the Creative Commons Attribution 4.0 License.
the Creative Commons Attribution 4.0 License.
 | 20 Mar 2024
Wind turbine rotors in surge motion: new insights into unsteady aerodynamics of floating offshore wind turbines (FOWTs) from experiments and simulations
Christian W. Schulz
Stefan Netzband
Umut Özinan
Po Wen Cheng
Moustafa Abdel-Maksoud
An accurate prediction of the unsteady loads acting on floating offshore wind turbines (FOWTs) under consideration of wave excitation is crucial for a resource-efficient turbine design. Despite a considerable number of simulation studies in this area, it is still not fully understood which unsteady aerodynamic phenomena have a notable influence on the loads acting on a wind turbine rotor in motion. In the present study, investigations are carried out to evaluate the most relevant unsteady aerodynamic phenomena for a wind turbine rotor in surge motion. As a result, inflow conditions are determined for which a significant influence of these phenomena on the rotor loads can be expected.
The experimental and numerical investigations are conducted on a two-bladed wind turbine rotor subjected to a tower-top surge motion. A specialised wind tunnel test rig has been developed to measure the aerodynamic torque response of the rotor subjected to surge motions with moderate frequencies. The torque measurements are compared to two free-vortex-wake (FVW) methods, namely a panel method and a lifting-line method. Unsteady contributions that cannot be captured using quasi-steady modelling have not been detected in either the measurements or the simulations in the covered region of motions ranging from a rotor reduced frequency of 0.55 to 1.09 and with motion velocity amplitudes of up to 9 % of the wind speed. The surge motion frequencies were limited to a moderate range (5 to 10 Hz) due to vibrations occurring in the experiments. Therefore, a numerical study with an extended range of motion frequencies using the panel and the lifting-line method was performed. The results from both FVW methods reveal significant unsteady contributions of the surge motions to the torque and thrust response that have not been reported in the recent literature. Furthermore, the results show the presence of the returning wake effect, which is known from helicopter aerodynamics. Additional simulations of the UNAFLOW scale model and the IEA 15 MW rotor demonstrate that the occurrence of the returning wake effect is independent from the turbine but determined by the ratio of 3P and surge motion frequency. In the case of the IEA 15 MW rotor, a notable impact of the returning wake effect was found at surge motion frequencies in the range of typical wave periods. Finally, a comparison with OpenFAST simulations reveals notable differences in the modelling of the unsteady aerodynamic behaviour in comparison to the FVW methods.
- Article
(8091 KB) - Full-text XML
- BibTeX
- EndNote


The rapid development of floating offshore wind turbines has been enabled by elaborate simulation techniques that are improving continuously with the needs of new wind turbine designs. In the case of new, large-scale floating offshore wind turbines (FOWTs), the reliability of these simulation methods becomes more and more crucial for the evaluation of their feasibility and safety.
In order to assess whether a numerical method is sufficiently reliable for such FOWT concepts, the underlying physical phenomena must be understood and characterised. Due to increasing rotor diameters, the relevance of various aerodynamic phenomena to wind turbine rotor loads must be continuously re-evaluated. Therefore, many current research activities in the field of floating-wind-turbine aerodynamics focus on the occurrence and effects of unsteady aerodynamic phenomena caused by the motions of the tower top of large wind turbines. Although a considerable number of studies have been carried out on this subject, no consensus has been reached in the research community on which unsteady aerodynamic phenomena are relevant and how much they can influence the loads acting on the wind turbine. Accordingly, the present work is intended to contribute to the understanding and characterisation of such unsteady phenomena and their influence on the loads of FOWT rotors using a novel experimental approach and comprehensive numerical investigations.
In the first step, an experimental study on a model rotor subjected to a surge motion is presented and load measurements are compared to simulations using two different free-vortex-wake (FVW) methods. It is shown that both FVW methods perform well but have slightly different qualities in the context of modelling unsteady phenomena. On the experimental side, a special test rig was developed for the experimental investigation to minimise vibrations, and an elaborate data acquisition procedure was applied to gain reliable and precise measurement results at high surge motion frequencies.
In the second step, the results of further numerical simulations exceeding the physical limits of the test rig are presented. A specialised set of load cases is used to clearly differentiate between quasi-steady and unsteady aerodynamic phenomena impacting the simulation results. Apart from the well-known unsteady airfoil effect and the dynamic inflow effect, the simulations show a significant impact of the returning wake effect on the loads of the surging model rotor. This effect is known from helicopter aerodynamics but has received very little attention in the context of FOWTs to date. In order to investigate the relevance of the returning wake effect for different turbines, the analysis is extended to another model rotor and a representative of modern full-scale offshore wind turbines. The rotor used in the UNAFLOW (Fontanella et al., 2021) measurement campaign was chosen because it was the subject of the recently finished IEA Task 30 (OC6;1 see Bergua et al., 2023), which also aimed at identifying unsteady aerodynamic effects caused by surge motions. For the sake of easy reproduction of the results, the IEA 15 MW turbine (Gaertner et al., 2020) was chosen as a full-scale representative. The extension of the simulation study to the IEA 15 MW turbine allows a transfer of the findings from the model rotors and reveals the presence of significant unsteady contributions to the load response at small wave periods. Finally, a comparison of the free-vortex-wake simulation results of the IEA 15 MW turbine and those obtained by AeroDyn–OpenFAST (Jonkman, 2022) provides insight into the capabilities and limitations of a state-of-the-art blade element momentum theory (BEMT) method in the context of unsteady aerodynamics caused by surge motions.
The present work is structured as follows. Sections 2 and 3 summarise the theory and current state of research regarding moving and especially surging wind turbine rotors and the corresponding unsteady aerodynamic phenomena. The utilised numerical models are briefly described in Sect. 4. A summary of the experimental setup, the test rig and the data acquisition followed by a comparison of experimental and numerical results is given in Sect. 5. In the subsequent Sect. 6, the range of motions is extended in a purely numerical study of the Hamburg University of Technology (TUHH) model rotor. The transferability of the findings from the TUHH model rotor to the UNAFLOW and the IEA 15 MW rotors is investigated in Sects. 7 and 8. A characterisation of the observed unsteady phenomena and their impact on the rotor loads based on dimensionless numbers is discussed in Sect. 9. Finally, the main results of the experimental and numerical investigations are summarised in Sect. 10.
2.1 Quasi-steady and unsteady parts of a rotor's load response to a surge motion
The load response of a wind turbine rotor to a tower-top surge motion is generally unsteady as the surge motion velocity varies the inflow conditions over time. However, in the case of a very slow motion, this response can be described in a quasi-steady way. Considering a very fast motion, it is likely that the behaviour of the rotor loads will be affected by additional aerodynamic phenomena caused, for example, by vortex shedding. Such behaviour is referred to as unsteady in this work, which does not include any quasi-steady effects.
As a consequence, the aerodynamic power of a wind turbine in motion can be divided into a quasi-steady and an unsteady part. For a harmonic surge motion with a velocity vm(t) and velocity amplitude Vm at constant rotational speed and constant wind speed, these parts can be described as follows:
where P, Cp, λ and f describe the aerodynamic power, power coefficient, tip speed ratio and motion frequency of the wind turbine. ρ and v0 denote air density and wind speed respectively. It has to be noted that λ can be determined by the time-dependent motion velocity in this case. All potential unsteady influences on the power are summarised in Punsteady.
Introducing the dimensionless number bvel as the ratio of motion to inflow velocity, the power amplitude AP can be expressed as
A detailed derivation of Eq. (4) and the following equations is given in Appendix A. The same derivation is valid for the rotor torque at constant rotational speed. Similarly, the thrust AT amplitude can be expressed as
where Ct describes the thrust coefficient. It has to be noted that λmin and λmax are also determined by bvel. This is due to the assumption of constant rotational speed and wind speed. Therefore, it can be concluded that the quasi-steady part of the power amplitude as a response of a harmonic surge motion is exclusively dependent on the dimensionless number bvel. This knowledge will be used in Sect. 6 to derive a set of load cases, which is suitable for distinguishing the quasi-steady part of the load response from the unsteady part.
2.2 Unsteady aerodynamic phenomena
Leishman (2002) describes three unsteady aerodynamic phenomena that were found to be most significant in the context of wind turbine rotors. Namely, the unsteady airfoil effect (attached flow), the dynamic inflow effect and dynamic stall. This is in line with Schepers' selection of relevant unsteady aerodynamic phenomena (Schepers, 2012). In addition to that, Eliassen (2015) showed that the returning wake effect may also influence the aerodynamic loads acting on a wind turbine in the case of tower-top vibrations. For the sake of simplicity, the experimental and numerical setups in the present work are designed so that stall has no or only minor influence on the rotor loads. As a consequence, only the other three effects are described briefly in the following, while details can be found in the above-mentioned publications.
2.2.1 Unsteady airfoil effect
The unsteady airfoil effect for attached flow describes two physical phenomena that are referred to as circulatory and non-circulatory. The circulatory effect is based on the fact that vortices are shed from the trailing edge of an airfoil when its circulation (i.e. lift force) changes. In turn, these vortices influence the angle of attack of the airfoil, which results in a mutual interaction between the angle of attack and the change in the lift force. This is a consequence of Kelvin's theorem, which claims that the accumulated circulation in a closed fluid volume cannot change. The shed vortices are then transported downstream, which causes their influence on the angle of attack to vanish over time. The non-circulatory effect refers to added mass forces that act on the airfoil surface, which are caused by an acceleration or deceleration of the flow field around the airfoil. Such forces may occur, for example, when the airfoil is pitching or plunging. In the case of a sinusoidal variation in the angle of attack in a frequency range that can be expected in the context of wind turbines, the circulatory effect is most prominent. It causes a time lag and a decrease in the lift amplitude with increasing frequency.
A reduced frequency fa was described by Sebastian and Lackner (2013) to characterise the influence of the unsteady airfoil effect on a wind turbine blade section:
Here, v0 and Ω describe the wind velocity and the angular speed of the rotor while r and c are the radius and chord length respectively of the radial section under investigation. f denotes the frequency with which the inflow conditions vary (i.e. surge motion frequency). fa is referred to as the airfoil reduced frequency in this work.
Leishman proposed that the flow around an airfoil may be considered quasi-steady up to fa=0.05 (Leishman, 2000). As the airfoil reduced frequency varies strongly over the blade span, it is difficult to use the value of fa as a clear indicator for the strength of the unsteady airfoil effect acting on the whole rotor.
2.2.2 Dynamic inflow effect
The helical vortex structure in the wake of a wind turbine induces an axial velocity component at the rotor plane, which is referred to as the induction. This induction has significant influence on the angle of attack at the blade sections and consequently on the rotor loads. A change in the inflow situation of the rotor (i.e. due to a blade pitch event) leads to an adaptation of the wake structure and vortex strength, which in turn causes a change in the induction of the rotor. As the wake is transported downstream, the induction is influenced by the newly shed vortices as well as the “old” wake structure. The influence of the old wake decays over time until a new steady state of the wake and induction is reached. Consequently, the induction of the rotor can only change gradually after a change in the inflow, which is the main impact of the dynamic inflow effect.
In the context of a surge motion, the dynamic wake effect can be characterised by a normalised “advection wavelength” introduced by Sebastian and Lackner (2012). A more convenient way is to utilise its inverse, which is known as wake or rotor reduced frequency fr:
where D denotes the rotor diameter. Typical values for the rotor reduced frequency corresponding to wave-induced motions may reach up to 8.2
2.2.3 Returning wake effect
As already mentioned in the context of the unsteady airfoil effect, vortices are shed from the trailing edge of an airfoil when the circulation around it changes rapidly. In the case of a rotor, these vortices may not only have an influence on the blade that was shedding them but also affect the flow situation around the following blades passing the same azimuth angle. In the case of an oscillatory excitation of the inflow, the returning wake effect leads to a significant decrease in the load amplitude when the frequency of the vortex shedding matches the blade frequency.
This effect can be illustrated when considering the influence of the shed vortices of an airfoil on the flow field of a second airfoil behind it. In Fig. 1, the history of the shed vortices during a cycle of a periodic surge motion3 of two airfoils in a row is illustrated schematically. In the presented case, the period of the motion is assumed to be equal to the time a vortex shed from the first airfoil needs to be transported to the second airfoil. The four rows shown in the figure correspond to four different positions during the surge motion. The first row represents the zero crossing of the surge motion during the downward motion. In the second row, the maximum position is reached, while the third and fourth correspond to the zero crossing in an upward direction and the minimum position respectively. During the downward motion, the presence of the motion velocity leads to an increase in the angle of attack and finally to a maximum of the lift force. The opposite is the case during the upward motion. The strength of the shed vortices is determined by the rate of change of the angle of attack, which is correlated to the actual rate of change of the surge motion velocity. In the case of the downward motion in the first row, the motion velocity is maximum, which results in a zero rate of change of the angle of attack and no vortex shedding. When the airfoil reaches the maximum position in the second row, the rate of change of the angle of attack is negative. Therefore, clockwise vortices are shed from the trailing edge of the airfoil. In the third row, where the zero position is reached during the upward motion, the rate of change of the angle of attack and the vortex shedding is zero again. Finally, the shedding of anticlockwise vortices in the fourth row is caused by the positive rate of change of the angle of attack at the minimum position. This procedure is the same in every surge motion period, which results in an alternating shedding of clockwise and anticlockwise vortices with the motion frequency.
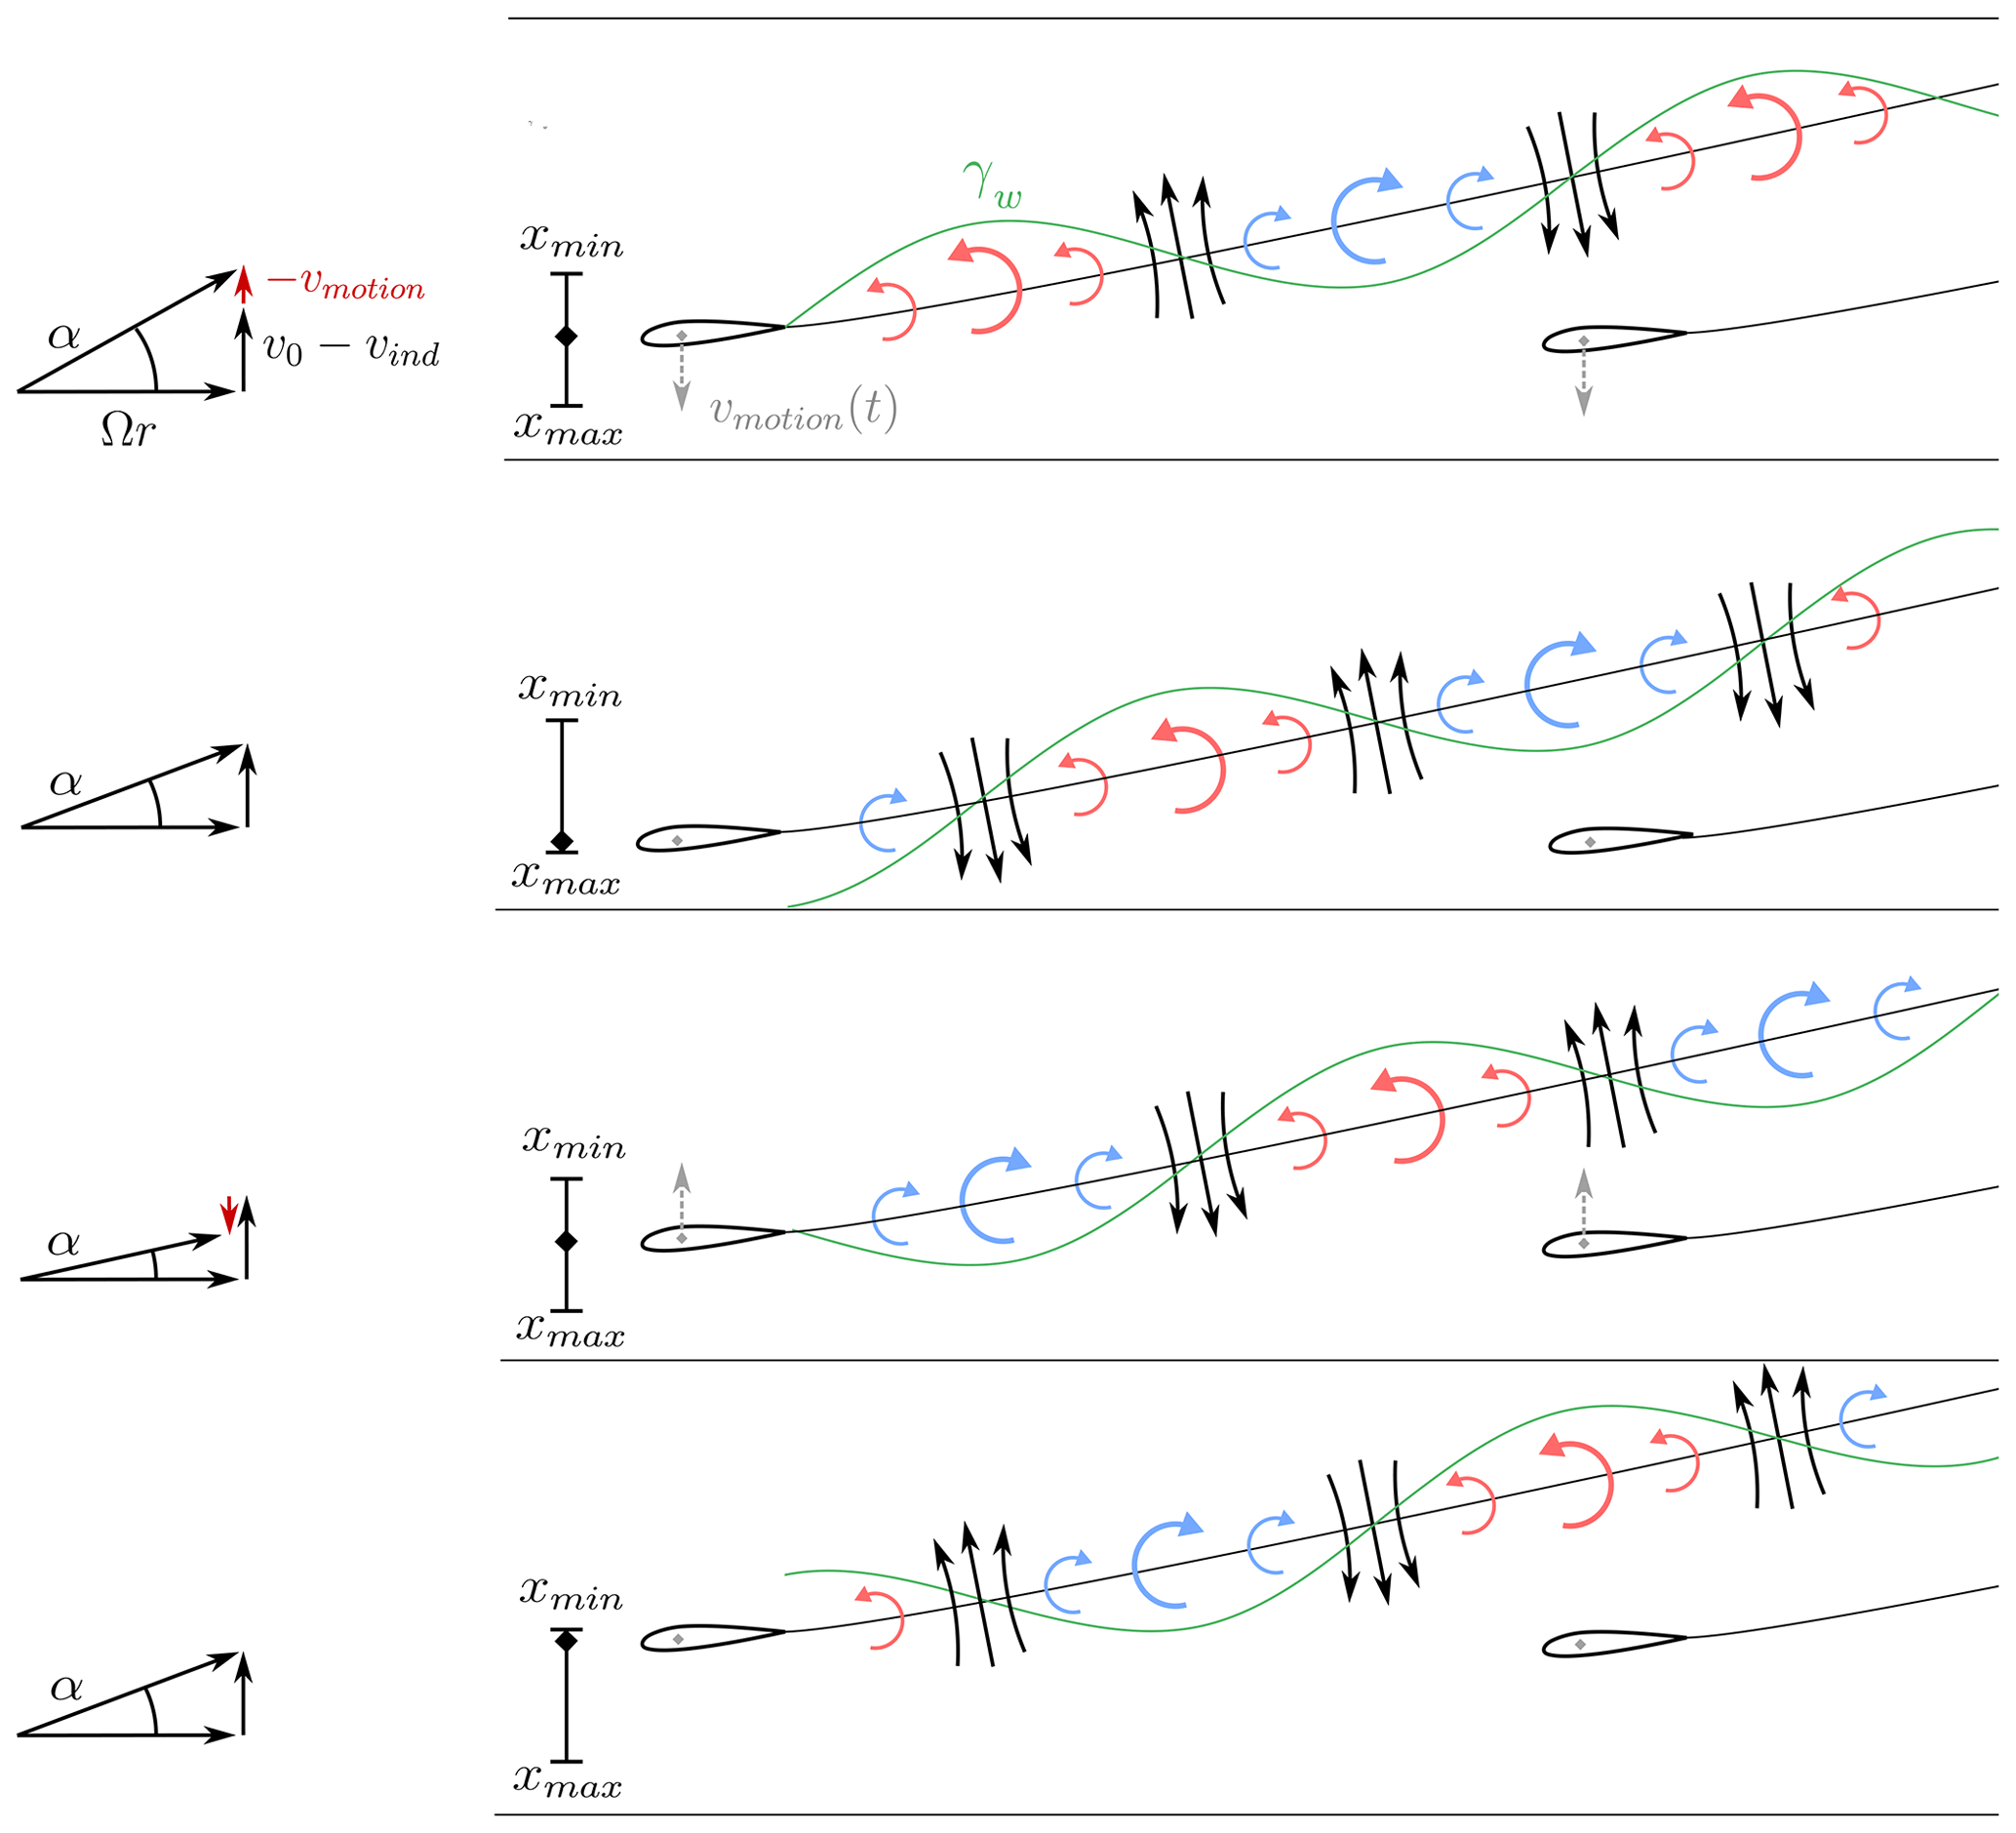
Figure 1Schematic sketch of the vortex shedding at four steps during a surge motion cycle in the two-dimensional projection. The actual surge motion position varies between xmin (turbine moved in wind direction) and xmax (turbine moved against wind direction). Dashed grey arrows illustrate the motion velocity. Solid black arrows indicate the local flow direction. The green line represents the strength of the shed vorticity γw, which varies in a sinusoidal manner. The velocity triangle on the left gives an indication of the change in the angle of attack α due to the variation in the motion velocity.
The lift amplitudes of both airfoils oscillate due to the surge motion. In the example, the vortices shed in one time instance reach the second airfoil exactly after one surge motion period. The superposition of the flow fields of the vortices yields an alternating upward and downward flow. In the case of these flow regimes being near the second airfoil, its angle of attack is deviated so that the amplitude of the lift force due to the surge motion is decreased.4
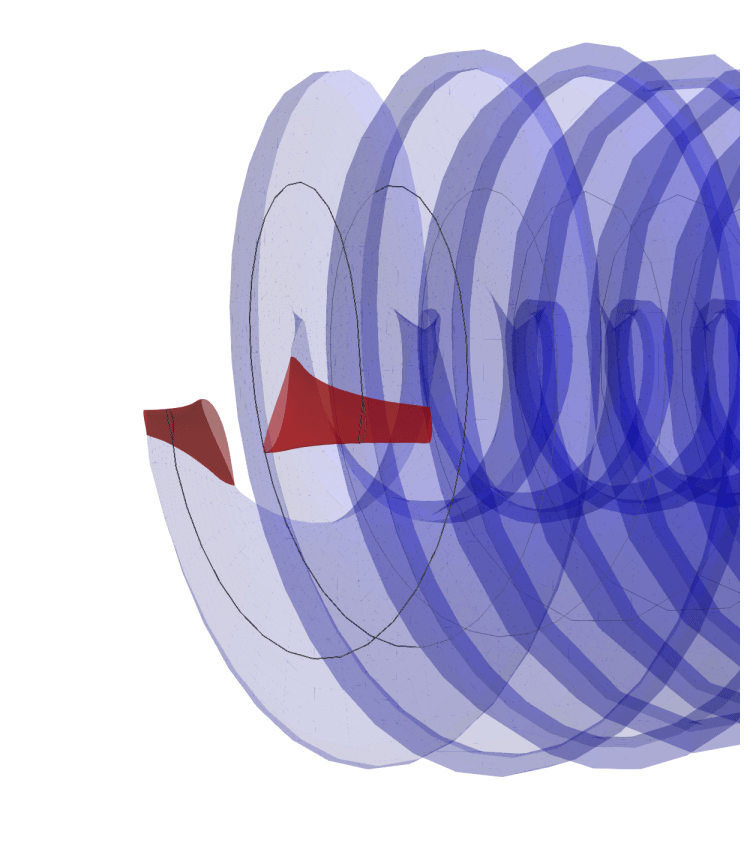
The illustrated situation in Fig. 1 can be adopted to a wind turbine rotor in surge motion. In this case, the two airfoils represent the blade sections of the wind turbine blades at the same radial position. The airfoils in the two-dimensional case represent a cylindrical cut through the blades of a certain radius as indicated in Fig. 2. When unrolling this cylindrical cut through the blades and the wake, a situation comparable to the one in Fig. 1 results. The distance between the airfoils is assumed to be equal to the distance that one blade section travels until the next blade passes in the three-dimensional case. Therefore, the time until the second blade passes the position where the vortices were emitted from the first blade is equal to of the rotation period of the rotor (for a two-bladed rotor). As a consequence, the above-described drop in the lift amplitude occurs when the motion period equals of the rotation period.
This effect is known as the returning wake effect from helicopter aerodynamics (Leishman, 2000) and was described mathematically by Loewy (1957). It can be described by the ratio of both frequencies:
where nb and Ω denote the number of blades and the angular velocity of the rotor respectively. In the case of a harmonic surge motion of a wind turbine, this means that a drop in the lift amplitude of the blades occurs when the motion frequency is equal to or a multiple of the blade-passing frequency. qb would be an integer in this case.
In addition, the influence of the shed vortices on the lift force of the following blade is dependent on the distance from the blade to the vortices emitted by the preceding blade. A more detailed explanation of the physical principle is given in Eliassen (2015).
2.2.4 Influence of unsteady phenomena on torque and thrust
The above-mentioned phenomena primarily affect the lift force of the rotor blades. While the returning wake effect and the unsteady airfoil effect can be considered a perturbation of the local angle of attack, the dynamic inflow effect affects the axial induction. Both a perturbation of the angle of attack and a change in the axial induction affect rotor torque and thrust simultaneously. Therefore, the general characterisation of these unsteady phenomena on the rotor level can be performed on the basis of either rotor torque or thrust.
2.3 Suitability of FVW methods for wind turbine aerodynamics
Lifting-line FVW methods have proven their ability to predict the loads acting on wind turbine rotors under typical, stationary operating conditions in several comparisons with experimental studies; see Schepers (2012) for an example. The same is true for FVW panel methods (van Garrel, 2016; Roura et al., 2010), except for the occurrence of stalled blades. However, it is more challenging to incorporate the influence of viscous effects on the blade loads into panel methods than into lifting-line methods. The reason for this is that the flow around the airfoil is explicitly modelled and cannot be altered in a simple manner while the lifting-line algorithm disregards the local flow field and fully relies on empirical lift and drag coefficients. As a consequence, despite their higher modelling fidelity, panel methods are often a little less reliable in predicting wind turbine loads in steady conditions.5 FVW methods are generally capable of modelling the circulatory unsteady airfoil effect. This is due to the fact that the vortices emitted into the wake due to a change in circulation around the airfoil are directly modelled in these methods. However, the non-circulatory part caused by the accelerated fluid around the airfoil can only be modelled directly by unsteady FVW panel methods representing the whole blade surface instead of a single lifting line. This effect can be introduced in lifting-line methods by means of empirical corrections. The dynamic inflow effect and the returning wake effect are caused by varying strength and motion trajectories of the vortices in the wake due to unsteady changes in the circulation around the blades and/or the inflow conditions. This is directly modelled in FVW methods, which means that both effects can be captured by these methods. In practice, the ability of a lifting-line method to explicitly model the dynamic inflow effect has also been shown in the past, e.g. by Schepers (2012) in conjunction with a pitch step of the National Renewable Energy Laboratory (NREL) Phase VI experiment. As there is no fundamental difference in the wake treatment between lifting-line and panel methods, this can also be transferred to panel methods.
3.1 Numerical investigations
A large number of simulation studies on the aerodynamic behaviour of wind turbine rotors undergoing typical FOWT motions have been presented in the recent literature. A selection of these studies is listed in Table 1. While a wide range of motion conditions is covered, the variety of wind turbine models is fairly limited among the listed studies.
Sebastian and Lackner (2012)de Vaal et al. (2014)Micallef and Sant (2015)Tran et al. (2015)Tran and Kim (2015)Farrugia et al. (2015)Sant et al. (2015)Sant and Cuschieri (2016)Wen et al. (2017)Wu and Nguyen (2017)Cormier et al. (2018)Lienard et al. (2020)Fang et al. (2020)Mancini et al. (2020)Chen et al. (2021)Ferreira et al. (2022)Mancini et al. (2022)Ribeiro et al. (2023)Bergua et al. (2023)Schulz et al. (2023)Table 1Selection of numerical investigations on rotor loads of surging and pitching wind turbines based on mid-fidelity and high-fidelity simulation approaches.Abbreviations: AD, actuator disc; CFD, computational fluid dynamics; GDW: generalised dynamic wake; LL, lifting line.
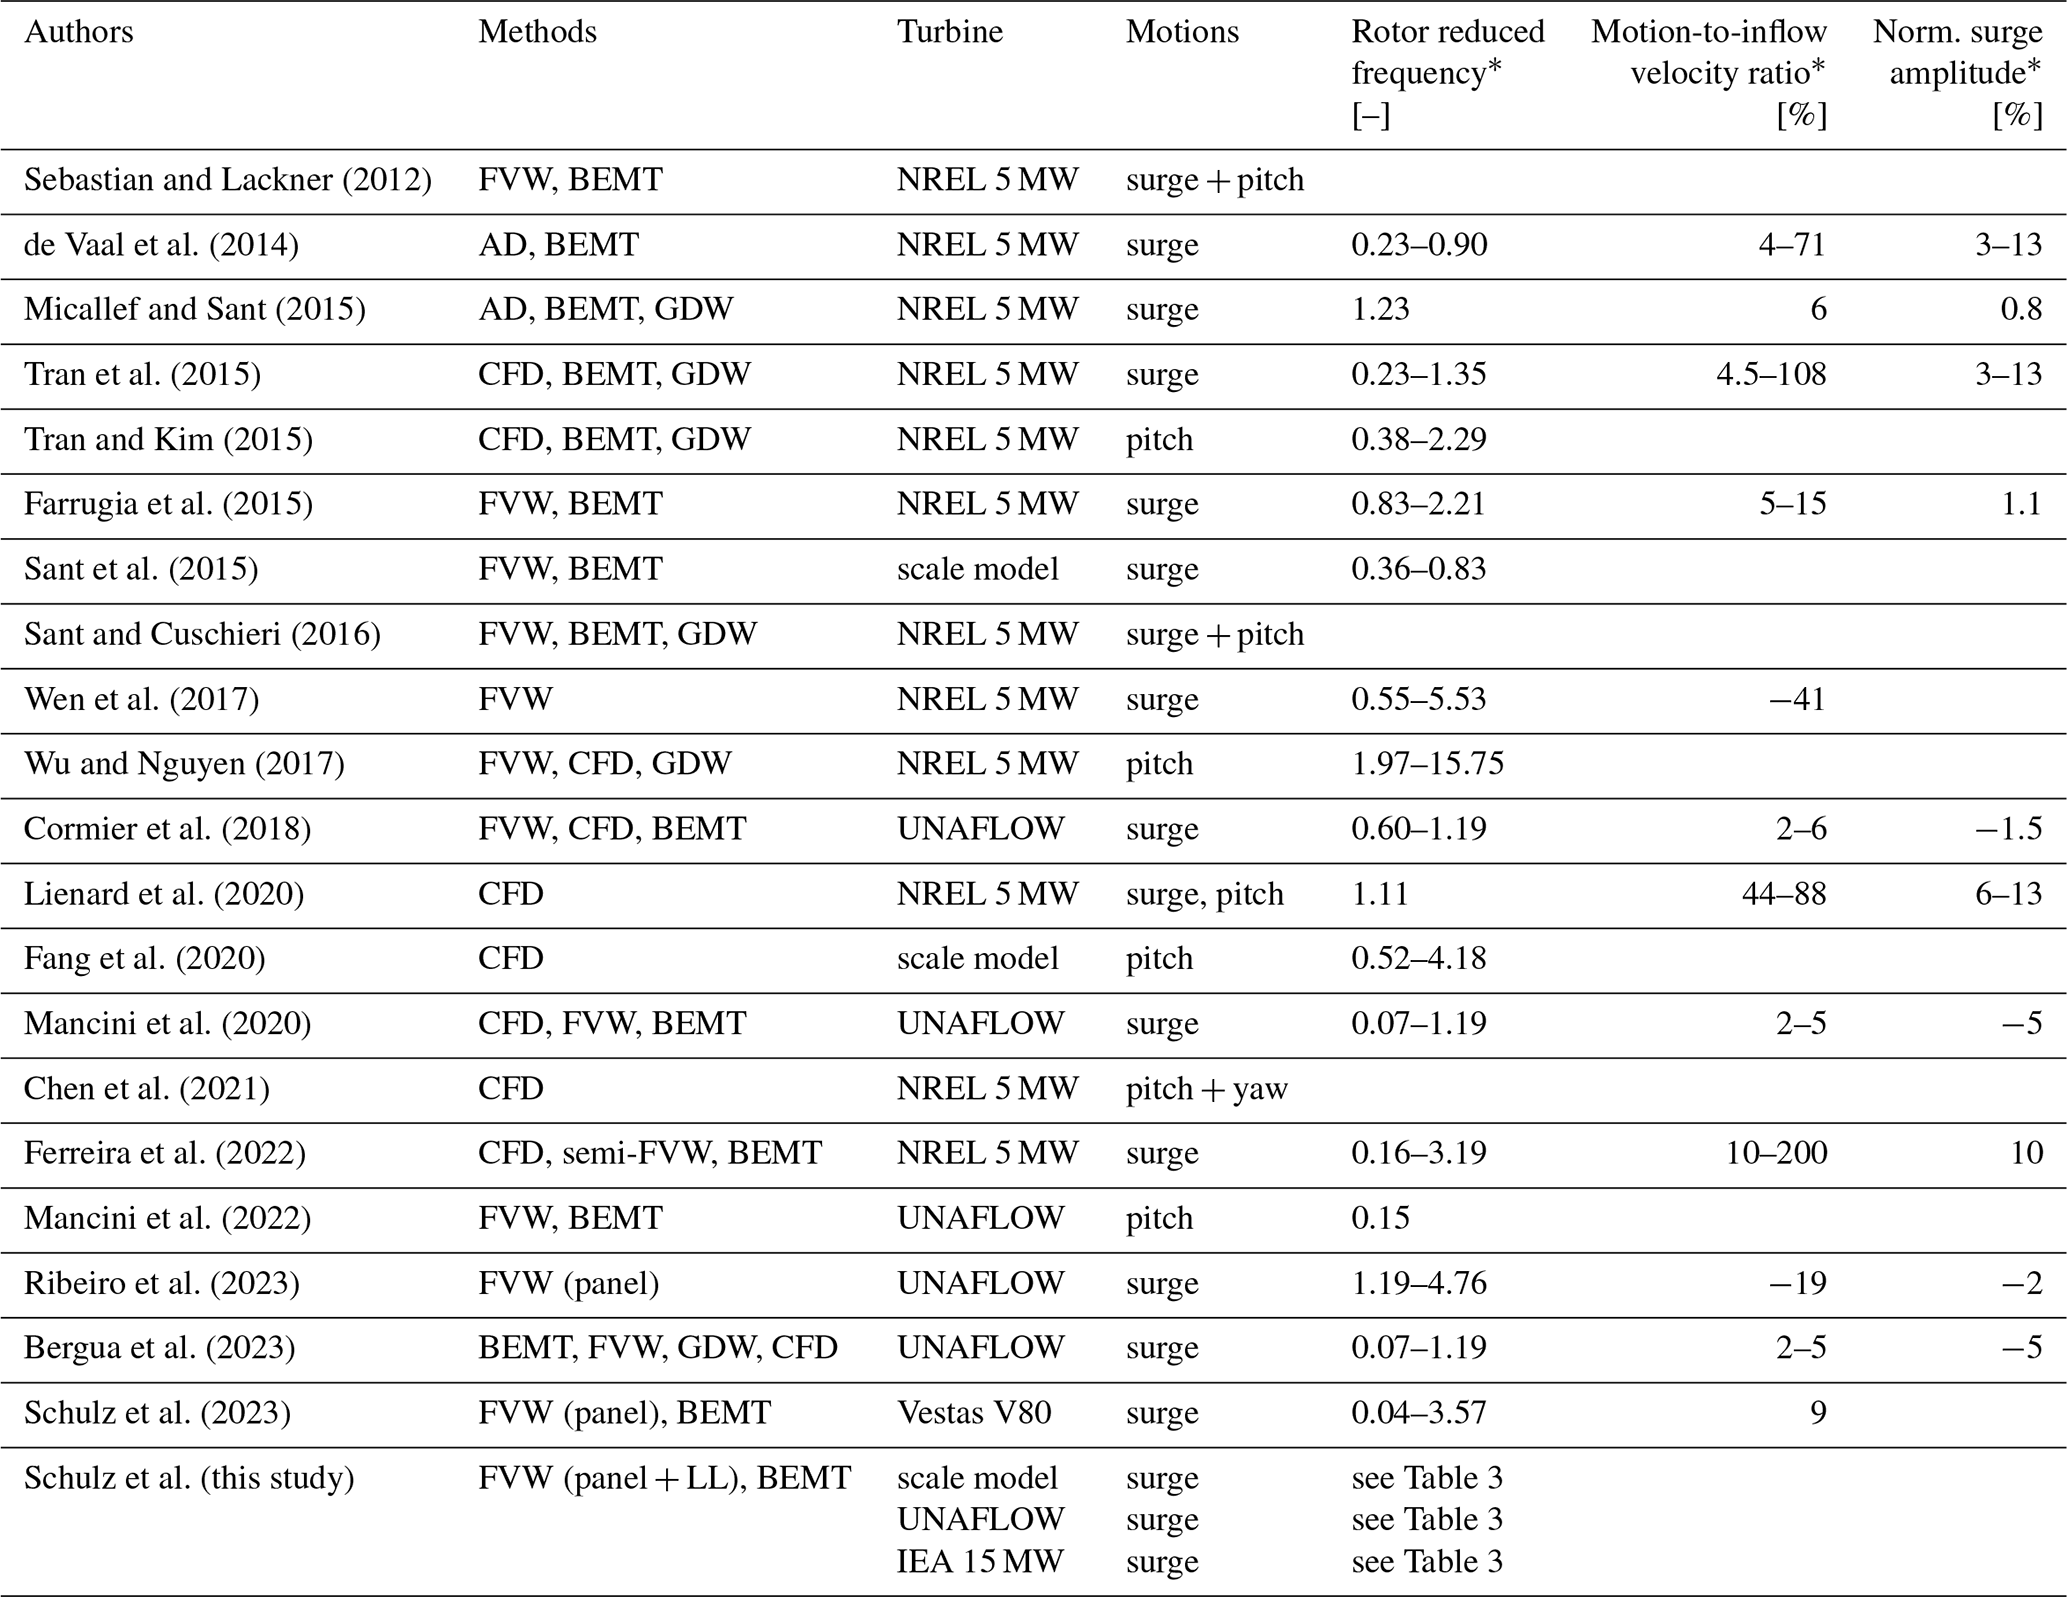
* In operating conditions near optimum tip speed ratio (TSR).
Characterisation of the aerodynamic load response to a rotor motion and of the influence of unsteady phenomena is addressed in most of the listed studies. Often, a harmonic tower-top surge motion is chosen in order to simplify the analysis of the simulation results. Among these, some studies utilising FVW or Reynolds-averaged Navier–Stokes (RANS) methods report a linear increase in the normalised thrust force amplitude with the motion frequency or motion-to-inflow velocity ratio bvel (see Eq. 3). Wen et al. (2017) and Sant et al. (2015) found that the thrust force amplitude is linearly dependent on bvel, as long as bvel stays in a moderate range below approximately 15 %. This can be explained by assuming a constant Ct and neglecting the higher-order terms in Eq. (5) (and Eq. A6). However, these assumptions are only valid for moderate bvel values and the absolute limits are dependent on the special case. In the FVW and RANS simulations of Mancini et al. (2020) and Ribeiro et al. (2023), a linear rise in the thrust amplitude ΔT, which is normalised by the motion amplitude A, with the motion frequency is present. This can be expressed as
When considering that the motion-to-inflow velocity ratio is proportional to the product of motion frequency and amplitude,
it can be easily shown that this is equivalent to the above-mentioned linear relation between the thrust amplitude and bvel.
In consequence, a constant motion-to-inflow velocity ratio results in an approximately constant power and thrust amplitude, which is confirmed by Wen et al. (2017). In the above-mentioned cases, the thrust response amplitude can therefore be described in a quasi-steady way so that an unsteady contribution is most likely not present in a moderate range of bvel values. This linear trend could also be confirmed during OC6 Phase III (Bergua et al., 2023). In this project, a considerable number of different low-fidelity, mid-fidelity and high-fidelity methods were compared against each other and experiments utilising the UNAFLOW rotor. In contrast to this, lifting-line FVW simulations of the NREL 5 MW wind turbine in surge motion conducted by Farrugia et al. (2015) show a strong decrease in torque and thrust amplitudes from 0.15 to 0.2 Hz at equal motion amplitudes. However, very similar simulation cases were also covered by Wen et al. (2017), who observed a linearly increasing trend again.
For higher motion-to-inflow velocity ratios (i.e. bvel>15 %) of the surging NREL 5 MW rotor around the design operating condition, Wen et al. (2017) found that the rise in the power amplitude becomes slightly nonlinear. A similar observation was found by Ribeiro et al. (2023) for the thrust force, where a FVW panel method was used to simulate the UNAFLOW rotor. In addition, a rising phase shift between the surge velocity and rotor thrust was reported independently from bvel, which was also observed by Mancini et al. (2020) earlier. Ribeiro et al. (2023) argue that this phase shift may lead to the lower-than-expected amplitude at high motion frequencies: as the strength of the unsteady airfoil effect, which most likely causes the phase shift, changes over the blade span, the phase shift also varies. Therefore, the lift contributions from the blade sections do not reach their maximum at the same time, which results in a lower accumulated amplitude. Although this reasoning seems plausible, a proof for this hypothesis is not given. However, in this case a high motion velocity was investigated concurrently with a high bvel. Therefore it cannot be distinguished whether the deviation from the linear trend indicates that the quasi-steady part of Eq. (5) cannot be approximated as linear due to the high bvel or that an unsteady contribution caused the deviation.
In a recent work of the authors (Schulz et al., 2023), a small contribution of unsteady aerodynamic phenomena to the torque and thrust response of the Vestas V80 rotor to surge motions was identified. While the unsteady airfoil correction of a BEMT method predicted a decrease in the load amplitudes due to the unsteady airfoil effect at high motion frequencies, panel method simulations showed a slight increase. This contradictory behaviour of the results of the methods was attributed to unsteady, three-dimensional wake effects that cannot be covered by BEMT.
When increasing the motion-to-inflow velocity ratio to extreme values, minimum and maximum power become more and more asymmetric to the mean value. Such behaviour is present in Tran et al. (2015) and Chen et al. (2021), where bvel values of 55 % or even higher have been investigated. This may be explained by the terms containing the third power of bvel in the quasi-steady part of Eq. (A5) and does therefore not necessarily indicate an unsteady contribution.
In the above-mentioned studies, the amplitude of the rotor thrust (and torque) response to a surge motion was mostly determined by a quasi-steady behaviour. This resulted in a linear dependency of the load amplitude on bvel, while no explicit influence of fr on this behaviour could be shown. Only in the case of the investigation of Ribeiro et al. (2023) is there a hint of an influence of fr on the thrust force amplitude, which has unfortunately not been examined independently from the influence of bvel. In addition, a slight phase shift of motion velocity and thrust force with rising fr was found in some studies. However, the influence of the potential unsteady effects could not be investigated accurately in most cases because the considered simulation cases did not allow for a clear distinction between their influence and those of quasi-steady effects (e.g. changes in bvel) on the rotor loads.
3.2 Experimental investigations
A number of investigations considering FOWT rotors in motion have been conducted in the last decade. Most studies address the influence of the motion on either the wake development or the rotor loads. The most relevant studies that focus on the unsteady rotor loads are listed in Table 2. As the model turbines are significantly downscaled, a scaling parameter for the surge motion is mandatory. Many studies utilise the rotor reduced frequency for this purpose. However, it has to be noted that from the three above-mentioned unsteady aerodynamic phenomena, only the dynamic inflow effect is covered by this choice.
Farrugia et al. (2014)Sivalingam et al. (2018)Bayati et al. (2016)Bayati et al. (2018)Mancini et al. (2020)Fontanella et al. (2021)Meng et al. (2022)Wei and Dabiri (2022)Fontanella et al. (2022, 2023)Table 2Experimental investigations on rotor loads of surging wind turbines.
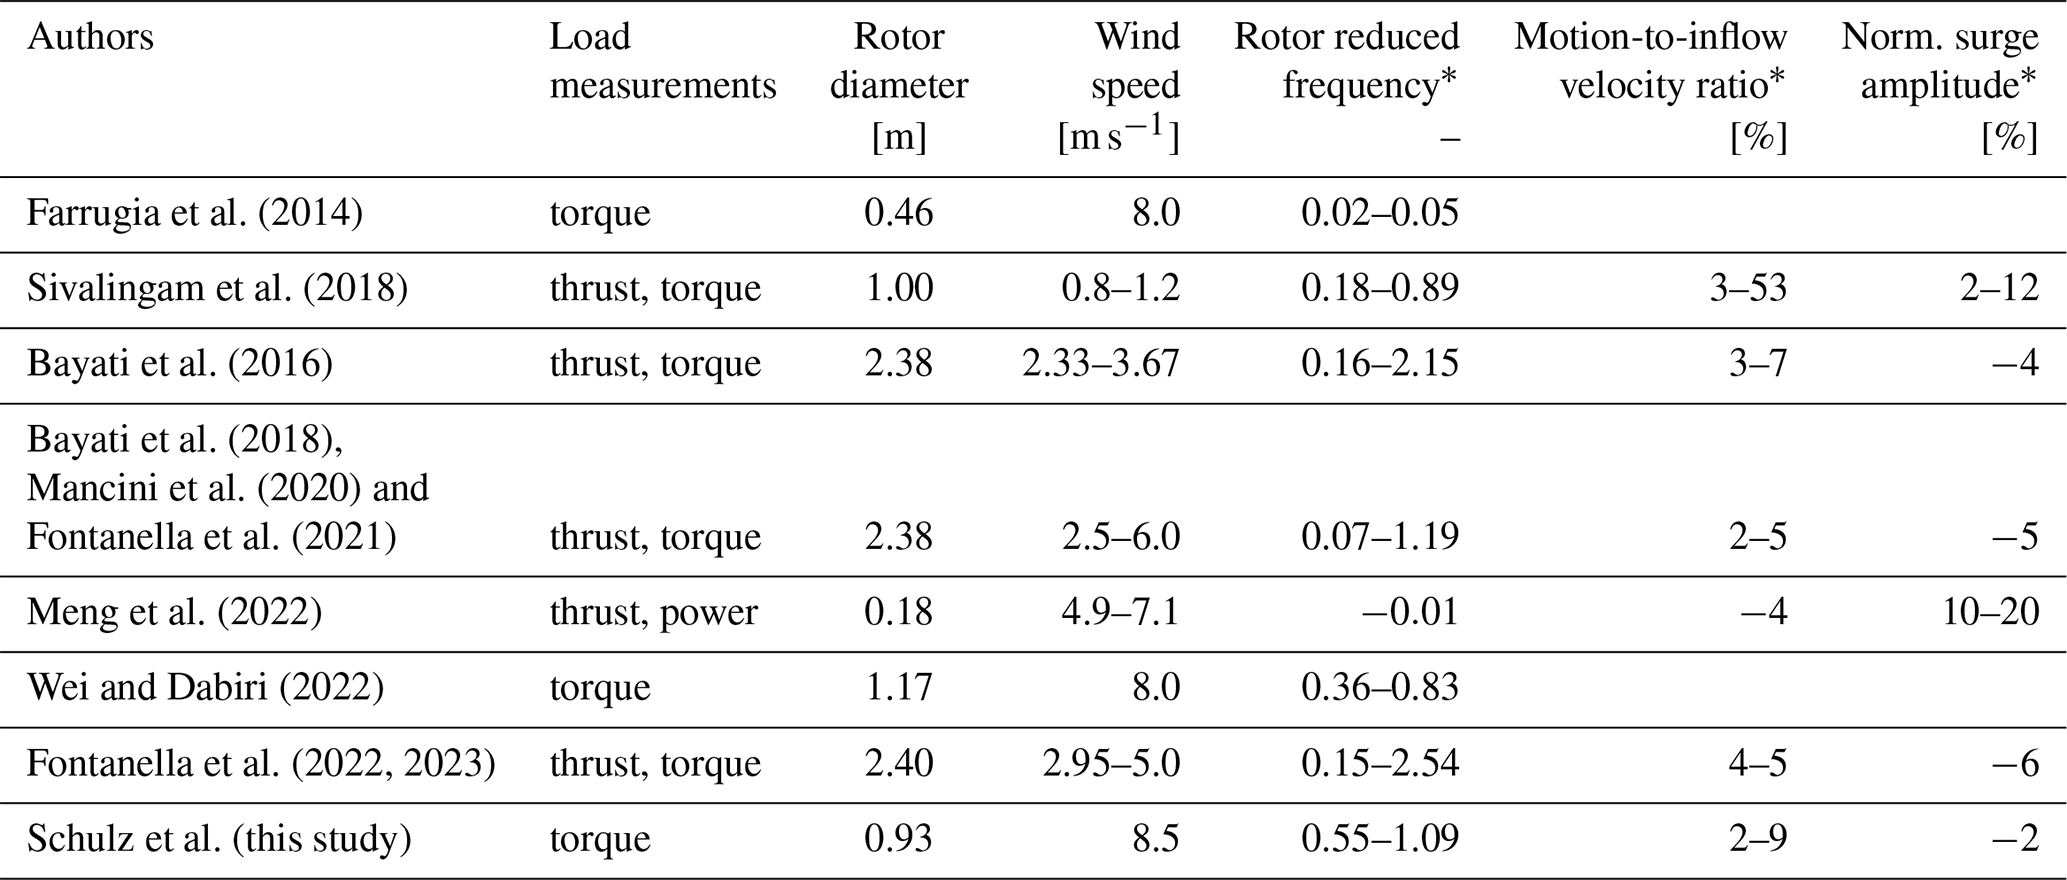
* In operating conditions near optimum TSR; measurement series “RATED” for UNAFLOW campaign.
Most studies utilise rotor diameters of 1 m and higher because higher rotor diameters lead to higher rotor reduced frequencies at the same motion frequency. This is also necessary to maintain a high local Reynolds number at the blade, which is a prerequisite for reaching realistic power coefficients and good comparability between the experiment and full-scale behaviour. As an exception, Farrugia et al. (2014) presented torque measurements of a combined wind tunnel and wave tank experiment of a model FOWT with a rotor diameter of 0.46 m. As the wind speed has been chosen to be comparatively high for wave tank experiments (8 m s−1), a low maximum rotor reduced frequency of 0.047 resulted. Mean values and standard deviation of the measured torque were analysed for a large number of tip speed ratios (TSRs) and different wave frequencies. Ultimately, no evidence for motion-induced torque fluctuations was found in the measurements, while FVW simulations clearly showed such fluctuations. Farrugia et al. (2014) noted that this mismatch is likely caused by the limited capabilities of the utilised torque meter.
One simple way to reach high wake reduced frequencies is to make use of an excessively low inflow wind speed. However, this usually leads to a significantly reduced flow quality and high uncertainties in the average wind speed as most wind tunnels are unable to reach and control a homogeneous flow at low wind speeds. In addition, the local Reynolds number at the blades becomes very small so that viscous contributions cause significant scale effects. Sivalingam et al. (2018) solved these issues by using water as the flow medium, which increases the Reynolds number massively due to its low kinematic viscosity. The model rotor with a diameter of 1 m was mounted on a rigid carriage and towed through a towing tank at travel speeds of around 1 m s−1. An actuator mounted on the carriage realised the surge motion with different frequencies and amplitudes. In this way, a maximum rotor reduced frequency of 0.89 could be achieved at a relatively low surge frequency of 0.89 Hz during normal operation of the rotor at a TSR of 6. Torque and thrust have been measured directly at the shaft, but it was not mentioned whether a correction of the inertial forces due to the surge movement was used. In addition to the experimental results, three kinds of simulations utilising a RANS, a classical BEMT and a BEMT method with unsteady corrections are presented. While the experiment at optimum TSR consistently shows a significantly higher thrust amplitude (between approx. 10 % and 25 %) than the RANS and the classical BEMT simulations, the unsteady BEMT results do not follow a clear trend in comparison to the experiments. The measured mean thrust force scatters in a range of around 5 %, but no clear trend with the motion frequency or motion-to-inflow velocity ratio could be identified. For torque oscillations at optimum TSR, the simulation results are in better agreement with each other, while the experiment again shows significantly higher amplitudes. It is interesting to note that negative values for the measured rotor torque already occur at a motion-to-inflow velocity ratio of 13.5 %. RANS simulations by Tran et al. (2015) and Lienard et al. (2020) show zero power output at motion-to-inflow velocity ratios above 70 % and 80 % respectively. Unfortunately, a quantitative analysis of unsteady contributions to torque and thrust amplitudes is not given.
A series of experimental campaigns has been performed in the large wind tunnel of the Politecnico di Milano (PoliMi) using a rotor with a diameter of 2.38 m. Maximum rotor reduced frequencies of up to 2.15 could be achieved for surge and pitch motions in the first study (Bayati et al., 2016). Later, it was found that tower vibrations had a significant influence on the measurements, and a second campaign with a stiffer tower was performed within the UNAFLOW project (Fontanella et al., 2021; Mancini et al., 2020), which focused on surge motions. The rotor thrust was measured by two triaxial force–moment sensors at the tower top and tower base. At high motion frequencies, the measured thrust force was dominated by inertial loads resulting from the tower-top acceleration due to the surge motion. To remove the inertial loads from the thrust signal, two compensation strategies were utilised: first, the inertial loads were determined in an experiment without wind and later subtracted from the signal with wind (difference-based compensation). Second, the tower-top acceleration was measured with an accelerometer near the force–moment sensor and the inertial contribution was calculated from mass and actual acceleration (acceleration-based compensation). However, in both cases the resulting thrust signal is extremely noisy due to tower vibrations and other sources at higher surge frequencies (Mancini et al., 2020; Bayati et al., 2018), so only the amplitude and phase of the first harmonic of the thrust signal were used as measurement results. Such data processing requires that the signal can be considered a mono-harmonic sine function in order to be accurate. Both compensations seem to be limited to a maximum motion frequency as a result of the tower vibrations. While the thrust measurements were found to be reliable up to a reduced frequency of approximately 0.9 for the difference-based compensation, a maximum reduced frequency of approximately 1.2 could be reached by the acceleration-based compensation (Mancini et al., 2020). In Fontanella et al. (2021), two measurement series in rated turbine conditions (i.e. optimum TSR) are presented. The main difference between these series is the inflow wind speed, which translates to a variation in the local Reynolds numbers at the blades. This difference seems to cause strong deviations between the two series in the amplitude of the thrust force. The series with the higher wind speed is considered more reliable as unwanted viscous phenomena should have a reduced influence and a higher thrust force can be measured in this case. An essentially linear relation between the thrust amplitude divided by the motion amplitude and the rotor reduced frequency was found up to a reduced frequency of around 0.6. For small motion amplitudes, this corresponds to a linear relation between the thrust amplitude and the motion-to-inflow velocity ratio, which was also observed in some of the simulation studies. For a higher reduced frequency, the scattering between the results for the different motion amplitudes is approximately 20 % of their mean value. As the results for the highest and the lowest motion amplitude are very similar while the two intermediate motion amplitudes caused the highest and the lowest thrust amplitude, no physically meaningful interpretation of the scattered results could be found. Therefore, these differences may be considered measurement uncertainty. In Mancini et al. (2020), where the acceleration-based compensation is applied, a very similar trend was observed. However, the scattering seems to be slightly lower in this case. In both cases, no significant phase shift between the thrust force and the surge velocity could be observed, while the interpretation of the phase angles was biased by a scattering of 5 to 10°. Mancini et al. (2020) noted that the presented rotor torque measurements were strongly disturbed by a drive train resonance, which was at least present for the two highest reduced frequencies. However, no clear, independent criterion was presented which could identify the border between the valid and the invalid measurement points. Therefore, the results below a reduced frequency of 0.6 could also be slightly affected by this distortion. An empirical model was tuned in order to compare the expected quasi-steady load amplitudes against the measurements. The quasi-steady model tends to underpredict the measured load amplitudes in both cases; however the scattering of the measurements at higher motion frequencies makes an evaluation difficult.
In the context of the COREWIND project, another model rotor was designed and subjected to surge motions in the wind tunnel of PoliMi. The COREWIND rotor is very similar to the UNAFLOW rotor. The same airfoil, nearly the same rotor diameter and similar operation parameters are utilised. Another test rig is used to impose the surge motion, which is also able to perform 6 DOF motions in a limited frame. In Fontanella et al. (2022), motions in surge, sway, roll, pitch and yaw were performed. For the surge motions, the difference-based inertia compensation is applied to the thrust measurements. Due to a lower wind speed, a higher rotor reduced frequency compared to the UNAFLOW experiments could be reached in the tests. In summary, three rotor reduced frequencies were tested: 0.14, 0.28 and 2.54. At the highest frequency, the measured thrust and torque amplitudes were found to be around 30 % higher than the quasi-steady prediction of the empirical model. In cases where the prediction is able to accurately represent the quasi-steady behaviour of the model rotor, this is a clear proof for a significant contribution of unsteady aerodynamic phenomena. Recently, another work of Fontanella et al. (2023) presents an experimental investigation with the same rotor containing a control system. Fontanella et al. (2023) mention a significant influence of small rotor speed oscillations on the measured rotor torque amplitude. As a consequence of these oscillations, the torque measurements are altered by inertial loads. The torque measurements are therefore corrected in a post-processing step.
The investigations by Meng et al. (2022) and Wei and Dabiri (2022) also include load measurements of a surging rotor. However, these are not directly comparable to the present work because of major differences in the measurement and/or data processing.
The above-mentioned studies show that the measurement of rotor loads in surge motion is a challenging task. Vibrations lead to a high random uncertainty or even biased measurement results at comparatively low rotor reduced frequencies. Nevertheless, the linear trend of the rotor thrust amplitude with the motion-to-inflow velocity ratio could be proved for low rotor reduced frequencies in the PoliMi experiments. The latest results from the COREWIND project indicate that this is also the case for moderate rotor reduced frequencies up to 1.7. A strong indication for unsteady effects could be found in another presentation of the COREWIND campaign, but no confirmation by simulations or other sources has been available so far.
The panel method panMARE and its sub-module for lifting-line calculations are utilised for the simulation of the three wind turbine rotors under consideration. In the case of the IEA 15 MW rotor, additional BEMT simulations using OpenFAST are performed in order to evaluate the modelling of unsteady phenomena in state-of-the-art BEMT methods during a surge motion. For the sake of simplicity, the numerical methods are exclusively used to calculate aerodynamic loads, while inertia loads, rotor speed variations or controller actions are excluded from the analysis. The utilised methods are described briefly in the following sections. Details on the numerical setups for the individual rotors are given in Appendix B.
4.1 panMARE: panel method
The first-order panel method panMARE is an in-house development of the Hamburg University of Technology (TUHH) and was utilised for floating structures and ship propellers (Bauer and Abdel-Maksoud, 2012) before it was extended to the simulation of FOWTs by Netzband et al. (2018). Validations were carried out with different wind turbine rotors, and a verification with the results of the Offshore Code Comparison Collaboration Continuation (OC4) campaign showed that combined aerodynamic, hydrodynamic and mooring loads as well as platform motions can be accurately captured (Netzband et al., 2018). panMARE has also been utilised to develop and simulate the yaw mechanism of the passively yawing FOWT concept CRUSE Offshore SelfAligner (Netzband et al., 2020). Validation and verification with full-scale measurement data and simulations of the Floatgen prototype were performed during the VAMOS project (Netzband et al., 2023).
In panMARE, the blade surface is discretised by panels. While source and doublet distributions are assigned to these panels, the three-dimensional wake is represented by doublet panels transported with the local wind speed (free wake). Panel methods are based on potential theory, which allows the description of the flow field as a boundary value problem. Therefore, viscous drag forces need to be considered using a viscous correction. In the present case, this correction is based on empirical airfoil drag coefficients of the blade sections. At every blade section, the inflow speed is calculated from the stagnation pressure. The effective angle of attack is then found by a comparison of the sectional lift force with the lift force of inviscid, two-dimensional simulations of the airfoil. Finally, the drag force of a section is calculated on the basis of local inflow velocity, the effective angle of attack and the empirical coefficients. A more detailed description of the panel method in conjunction with wind turbine rotors can be found in Netzband et al. (2018).
4.2 panMARE: lifting-line method
A sub-module for lifting-line simulations was implemented in panMARE and used to efficiently generate initial wake geometries for propeller simulations in Wang and Abdel-Maksoud (2020). This sub-module was slightly modified and adopted to wind turbines by the authors. In the sub-module, the discretised blade surface is replaced by a simple lifting line at the chord position and the wake is shed from the end of the chord line. In every time step, the local inflow velocity and angle of attack are determined from the flow field, which includes the influence of the wake and all inflow parameters. Then, the lift and drag forces are determined from empirical airfoil coefficients. Finally, the circulation of the lifting line is computed from the lift force. No unsteady corrections are used in the current version of the lifting-line sub-module. As described in Sect. 2, these might be helpful for the incorporation of the non-circulatory unsteady airfoil effect as well as for the modelling of dynamic stall. However, both phenomena have minor influence in the considered cases.
4.3 OpenFAST
In BEMT methods, a momentum equilibrium on every annular ring of a wind turbine rotor is assumed. With this assumption, the rotor loads can be computed based on empirical lift and drag coefficients of the utilised airfoils. In contrast to FVW methods, the direct modelling of the flow field in the wake is not part of the method. The BEMT method AeroDyn v15, which is part of OpenFAST (v3.1.0), contains two unsteady corrections to correct for the unsteady airfoil and dynamic inflow effect. The unsteady airfoil correction is based on the Leishman–Beddoes model (Leishman and Beddoes, 1989) with slight modifications. The dynamic inflow correction based on Øye (see Snel et al., 1995) prevents the axial induction from undergoing rapid changes. Further information on AeroDyn and its unsteady corrections is presented in Moriarty and Hansen (2005), Damiani and Hayman (2019), and Branlard et al. (2022b).
5.1 Experimental setup
The experimental investigations were performed in the wind tunnel of the TUHH. Its test section is 2 m high, 3 m wide and 5 m long, and the flow is characterised by a turbulence intensity below 0.5 %. A description of the wind tunnel environment and the TUHH model rotor can be found in a previous study of the yaw moment of the rotor (Schulz et al., 2022). Therefore, only a brief description on these topics is given in the following.
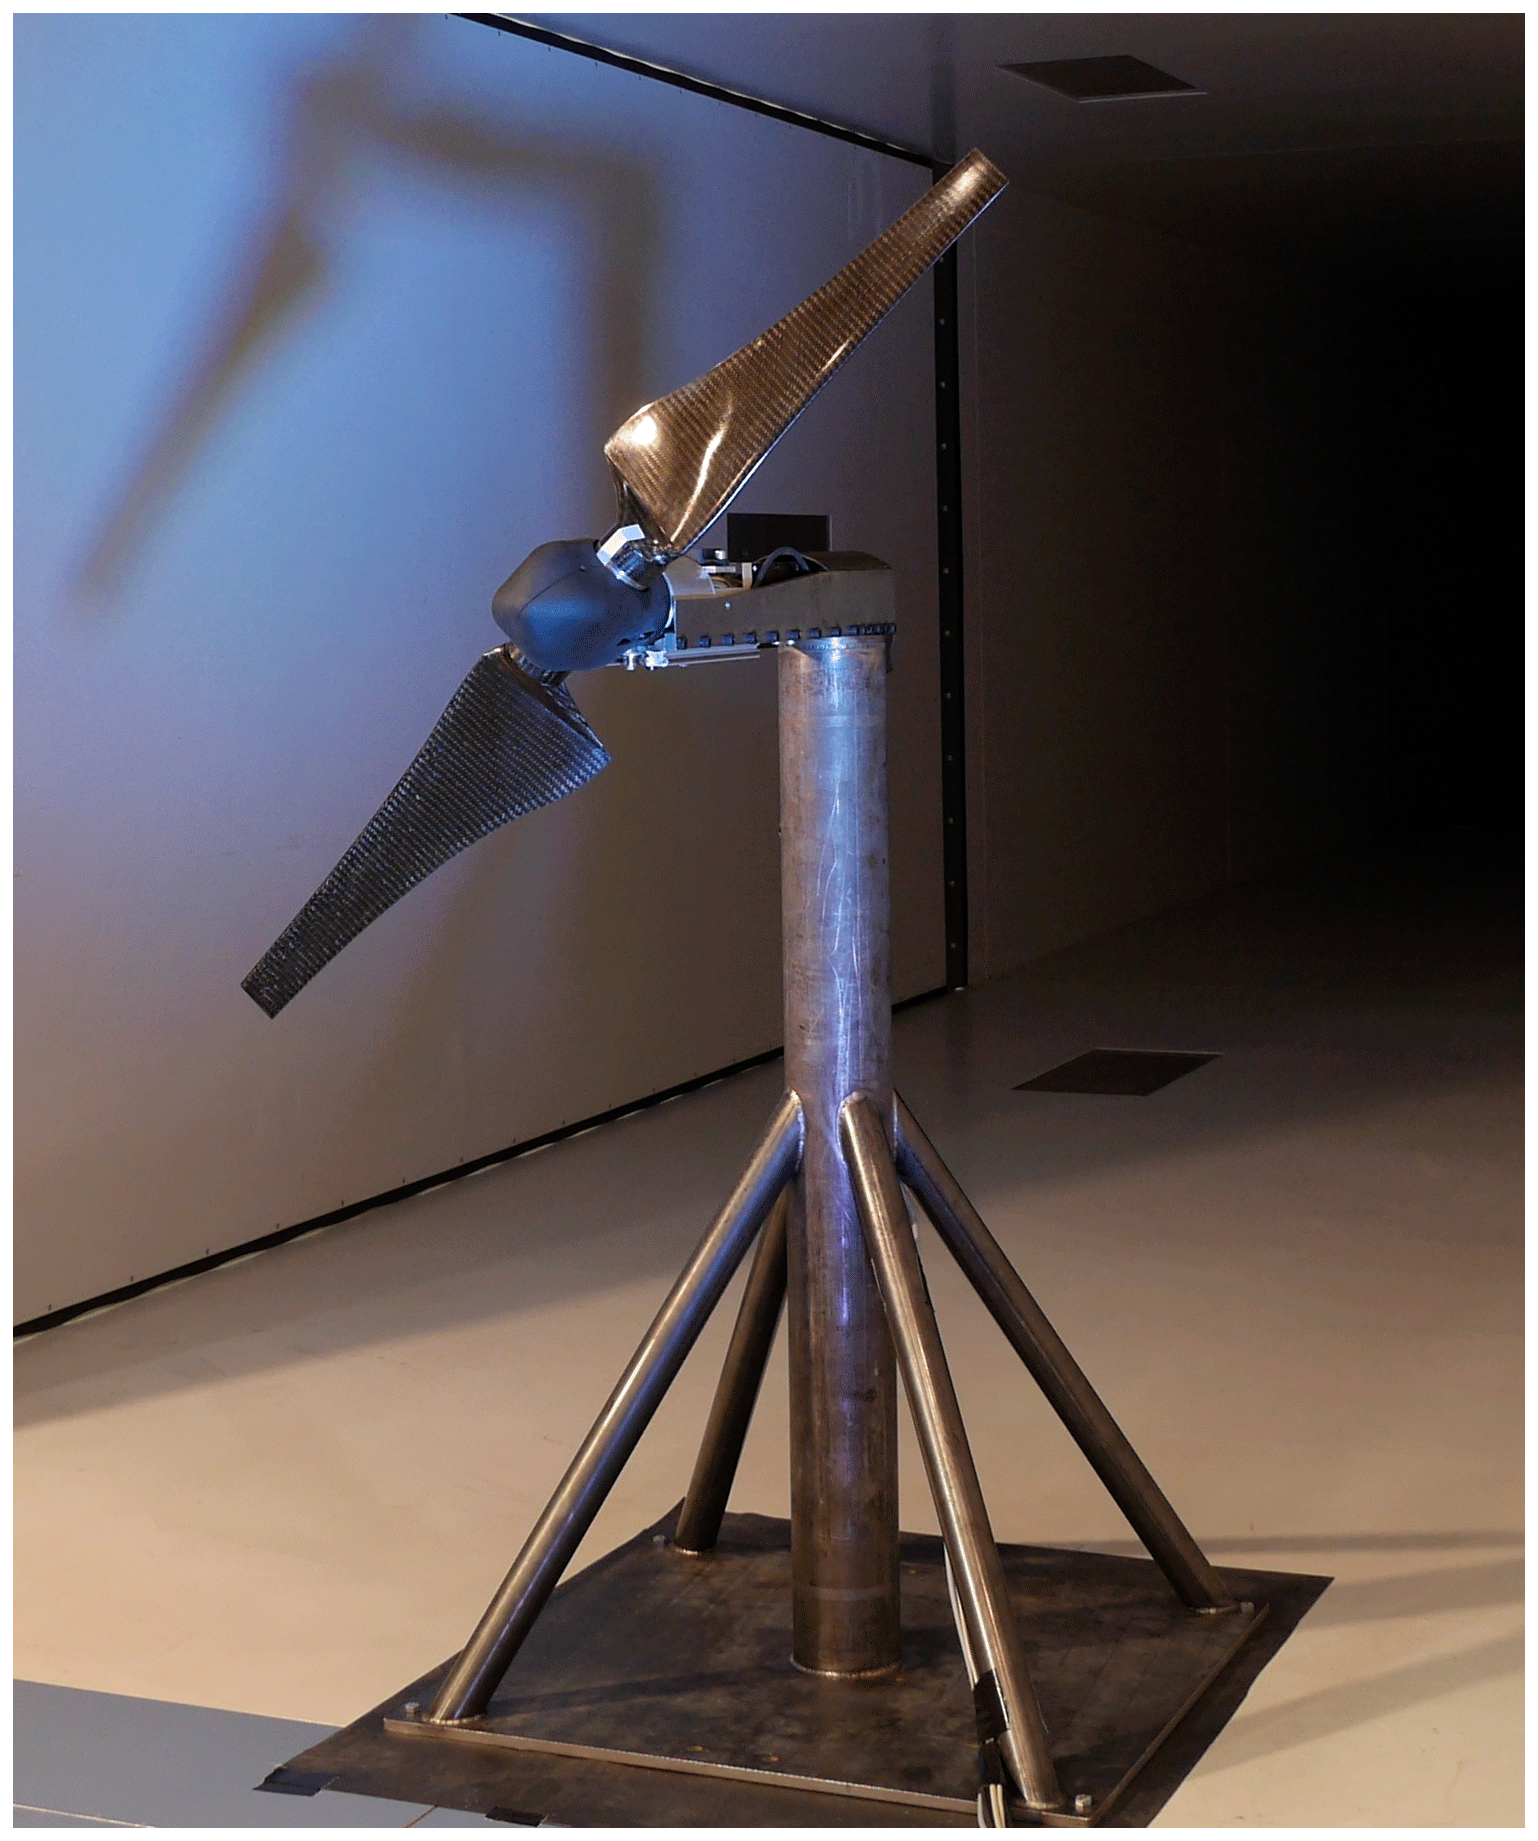
The two-bladed model wind turbine (see Fig. 3) has a rotor diameter of 0.93 m. It is designed to be rigid so that no notable influence of blade bending and torsion on the load measurements is expected. The accuracy of the blade manufacturing was checked using a high-accuracy 3D surface scan. As scaled wind turbines generally suffer from a very low Reynolds number, the chord length is often significantly increased in comparison to the geometric scaling of full-scale turbines. This leads to a redesign of the complete blade geometry. Therefore, scale models can usually not be considered to belong to a certain turbine type anymore but serve as representatives of a typical modern wind turbine. In this case, a Reynolds number of approximately 125 000 could be maintained over major parts of the blades due to the increased chord length and a comparatively high rotational speed of 1050 rpm during the measurements. In addition, the SD7062 airfoil was used for the whole blade, as laminar-turbulent transition occurs earlier compared to with conventional wind turbine airfoils, which has a positive effect on aerodynamic properties at low Reynolds numbers.
Due to the specialised blade design, the occurrence of stall is not expected except very near to the root. All data to set up a numerical model of the rotor are given in Schulz et al. (2022).
A novel test rig (see Fig. 3) was developed in order to impose surge motions with high frequencies while minimising tower-top vibrations. The key feature of the test rig is that the nacelle is mounted on a linear slide at the tower top (see Fig. 4), which is connected to a magnetic linear motor. This allows making use of a heavy and rigid tower design while keeping the weight of the moving parts low. The steel tower with a height of 1 m consists of a base plate, a main column with a diameter of 0.1 m and a thickness of 6 mm, and bracings that support the main column. The lowest eigenfrequency of the tower structure was found to be approximately 800 Hz in finite-element simulations. In order to reduce the inertia loads disturbing the thrust measurement, a six-component force–moment sensor was integrated into the rotating hub. Therefore, a wireless transmission of the measurement data was necessary. In addition, hall sensors, a surge position sensor and an accelerometer were placed in the nacelle. Details on the sensors and data acquisition as well as a sketch of the nacelle can be found in Appendix C.
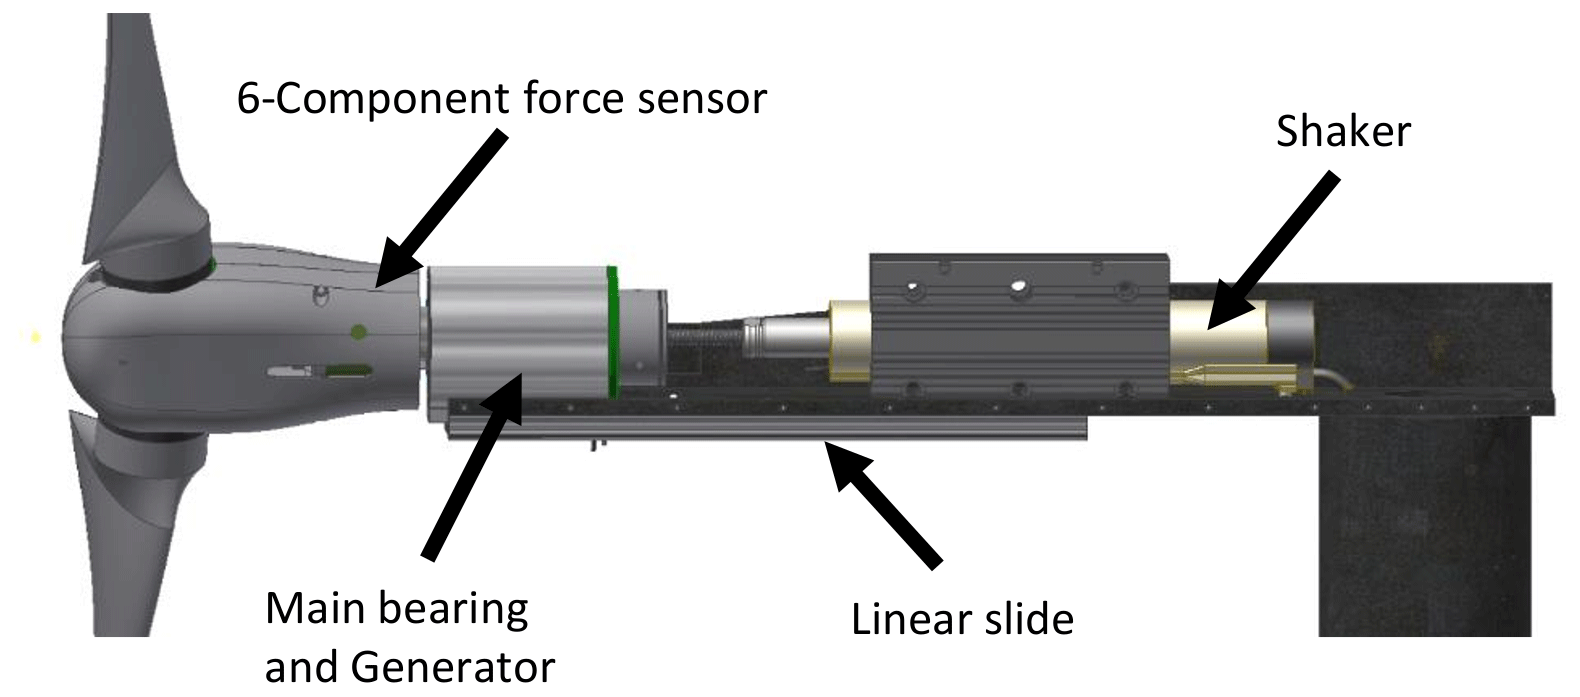
Figure 4Sketch of the tower top of the test rig. The rotor nacelle assembly is mounted on a carriage, which can be moved in the surge direction by the linear actuator.
5.2 Steady operating conditions
In order to validate the capability of the simulation models to capture the quasi-steady behaviour of the model rotor, multiple test series with constant rotational speed and varying inflow wind velocity were performed, and the experimental results were compared with those of the simulations. The three test series with rotational speeds of 600, 800 and 1050 rpm approximately correspond to local Reynolds numbers of 75 000, 100 000 and 125 000 at the blade sections. The measured values of the rotor torque were filtered for outliers; averaged over a period of 15 s; and then utilised to compute the power coefficients, which are shown in Fig. 5. For the highest Reynolds number, a maximum power coefficient of approximately 0.41 is reached, which confirms a comparatively low influence of undesirable viscous effects induced by the scaling. Therefore, a low sensitivity of local variations in the Reynolds number to the measured aerodynamic loads can be concluded. In addition, the smoothness of the curves gives an indication of a comparatively low repetition error, which was also observed in a previous investigation of this rotor (Schulz et al., 2022).
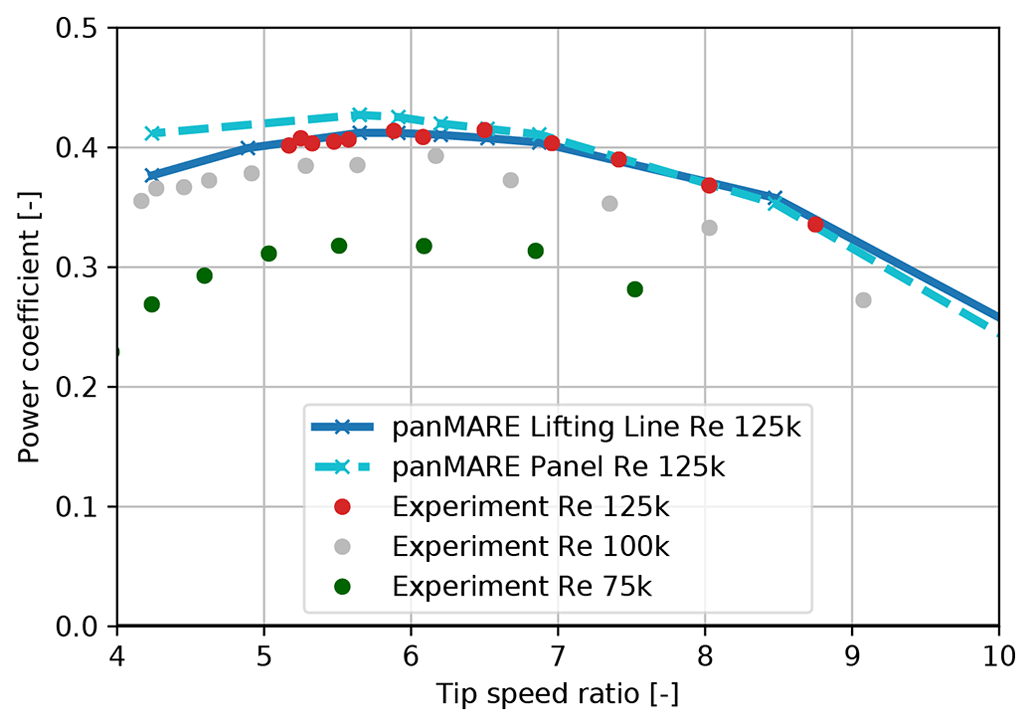
Figure 5Power coefficient of the model rotor dependent on the TSR. Lift and drag coefficients used in the simulations correspond to a Reynolds number of 125 000.
The lifting-line simulations show a nearly exact agreement with the corresponding measurement series, while the panel method overpredicts the power coefficient slightly at low TSR. This is most likely due to the fact that the lift coefficient is slightly overpredicted in the panel method simulations at high angles of attack due to the missing consideration of viscosity (see Fig. B1). The operating point at which the surge tests were performed was selected to be at the highest rotational speed and a wind speed of 8.51 m s−1. This corresponds to a TSR of 6 and optimal power generation.
5.3 Thrust measurements in surge motion
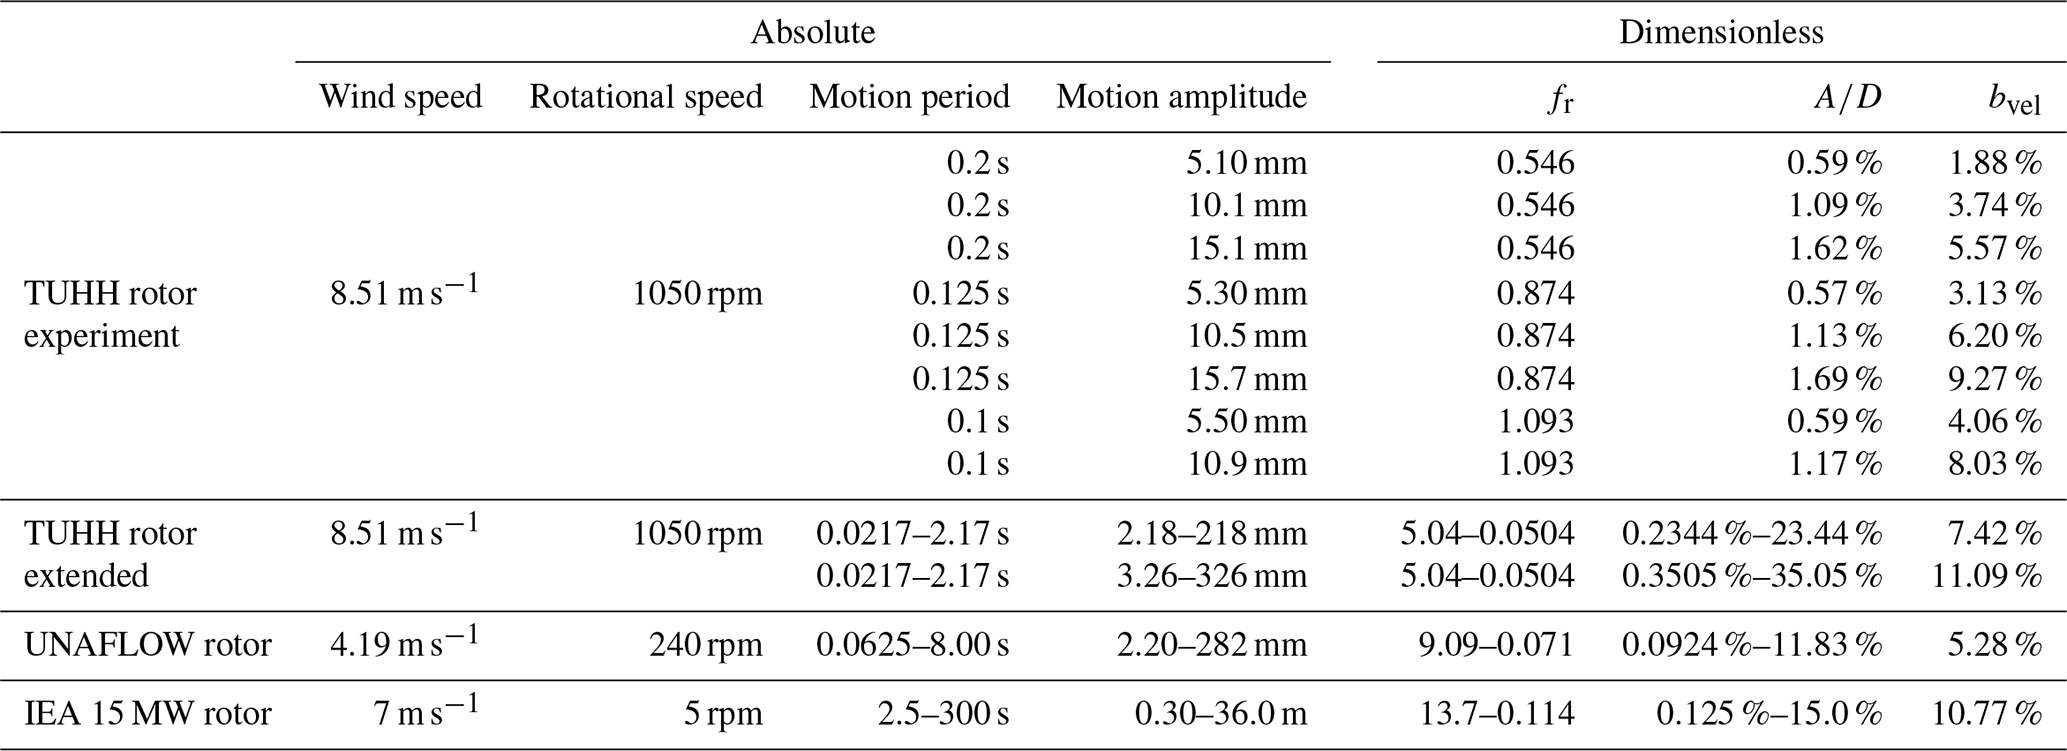
Harmonic surge motions were applied to the model rotor at constant rotational speed and wind speed. An overview of the experimental load cases is given in Table 3. The motion amplitudes and frequencies were chosen so that realistic motion-to-inflow velocity ratios for a FOWT in typical environmental conditions were covered. However, vibrations of the tower top limited the rotor reduced frequency to 1.09.
Table 3Surge motion load cases for the three different rotors. For the simulation studies, only minimum and maximum values for one series are given. Maximum values of periods and minimum values of amplitudes correspond to the same load cases and vice versa.
Although thrust measurements were recorded, a sufficiently low uncertainty could not be achieved. Accelerometer-based and difference-based inertia removal procedures were applied to separate the aerodynamic thrust force from the inertial forces of the rigid body. In the accelerometer-based procedure, the nacelle acceleration was multiplied by the accelerated mass of the hub and subtracted from the axial rotor force. In the difference-based procedure, the axial rotor force in surge motion was measured with and without wind. To gain the aerodynamic rotor thrust, the signal without wind was subtracted from the signal with wind.6 The inertia-corrected thrust force signals were phase-averaged over at least 10 periods, and the thrust force amplitudes were extracted.
To check the integrity of the inertia force compensation procedures, a number of selected load cases were run multiple times without wind. Both procedures were applied to evaluate the measured values of test runs, which should result in a vanishing rotor thrust as no aerodynamic load was applied. In the covered motion range, the residual thrust amplitudes deviated by up to 10 % of the nominal thrust from zero. Since the magnitude of the uncertainty is in the same order of magnitude as the total thrust force amplitude at low bvel values, the determination of the unsteady parts would be pursued as the identification of these parts of the load response requires higher accuracy than in the measurements performed.
Forced tower-top vibrations are considered the main reason for the insufficient accuracy of the inertia removal procedures. Due to the multi-axial vibrations, the inertia loads could not be measured with sufficient accuracy, so not all inertia load contributions could be eliminated by the inertia removal procedures. A possible source for such uncertainties comprises parasitic measurement signals on the thrust force channel from crosstalk, which are caused by vibration-induced inertia loads in directions other than the surge motion direction. These vibration-induced inertia loads and corresponding parasitic loads could not be filtered from the measurements because they occur exactly at the same frequency as the aerodynamic forces. Finally, it was found that the tower and support structure could not maintain a sufficiently low level of vibrations, although these were designed in a very rigid manner in comparison to other similar experimental setups.
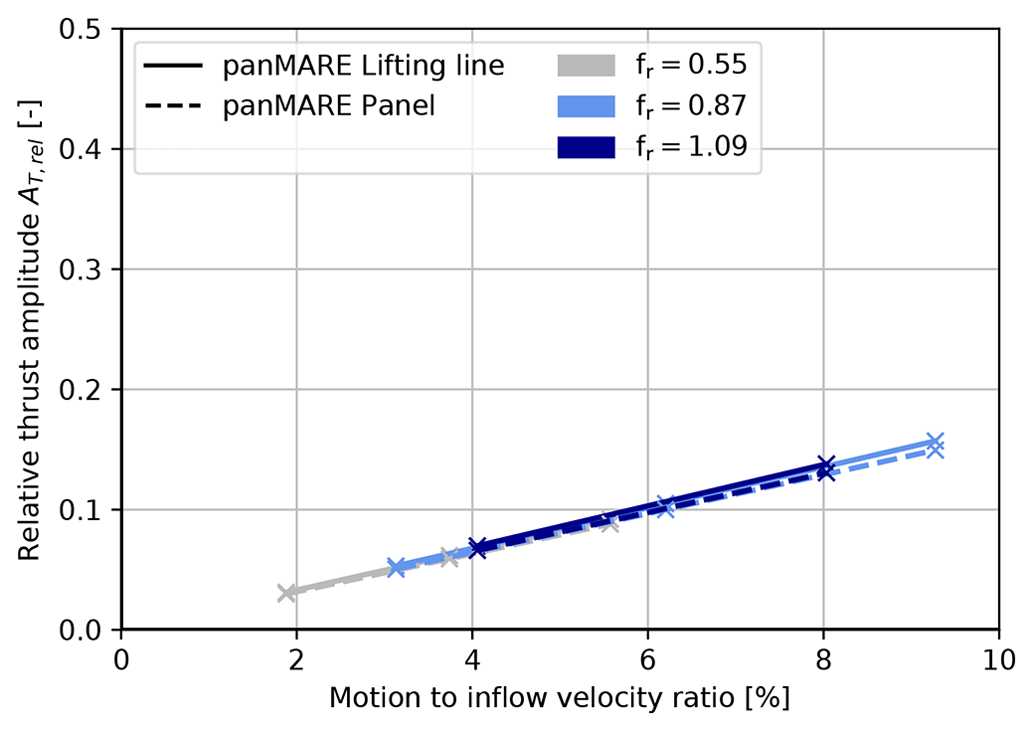
The numerical results for the relative thrust force amplitude are shown in Fig. 6. These relative amplitudes are computed by normalising the thrust amplitude AT to the thrust measured (or simulated) in steady conditions (Tsteady) at the operation point:
A linear ratio between the rotor thrust amplitude and bvel can be observed. Interestingly, the variation in the rotor reduced frequency does not seem to have any impact on this linear relation in the considered range of motion parameters. It can be clearly seen that bvel determines the rotor thrust amplitude when rotor speed and inflow speed are kept constant. Therefore, no hint of unsteady contributions to the simulated thrust amplitude is present in the considered cases.
5.4 Torque measurements in surge motion
Large effort was undertaken to keep an ideally constant rotor torque during the surge motion; however, a sinusoidal variation in the rotor speed in a range of 0.1 % to 0.3 % of the nominal rotor speed could not be avoided. Due to the acceleration and deceleration of the rotor, the measured rotor torque contained a significant contribution of the corresponding rigid body inertia loads. In the present case, this contribution counteracted the aerodynamic rotor torque and therefore compensated the measured torque fluctuations to surprisingly small values. The same phenomenon was observed in the COREWIND experiments by Fontanella et al. (2023). As a consequence, an inertia compensation procedure needs to be applied to the torque measurements even for very small variations in the rotor torque. The aerodynamic rotor torque Q can be written as
where Qmeas(t) is the measured torque and J describes the mass moment of inertia of the rotating part of hub and rotor behind the sensor. A number of post-processing steps are required to reproduce the actual aerodynamic torque from the load and rotor speed measurements, which are described in Appendix C2. The resulting rotor torque during one motion period is shown in Fig. 7 (blue line) for the cases listed in Table 3. It has to be noted that the aerodynamic torque signal follows a mostly mono-harmonic trend, which is – in contrast to other experiments – not a result of a low-pass filtering but the measured characteristic of the signal. An estimation of the systematic uncertainty in this procedure is given in Appendix D.
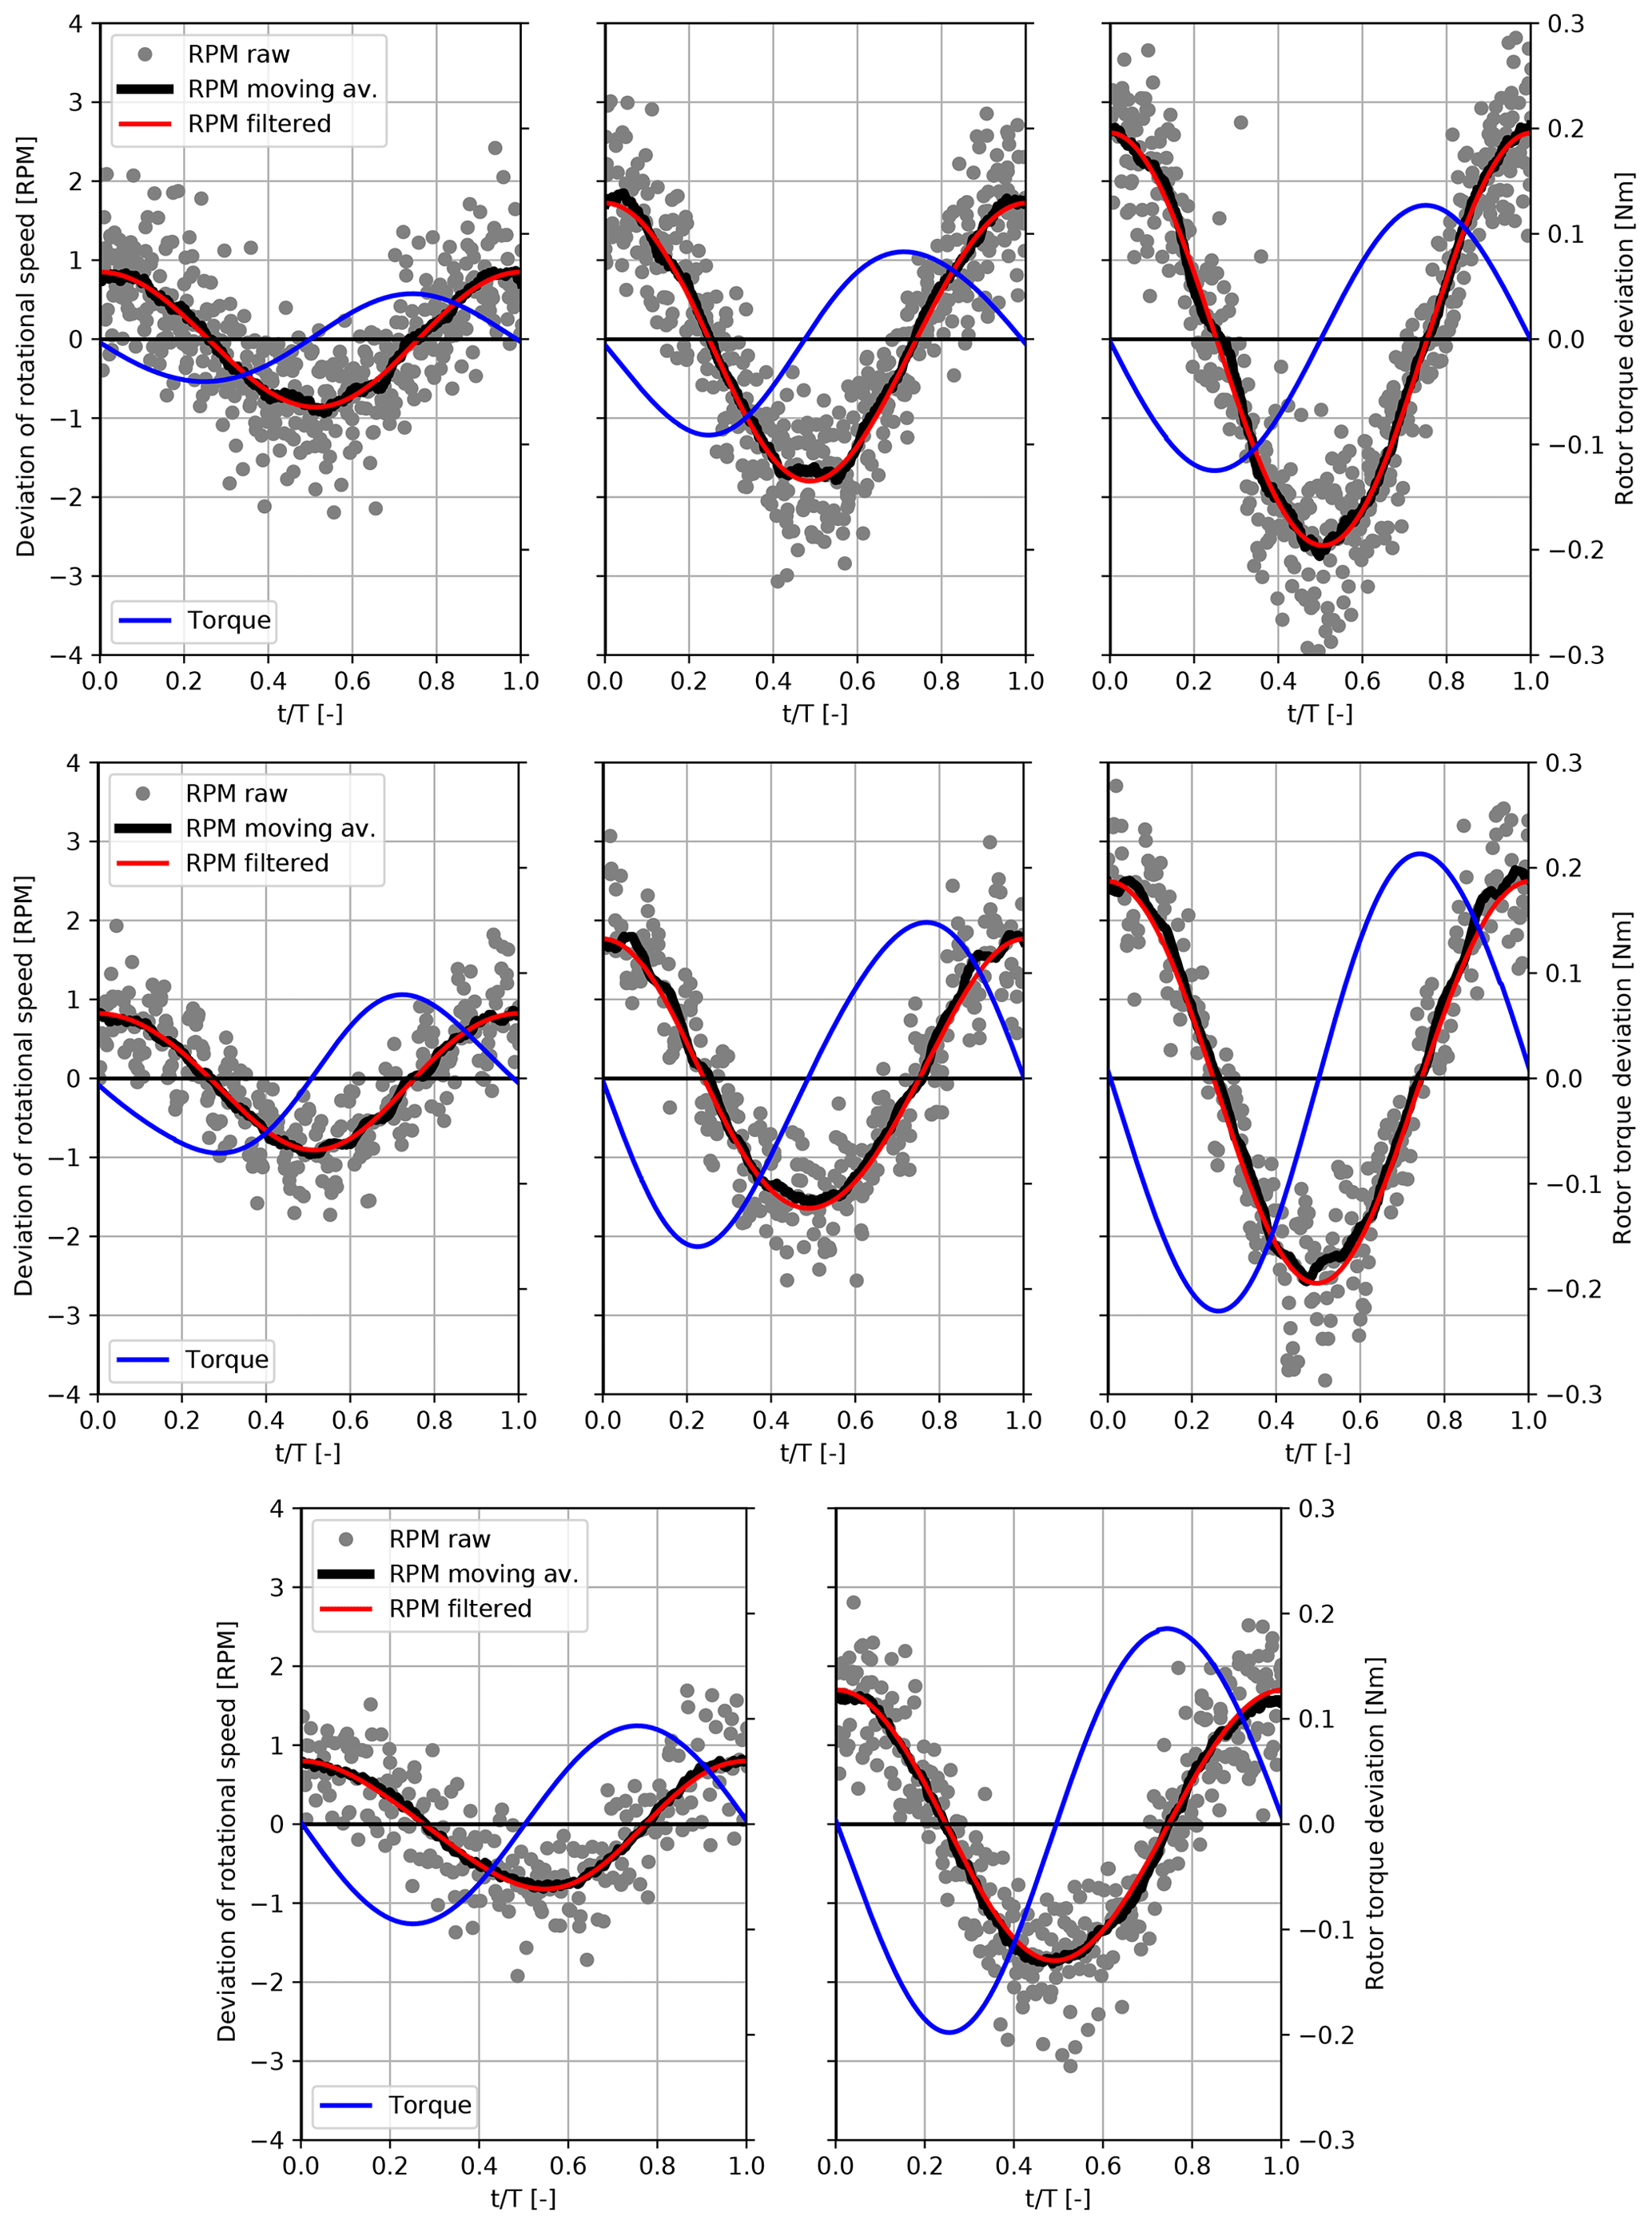
Figure 7Raw, phase-averaged and filtered variation in the rotational speed measurements (left y axis) and phase-averaged, inertia-compensated rotor torque fluctuations (right y axis).
The relative torque amplitudes AQ,rel extracted from the time series signals are shown in Fig. 8. These relative amplitudes are computed by normalising the torque amplitude AQ to the torque measured (or simulated) in steady conditions (Qsteady) at the operation point:
Only marginal differences between the experimental and numerical results are present, no matter whether the panel method or lifting-line simulations are considered. Every measurement was repeated at least twice.7 The results for the same load case show very similar values, which indicates a comparatively small repetition error. For selected load cases, a third run was also performed, which resulted in similar values that are not shown here.
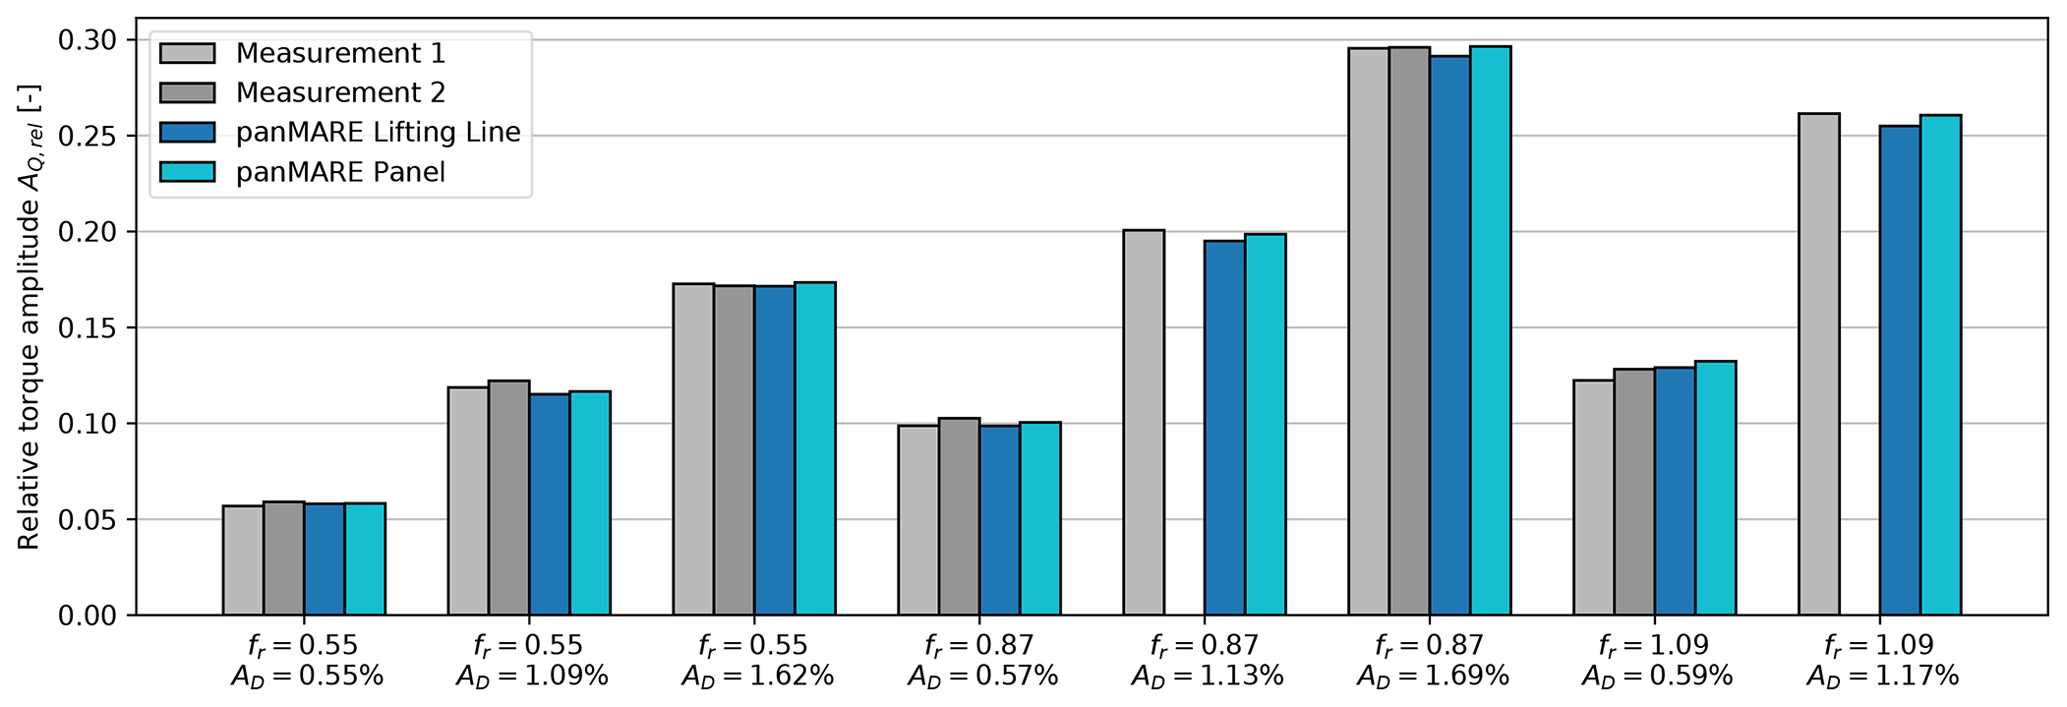
Figure 8Measured and simulated relative rotor torque amplitudes as a response to eight different surge motions. Values are normalised according to Eq. (14). Two measurement runs under identical conditions are shown for most surge motions. AD describes the motion amplitude normalised to the rotor diameter.
The same amplitudes are plotted over the corresponding motion-to-inflow velocity ratio bvel and coloured by the rotor reduced frequency in Fig. 9. The measurements reveal a linear ratio between the rotor torque amplitude and bvel. This linear trend is captured nearly exactly by both simulation methods, which is very similar to the behaviour of the simulated rotor thrust force in Fig. 6. Therefore, the rotor torque oscillations can be determined by bvel exclusively in the applied range of motions, which is a strong indication of a quasi-steady behaviour. It has to be noted that the absence of unsteady behaviour is suggested by the independence of the linear trend from the motion frequency but not necessarily by the presence of a linear trend itself.
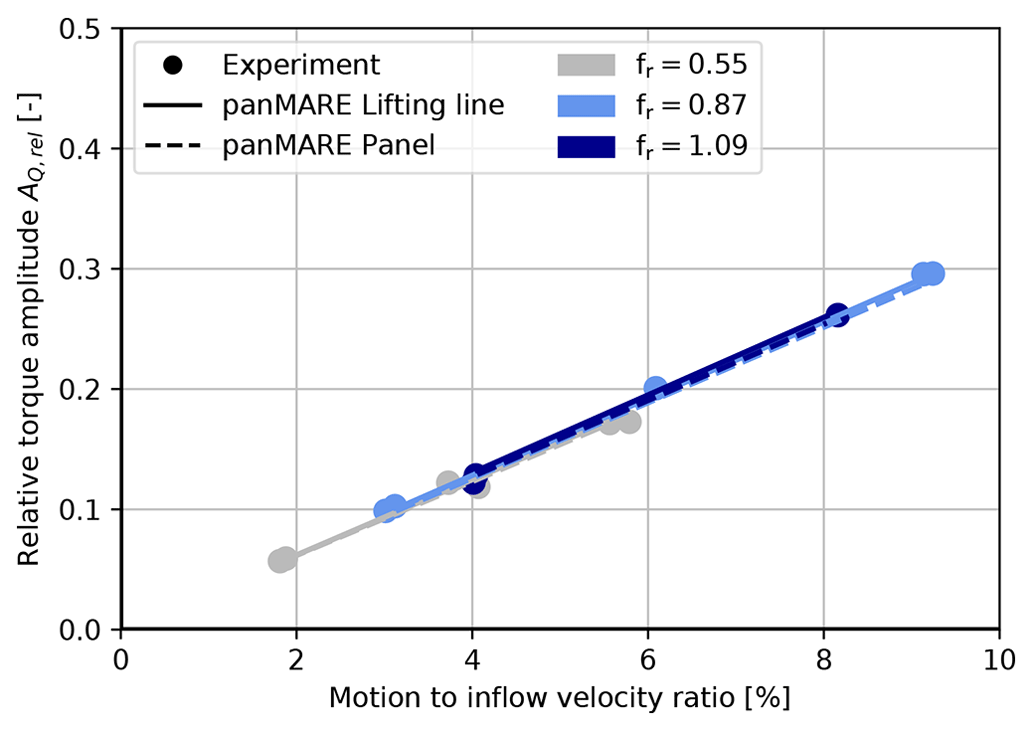
Figure 9Measured and simulated rotor torque amplitudes as a response to the surge motions plotted over the motion-to-inflow velocity ratio. Values are normalised according to Eq. (14).
In Fig. 10, the average rotor power derived from the rotor torque measurements normalised by the steady-state power is plotted over bvel. The average power is computed by the product of the averaged rotor torque obtained by the load sensor and the average rotational speed over approximately 15 motion cycles. A slight increase in the power can be observed with rising bvel. In addition, comparatively strong scattering is visible because the deviation from the steady-state power is in a range of only 1 %. Again, no systematic influence of the motion frequency is detectable, which proves the absence of an unsteady influence on the average power. Both simulations agree closely with the measurements, which is not surprising as it is shown in Fig. 5 that the quasi-steady power of the model rotor can be accurately captured by the simulations. The deviations between measurements and simulations (also among each other) are within a maximum range of approximately 0.4 %, which is considered uncertainty.
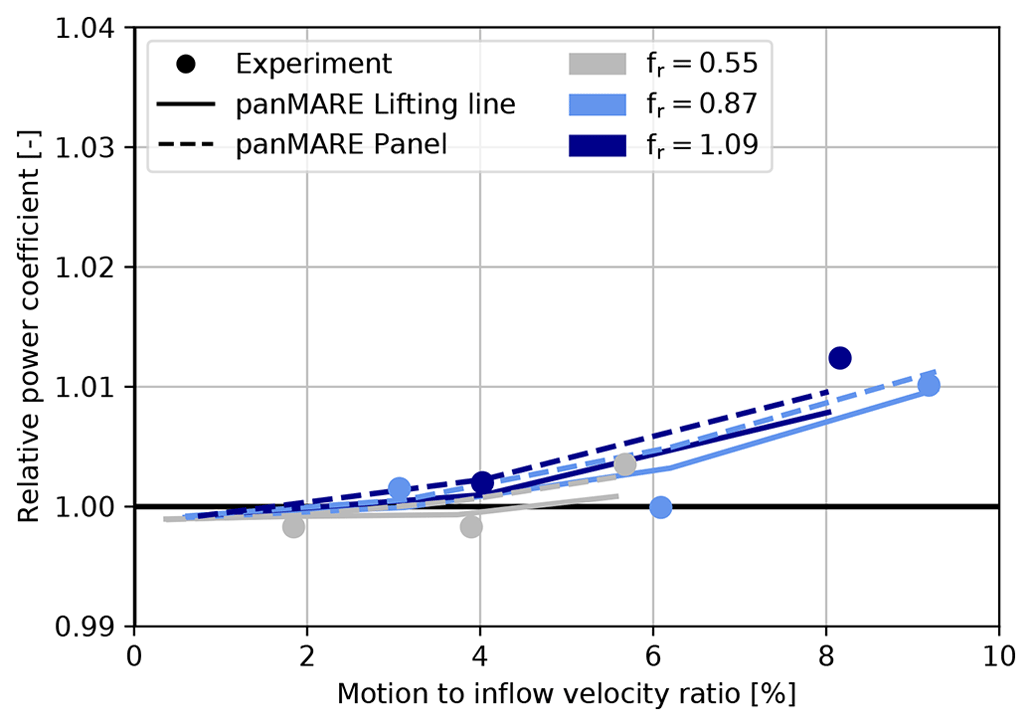
Figure 10Measured and simulated average power coefficient during the surge motions plotted over the motion-to-inflow velocity ratio. Values are normalised to the average rotor power in steady conditions (no surge motion).
In summary, a precise agreement of measurements and the lifting-line and panel method simulations in the steady and unsteady cases can be observed. No hint of unsteady contributions to the rotor torque or any other unsteady behaviour could be found in the experiments and simulations. However, due to the limited motion frequency range of the experiments and measurement accuracy, a small contribution of unsteady effects cannot be excluded. It has to be noted that only aerodynamic loads and no controller actions are considered here and in all following results.
The test rig was limited to moderate motion frequencies. In reality, significantly higher rotor reduced frequencies up to 8 or even higher may occur when considering 20 MW wind turbines moving with typical wave frequencies. Therefore, the surge motion frequency range was extended to investigate whether unsteady aerodynamic effects may occur at very high motion frequencies. Figure 11 shows the relative rotor torque amplitude over bvel comparably to Fig. 9 but with a higher range of the rotor reduced frequencies and bvel values.
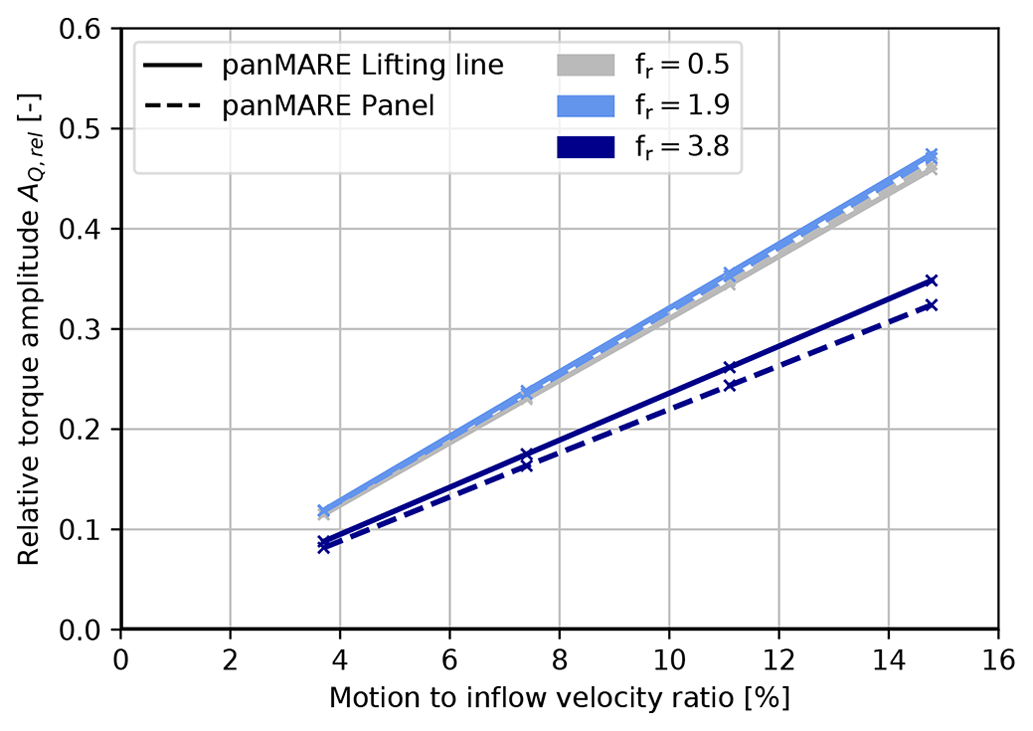
Figure 11Simulated rotor torque amplitudes of the model rotor as a response to the extended surge motions plotted over the motion-to-inflow velocity ratio. Values are normalised according to Eq. (14).
As in the previous case, a linear trend between the amplitude and the motion-to-inflow velocity ratio is present. The grey line representing a rotor reduced frequency of 0.5 is approximately equal to the previous experimental and numerical results, where no hint of unsteady behaviour was found. The slope of the linear relation slightly rises for an increased reduced frequency of 1.9, which already gives an indication of small unsteady contributions to the torque response. Interestingly, a further increase to a reduced frequency of 3.8 yields a significant decrease in the slope. This is caused by the returning wake effect, which is shown in the further investigations in this section. Finally, the results show a significant dependency of the rotor torque amplitude on the rotor reduced frequency at the same motion-to-inflow velocity ratio bvel. This can be considered proof of an unsteady contribution to the load response of the simulations.
In order to investigate the underlying aerodynamic phenomenon causing this unsteady behaviour, a different kind of load case series is applied, which allows the investigation of the influence of the motion frequency independently from bvel. In these series, bvel is kept constant, while the motion frequency varies (see Table 3). This results in a constant quasi-steady behaviour for every load case in the series while the influence of unsteady phenomena may vary with the motion frequency. The load case with the lowest motion frequency is considered an approximately quasi-steady case because one surge motion period lasts as long as 35 rotor revolutions. The extremely low motion frequencies and their corresponding amplitudes therefore represent somewhat exaggerated cases, as such behaviour is not expected in reality.
The analysis in this section is based on the rotor torque for consistency with the experiments. As discussed in Sect. 2.2, the influence of the expected unsteady phenomena is very similar on torque and thrust in the case of surge motions. For completeness, the main results are also shown for the thrust force in Appendix E. However, no principal difference between the graphs for torque and thrust amplitudes can be found.
6.1 Analysis of the torque amplitudes
In Fig. 12, the torque amplitude is displayed over the motion period and rotor reduced frequency. Two series with exemplary motion-to-inflow velocity ratios were simulated with the panel method and the lifting-line method. For visual purposes, the x axis is chosen to be logarithmic. In contrast to the preceding illustrations, all amplitudes are normalised to the quasi-steady case, which corresponds to the amplitude at a rotor reduced frequency of 0.02 (or a period of 2 s). This also applies to all following sections. The normalised rotor torque therefore describes the ratio between the actual torque amplitude AQ and the torque amplitude of the simulation case with the longest motion period AQ,quasi-steady:
This results in the fact that all curves reach 1 at this period. The normalised thrust amplitude can be computed accordingly.
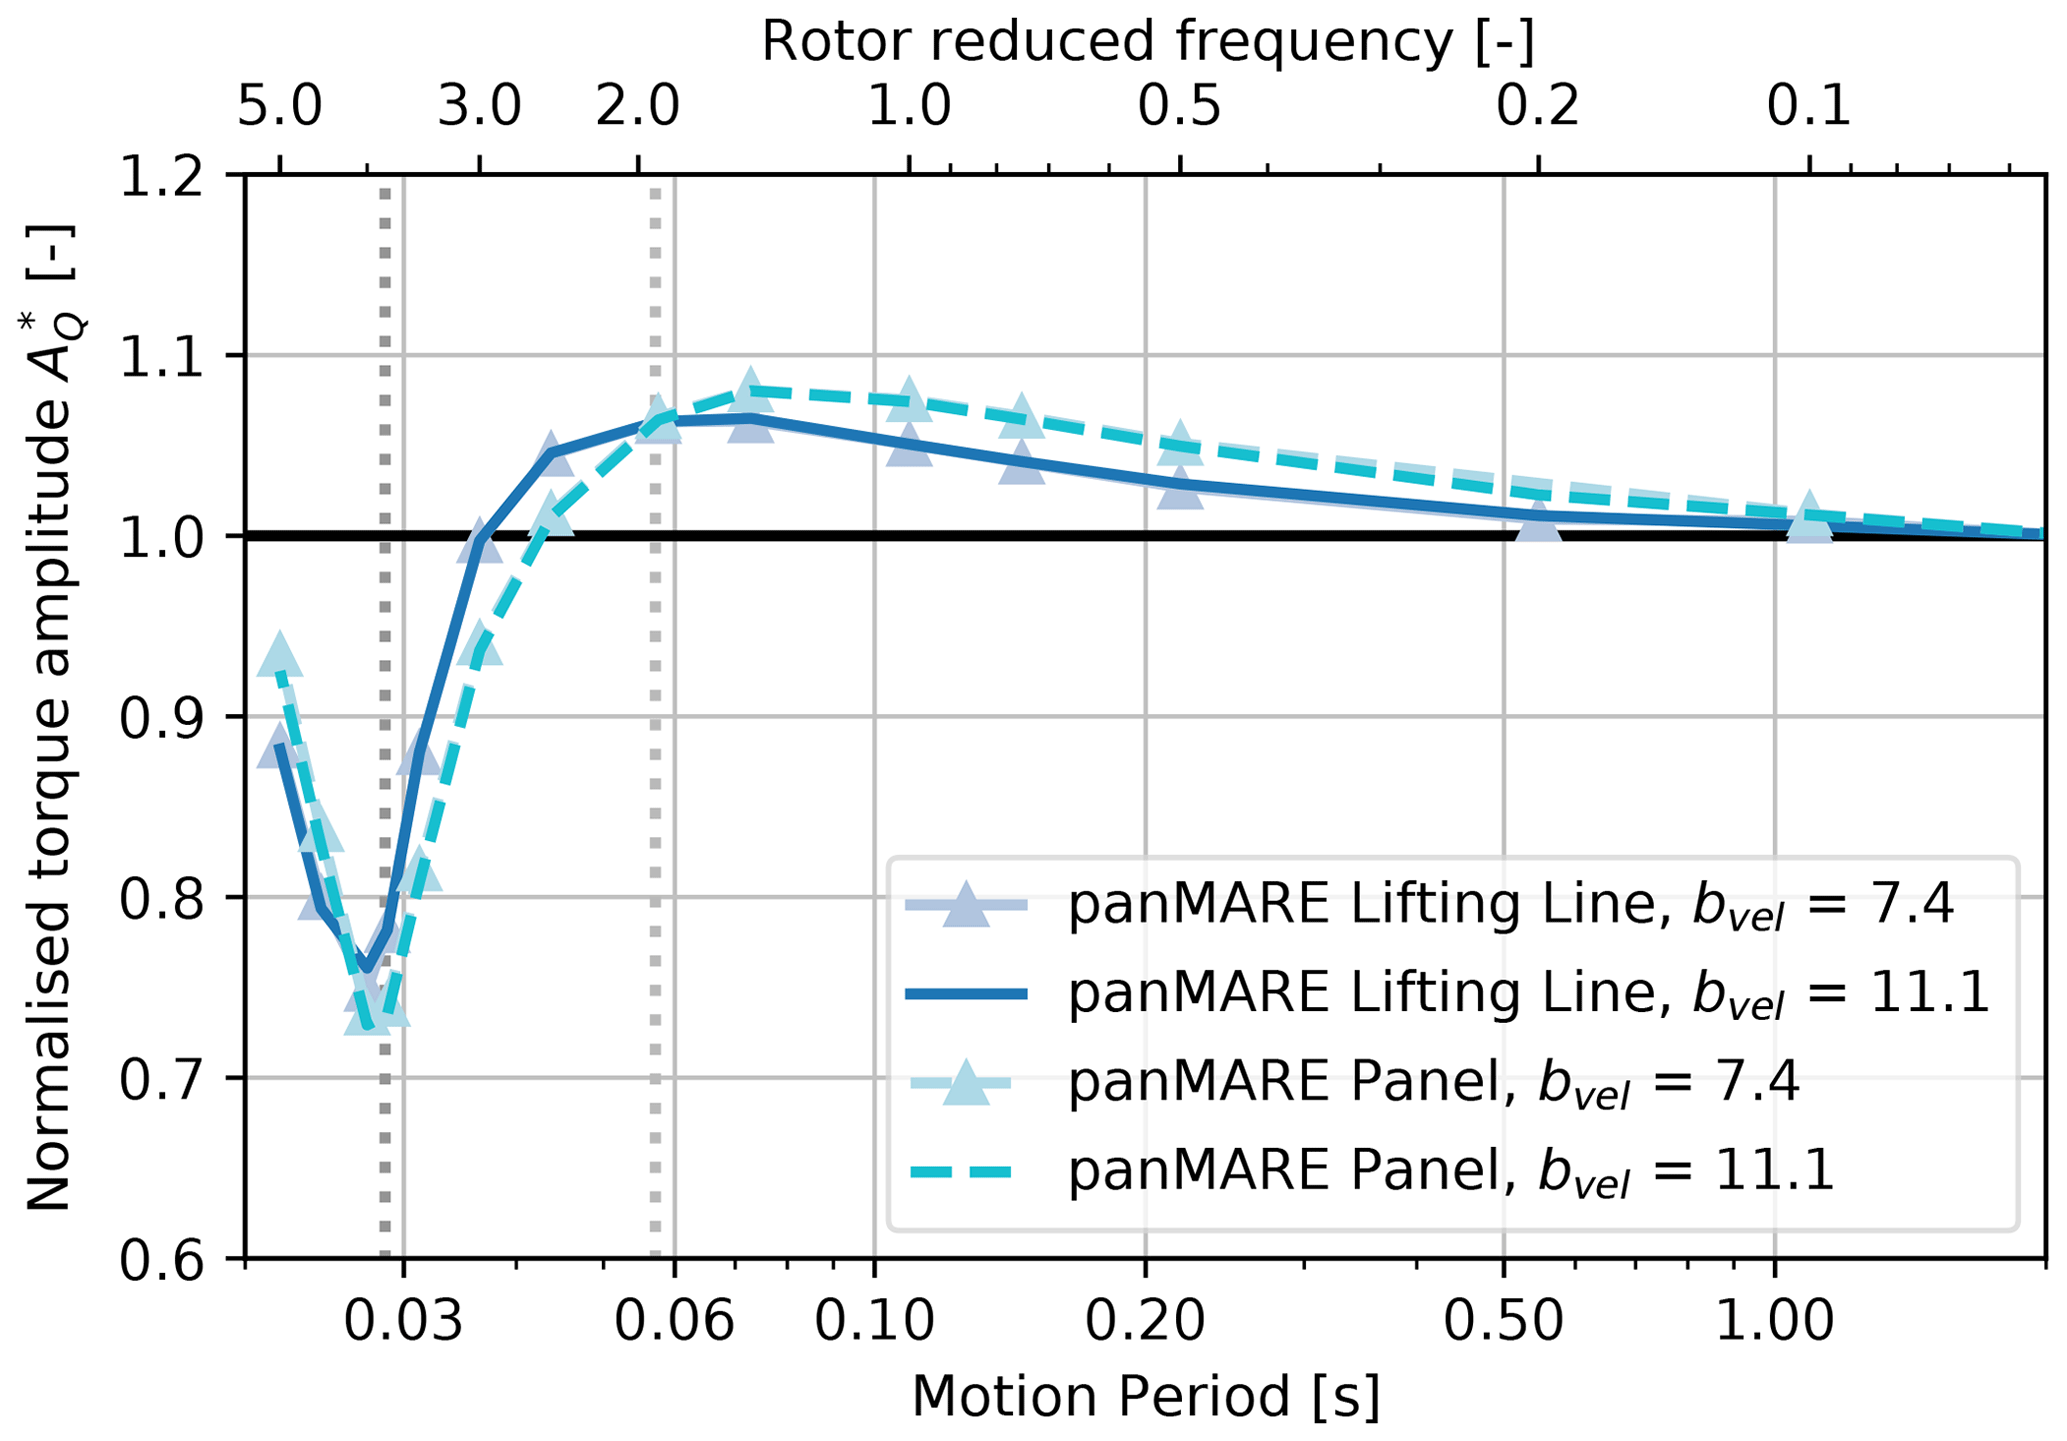
Figure 12Rotor torque amplitudes of the model rotor from simulations as a response to the extended surge motions plotted over the motion period and rotor reduced frequency. Torque amplitudes are normalised to the case with the highest motion period (see Eq. 15). The single (dark grey) and double (light grey) blade-passing periods corresponding to f3P and are indicated by vertical dotted lines.
Starting on the right at the lowest reduced frequency, both methods show a slowly increasing torque amplitude up to a reduced frequency of 2. A rapid drop of approximately 30 % occurs towards a reduced frequency of 4, which is followed by another increase. This behaviour clearly indicates the presence of unsteady aerodynamic phenomena. Otherwise, all curves would follow a constant trend over the rotor reduced frequency. When comparing the values at the reduced frequencies from the experiment (0.55, 0.87 and 1.09), it becomes clear that although there are only small differences between the torque amplitudes, the values differ clearly from 1. This shows that small unsteady contributions are present also in these simulated cases, although no clear indication of unsteady behaviour was found in the analysis in the previous section. From the displayed results it is difficult to conclude which of the unsteady aerodynamic phenomena described in Sect. 2.2 may cause such behaviour. However, the minimum amplitude is reached at the surge motion frequency that corresponds to the blade-passing frequency (35 Hz, i.e. a period of 0.0286 s). This provides a strong indication that the returning wake effect is present.
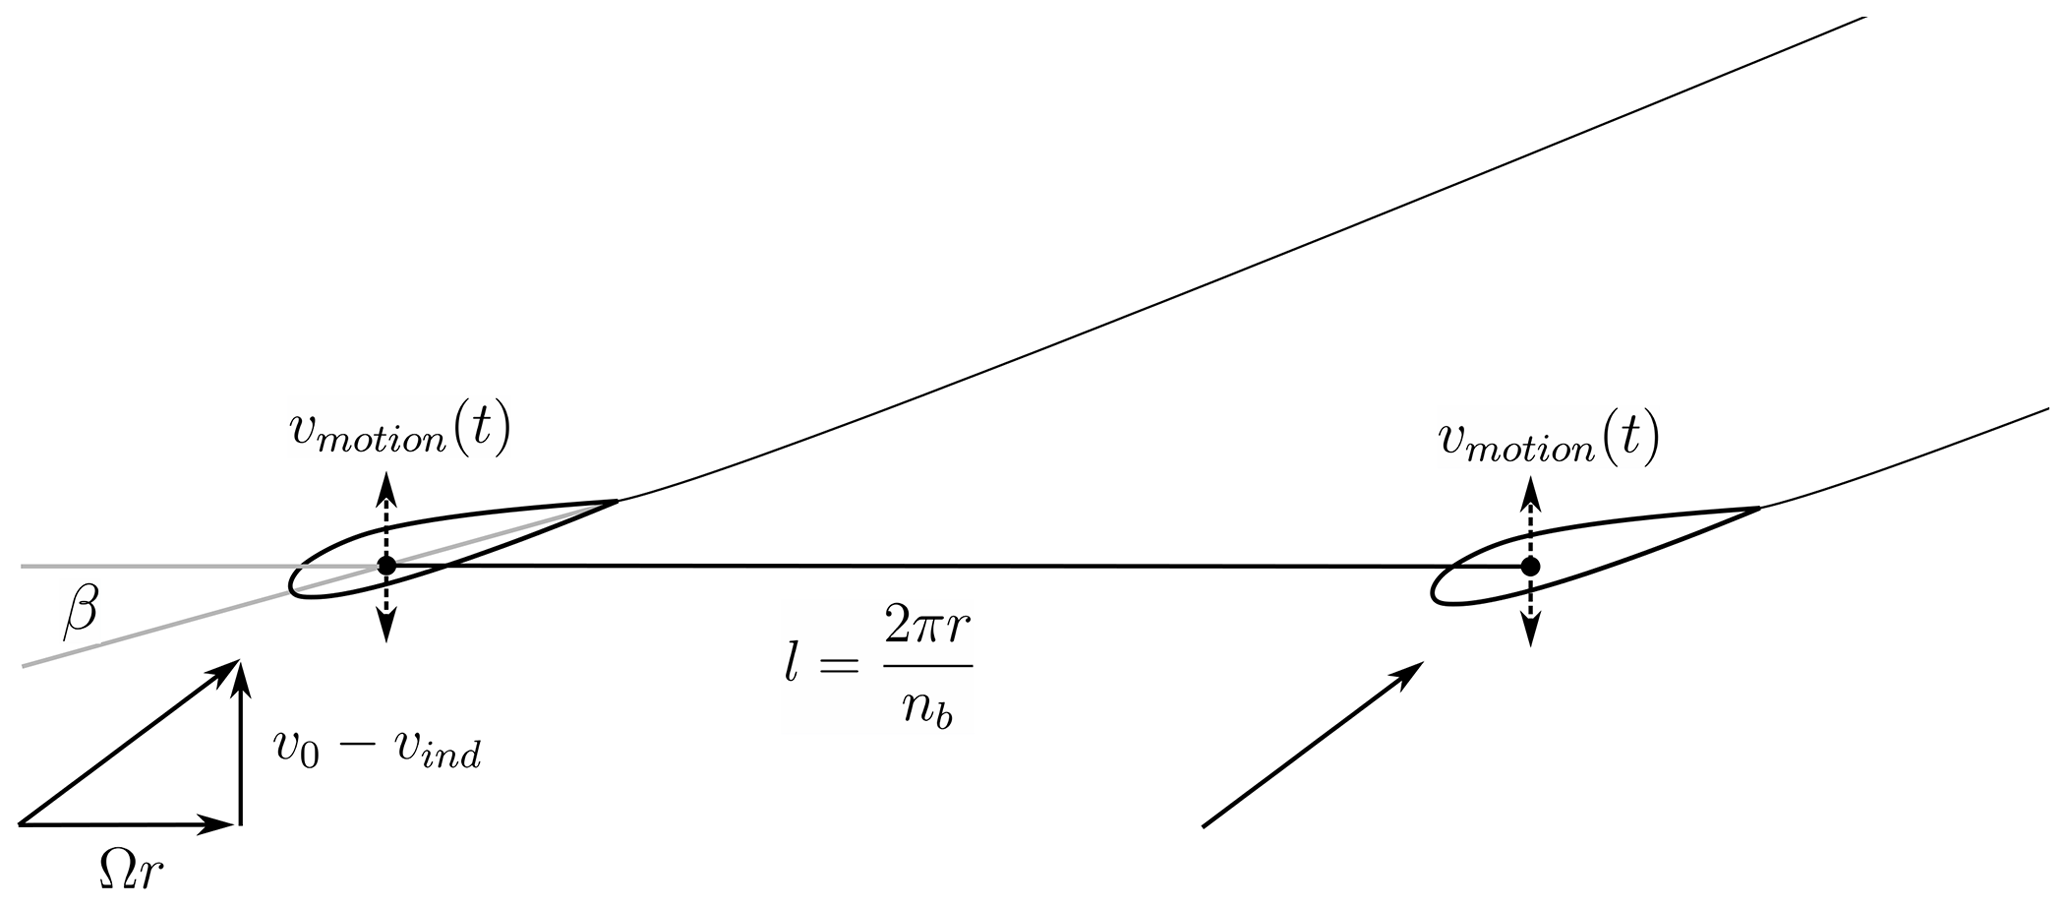
Figure 13Schematic setup of the two-dimensional simulations of a blade section. The setup can be considered an unrolled version of the sectional view illustrated in black in Fig. 2. l and β describe the distance between the two airfoils and the local twist angle at the corresponding rotor radius.
6.2 Identification of the returning wake unsteady airfoil effect in 2D
The returning wake effect can be modelled in a two-dimensional manner using the cascade approach, which was demonstrated for wind turbines by Eliassen (2015). Therefore, an equivalent two-dimensional setup approximately corresponding to the flow situation on a cylindrical surface with a relative radius of 62 % was created in panMARE (see Fig. 13). For the sake of simplicity, only two airfoils representing the two blade sections were considered here. However, for a complete representation of the returning wake effect in such setup, multiple airfoils and their wakes would be necessary. The two airfoils in Fig. 13 represent cuts through the two blades at a constant radius as indicated by the black contours in Fig. 2.8 Their distance in the lateral direction to each other equals the arc length from one blade to the other in the three-dimensional case. In consequence, the interaction of the shed vortices from the first blade with the lift force of the second blade at a given blade section can be represented in this way. However, due to the limitation to two airfoils, only the vortices shed during one rotor rotation are considered in the two-dimensional simulations. The inflow speed and angle of attack of the airfoils approximately correspond to those in the three-dimensional simulations. The surge motion is represented as a harmonic vertical motion of the airfoil pair.
The lift force amplitude of the second airfoil for different motion frequencies is shown Fig. 14. In addition to that, the results for the same setup with only one airfoil, where no returning wake effect is present, can be seen in the graph. Again, the amplitudes are normalised to the largest motion period (corresponding to the lowest rotor reduced frequency), which can be considered a quasi-steady case. This assumption can be confirmed by the nearly horizontal slope of the amplitudes at the highest motion period. On the top border of the graph, a second scale indicating the airfoil reduced frequency is inserted. The lift amplitude of the single airfoil follows a decreasing trend from an airfoil reduced frequency of 0.02. This decrease is in accordance with simulations presented by Leishman (2000) and can be explained by the circulatory unsteady airfoil effect.
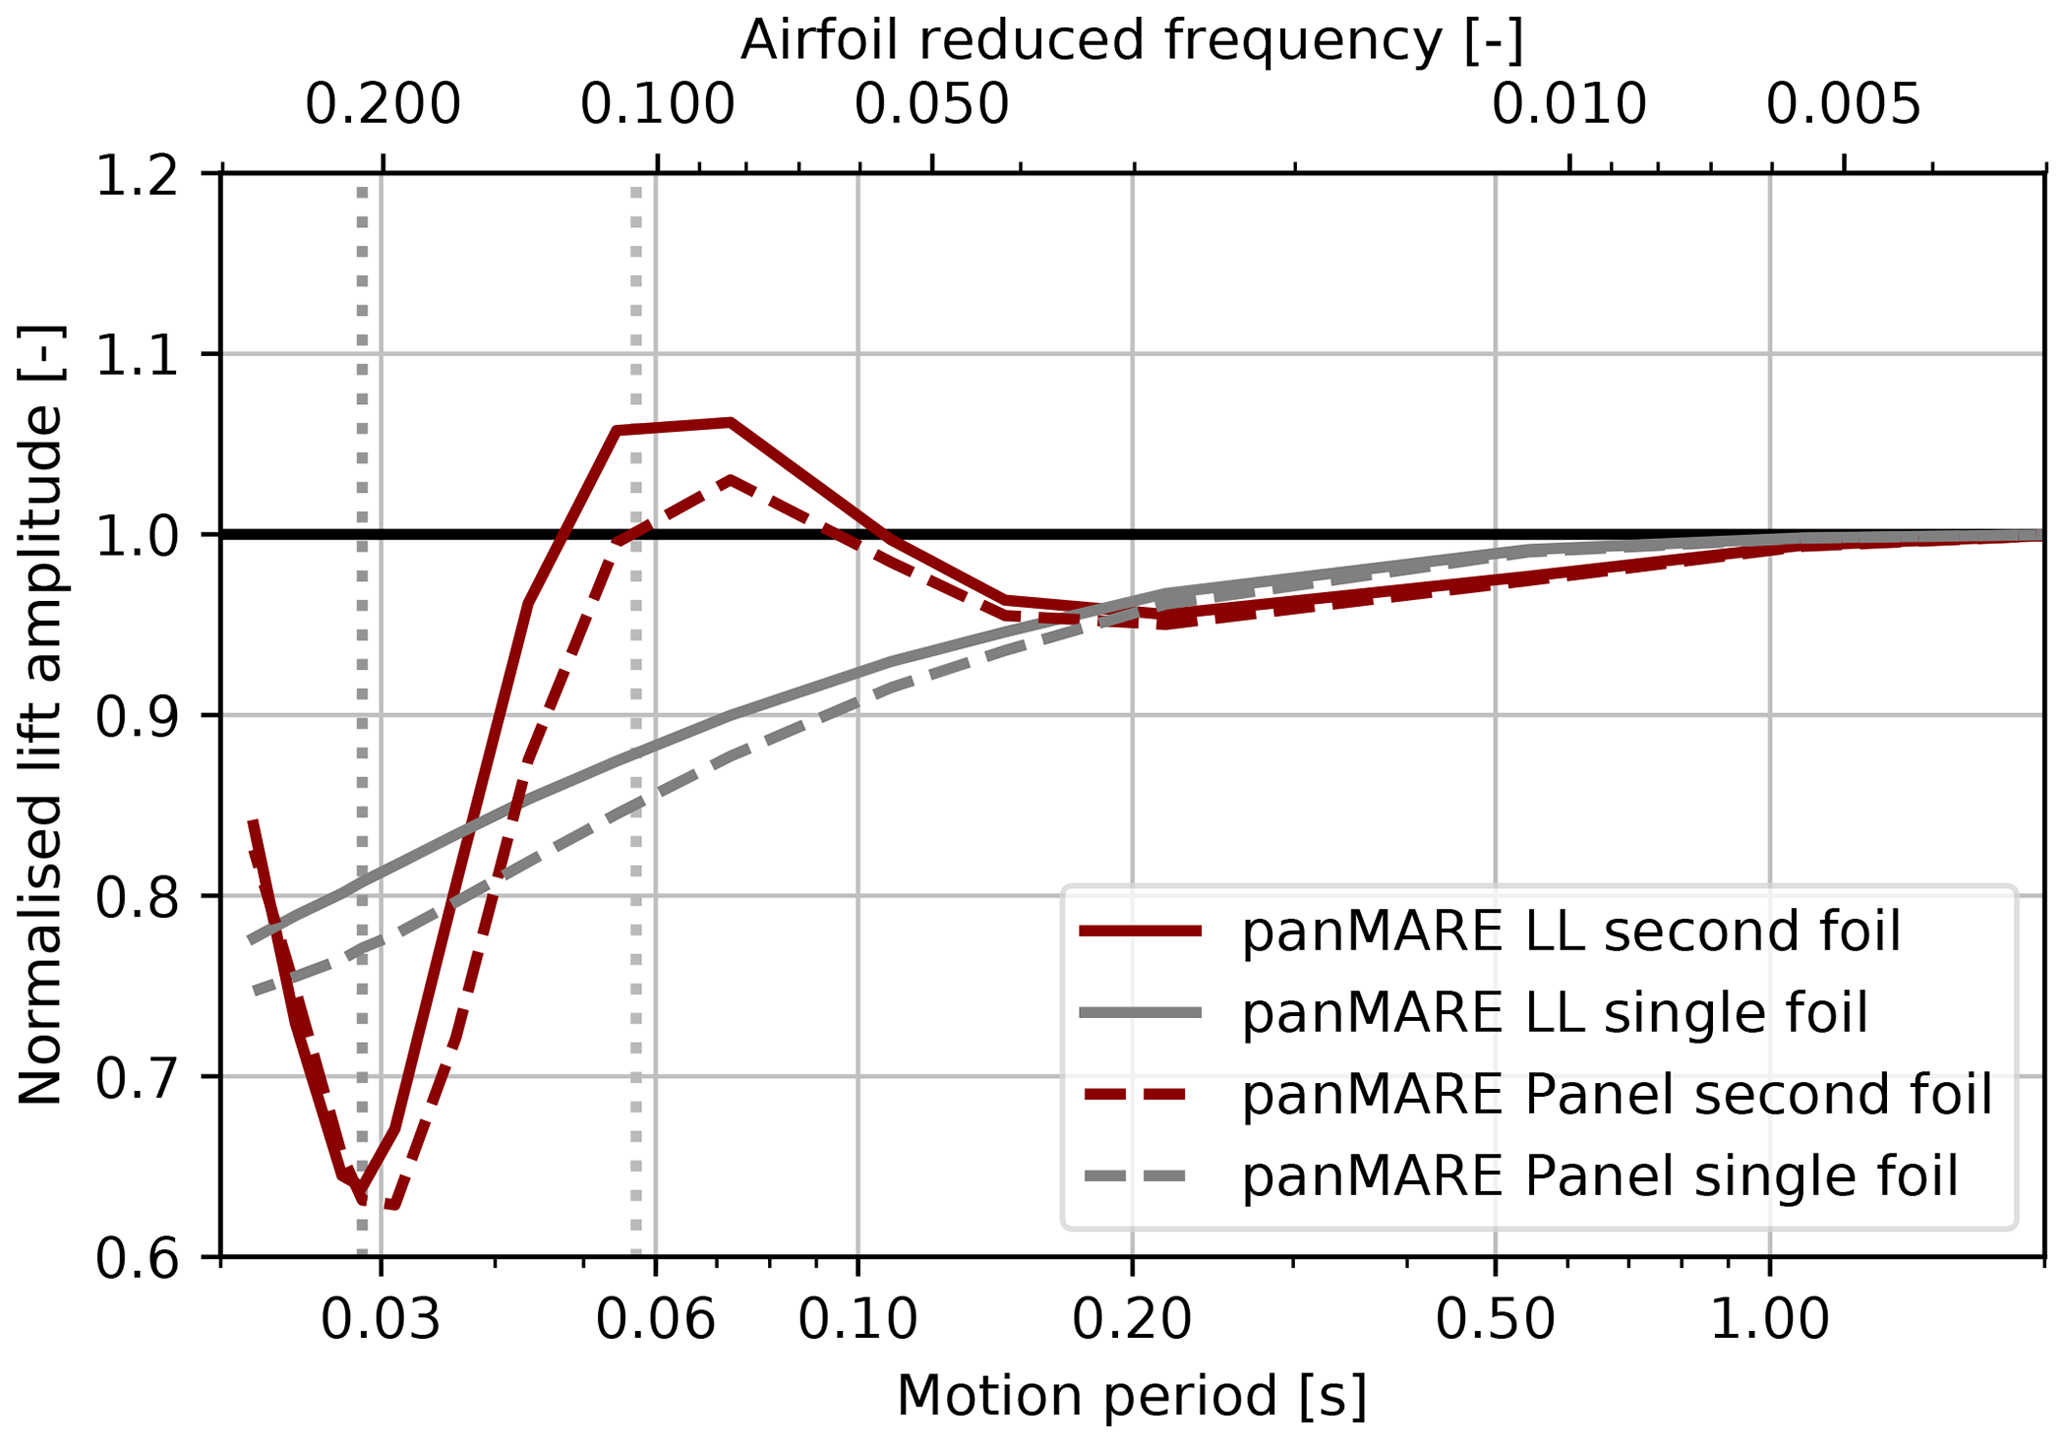
Figure 14Lift amplitudes of an airfoil undergoing a plunging motion. The amplitude and frequency of the motions are chosen corresponding to the flow situation at a rotor radius of 62 % of the model rotor undergoing the surge motions presented in Table 3. Results are shown for the a setup with one and two airfoils. In the case of two airfoils, the lift amplitude of the second airfoil is plotted. Lift amplitudes are normalised to the case with the highest motion period.
The slight differences between the panel method and the lifting-line simulations may be caused by the insufficient representation of the blade utilising a point vortex in the lifting-line method. When two airfoils are considered, the characteristic of the lift amplitude is similar to the torque amplitude of the rotor. The maximum is reached when the motion frequency equals half the blade frequency, and a drop of around 30 % is present when the motion frequency equals the blade frequency. As the setup shown in Fig. 13 corresponds to the schematic illustration in Fig. 1, the occurrence of the maximum and minimum can be explained in the same way as done in Sect. 2.
Finally, the characteristic of the rotor torque amplitude can be approximately reconstructed at a representative two-dimensional blade section. The occurrence of the minimum at the blade frequency can be clearly attributed to the returning wake effect. This observation provides a strong indication that the driving aerodynamic phenomena are the unsteady airfoil and the returning wake effect. The less pronounced maximum may be explained by fact the torque is a the summation of the sectional load responses, which may not have the exact same characteristic at different blade spans. Another reason might be the limitation of the two-dimensional simulations to two airfoils.
It is unclear at this point whether or in which frequency range the dynamic wake effect comes into play. Regarding the two different motion-to-inflow velocity ratios tested, it seems that the chosen bvel has negligible influence on the unsteady aerodynamic behaviour of the rotor torque because nearly no difference between the corresponding curves is present. This is in line with the conclusions drawn from similar simulations of the Floatgen wind turbine using a panel method and a BEMT method (Schulz et al., 2023).
6.3 Phase shift of the rotor torque
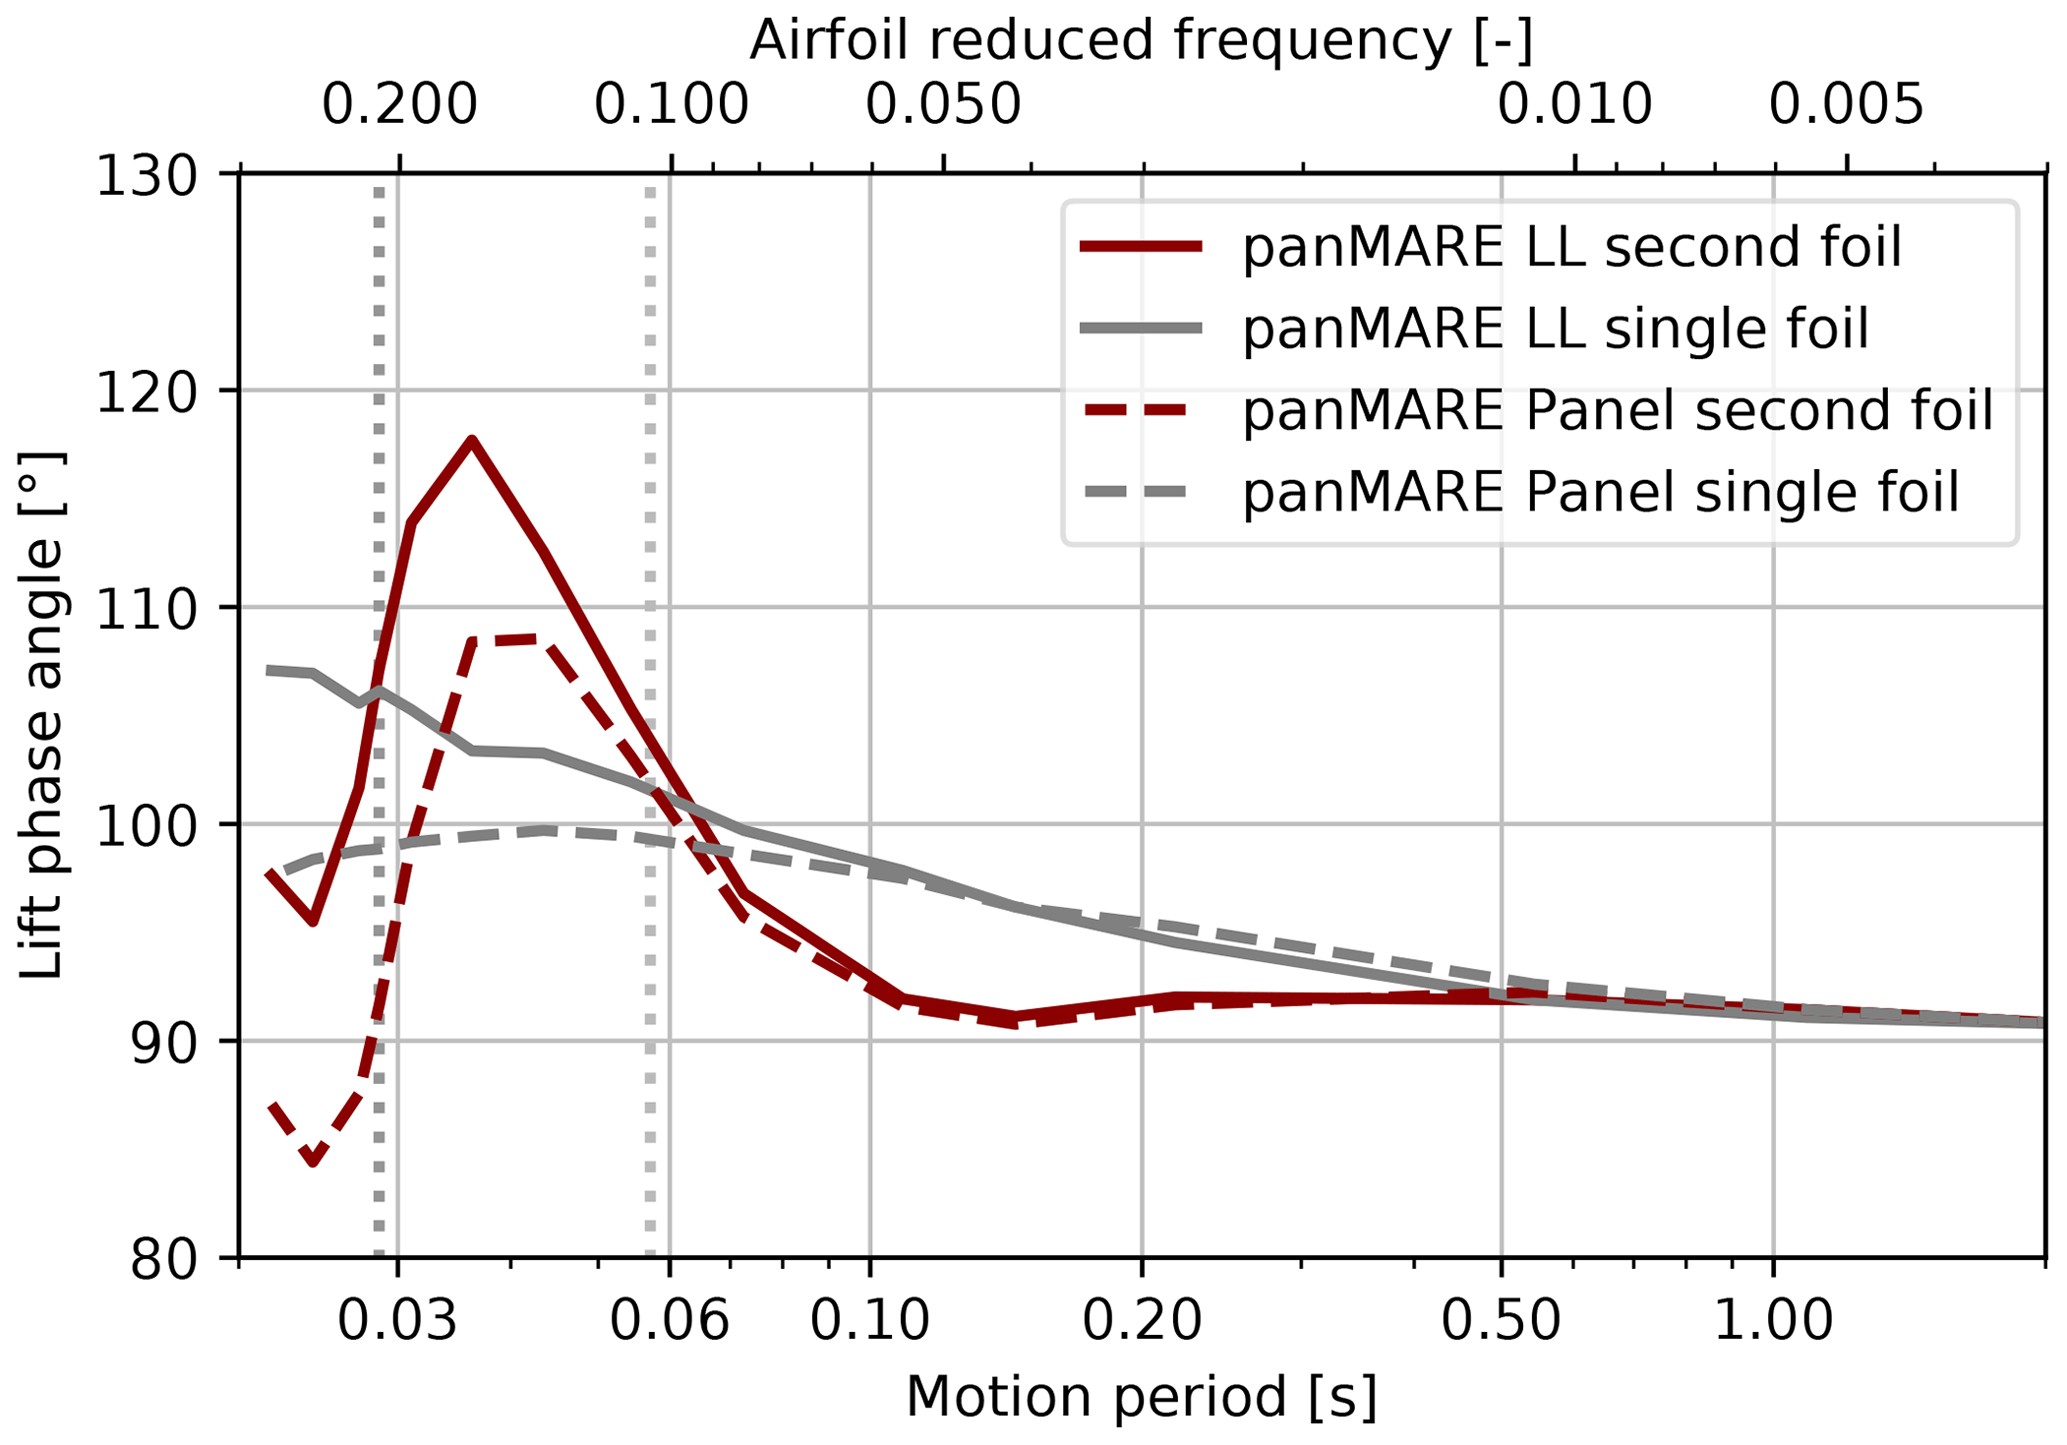
In Fig. 15, the phase shift between the torque oscillation and the surge position is shown. In the case of the rotor torque, an initial phase shift of 90° is present at the lowest rotor reduced frequency, which means that the torque oscillation is in phase with the motion velocity. The phase shift stays constant up to a rotor reduced frequency of 1 and then increases until a maximum is reached slightly below 4. With further rising reduced frequency, the phase shift drops approximately 20°. Lifting-line and panel method simulations agree well up to a reduced frequency of 3. At higher reduced frequencies, a difference of around 10° evolves. The characteristic behaviour is in line with the phase shift of the lift force in the two-dimensional case (see Fig. 16), when the second airfoil is considered. Therefore, the characteristic of the phase can also be attributed to a superposition of the unsteady airfoil and the returning wake effect. Interestingly, the difference between the lifting-line and the panel method simulations is also present in the simulations, where only one airfoil is considered. In this case, the unsteady airfoil effect determines the unsteady behaviour. The difference at higher airfoil reduced frequencies can most likely be attributed to the non-circulatory unsteady airfoil effect, which cannot be modelled by the lifting-line method.
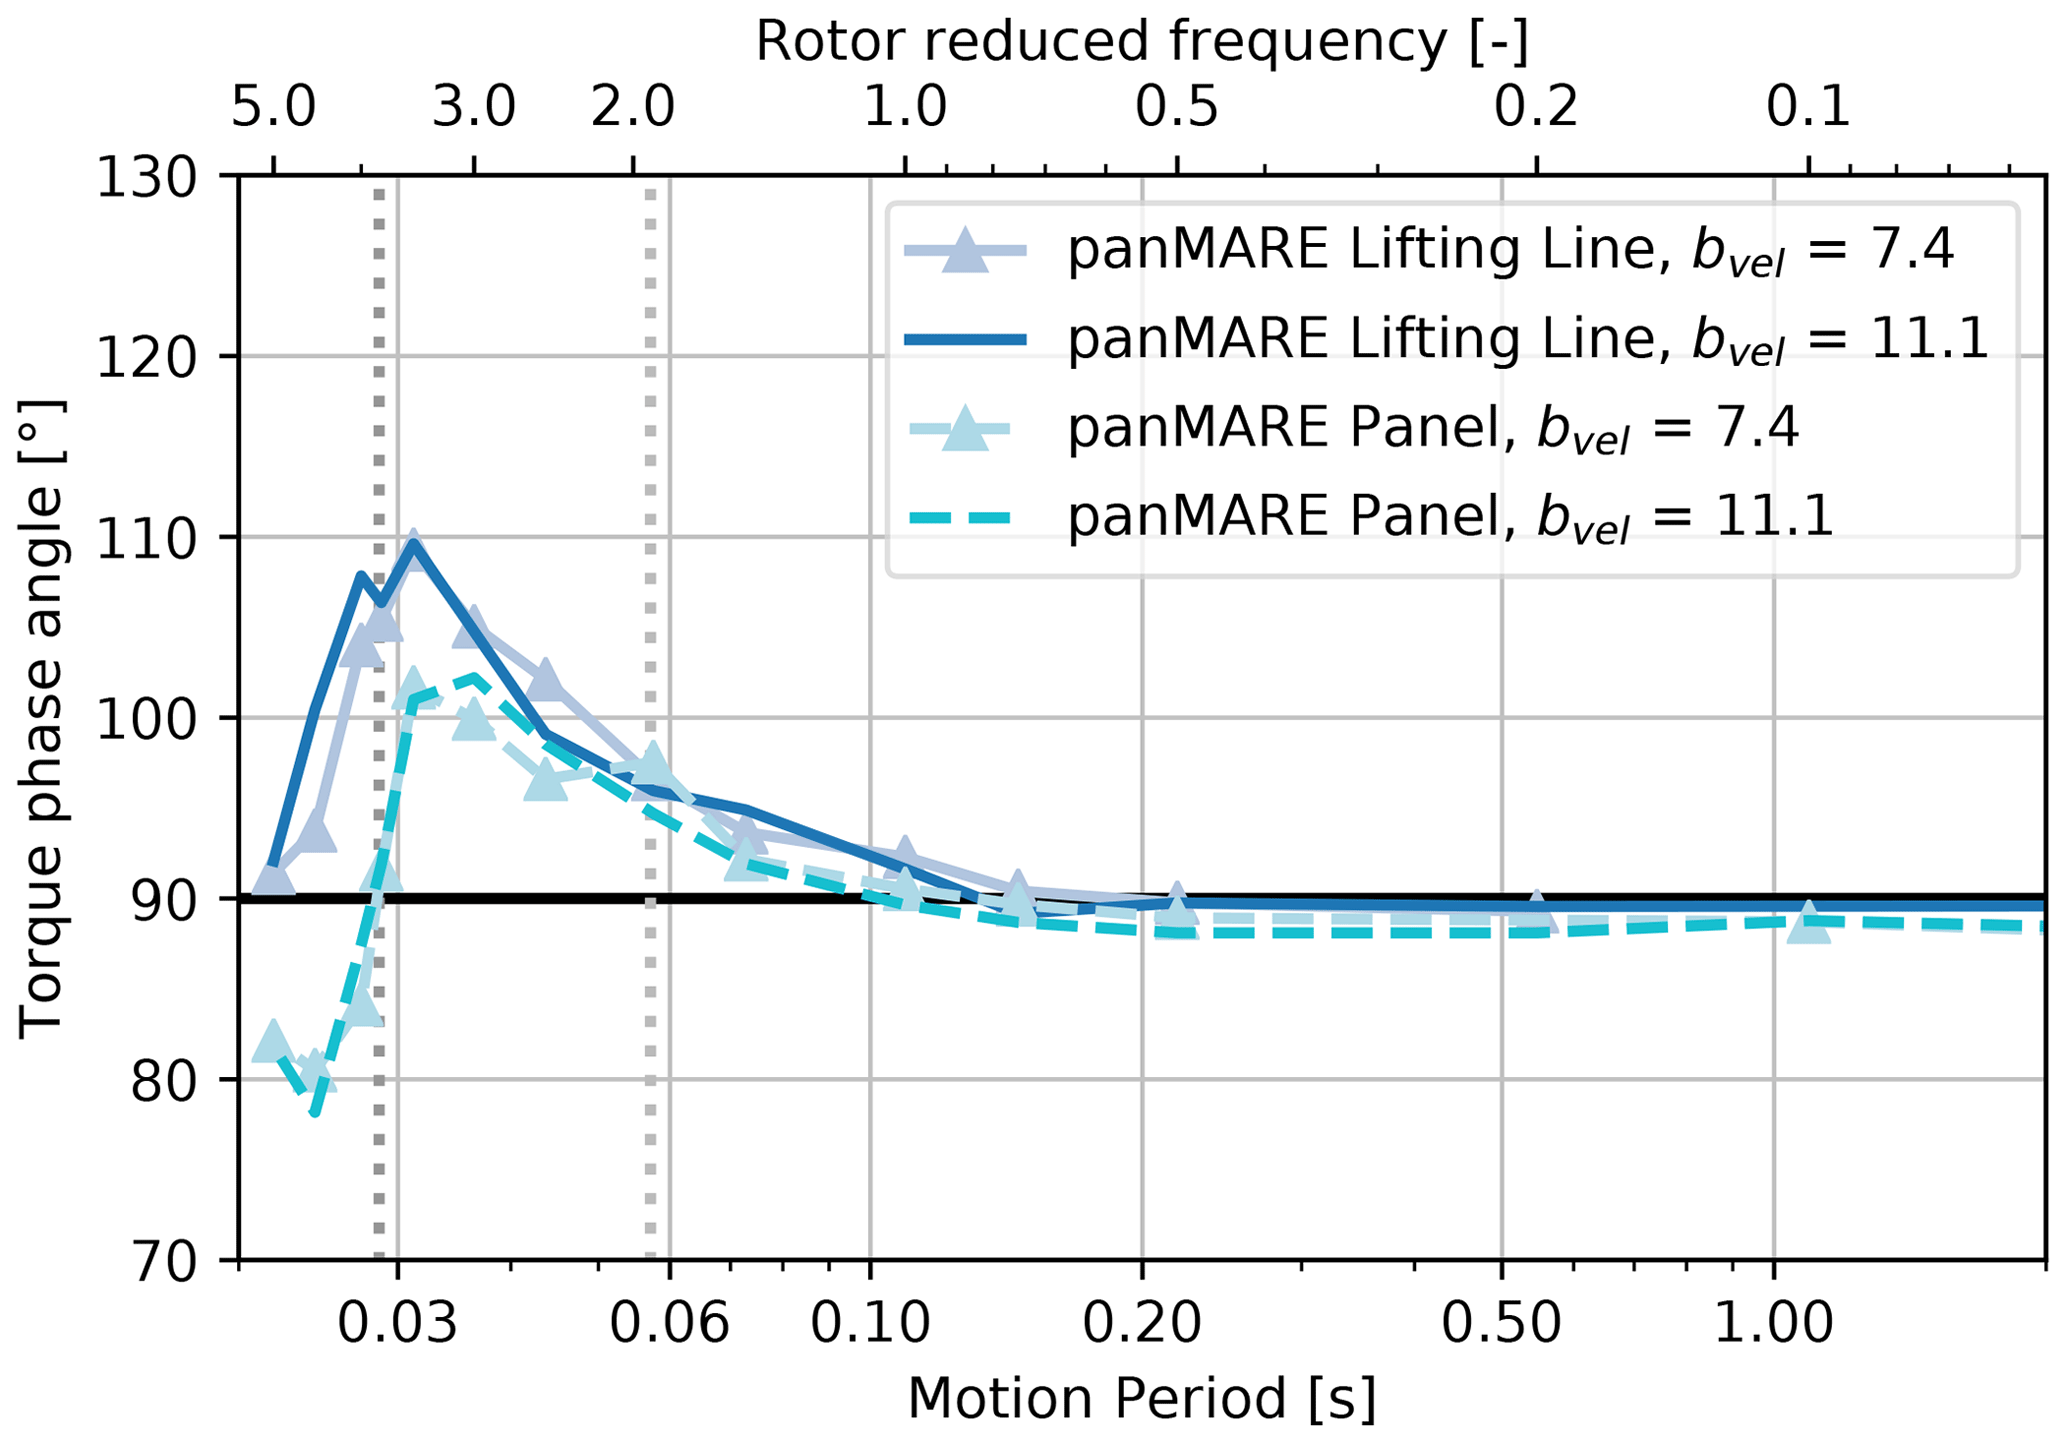
Figure 15Phase shift between rotor torque and surge position corresponding to amplitudes of the model rotor shown in Fig. 12.
The panMARE lifting-line model, which was set up in the OC6 project, is utilised to run a load case set with extended motion frequency range in comparison to previous studies. As the similarity between results of the lifting-line and the panel method has already been shown for the TUHH rotor, only the existing model was used. In order to allow for a more direct comparison with other studies, the following analysis is based on the thrust force. As discussed above, the behaviour of torque and thrust amplitudes is very similar. The results for torque can be found in Appendix F.
In Fig. 17, the normalised thrust amplitude of the UNAFLOW rotor as a response to a series of surge motions with a constant motion-to-inflow ratio and varying rotor reduced frequency is shown. The motion-to-inflow velocity was chosen to be bvel=5.28 %, which corresponds to a load case from the measurement campaign. The load cases are listed in Table 3. As in the previous figures, the amplitudes are normalised to the case with the lowest rotor reduced frequency, i.e. highest motion period. It is shown that the amplitude stays approximately constant in the range of low rotor reduced frequencies. From a rotor reduced frequency of 0.5, the curve rises again slightly and reaches a flat maximum at half the blade-passing frequency followed by a rapid decrease with a minimum at the blade-passing frequency. Apart from the slight decrease at low motion frequencies, a very similar behaviour to that seen for the TUHH rotor can be identified. The same is true in the case of the phase shift of the thrust oscillation shown in Fig. 18. However, the maximum phase shift is about 10° higher in comparison to the TUHH rotor. As the lifting-line method showed an overprediction of the maximum phase angle in the case of the TUHH rotor, it is likely that the same is true for the UNAFLOW rotor. Due to the characteristic behaviour of the thrust amplitude, it can be concluded that the returning wake effect also has a significant influence on the UNAFLOW rotor in surge motion.
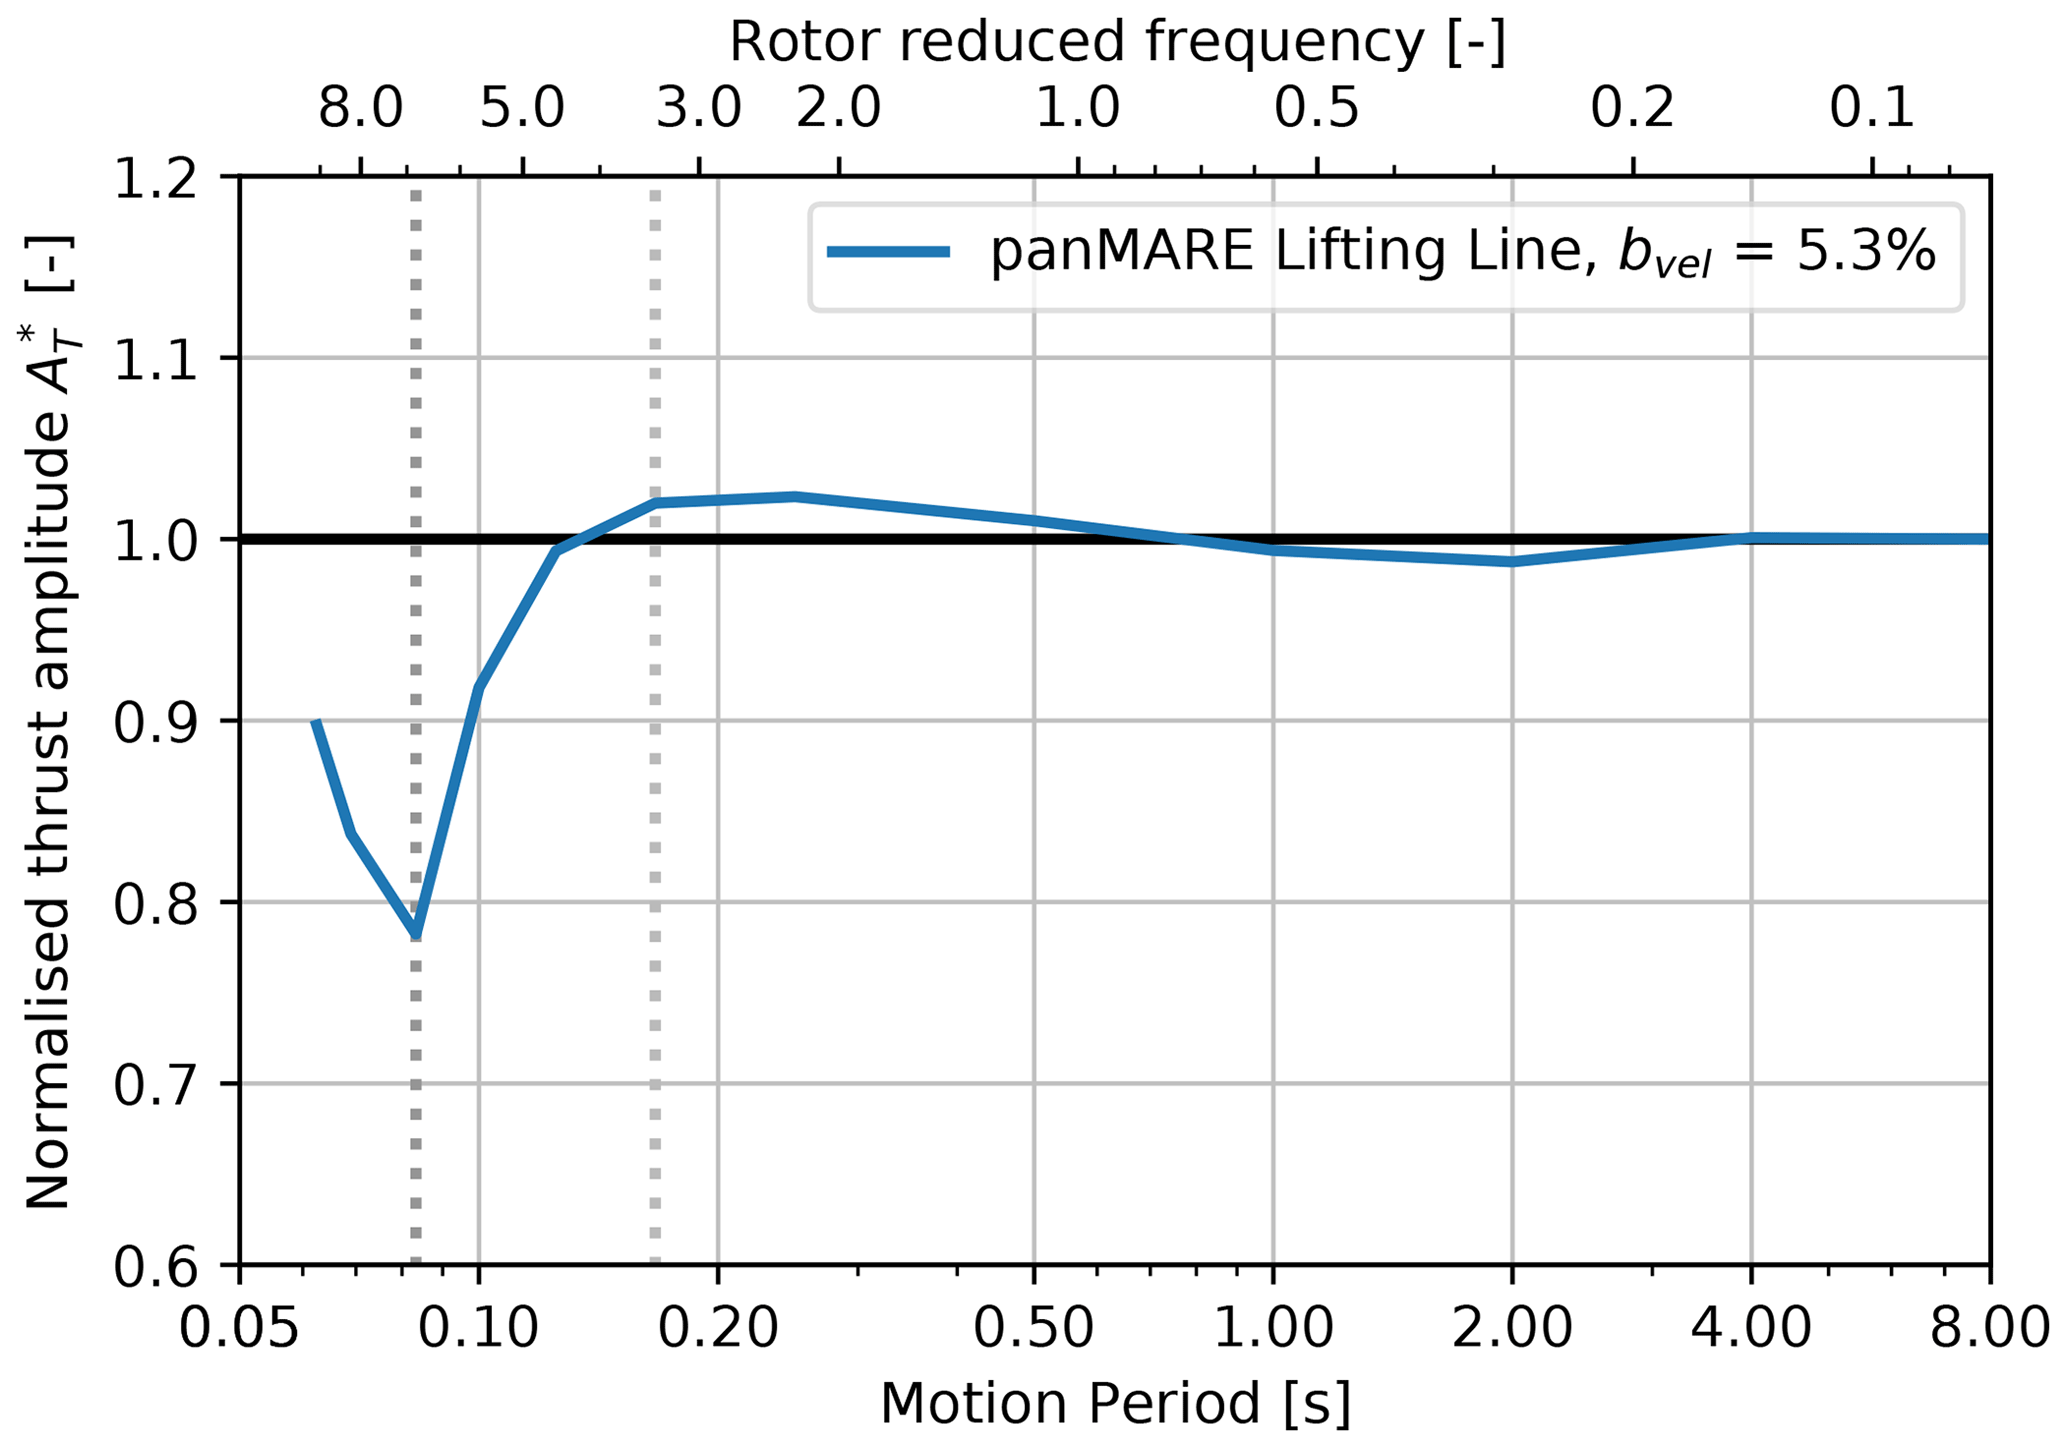
Figure 17Rotor thrust amplitudes of the UNAFLOW rotor from simulations as a response to surge motions plotted over motion period and rotor reduced frequency. Thrust amplitudes are normalised to the case with the highest motion period (compare Eq. 15).
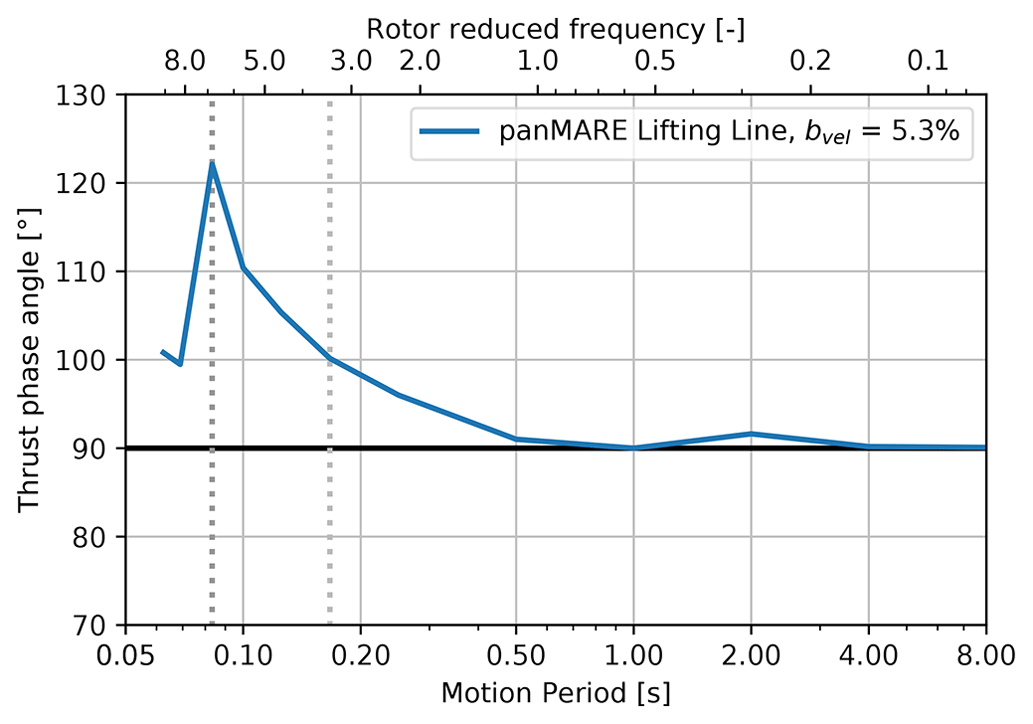
Figure 18Phase shift between rotor thrust and surge position corresponding to amplitudes of the UNAFLOW rotor shown in Fig. 17.
A hint of such behaviour can also be found in Ribeiro et al. (2023). Panel method simulations showed a lower-than-expected thrust amplitude at a rotor reduced frequency slightly below 5. This is in line with the decrease in the amplitude in the range of the rotor reduced frequencies between 3 and 7 shown in the present simulations. Ribeiro et al. (2023) assumed that this drop is caused by a varying phase shift of the lift force variation over the blade span (see Sect. 3). However, from the two-dimensional investigations shown in the previous section and the characteristic occurrence of minimum and maximum it seems more likely that the returning wake effect induces this behaviour.
In the measurements performed during the UNAFLOW project, no such behaviour of the thrust amplitude was observed. This is in line with the present simulation results as the measurements in Mancini et al. (2020) were limited to a maximum reduced frequency of 1.19. In this region, only limited influence of unsteady effects can be seen in Fig. 17. Also other previous simulation studies including OC6 Phase III (Bergua et al., 2023) were limited to a similar motion frequency range, so – apart from a slight phase shift – no unsteady behaviour could be noticed.
In contrast to this, unexpected thrust and torque amplitudes were observed during the COREWIND measurement campaign (Fontanella et al., 2022). At a rotor reduced frequency of approximately 2.5, these were approximately 30 % higher than expected from a quasi-steady model. As the rotor, operational conditions, wind speed and load case set are quite similar to the UNAFLOW campaign, it can be assumed that at least a similar characteristic behaviour of both rotors should be present. However, the present simulations seem to contradict the measurements. The reason for this is not quite clear, and further simulations on this specific rotor as well as continued experimental efforts may shed light on this interesting observation.
A set of load cases with a constant motion-to-inflow velocity ratio and varying surge motion frequency is applied to the IEA 15 MW rotor9 (see Table 3). The thrust force amplitudes calculated by the panel method and the BEMT method over a wide range of motion periods are shown in Fig. 19. The characteristic change in the thrust force amplitude is similar to those of the model rotors. However, no distinct maximum can be identified at the surge motion frequency, which equals half the blade-passing frequency. In order to investigate this difference, two-dimensional flow simulations around the blade sections of the IEA 15 MW rotor at an exemplary relative radius of 0.64 were performed. The setup was chosen in the same way as in Sect. 6. In Fig. 20, the lift amplitude of the second airfoil as a response to the surge motion is shown. A characteristic similar to the one in the previous two-dimensional simulations can be identified. However, the minimum and maximum are less pronounced in this case. Similarly, the decrease in the lift amplitude in the case of a single airfoil is less strong. This can be explained by the lower range of the airfoil reduced frequency (see upper x axis) in comparison to Fig. 14. For example, at the blade-passing frequency, the airfoil reduced frequency is 0.07 for the IEA 15 MW airfoil, while it is 0.2 for the TUHH rotor airfoil.10 The unsteady airfoil effect is therefore much stronger in the case of the TUHH rotor at the same ratio of motion and blade-passing frequency. As the returning wake effect is driven by the same vortices shed from the trailing edge of the upward blade, it is straightforward to account for the fact that it is also less pronounced in this case. The influence of the returning wake effect may be considered a perturbation of the unsteady airfoil effect on the lift amplitude of an oscillating airfoil.
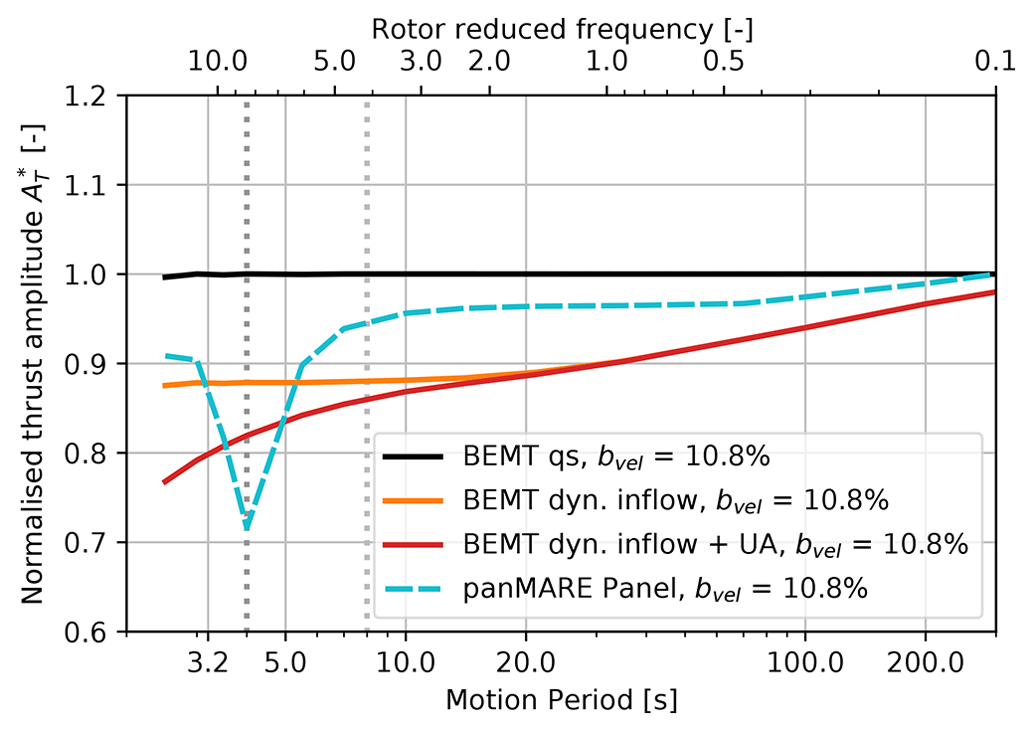
Figure 19Calculated rotor thrust amplitudes of the IEA 15 MW rotor as a response to surge motions plotted over motion period and rotor reduced frequency. Thrust amplitudes are normalised to the case with the highest motion period (compare Eq. 15) in the case of the panel method and to the quasi-steady simulation in the case of BEMT.
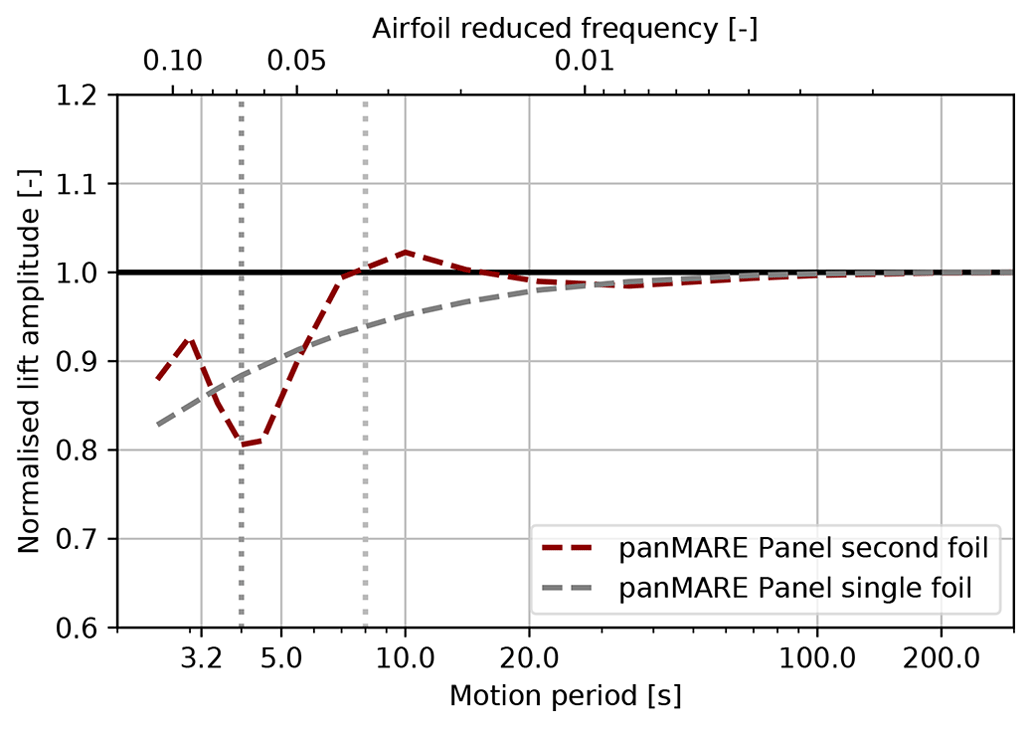
Figure 20Lift amplitudes of an airfoil undergoing a plunging motion. The amplitude and frequency of the motions are chosen corresponding to the flow situation at a rotor radius of 64 % of the IEA 15 MW rotor undergoing the surge motions presented in Table 3. Results are shown for the a setup with one and two airfoils. In the case of two airfoils, the lift amplitude of the second airfoil is plotted. Lift amplitudes are normalised to the case with the highest motion period.
It has to be noted that the two-dimensional simulations only represent the flow at one specific rotor radius. Therefore, the lower height of the maximum peak in these simulations may be understood as an indication that the returning wake effect is less pronounced in the case of the IEA 15 MW rotor, which most likely leads to the absence of a maximum in the rotor thrust amplitude. In addition, the two-dimensional simulations indicate that an unsteady airfoil and returning wake effect already act on the sectional blade loads between 10 and 20 s although the trend of the rotor thrust amplitude is nearly constant in this region. Therefore, a simulation method that only covers the unsteady airfoil effect, might predict erroneous amplitudes in this region.
The results of the BEMT simulations are illustrated by three different lines in Fig. 19. A normalisation of the thrust force amplitudes to the quasi-steady results is applied. BEMT without unsteady corrections (BEMT qs) shows a constant trend, which is due to its quasi-steady nature. With the application of the dynamic inflow correction (BEMT dyn. inflow), the normalised amplitude shows a continuously decreasing trend with decreasing motion period. This decrease changes to a constant trend for motion periods less than 20 s. The unsteady airfoil correction causes an additional decrease in the thrust amplitude at motion periods below 15 s. While the effect of the unsteady airfoil correction is similar to the trend of the single airfoil in Fig. 20, the returning wake effect is naturally not captured by the unsteady corrections. Furthermore, it is remarkable that the dynamic inflow correction causes such a strong decrease in the thrust amplitude because this could not be observed in the case of the other turbines. Initially, the panel method simulations show a similar trend, which starts to diverge from the BEMT results at a motion period of 70 s. It is therefore likely that the dynamic wake effect causes the slight initial decrease in the torque amplitude at high motion periods in the panel method simulations. In addition, it is possible that the convergence to a quasi-steady amplitude is not perfectly reached in the panel method simulations, as there is still a slope of the curve visible between the two cases with the highest motion period. This is a possible explanation for the initial offset between the methods. However, at motion periods between 10 and 70 s, the trend of both methods is notably different. On the one hand, this could be caused by an overprediction of the dynamic inflow effect in the BEMT simulations. On the other hand, the influence of the returning wake and unsteady airfoil effect at the inner blade parts is stronger compared to the results in Fig. 20 due to the lower airfoil reduced frequency in this region. Therefore, it is also possible that the returning wake and/or unsteady airfoil effect counteracts the influence of the dynamic inflow effect in this intermediate region of motion periods.
In Figs. 21 and 22, the phase shift of the rotor thrust oscillation and the lift force in 2D in comparison to the surge position are shown. Again, a similar characteristic can be identified. Considering the BEMT simulations, it can be observed that the unsteady airfoil correction seems to capture the general trend of the phase shift at intermediate motion periods well, while the returning wake effect is naturally not captured.
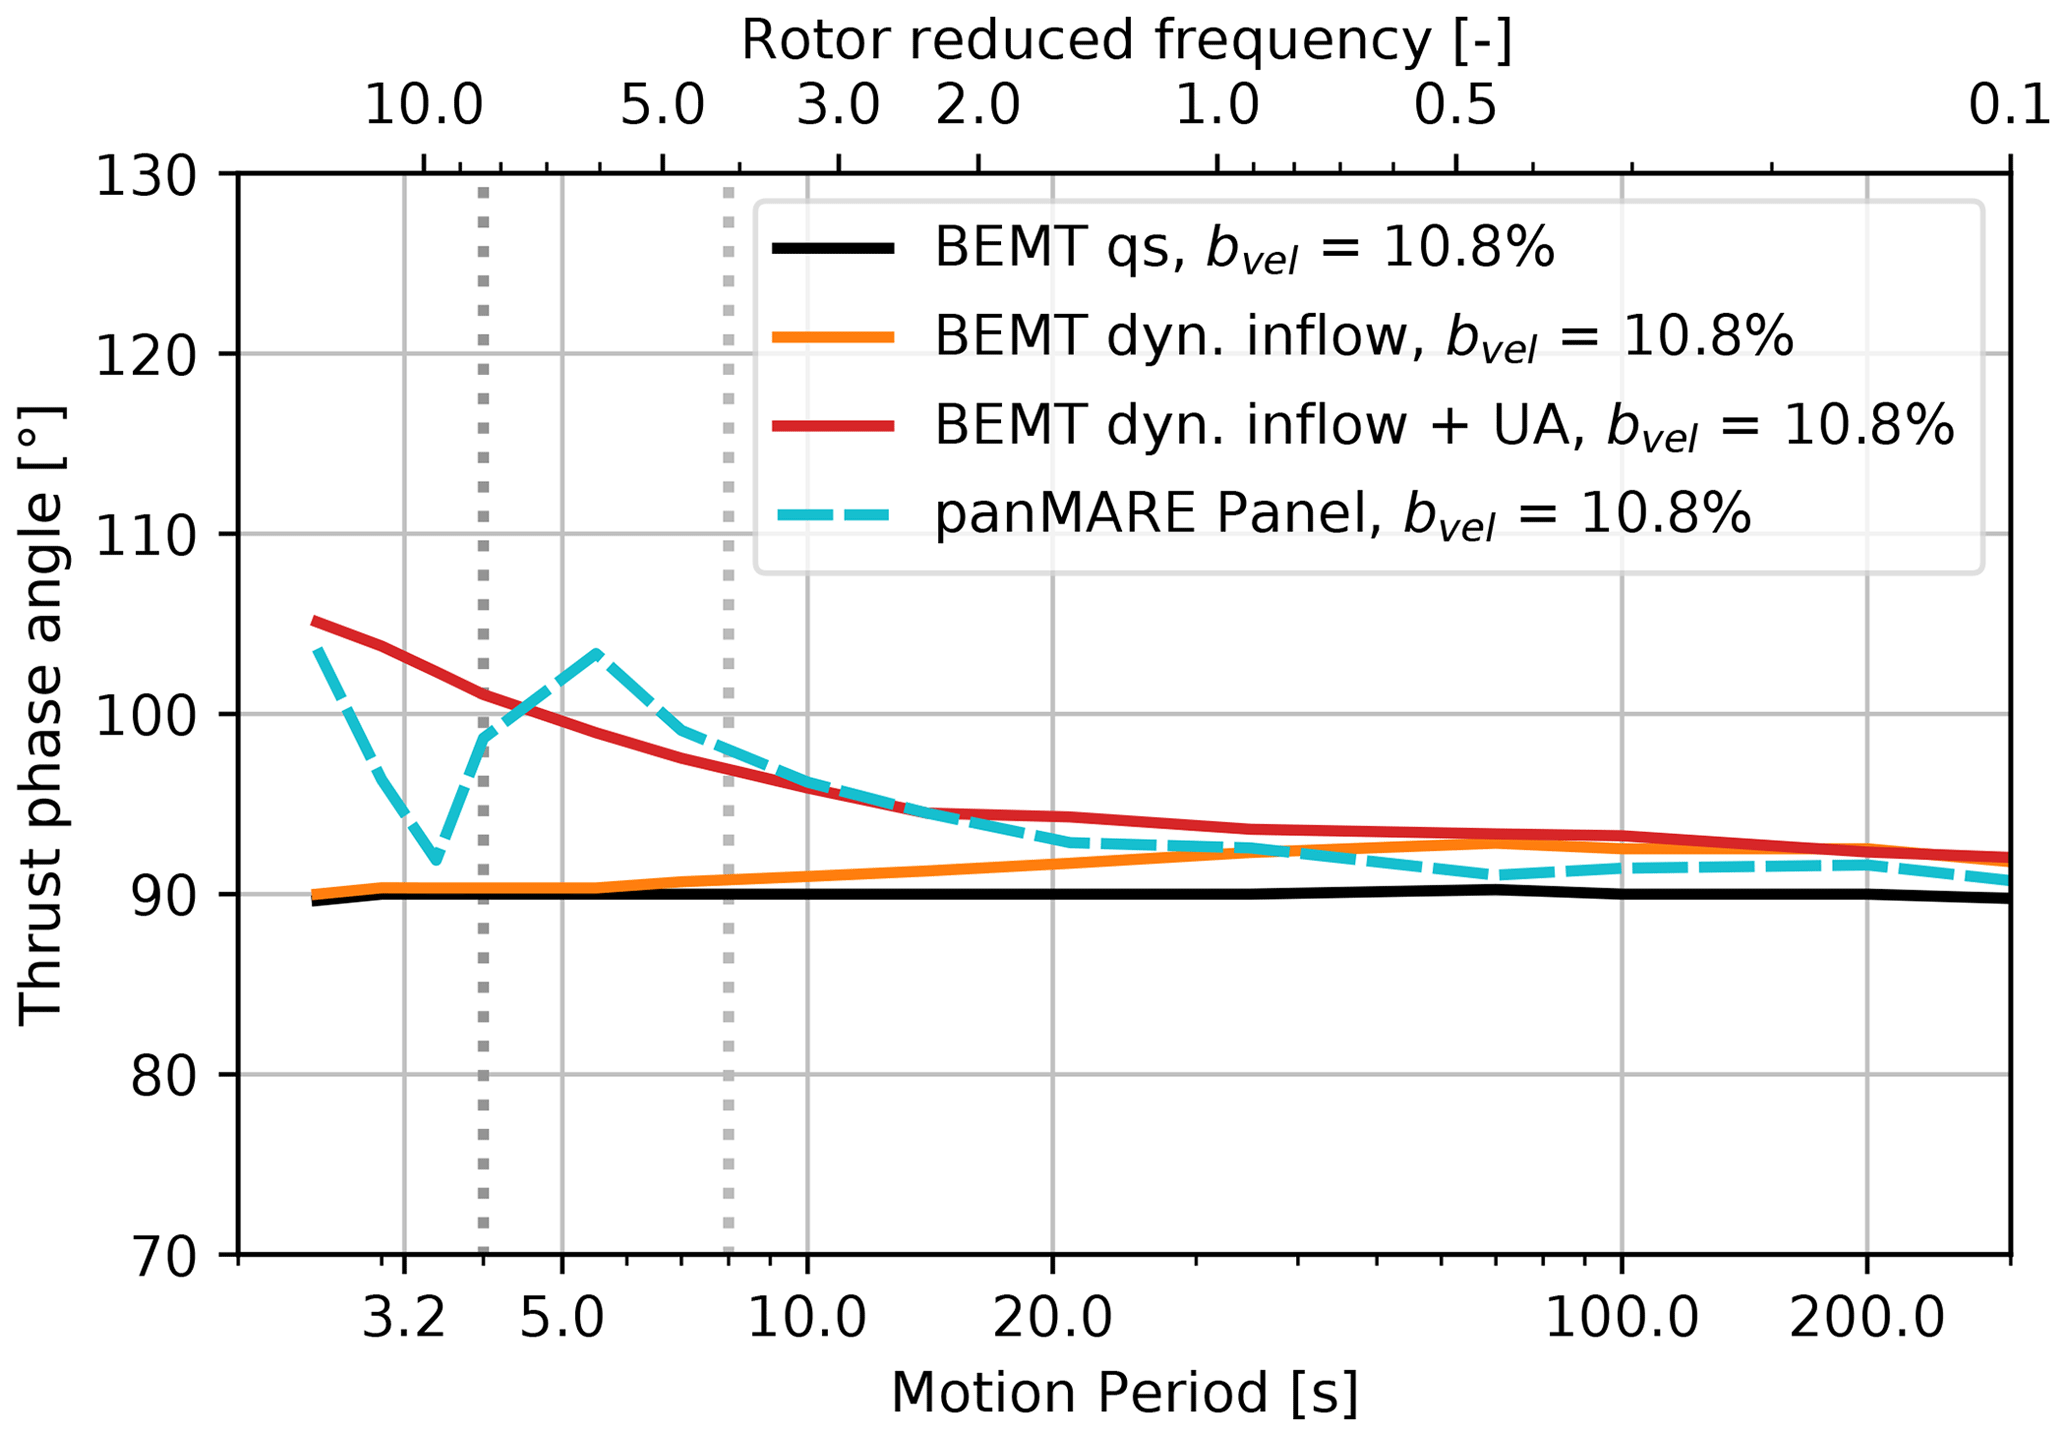
Figure 21Phase shift between the rotor thrust and surge position corresponding to amplitudes of the IEA 15 MW rotor shown in Fig. 19.
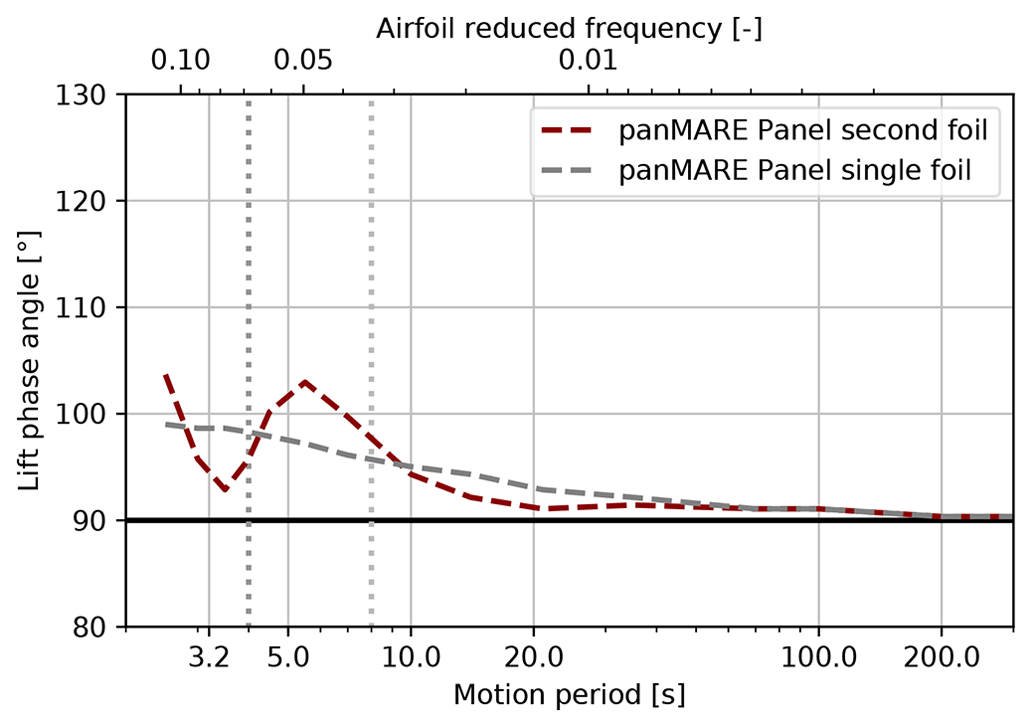
9.1 Characterisation
The unsteady airfoil effect and the returning wake effect could be identified as major drivers for unsteady contributions to the load response of surging wind turbine rotors. In particular, the circulatory part of the unsteady airfoil effect was dominant over the non-circulatory part. A possible, but small, contribution of the dynamic inflow effect could only be found in the case of the IEA 15 MW rotor. However, no further analysis was performed to prove the presence of the dynamic wake effect in the free-vortex-wake simulations.
The occurrence and strength of these unsteady aerodynamic phenomena can be estimated by the dimensionless numbers described in Sect. 2. In the case of the airfoil reduced frequency, it is difficult to find a representative value for the rotor as it varies over the blade span due to its dependency on the chord length. Unsteady contributions to the load response were identified at an airfoil reduced frequency of 0.02 and higher in the investigated two-dimensional simulation cases for the TUHH and the IEA 15 MW rotors. This differs slightly from the limiting value (0.05) given by Leishman (2000). The strength of the returning wake effect is strongly influenced by the airfoil reduced frequency and the ratio of surge motion frequency and blade-passing frequency. In cases where the airfoil reduced frequency is sufficiently high, the returning wake effect comes into play when the motion frequency rises above half the blade-passing frequency or even at slightly lower values. However, it seems that in practice, an airfoil reduced frequency of above 0.02 is a prerequisite for the occurrence of the returning wake effect. The strength of the returning wake effect is also affected by the distance between the blade sections and the wake sheet from the upward airfoil, i.e. from the pitch of the helical wake.
Finally, an experimental wind turbine rotor would need to maintain similarity with all three dimensionless numbers described in Sect. 2 in order to model the occurrence of these unsteady aerodynamic phenomena comparable to a full-scale turbine. The consideration of the rotor reduced frequency only is therefore not sufficient. This can be easily recognised by comparing the load response amplitudes of the three rotors (Figs. 12, 17 and 19). The minima in these cases clearly do not occur at the same rotor reduced frequencies.
9.2 Occurrence in full scale
In practice, the investigated pure surge motion is superposed with a rotor speed oscillation in below-rated conditions. The rotor speed oscillation has shown to trigger a strong dynamic inflow effect even at low motion frequencies in a previous work (Schulz et al., 2023). However, the observed phenomena will most likely also occur when a concurrent rotor speed variation is present. The returning wake effect may occur at large turbines in low-wind-speed conditions, where half the blade-passing frequency may be in the range of the wave spectrum. As seen in the case of the IEA 15 MW rotor at 7 m s−1 wind speed, the returning wake effect impacts the sectional lift force at a motion period of 10 s. This is within the range of typical wave periods (approximately 5–20 s). However, a prediction of the quantitative impact of the returning wake effect from the dimensionless numbers is challenging, and therefore exemplary FVW simulations at low wind speeds might give a more reliable insight.
An experimental and numerical investigation on the occurrence of unsteady aerodynamic phenomena caused by a surge motion of a wind turbine rotor is presented. The investigation is limited to aerodynamic loads and basic surge motion scenarios excluding rotor speed variations or controller actions. To impose a surge motion onto the two-bladed TUHH model rotor, a novel test rig was designed. The surge motion is applied to the nacelle only, which allows for a very rigid tower design. In addition, the load sensor was placed in the shaft of the rotor to reduce undesirable inertia forces in the measurement signal. The results of FVW lifting-line and panel method simulations utilising the software panMARE were compared against those of the measurements. In a second step, the simulations were extended to a frequency range exceeding the capabilities of the test rig and certain load cases were investigated to distinguish between the quasi-steady and the unsteady part of the load response to a surge motion. In order to prove the generality of the findings, the load case set was additionally applied to the UNAFLOW and the IEA 15 MW rotors. Additional BEMT simulations of the IEA 15 MW rotor with and without unsteady corrections were conducted. Finally, a characterisation of the observed unsteady aerodynamic phenomena is given and the applicability of three dimensionless numbers to identify their occurrence is discussed.
The most relevant findings from the numerical and experimental investigations can be summarised as follows:
-
Despite the comparatively rigid tower design and two different approaches to remove inertial loads from the axial force measurements, a sufficient accuracy of the compensated rotor thrust force could not be achieved. This was most likely caused by forced vibrations of the tower top.
-
Slight oscillations of the rotor speed were found to have a major influence on the measured rotor torque. Therefore, an inertia removal procedure was developed and applied. The compensated measurements proved to have a low repetition error and very good agreement with the FVW simulations. This is the case for steady and unsteady scenarios.
-
The measured torque oscillation amplitudes during surge motions were found to be determined by the motion-to-inflow velocity ratio bvel, and no hint of unsteady behaviour was found in the motion frequency range covered by the experiments (fr between 0.55 and 1.09, bvel up to 9 %). However, corresponding FVW simulations showed slight unsteady contributions, which could not be directly examined in the experimental data due to the absence of a quasi-steady reference for the experiment.
-
The extension of the motion frequency range in the FVW simulations up to a reduced frequency of 5 revealed a significant influence of the returning wake effect on both the amplitude and the phase of the torque and thrust force. Therefore, unsteady aerodynamic phenomena are clearly present in the simulations.
-
The occurrence of the returning wake effect could also be proved in the case of the UNAFLOW and the IEA 15 MW rotors. In the case of the IEA 15 MW rotor, unsteady contributions to the torque and thrust response were found within the frequency range of common seaways at reduced frequencies of between 3 and 7. The returning wake effect had a clear influence on the airfoil loads at motion frequencies in the range of half the blade-passing frequency and higher. A prerequisite for its occurrence seemed to be an airfoil reduced frequency above 0.02.
-
The unsteady aerodynamic behaviour was determined by the circulatory unsteady airfoil effect and the returning wake effect in the investigated cases. A hint of a contribution of the dynamic inflow effect was found in the case of the IEA 15 MW rotor but was not investigated in detail. A proper scaling of these three unsteady effects would need to maintain similarity between the three corresponding dimensionless numbers described in Sect. 2. Utilising the rotor reduced frequency only for this purpose was found to be not sufficient.
-
BEMT simulations with and without common unsteady corrections were naturally unable to capture the returning wake effect. Instead, an impact of the dynamic inflow effect was present at comparatively low motion frequencies, i.e. rotor reduced frequencies for the IEA 15 MW rotor. The onset of this effect could also be seen in the free-vortex-wake simulations, but the results diverge clearly at motion frequencies below 70 s (i.e. fr>0.5).
It has to be noted that the above-mentioned findings regarding the unsteady aerodynamic phenomena are based on two FVW methods that utilise the same software routines in major parts. In addition, attached flow conditions were assumed in all cases. In the case of the IEA 15 MW rotor, this might have affected the results slightly. Therefore, all findings need to be evaluated using other FVW methods, higher-fidelity simulations and experiments. Special attention should be paid to a comparison of high-fidelity simulations and/or experiments with the COREWIND measurements, where a contradictory trend in comparison to the present simulations was found.
In practice, the returning wake effect is most likely present in the case of large rotors and low inflow wind speeds. Most state-of-the-art BEMT methods are not capable of modelling the returning wake effect. Therefore, FVW simulations are strongly recommended to check whether its influence is significant and the application of such methods is valid in these cases.
In Sect. 2, the amplitude of the rotor power oscillation caused by a harmonic surge motion at constant wind speed and constant rotational speed is stated (see Eq. 4). As a basis, the well-known empirical formulation for the steady power of a wind turbine is adopted to a sinusoidal variation in the inflow speed in Eq. (2), where potential unsteady effects are summarised in the extra term Punsteady(t). When introducing the dimensionless number bvel, Eq. (2) can be rewritten as
Furthermore, the quasi-steady amplitude of the rotor power can be computed by the difference between the minimum and the maximum power during a surge motion cycle, which occur at minimum and maximum motion velocity.
As the steady power coefficient is determined by the actual inflow velocity and the rotational speed, its values at the highest and lowest motion velocities can be determined simply.
λmin and λmax correspond to the minimum and maximum TSR that is reached during a surge motion cycle. When finally introducing Eqs. (A3) and (A4) into Eq. (A2), Eq. (4) results.
For small bvel values, Cp may be assumed to be constant. In this case, Eq. (4) can be simplified to
As the third power of bvel may be disregarded in this case, a linear trend of the power amplitude with bvel results in the quasi-steady case. Due to the constant rotor speed, the torque amplitude is linearly dependent on the power amplitude. Analogously, the thrust amplitude can be expressed as
However, the limitations of these simplifications need to be evaluated in the considered application case.
B1 Lift correction in panMARE
Panel methods often suffer from an overprediction of the lift force when airfoils at low Reynolds numbers are considered. In the case of the SD7062 airfoil used for the TUHH model rotor at a Reynolds number of 125 000, this overprediction can be approximated as a constant offset up to an angle of attack of 5° (see Fig. B1). The angles of attack along the blade span during the surge motion tests range from approximately 1 to 4.5° at 90 % of the blade. In this region, an offset of the angle of attack of about 0.8° is sufficient to correct the overprediction of the lift coefficient (see “panMARE panel, corrected” in Fig. B1), which is applied in the presented simulations of the TUHH model rotor.
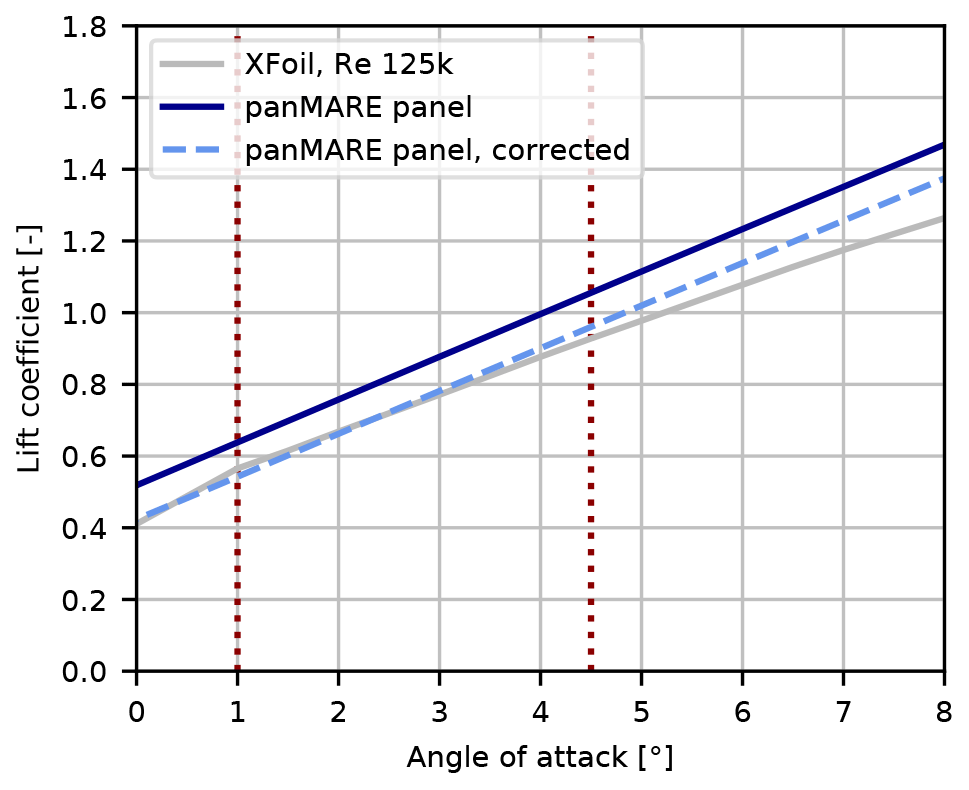
Figure B1Lift coefficient of the SD7062 airfoil computed with XFOIL and panMARE in comparison with the applied correction. Dotted red lines indicate the range of realistic angles of attack of the TUHH model rotor in the present operating conditions.
B2 Numerical setups in panMARE (panel method)
The TUHH model rotor is discretised by 2940 blade surface panels and 9600 wake panels, and the wake deformation is “frozen” after one rotor rotation. This represents a wake length of approximately four rotor diameters. The discretisation of the wake is coarsened in four steps. We start with a resolution of 1.26° azimuth angle per wake panel in the tangential direction in the direct vicinity of the trailing edge, which corresponds to a time step size of 0.0002 s. The tangential resolution of the near wake is approximately 10° per wake panel, while the discretisation of the far wake is 20° per wake panel in the tangential direction. It has to be noted that the time step size is driven by the necessity to capture the surge motion in sufficient detail here. The cylindrical and transition blade sections near the root cannot be modelled in potential theory. Therefore, the blade starts at a relative radius of , where the blade is aerodynamically shaped. As the panel method is limited to inviscid flow, low-Reynolds-number regimes as seen in experiments often cause a slight overprediction of the lift force of the utilised airfoil. In the case of the SD7062 airfoil, a simple lift correction could be applied in the panel method, which is described in Appendix B1.
For the model of the IEA 15 MW rotor, 3150 blade surface panels and 17 280 wake panels are used. A wake length of approximately four rotor diameters is covered by the wake panels. Three wake coarsening steps are applied so that a resolution of 3° per wake panel is reached near the blade. This corresponds to a time step size of 0.1 s. The resolution is 6° per wake panel in the near wake and 12° per panel in the far wake. The blade is modelled from a relative radius of .
B3 Numerical setups in panMARE (lifting-line method)
The TUHH model rotor is discretised with the same resolution as in the panel method. Instead of the blade representation, a lifting line with 20 sections in the spanwise direction is utilised. Lift and drag coefficients of the SD7062 were computed using XFOIL (Drela, 1989) for a local Reynolds number of 125 000. The two-dimensional simulations were validated against experimental data presented in Lyon et al. (1997) at slightly different Reynolds numbers and proved to be in excellent agreement.
The UNAFLOW rotor is divided into 24 spanwise sections, and a total number of 14 400 wake panels are utilised. This corresponds to a wake length of approximately three rotor diameters. A time step size of 0.002 s is applied, which corresponds to an angular resolution of 2.88° per time step. The wake resolution is approximately 6° in the near wake and 23° in the far wake. Lift and drag coefficients are chosen according to the description in Bergua et al. (2023).
B4 Numerical setups OpenFAST
In the model of the IEA 15 MW rotor, Prandtl tip and hub loss corrections as well as the unsteady airfoil and dynamic wake corrections are applied. The blade geometry and parameters for the unsteady airfoil correction published in the official GitHub repository of the IEA 15 MW turbine (https://github.com/IEAWindTask37/IEA-15-240-RWT, last access: 3 May 2023) were utilised in the simulations. It has to be noted that the coefficients A1, A2, b1 and b2 for the unsteady airfoil correction were originally derived for a NACA 0012 airfoil (Leishman and Beddoes, 1989). However, individualised coefficients for the various airfoil shapes at the blade sections have not been discovered in the literature. For the dynamic inflow correction, the time constant τ1 is chosen according to Øye (see e.g. Branlard et al., 2022b). The time step size is set to 0.1 s. A study on smaller time steps showed no notable influence of this particular choice on the results.
C1 Actuation and sensing system
The six-component force–moment sensor K6D40 supplied by ME-Meßsysteme GmbH was mounted inside the rotating shaft and in front of the generator bearings (see Fig. C1). Apart from a thin cable connection for the power supply of the measurement amplifier and sensor, no loads other than aerodynamic and inertia loads were measured by the sensor. The miniature measurement amplifier GSV-6BT (ME-Meßsysteme GmbH) was placed inside the rotating hub and was connected to the force–moment sensor, sending the acquired measurement data to the main measurement computer via a wireless Bluetooth connection. The power supply cable for the rotating hub was placed inside the hollow shaft of the rotor and connected to a slip ring on the backward end of the nacelle.
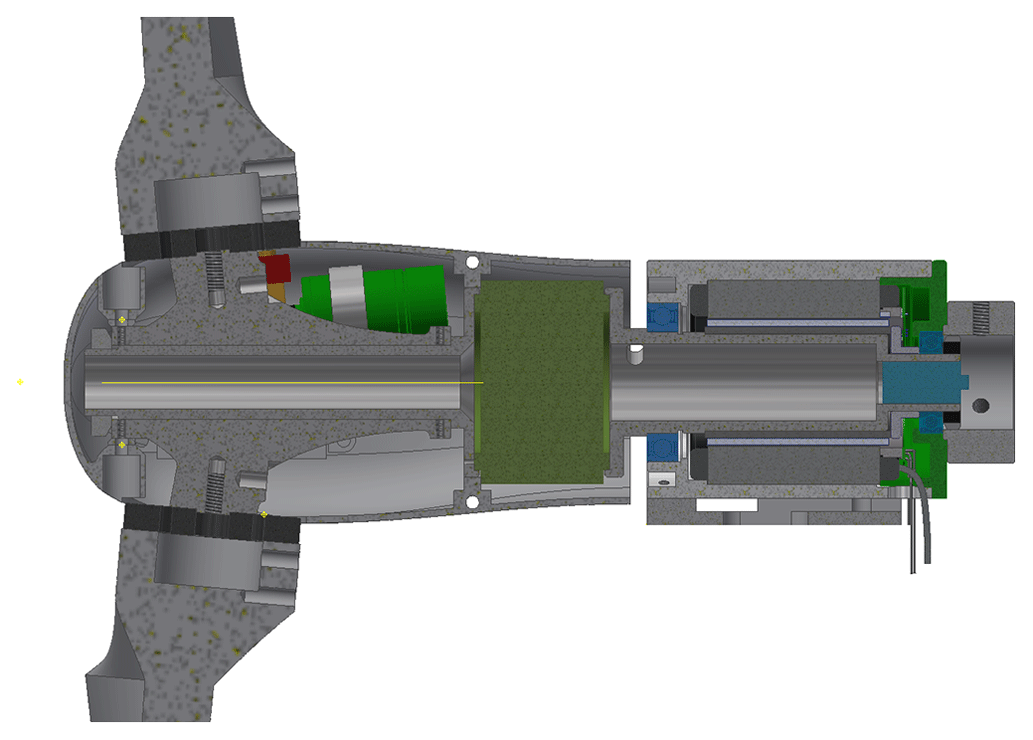
Figure C1Sectional view of the nacelle. The load sensor (dark green) is integrated in the rotating shaft. The generator is illustrated in dark grey, and the main bearings are coloured in blue. A slip ring is placed inside the shaft at its right end.
The Kollmorgen brushless DC motor TBMS-6051 was utilised as a generator. The signals of the three inbuilt hall sensors were fed into the Kollmorgen AKD-P01206 motor controller and in parallel into the HBM measurement amplifier.
Nacelle accelerations were measured with a TE connectivity model 4030 triaxial acceleration sensor, which was cable-connected to the HBM measurement amplifier.
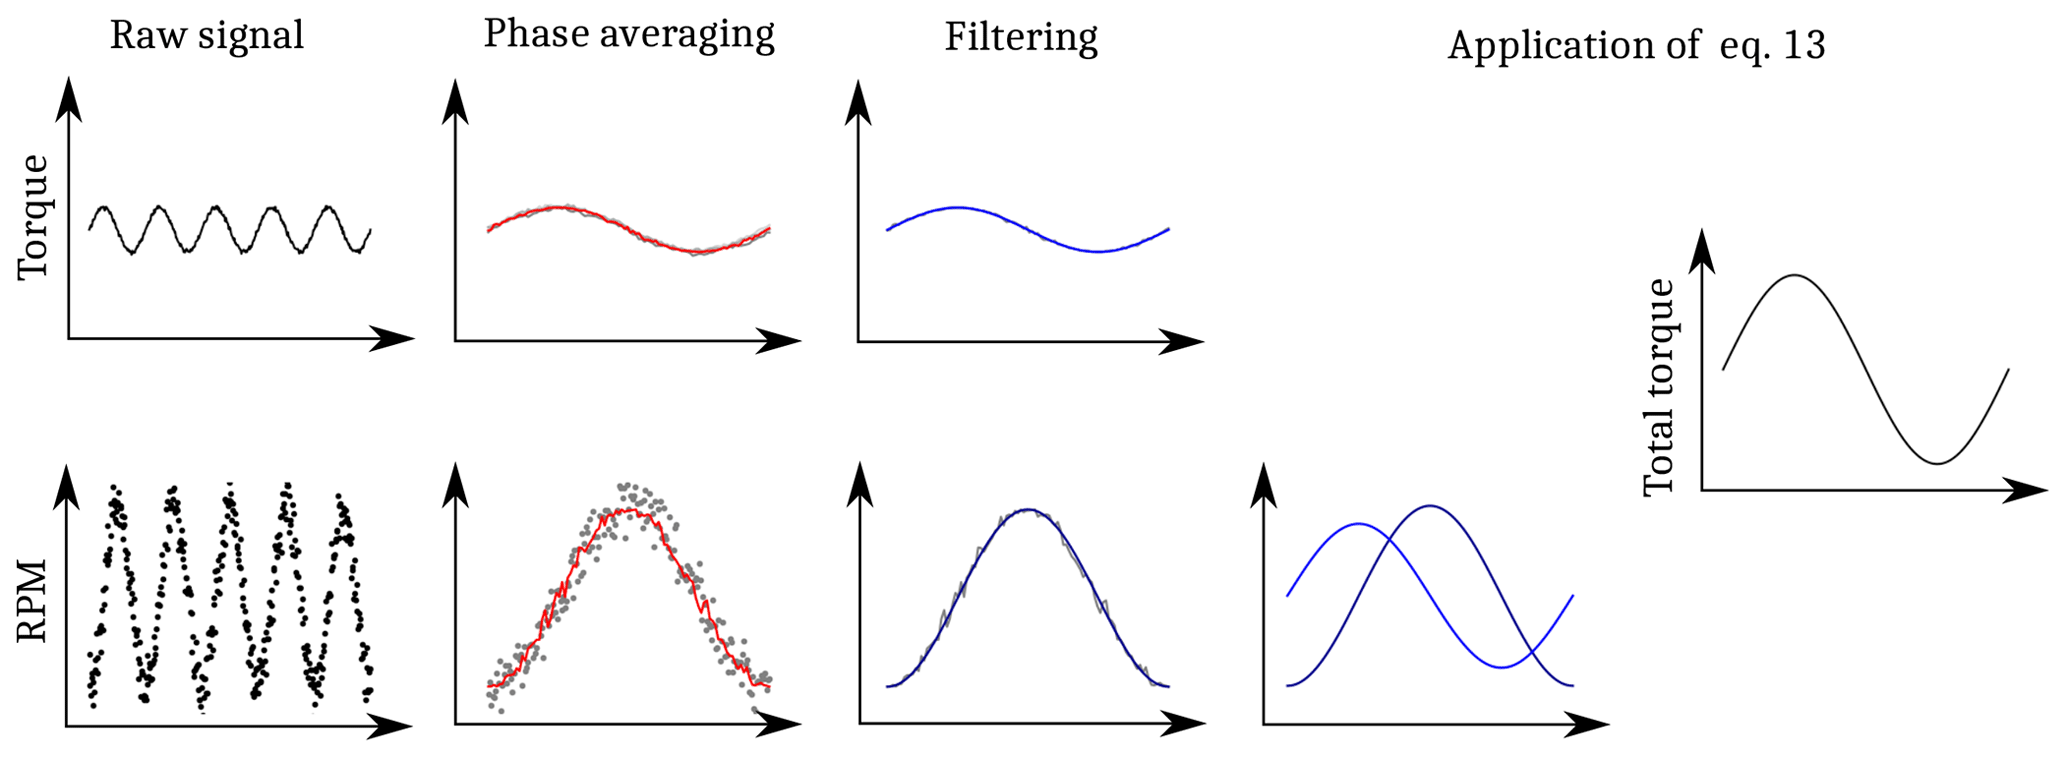
Figure C2Illustration of the data acquisition and inertia removal procedure for the torque measurements. Signal parts from load sensor measurements (top panels) and the rotational speed measurements (bottom panels) are added up in the last step.
The LinMot MS01-1/D magnetic position sensor was mounted on the backward end of the nacelle, while the magnetic band was placed on the steel frame of the tower top. It was used for a closed-loop control of the linear motor as well as the position measurement via the HBM measurement amplifier. The magnetic linear motor LinMot PS01-37x120 was used as actuator to apply the surge motion of the nacelle. A feedback control with the position sensor was realised with the LinMot C1100-GP motor driver.
Due to the limited data rate, the sampling frequency of the wireless measurement amplifier was limited to 600 Hz. A low-pass filter (infinite impulse response, IIR) with an edge frequency of 200 Hz was applied to the measurement signal before transmitting it. Torque measurements were additionally filtered as described in Sect. 5.
For hall sensors, the position sensor and the acceleration sensor, a sampling frequency of approximately 10 kHz was chosen.
C2 Processing steps for rotor torque measurement
The calculation procedure of the aerodynamic torque is illustrated in Fig. C2. In the procedure, the rotational speed signal is phase-averaged over at least 15 periods and then low-pass-filtered with an edge frequency of 2.5 times the motion frequency. Then, a central differencing scheme is applied to calculate the numerical derivative and the result is fed into Eq. (13). The measured rotor torque is also phase-averaged and filtered in the same way. Finally, the aerodynamic rotor torque is calculated from Eq. (13). In Fig. 7, the measured, phase-averaged and filtered rotational speed variations as well as the compensated rotor torque are shown for all load cases. Due to the low amplitude of the rotational speed oscillation, the signal is largely scattered. However, the phase-averaged results follow a sinusoidal trend in every case. Small disturbances of the gradient are disregarded using the low-pass filtering.
C3 Reconstruction of rotational speed
The rotational speed signal was reconstructed from the signals of three inbuilt, equidistant hall sensors inside the motor. The sensors deliver a rising edge in the signal when an electrical pole of the motor crosses it. Due to the presence of six pole pairs, six rising edges can be detected during one rotation in one sensor signal. The rotational speed can therefore be calculated from the fact that a rising edge occurs every 60° of rotation and from the time elapsed between two rising edges. As the signal takes approximately two time steps to rise at the sampling rate of 10 kHz, the point in time when the signal starts to rise is detected via linear interpolation between the samples. As a consequence, the resolution of the rising edge detection can be considered about 10 times higher than the sampling resolution.
C4 Determination of the mass moment of inertia of the rotor
The mass moment of inertia of the rotor and hub geometry was determined experimentally. When rotor torque and rotational acceleration are known while no aerodynamic load is applied, the mass moment of inertia can be calculated by the following equation.
The rotor was accelerated with a constant torque from 0 to 300 rpm. A linear fit of the approximately linear rotor speed increase between 200 and 300 rpm was computed. The steepness gave the average angular acceleration during this process. Concurrently, the measured rotor torque, which was approximately constant, was averaged over the same period of time. Finally, the mass moment of inertia was computed by the average of four repetitions of this procedure and the above equation. In order to validate the result, the same procedure was repeated with a higher and a lower level of torque yielding a faster and a slower acceleration of the rotor. A maximum deviation of 1.4 % between the results was reported.
The rotor torque amplitude consists of the direct torque measurement and the inertia compensation procedure. Major sources of random and systematic uncertainty in the relevant quantities for the measurement of the rotor torque amplitude are listed below.
D1 Uncertainty in the direct torque measurement
On the torque axis, the force–moment sensor has an uncertainty of 0.008 N m (with a confidence level of 95 %), which corresponds to below 1 % of the rated rotor torque. As the sensor is mounted with a fit into the rotor shaft, inaccuracies caused by the mounting position and angle can be considered negligible. A few very thin wires for power transmission connect the measuring side of the sensor to the generator side. A change in the parasitic moment induced by the wires during one measurement cycle may result in a minimal contribution to the random uncertainty.
D2 Uncertainty in rotor speed measurement
Sources of random uncertainty in the rotor speed measurement are any geometrical inaccuracies of the placement of the motor poles and hall sensors as well as the rise characteristics of the hall sensors. These uncertainties do not result in systematic errors because the influence of these parameters on the rotor speed measurement will be the same in any rotation cycle. A systematic influence on the phase-averaged rotor speed amplitude would therefore require the rotor rotation and surge motion to be phase-locked, which is not the case.
The measurement of the time between two rising edges due to the sampling is the most crucial contributor to the random uncertainty (see dots in Fig. 7). As this time is in the magnitude of and can be detected with a resolution of approximately , an error of approximately 0.1 % for every measurement point can be expected. Due to the fact that the measured peak-to-peak rotor speed oscillations range from 0.2 % to 0.6 % of the rated rotor speed, this is quite significant. However, it can be assumed that this error is of a purely random nature and is therefore drastically reduced due to the phase averaging.
A systematic influence on the rotor speed amplitude measurement is that the actual rotor speed is averaged over of a rotation. This results in the fact that magnitudes of maxima and minima are slightly underpredicted because the rotor speed is averaged over a phase range of 60°. For the highest motion frequency, this effect yields a systematic underprediction of the rotor speed amplitude of approximately 2 %.
D3 Uncertainty from synchronisation of rotor speed and torque measurement
Rotor speed and direct torque measurements were acquired with two different measurement amplifiers. A synchronisation was achieved by a comparison of the rotor load in the wind direction (including inertia) and the nacelle acceleration. Both signals were time-shifted so that the onset of the motion occurs at the same time in both signals. The accuracy of this procedure is difficult to evaluate but is assumed to be maximum 2 % of the motion period. This results in a maximum phase shift of 7° between the rotor speed and direct torque measurements. As the contribution of the direct torque measurements to the rotor torque amplitude is below 20 %, the influence of this phase shift is assumed to be comparatively small.
D4 Uncertainty in the determination of the mass moment of inertia
The two sources of uncertainty are the rotor speed and the rotor torque measurement (both discussed above). In both, no significant systematic uncertainty is expected. As the measurements are repeated only four times, the above-described sources of random uncertainty did not completely average out. The procedure resulted in a maximum deviation of 1.4 % between the results for three independent runs with different rotor accelerations.
D5 Uncertainty in position and velocity amplitude measurement
For the reproduction of the measurements with the numerical model, the measurement of the actual motion amplitude is as crucial as the torque measurement itself. The positioning sensor has an overall uncertainty of 0.01 mm. This is about 0.2 % of the lowest motion amplitude. However, the most crucial uncertainty comes from the deviation of the actual motion trajectory between different motion cycles. Deviations of about 3 % have been observed when considering approximately 15 motion cycles. These deviations have been accepted, and no detailed analysis on the consequences of these was performed.
Finally, a theoretical investigation of the combined systematic and random uncertainty in the rotor torque, surge motion and data processing with a sufficient level of detail was found to be very complex and prone to errors. However, an experimental investigation of these uncertainties would have required the construction of an elaborate calibration rig. This was out of the scope of the current work. Therefore, the authors had to rely on the above theoretical analysis, where systematic errors are shown to be generally in a low single-digit percentage range. In addition, an indication that the random uncertainty is also within a low single-digit percentage can be concluded from the comparison of the repetition results shown.
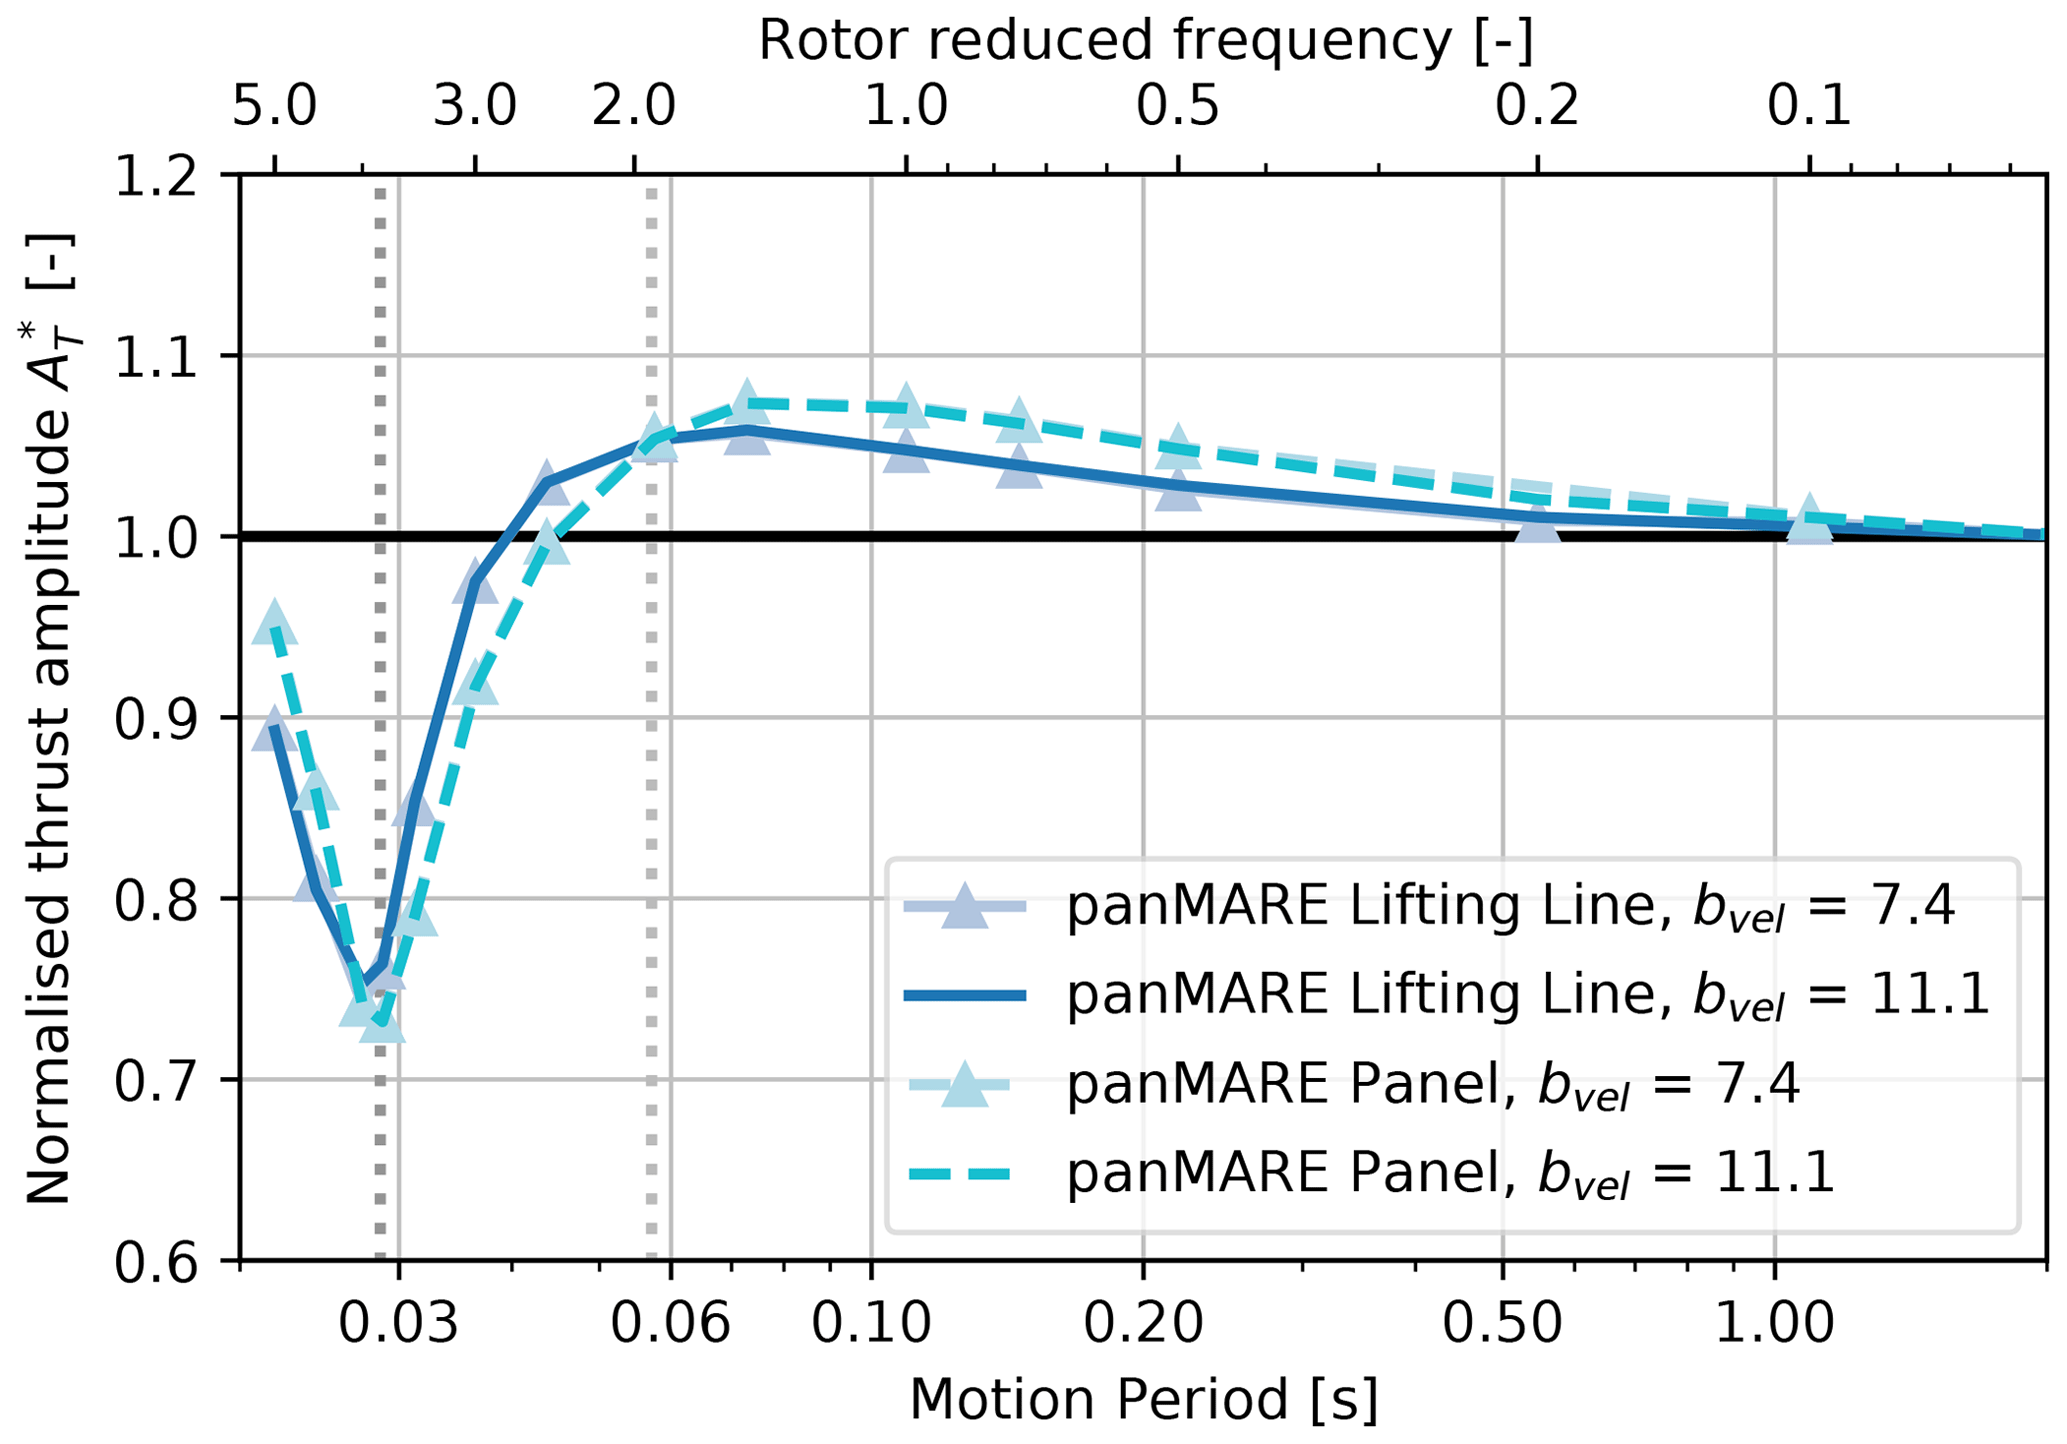
Figure E1Aerodynamic rotor thrust amplitudes of the model rotor from simulations as a response to the extended surge motions plotted over the motion period and rotor reduced frequency. Thrust amplitudes are normalised to the case with the highest motion period.
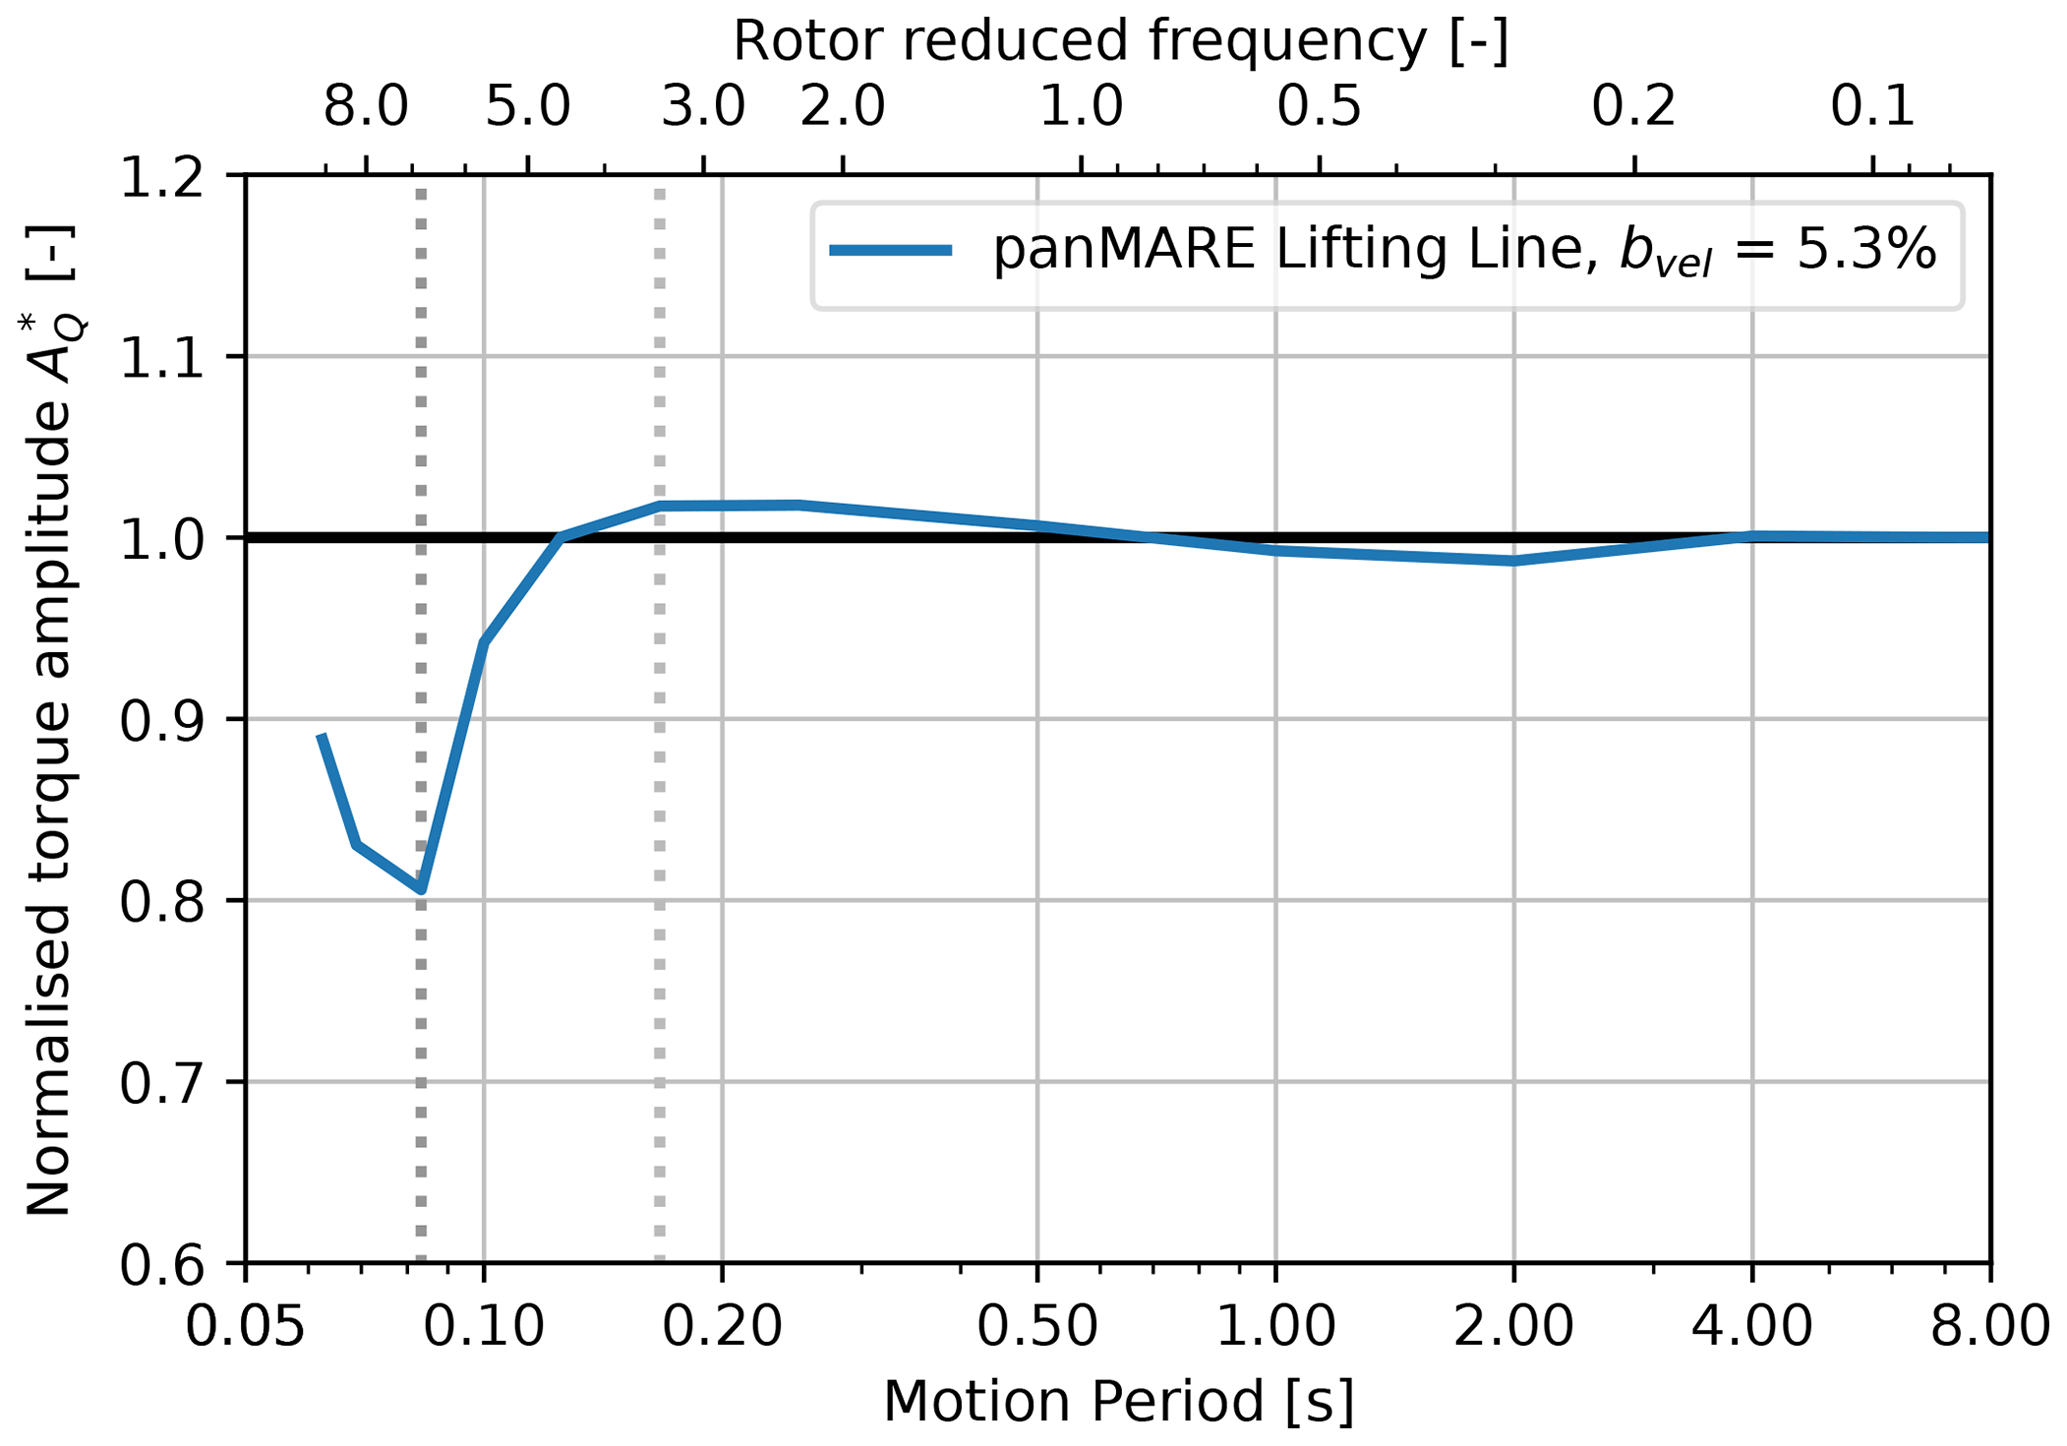
Figure F1Aerodynamic rotor torque amplitudes of the UNAFLOW rotor from simulations as a response to surge motions plotted over the motion period and rotor reduced frequency. Torque amplitudes are normalised to the case with the highest motion period.
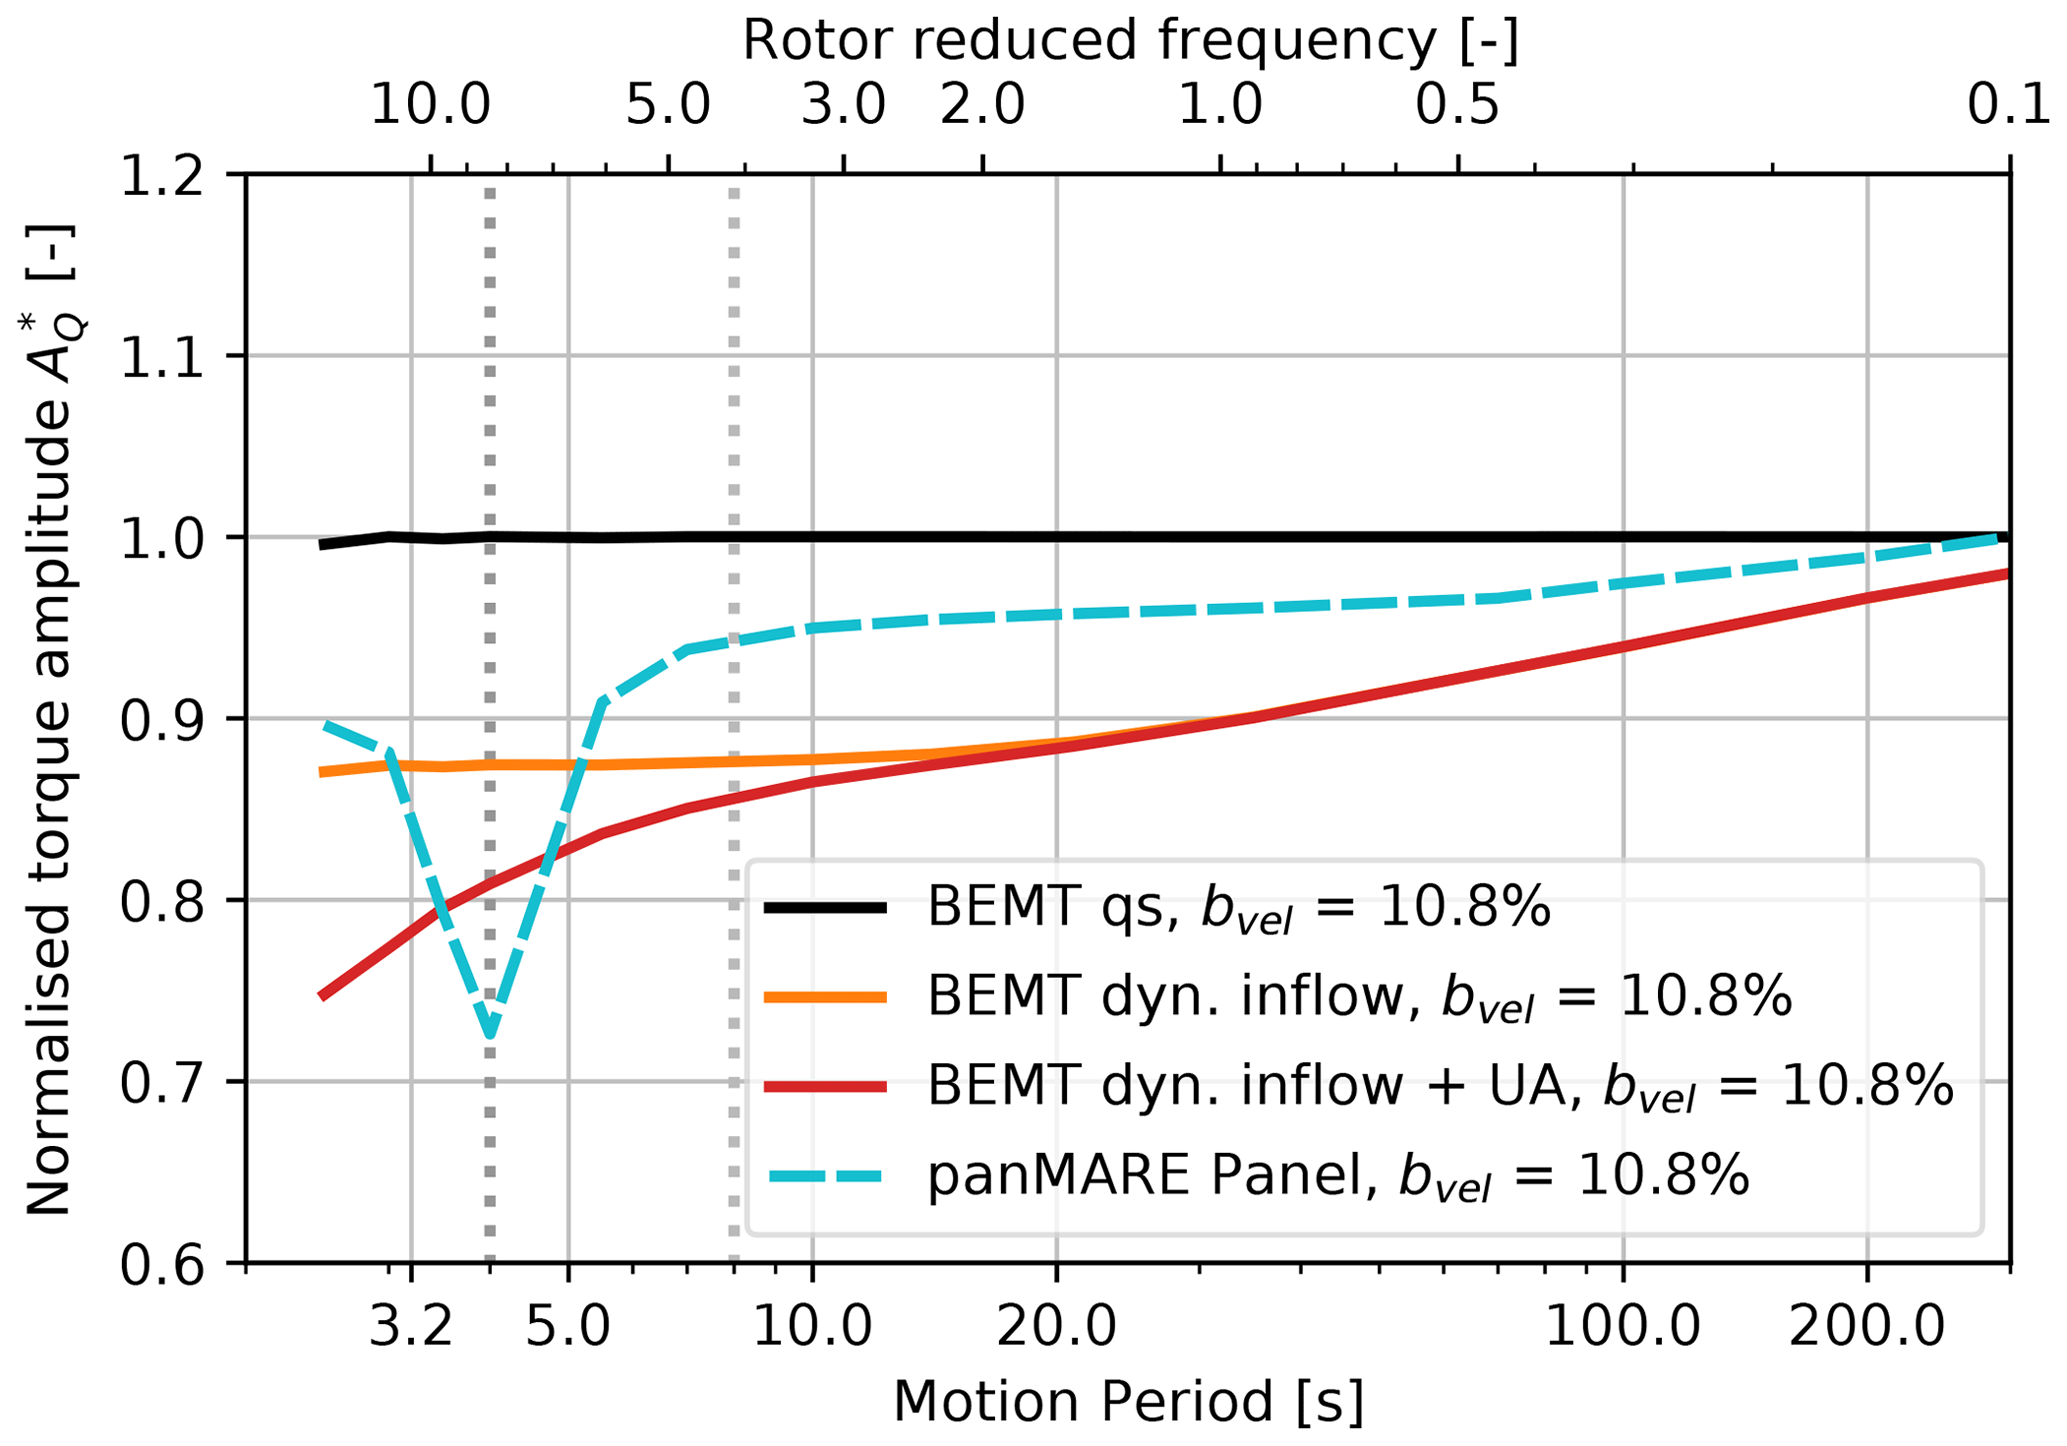
Figure F2Aerodynamic rotor torque amplitudes of the IEA 15 MW as a response to surge motions, plotted over the motion period and rotor reduced frequency. Torque amplitudes are normalised to the scenario with the highest motion period in the case of the panel method and to the quasi-steady simulation in case of BEMT.
The FVW method panMARE is an in-house development of the TUHH and can be provided in the course of academic and commercial cooperations. The open-source BEMT method AeroDyn v15, which is part of OpenFAST 3.1.0, is freely available and can be found at Jonkman (2022) (https://doi.org/10.5281/zenodo.6324288). Apart from post-processing and plotting scripts, no other software was used.
The raw data of the simulation results and measurements can be provided by contacting the corresponding author.
CWS planned, designed and conducted the experiment, which includes the turbine design and data processing. In addition, CWS developed the load case sets, performed the FVW simulations, led the analysis of numerical and experimental results, and wrote the manuscript. UÖ performed OpenFAST simulations, supported the analysis of the simulations and reviewed the manuscript. SN implemented the extension of panMARE for wind turbines, supported the FVW simulations, contributed to the analysis of their results and reviewed the manuscript. PWC contributed to the theoretical discussions, supervised the works of UÖ and acquired funding. MM contributed to the theoretical discussions, supervised all works of CWS and SN, reviewed the manuscript, and acquired funding.
The contact author has declared that none of the authors has any competing interests.
Publisher's note: Copernicus Publications remains neutral with regard to jurisdictional claims made in the text, published maps, institutional affiliations, or any other geographical representation in this paper. While Copernicus Publications makes every effort to include appropriate place names, the final responsibility lies with the authors.
Special thanks go to our partners CRUSE Offshore GmbH, aerodyn engineering GmbH, Jörss – Blunck – Ordemann GmbH, DNV GL, and the Institute for Ship Structural Design and Analysis at the Hamburg University of Technology for the excellent cooperation in the HyStOH project as well as the partners from the VAMOS consortium, BW Ideol, École Centrale de Nantes, sowento GmbH, UL International GmbH and DNV GL. The authors greatly appreciate the work of Klaus Wieczorek in supporting the experimental investigations.
Publishing fees supported by Funding Programme Open Access Publishing of the Hamburg University of Technology (TUHH).
The authors kindly thank Roger Bergua, Emmanuel Branlard, Jason Jonkman and Amy Robertson (NREL, National Renewable Energy Laboratory) for supporting the analysis of the OpenFAST simulations.
This research has been supported by the Bundesministerium für Wirtschaft und Energie (HyStOH project, grant no. 03SX409A-F, and VAMOS project, grant no. 03EE2004A-C).
This paper was edited by Jens Nørkær Sørensen and reviewed by two anonymous referees.
Bauer, M. and Abdel-Maksoud, M.: A 3-D Potential Based Boundary Element Method for Modelling and Simulation of Marine Propeller Flows, in: IFAC Proceedings Volumes, vol. 45 of 7th Vienna International Conference on Mathematical Modelling, Elsevier, 1179–1184, https://doi.org/10.3182/20120215-3-AT-3016.00209, 2012. a
Bayati, I., Belloli, M., Bernini, L., and Zasso, A.: Wind tunnel validation of AeroDyn within LIFES50+ project: imposed Surge and Pitch tests, J. Phys.: Conf. Ser., 753, 092001, https://doi.org/10.1088/1742-6596/753/9/092001, 2016. a, b
Bayati, I., Belloli, M., Bernini, L., Boldrin, D., Boorsma, K., Caboni, M., Cormier, M., Mikkelsen, R., Lutz, T., and Zasso, A.: UNAFLOW project: UNsteady Aerodynamics of FLOating Wind turbines, J. Phys.: Conf. Ser., 1037, 072037, https://doi.org/10.1088/1742-6596/1037/7/072037, 2018. a, b
Bergua, R., Robertson, A., Jonkman, J., Branlard, E., Fontanella, A., Belloli, M., Schito, P., Zasso, A., Persico, G., Sanvito, A., Amet, E., Brun, C., Campaña-Alonso, G., Martín-San-Román, R., Cai, R., Cai, J., Qian, Q., Maoshi, W., Beardsell, A., Pirrung, G., Ramos-García, N., Shi, W., Fu, J., Corniglion, R., Lovera, A., Galván, J., Nygaard, T. A., dos Santos, C. R., Gilbert, P., Joulin, P.-A., Blondel, F., Frickel, E., Chen, P., Hu, Z., Boisard, R., Yilmazlar, K., Croce, A., Harnois, V., Zhang, L., Li, Y., Aristondo, A., Mendikoa Alonso, I., Mancini, S., Boorsma, K., Savenije, F., Marten, D., Soto-Valle, R., Schulz, C. W., Netzband, S., Bianchini, A., Papi, F., Cioni, S., Trubat, P., Alarcon, D., Molins, C., Cormier, M., Brüker, K., Lutz, T., Xiao, Q., Deng, Z., Haudin, F., and Goveas, A.: OC6 project Phase III: validation of the aerodynamic loading on a wind turbine rotor undergoing large motion caused by a floating support structure, Wind Energy. Sci., 8, 465–485, https://doi.org/10.5194/wes-8-465-2023, 2023. a, b, c, d, e
Branlard, E., Brownstein, I., Strom, B., Jonkman, J., Dana, S., and Baring-Gould, E. I.: A multipurpose lifting-line flow solver for arbitrary wind energy concepts, Wind Energ Sci, 7, 455–467, https://doi.org/10.5194/wes-7-455-2022, 2022a. a
Branlard, E., Jonkman, B., Pirrung, G. R., Dixon, K., and Jonkman, J.: Dynamic inflow and unsteady aerodynamics models for modal and stability analyses in OpenFAST, J. Phys.: Conf. Ser., 2265, 032044, https://doi.org/10.1088/1742-6596/2265/3/032044, 2022b. a, b
Chen, Z., Wang, X., and Kang, S.: Effect of the Coupled Pitch–Yaw Motion on the Unsteady Aerodynamic Performance and Structural Response of a Floating Offshore Wind Turbine, Processes, 9, 290, https://doi.org/10.3390/pr9020290, 2021. a, b
Cormier, M., Caboni, M., Lutz, T., Boorsma, K., and Krämer, E.: Numerical analysis of unsteady aerodynamics of floating offshore wind turbines, J. Phys.: Conf. Ser., 1037, 072048, https://doi.org/10.1088/1742-6596/1037/7/072048, 2018. a
Damiani, R. R. and Hayman, G.: The Unsteady Aerodynamics Module For FAST8, Tech. Rep. NREL/TP–5000-66347, 1576488, NREL – National Renewable Energy Lab., Golden, CO, USA, https://doi.org/10.2172/1576488, 2019. a
de Vaal, J., Hansen, M. L., and Moan, T.: Effect of wind turbine surge motion on rotor thrust and induced velocity, Wind Energy, 17, 105–121, https://doi.org/10.1002/we.1562, 2014. a
Drela, M.: XFOIL: An Analysis and Design System for Low Reynolds Number Airfoils, in: Low Reynolds Number Aerodynamics, Lecture Notes in Engineering, edited by: Mueller, T. J., Springer, 1–12, ISBN 978-3-642-84010-4, https://doi.org/10.1007/978-3-642-84010-4_1, 1989. a
Eliassen, L.: Aerodynamic loads on a wind turbine rotor in axial motion, phdthesis, University of Stavangar, http://hdl.handle.net/11250/284344 (last access: 20 December 2023), 2015. a, b, c, d
Fang, Y., Duan, L., Han, Z., Zhao, Y., and Yang, H.: Numerical analysis of aerodynamic performance of a floating offshore wind turbine under pitch motion, Energy, 192, 116621, https://doi.org/10.1016/j.energy.2019.116621, 2020. a
Farrugia, R., Sant, T., and Micallef, D.: Investigating the aerodynamic performance of a model offshore floating wind turbine, Renew. Energy, 70, 24–30, https://doi.org/10.1016/j.renene.2013.12.043, 2014. a, b, c
Farrugia, R., Sant, T., and Micallef, D.: A study on the aerodynamics of a floating wind turbine rotor, Renew. Energy, 86, 770–784, https://doi.org/10.1016/j.renene.2015.08.063, 2015. a, b
Ferreira, C., Yu, W., Sala, A., and Viré, A.: Dynamic inflow model for a floating horizontal axis wind turbine in surge motion, Wind Energ. Sci., 7, 469–485, https://doi.org/10.5194/wes-7-469-2022, 2022. a
Fontanella, A., Bayati, I., Mikkelsen, R., Belloli, M., and Zasso, A.: UNAFLOW: a holistic wind tunnel experiment about the aerodynamic response of floating wind turbines under imposed surge motion, Wind Energ. Sci., 6, 1169–1190, https://doi.org/10.5194/wes-6-1169-2021, 2021. a, b, c, d
Fontanella, A., Facchinetti, A., Di Carlo, S., and Belloli, M.: Wind tunnel investigation of the aerodynamic response of two 15 MW floating wind turbines, Wind Energ. Sci., 7, 1711–1729, https://doi.org/10.5194/wes-7-1711-2022, 2022. a, b, c
Fontanella, A., Daka, E., Novais, F., and Belloli, M.: Aerodynamic response of a floating wind turbine scale model with inclusion of reference control functionalities, Wind Energ. Sci. [preprint], https://doi.org/10.5194/wes-2023-29, 2023. a, b, c, d
Gaertner, E., Rinker, J., Sethuraman, L., Zahle, F., Anderson, B., Barter, G. E., Abbas, N. J., Meng, F., Bortolotti, P., Skrzypinski, W., Scott, G. N., Feil, R., Bredmose, H., Dykes, K., Shields, M., Allen, C., and Viselli, A.: IEA Wind TCP Task 37: Definition of the IEA 15-Megawatt Offshore Reference Wind Turbine, Tech. Rep. NREL/TP-5000-75698, NREL – National Renewable Energy Lab., Golden, CO, USA, https://doi.org/10.2172/1603478, 2020. a
Jonkman, B. Mudafort, R. M., Platt, A., Branlard, E., Sprague, M., Jonkman, J., HaymanConsulting, Vijayakumar, G., Buhl, M., Ross, H., Bortolotti, P., Masciola, M., Ananthan, S., Schmidt, M. J., Rood, J., rdamiani, nrmendoza, sinolonghai, Hall, M., …, and rcorniglion: OpenFAST/openfast: OpenFAST v3.1.0, Zenodo [code], https://doi.org/10.5281/zenodo.6324288, 2022. a, b
Leishman, J. G.: Principles of Helicopter Aerodynamics, in: 1st Edn., Cambridge University Press, ISBN 78-0-521-85860-1, 2000. a, b, c, d
Leishman, J. G.: Challenges in modelling the unsteady aerodynamics of wind turbines, Wind Energy, 5, 85–132, https://doi.org/10.1002/we.62, 2002. a
Leishman, J. G. and Beddoes, T. S.: A Semi-Empirical Model for Dynamic Stall, J. Am. Helicopt. Soc., 34, 3–17, https://doi.org/10.4050/JAHS.34.3.3, 1989. a, b
Lienard, C., Boisard, R., and Daudin, C.: Aerodynamic Behavior of a Floating Offshore Wind Turbine, AIAA J., 58, 3835–3847, https://doi.org/10.2514/1.J059255, 2020. a, b
Loewy, R. G.: A Two-Dimensional Approximation to the Unsteady Aerodynamics of Rotary Wings, J. Aeronaut. Sci., 24, 81–92, https://doi.org/10.2514/8.3777, 1957. a
Lyon, C. A., Broeren, A. P., Giguere, P., Gopalarathnam, A., and Selig, M. S.: Summary of Low-Speed Airfoil Data, in: Volume 3, Tech. rep., SoarTech Publications, University of Illinois, ISBN 0-9646747-3-4, 1997. a
Mancini, S., Boorsma, K., Caboni, M., Cormier, M., Lutz, T., Schito, P., and Zasso, A.: Characterization of the unsteady aerodynamic response of a floating offshore wind turbine to surge motion, Wind Energ. Sci., 5, 1713–1730, https://doi.org/10.5194/wes-5-1713-2020, 2020. a, b, c, d, e, f, g, h, i, j
Mancini, S., Boorsma, K., Caboni, M., Hermans, K., and Savenije, F.: An engineering modification to the blade element momentum method for floating wind turbines, J. Phys.: Conf. Ser., 2265, 042017, https://doi.org/10.1088/1742-6596/2265/4/042017, 2022. a
Meng, H., Su, H., Guo, J., Qu, T., and Lei, L.: Experimental investigation on the power and thrust characteristics of a wind turbine model subjected to surge and sway motions, Renew. Energy, 181, 1325–1337, https://doi.org/10.1016/j.renene.2021.10.003, 2022. a, b
Micallef, D. and Sant, T.: Loading effects on floating offshore horizontal axis wind turbines in surge motion, Renew. Energy, 83, 737–748, https://doi.org/10.1016/j.renene.2015.05.016, 2015. a
Moriarty, P. J. and Hansen, A. C.: AeroDyn Theory Manual, Tech. Rep. NREL/T-500-36881, National Renewable Energy Lab., Golden, CO, USA, https://doi.org/10.2172/15014831, 2005. a
Netzband, S., Schulz, C. W., Göttsche, U., Ferreira González, D., and Abdel-Maksoud, M.: A panel method for floating offshore wind turbine simulations with fully integrated aero- and hydrodynamic modelling in time domain, Ship. Technol. Res., 65, 123–136, https://doi.org/10.1080/09377255.2018.1475710, 2018. a, b, c
Netzband, S., Schulz, C. W., and Abdel-Maksoud, M.: Self-aligning behaviour of a passively yawing floating offshore wind turbine, Ship. Technol. Res., 67, 15–25, https://doi.org/10.1080/09377255.2018.1555986, 2020. a
Netzband, S., Schulz, C. W., Özinan, U., Adam, R., Choisnet, T., Cheng, P. W., and Abdel-Maksoud, M.: Validation of a panel method with full-scale FOWT measurements and verification with engineering models, J. Phys.: Conf. Ser., 2626, 012061, https://doi.org/10.1088/1742-6596/2626/1/012061, 2023. a
Ramos-García, N., Sørensen, J. N., and Shen, W. Z.: Three-dimensional viscous-inviscid coupling method for wind turbine computations, Wind Energy, 19, 67–93, https://doi.org/10.1002/we.1821, 2016. a
Ribeiro, A. F. P., Casalino, D., and Ferreira, C. S.: Nonlinear inviscid aerodynamics of a wind turbine rotor in surge, sway, and yaw motions using a free-wake panel method, Wind Energ. Sci., 8, 661–675, https://doi.org/10.5194/wes-8-661-2023, 2023. a, b, c, d, e, f, g
Roura, M., Cuerva, A., Sanz-Andrés, A., and Barrero-Gil, A.: A panel method free-wake code for aeroelastic rotor predictions, Wind Energy, 13, 357–371, https://doi.org/10.1002/we.358, 2010. a
Sant, T. and Cuschieri, K.: Comparing Three Aerodynamic Models for Predicting the Thrust and Power Characteristics of a Yawed Floating Wind Turbine Rotor, J. Sol. Energ. Eng., 138, 031004, https://doi.org/10.1115/1.4032684, 2016. a
Sant, T., Bonnici, D., Farrugia, R., and Micallef, D.: Measurements and modelling of the power performance of a model floating wind turbine under controlled conditions, Wind Energy, 18, 811–834, https://doi.org/10.1002/we.1730, 2015. a, b
Schepers, J. G.: Engineering models in wind energy aerodynamics: development, implementation and analysis using dedicated aerodynamic measurements, Phd thesis, Delft University of Technology, Delft, ISBN 9789461915078, 2012. a, b, c
Schulz, C. W., Wang, K., Wieczorek, K., Netzband, S., and Abdel-Maksoud, M.: Experimental and numerical investigation of the yaw moment of a downwind coned wind turbine rotor, Wind Energy, 25, 1995–2015, https://doi.org/10.1002/we.2779, 2022. a, b, c
Schulz, C. W., Özinan, U., Netzband, S., Cheng, P. W., and Abdel-Maksoud, M.: The Impact of Unsteadiness on the Aerodynamic Loads of a Floating Offshore Wind Turbine, J. Phys.: Conf. Ser., 2626, 012064, https://doi.org/10.1088/1742-6596/2626/1/012064, 2023. a, b, c, d
Sebastian, T. and Lackner, M.: Analysis of the Induction and Wake Evolution of an Offshore Floating Wind Turbine, Energies, 5, 968–1000, https://doi.org/10.3390/en5040968, 2012. a, b
Sebastian, T. and Lackner, M.: Characterization of the unsteady aerodynamics of offshore floating wind turbines, Wind Energy, 16, 339–352, https://doi.org/10.1002/we.545, 2013. a
Sivalingam, K., Martin, S., and Singapore Wala, A.: Numerical Validation of Floating Offshore Wind Turbine Scaled Rotors for Surge Motion, Energies, 11, 2578, https://doi.org/10.3390/en11102578, 2018. a, b
Snel, H., Schepers, J. G., van Bussel, G. J. W., Vermeer, L. J., Rawlinson Smith, R. I., Voutsinas, S., van Holten, T., Oye, S., and Bareiß, R.: Joint investigation of dynamic inflow effects and implementation of an engineering method, Tech. Rep. ECN-C-94-107, Netherlands Energy Research Center, https://publications.ecn.nl/E/1995/ECN-C--94-107 (last access: 20 December 2023), 1995. a
Tran, T. T. and Kim, D.-H.: The platform pitching motion of floating offshore wind turbine: A preliminary unsteady aerodynamic analysis, Renew. Energy, 142, 65–81, https://doi.org/10.1016/j.jweia.2015.03.009, 2015. a
Tran, T. T., Kim, D.-H., and Hieu Nguyen, B.: Aerodynamic Interference Effect of Huge Wind Turbine Blades With Periodic Surge Motions Using Overset Grid-Based Computational Fluid Dynamics Approach, J. Sol. Energ. Eng., 137, 061003, https://doi.org/10.1115/1.4031184, 2015. a, b, c
van Garrel, A.: Multilevel panel method for wind turbine rotor flow simulations, phdthesis, University of Twente, ISBN 9789036542241, https://doi.org/10.3990/1.9789036542241, 2016. a
Wang, Y. and Abdel-Maksoud, M.: Coupling wake alignment lifting line method and boundary element method for open water and unsteady propeller simulation, Ocean Eng., 213, 107738, https://doi.org/10.1016/j.oceaneng.2020.107738, 2020. a
Wei, N. J. and Dabiri, J. O.: Phase-averaged dynamics of a periodically surging wind turbine, J. Renew. Sustain. Energ., 14, 013305, https://doi.org/10.1063/5.0076029, 2022. a, b
Wen, B., Tian, X., Dong, X., Peng, Z., and Zhang, W.: Influences of surge motion on the power and thrust characteristics of an offshore floating wind turbine, Energy, 141, 2054–2068, https://doi.org/10.1016/j.energy.2017.11.090, 2017. a, b, c, d, e
Wu, C.-H. K. and Nguyen, V.-T.: Aerodynamic simulations of offshore floating wind turbine in platform-induced pitching motion: Numerical simulations of FOWT in coupled motions, Wind Energy, 20, 835–858, https://doi.org/10.1002/we.2066, 2017. a
Offshore Code Comparison, Collaboration, Continued, with Correlation and unCertainty.
A rotor m s−1 wind speed and a wave-induced motion period of 7 s.
In the reference frame of the airfoil the surge motion of the rotor would be a plunge motion. However, for the sake of simplicity, the term surge motion is used here.
In the first row of Fig. 1, the vortex-induced velocity leads to a decrease in the angle of attack, when the airfoil has its maximum downward motion velocity. Concurrently, the lift force is maximum due to the downward motion of the airfoils. Therefore, the vortex-induced velocity causes a decrease in the maximum lift force of the second airfoil. The opposite is the case in the third row, where the vortex-induced velocity increases the angle of attack during the upward motion. As the minimum lift force occurs during the upward motion, this minimum increases due to the presence of the shed vortices. Consequently, the lift amplitude of the second airfoil caused by the surge motion decreases due to the presence of the shed vortices in cases where the vortices reach the second airfoil after one motion period. In a similar way, it can be argued that a maximum of the lift force occurs when vortices reach the second airfoil after half a motion period.
This can for example be seen when comparing the blade load predictions of the MEXICO rotor computed by an inviscid panel method in Ramos-García et al. (2016) and a lifting-line method in Branlard et al. (2022a).
In this procedure, aerodynamic loads on the rotor in the no-wind cases are not considered. An estimation of these residual drag forces based on the maximum motion velocities for a conservative drag coefficient of 2 showed that these loads are within a range of 0.2 % of the expected thrust force. This is considered negligible in the context of the inertia correction procedure.
Two cases are missing in the graph because the rotational speed contained significantly higher scattering in comparison to the other test runs.
The present analysis is limited to the influence of the shed wake of the first blade to the second blade during the first rotor rotation. However, due to the modelling constraints of the cascade approach, a third airfoil has to be placed in the row in order to evaluate the lift force of the second airfoil in a physically correct way (see Eliassen, 2015, for details). This third airfoil is present in the simulations but not shown in the figure for the sake of simplicity.
In contrast to the original definition of the turbine, the utilised design has a cone and tilt angle of 0° in order to remove any possible unsteady contribution which is not caused by the surge motion itself.
Note that the airfoil reduced frequency is dependent on the chord length and consequently on the rotor radius. Therefore, this comparison is only valid because both simulations represent the situation at approximately the same relative radius.
- Abstract
- Introduction
- Theoretical background
- Previous numerical and experimental works
- Numerical methods
- Experimental and corresponding numerical investigation of the TUHH rotor
- Simulation study on the TUHH rotor beyond the experiment
- Simulation study on the UNAFLOW rotor
- Simulation study on the IEA 15 MW turbine
- Characterisation and occurrence of unsteady aerodynamic phenomena
- Summary and conclusions
- Appendix A: Derivation of Eq. (4)
- Appendix B: Details on numerical methods and models
- Appendix C: Data acquisition
- Appendix D: Sources of random and systematic uncertainty
- Appendix E: Thrust force amplitudes of the simulation study of the TUHH model rotor
- Appendix F: Torque amplitudes of the simulation study of the UNAFLOW and the IEA 15 MW rotor
- Code availability
- Data availability
- Author contributions
- Competing interests
- Disclaimer
- Acknowledgements
- Financial support
- Review statement
- References