the Creative Commons Attribution 4.0 License.
the Creative Commons Attribution 4.0 License.
 | 13 Jun 2025
Estimating microplastic emissions from offshore wind turbine blades in the Dutch North Sea
Anna Elisa Schwarz
Henk Slot
Harald van der Mijle Meijer
The continued expansion of offshore wind energy raises concerns regarding the microplastics released from wind turbine blades due to leading edge erosion. Currently, the literature lacks reliable and transparent estimates of microplastic formation and emissions from wind turbines. To bridge this knowledge gap, we employed state-of-the-art models to analytically evaluate the release of microplastics resulting from wind turbine blades' leading edge erosion. This was achieved by integrating measured offshore weather data with a fatigue-based erosion model. We then applied and extrapolated this methodology to estimate microplastic emissions from all offshore wind turbines installed in the Dutch North Sea and compared these estimates to other sources of microplastics in the Netherlands. Our estimates indicate that microplastic emissions from a modern 15 MW offshore wind turbine equipped with a polyurethane-based leading edge protection system are approximately 240 g yr−1. Using this value, we estimated the current emissions from all wind turbines installed in the Dutch North Sea. Our projections suggest that the current emissions from Dutch offshore wind turbine blades, amounting to 100 kg yr−1, are approximately 1000 times lower than the total offshore microplastic emissions in the Netherlands when considering other sources, such as the paints and coatings of marine vessels.
- Article
(2806 KB) - Full-text XML
-
Supplement
(332 KB) - BibTeX
- EndNote


To cut greenhouse gas emissions and achieve the Paris Agreement's target of keeping global warming below 1.5 °C, the European energy sector must invest in sustainable and renewable energy sources. To reach this target, Europe aims to produce 510 GW of wind energy by 2030. Recent studies have shown that wind turbines can release microplastics (particles smaller than 5 mm) into the environment throughout their life cycle (Hof et al., 2023). A significant cause of material loss in modern offshore wind turbine blades is leading edge erosion (LEE), mainly resulting from the impact of water droplets on the blades. Microplastics in the environment are recognized for their ecotoxicological risks to both wildlife and human health (Gall and Thompson, 2015; Huerta Lwanga et al., 2016; Leslie et al., 2022). As onshore and offshore wind farms are expected to expand to boost Europe's renewable energy share, microplastic emissions from wind turbines could become an additional environmental issue. Quantifying microplastic emissions from wind turbine blades is essential to determine potential mitigation measures, such as the development of anti-erosion coatings (Mishnaevsky et al., 2023), the implementation of effective maintenance practices for erosion prevention, and the application of erosion-safe modes (Bech et al., 2018), which involve reducing the turbine's rotational speed during periods of heavy rain and high wind speeds. Such quantification has been conducted for sectors like packaging, car tires, and agricultural practices, which are found to emit substantial amounts of microplastics, up to 0.8×10⁶ t annually on a global scale (Schwarz et al., 2023).
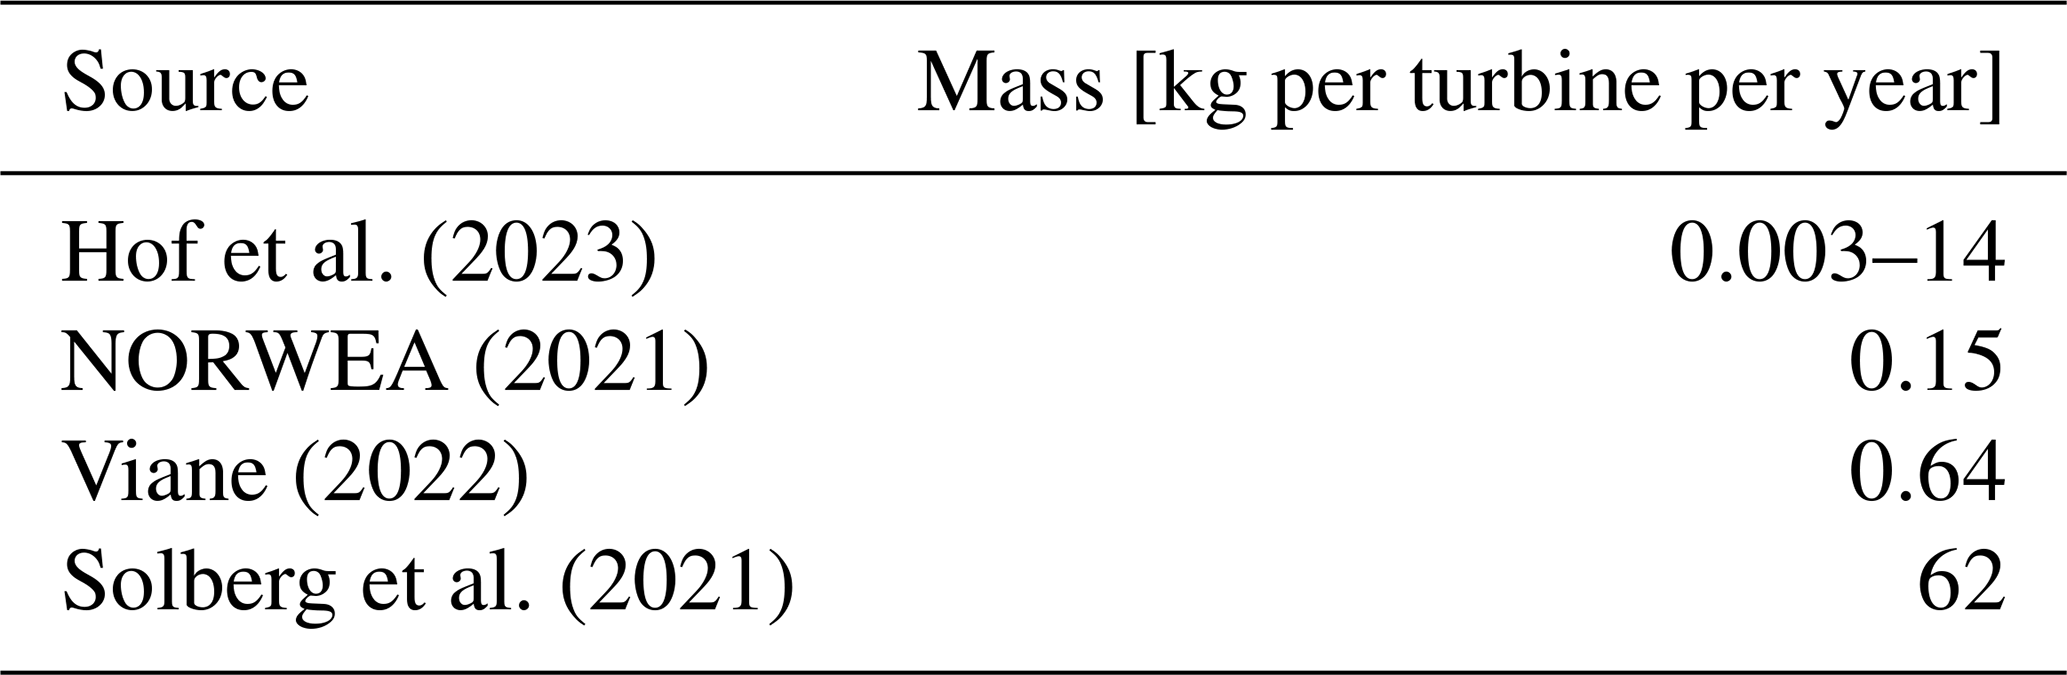
Although extensive research has been conducted on wind turbine LEE (Slot et al., 2015; Mishnaevsky et al., 2021; Verma et al., 2021) and its impact on wind turbine power production (Bak et al., 2020; Maniaci et al., 2020), a literature survey has revealed a lack of studies on methodologies to assess microplastic emissions from wind turbine blades. Currently available studies reporting values of microplastic formation due to wind turbine blades' LEE come from government and company reports or online news items and are summarized in Table 1. These sources share a common lack of detailed explanations regarding the methodology, data sources, and assumptions. Without such information, replicating and assessing these studies becomes challenging; if not impossible. A report by the Dutch National Institute for Public Health and the Environment (RIVM) (Hof et al., 2023) estimated that each turbine releases between 3 g and 14 kg of microplastics annually. These estimates, which vary based on blade length and the leading edge protection (LEP) system, were derived from photographs of eroded blades and communications with unnamed wind turbine manufacturers. The original authors' upper estimate of 14 kg is deliberately exaggerated, assuming the entire blade length is affected by erosion. Moreover, some of their estimates apply to blades without LEP. A factsheet from NORWEA, the Norwegian Wind Energy Association, reports an erosion rate of 150 g per turbine per year (NORWEA, 2021). This information is reported to have been provided directly by Vestas. On a web page, Viane (2022) mentions that Vleemo, a Flemish wind farm developer, reports that wind turbine blades release 640 g of material per turbine annually. No details are provided about the methodology used to obtain this figure. Solberg et al. (2021) report significantly greater microplastic formation compared to other reviewed sources, estimating a loss of 62 kg per turbine annually. This study builds on the work of Pugh and Stack (2021), who conducted erosion testing on epoxy-glass composite samples using a whirling arm rain erosion test rig, revealing up to 0.199 % mass loss depending on the accumulated rain. Solberg et al. (2021) mistakenly applied this same percentage, which was derived from a few millimeter samples, to an entire blade (weighing several tons). Consequently, this leads to a disproportionate overestimation of total LEE and the resulting microplastic formation.
Hof et al. (2023)NORWEA (2021)Viane (2022)Solberg et al. (2021)Table 1Current estimates of microplastic formation due to leading edge erosion from wind turbine blades. The estimation by Solberg et al. (2021) is based on evident methodological errors.
The present study aims to tackle the knowledge gap regarding microplastic emissions from wind turbines by employing state-of-the-art LEE assessment methodologies. The specific goal of this work is to evaluate microplastic emissions resulting from LEE of offshore wind turbine blades, including those with LEP systems. Using estimates from a representative modern offshore wind turbine, we aim to calculate the total microplastic emissions from all turbines currently installed in the Dutch North Sea and project these emissions through 2050. The formation of microplastics during installation, maintenance, deconstruction, or from other wind turbine components, such as the foundation or cable degradation, is beyond the scope of this study.
Recently measured rain and wind speed offshore data are combined with a fatigue-based erosion model to estimate the accumulated damage and erosion depth of a representative offshore wind turbine. Detailed information on the weather measurements and erosion model can be found in the Methods section of this paper. As reported in the result section, the estimated microplastic formation from the reference wind turbine is used to evaluate the contribution of wind turbine blades to the total microplastic emissions in the Netherlands.
2.1 Weather measurements
Measured offshore weather data supported this work by providing input to the erosion model. Rain measurements provided information on the number and size of droplets, as well as their fall velocity, while wind speed was correlated with rotor speed, dictating the impact speed between raindrops and blades. Concurrent measurements of rain and wind at the Dutch North Sea are scarce. The only available source of measurements is provided by TNO (Caboni et al., 2024) for a relatively short period. More specifically, over a period of 1 year, from March 2022 to March 2023, TNO carried out concurrent rainfall and wind speed measurements at the offshore Lichteiland Goeree (LEG) platform. Figure 1 depicts the exact location of the platform. Rainfall measurements were carried out by means of an OTT Parsivel2 disdrometer. Wind speed was measured by means of a Leosphere WindCube V2 lidar. Since the current investigation focuses only on rain-induced erosion, measured events with snow and hail have been filtered out, retaining just rainy intervals. Hailstones, being larger, heavier, and harder than raindrops, can cause delamination, indentations, and surface cracking depending on their size and falling velocity (Verma et al., 2023). The impact of hailstones on blade erosion in the North Sea is not yet fully understood, so this topic has been excluded from the scope of this work. In 2022, the average wind speed at 140 m above sea level at LEG was 9.3 m s−1, which is slightly lower than the 2015–2022 average of 9.9 m s−1 (Vitulli et al., 2023). 2022 was a relatively dry year in the Netherlands, with a national average rainfall of 729 mm (KNMI, 2022). Typically, the country's average annual rainfall is 795 mm.
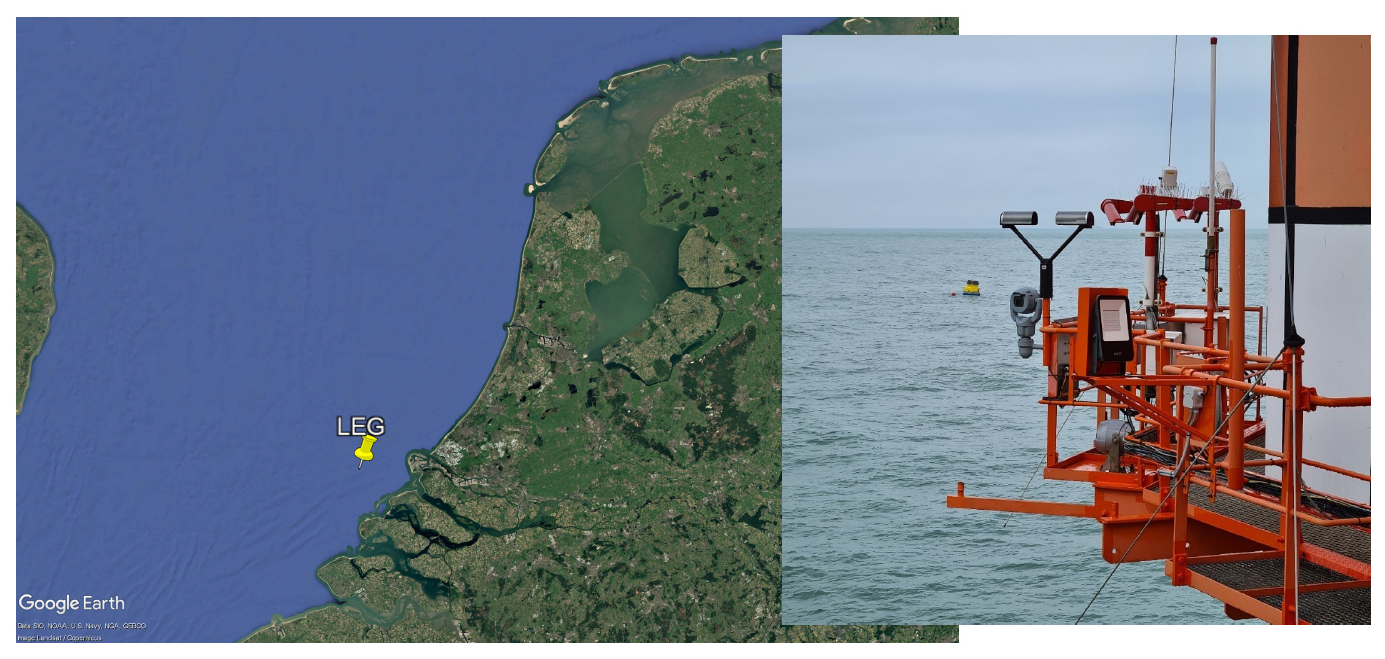
Figure 1A map showing the location of the Lichteiland Goeree (LEG) platform, where concurrent rain and wind speed measurements were conducted (Caboni et al., 2024), and a picture of the OTT Parsivel2 disdrometer installed on the platform are shown. Map courtesy of © Google Earth.
2.2 Erosion model
2.2.1 Leading edge erosion modeling
The LEE process is influenced by the fatigue properties of the blade LEP systems and the size and number of droplets impacting the surface at a given speed. Wear particle emissions from the leading edge begin once the incubation period is complete. Figure 2 illustrates a schematic of erosion depth over time during a droplet erosion test, performed under specific impact conditions such as drop size, impact velocity, and volume concentration. The figure indicates the incubation period and erosion rate. Methods for accurately calculating the incubation periods and erosion rates of currently applied LEP systems, including the effects of drop size, are limited. The available models are Slot's physical- and fatigue-based model for the droplet impingement erosion incubation period (Slot, 2021; Slot et al., 2015); Springer's semi-empirical, fatigue-based model (Springer, 1976); and the “ASTM – multiple linear regression fit equations” derived from a round robin test program, as detailed in Heymann's work (Heymann, 1979, 1970). Both Slot's and Springer's models necessitate the material and fatigue properties of the LEP system in use. However, these properties are rarely available or easily determined for most current LEP systems. Consequently, this study estimates the incubation period and erosion rate using the ASTM – multiple linear regression fit equations, incorporating a modified drop size dependence.
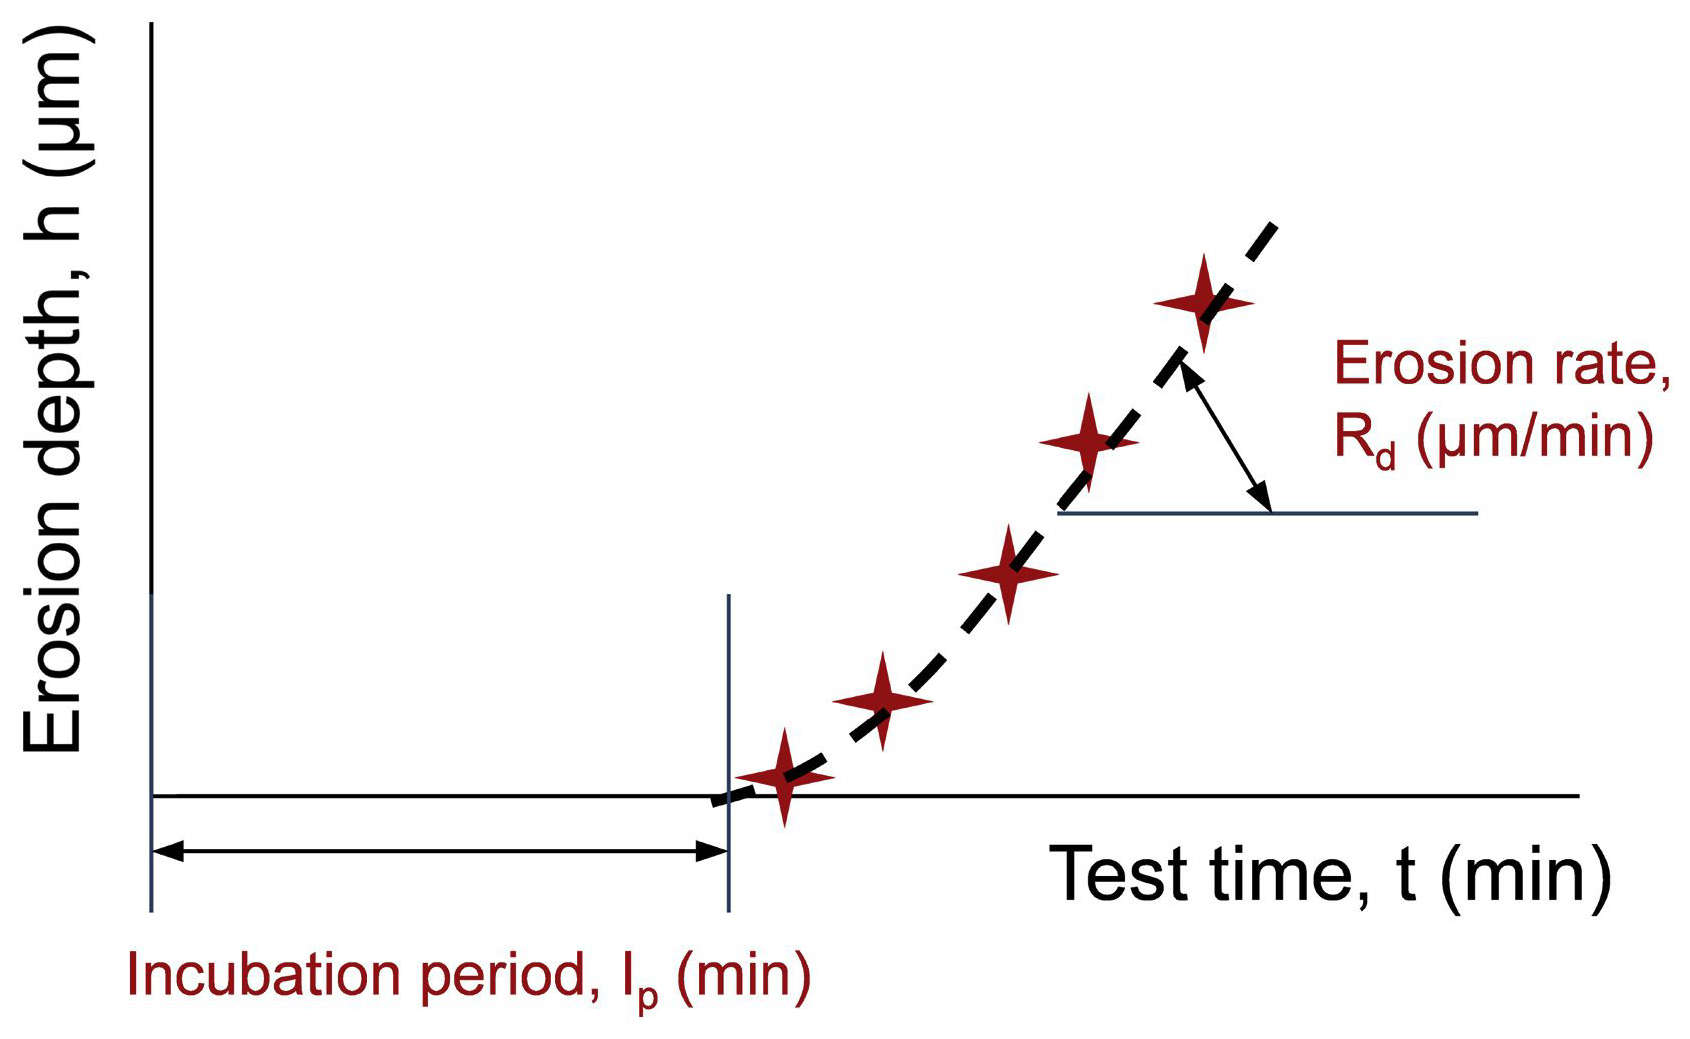
Figure 2The figure illustrates the leading edge erosion process, showing a schematic of erosion depth over time during a droplet erosion test. Figure reproduced from Slot et al. (2015).
2.2.2 Incubation period
The ASTM – multiple linear regression fit equations were developed from a comprehensive round robin test program organized by the American Society for Testing and Materials (ASTM). Heymann (1979) developed these equations to estimate the incubation period, with each tested material characterized by its normalized incubation resistance number (NOR). Stainless steel AISI 316 was selected as the reference material, assigned a NOR value of 1. Heymann's work suggests that, under reference conditions, the volume of impinged water per unit surface area (m3 m−2) during the incubation period can be estimated as follows:
where Vref represents the reference impact speed (100 m s−1) and Dref denotes the reference drop diameter (1.8 mm). The ratio of the volume of water (per unit surface area) during incubation at the actual drop diameter to that at the reference drop diameter is given by
The volume of water per unit surface, impinged over the blade at a velocity of Vk and drop diameter Di during incubation, is
The number of impacts per unit surface (m−2), at a velocity of Vk, between blade and drops having a diameter of Di during incubation is
where Voli is the volume of a raindrop with diameter Di:
The measured drop diameters, in the aforementioned campaign at LEG, varied from approximately 0.5 to 9 mm. Within this range, none of the currently available erosion models accurately account for the effect of different drop sizes on the incubation period. Even the widely used Springer's model (Springer et al., 1974), along with derived models such as the Det Norske Veritas (DNV) model reported in DNVGL-RP-0573, does not account for the effect of drop size on the incubation period. Instead, it uses the drop diameter to determine the number of impacting drops on a given area. When evaluating the drop size effect, the authors of this paper observed opposite trends between experiments and Springer's model. Heymann's model considers the effect of drop size, but it is not reliable for relatively small droplets, as these were not included in the aforementioned ASTM test program. To address this, we utilized data from the literature to enhance Heymann's model. Schmitt (1968), Seleznev et al. (2010), Krzyzanowski and Szprengiel (1978), Weigle and Szprengiel (1985), and Bech et al. (2022) reported erosion results from drop impacts on metals, rubber, and elastomers for drop sizes ranging from 0.1 to 3.5 mm and impact velocities from 100 to 224 m s−1. Based on these test results, the best representation of the drop size effect was found to be a power of 1.5, as shown in Eq. (2).
2.2.3 Maximum erosion rate
Heymann also developed multiple linear regression fit equations for the erosion rate (Heymann, 1979), where each tested material is characterized by its normalized erosion resistance number (NER). Stainless steel AISI 316 was selected as the reference for this resistance number (NER=1). The derived equation for the maximum erosion rate (REk) is
where REk is defined as the erosion depth (m) divided by the volume of impinged water on a certain area (m3 m−2). In Heymann's regression equations the drop size is not included and seems to have a minor effect on the erosion rate. NER and NOR values have been determined in this ASTM program for each of the materials tested (Heymann, 1979). The relation between the NOR and NER values derived for these metals and elastomers is given by
Combining Eq. (6) with Eq. (7) gives the maximum erosion rate as follows:
This equation was employed to estimate the local erosion rate after the incubation period. For cases of non-perpendicular drop impacts, the normal velocity component to the surface should be used. Given the erosion rate, the erosion depth can be calculated as
where nijk represents the number of impacts per unit area during an observation interval that a blade section encounters while rotating with a tangential velocity of TSk, involving drops of diameter class i and drop fall velocity class j. During the LEG campaign, rain and wind observations were recorded at 10 min intervals. Assuming the drops are evenly distributed in space, nijk can be expressed as
Assuming linear damage accumulation (Springer, 1976), the Palmgren–Miner rule was applied to account for the cumulative effects of varying rain and wind speed conditions on the accumulated damage as follows:
where F represents the cumulative damage, starting at zero at the beginning of the erosion process and reaching 1 by the end of the incubation period. Following the incubation period, the erosion depth is also calculated cumulatively using the Palmgren–Miner rule as follows:
In this study, we calculated F and ED by summing the contributions from each 10 min interval of measured rain and wind speed.
2.2.4 LEE properties of currently applied LEP systems
A literature study was conducted on recently tested LEP systems in the rotating arm rain erosion tester (RET) setup to determine the NOR value of currently applied systems on wind turbine blades. The RET method, as detailed in DNV-RP-0171 (2008) (DNV, 2021), demonstrates the highest accuracy and reliability when compared to real rain conditions. Figure 3 illustrates an example of a specimen both at the initial stage and after prolonged exposure in the rotating arm test. For example, Fig. 4 collects the results of regular inspections of the specimen surface at intervals during a rain erosion test conducted on a Teknos' LEP system. The graph correlates the number of drop impacts at a specific specimen location, thus characterized by a certain tangential velocity, that lead to the end of incubation, defined as the onset of material loss (see Fig. 2). The graph illustrates that as the local velocity decreases, the incubation period, measured by the number of drop impacts, increases. The local drop impact velocity is considered equal to the local specimen tangential velocity. Depending on the type of LEP system sometimes large scatters in obtained data points have been observed. The best fit using a power function for these data points gives the relation between the incubation period and drop impact velocity resulting in the fit constants exponent m (–) and a constant C (m s−1) (see Eq. 13).
For each LEP system or material documented in the literature, within the present work we established graphs and best-fit functions. The incubation period, expressed as the volume of water per unit area at a velocity of 100 m−1, is determined as follows:
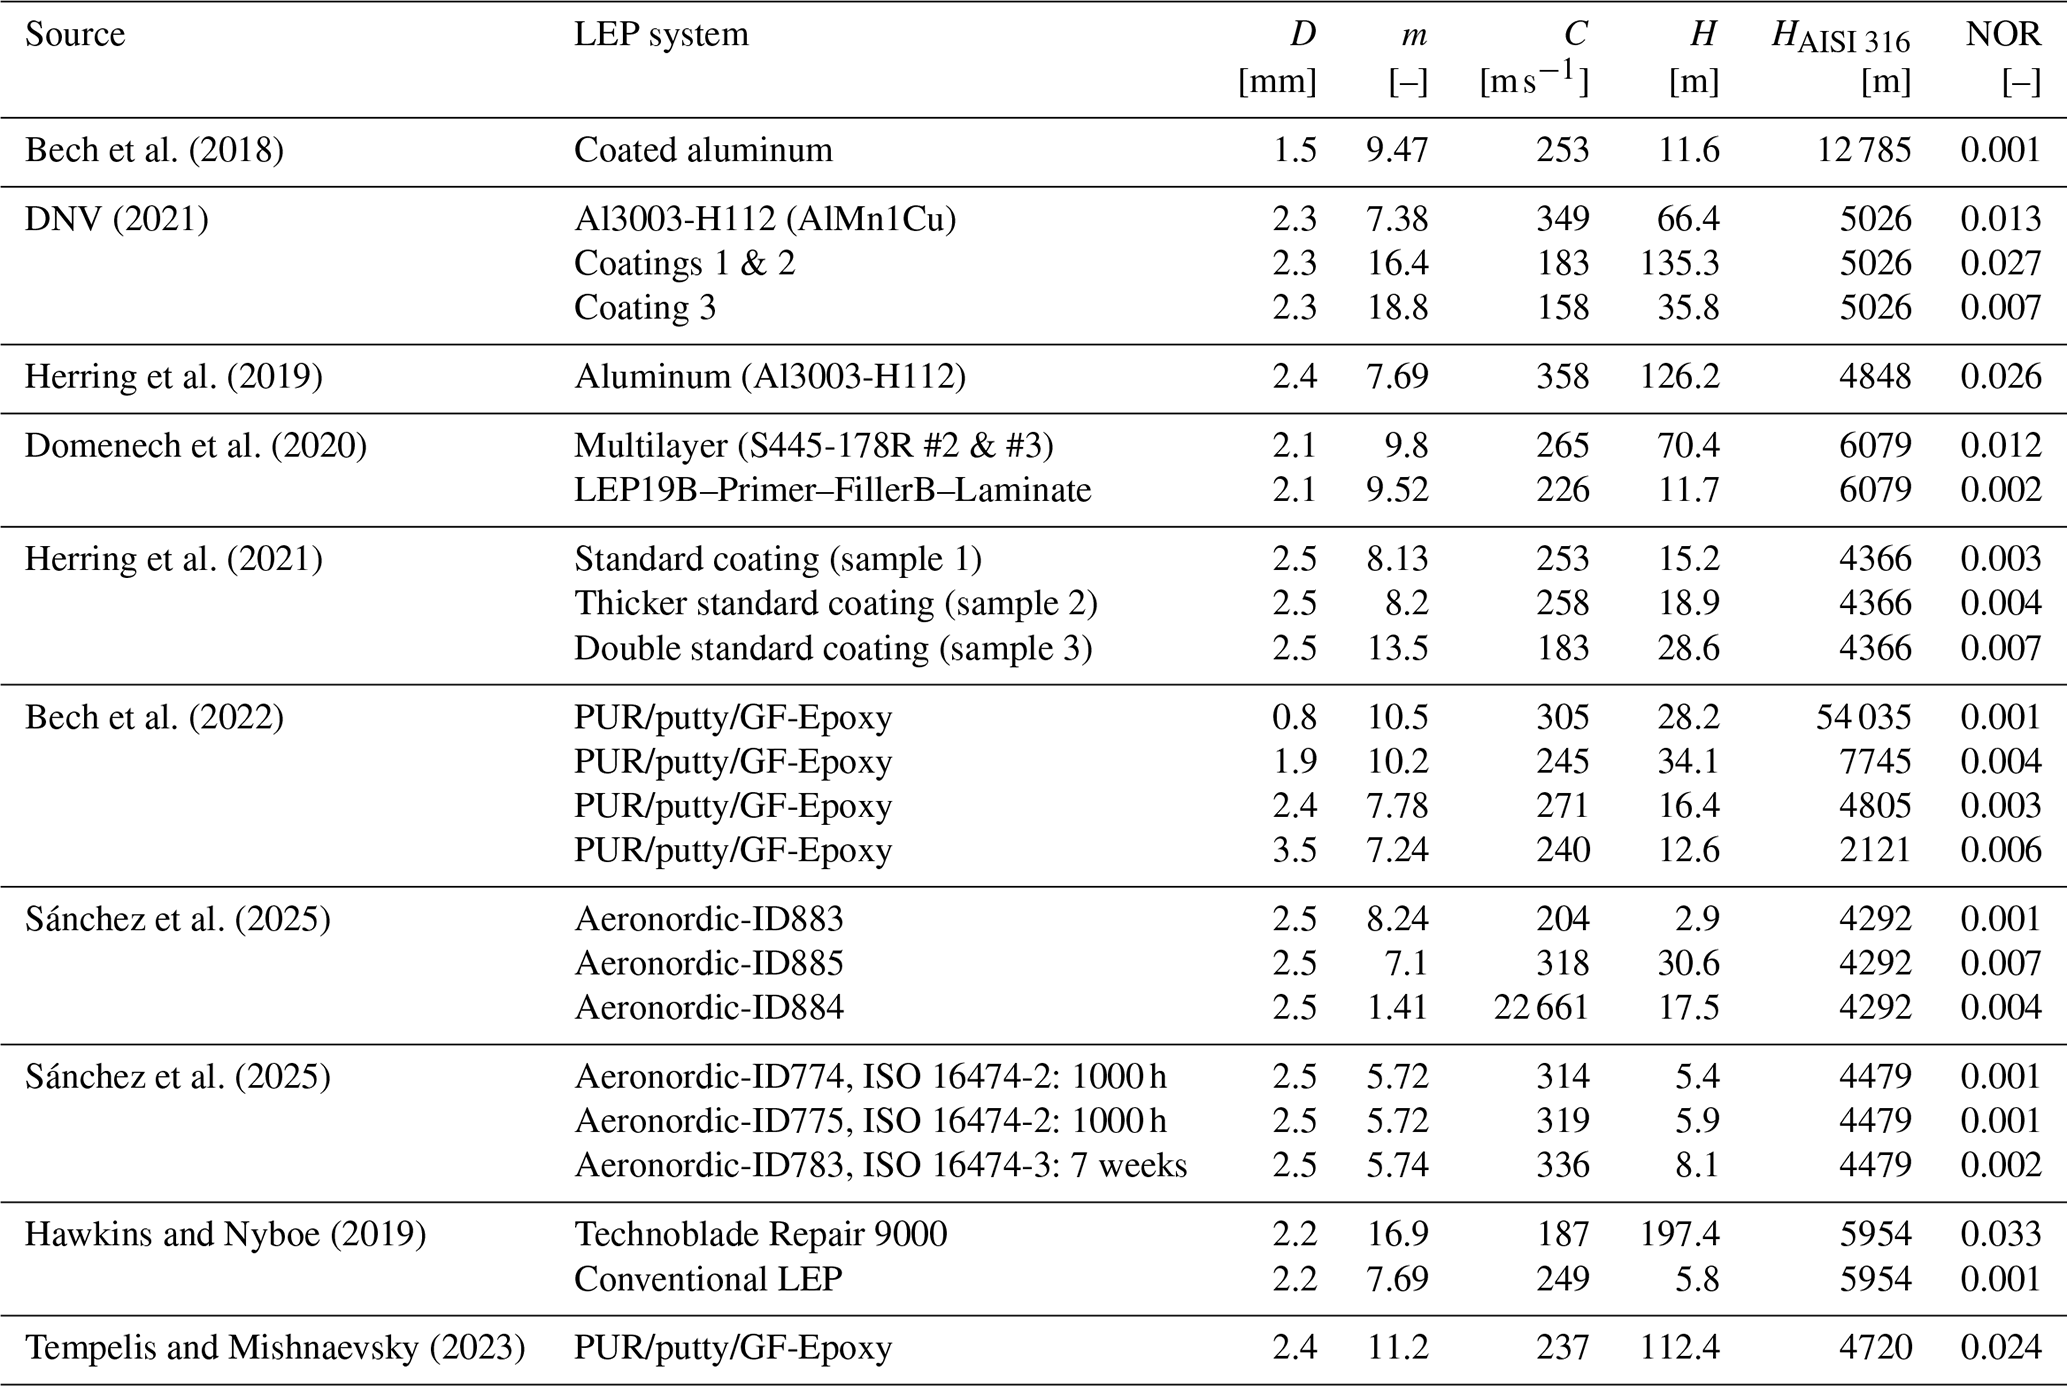
where D is the drop diameter. The value of H is then compared to the incubation period of stainless steel AISI 316 at the same drop impact velocity to determine the NOR value of the tested LEP system. The results of this literature inventory are shown in Table 2. For each LEP system, Table 2 depicts the tested mean drop size, D; the exponent m; and constant C according to Eq. (13). It is noted that the exponent m of these polymeric-based LEP systems shows a large scatter, and it varies between 5.7 and 18.8 with a mean of 9.5 and a coefficient of variation of 0.45. Table 2 also shows the incubation period at an impact speed of 100 m s−1 of the given LEP system, H, and the stainless steel AISI 316, HAISI 316. HAISI 316 is determined through Eq. (1), while H is determined through Eq. (14). The last column of Table 2 gives the resulting NOR value of the LEP system. The NOR values of the tested LEP systems vary between 0.001 and 0.033, and most systems have a value below 0.010. For four polymer-based LEP systems, the NOR value is above 0.010 and for only two systems, it is around 0.030 (note that higher NOR numbers indicate better fatigue properties.).
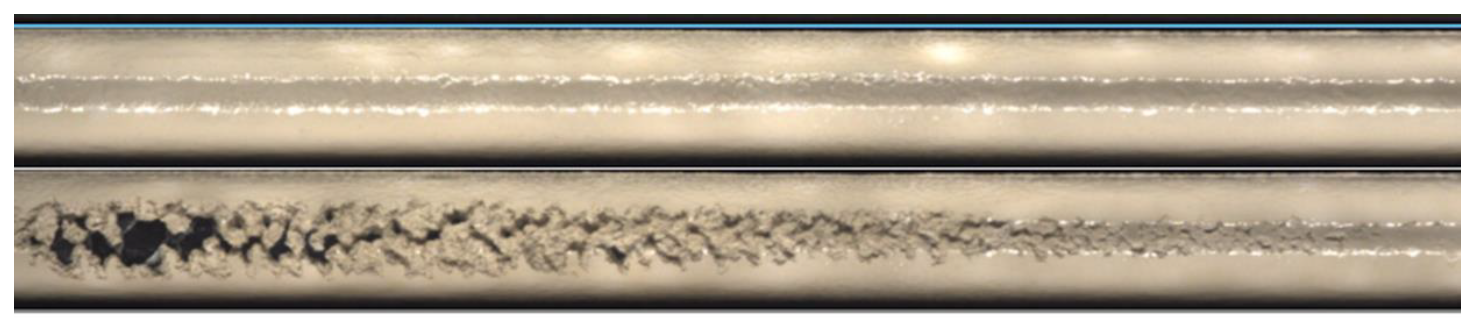
Figure 3Examples of an initial and a tested specimen in the rotating arm tester. This figure is adapted from Hawkins and Nyboe (2019).
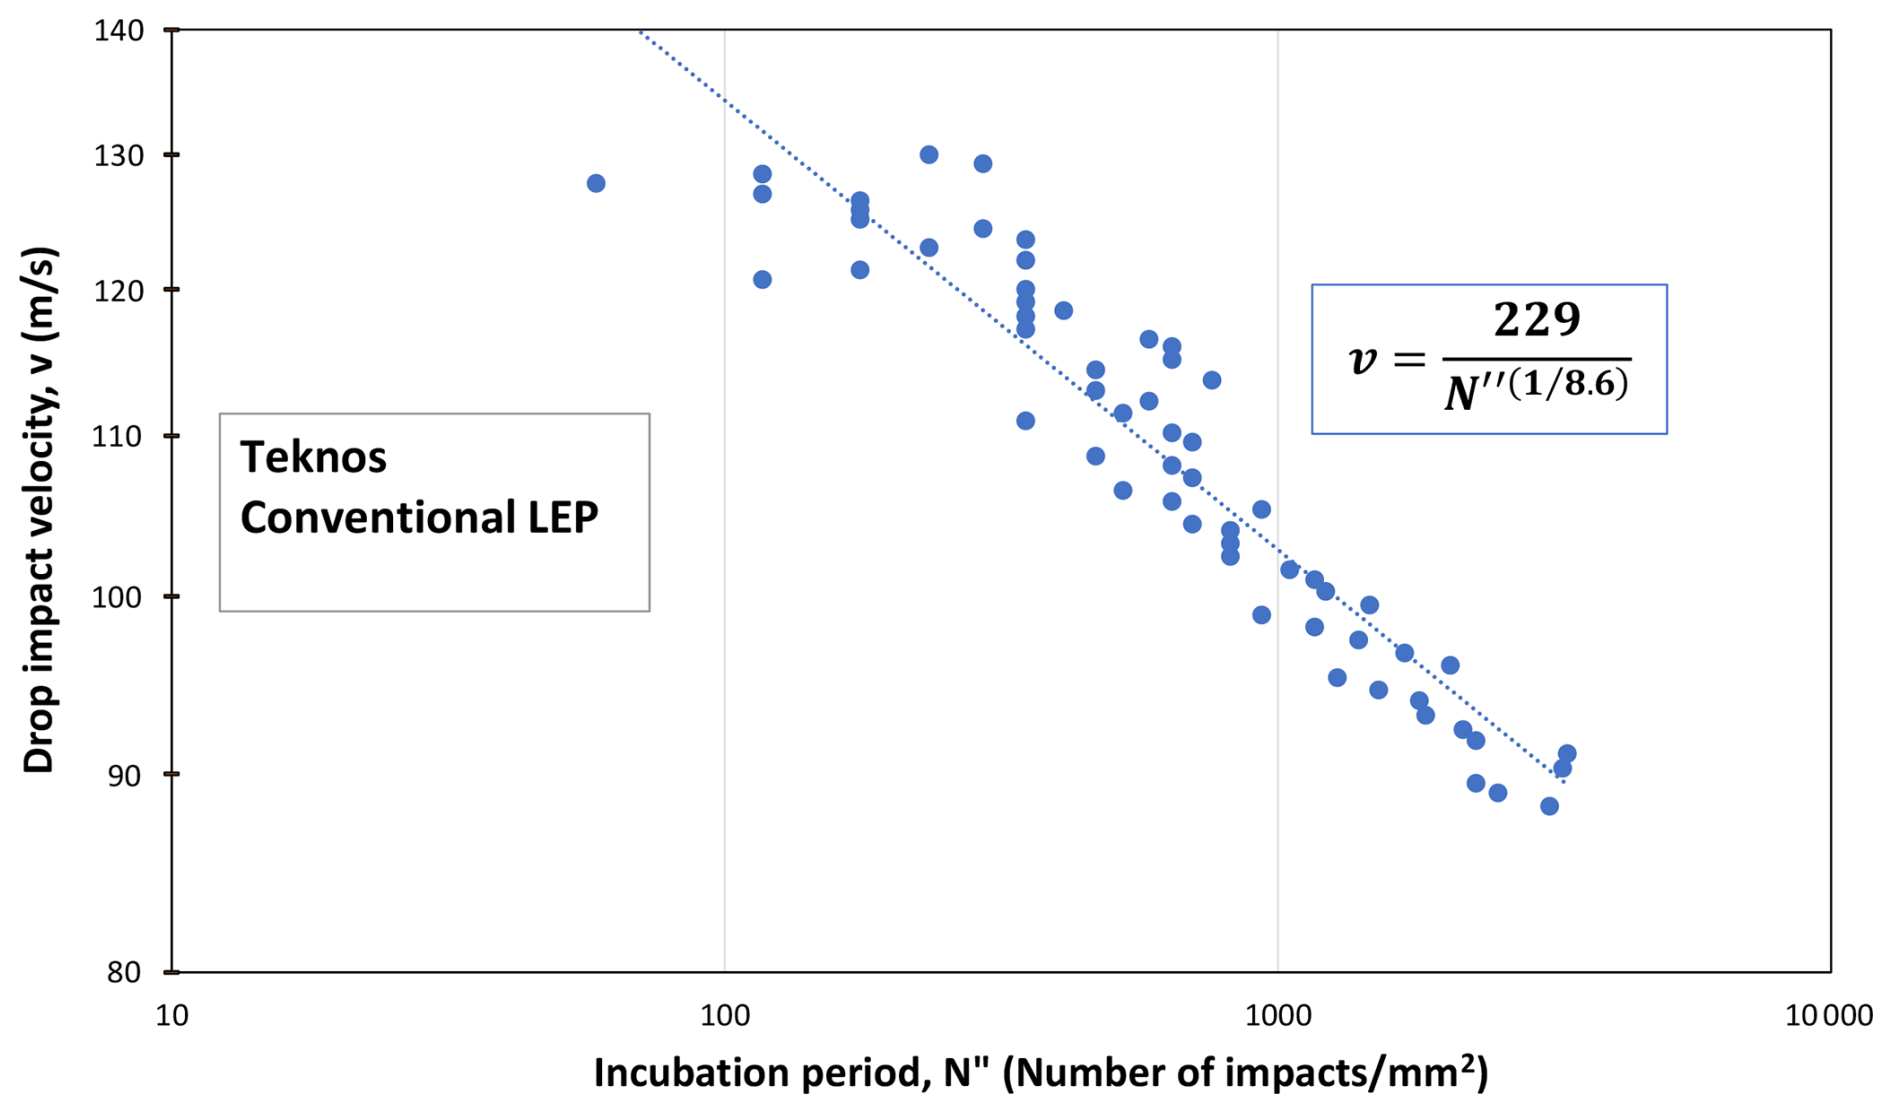
Figure 4The results of periodic inspections of the specimen surface during a rain erosion test on Teknos' LEP system are presented. The fitting equation is displayed.
Table 2Summary of rotating arm erosion tests (RETs) with LEP systems found in literature. The data in this table were calculated by the authors of this study based on underlying results found in the literature.
When interfaces and/or defects are present in the coating system, the incubation period can be shortened by fatigue initiating of subsurface cracks. Also, polymer degradation processes like aging by ultraviolet radiation (UV) can result in reduction of the incubation period by embrittlement of the exposed LEP system. Especially epoxy has a low resistance to UV degradation and must be shielded from UV radiation by application of a PU top coating (Sánchez et al., 2025). Currently, more research is needed to understand and quantify the effect of UV on blade degradation. Therefore, this study does not account for UV-related degradation.
2.3 Assessment of erosion levels on the leading edge of wind turbines
The erosion rate of wind turbine blades due to rain is influenced by rain conditions (such as amount and drop size distribution), the resistance of the LEP system, and the impact speed between raindrops and blades. As previously mentioned, LEE is driven by the component of the relative velocity between raindrops and the blade surface that is normal to the surface. The impact speed is primarily determined by the blade's tangential velocity. Outboard sections, which have greater tangential velocities than inboard sections, erode faster. Additionally, at a given radial location (characterized by a specific tangential velocity), the aerodynamic curvature of the blade profiles causes different elements along the leading edge to experience varying normal impact speeds. Consequently, the normal component of the impact speed varies both chord-wise (along the profile shape) and span-wise (at different radii). To determine the erosion rate along the blade, we divided the blade surface into several chord-wise and span-wise elements. For each of these elements, we calculated the accumulated damage and erosion rate using the normal component of the local impact velocity.
The first challenge is determining the relative velocity between raindrops and the blade. Given the complexity of obtaining precise estimates of this parameter, certain assumptions were necessary. As mentioned earlier, the relative velocity between raindrops and the blade is primarily influenced by the blade's tangential velocity. However, the terminal velocity of the droplets (which is equal to around 6 m s−1 for a 2 mm droplet) and aerodynamic effects also play a role (Barfknecht and von Terzi, 2024). Small droplets are expected to be completely advected by the wind, whereas larger, heavier droplets experience less advection. Using a numerical methodology, Gires et al. (2022) estimated that rain droplets exceeding 0.6 mm in size experience minimal advection in a turbulent wind field. For simplicity, we assumed that the terminal velocity of the droplets and aerodynamic effects, including advection, are negligible compared to the blade's tangential velocity. In other words, we assumed that raindrops remain stationary in space from an absolute reference frame. Under these assumptions, the relative velocity between raindrops and a blade section is equal to the tangential velocity of that blade section. The tangential velocity, Ωr, is aligned with the rotor plane, as illustrated in Fig. 5. Due to the curved shape of the blade profiles, each section around the leading edge encounters the drops at different normal speeds, Vk. We discretized the shape of each blade profile into very small straight elements and calculated the normal component of the tangential velocity for each element, as shown in Fig. 5. This component was then used to assess the erosion amount from each element.
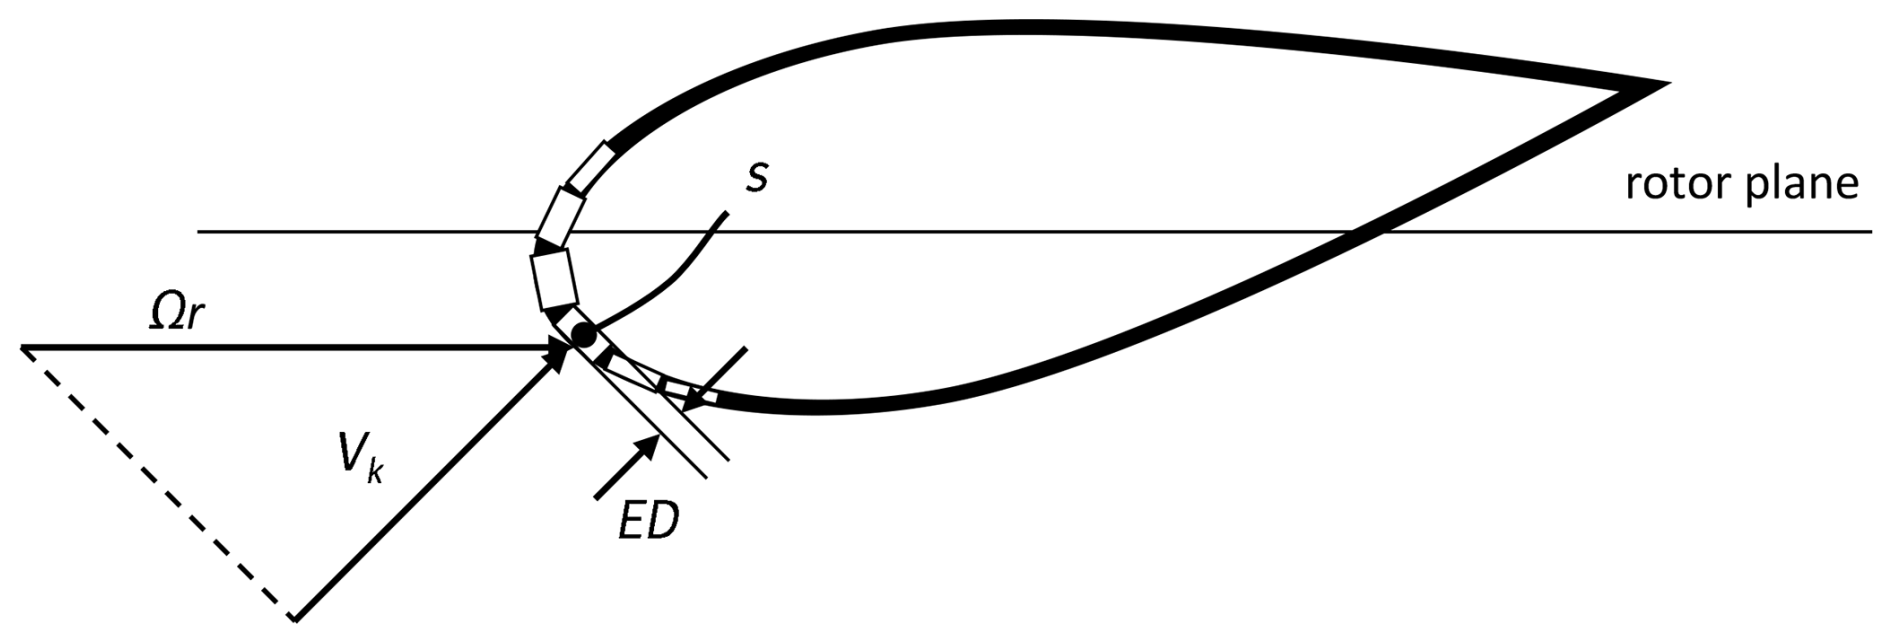
Figure 5A sketch illustrating the parameters used to evaluate the erosion depth of a generic chord-wise element. Ωr represents the assumed relative velocity between the raindrop and the blade section, where Ω is the rotor's angular velocity and r is the radial distance of the section from the rotor center. Vk is the component of Ωr normal to the surface element. ED and s denote the eroded depth and eroded surface area of the generic element, respectively.
2.4 Microplastic emission comparison
The microplastic emissions estimate from the reference offshore wind turbine that results from our assessment (reported below) was extrapolated to determine the total microplastic emissions from all wind turbines installed in the Dutch North Sea. Information on the current and future (until 2050) wind energy assets in the Netherlands, including the number, capacity, specifications, and operation period of wind turbines, was collected from the Global Offshore Wind Farms Database (4C-Offshore, 2024) and through communications with stakeholders and the Netherlands Enterprise Agency (Rijksdienst voor Ondernemend Nederland, RVO). Using the wind turbine types as provided by the Global Offshore Wind Farms Database, blade length and rotor diameter were obtained from producers' websites. For future projects where wind turbine type was not yet known, a linear correlation was tested between capacity of the turbine and blade length (Pearsons' correlation test = 0.973). A linear trend line was used to assess the blade length of the unknown wind turbines using Microsoft Excel (v.2402). To assess total microplastic formation and emissions from the offshore turbines in the Dutch North Sea, the emissions from the reference turbine (i.e., IEA 15 MW Reference Wind Turbine, Gaertner et al., 2020) were linearly scaled with blade length. In other words, if a turbine has blades that are half the length of those on the reference wind turbine, the length of the exposed area that generates microplastics is also halved. The dataset used for this extrapolation is available in the Supplement.
The resulting total annual microplastic emissions from wind turbine blades were compared to all other direct microplastic emission sources in the Netherlands. Using the existing material flow analysis (MFA) from Schwarz et al. (2023), direct microplastic and macroplastic losses in the Netherlands were mapped. This includes the following sectors: packaging, textiles, automotive, electronic equipment, building and construction, agriculture, primary cosmetic microplastics, and fishery. Micro- and macroplastic emissions are modeled to multiple environmental compartments, including ocean environments, roadside, and residential soil. Further information on model data and methodology can be found in Schwarz et al. (2023). In this assessment, several additions to the model were included compared to the published version. First of all, material flows for paints and varnishes are included as a microplastic source, with paint volume data collected from Kusumgar (2020), applying an average polymer mass of 37 % and transfer coefficients from Verschoor (2016). Secondly, microplastic losses from fishing nets were included and estimated at 1 % over the lifetime, similar to loss rates for other fiber-based products, which include textiles and clothing. Furthermore, environmental compartments were updated, aligned to the land cover and land cover change dataset from the Copernicus Institute (Haščič and Mackie, 2018; Copernicus Climate Change Service, 2019). This affects the type of environment in which microplastics end up when emitted to air or emitted to water.
3.1 Estimating microplastic release from the reference wind turbine blades
In this study, we estimated microplastic formation from the IEA 15 MW Reference Wind Turbine (Gaertner et al., 2020), which features 117 m long blades rotating at a maximum tangential velocity of 95 m s−1. We assumed that the blades of the IEA 15 MW Reference Wind Turbine use a polyurethane (PU)-based LEP system with a NOR value of 0.001 and thickness of 0.55 mm. This LEP was selected as it represents the worst-case scenario, having the lowest resistance characteristics among the LEP systems listed in Table 2. For each blade discretization element, we evaluated the accumulated damage and erosion depth using 1 year of concurrent rain and wind offshore measurements performed by Caboni et al. (2024). By calculating the reciprocal of the yearly accumulated damage we estimated the incubation period (assuming constant yearly rain and wind conditions). The eroded surface area shown in Fig. 5 is calculated by multiplying the erosion depth by the chord-wise length of each element. The eroded volume depicted in Fig. 6 is then calculated by multiplying the eroded surface area by the span-wise dimensions of the elements. The blade span was divided into 100 elements of equal span-wise length, while the profiles were discretized into approximately 200 elements, with finer resolution around the leading edge.
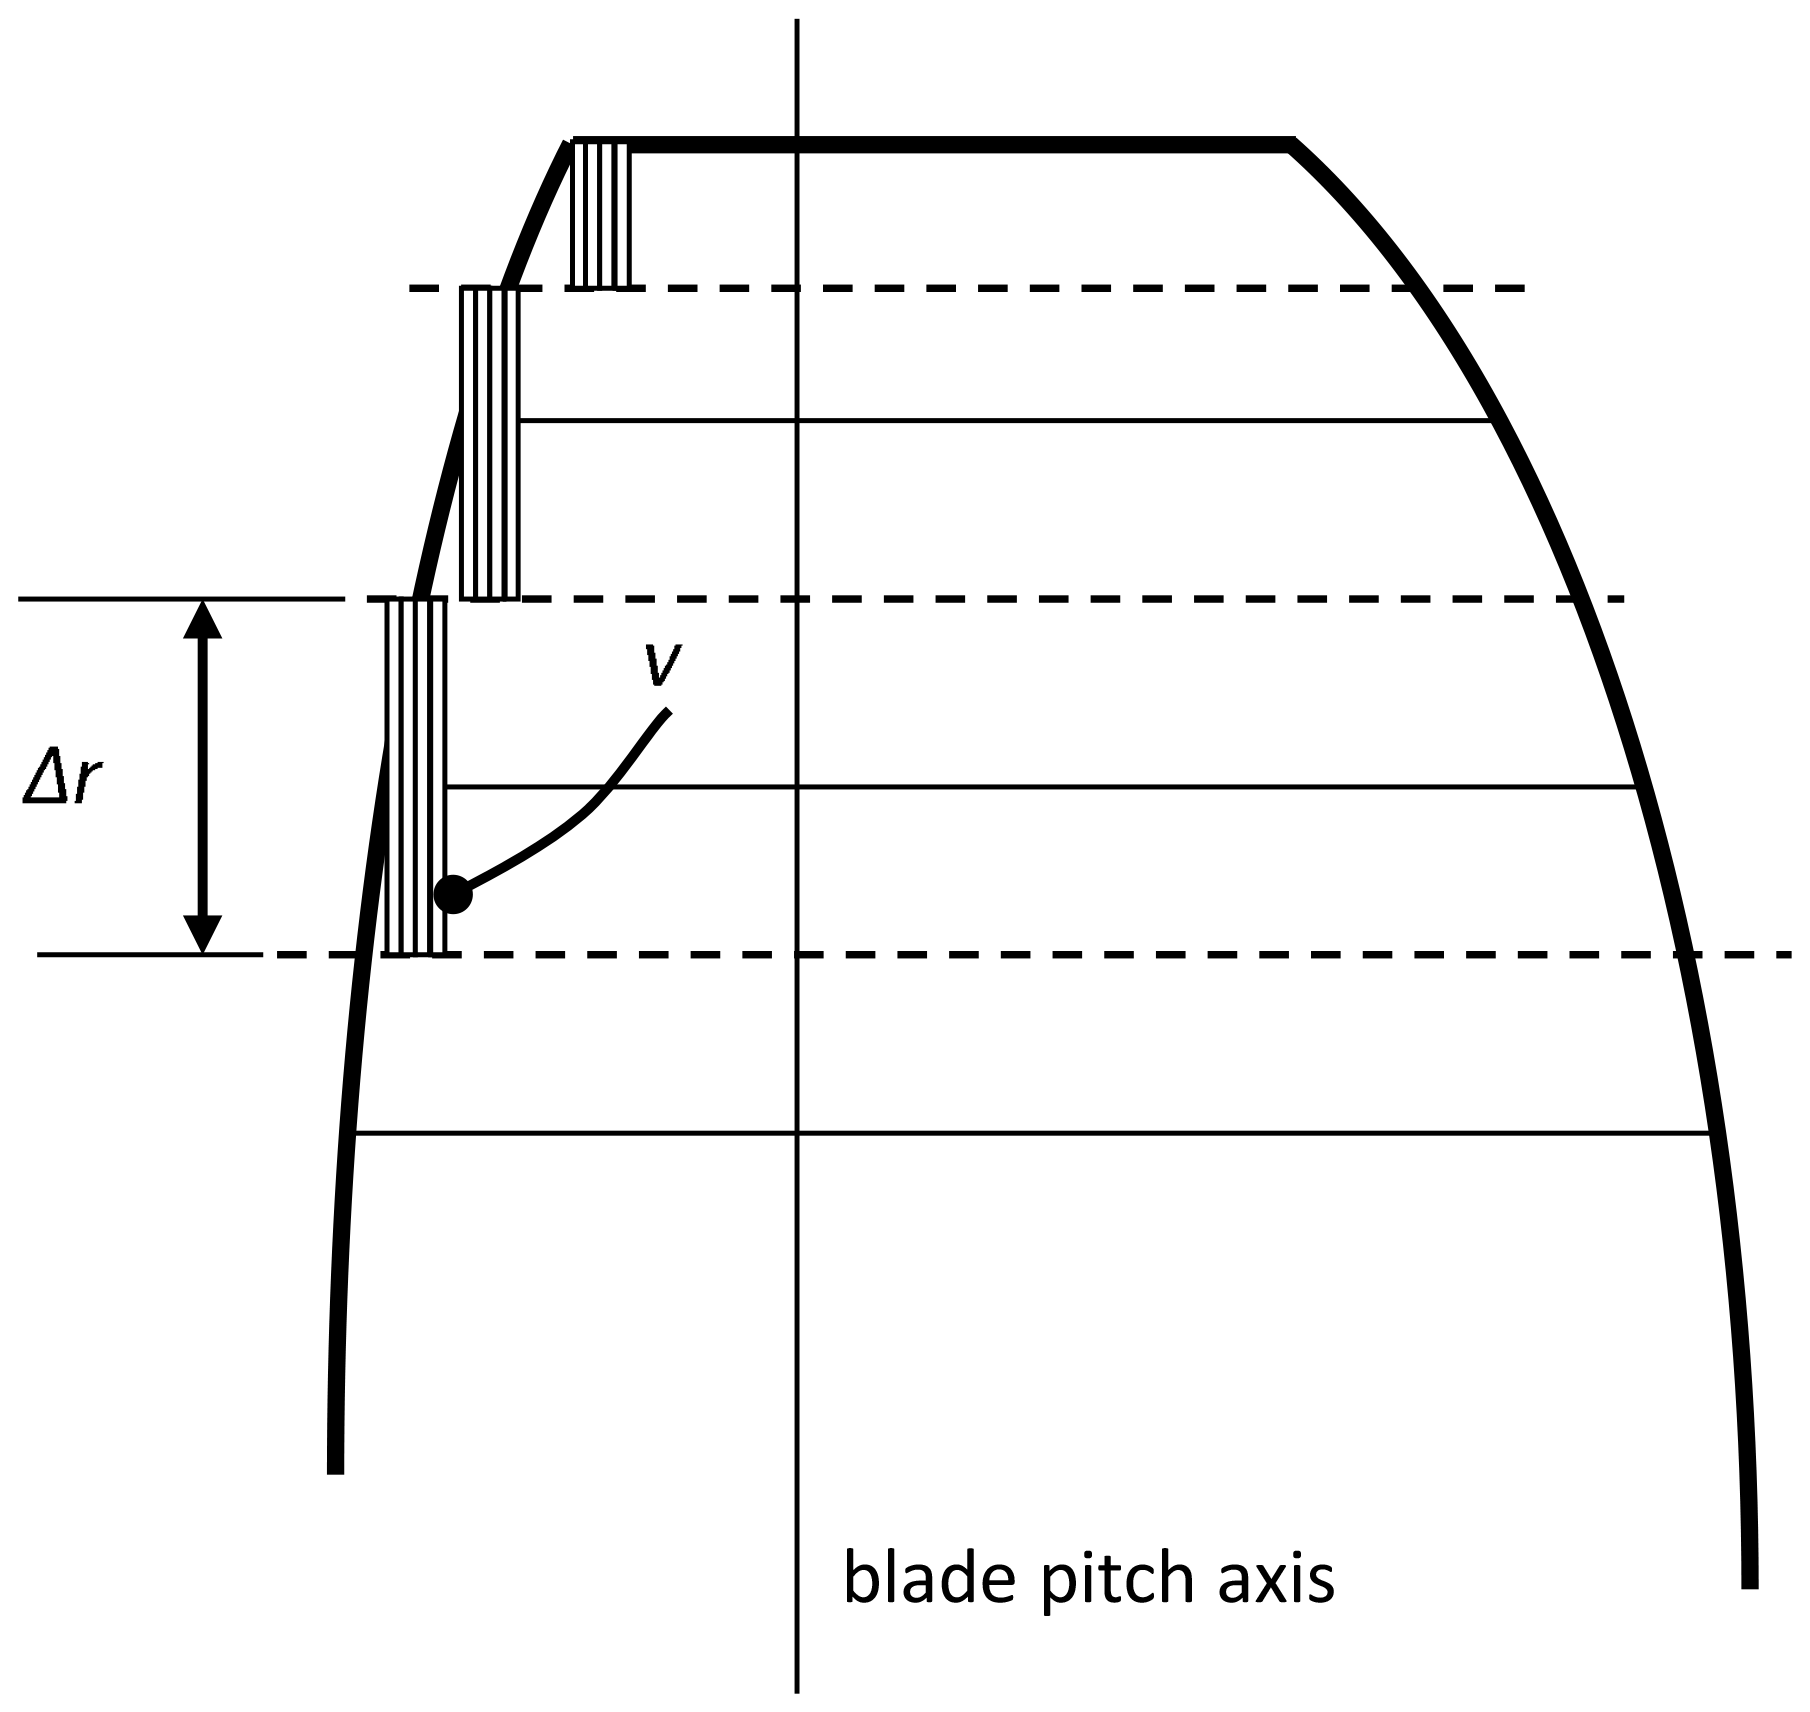
Figure 6A sketch illustrating the parameters used to evaluate the eroded volume of a generic span-wise element. Δr represents the span-wise dimension of a generic element, and v denotes the eroded volume from that element.
Figures 7 and 8 illustrate the leading edge discretization elements of the tip airfoil and an airfoil located at 75 % of the blade length from the root, respectively. For each element, the figures show the estimated incubation period and the yearly erosion depth using the aforementioned measured weather conditions. The erosion depth is expressed in millimeters of material removed per year. As expected, the erosion rate is greater around the leading edge, where the normal component of the relative velocity between the droplets and the blade is greater. As we move away from this zone towards the trailing edge, the erosion rate quickly decreases. For both profiles, the highest erosion rate is found on the upper surface. This is due to the section pitch angle (which is not shown in Figs. 7 and 8), rotating the profile counterclockwise and increasing the exposure of the upper section to droplet impact. This is also evident in Fig. 5, where the rotor plane, representing the direction of the relative velocity between the droplets and the blade, intersects the profile on the upper side. This finding aligns with Vimalakanthan et al. (2023), which presents a 3D profile obtained using an optical scanner of a commercial wind turbine (63 m long) blade near the tip. The scan reveals that erosion is predominantly concentrated on the upper surface. For confidentiality reasons, it was not possible to provide operational parameters of this section.
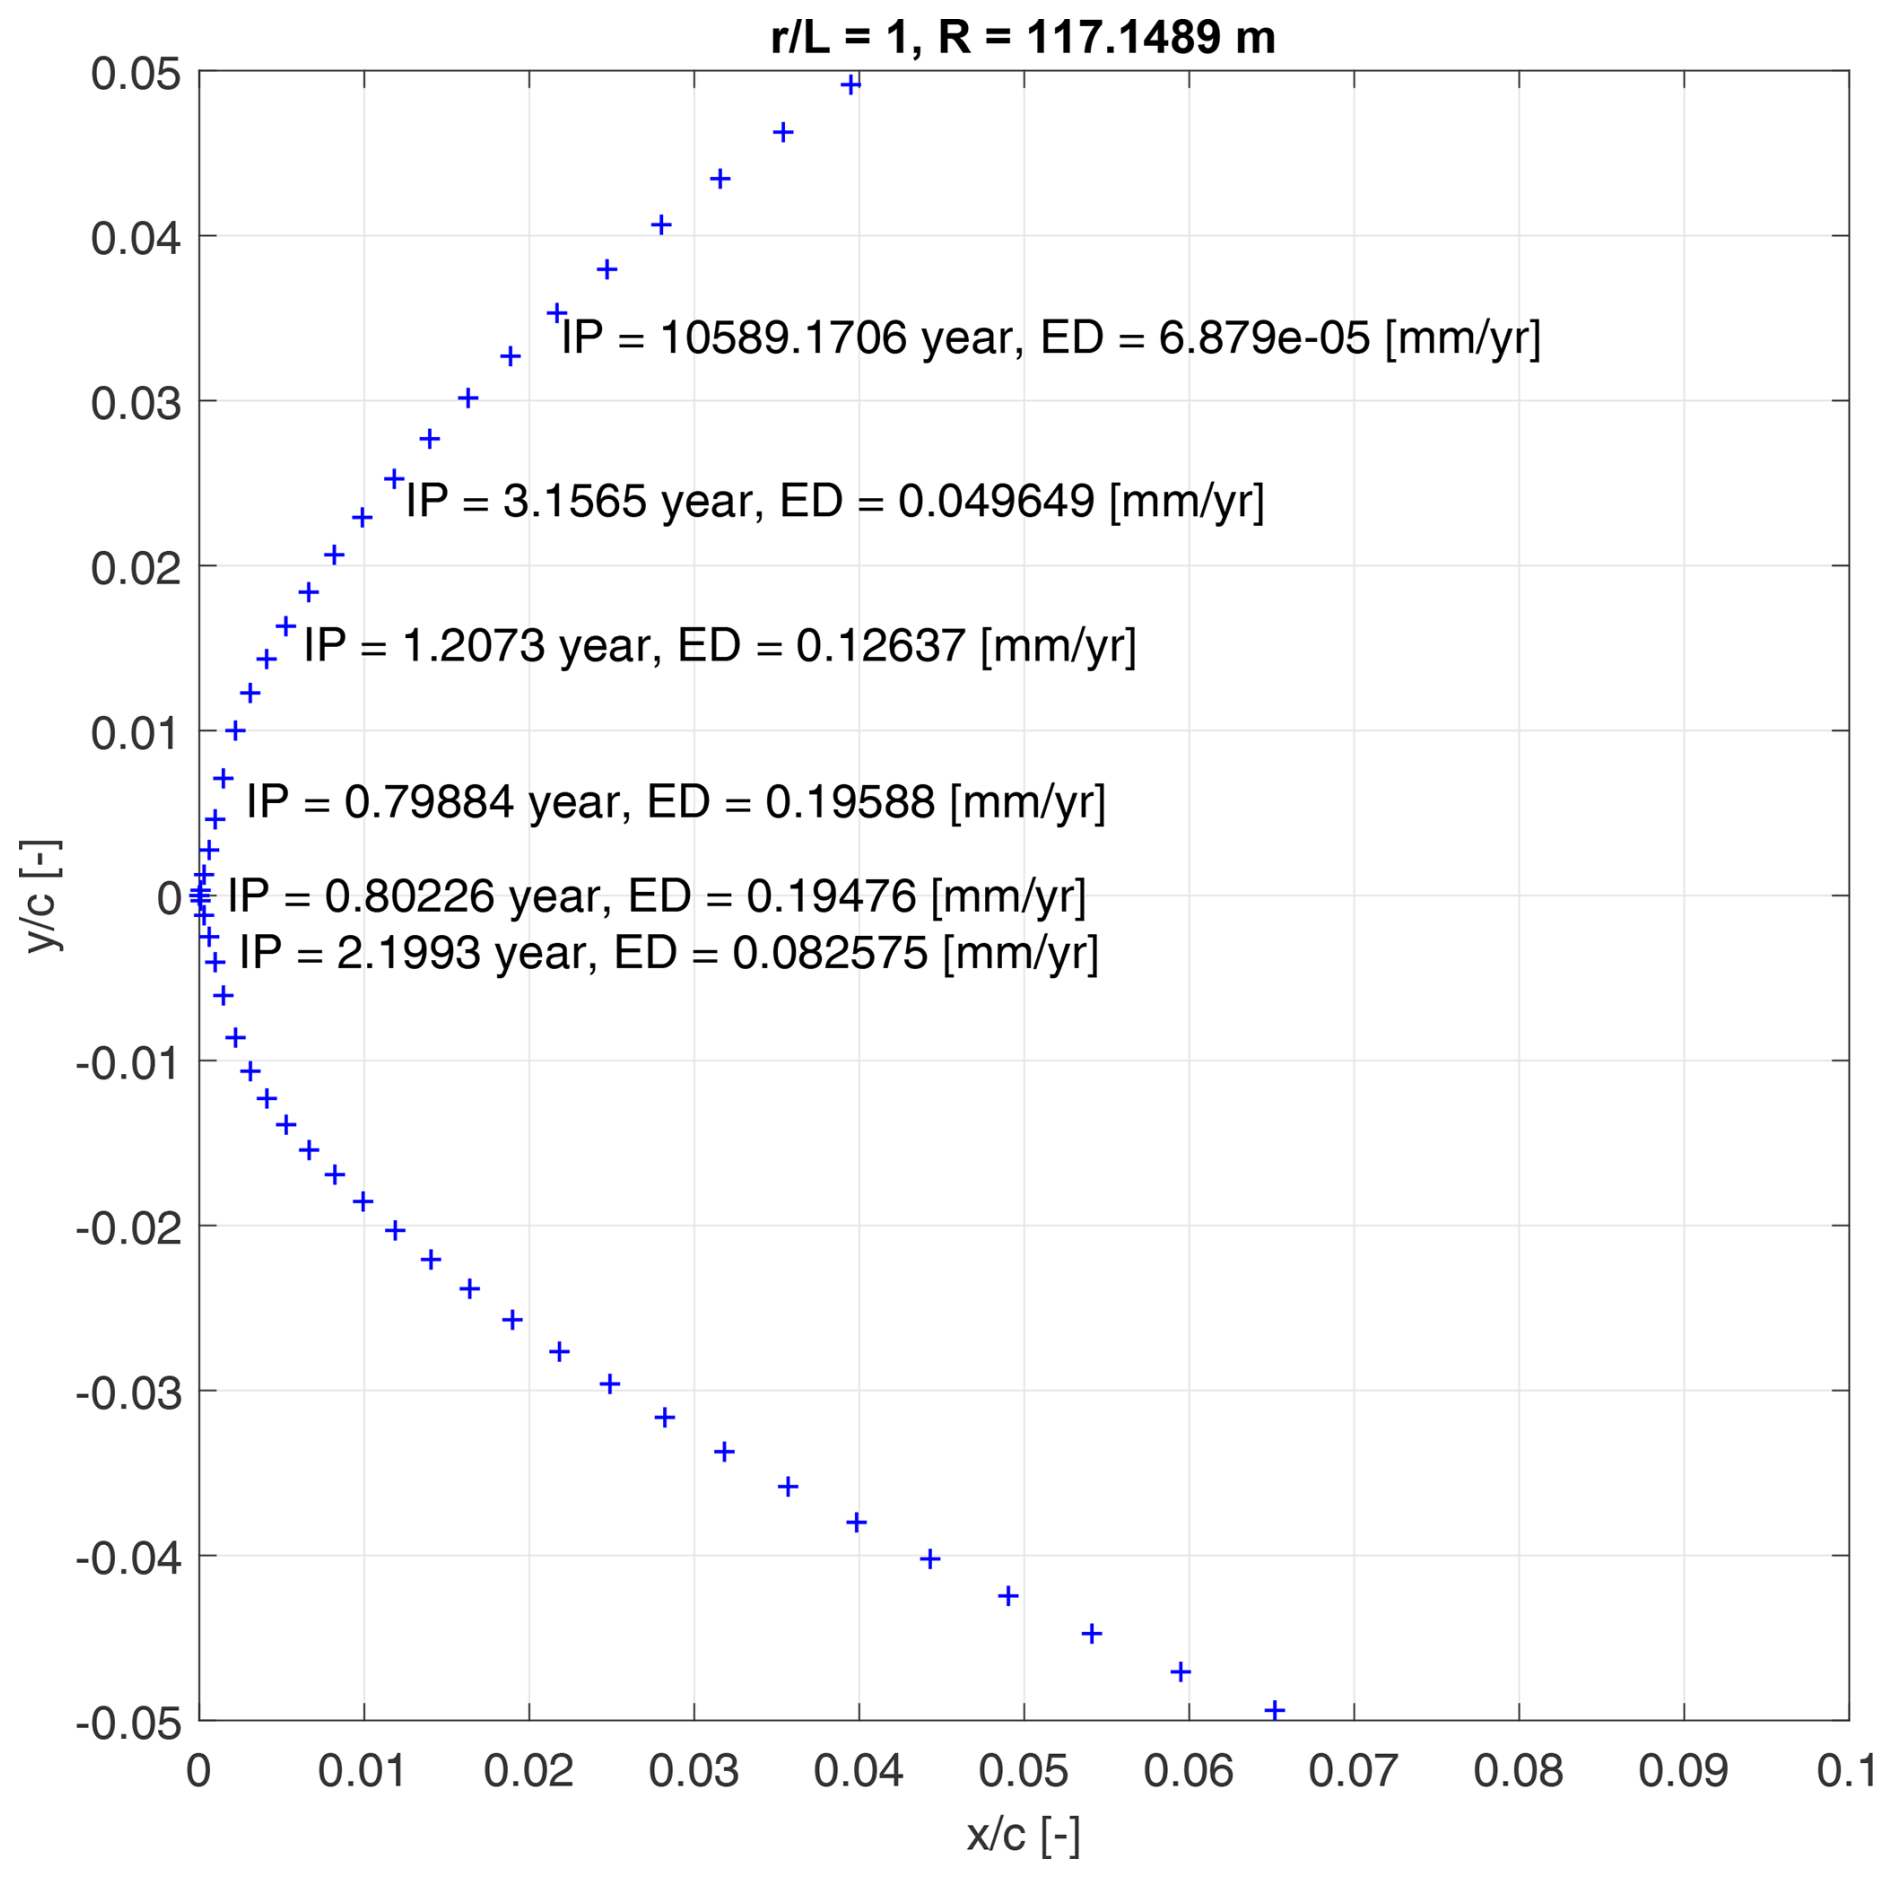
Figure 7The figure illustrates the discretization of chord-wise elements of the tip airfoil. For certain elements, the incubation period, IP, and the yearly accumulated erosion depth, ED, are shown. represents the relative position of the profile along the blade length, while R denotes the radial distance of the airfoil from the blade root. and are the airfoil coordinates, non-dimensional using the local chord length.
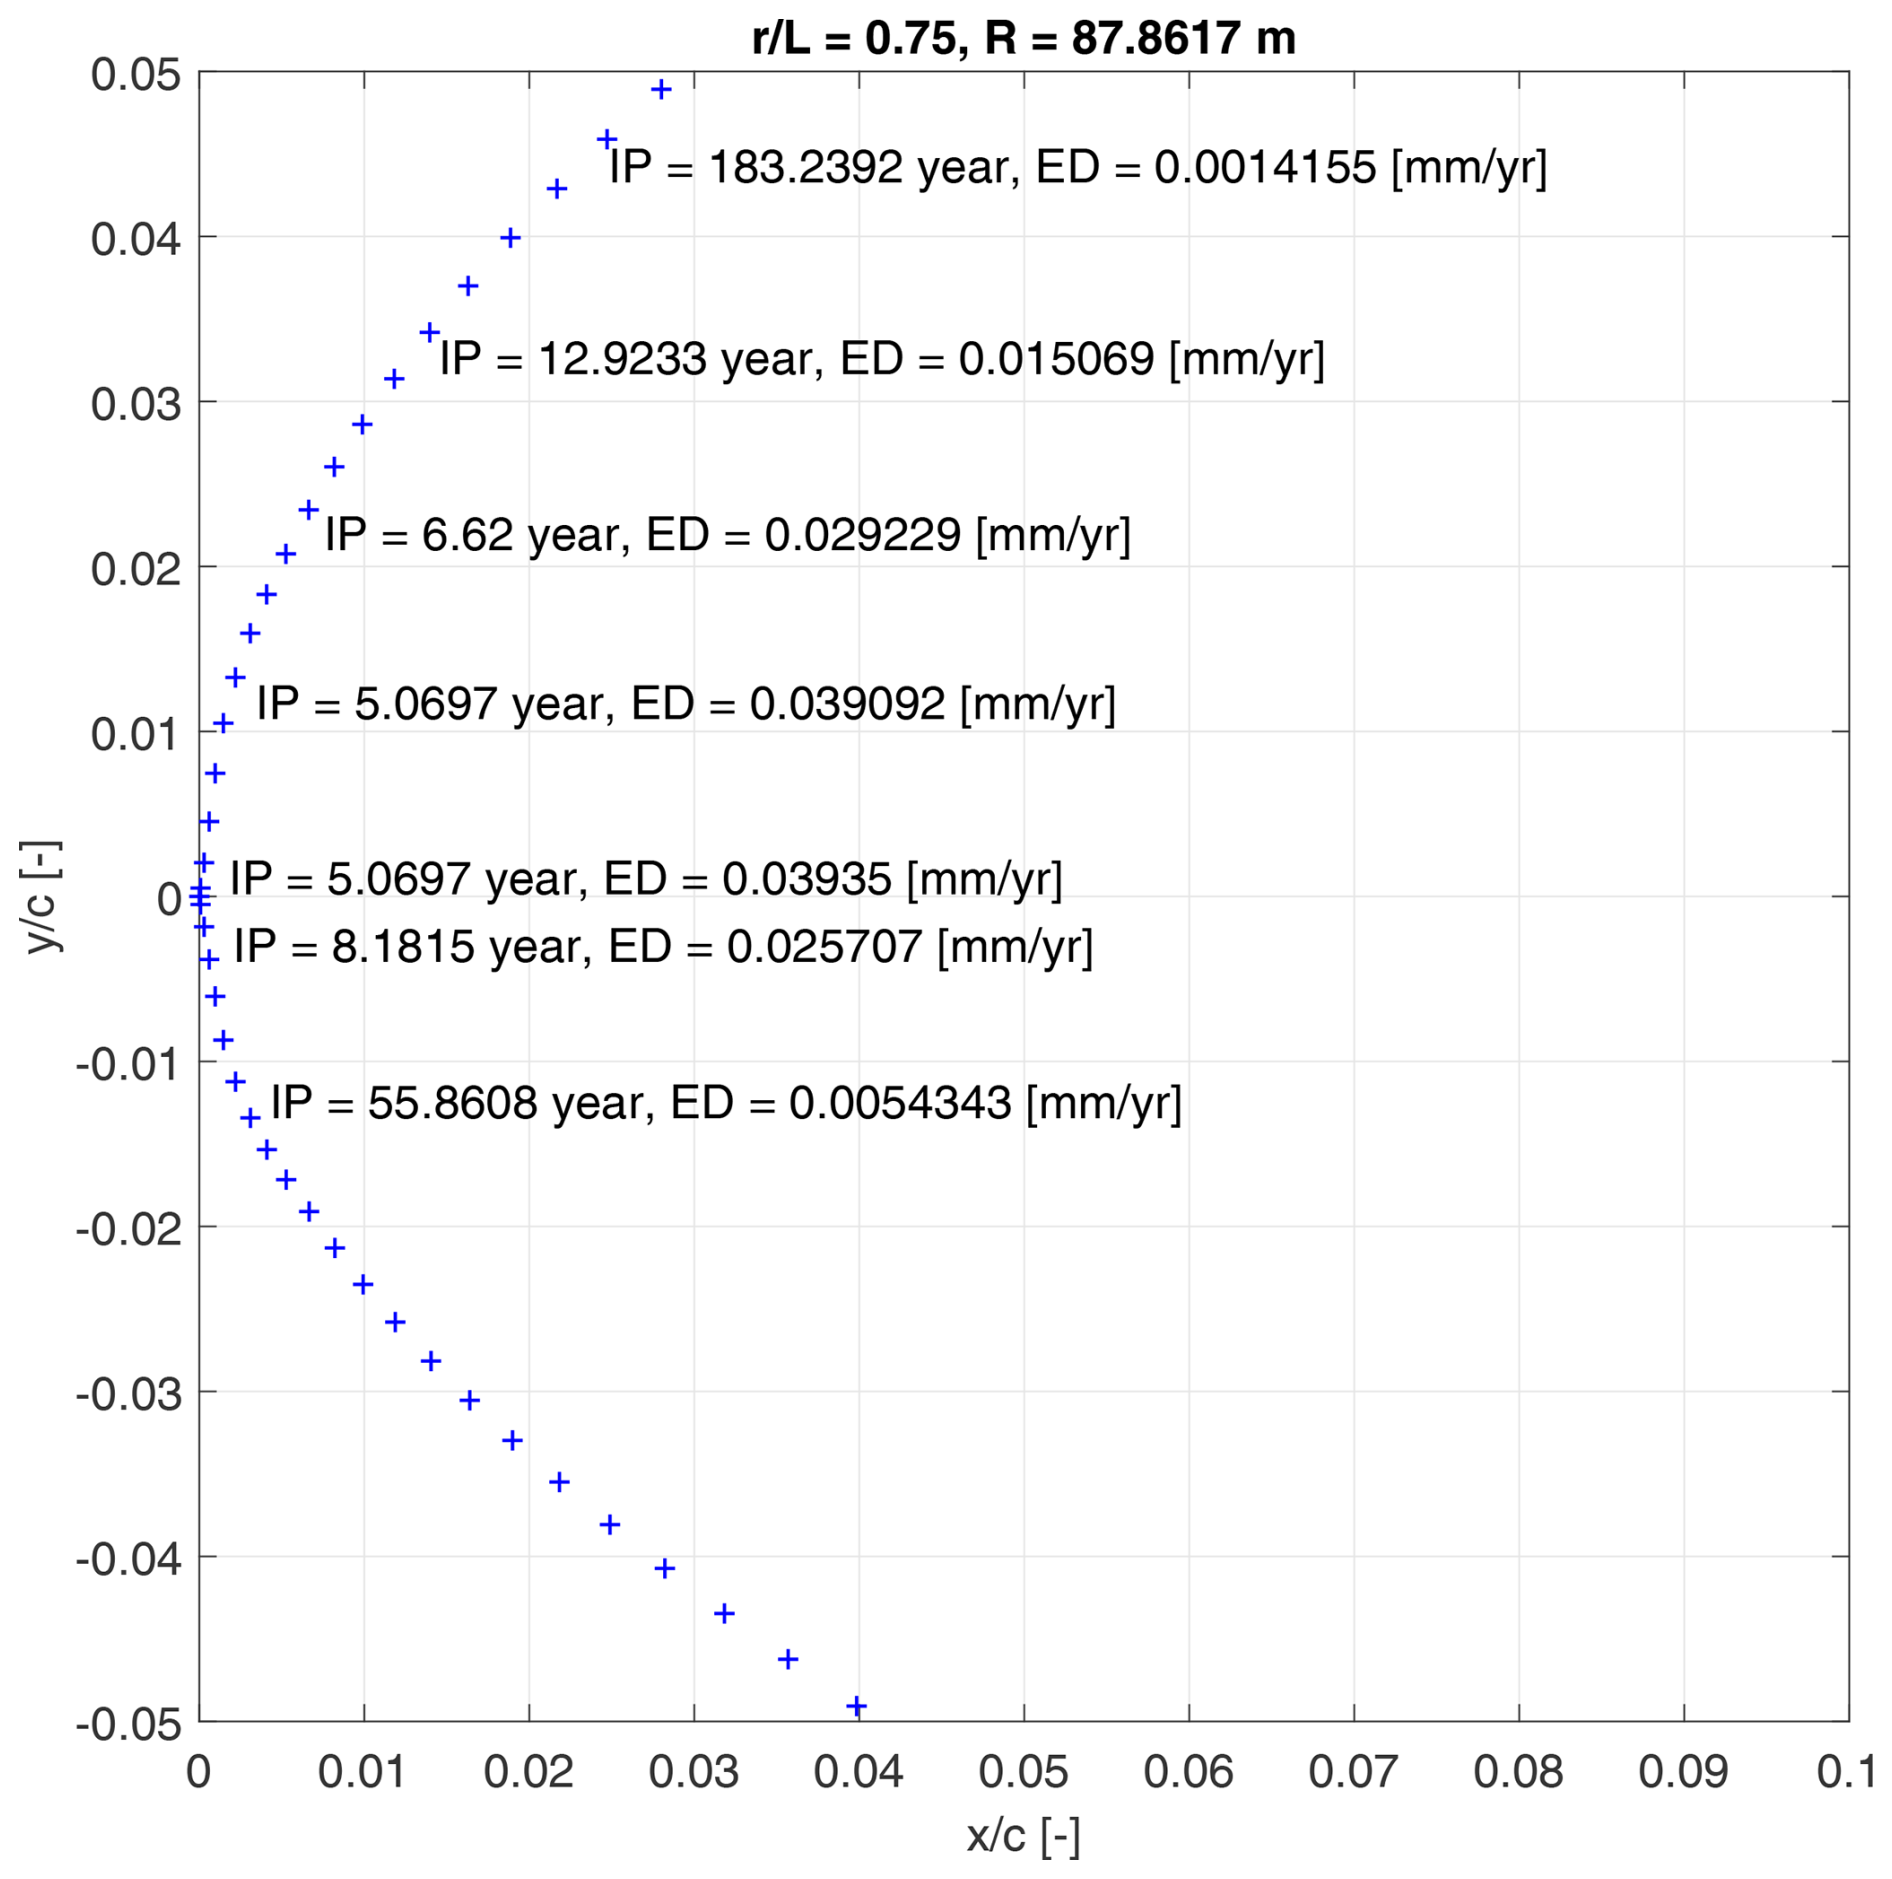
Figure 8The figure illustrates the discretization of chord-wise elements of a blade profile located at 75 % blade length from the blade root. For certain elements, the incubation period, IP, and the yearly accumulated erosion depth, ED, are shown. represents the relative position of the profile along the blade length, while R denotes the radial distance of the airfoil from the blade root. and are the airfoil coordinates, non-dimensional using the local chord length.
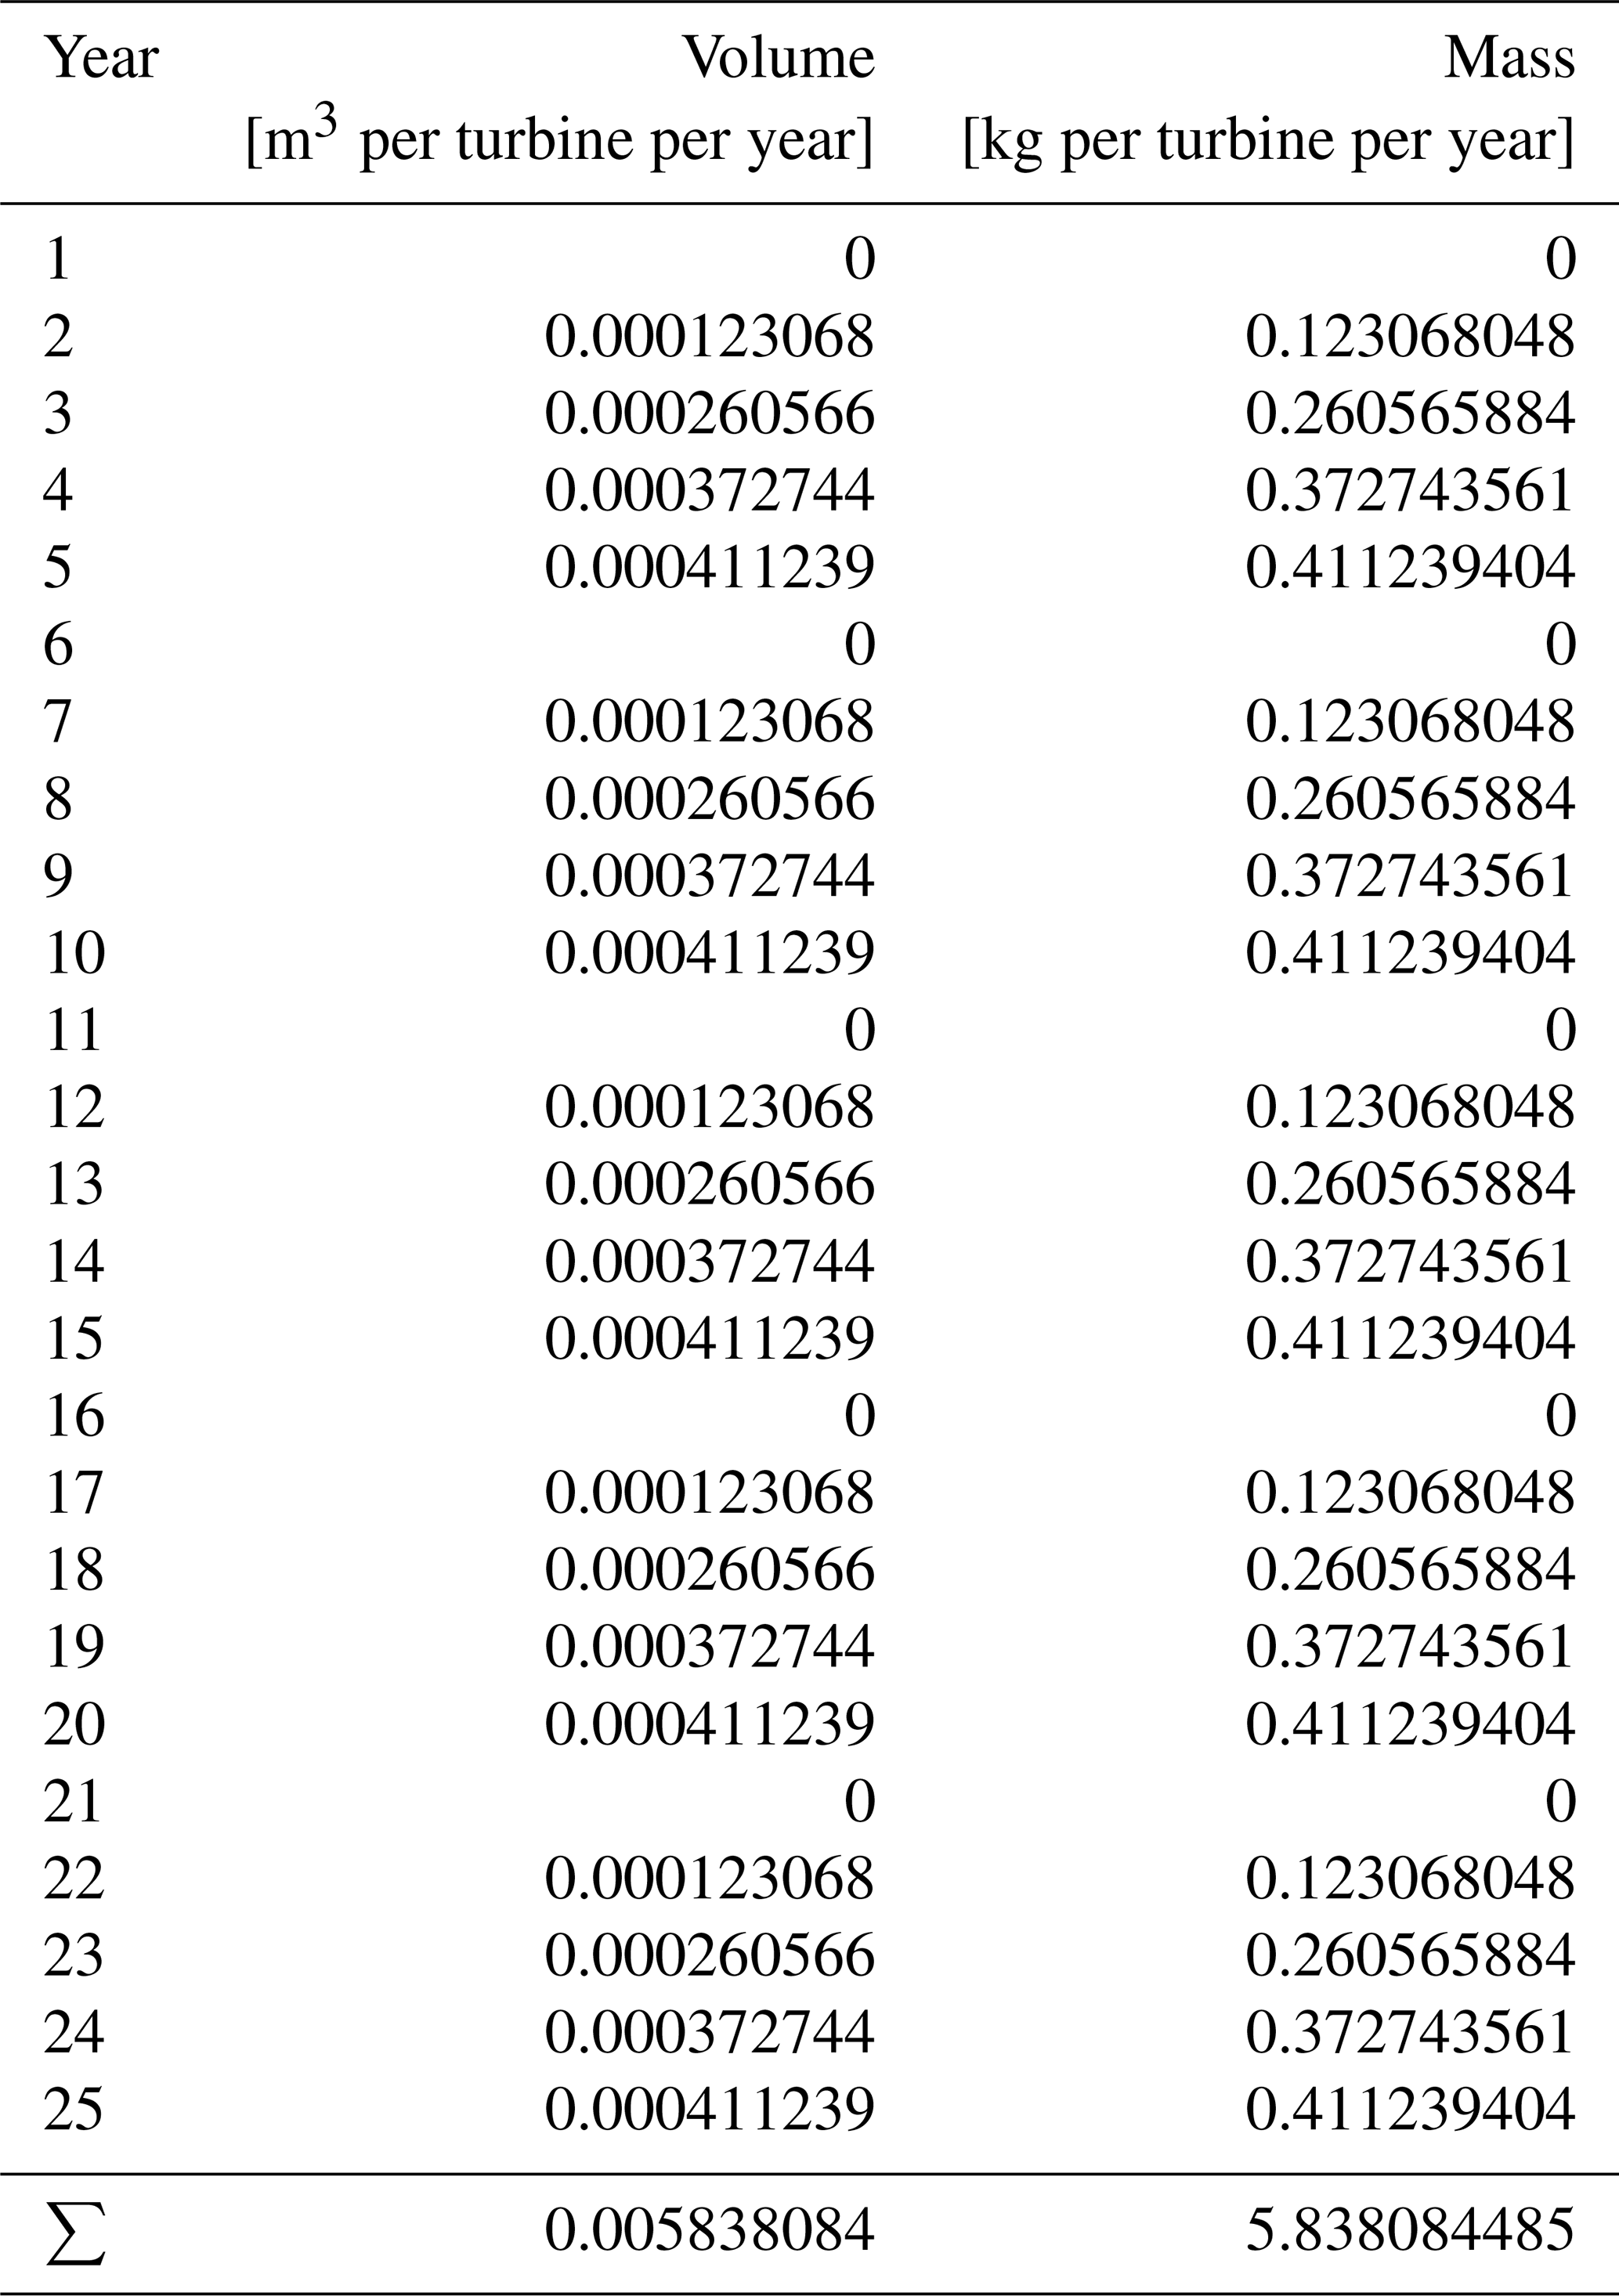
At the most exposed section of the tip, the incubation period is approximately 0.8 years, with an erosion depth of 0.2 mm yr−1. At the section located 75 % of the blade length from the root, the incubation period for the most vulnerable element ends after 5 years, with the erosion depth progressing at a rate of 0.04 mm yr−1. According to our estimation, erosion reaches a blade section located 75 % of the blade length from the root after approximately 5 years. Thus, to prevent erosion from propagating beyond this section, we assumed that one repair is conducted every 5 years. Under this assumption, we estimated the amount of plastic material eroded by rain from the leading edge of three blades over the assumed 25-year lifetime of the wind turbine. Table 3 summarizes the results. Following blade commissioning and each repair, the accumulated damage resets to zero. No material is removed during the first year, as none of the blade elements reach the incubation period. After 2 years, material begins to be released from the tip. The erosion then progresses inboard, increasing the amount of material lost. Once an erosion depth of 0.55 mm (the assumed thickness of the LEP system) is reached at a specific element of the profile leading edge, we assume that no further material can be released from that area. Indeed, by ensuring that operations and maintenance are effectively carried out, the appropriate maintenance and inspection strategy prevents excessive damage beyond the LEP system. Over the lifetime of the turbine, it is estimated that the total volume of material lost from three blades is about 0.006 m3. The density of PU-based coatings for wind turbines varies depending on the specific material composition. Our best estimates range between 0.9 and 1.1 g cm−3. Given this range, we used a representative value of 1 g cm−3 to estimate the mass of material lost from the volume lost. Thus, with an average PU density of 1 g cm−3, this equates to a mass loss of approximately 6 kg. This results in an average production of 240 g of microplastics per turbine each year.
Table 3The table estimates the volume and mass of microplastics released due to leading edge erosion from the blades of the IEA 15 MW Reference Wind Turbine, which features a polyurethane LEP system. It shows microplastic release over time and throughout the turbine's lifetime, assuming one repair every 5 years.
3.2 Blade microplastic emission and impact analysis results
In the previous section, we estimated that the IEA 15 MW Reference Wind Turbine (Gaertner et al., 2020), which has 117 m long blades, releases an average of 240 g of microplastics annually based on measured offshore weather conditions. Using this figure, we estimated the microplastics release from the different wind turbines installed in the Dutch North Sea by scaling the reference turbine's estimate linearly according to blade length. Figure 9 depicts the estimated release of microplastics into the oceanic environment from offshore wind turbines located over the Dutch North Sea between 2024 and 2050. Between 2024 and 2050, microplastic emissions are expected to rise due to the increasing installed capacity of wind turbines in the North Sea, growing from the current 100 kg yr−1 to a peak of around 650 kg yr−1 by 2041. Approximately, there is a microplastic release of 0.02 kg MW−1 installed capacity, with a slight decrease in the future, from 0.021 to 0.014 kg. This is a direct result of improved capacity of turbines, allowing longer wind turbine blades, which reduces the total number of wind turbines required. This results in relatively lower material input for the turbines. The decrease in capacity after 2041, as shown in Fig. 9, is due to the decommissioning of wind farms that have reached the end of their operational life. Potential repowering of existing wind farms or the development of new wind farm areas after 2030 is not included in the data and is therefore not represented here.
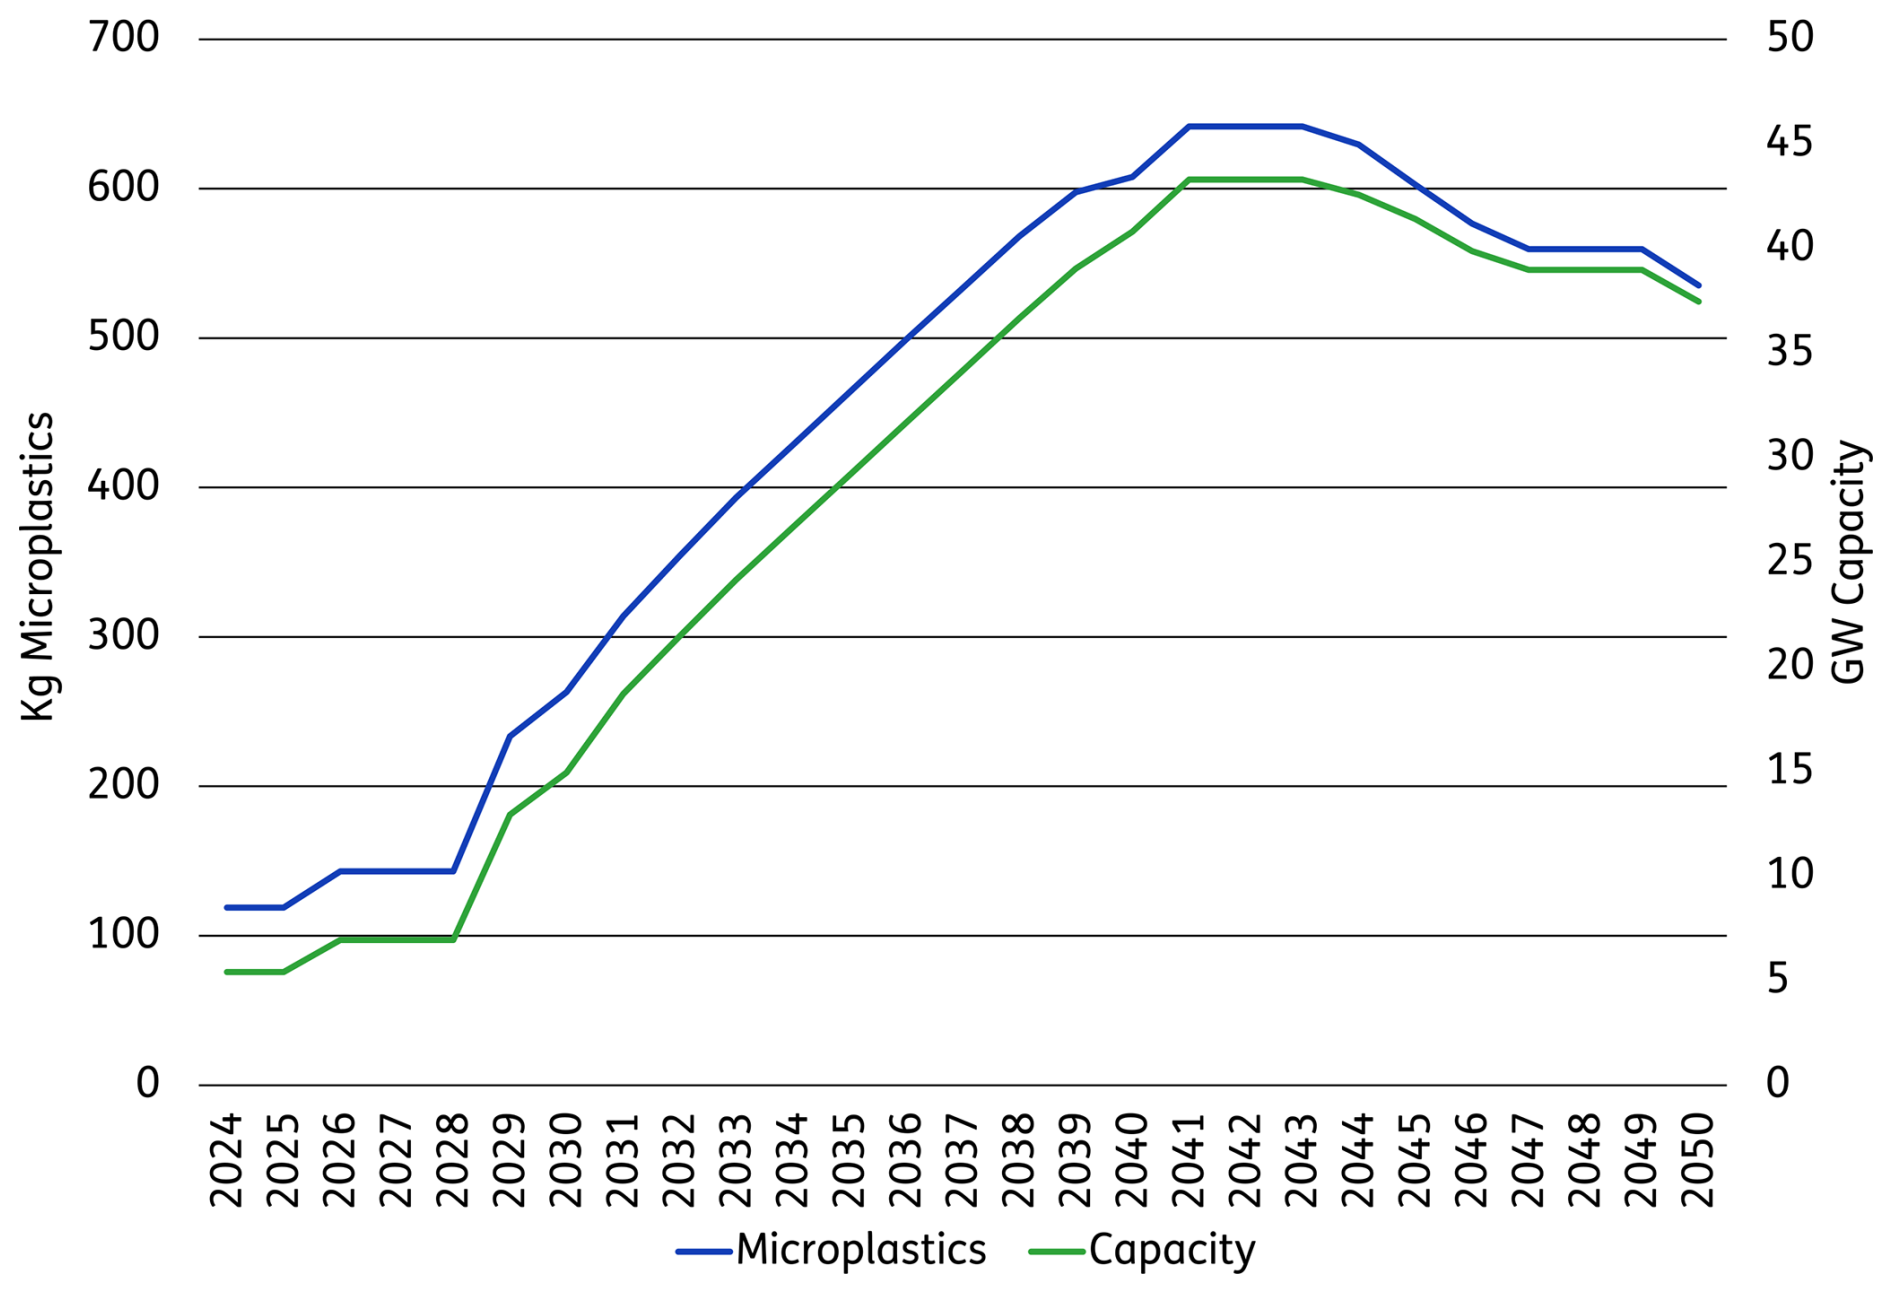
Figure 9Annual microplastic emissions and the associated yearly capacity from Dutch offshore wind turbines in the North Sea.
When comparing the yearly offshore wind turbine emissions to other microplastic emission sources in the Netherlands, wind turbines only contribute to small amounts to the total emissions. In 2017, around 23 kt of microplastics was directly released into the environment in the Netherlands, with approximately 70 % of that total originating from car tires (see Fig. 10). This value excludes any macroplastic emissions (>5 mm), which include littering and improper waste management practices, such as dumping of (plastic) waste. Figure 10 indicates that microplastic losses from Dutch fisheries are assessed to be minimal. Additionally, we utilized the MFA to evaluate and compare microplastic emissions with all direct emissions to oceanic environments from the Netherlands. This assessment includes emissions from macroplastics but excludes any transport from other compartments, such as river inflows. In 2017, a total of 155 t of micro- and macroplastics was emitted into the Dutch North Sea. These direct plastic emissions originated from both the paints and coatings of marine vessels and the direct loss of fishery equipment. Therefore, the estimated 0.1 t currently emitted from offshore wind turbine blades in the Dutch North Sea represents less than 1 ‰ (one per mille) of the total annual plastic offshore emissions in the Netherlands.
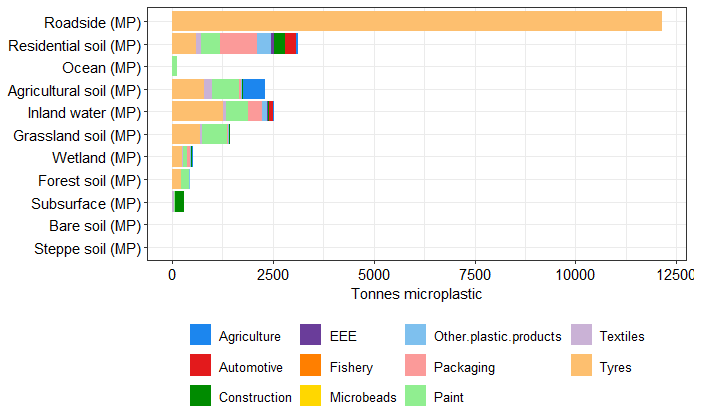
Figure 10Microplastic emissions to the environment for the Netherlands in 2017, assessed through material flow analysis (Schwarz et al., 2023).
Our estimate of 240 g per turbine per year is on the lower end of the existing range of available estimations (see Table 1), which spans 3 g to 14 kg per turbine per year (excluding the erroneous estimate by Solberg et al., 2021). At 240 g, our estimate is rather close to the 150 g estimate provided by Vestas (NORWEA, 2021). The aforementioned lack of information on the estimate in the literature prevents us from further investigating the reasons for the differences.
In our study, we estimated the emissions of microplastics from a turbine with blades featuring a PU-based LEP system. We assumed a NOR value of 0.001 for this LEP, representing the worst-case scenario due to its lowest resistance characteristics among the LEP systems listed in Table 2. The NOR value has a significant impact on both the incubation period and the erosion rate. According to Eqs. (1) and (11), the NOR value is inversely proportional to the accumulated damage and, consequently, directly proportional to the incubation period. Doubling the NOR value results in doubling the incubation period. Based on the current assumptions (NOR=0.001), the most exposed section of the blade, specifically the leading edge of the tip section (Fig. 7), has an incubation period of approximately 0.8 years. Therefore, using an LEP system with a NOR value greater than around 0.03 (while maintaining the assumptions on rain and wind speed) would extend the incubation period of the most exposed section to 25 years, matching the turbine's lifetime and effectively eliminating microplastics release. Table 2 lists one LEP system that theoretically has such high resistance that, according to the calculation methodology used in this study, it would solve the issue of microplastics release from blades. However, such theoretical results need to be validated in the field, which is beyond the scope of this paper. The NOR values in Table 2 were determined in laboratory environments, allowing for perfect application of the LEP and not accounting for aging effects like UV exposure. However, in the field, LEP systems operate in challenging marine environments and are exposed to aging effects, which likely impact their resistance characteristics.
Our study assumed that all wind turbines have LEP systems. However, the actual situation is more complex. In the Netherlands, no special LEP systems were used on the first generation of offshore turbines installed in 2006–2007 (33 Vestas V90–3 MW wind turbines at Princess Amalia Wind Farm and 60 Vestas V80–2 MW wind turbines at Offshore Windpark Egmond aan Zee). The blade leading edges of these turbines are equipped with a standard protective blade coating system (gel coating, UV resistant). On modern offshore wind turbines placed in the North Sea, an LEP coating and/or soft shell system is used instead. Therefore, the resistance characteristics of the LEP system assumed in this study overestimate those of the first-generation wind turbines and better match those of the new turbines. The authors lack the necessary information to estimate the NOR values of the actual LEP systems for both the old and new wind turbines.
As observed and compared in the Results section, it was found that the contribution of microplastic emissions from offshore wind turbine blades in the Dutch North Sea is minimal. This is also the case when only the direct emission sources into oceanic environments are considered, which include fishery and paint as sources. The fate of microplastics released from wind turbine blade LEP systems at sea is influenced by their density, which varies depending on the specific material composition. PU-based coatings have densities ranging from 0.9 to 1.1 g cm−3. Microplastics generated from PU-based coatings with a density greater than that of seawater (which ranges from 1.02 to 1.03 g cm−3) will quickly sink to the ocean floor. Consequently, the exposure time of these microplastics in the upper water column is minimal, reducing their potential impact on species living there. However, microplastics generated from PU-based coatings with a density lower than that of seawater will float on the sea surface, posing a greater potential impact on living species. The authors lack specific data regarding the density of LEP systems currently in use on wind turbine blades installed in the Dutch North Sea. Although PU is rarely found in ocean surface waters (Lebreton et al., 2018), the authors believe that further research is needed to assess the fate of microplastics generated from the LEP systems used in actual wind turbine blades, through measurements taken around wind turbine installations.
The degradation rates of these microplastics at the seafloor are likely slow, due to absence of UV in these areas. Local accumulation of PU microplastics can occur, which can negatively affect species living on the ocean floor. Comparing the long-term impacts of microplastic release with other effects from offshore wind installations, such as the impact on migratory birds and disturbances to the ocean floor during installation, maintenance, and decommissioning, remains a significant challenge. Future studies should aim to compare and address the biodiversity impacts of these activities.
The calculations executed in this study are related to offshore wind turbines and are also only applied on offshore installed capacity. However, wind turbines are also installed onshore, where microplastics are emitted closer to human environments. In the Netherlands, onshore capacity is lower compared to offshore capacity. Additionally, often the tip speed on onshore installations is lower compared to offshore systems to reduce noise pollution on land. However, this also results in lower investments in LEP technology on onshore systems. Still, it can be safely assumed that the contribution of microplastic emissions from onshore systems is low, especially compared to other emission sources of microplastics to terrestrial environments, such as car tires, of which the contribution is significantly higher. This underlines the low contribution of wind turbines to total microplastic emission to the environment. However, other problems can occur due to degradation in the absence of, or lack of maintenance of, LEP, such as the potential emissions of Bisphenol A (NORWEA, 2021).
It is important to note that this study does not include microplastic emissions from other wind turbine components and sources, such as foundation coatings and electrical grid cables. Additionally, plastic wear and tear during production, installation, operation, maintenance, and decommissioning are excluded. The methodology for assessing LEP degradation assumes proper application and degradation under modeled LEE conditions. However, faults and issues during LEP application and maintenance, such as repairs, can accelerate LEP erosion.
Our estimations, made using state-of-the-art LEE methodology, assume that all offshore turbines use the same materials, operate similarly, and experience the same environmental conditions. The short-term weather conditions used in the assessment were recorded during a relatively dry period with wind speeds slightly below average, leading to an underestimation of the degradation rate. Despite this, the calculation offers a first scientific approach to assess the scale of microplastic emissions from wind turbines in oceanic environments.
In this study, we assessed the total quantity of microplastics emitted by wind turbines currently operating in the Dutch North Sea and projected these data through 2050. Our estimates indicate that the release of microplastics into the offshore environment is currently around 100 kg yr−1, with projections suggesting it could rise to approximately 650 kg by 2041. Therefore, the estimates of microplastics currently emitted from offshore wind turbines in the Netherlands account for a very small portion of the total microplastics released offshore in the Netherlands, specifically less than 1 ‰ (one per mille).
Our research indicates that the release of microplastics from blades due to rain-induced LEE is negligible compared to other sources. However, the authors emphasize the need for future research to develop mitigation strategies, such as new erosion-resistant coatings, maintenance practices for erosion prevention, and turbine operational erosion-safe modes that could potentially eliminate these emissions entirely. Future research is also necessary to address the unresolved aspects of this study. As previously mentioned, our analytical estimate relies on numerous assumptions and models that need validation. In our work, we used short-term offshore measurements to estimate the impact of erosion. Future research should focus on understanding long-term rain and wind conditions, considering the increase in extreme events due to climate change. Furthermore, future research should validate and enhance the representativeness of rain erosion tests and evaluate the impact of UV exposure and hailstones on blade erosion. Additionally, our research did not consider other sources of microplastics from various wind turbine components or maintenance activities such as repairs. These sources, which we currently cannot quantify, could be significant. Furthermore, we highlight the need for additional research to assess the fate of microplastics generated from the LEP systems used in modern wind turbines, through measurements taken around wind turbine installations. Additionally, our research did not evaluate the toxicity of wind turbine polymers released as microplastics into the environment, nor is it clear how these polymers decompose in a marine environment.
Software code developed and used for this study can be made available by the corresponding author (Marco Caboni) upon request.
Data developed and used for this study can be made available by the corresponding author (Marco Caboni) upon request.
The supplement related to this article is available online at https://doi.org/10.5194/wes-10-1123-2025-supplement.
MC conceptualized the paper, developed the methodology for evaluating leading edge erosion using weather data, and conducted the analysis of the results. AES performed the material flow analysis and conducted the analysis of the results. HS developed the erosion model. HvdMM collected and integrated information from the Global Offshore Wind Farms Database, stakeholders, and the Netherlands Enterprise Agency (RVO).
The contact author has declared that none of the authors has any competing interests.
Publisher's note: Copernicus Publications remains neutral with regard to jurisdictional claims made in the text, published maps, institutional affiliations, or any other geographical representation in this paper. While Copernicus Publications makes every effort to include appropriate place names, the final responsibility lies with the authors.
This research was supported by TNO's Knowledge Innovation Project (KIP) 2023, and, within the PROWESS project, the Netherlands Enterprise Agency (RVO), part of the Dutch Ministry of Economic Affairs, under grant number HER+-00900701.
This research has been supported by the Rijksdienst voor Ondernemend Nederland (grant no. HER+-00900701).
This paper was edited by Mingming Zhang and reviewed by two anonymous referees.
4C-Offshore: Global Offshore Wind Farms Database, https://www.4coffshore.com/windfarms/, last access: 28 November 2024. a
Bak, C., Forsting, A. M., and Sorensen, N. N.: The influence of leading edge roughness, rotor control and wind climate on the loss in energy production, J. Phys. Conf. Ser., 1618, 052050, https://doi.org/10.1088/1742-6596/1618/5/052050, 2020. a
Barfknecht, N. and von Terzi, D.: Aerodynamic interaction of rain and wind turbine blades: the significance of droplet slowdown and deformation for leading-edge erosion, Wind Energ. Sci., 9, 2333–2357, https://doi.org/10.5194/wes-9-2333-2024, 2024. a
Bech, J. I., Hasager, C. B., and Bak, C.: Extending the life of wind turbine blade leading edges by reducing the tip speed during extreme precipitation events, Wind Energ. Sci., 3, 729–748, https://doi.org/10.5194/wes-3-729-2018, 2018. a, b
Bech, J. I., Johansen, N. F.-J., Madsen, M. B., Hannesdóttir, Á., and Hasager, C. B.: Experimental study on the effect of drop size in rain erosion test and on lifetime prediction of wind turbine blades, Renew. Energ., 197, 776–789, https://doi.org/10.1016/j.renene.2022.06.127, 2022. a, b
Caboni, M., Slot, H. M., Bergman, G., Wouters, D. A. J., and van der Mijle Meijer, H.: Evaluation of wind turbine blades' rain-induced leading edge erosion using rainfall measurements at offshore, coastal and onshore locations in the Netherlands, J. Phys. Conf. Ser., 2767, 062003, https://doi.org/10.1088/1742-6596/2767/6/062003, 2024. a, b, c
Copernicus Climate Change Service, C. D. S.: Land cover classification gridded maps from 1992 to present derived from satellite observation, https://doi.org/10.24381/cds.006f2c9a, 2019. a
DNV: DNV-RP-0171 Testing of rotor blade erosion protection systems, https://www.dnv.com/energy/standards-guidelines/dnv-rp-0171-testing-of-rotor-blade-erosion-protection-systems/ (last access: 12 June 2025), 2021. a, b
Domenech, L., García-Peñas, V., Šakalytė, A., Puthukara Francis, D., Skoglund, E., and Sánchez, F.: Top Coating Anti-Erosion Performance Analysis in Wind Turbine Blades Depending on Relative Acoustic Impedance. Part 2: Material Characterization and Rain Erosion Testing Evaluation, Coatings, 10, 709, https://doi.org/10.3390/coatings10080709, 2020. a
Gaertner, E., Rinker, J., Sethuraman, L., Zahle, F., Anderson, B., Barter, G., Abbas, N., Meng, F., Bortolotti, P., Skrzypinski, W., Scott, G., Feil, R., Bredmose, H., Dykes, K., Shields, M., Allen, C., and Viselli, A.: Definition of the IEA 15-Megawatt Offshore Reference Wind Turbine, Tech. Rep. NREL/TP-5000-75698, National Renewable Energy Laboratory (NREL), Golden, CO, USA, https://doi.org/10.2172/1603478, 2020. a, b
Gall, S. and Thompson, R.: The impact of debris on marine life, Mar. Pollut. Bull., 92, 170–179, https://doi.org/10.1016/j.marpolbul.2014.12.041, 2015. a
Gires, A., Tchiguirinskaia, I., and Schertzer, D.: 3D trajectories and velocities of rainfall drops in a multifractal turbulent wind field, Atmos. Meas. Tech., 15, 5861–5875, https://doi.org/10.5194/amt-15-5861-2022, 2022. a
Haščič, I. and Mackie, A.: Land Cover Change and Conversions: Methodology and Results for OECD and G20 Countries, OECD Green Growth Papers, No. 2018/04, OECD Publishing, Paris, https://doi.org/10.1787/72a9e331-en, 2018. a
Hawkins, S. and Nyboe, A.: The TEKNOBLADE REPAIR 9000 – a practical approach to Leading Edge Protection for wind turbine blades, Tech. rep., TEKNOS, https://www.worldclassmaintenance.com/wp-content/uploads/2019/12/2022.05.20-Teknos-A-practical-approach-to-Leading-Edge-Protection-for-wind-turbine-blades.pdf (last access: 12 June 2025), 2019. a, b
Herring, R., Dyer, K., MacLeod, A., and Ward, C.: Computational fluid dynamics methodology for characterisation of leading edge erosion in whirling arm test rigs, J. Phys. Conf. Ser., 1222, 012011, https://doi.org/10.1088/1742-6596/1222/1/012011, 2019. a
Herring, R., Domenech, L., Renau, J., Šakalytė, A., Ward, C., Dyer, K., and Sánchez, F.: Assessment of a Wind Turbine Blade Erosion Lifetime Prediction Model with Industrial Protection Materials and Testing Methods, Coatings, 11, 767, https://doi.org/10.3390/coatings11070767, 2021. a
Heymann, F.: Toward Quantitative Prediction of Liquid Impact Erosion, in: Characterization and Determination of Erosion Resistance, ASTM International, https://doi.org/10.1520/STP26871S, 1970. a
Heymann, F. J.: Conclusions from the ASTM interlaboratory test program with liquid impact erosion facilities, in: International Conference on Erosion by Liquid and Solid Impact, 5th edn., 3–6 September 1979, Cambridge, England, Proceedings (A80-25030 09-23), Cambridge, Cambridge University, 20-1–20-10, 1979. a, b, c, d
Hof, M., Bodar, C., and de Kort, T.: Eerste inzicht in emissies van chemische stoffen bij windturbines op land, Tech. rep., RIVM, https://www.rivm.nl/bibliotheek/rapporten/2022-0235.pdf (last access: 12 June 2025), 2023. a, b, c
Huerta Lwanga, E., Gertsen, H., Gooren, H., Peters, P., Salanki, T., van der Ploeg, M., Besseling, E., Koelmans, A., and Geissen, V.: Microplastics in the terrestrial ecosystem: Implications for Lumbricus terrestris (Oligochaeta, Lumbricidae), Environ. Sci. Technol., 50, 2685–2691, https://doi.org/10.1021/acs.est.5b05478, 2016. a
KNMI: Jaaroverzicht Weer 2022, https://cdn.knmi.nl/knmi/map/page/klimatologie/gegevens/mow/jow_2022.pdf (last access: 12 June 2025), 2022. a
Krzyzanowski, J. and Szprengiel, Z.: The Influence of Droplet Size on the Turbine Blading Erosion Hazard, J. Eng. P., 100, 561–565, https://doi.org/10.1115/1.3446394, 1978. a
Kusumgar, N. G.: Kusumgar, Nerlfi & Growney publishes fourth study on the global paint & coatings industry, Focus on Powder Coatings, 2020, 7, https://doi.org/10.1016/j.fopow.2020.04.038, 2020. a
Lebreton, L. C., Slat, B., Ferrari, F., Sainte-Rose, B., Aitken, J., Marthouse, B., Hajbane, S., Cunsolo, S., Schwarz, A., Levivier, A., Noble, K., Debeljak, P., Maral, H., Schoeneich-Argent, R., Brambini, R., and Reisser, J.: Evidence that the Great Pacific Garbage Patch is rapidly accumulating plastic, Sci. Rep.-UK, 8, 1–10, https://doi.org/10.1038/s41598-018-22939-w, 2018. a
Leslie, H. A., van Velzen, M. J., Brandsma, S. H., Vethaak, A. D., Garcia-Vallejo, J. J., and Lamoree, M. H.: Discovery and quantification of plastic particle pollution in human blood, Environ. Int., 163, 107199, https://doi.org/10.1016/j.envint.2022.107199, 2022. a
Maniaci, D. C., Westergaard, C., Hsieh, A., and Paquette, J. A.: Uncertainty Quantification of Leading Edge Erosion Impacts on Wind Turbine Performance, J. Phys. Conf. Ser., 1618, 052082, https://doi.org/10.1088/1742-6596/1618/5/052082, 2020. a
Mishnaevsky, L., Hasager, C. B., Bak, C., Tilg, A.-M., Bech, J. I., Doagou Rad, S., and Fæster, S.: Leading edge erosion of wind turbine blades: Understanding, prevention and protection, Renew. Energ., 169, 953–969, https://doi.org/10.1016/j.renene.2021.01.044, 2021. a
Mishnaevsky, L., Tempelis, A., Kuthe, N., and Mahajan, P.: Recent developments in the protection of wind turbine blades against leading edge erosion: Materials solutions and predictive modelling, Renew. Energ., 215, 118966, https://doi.org/10.1016/j.renene.2023.118966, 2023. a
NORWEA: Faktaark: Vindkraft, plast og Bisfenol A, https://static1.squarespace.com/static/5c61546ae5f7d115a78a4fcf/t/60ae871d9dbaab748e3a217f/1622050590073/Plast%2Bog%2BBisfenol%2BA%2Bfaktaark1.pdf (last access: 17 October 2024), 2021. a, b, c, d
Pugh, K. and Stack, M. M.: Rain Erosion Maps for Wind Turbines Based on Geographical Locations: A Case Study in Ireland and Britain, Journal of Bio- and Tribo-Corrosion, 7, 34, https://doi.org/10.1007/s40735-021-00472-0, 2021. a
Sánchez, F., Sakalyte, A., Ansari, M. Q., Wu, C.-Y., Teuven, J., Young, T. M., Olivares, A., and Domenech, L.: Erosion Damage Progression Analysis for Wind Turbine Blade Material Coatings based on Comparison of Accelerated Rain Erosion Testing Methods and Polymer Properties, SSRN, https://doi.org/10.2139/ssrn.5172335, 2025. a, b, c
Schmitt, G. F.: Research for Improved Subsonic and Supersonic Rain Erosion Resistant Material, Tech. Rep. AFML-TR-67-211, Air Force Materials Laboratory, https://apps.dtic.mil/sti/html/tr/AD0828188/index.html (last access: 12 June 2025), 1968. a
Schwarz, A., Lensen, S., Langeveld, E., Parker, L., and Urbanus, J.: Plastics in the global environment assessed through material flow analysis, degradation and environmental transportation, Sci. Total Environ., 875, 162644, https://doi.org/10.1016/j.scitotenv.2023.162644, 2023. a, b, c, d
Seleznev, L. I., Ryzhenkov, V. A., and Mednikov, A. F.: Phenomenology of erosion wear of constructional steels and alloys by liquid particles, Therm. Eng.+, 57, 741–745, https://doi.org/10.1134/S004060151009003X, 2010. a
Slot, H.: A fatigue-based model for the droplet impingement erosion incubation period, PhD thesis, University of Twente, Enschede, the Netherlands, https://ris.utwente.nl/ws/portalfiles/portal/268387756/PhD_thesis_H_Slot.pdf (last access: 12 June 2025), 2021. a
Slot, H., Gelinck, E., Rentrop, C., and van der Heide, E.: Leading edge erosion of coated wind turbine blades: Review of coating life models, Renew. Energ., 80, 837–848, https://doi.org/10.1016/j.renene.2015.02.036, 2015. a, b, c
Solberg, A., Rimereit, B.-E., and Weinbach, J. E.: Leading Edge erosion and pollution from wind turbine blades, https://docs.wind-watch.org/Leading-Edge-erosion-and- pollution-from-wind-turbine-blades_5_july_English.pdf (last access: 17 October 2024), 2021. a, b, c, d, e
Springer, G. S.: Erosion by liquid impact, John Wiley & Sons, https://doi.org/10.1017/S0001924000034552, 1976. a, b
Springer, G. S., Yang, C.-I., and Larsen, P. S.: Analysis of Rain Erosion of Coated Materials, J. Compos. Mater., 8, 229–252, https://doi.org/10.1177/002199837400800302, 1974. a
Tempelis, A. and Mishnaevsky, L.: Surface roughness evolution of wind turbine blade subject to rain erosion, Mater. Design, 231, 112011, https://doi.org/10.1016/j.matdes.2023.112011, 2023. a
Verma, A. S., Jiang, Z., Caboni, M., Verhoef, H., van der Mijle Meijer, H., Castro, S. G., and Teuwen, J. J.: A probabilistic rainfall model to estimate the leading-edge lifetime of wind turbine blade coating system, Renew. Energ., 178, 1435–1455, https://doi.org/10.1016/j.renene.2021.06.122, 2021. a
Verma, A. S., Yan, J., Hu, W., Jiang, Z., Shi, W., and Teuwen, J. J.: A review of impact loads on composite wind turbine blades: Impact threats and classification, Renew. Sust. Energ. Rev., 178, 113261, https://doi.org/10.1016/j.rser.2023.113261, 2023. a
Verschoor, A.: Emission of microplastics and potential mitigation measures Abrasive cleaning agents, paints and tyre wear, Tech. Rep. 2016-0026, RIVM, https://www.rivm.nl/bibliotheek/rapporten/2016-0026.pdf (last access: 12 June 2025), 2016. a
Viane, J.: Windturbines verliezen geen 62 kg per turbine aan microplastic per jaar, https://factcheck.vlaanderen/factcheck/windturbines-verliezen-geen-62-kg-per-turbine-aan-microplastic (last access: 17 October 2024), 2022. a, b
Vimalakanthan, K., van der Mijle Meijer, H., Bakhmet, I., and Schepers, G.: Computational fluid dynamics (CFD) modeling of actual eroded wind turbine blades, Wind Energ. Sci., 8, 41–69, https://doi.org/10.5194/wes-8-41-2023, 2023. a
Vitulli, J., Eeckels, C., Bot, E., Verhoef, J., Bergman, G., and der Werff, P. V.: Offshore wind energy deployment in the North Sea by 2030: long-term measurement campaign. LEG, 2014-2022, Tech. Rep. R10579, TNO, https://publications.tno.nl/publication/34640886/7ycJdI/TNO-2023-R10579.pdf (last access: 12 June 2025), 2023. a
Weigle, B. and Szprengiel, Z.: An attempt to assess the erosion damage due to the impact of a polyfractional rain of droplets, Transactions Institute of Fluid-Flow Machinery, 88, 45–70, 1985. a