the Creative Commons Attribution 4.0 License.
the Creative Commons Attribution 4.0 License.
 | 11 Sep 2025
Leveraging signal processing and machine learning for automated fault detection in wind turbine drivetrains
Cédric Peeters
Timothy Verstraeten
Jan Helsen
Wind energy is considered a sustainable renewable energy source; however, it faces the challenge of significant operating and maintenance costs. The research proposes a hybrid fault detection method to combine the physical domain knowledge with the machine learning models to provide an overview of the health of wind turbine drivetrain components. Signal processing indicators are computed from raw vibration signals measured from strategically placed accelerometers over drivetrain components. It produces an immense number of indicators as each indicator is sensitive towards certain types of faults, and manual monitoring becomes an unfeasible task. The machine learning models are trained using signal processing indicators and supervisory control and data acquisition (SCADA) data. The normal behavior modeling technique is employed to learn the healthy operation of the machine from data collected during healthy machine operation. The trained normal behavior machine learning models label each indicator in a healthy or faulty state over time. The labeled state-of-the-art signal processing indicators are fused to provide a high-level health status overview of wind turbine drivetrain components. It helps to derive the required details from many condition indicators, which is valuable when managing multiple components in a single wind turbine across an entire wind farm. The proposed hybrid fault detection method is validated on an offshore wind farm with multiple years of condition monitoring data. It provides a high-level health overview that is readily understandable for non-expert wind farm operators, and for more detailed fault analysis, experts can conduct a comprehensive inspection.
- Article
(3824 KB) - Full-text XML
- BibTeX
- EndNote


Renewable energy has experienced significant growth in recent years and has reduced the impact of global warming. In 2022, international investments in the renewable energy sector reached USD 1.3 trillion to decarbonize fossil-fuel-based energy production (IRENA and CPI, 2023). The growing interest in renewable energy has led to a substantial increase in clean, green energy production. The global installed wind energy capacity has escalated to 906 GW due to the fast growth observed during recent years (Hutchinson and Zhao, 2023). The increasing interest in renewable and wind energy is accompanied by the challenge of significant operating and maintenance (O&M) costs. In the case of offshore wind, the O&M cost accounts for 30 % of the total energy cost, primarily due to the remote and challenging environmental conditions of offshore locations. Offshore wind energy sites are advantageous for wind energy due to the availability of more consistent and strong winds to harvest (Gao and Odgaard, 2023). This situation offers ample opportunities for cost reduction in offshore wind energy by identifying faults at early stages to plan efficient group maintenance strategies by combining multiple wind turbines or components (Wang et al., 2022b). It is crucial to accurately determine the health status of wind turbines to plan efficient maintenance strategies during low energy demand and suitable weather conditions to reduce the O&M cost (Helsen et al., 2017).
The advancement of Industry 4.0 introduced Internet of Things (IoT) devices, facilitating the transfer of sensor data over the Internet (Ma et al., 2022). The wind industry utilized this opportunity and equipped wind turbines with various IoT sensors to gather a wide range of data (Verstraeten et al., 2019a). Moreover, the drive to automate every conceivable industrial process has made the mechanical industry increasingly intricate, owing to the complex interrelations between numerous complicated components and procedures. Wind turbines are complex machines because they operate under constantly evolving operating conditions in challenging weather and environmental settings. The nonstationary conditions of wind turbines pose significant challenges to fault detection (Liu et al., 2023). As a result, there is a growing need for more advanced maintenance strategies to effectively manage and uphold wind turbine performance (Zonta et al., 2020). The big data collected from multiple IoT sensors enable continuous health monitoring of wind turbines. They transform the maintenance strategies from periodic or reactive to predictive (Nejad et al., 2022). Currently, predictive maintenance is the most optimal maintenance strategy, which allows planning future group maintenance by identifying faults at the initial stage, leveraging the continuous data measurements provided by IoT sensors. Predictive maintenance methods involve training machine learning models using historical data from IoT sensors to predict the current health state of a wind turbine. It provides insight to execute group maintenance or arrange necessary measures to extend the wind turbine's operational life (Zhang et al., 2019; Carvalho et al., 2019). The life of a wind turbine affected by an early-stage fault can be increased by only utilizing it during high demand (Verstraeten et al., 2019b). The wind energy O&M cost is reduced when reliability is improved and wind turbines are available to produce energy in line with demand (Clark and DuPont, 2018).
The IoT sensors installed on wind turbines have the capacity to measure various types of data, primarily used for vibration analysis, acoustics, oil analysis, strain measurement, and thermography. Supervisory control and data acquisition (SCADA) is a widely used data acquisition and monitoring system for wind turbines. It collects various types of data, including wind speed, power output, and rotor speed, which are essential for assessing the operating condition of the wind turbine. The measured data are used to monitor components such as gearboxes, generators, main bearings, blades, and towers (García Márquez et al., 2012). SCADA data have been utilized for detecting faults in the generator (Chesterman et al., 2022; Peter et al., 2022) and the main bearing (Beretta et al., 2021). SCADA data offer a cost-effective health monitoring solution since they eliminate the need for additional sensor installations. However, SCADA-based condition monitoring is unreliable; only a small subset of SCADA parameters is suitable for fault detection (Nejad et al., 2022). A large subset of SCADA parameters is utilized as machine learning model features to enhance fault detection and improve the reliability of SCADA-based condition monitoring (Renström et al., 2020; Lima et al., 2020; Dienst and Beseler, 2016). Among condition monitoring techniques, vibration analysis has emerged as a primary method for condition monitoring (Nejad et al., 2022; Helsen et al., 2017; Peeters et al., 2019a). However, raw data are not sufficient to provide insights to develop effective predictive maintenance strategies. Signal processing indicators derived from raw vibration data are used to monitor the health status of wind turbines. Experts are required to monitor individual indicators to identify emerging fault trends. Numerous signal processing methods are used to compute such indicators, with each one sensitive to specific types of faults. Therefore, it is unfeasible for experts to continuously monitor each indicator, especially when a wind farm has multiple wind turbines, and each wind turbine contains many components. Machine learning models can provide a high-level health status (Jamil et al., 2023b, a) or label the indicators with healthy and alarm states for easy interpretation (Peeters et al., 2019b).
The signal processing indicators for fault detection are categorized into two groups: time domain and frequency domain indicators. Time domain indicators, such as mean and standard deviation, are statistical parameters that enable the determination of health degradation trends by monitoring deviations from established normal behavior. These time domain features include statistical parameters such as root mean square, kurtosis, peak to peak, Moors kurtosis, peak energy index, and crest factor (Peeters et al., 2017, 2018a, 2019b). Time domain indicators significantly simplify health analysis since they do not require knowledge of the characteristic frequencies of components. Nonetheless, these indicators only indicate which sensor has detected a fault, without offering insights into the specific nature of the fault. In contrast, frequency domain indicators not only detect faults but also specify which component is experiencing the fault by utilizing characteristic frequencies associated with those components. Bearing characteristic frequencies are the inner race, outer race, roller cage, and roller, while gears have distinct characteristic frequencies associated with gear meshing. These characteristic frequencies are tracked in the spectral domain of the signal and its envelope (Ho and Randall, 2000; McCormick and Nandi, 1998). Fault detection methods based on cyclostationarity are gaining popularity in rotating machinery fault detection applications (Antoni, 2009). These methods highlight the modulation in signals introduced by faults in rotating components.
There is a rising interest among the research community in employing machine learning models for fault detection (Liu et al., 2018; Xiang et al., 2022). The most commonly used machine learning models include artificial neural networks (Marugán et al., 2018), support vector machines (Vidal et al., 2018; Widodo and Yang, 2007), and deep neural networks (Dibaj et al., 2023; Jia et al., 2016; Ibrahim et al., 2016). These machine learning applications are implemented by leveraging signal processing features as they depict substantial fault trends (Peeters et al., 2019b; Jamil et al., 2023b, a; Perez-Sanjines et al., 2023). However, a primary challenge for machine learning models is the scarcity of fault cases, as machines typically operate in a healthy state for the majority of their operational time. Therefore, training a classifier to distinguish between normal and faulty health states may not be an optimal technique. Transfer learning provides a viable solution to address the issue of limited data availability in the machine learning discipline. It enables the transfer of data or knowledge from similar domains to enhance the prediction performance of machine learning models (Zhuang et al., 2021). In the context of fault detection, transfer learning enhances detection capabilities by transferring learned knowledge from a similar source domain to a target domain (Bai et al., 2021), while avoiding negative transfer (Jamil et al., 2022). However, transfer learning does require a few known faulty cases to improve supervised learning fault detection models. It implies that in order to deploy a fault detection model in industry, a wind turbine must experience a failure event that provides the necessary data to train a fault detection classifier. The acquisition of fault data for machines poses a significant challenge, as it requires the occurrence of faults before training a robust health status classifier to differentiate between healthy and faulty states. However, healthy data are available to measure after the machine begins operations. A more practical approach in such cases involves employing a machine learning model capable of learning healthy behavior and detecting faults by identifying deviations from the learned normal behavior. The normal behavior model (NBM) is trained on the expected behavior and identifies deviations as anomalies. This approach allows for the utilization of healthy wind turbine data to train NBMs and detect a potential fault when any deviation from the expected behavior is observed (Peeters et al., 2019b; Helsen et al., 2018; Wang et al., 2022a). Peeters et al. (2019b) introduced a hybrid fault detection method that leverages signal processing statistical indicators computed during a healthy operating period to train an NBM. The trained NBM is able to label indicators' healthy states and any possible deviations as a faulty trend. Temperature signals are less sensitive compared to the vibration signals towards any fault introduction; however, they do exhibit trends that can indicate fault trends. NBMs trained on healthy temperature signals are able to successfully detect gearbox faults in wind turbines (Helsen et al., 2015, 2018). Chesterman et al. (2022) compare statistical and machine learning NBM pipelines to detect wind turbines generating bearing faults using SCADA data. Perez-Sanjines et al. (2023) employed coherence maps derived from vibrational signals to train normal behavior deep learning models to detect mechanical faults in wind turbine rotating components. Normal behavior modeling is the most effective machine learning approach for mechanical condition monitoring and failure prediction, as concluded from a comparison of various SCADA-data-based condition monitoring techniques (Chesterman et al., 2023). The key advantage of the normal behavior model (NBM) includes its ability to perform unsupervised learning and detect failures without prior exposure to them. NBM can be easily adapted to various types of data from any component or process by learning normality and triggering an alarm when the normality is violated.
The proposed method is a hybrid fault detection approach to provide a high-level health status summary by adapting to changing operating conditions by using vibration and SCADA data. It combines the computational capabilities of machine learning with domain knowledge of signal processing indicators. This method leverages domain knowledge to train machine learning models, providing results that are both easily interpretable and explainable compared to black-box machine learning models only predicting the presence of faults. The effectiveness of the proposed method has been validated across multiple real-life wind farms, spanning several years of operational data. It has demonstrated a notable capability to detect fault trends at their early stages. The key contributions of this research can be summarized as follows:
-
Development of a fully automated vibration and SCADA-data-based drivetrain monitoring pipeline.
-
The method introduces physical domain knowledge to enhance machine learning models' prediction performance.
-
It provides a high-level health status overview by adapting to changing operating conditions.
-
It has been validated on many real-world wind farms, leveraging multiple years of data, and exhibited promising results.
The proposed approach is a hybrid condition monitoring method for fault detection. This method integrates vibration-based signal processing indicators and SCADA data with machine learning models. Although SCADA data have not been designed primarily for wind turbine condition monitoring (Tautz-Weinert and Watson, 2017), the proposed method derives operational information about the wind turbine from these data. A range of signal processing techniques are employed to compute indicators from vibration signals, including time domain statistical indicators, frequency domain spectral features, and cyclostationary indicators. These computed indicators serve as the input for machine learning NBMs trained to classify the indicators into healthy or faulty states. Subsequently, the approach calculates the count of indicators labeled as faulty at each time step to provide a high-level overview of the wind turbine's health. Figure 1 offers a visual representation of the hybrid condition monitoring pipeline, which commences with data acquisition from sensors installed on the wind turbine drivetrain. The SCADA data are collected through the SCADA system, while the vibrational data are measured by the condition monitoring system. Since these systems operate at different frequencies and intervals, the data from both sources are integrated by aligning them based on matching timestamps. The combined dataset is derived by merging the vibration data measurements with their corresponding SCADA data measurements. This unified dataset is passed to machine-learning-based NBMs to label the measurements as healthy and faulty states. Finally, in the last stage, alarms are triggered based on the number of indicators classified as faulty per timestamp.
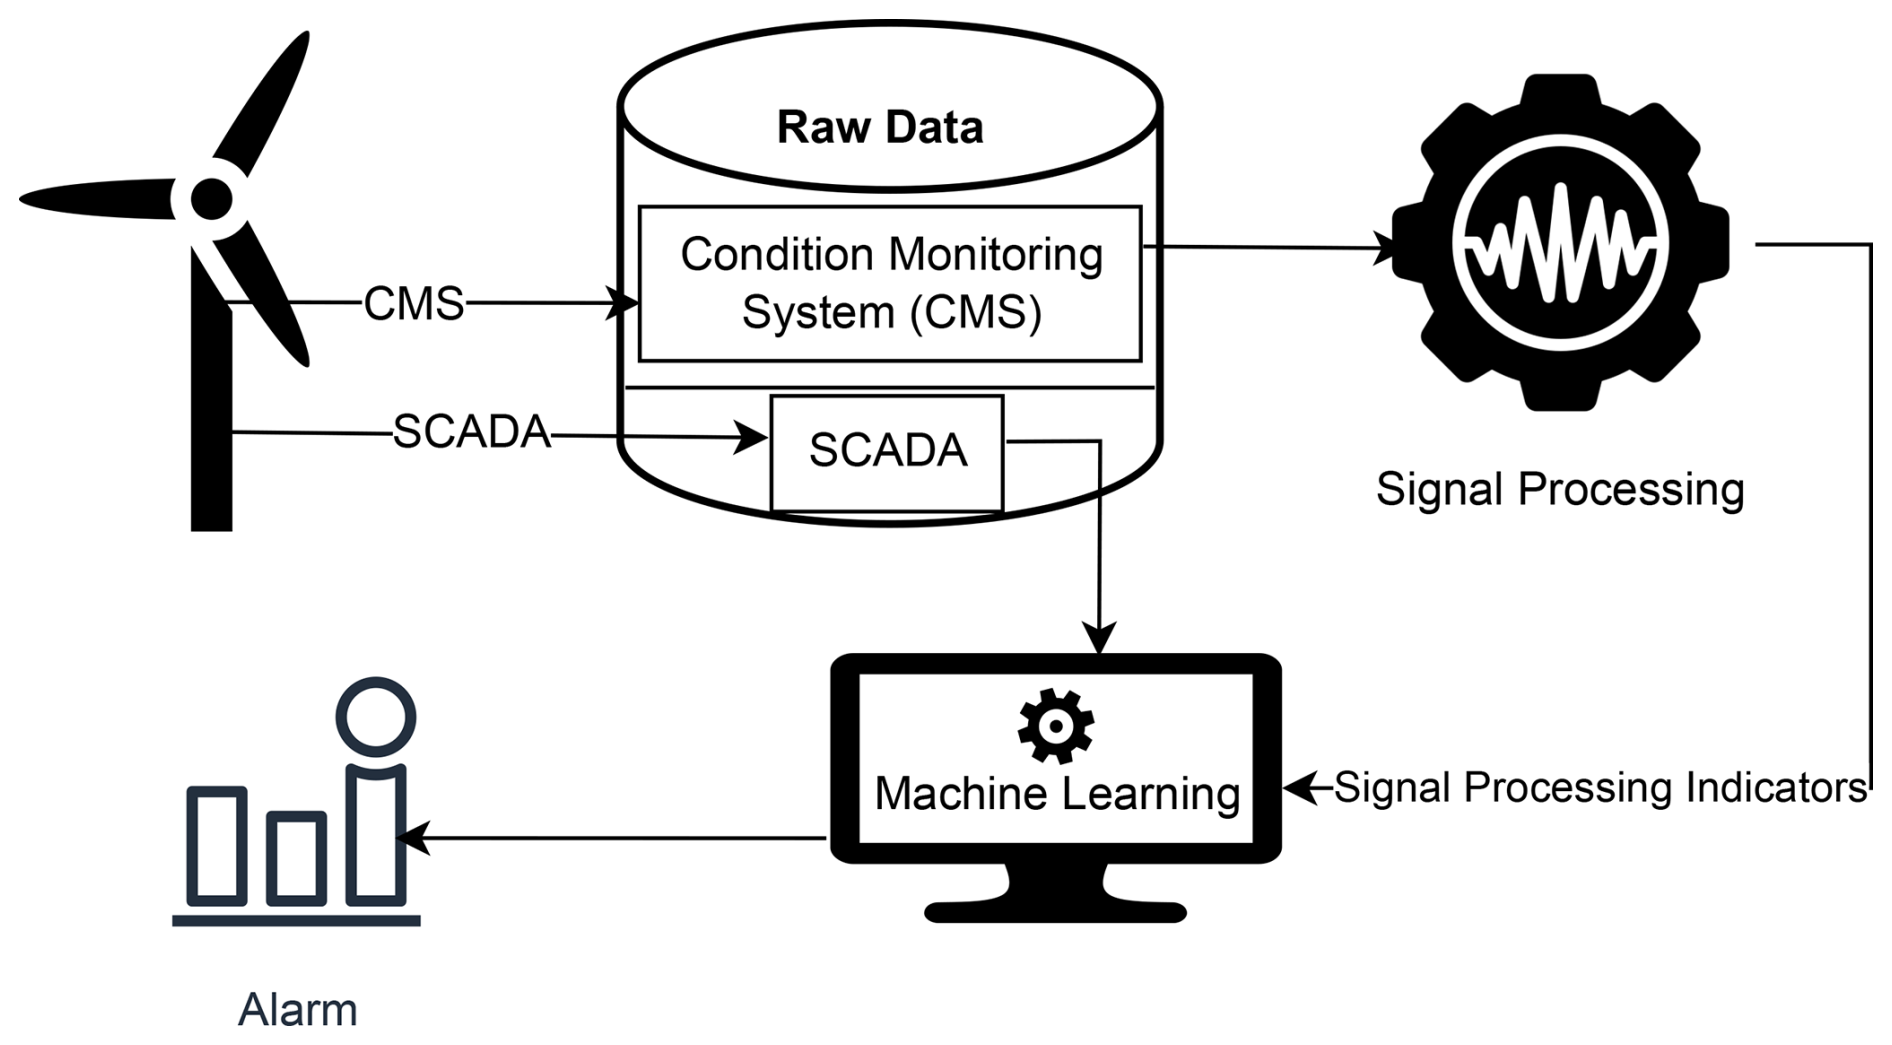
Figure 1The hybrid condition monitoring pipeline commences with data acquisition from a wind turbine. These data are then used to compute signal processing features, which are subsequently passed as input into machine learning models alongside SCADA data to predict alarms.
The proposed hybrid condition monitoring pipeline is structured into three distinct steps:
-
Computation of signal processing time domain and frequency domain condition indicators
-
Labeling computed indicators as healthy and faulty states using normal behavior machine learning models
-
Alarming to provide a high-level health status of the wind turbine
2.1 Signal processing
The condition indicators that are fed to the normal behavior models are the result of an extensive signal pre-processing phase that tries to track any significant changes in the measurements. The following paragraphs detail the different steps required to arrive at a set of meaningful and effective condition indicators for fault detection.
Due to the nonstationary nature of wind turbine drivetrains, the measured vibration signals cannot be fully analyzed directly without knowledge of the rotating speed or instantaneous angular speed (IAS) of the drivetrain shafts. Given that not every turbine has a high-resolution angle encoder installed on its drivetrain, the first step in the signal processing pipeline is the automated estimation of the IAS directly from the vibration signals. To achieve this automated estimation, knowledge of the kinematic orders present in the gearbox is necessary, i.e., the gear ratios. Using these kinematic orders, we can employ the harmonic frequencies that each gear produces as input for the multi-order probabilistic approach (MOPA) (Leclère et al., 2016) to obtain a first rough speed estimate. The benefit of MOPA is its ease of use as well as its ability to deal with strong speed variations without the need for fine-tuning a bandpass filter. Once the initial speed estimate is obtained, this estimate is refined through the multi-harmonic demodulation (MHD) method, which does need an initial rough speed estimate in order to work properly (Peeters et al., 2022). However, MHD typically produces much more accurate speed estimates that are on par with a physical angle encoder. Afterwards, the estimated speed needs to pass a quality check to ensure it actually improves the ensuing processing steps and will lead to meaningful condition indicators.
Once the instantaneous angular speed is known, the data are angularly resampled and can then be used for further data cleaning steps. Typically, the data are separated into deterministic and stochastic signal content since gears and bearings are considered to primarily produce only one of these two distinct signal characterizations. Common methods to achieve this separation are cepstrum editing (Peeters et al., 2018b, 2017), discrete/random separation (Peeters et al., 2020), linear prediction coding (Antoni and Randall, 2004), self-adaptive noise cancellation (Ho, 1999), and phase editing (Barbini et al., 2017). This approach gives rise to a tripling of the signals to use for condition indicator calculation as there is now the raw signal and the deterministic and stochastic signals. Another commonly employed pre-processing technique is the usage of a filter bank (Antoni, 2021). Bandpass-filtering the signal prior to indicator calculation increases the sensitivity of the computed statistics to frequency-localized phenomena. Since a fault might be amplified by the transfer path from the source to the receiving sensor, resonances can play an important role in the detection through statistics of the fault (Randall, 2021). Hence, adding frequency dependency to the condition indicator calculation can greatly enhance the efficacy with which a pipeline is capable of early fault detection. One of the most popular examples of this aspect is the kurtogram (Antoni, 2007), which employs a binary–ternary filter bank to track the kurtosis of different frequency bands. Similar filter bank structures can also be used for statistics other than kurtosis (Peeters et al., 2019c).
After speed estimation and data cleaning, the final signal processing step is to compute condition indicators on the pre-processed data. For complex machinery, there are usually a lot of potential components that can fail, meaning that a very targeted approach is often not possible due to a lack of historical insights. Therefore, the most common approach is to calculate a wide array of indicators that look at all potential changes in a signal, be it in the time or the frequency domain. In the time domain, several statistics are calculated on all the pre-processed signals, i.e., the signals after deterministic/stochastic separation and filtering. Most of these indicators are common vibration analysis condition indicators such as RMS, kurtosis, crest factor, and negentropy. These indicator types can generally be characterized as quantifying either the Gaussianity or the stationarity of a signal (Antoni and Borghesani, 2019; Kestel et al., 2023). In the frequency domain the condition indicators are linked to the characteristic frequencies linked to the kinematics of the drivetrain. The harmonics produced by the gears and shafts are tracked in both the autopower spectra and the envelope spectra to check for increases in first- and second-order cyclostationarity that could be related to degradation (Napolitano, 2016). Also, the sidebands that surround the fundamental harmonics are tracked as they are often a useful indicator of degradation in the case of gear wear (Zhang et al., 2021). Due to the pre-processing and the computation of many different features, the total number of condition indicators typically ends up being in the hundreds or even thousands for a single sensor. Multiply that number by the number of sensors and machines and it becomes clear that manual investigation of each indicator trend very quickly becomes completely unfeasible for a human. The difficulty, however, is dealing with these indicators in an automated manner that allows for early fault detection while also avoiding too many alarms or false positives which would again increase the manual investigation work required. The next sections detail the proposed approach to handle such large sets of condition indicators in a reliable manner on a fleet-wide level.
2.2 Normal behavior models
Normal behavior or anomaly detection models are specialized in identifying data observations that deviate from the established pattern of normal behavior. NBMs are used in applications to identify abnormalities or outliers, such as fault detection, fraud detection, intrusion detection, and medical diagnosis (Chandola et al., 2009). It is crucial to define the normal behavior of the model to effectively detect anomalies. If the model is trained on data containing abnormalities, it may face difficulty identifying anomalies.
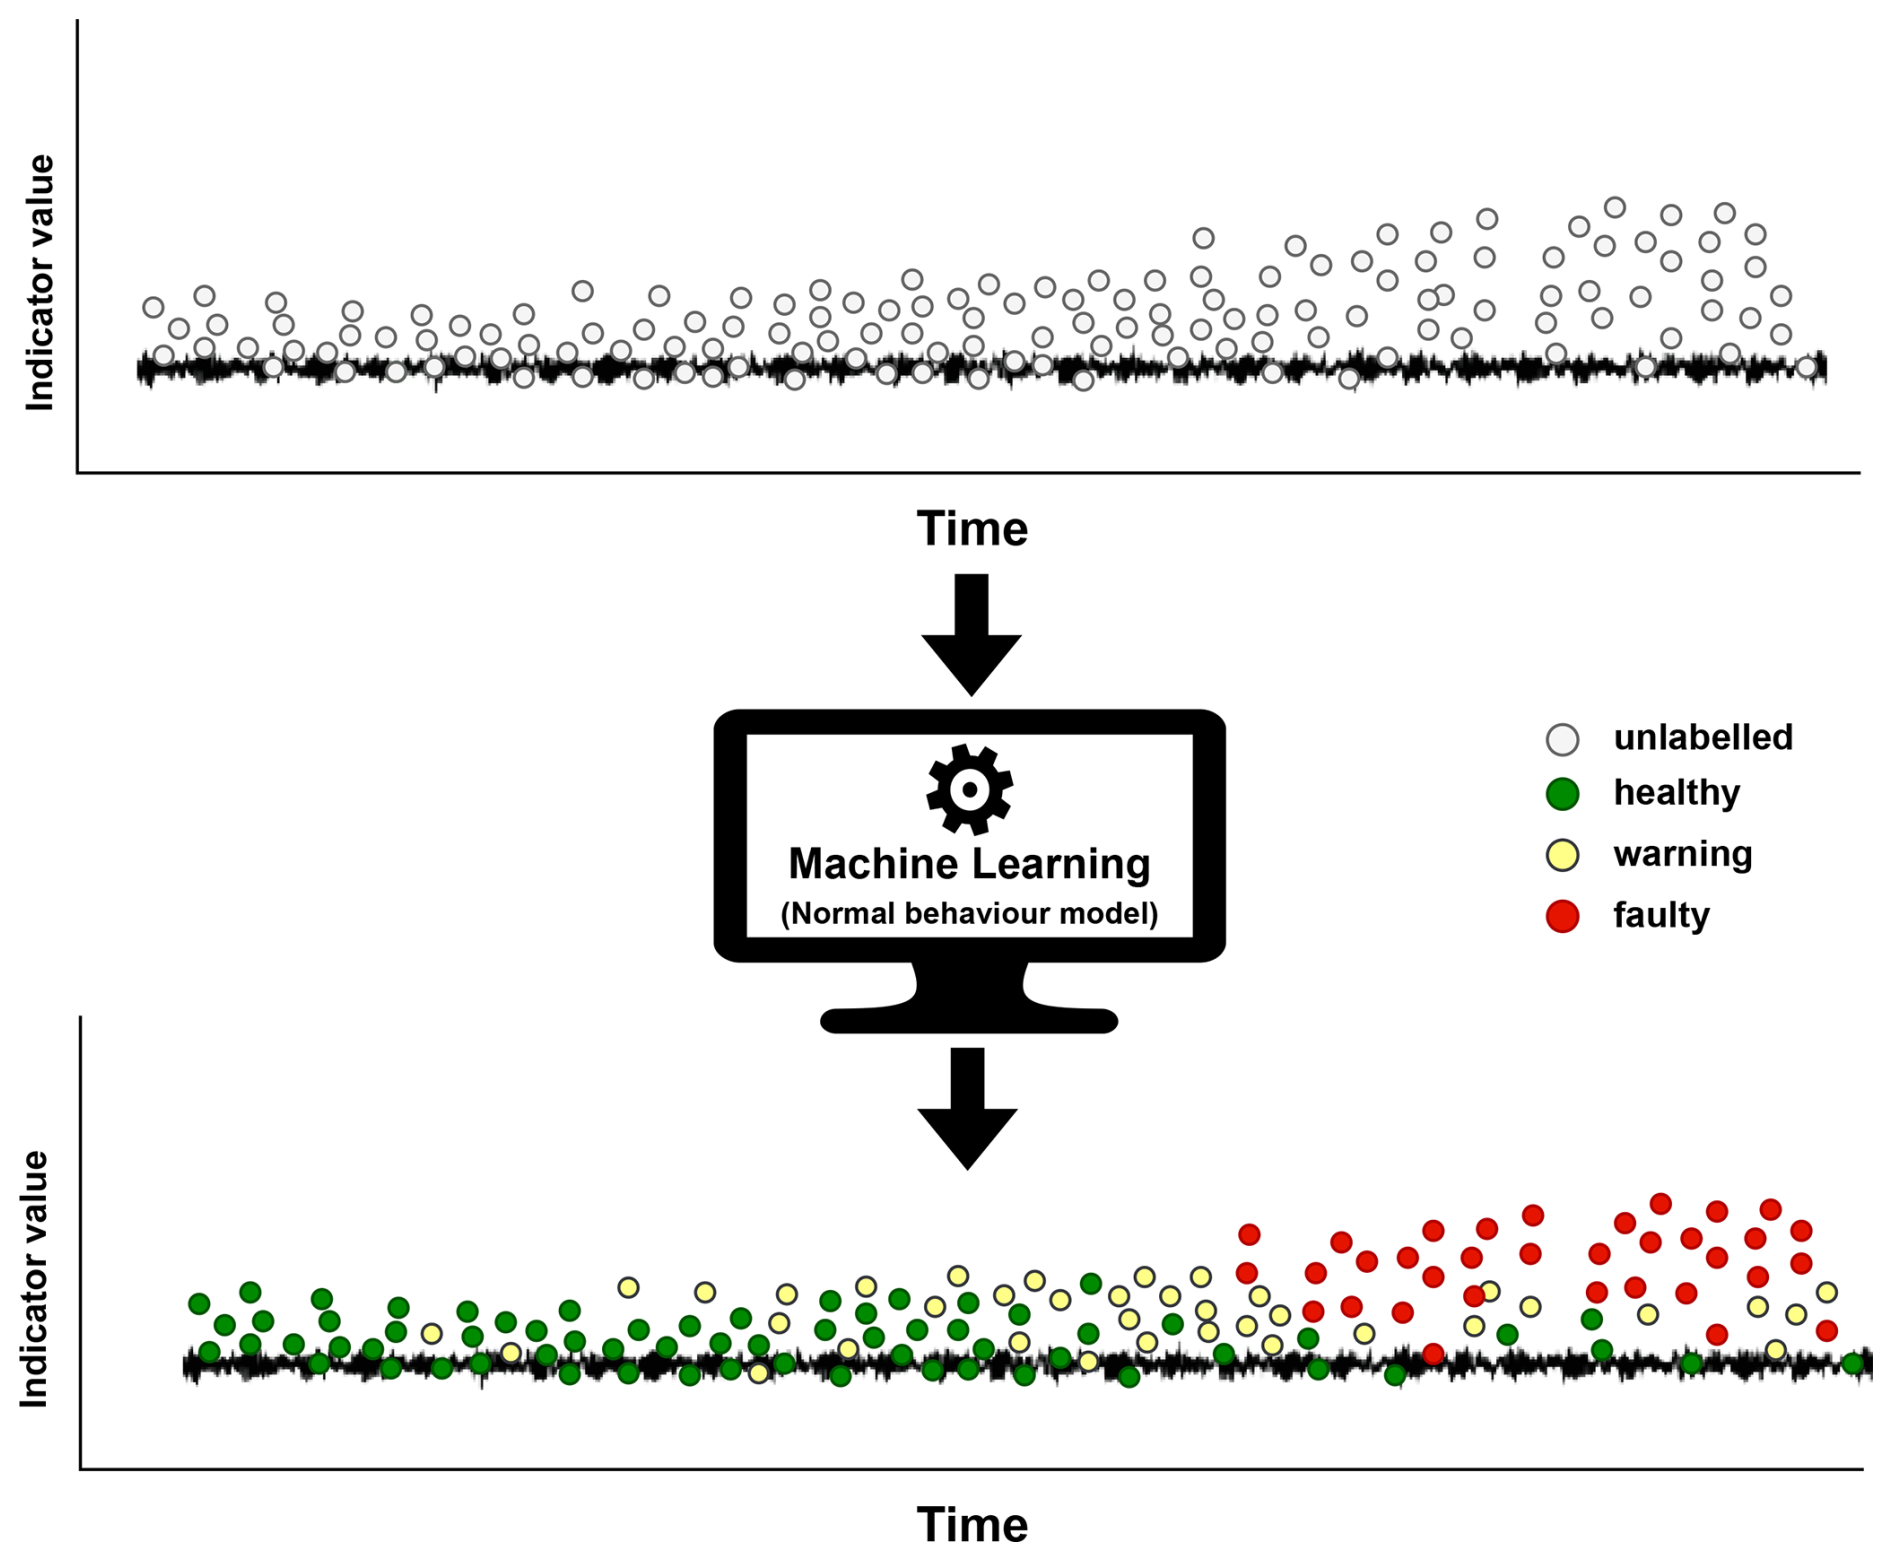
Figure 2The normal behavior machine learning models label the unlabeled indicators as healthy (green), warning (yellow), and faulty (red) states.
The proposed method relies on exclusively utilizing healthy data, ensuring that it does not incorporate faulty observations to detect mechanical faults.
The NBMs are trained using historical healthy data collected from sensors installed on wind turbine components. The proposed hybrid approach uses vibrational signals and SCADA data. Figure 2 illustrates that the trained NBMs take the unlabeled indicator as input and label them with healthy, warning, and faulty states at each timestamp. The condition indicators are derived from the vibration signal, while SCADA data are used together with the condition indicators for machine learning models. The NBMs learn the normal behavior of wind turbine components from the healthy data, and faults are detected when the model predictions observe deviations from the learned normal behavior. The wind turbine operates in complex weather and environmental conditions, which presents a greater challenge for fault detection methods due to varying wind speeds and changing operating conditions. A model trained on observations from a low-wind-speed operating regime could misclassify an observation as a fault when applied to observations from a high-wind-speed operating regime. The proposed method addresses this issue by incorporating a step to ensure operating condition independence to mitigate the influence of varying operating regimes. K-means clustering is used to segment the measured data into distinct operating regimes using wind turbine operational data. The operating parameters from the SCADA data, such as active power and rotation speed, are utilized to define these operating regime clusters. Before NBM predicts the health status of the associated indicator, the K-means clustering model, trained on the operating parameters of healthy data, assigns each observed data point to a corresponding operating regime. An individual NBM is trained for each indicator per operating regime. The objective of a machine learning model is to predict the value of a condition indicator based on the SCADA operating parameters. The model is trained on healthy data to predict indicator values reflecting normal behavior based on the input SCADA operating parameters. A fault introduces changes in the vibration signal, causing deviations from the expected normal behavior. As a result, the trained model can identify faults by comparing the difference between the predicted indicator value, based on the SCADA operating parameters, and the actual measured value. The active power and rotation speed are SCADA operating parameters which serve as the input features for the machine learning model to predict the expected value of a specific signal processing indicator target variable.
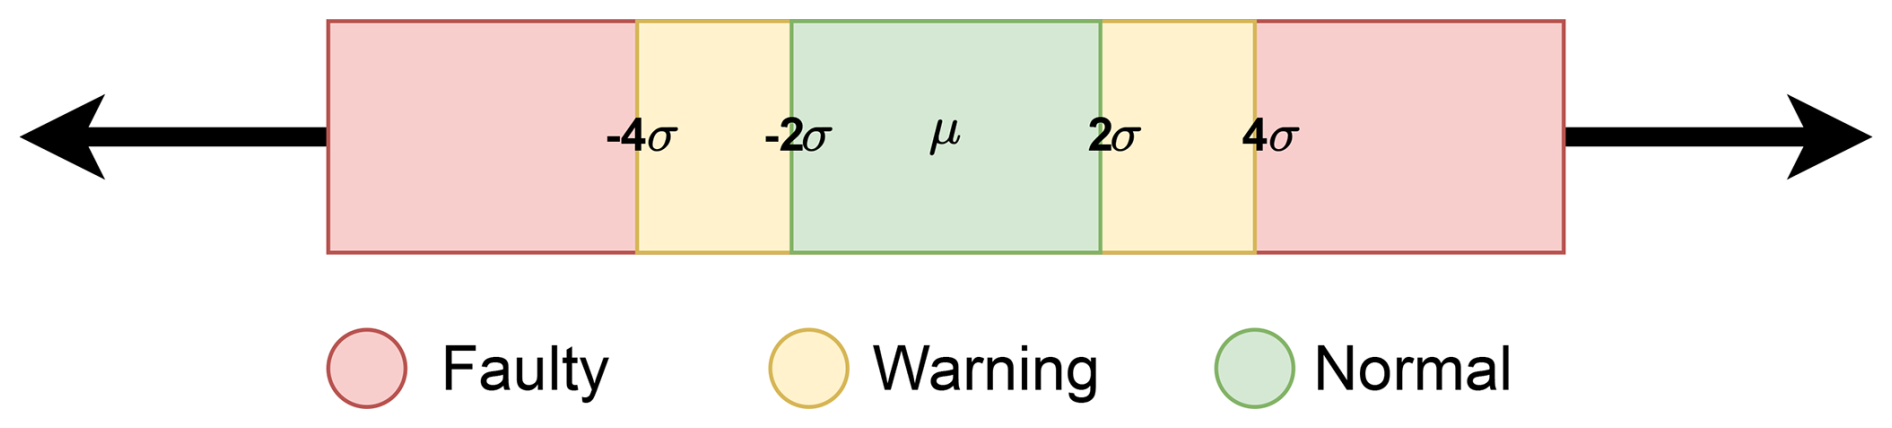
Figure 3A measurement is considered healthy when the difference between the measured and predicted indicator values falls within ±2 standard deviations, labeled as a warning when the difference is between 2 and 4 standard deviations, and classified as faulty when it exceeds 4 standard deviations.
Various regression models, including linear regression, Bayesian ridge regression, support vector regression, multilayer perceptron regression, and decision tree regression, are assessed as NBM. Among these, Bayesian ridge regression produced superior results. Consequently, it is selected for NBM, which is a Bayesian approach to linear regression with ridge (L2) regularization. It leverages probability distributions for the regression coefficients to estimate the model parameters and quantify uncertainty in predictions. This probabilistic framework is valuable for robust modeling and assessing the level of uncertainty associated with the model's coefficient estimates and predictions. Equation (1) represents the Bayesian ridge regression model.
In this equation, Y represents the condition indicator, the variable to be predicted. X1 and X2 correspond to the SCADA operational parameters as active power and rotation speed are the input variables or features of the model. The coefficients β0, β1, and β2 are model parameters, with β0 denoting the intercept term. In Bayesian ridge regression, these coefficients are considered random variables, enabling probabilistic modeling. The term ϵ represents the error term, accounting for data variability and noise. The NBM trained on healthy data predicts the indicator value corresponding to a healthy machine behavior based on the provided SCADA operational parameters. The machine's health status, specific to each condition indicator within its operating regime, is assessed by comparing the actual and predicted indicator values using the two-sigma rule, as illustrated in Fig. 3. Under this rule, deviations within 2 standard deviations of the predicted value are considered healthy, capturing approximately 95 % of the expected variation in a normal distribution. Deviations between 2 and 4 standard deviations are labeled as warnings, while those exceeding 4 standard deviations are classified as faults. The proposed thresholding approach enables early fault detection to provide operators with more time to plan and implement maintenance strategies. However, as sensitivity requirements may vary across applications, an extended n-sigma framework can be employed, setting the threshold at n standard deviations from the mean, to adapt the fault detection strategy to specific operational needs.
2.3 Alarming
While the individual labeled indicator trends are easy to interpret, observing a large number of indicator trends is challenging and quickly becomes entirely unfeasible for a large number of machines and sensors. The proposed method incorporates an alarming step to aggregate multiple indicators into a single high-level indicator. It provides a comprehensive global health status overview of wind turbine components, eliminating the need to inspect individual indicators separately.
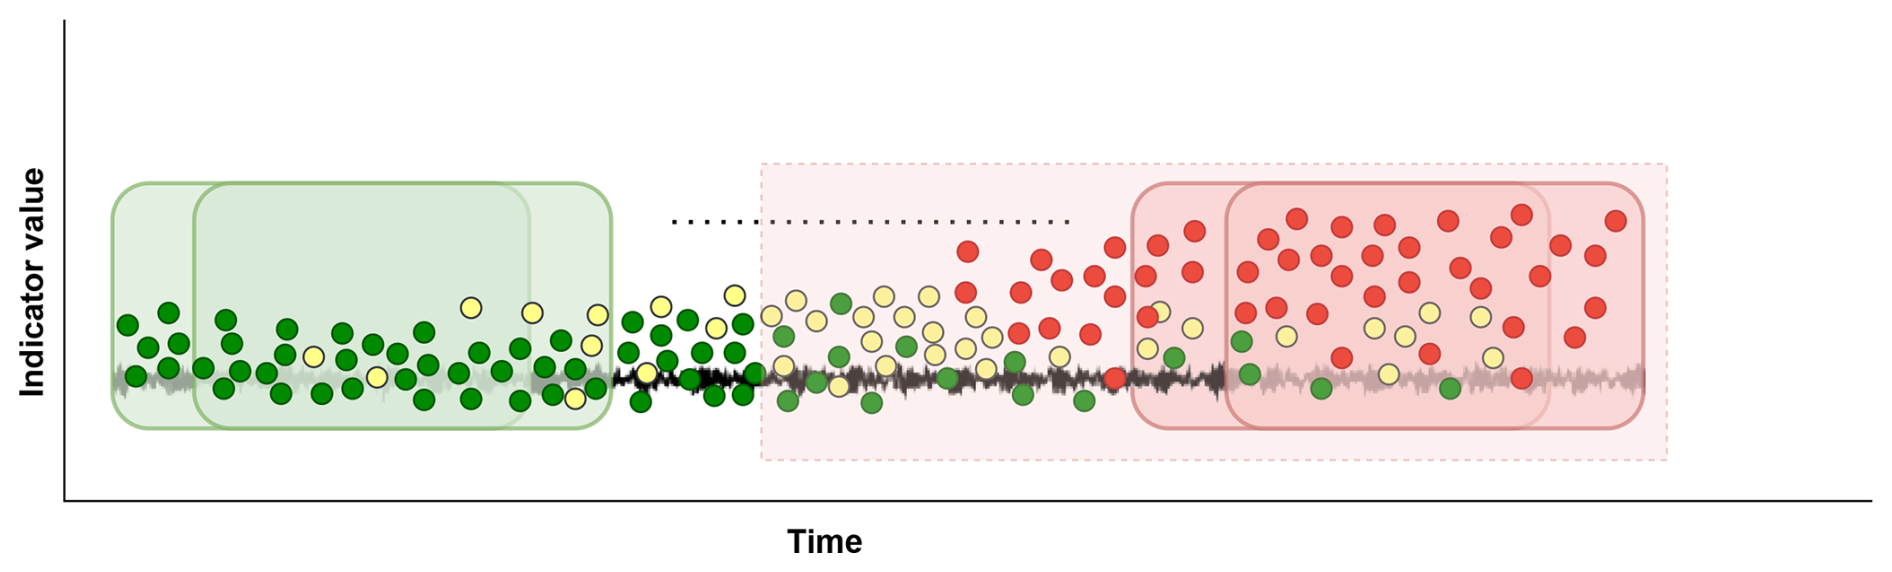
Figure 4The sliding window over a single indicator's time series to identify continuous faulty intervals based on labeled as a warning and healthy measurements determined by the NBM.
The high-level indicator is generated by applying a sliding window across the entire time series of each indicator to identify healthy, warning, and faulty intervals, as illustrated in the Fig. 4. A faulty interval represents consecutive detected faulty windows. A sliding window spanning 60 d is utilized, as measurements are taken at intervals of 10 s approximately every 2 or 3 d. Each measurement is assigned a value of 0, 0.5, or 1, corresponding to healthy, warning, or faulty predicted states by NBM, respectively. The status of each window is determined as healthy or faulty by counting the number of warning and faulty measurements based on these assigned values. The mean of the assigned values is calculated, and if the mean is equal to or greater than 0.3, the window is labeled as faulty. To eliminate outliers, any faulty interval shorter than 1 month is excluded.
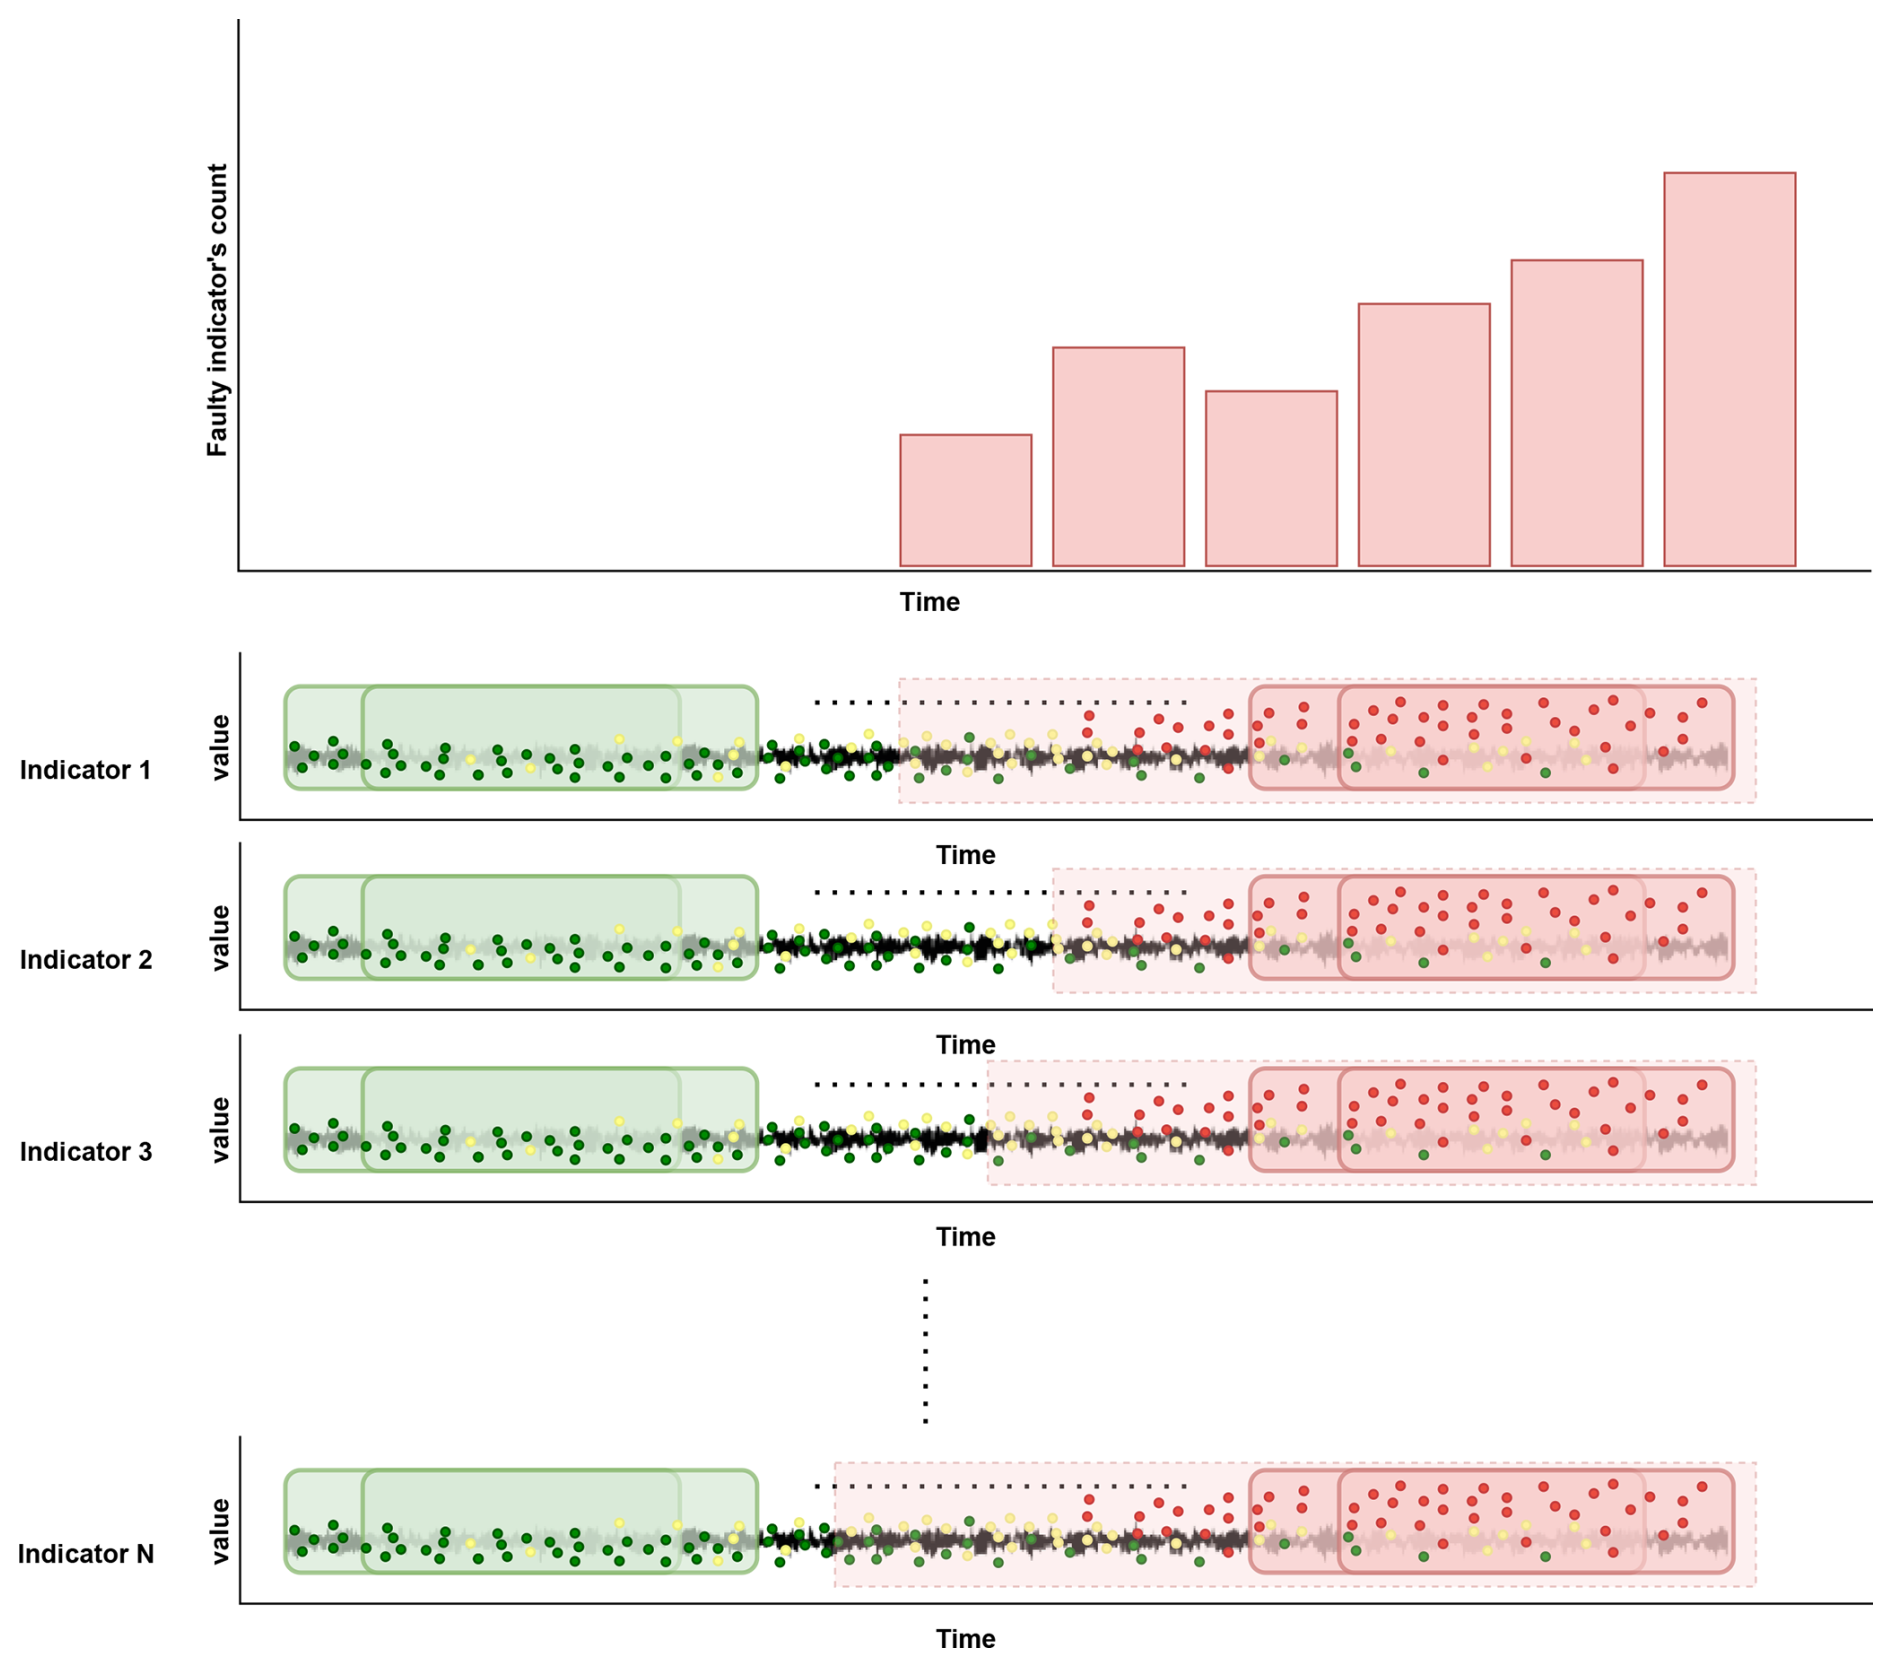
Figure 5The high-level health indicator is derived by combining data from various indicators computed from a single sensor's raw vibration signal. It provides an idea of the number of indicators detecting fault trends at a timestamp.
As shown in Fig. 5, the high-level indicator is an aggregation of all indicators computed from a single sensor's vibration signal, providing a high-level health status overview of the components on which it is installed. This high-level indicator depicts the indicators observing faulty intervals. The high-level health indicator is derived by adding the number of indicators having a labeled faulty interval during a month. The high-level indicator is visually represented as a bar plot, showcasing the number of signal processing indicators that are observing faults during 1 month. Early-stage faults are initially detected by a limited set of signal processing indicators. As the fault's severity progresses more indicators start observing the fault trend. Furthermore, our proposed method allows experts to examine individual indicators tracking fault trends, facilitating a more detailed examination of the identified faults.
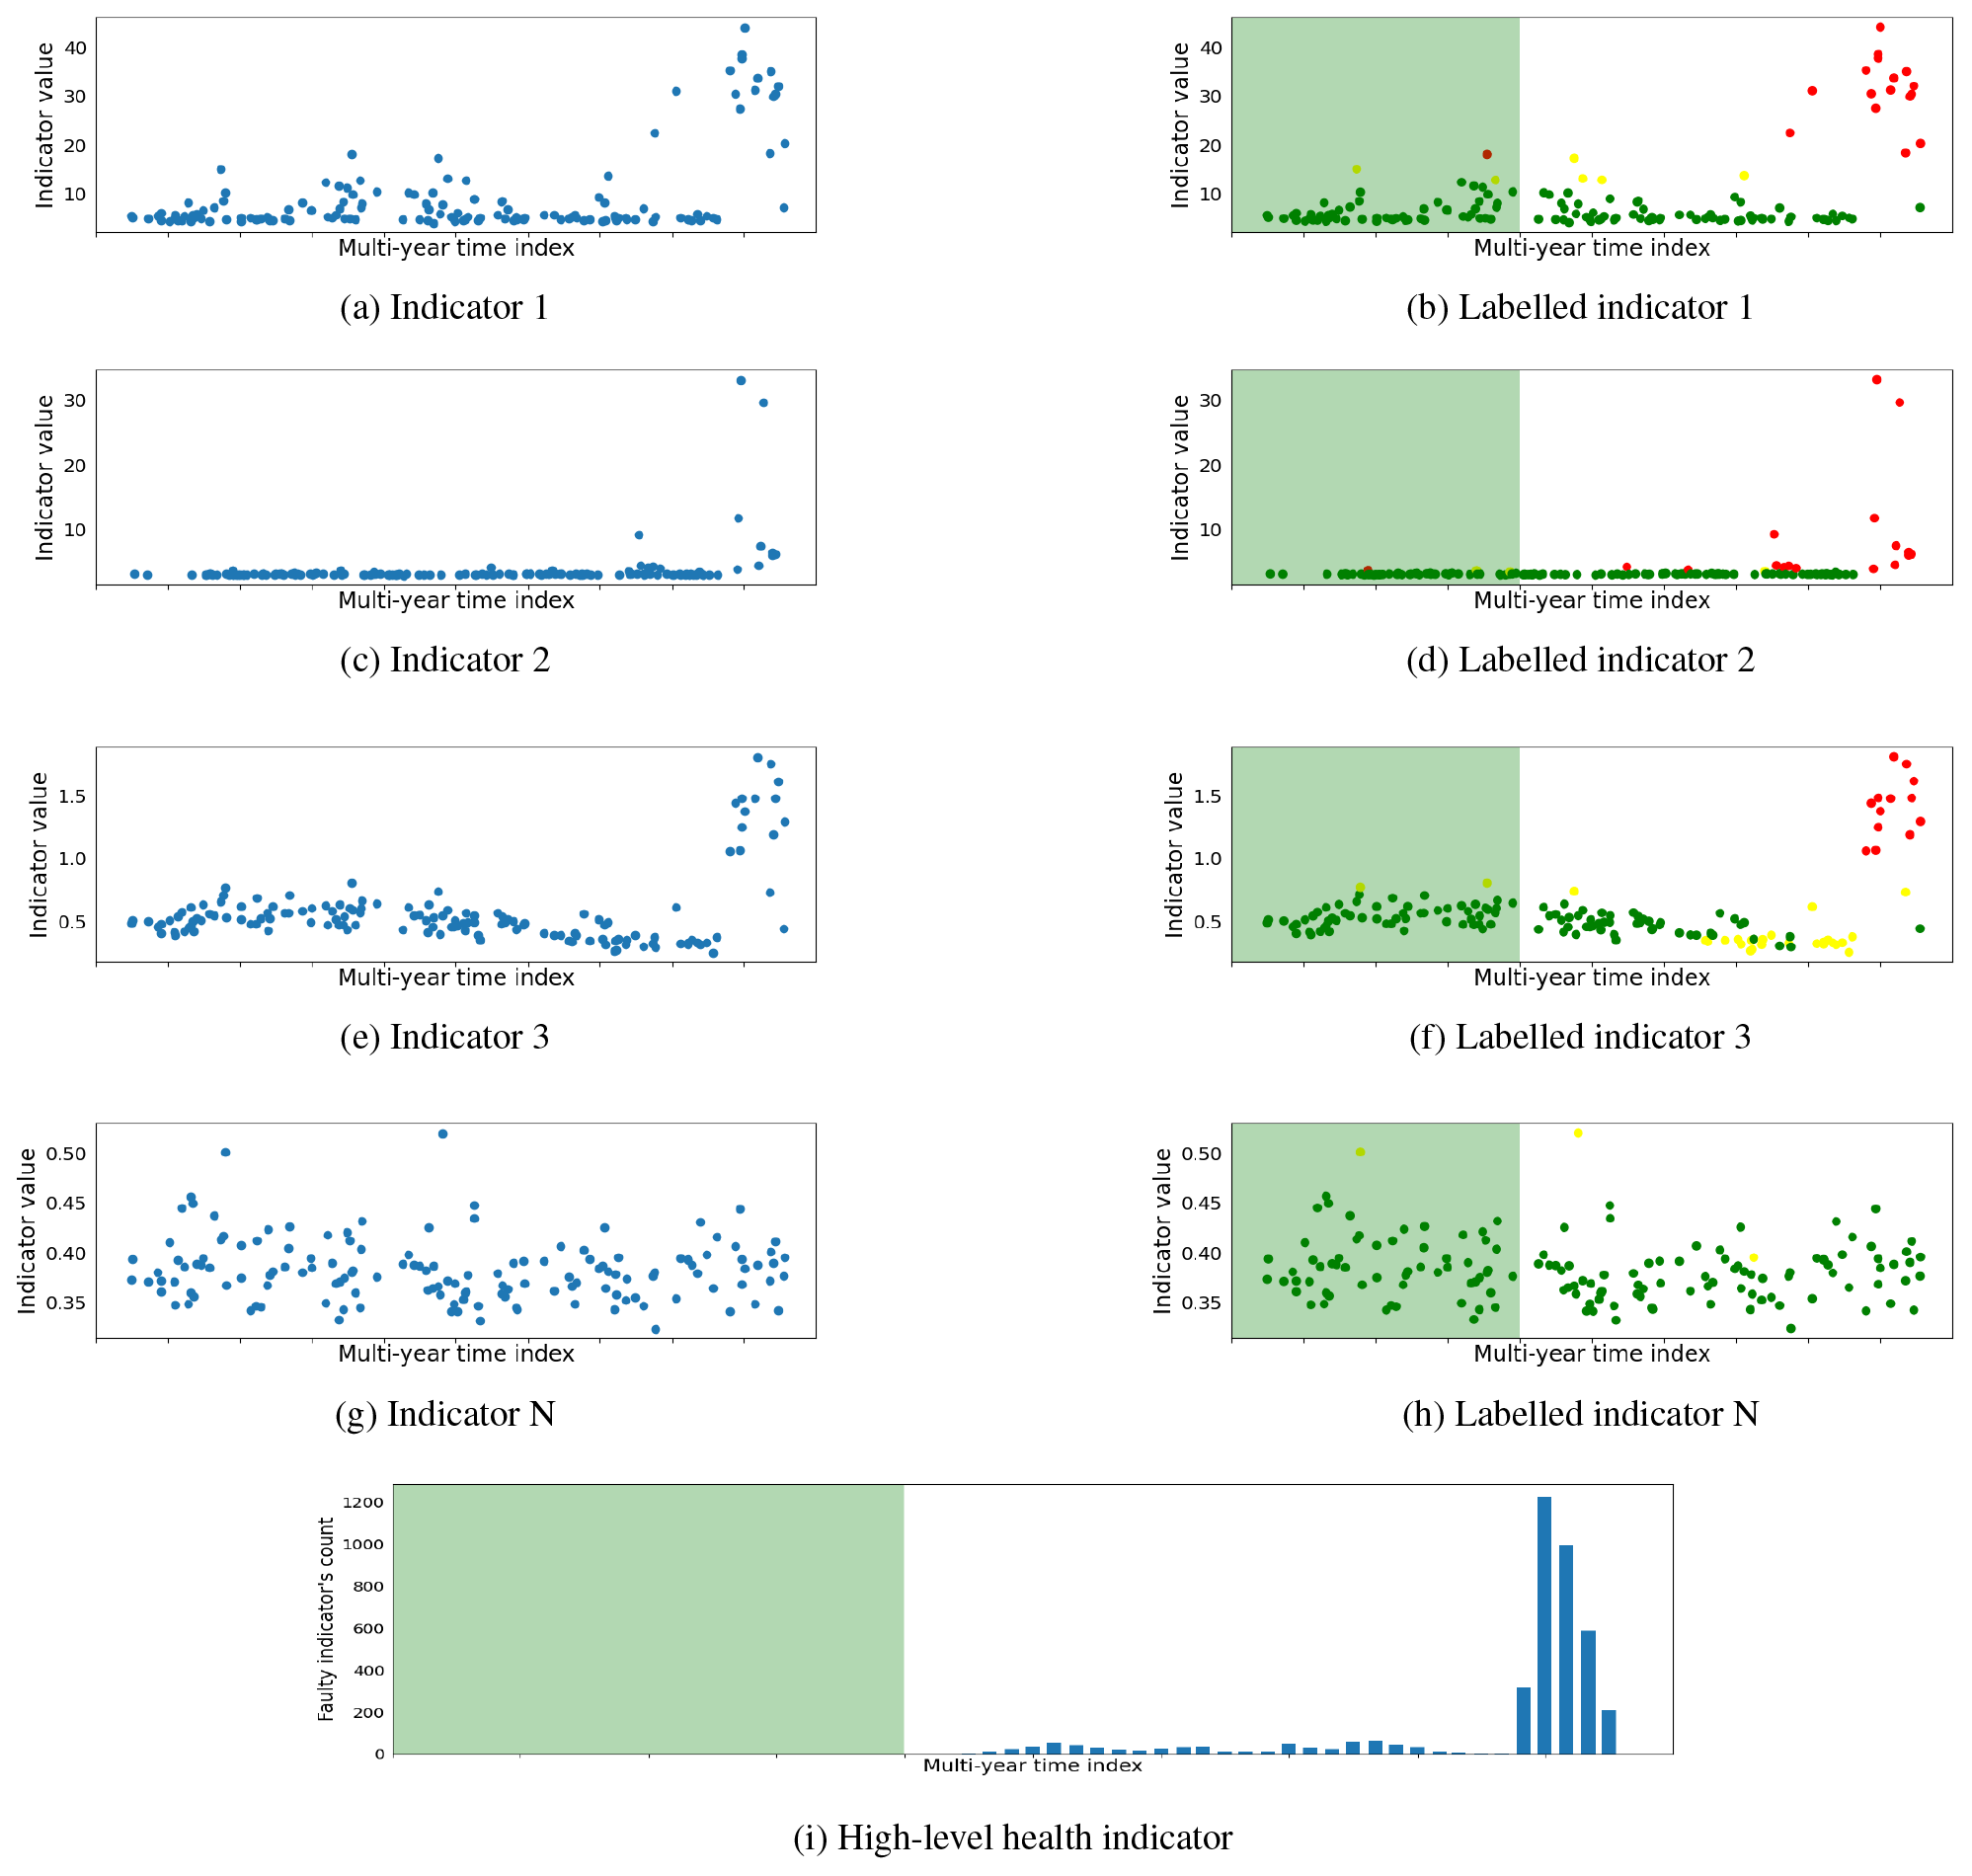
Figure 6A planetary stage channel fault is detected by multiple low-level signal processing indicators and then also depicted in the high-level health indicator. The fault is later confirmed in a comprehensive bore scope inspection.
The proposed method is validated on a wind farm comprising more than 50 wind turbines. For the analysis, data are collected at a sampling frequency of 20 kHz using strategically positioned accelerometers on the wind turbine drivetrain components. This data collection process involves measuring data for 10 s during a single measurement every 2 to 3 d over several years. Consequently, an approximate total of 150 measurements are obtained each year. From these individual raw vibration signal measurements, multiple signal processing statistical and frequency domain indicators are derived. The signal processing indicators are computed from the raw vibration data obtained by a single sensor. To assess the variability in wind speeds and its influence on the wind turbine's operating conditions, the data are segmented into four distinct operating regimes before the NBM training phase. A distinct NBM is trained for each computed indicator per operating condition to label the indicators with healthy, warning, or faulty state at each timestamp. Approximately 1 year of healthy data are used to train the NBMs, ultimately enabling the ability to track an indicator's fault detection trends over multiple years. The labeled indicators are combined into a single high-level health indicator for each sensor located on a specific wind turbine drivetrain component at a particular position. The detected faults by the proposed method are subsequently confirmed via manual bore scope inspections conducted by engineers on the drivetrain components.
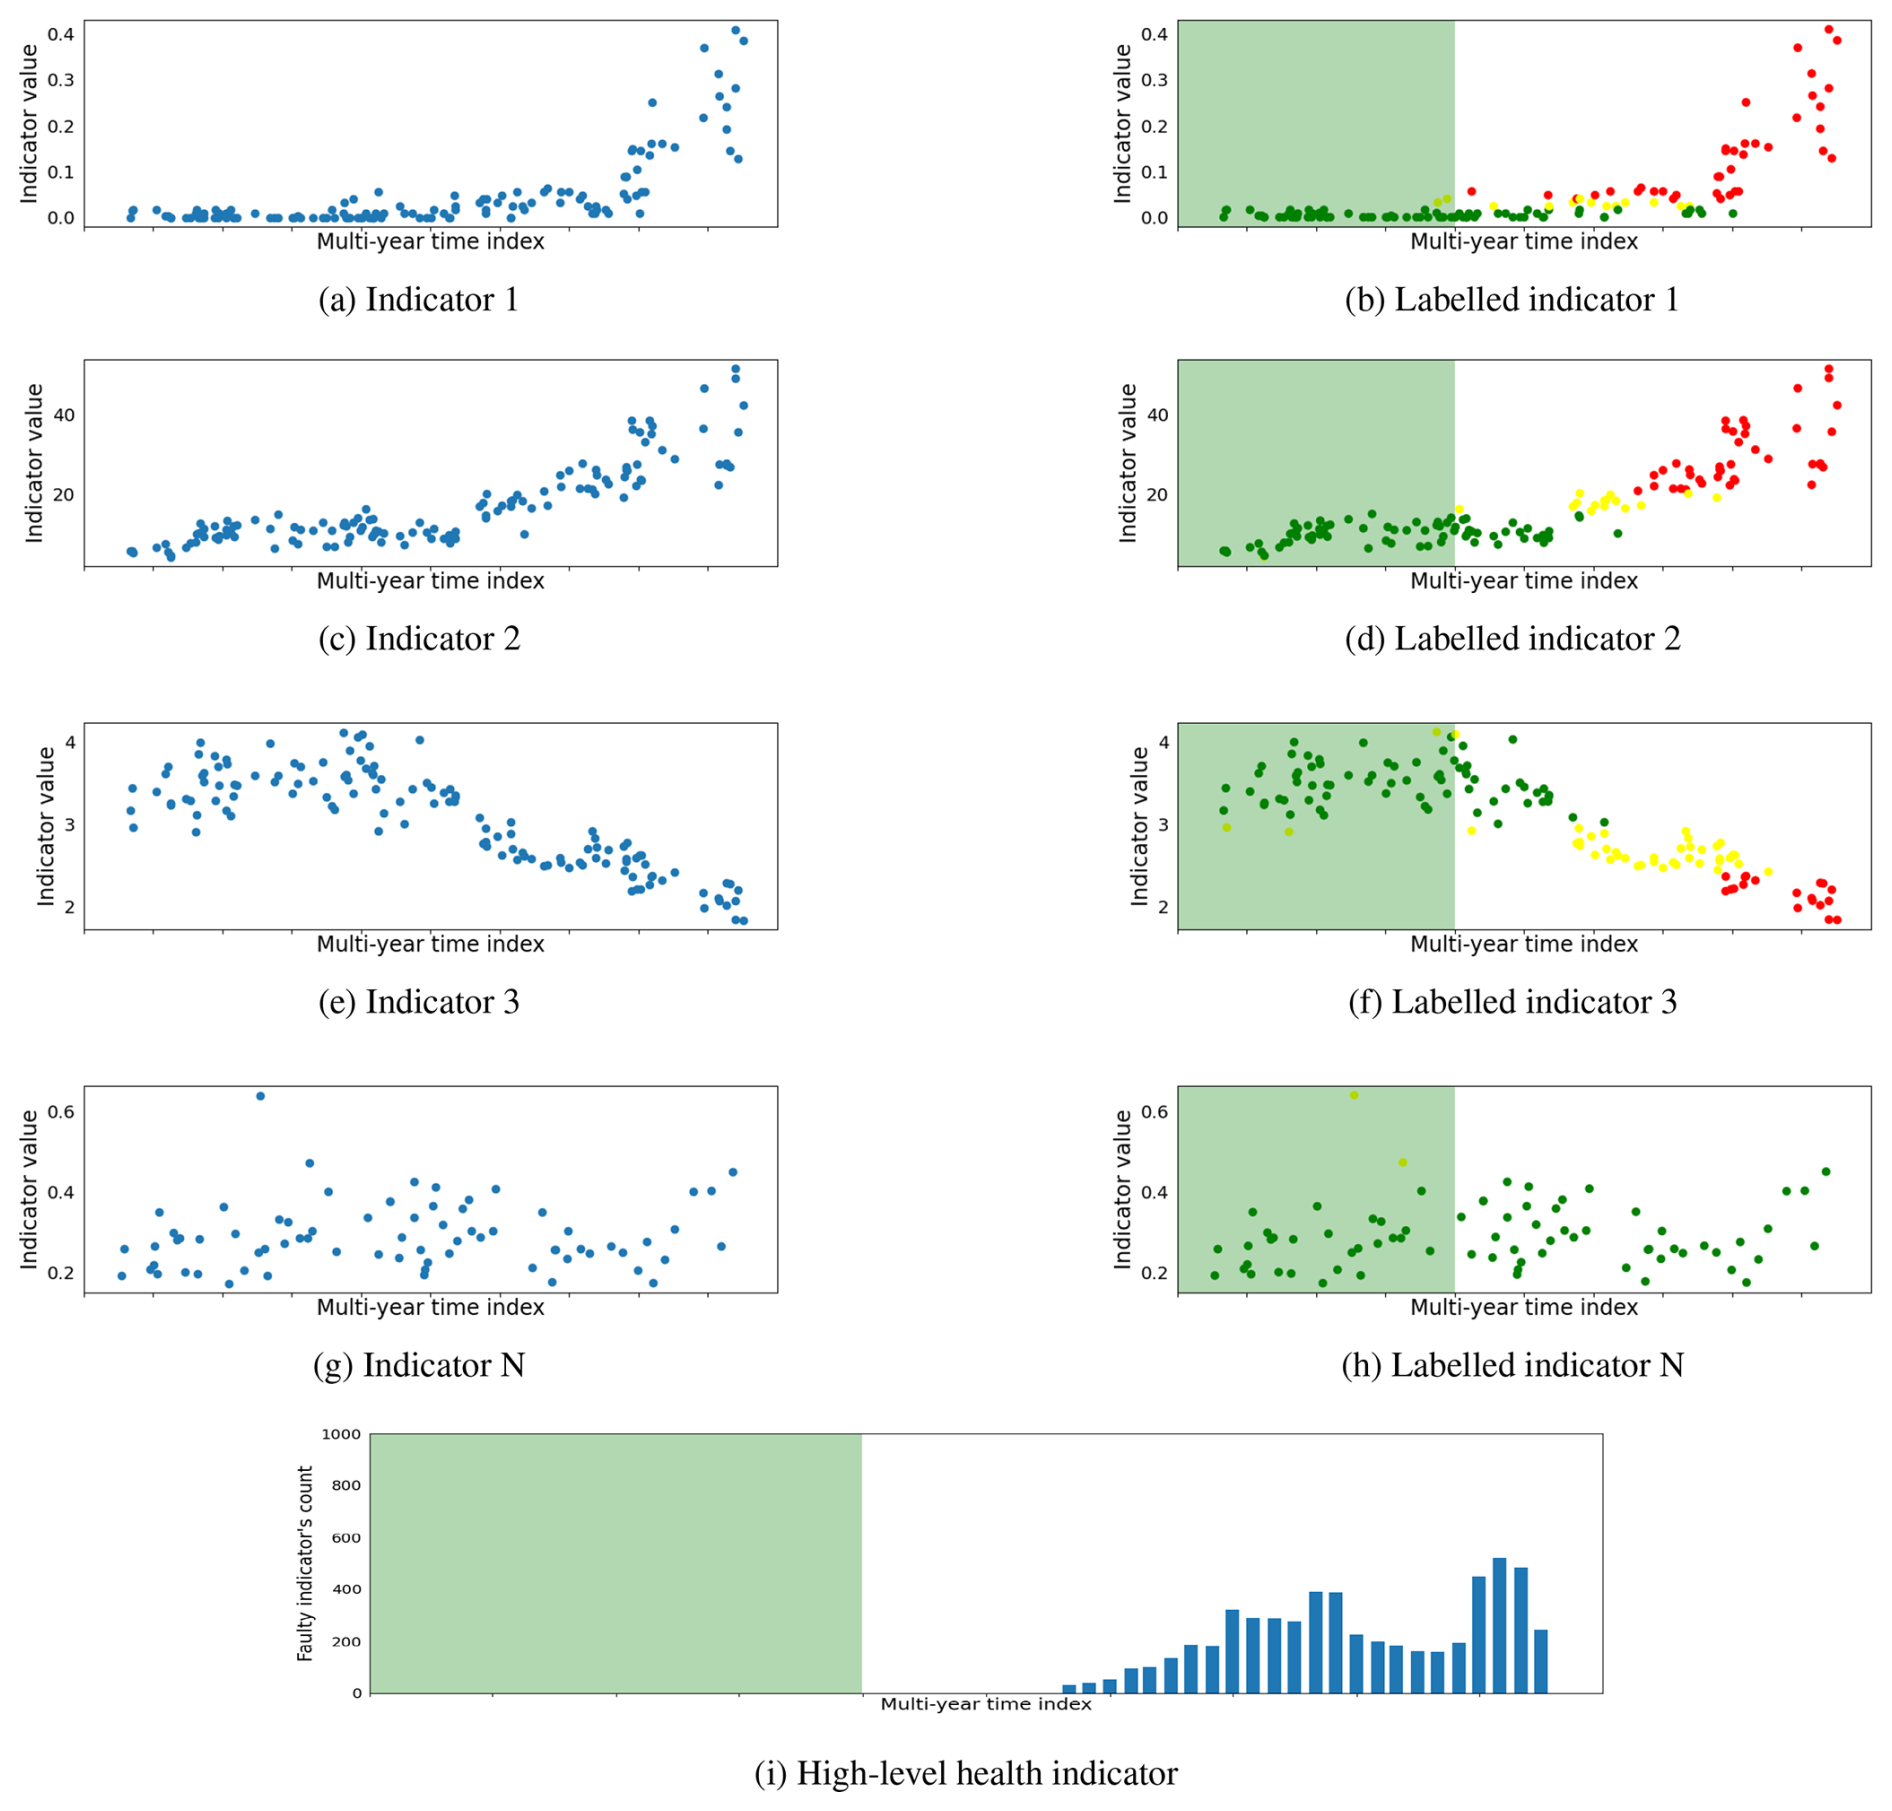
Figure 7A generator channel fault is detected by multiple low-level signal processing indicators and then also depicted in the high-level health indicator. The fault is later confirmed in a comprehensive bore scope inspection.
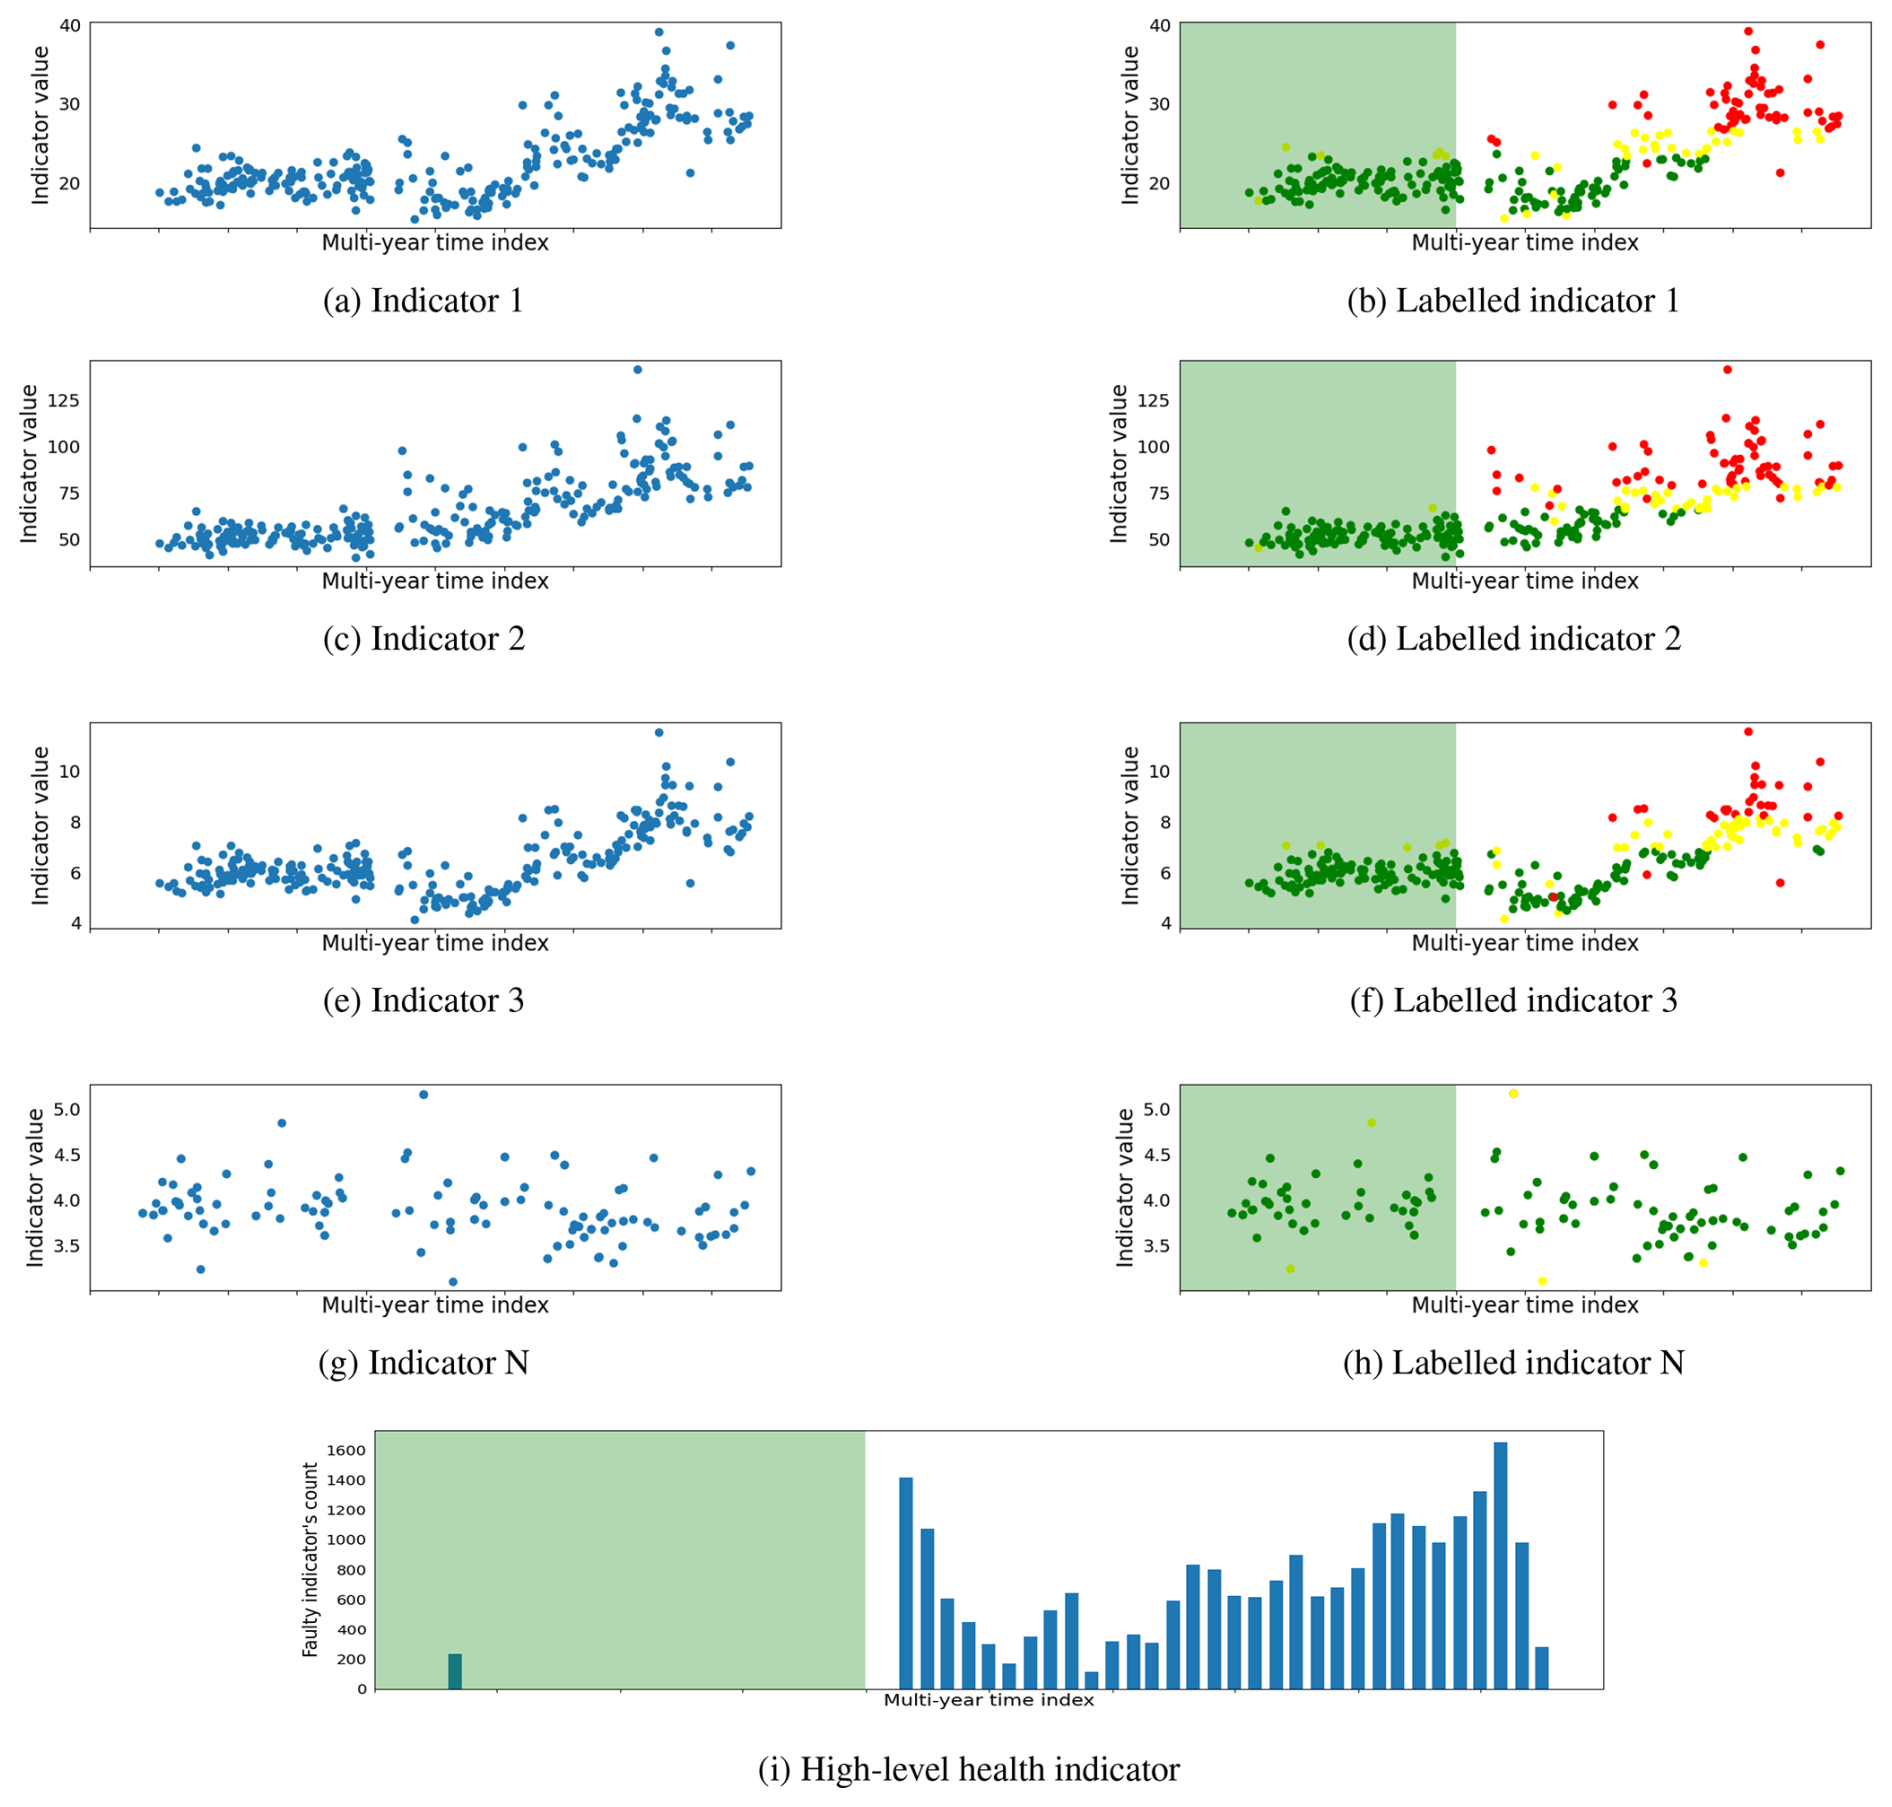
Figure 8A high-speed stage channel fault is detected by multiple low-level signal processing indicators and then also depicted in the high-level health indicator. The fault is later confirmed in a comprehensive bore scope inspection.
The proposed method is validated on an entire offshore wind farm. Due to confidentiality constraints, specific information about the wind farm or individual wind turbines cannot be disclosed. Consequently, plots have been generated with anonymized axes to showcase the results while preserving the confidentiality of the sensitive information. However, for the purpose of the result demonstration, a detailed analysis of four specific cases is presented in this section. These cases include three instances of fault detection at different wind turbine life stages and one where the wind turbine remains consistently healthy throughout the observation period. This section elaborates on these diverse fault cases associated with different wind turbine drivetrain components to offer a comprehensive illustration of the proposed method's ability to detect faults within rotating components of the drivetrain. Figures 6, 7, and 8 depict the faulty scenarios, while Fig. 9 illustrates a healthy case. These visual representations showcase the results obtained at three distinct stages of the proposed method. Each figure demonstrates the proposed method output at three different stages, including the derived signal processing indicators, the machine learning labeled indicators categorized as healthy, warning, and faulty, and a high-level health status overview illustrating the counts of faulty indicators. The x axis represents the time of observation spanning multiple years, while the y axis displays the values of indicators in both labeled and unlabeled plots. Additionally, the signal processing labeled indicators, determined by the machine learning NMBs, indicate the health status of the indicator at a specific timestamp. It is denoted by green, yellow, and red colors for healthy, warning, and faulty states, respectively. In the high-level health indicator plot, the y axis represents the count of indicators observing fault trends. The green shaded area on the labeled and high-level health indicator plots represents the training healthy period for NBMs. Although the green area spans 2 years in the figure, it is important to note that a substantial number of measurements are missing during the initial year. Consequently, the actual healthy data measurements are approximately equal to 1 year.
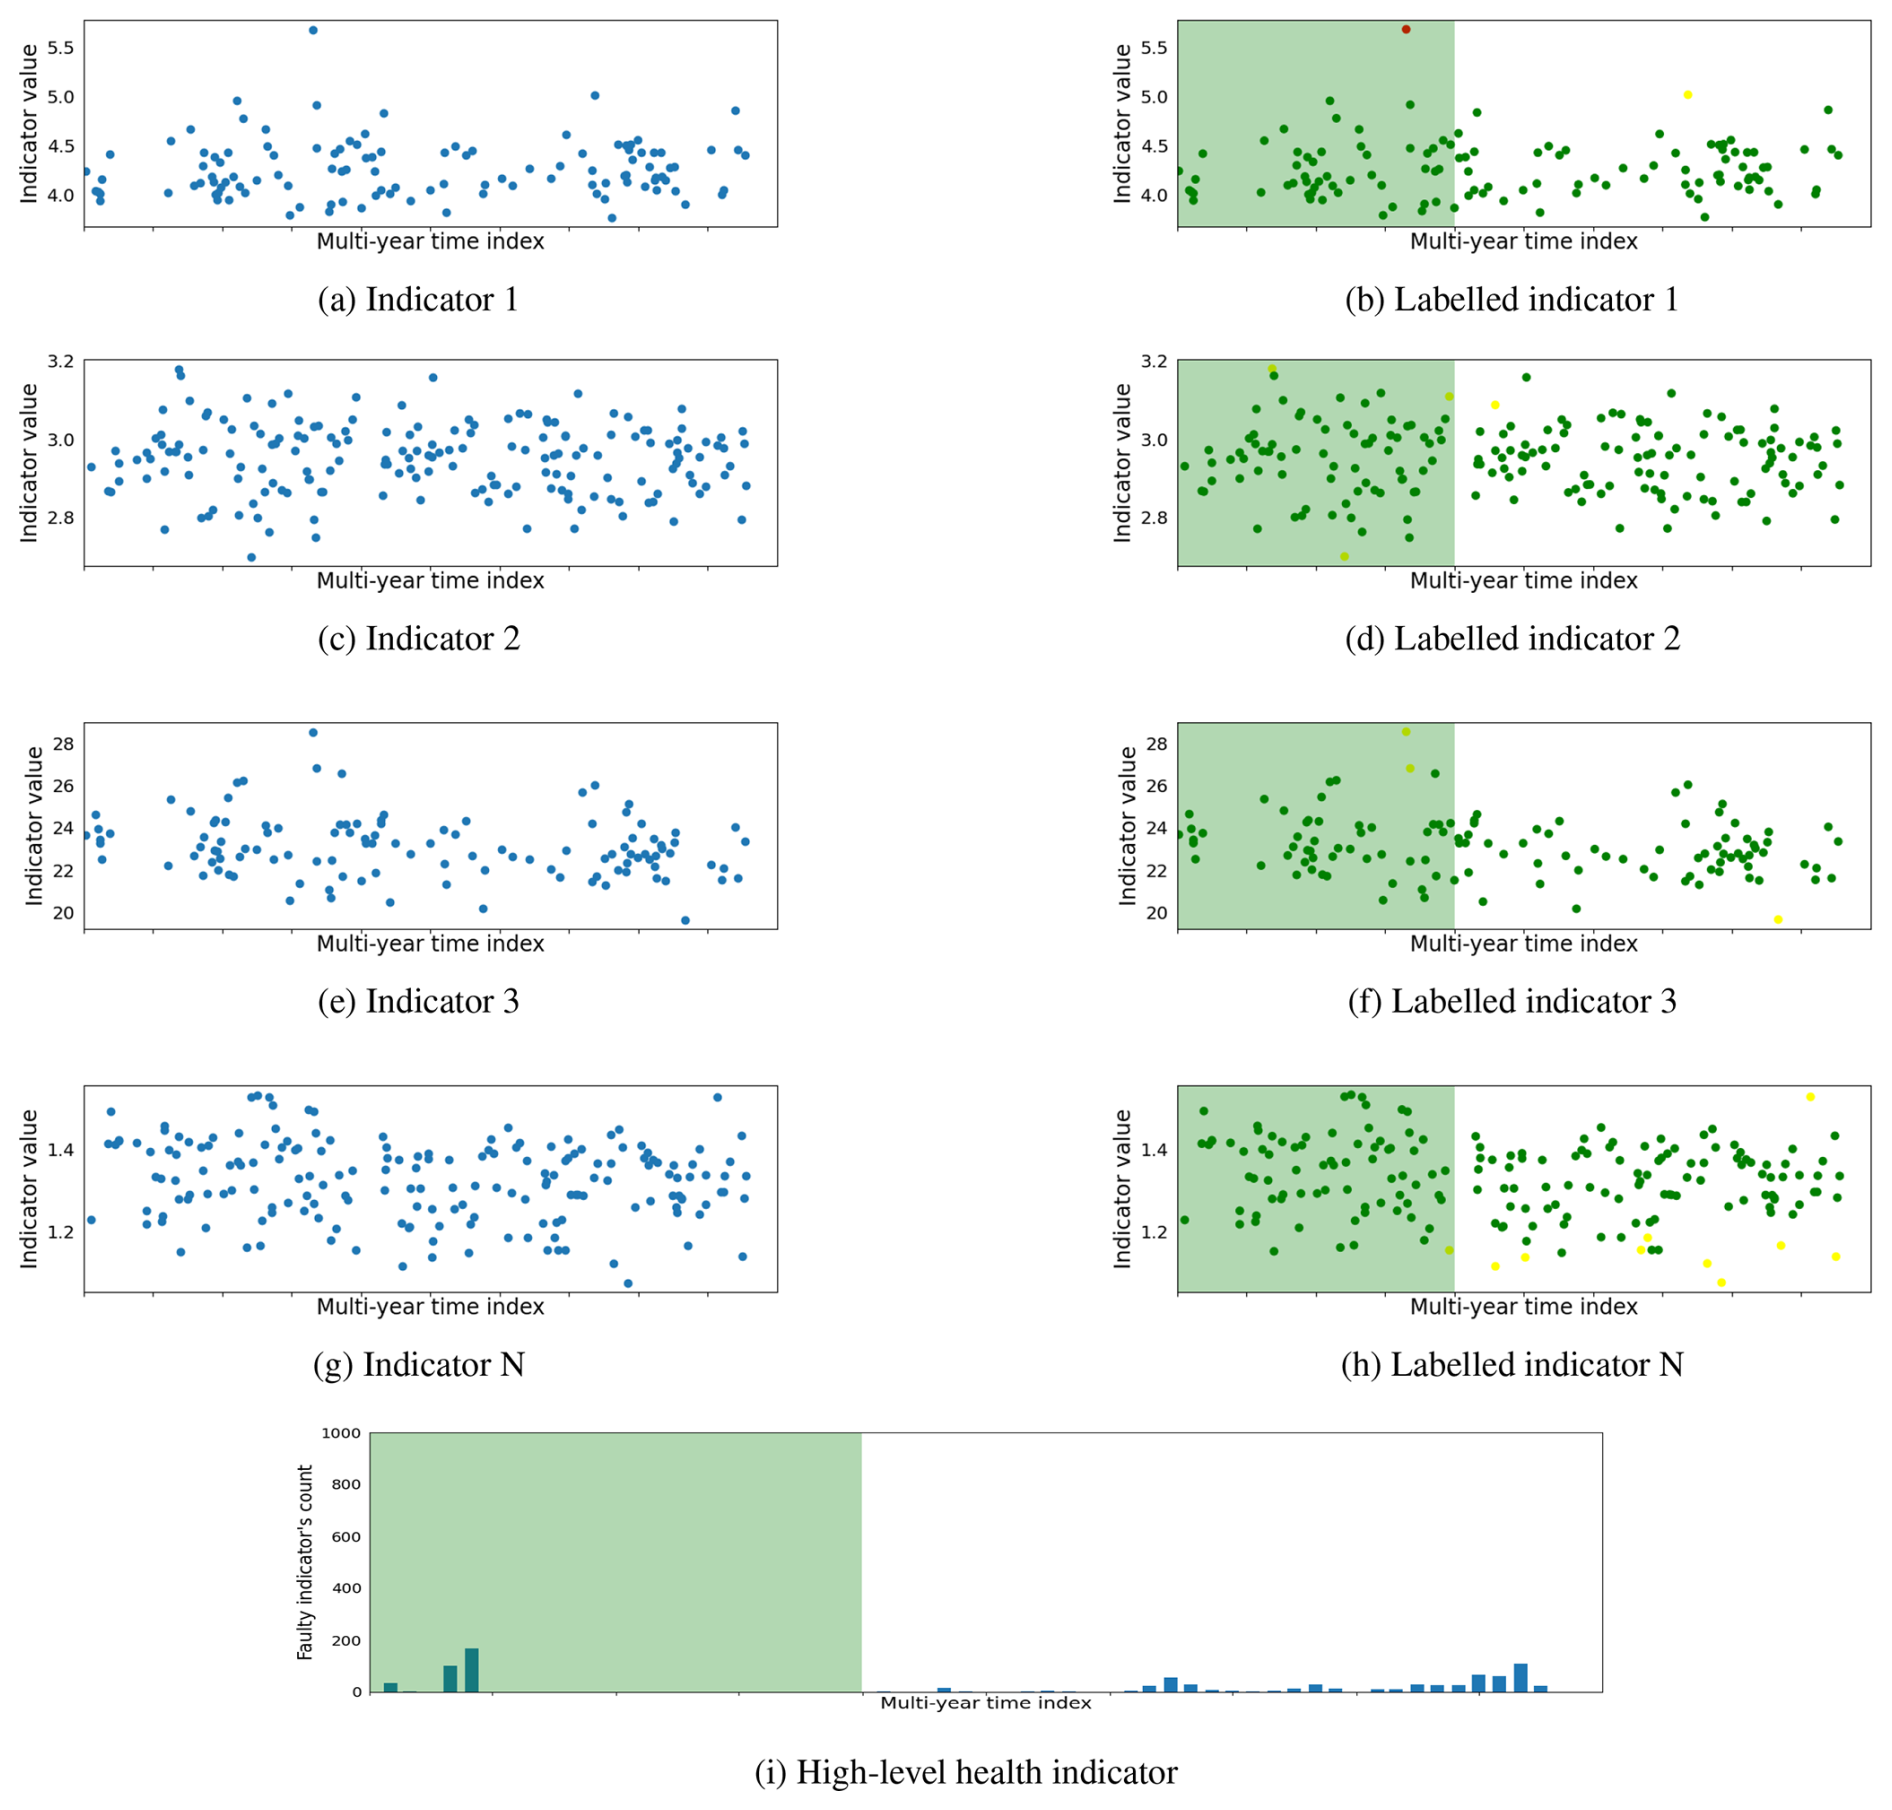
Figure 9A planetary stage channel healthy case depicted a healthy state throughout the observed time period.
The planetary stage channel fault is depicted in Fig. 6. It is challenging for signal processing indicators to detect early-stage planetary stage channel faults. Therefore, a notable impulsive increase in the number of indicators observing faults is observed instead of gradual growth in indicator fault trends. The manual inspection revealed indentations on the planet gear and ring gear teeth. Additionally, standstill mark damage is observed on the rollers of the planet gear bearing. Figure 7 illustrates a generator channel fault, observing a gradual increase in the number of indicators detecting fault trends in proportion to the fault's intensity. In the early stages of the fault, only a handful of indicators observe the fault, but as the fault progresses, an increasing number of indicators begin to depict fault trends. Notably, the early detection of the generator channel fault, along with the incremental rise in the number of indicators observing faults over time, allows wind farm operators more time for maintenance planning compared to the immediate surge in indicators observed for the planetary stage channel fault. The high-speed stage (HSS) channel fault case is shown in Fig. 8, where a significant number of indicators commenced detecting fault trends at the early stage of the fault. This early response signals the introduction of a fault, which engineers confirm through manual inspection; this revealed abrasive wear on the roller flange of the generator-side HSS bearing. In contrast to faulty cases, the case of a healthy planetary stage channel is depicted in Fig. 9. The signal processing indicators do not detect any significant fault trends. However, a few indicators exhibit minor fault observations during the typical run-in period when the moving mechanical components are still settling. Furthermore, a minimal fault trend is observed towards the end, but it lacks significance compared to the faulty cases. The healthy case is also verified through a manual inspection, where all bearings and gears exhibit no signs of wear or damage and are found to be in good condition.
4.1 Performance analysis
The proposed method is validated using real wind farm data, which presents challenges in performance analysis due to data imperfections. A key challenge is the uncertainty in the exact timing of fault initiation; however, fault cases are confirmed through manual inspection. Therefore, fault cases identified during a manual inspection are considered actual faults, while the remaining cases are classified as healthy. Additionally, fault-related frequencies may appear in channels monitoring neighboring components, which further complicate the fault detection. Since precise details about real wind farm data are unavailable, the following assumptions are made to define true positives (TPs), true negatives (TNs), false positives (FPs), and false negatives (FNs):
-
TP: the model correctly identifies a manually confirmed fault as faulty.
-
TN: the model correctly classifies a healthy case as healthy.
-
FP – false alarm: the model incorrectly predicts a healthy case as faulty.
-
FN – missed fault detection: the model fails to detect a fault and incorrectly classifies it as healthy.
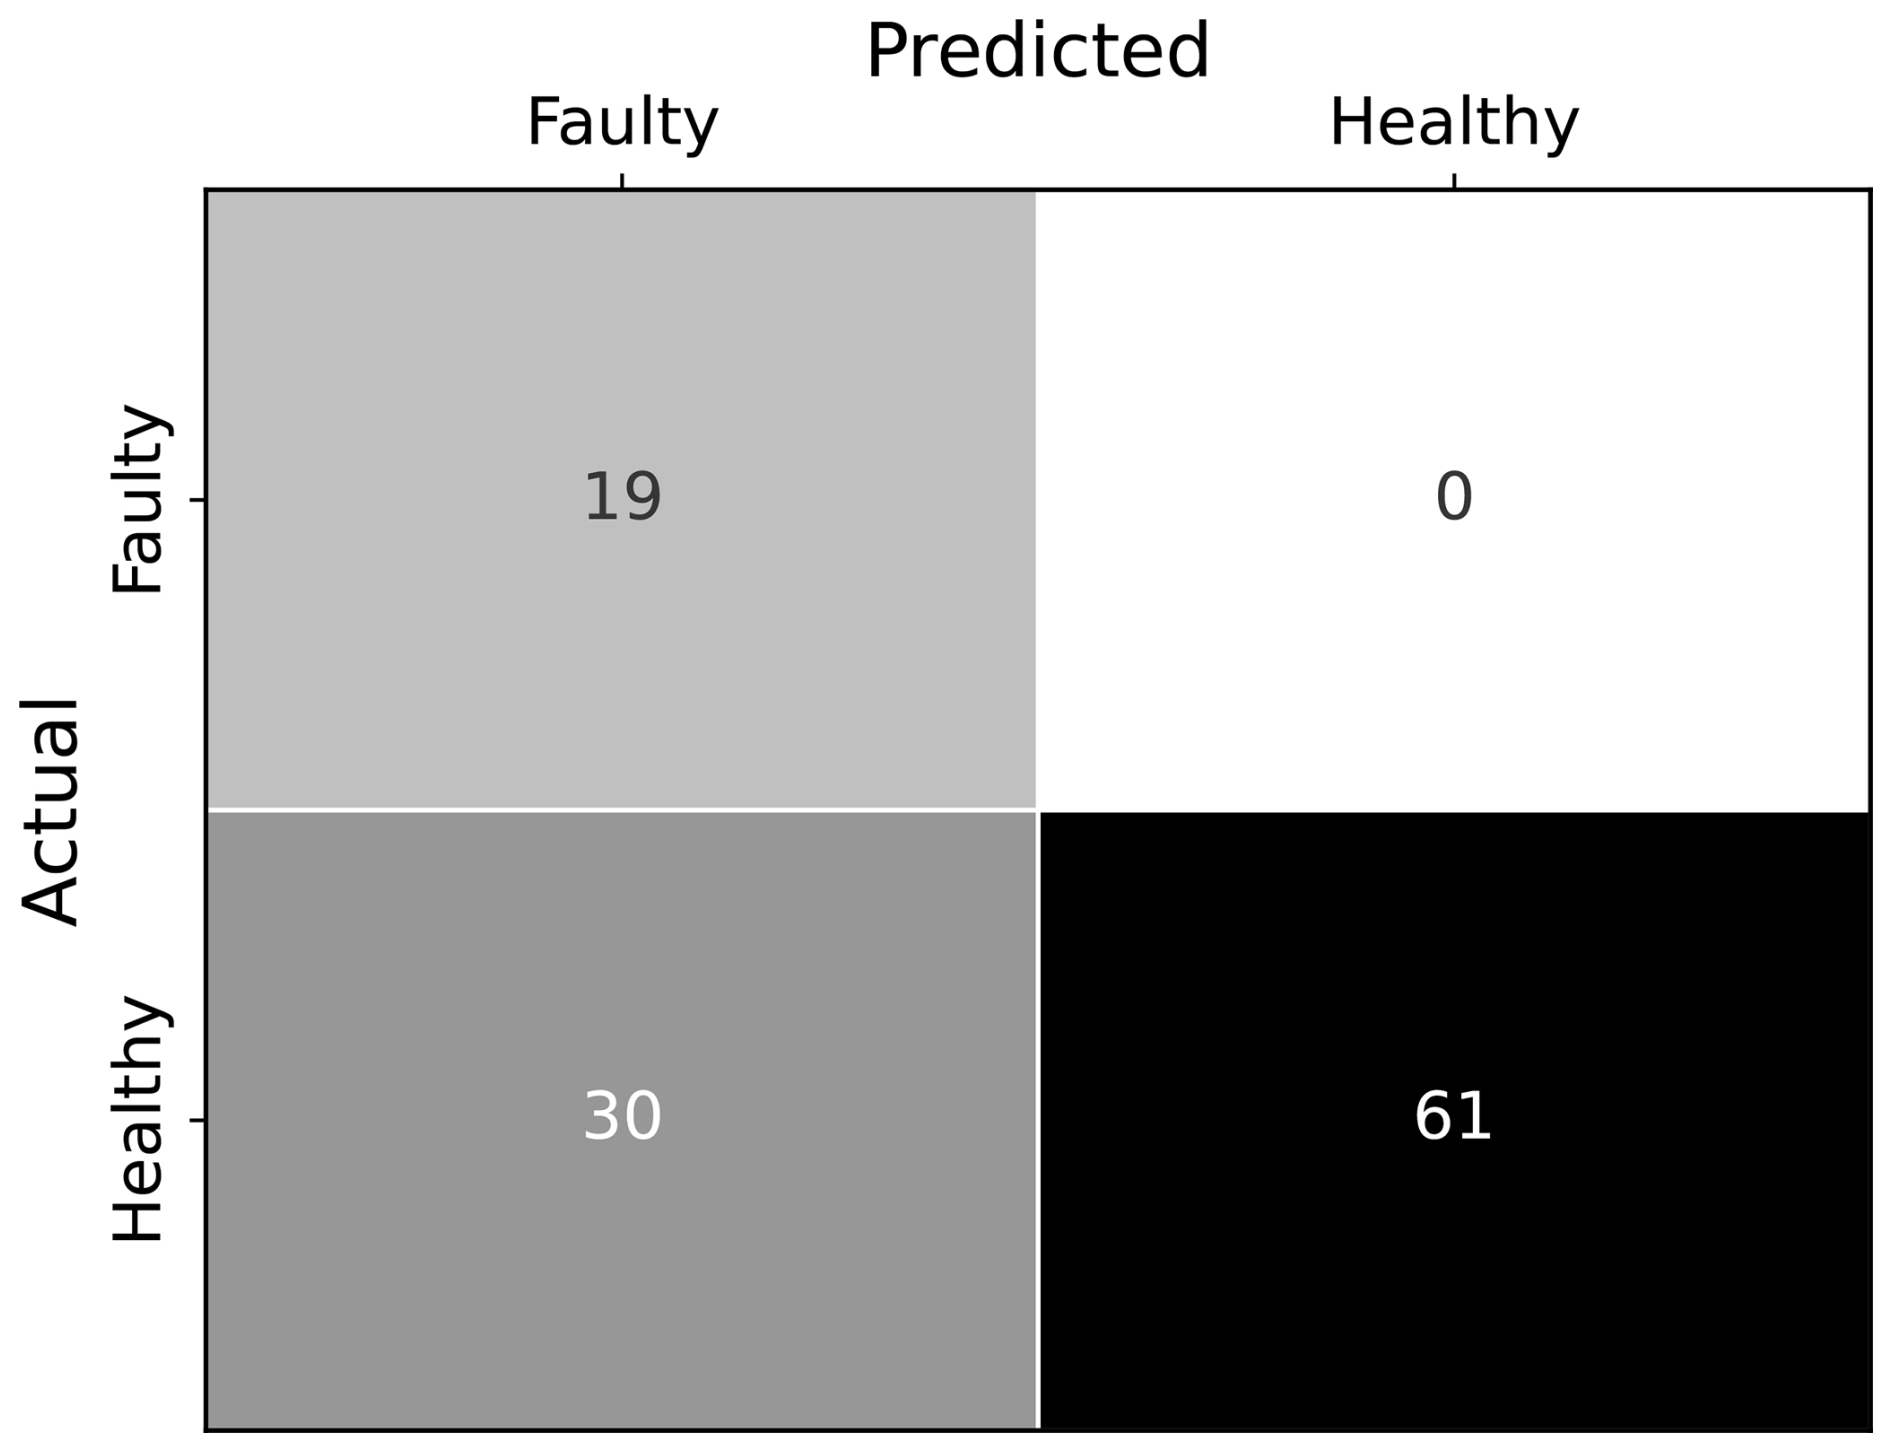
Figure 10Confusion matrix of the fault detection method with 19 true positives, 0 false negatives, 30 false positives, and 61 true negatives.
The performance of the proposed method is evaluated on 10 wind turbines, where manual inspection confirmed faults in 19 drivetrain components of eight turbines. A confusion matrix is created to evaluate the performance of the proposed method based on the assumptions defined for TP, TN, FP, and FN. The confusion matrix, as shown in Fig. 10, indicates 19 TPs, 0 FNs, 30 FPs, and 61 TNs. The method successfully detects all faults confirmed during manual inspection and does not predict confirmed faults as healthy. However, there are several reasons for false-positive predictions. An early-stage fault may not be confirmed during manual inspection, and the channel monitoring a healthy component might register fault frequencies from neighboring components. The validation dataset consists of data from 10 wind turbines, with 19 confirmed faulty drivetrain components identified through manual inspection, while the remaining 91 channels are considered healthy. Due to the data imbalance, the model's performance cannot be effectively evaluated using standard precision, recall, and F1 score metrics. Instead, weighted precision in Eq. (2), recall in Eq. (3), and F1 score in Eq. (4) are calculated to provide a comparative performance assessment, where Nf and Nh are the number of actual faulty and healthy cases, respectively. Similarly, Precisionf, Recallf, and represent the precision, recall, and F1 score for the faulty label, respectively. On the other hand, Precisionh, Recallh, and represent the precision, recall, and F1 score for the healthy label, respectively.
Table 1 presents the evaluation metrics – precision, recall, and F1 score – for faulty and healthy cases, along with their weighted averages. The results show that the model achieves high recall (1.00) for faulty cases, ensuring all confirmed faults are correctly detected. For the healthy case, the model demonstrates perfect precision (1.00), meaning all predicted healthy cases are healthy. However, the recall of 0.67 for the healthy class indicates that some actual healthy cases are misclassified as faulty.
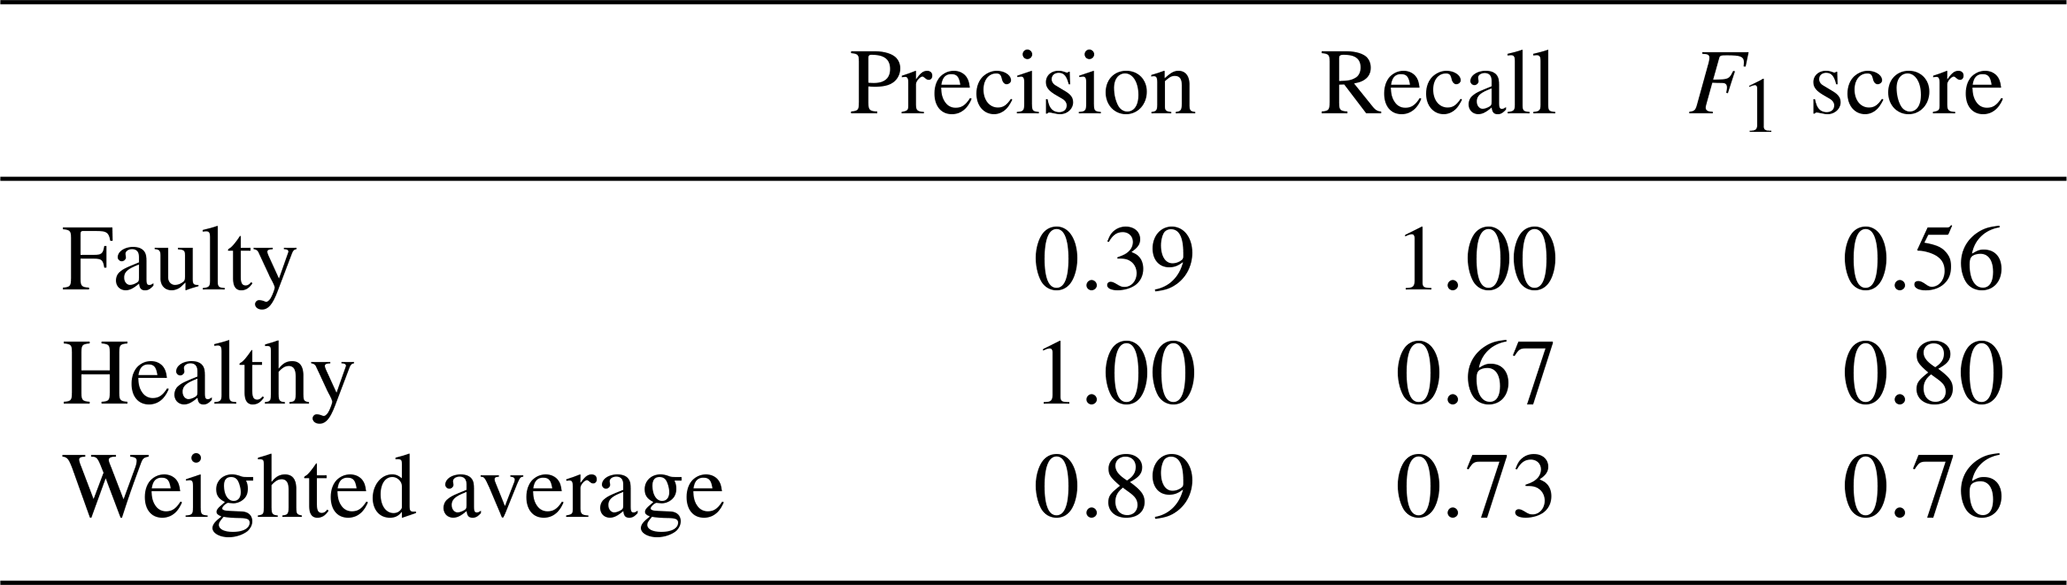
The weighted precision (0.89) indicates that the model's prediction, across both healthy and faulty cases, is 89 % correct. However, the weighted recall (0.73) suggests that the model correctly identifies 73 % of actual healthy and faulty cases. Ideally, both precision and recall should be high, but in practice, there is a trade-off between false positives (FPs) and false negatives (FNs). Increasing recall may reduce false alarms (FP) but could lead to missed fault detection (FN). Balanced accuracy, as defined in Eq. (5), is a performance metric used to evaluate a model's accuracy when dealing with imbalanced datasets. The model has achieved a balanced accuracy of 84 %, highlighting its reliability in accurately predicting fault cases.
For effective fault detection, it is crucial to minimize false fault alarms while ensuring no fault detection is missed. Moreover, real wind farm data validate the method's real-world applicability but present challenges, since only faulty cases are labeled with certainty. Therefore, an accurately labeled dataset is essential for precisely evaluating the performance of the proposed method.
The proposed hybrid method combines physics-based signal processing indicators with machine learning techniques to detect faults in wind turbine drivetrains. The labeled signal processing indicators, which include healthy, warning, and faulty states, can be easily analyzed without expert knowledge. Furthermore, the high-level health status provides an overview of wind turbine components' health without requiring the inspection of individual condition indicator trends. This proposed method can serve both engineering experts and non-expert operators, offering them a health status overview tailored to their needs. A non-expert operator can gain a high-level understanding of the fleet's health to plan upcoming maintenance campaigns, while an expert can obtain a more detailed overview to understand the nature of the fault and determine the specific maintenance requirements for a particular component. The method has been validated across all wind farm drivetrain components, with bore scope inspections confirming the results. For demonstration purposes, we discuss four cases in this study, where data have been observed over multiple years. A total of 1 year of healthy data are used to train the NBMs in the training phase. The drivetrain components observe the faults at different stages of their life cycle. Early fault detection of the planetary stage gears and bearings is often particularly challenging and typically leads to only minor increases in condition indicator trends which are difficult to detect manually. The proposed hybrid pipeline accurately tracks the degradation of the planet gear, ring gear teeth, and planet gear bearing roller faults through the high-level alarm trend. In the remaining two cases, the generator and HSS channel faults are identified at an early stage, and an increasing trend is observed in the high-level indicator. The fault trends observed by the proposed hybrid method are confirmed after monitoring the abrasive wear on the roller flange of the generator-side HSS bearing. In contrast, the planetary stage in the healthy case remains fault-free throughout the observing period, and the inspection confirms no wear or damage on the bearings and gears. The method's performance is evaluated through a study of 10 wind turbine datasets, which are monitored by 110 sensors, including 19 confirmed faulty cases. These faults are confirmed through manual mechanical inspections conducted by technicians. Due to the imbalanced nature of our fault data, balanced accuracy is used as the performance metric. The model has achieved a balanced accuracy of 84 %. The proposed method demonstrates high reliability in fault detection, accurately identifying all 19 drivetrain fault cases in the performance analysis of 10 wind turbines. However, some false alarms arise due to the complexities of real wind farm data. A high threshold reduces false alarms but increases the risk of missing actual faults. Therefore, a lower threshold is adopted to prioritize early-stage fault detection, as identifying potential issues as early as possible is critical to provide sufficient time to plan and execute maintenance strategies. A higher threshold may reduce false alarms, but it can compromise the detection of subtle changes in indicator trends, limiting the ability to identify faults at an early stage. Additionally, it becomes challenging to suppress false alarms when a sensor captures fault frequencies originating from neighboring components.
The proposed hybrid method effectively provides a comprehensive assessment of the turbine's health, encompassing both a high-level overview and detailed insights into individual condition indicators for each installed accelerometer. However, the training process demands substantial computational resources due to the requirement of individually training an NBM for each condition indicator. Future work aims to address this challenge by developing an explainable machine learning model that can adapt to all condition indicators simultaneously while providing both a holistic evaluation of the turbine's health and an in-depth analysis of individual condition indicator fault trends. It will significantly mitigate the computational burden. The multitude of condition indicators employed in this approach plays a critical role, as each indicator demonstrates sensitivity to distinct fault categories. By leveraging the correlations among indicators, it becomes feasible to streamline the number of necessary indicators while maintaining robust fault detection capabilities. Nevertheless, this requires a detailed data analysis of indicators over multiple cases before eliminating any indicators. The proposed method integrates two data sources: the vibrational signals measured by accelerometers installed on the components and SCADA data. As a consequence, the application of this hybrid condition monitoring fault detection method is limited to wind turbines that are equipped to measure both vibration and SCADA data. Future work will focus on vibrational analysis to reduce dependence on SCADA data. However, developing a standalone vibration-based condition monitoring method will require high-quality vibration data to extract operational information.
A hybrid fault detection method was introduced that combines advanced signal processing techniques with machine learning to offer a comprehensive overview of the health of wind turbine drivetrain components. The proposed method provided a high-level health status overview to address the vast number of condition monitoring indicators, as individually monitoring all available condition indicators is not possible when managing multiple components in a single wind turbine across an entire wind farm. This method not only facilitates high-level health assessments but also allows for in-depth inspections of signal processing indicators, making it a versatile tool suitable for both experts and non-expert stakeholders. The proposed method has been validated across an entire wind farm fleet, where it consistently achieved satisfactory results in the majority of cases. To further validate its effectiveness, manual bore scope inspections were conducted after the fault detection process, confirming the presence of mechanical faults. The combination of physical knowledge and the computational power of machine learning in our approach holds great promise for enhancing the reliability and efficiency of wind turbine maintenance and performance monitoring.
The software code developed for this research cannot be shared publicly due to confidentiality agreements with industrial partners. The models were developed under a non-disclosure agreement (NDA), which restricts the release of proprietary code.
The dataset used in this research is proprietary to our industrial partners and was obtained through industrial collaboration under a non-disclosure agreement (NDA). Therefore, it cannot be shared publicly.
FJ was responsible for conceptualization, data curation, formal analysis, investigation, methodology development, project administration, software coding, validation, visualization, and writing of the original draft. CP contributed to conceptualization, methodology development, project administration, supervision, and the reviewing and editing of the paper. TV was involved in conceptualization, methodology development, and supervision. JH was responsible for conceptualization, funding acquisition, methodology development, supervision, and the final phase of paper review and editing.
The contact author has declared that none of the authors has any competing interests.
Publisher’s note: Copernicus Publications remains neutral with regard to jurisdictional claims made in the text, published maps, institutional affiliations, or any other geographical representation in this paper. While Copernicus Publications makes every effort to include appropriate place names, the final responsibility lies with the authors.
The authors would like to acknowledge the FWO (Fonds Wetenschappelijk Onderzoek) for their support through the SB grants of Faras Jamil (no. 1S63123N), the post-doctoral grant of Cédric Peeters (no. 1282221N), and SBO project Robustify (S006119N). Furthermore, this research was supported by funding from the Flemish Government under the “Onderzoekspro- gramma Artificiële Intelligentie (AI) Vlaanderen” program and under the VLAIO/Blue Cluster Supersized 5.0 ICON project (HBC.2024.0130). The authors are also grateful to VSC Supercomputing Flanders for support in the context of the VSC Cloud program.
This research has been supported by the Fonds Wetenschappelijk Onderzoek (grant nos. 1S63125N, 1282221N, and S006119N). Furthermore, this research was supported by funding from the Flemish Government under the “Onderzoekspro- gramma Artificiële Intelligentie (AI) Vlaanderen” program and under the VLAIO/Blue Cluster Supersized 5.0 ICON project (HBC.2024.0130).
This paper was edited by Yi Guo and reviewed by four anonymous referees.
Antoni, J.: Fast computation of the kurtogram for the detection of transient faults, Mech. Syst. Signal Pr., 21, 108–124, 2007. a
Antoni, J.: Cyclostationarity by examples, Mech. Syst. Signal Pr., 23, 987–1036, https://doi.org/10.1016/j.ymssp.2008.10.010, 2009. a
Antoni, J.: A critical overview of the “Filterbank-Feature-Decision” methodology in machine condition monitoring, Acoust. Aust., 49, 177–184, 2021. a
Antoni, J. and Borghesani, P.: A statistical methodology for the design of condition indicators, Mech. Syst. Signal Pr., 114, 290–327, 2019. a
Antoni, J. and Randall, R.: Unsupervised noise cancellation for vibration signals: part I – evaluation of adaptive algorithms, Mech. Syst. Signal Pr., 18, 89–101, 2004. a
Bai, M., Yang, X., Liu, J., Liu, J., and Yu, D.: Convolutional neural network-based deep transfer learning for fault detection of gas turbine combustion chambers, Appl. Energ., 302, 117509, https://doi.org/10.1016/j.apenergy.2021.117509, 2021. a
Barbini, L., Ompusunggu, A. P., Hillis, A., du Bois, J., and Bartic, A.: Phase editing as a signal pre-processing step for automated bearing fault detection, Mech. Syst. Signal Pr., 91, 407–421, 2017. a
Beretta, M., Julian, A., Sepulveda, J., Cusidó, J., and Porro, O.: An Ensemble Learning Solution for Predictive Maintenance of Wind Turbines Main Bearing, Sensors, 21, 1512, https://doi.org/10.3390/s21041512, 2021. a
Carvalho, T. P., Soares, F. A. A. M. N., Vita, R., da P. Francisco, R., Basto, J. P., and Alcalá, S. G. S.: A systematic literature review of machine learning methods applied to predictive maintenance, Comput. Ind. Eng., 137, 106024, https://doi.org/10.1016/j.cie.2019.106024, 2019. a
Chandola, V., Banerjee, A., and Kumar, V.: Anomaly Detection: A Survey, ACM Comput. Surv., 41, 1–58, https://doi.org/10.1145/1541880.1541882, 2009. a
Chesterman, X., Verstraeten, T., Daems, P., Sanjines, F. P., Nowé, A., and Helsen, J.: The detection of generator bearing failures on wind turbines using machine learning based anomaly detection, J. Phys. Conf. Ser., 2265, 032066, https://doi.org/10.1088/1742-6596/2265/3/032066, 2022. a, b
Chesterman, X., Verstraeten, T., Daems, P.-J., Nowé, A., and Helsen, J.: Overview of normal behavior modeling approaches for SCADA-based wind turbine condition monitoring demonstrated on data from operational wind farms, Wind Energ. Sci., 8, 893–924, https://doi.org/10.5194/wes-8-893-2023, 2023. a
Clark, C. E. and DuPont, B.: Reliability-based design optimization in offshore renewable energy systems, Renew. Sust. Energ. Rev., 97, 390–400, https://doi.org/10.1016/j.rser.2018.08.030, 2018. a
Dibaj, A., Gao, Z., and Nejad, A. R.: Fault detection of offshore wind turbine drivetrains in different environmental conditions through optimal selection of vibration measurements, Renewable Energy, 203, 161–176, https://doi.org/10.1016/j.renene.2022.12.049, 2023. a
Dienst, S. and Beseler, J.: Automatic anomaly detection in offshore wind SCADA data, Wind Europe Summit, Hamburg, Germany, 27–29 September 2016, https://windeurope.org/summit2016/conference/submit-an-abstract/pdf/626738292593.pdf (last access: 5 September 2025), 2016. a
Gao, Z. and Odgaard, P.: Real-time monitoring, fault prediction and health management for offshore wind turbine systems, Renewable Energy, 218, 119258, https://doi.org/10.1016/j.renene.2023.119258, 2023. a
García Márquez, F. P., Tobias, A. M., Pinar Pérez, J. M., and Papaelias, M.: Condition monitoring of wind turbines: Techniques and methods, Renewable Energy, 46, 169–178, https://doi.org/10.1016/j.renene.2012.03.003, 2012. a
Helsen, J., Devriendt, C., Weijtjens, W., and Guillaume, P.: Condition monitoring by means of scada analysis, in: Proceedings of European wind energy association international conference, Paris, France, 17–20 November 2015, 2015. a
Helsen, J., Peeters, C., Doro, P., Ververs, E., and Jordaens, P. J.: Wind Farm Operation and Maintenance Optimization Using Big Data, in: 2017 IEEE Third International Conference on Big Data Computing Service and Applications (BigDataService), 6–9 April 2017, 179–184, https://doi.org/10.1109/BigDataService.2017.27, 2017. a, b
Helsen, J., Peeters, C., Verstraeten, T., Verbeke, J., Gioia, N., and Nowé, A.: Fleet-wide condition monitoring combining vibration signal processing and machine learning rolled out in a cloud-computing environment, in: International Conference on Noise and Vibration Engineering (ISMA), Leuven, Belgium, 17–19 September 2018, 17–19, https://past.isma-isaac.be/downloads/isma2018/proceedings/Contribution_262_proceeding_3.pdf (last access: 5 September 2025), 2018. a, b
Ho, D.: Bearing diagnostics and self-adaptive noise cancellation, PhD thesis, UNSW Sydney, https://doi.org/10.26190/unsworks/4524, 1999. a
Ho, D. and Randall, R.: Optimisation of Bearing Diagnostic Techniques Using Simulated and Actual Bearing Fault Signals, Mech. Syst. Signal Pr., 14, 763–788, https://doi.org/10.1006/mssp.2000.1304, 2000. a
Hutchinson, M. and Zhao, F.: Global Wind Report 2023, https://gwec.net/globalwindreport2023/ (last access: 26 September 2023), 2023. a
Ibrahim, R., Weinert, J., and Watson, S.: Neural networks for wind turbine fault detection via current signature analysis, Wind Europe summit, Hamburg, Germany, 27–29 September 2016, 2016. a
IRENA and CPI: Global landscape of renewable energy finance 2023, International Renewable Energy Agency, Abu Dhabi, https://www.irena.org/Publications/2023/Feb/Global-landscape-of-renewable-energy-finance-2023, last access: 26 September 2023. a
Jamil, F., Verstraeten, T., Nowé, A., Peeters, C., and Helsen, J.: A deep boosted transfer learning method for wind turbine gearbox fault detection, Renewable Energy, 197, 331–341, https://doi.org/10.1016/j.renene.2022.07.117, 2022. a
Jamil, F., Jara Avila, F., Vratsinis, K., Peeters, C., and Helsen, J.: Wind Turbine Drivetrain Fault Detection Using Multi-Variate Deep Learning Combined With Signal Processing, in: Turbo Expo: Power for Land, Sea, and Air, vol. 87127, V014T37A003, American Society of Mechanical Engineers, https://doi.org/10.1115/GT2023-101689, 2023a. a, b
Jamil, F., Peeters, C., Verstraeten, T., and Helsen, J.: Wind turbine drivetrain fault detection using physics-informed multivariate deep learning, in: Surveillance, Vibrations, Shock and Noise, Institut Supérieur de l'Aéronautique et de l'Espace [ISAE-SUPAERO], 10–13 July 2023, Toulouse, France, https://hal.science/hal-04166103, 2023b. a, b
Jia, F., Lei, Y., Lin, J., Zhou, X., and Lu, N.: Deep neural networks: A promising tool for fault characteristic mining and intelligent diagnosis of rotating machinery with massive data, Mech. Syst. Signal Pr., 72–73, 303–315, https://doi.org/10.1016/j.ymssp.2015.10.025, 2016. a
Kestel, K., Antoni, J., Peeters, C., Leclère, Q., Girardin, F., Ooijevaar, T., and Helsen, J.: The design of optimal indicators for early fault detection using a generalized likelihood ratio test, in: Surveillance, Vibrations, Shock and Noise, 10–13 July 2023, Toulouse, France, https://hal.science/hal-04165952v1, 2023. a
Leclère, Q., André, H., and Antoni, J.: A multi-order probabilistic approach for Instantaneous Angular Speed tracking debriefing of the CMMNO14' diagnosis contest, Mech. Syst. Signal Pr., 81, 375–386, https://doi.org/10.1016/j.ymssp.2016.02.053, 2016. a
Lima, L. A. M., Blatt, A., and Fujise, J.: Wind Turbine Failure Prediction Using SCADA Data, J. Phys. Conf. Series, 1618, 022017, https://doi.org/10.1088/1742-6596/1618/2/022017, 2020. a
Liu, D., Cui, L., and Cheng, W.: Fault diagnosis of wind turbines under nonstationary conditions based on a novel tacho-less generalized demodulation, Renewable Energy, 206, 645–657, https://doi.org/10.1016/j.renene.2023.01.056, 2023. a
Liu, R., Yang, B., Zio, E., and Chen, X.: Artificial intelligence for fault diagnosis of rotating machinery: A review, Mech. Syst. Signal Pr., 108, 33–47, https://doi.org/10.1016/j.ymssp.2018.02.016, 2018. a
Ma, S., Ding, W., Liu, Y., Ren, S., and Yang, H.: Digital twin and big data-driven sustainable smart manufacturing based on information management systems for energy-intensive industries, Appl. Energ., 326, 119986, https://doi.org/10.1016/j.apenergy.2022.119986, 2022. a
Marugán, A. P., Márquez, F. P. G., Perez, J. M. P., and Ruiz-Hernández, D.: A survey of artificial neural network in wind energy systems, Appl. Energ., 228, 1822–1836, https://doi.org/10.1016/j.apenergy.2018.07.084, 2018. a
McCormick, A. and Nandi, A.: Cyclostationarity in Rotating Machine Vibrations, Mech. Syst. Signal Pr., 12, 225–242, https://doi.org/10.1006/mssp.1997.0148, 1998. a
Napolitano, A.: Cyclostationarity: New trends and applications, Signal Process., 120, 385–408, 2016. a
Nejad, A. R., Keller, J., Guo, Y., Sheng, S., Polinder, H., Watson, S., Dong, J., Qin, Z., Ebrahimi, A., Schelenz, R., Gutiérrez Guzmán, F., Cornel, D., Golafshan, R., Jacobs, G., Blockmans, B., Bosmans, J., Pluymers, B., Carroll, J., Koukoura, S., Hart, E., McDonald, A., Natarajan, A., Torsvik, J., Moghadam, F. K., Daems, P.-J., Verstraeten, T., Peeters, C., and Helsen, J.: Wind turbine drivetrains: state-of-the-art technologies and future development trends, Wind Energ. Sci., 7, 387–411, https://doi.org/10.5194/wes-7-387-2022, 2022. a, b, c
Peeters, C., Guillaume, P., and Helsen, J.: A comparison of cepstral editing methods as signal pre-processing techniques for vibration-based bearing fault detection, Mech. Syst. Signal Pr., 91, 354–381, https://doi.org/10.1016/j.ymssp.2016.12.036, 2017. a, b
Peeters, C., Gioia, N., and Helsen, J.: Stochastic simulation assessment of an automated vibration-based condition monitoring framework for wind turbine gearbox faults, J. Phys. Conf. Series, 1037, 032044, https://doi.org/10.1088/1742-6596/1037/3/032044, 2018a. a
Peeters, C., Guillaume, P., and Helsen, J.: Vibration-based bearing fault detection for operations and maintenance cost reduction in wind energy, Renewable Energy, 116, 74–87, https://doi.org/10.1016/j.renene.2017.01.056, 2018b. a
Peeters, C., Leclère, Q., Antoni, J., Lindahl, P., Donnal, J., Leeb, S., and Helsen, J.: Review and comparison of tacholess instantaneous speed estimation methods on experimental vibration data, Mech. Syst. Signal Pr., 129, 407–436, https://doi.org/10.1016/j.ymssp.2019.02.031, 2019a. a
Peeters, C., Verstraeten, T., Nowé, A., and Helsen, J.: Wind turbine planetary gear fault identification using statistical condition indicators and machine learning, in: International conference on offshore mechanics and arctic engineering, vol. 58899, V010T09A014, American Society of Mechanical Engineers, https://doi.org/10.1115/OMAE2019-96713, 2019b. a, b, c, d, e
Peeters, C., Verstraeten, T., Nowé, A., and Helsen, J.: Wind turbine planetary gear fault identification using statistical condition indicators and machine learning, in: International conference on offshore mechanics and arctic engineering, vol. 58899, V010T09A014, American Society of Mechanical Engineers, 2019c. a
Peeters, C., Antoni, J., Daems, P.-J., and Helsen, J.: Separation of vibration signal content using an improved discrete-random separation method, in: Separation of vibration signal content using an improved discrete-random separation method, ISMA 2020, 22–24 September 2020, Leuven, Belgium, https://hal.science/hal-03212000v1, 2020. a
Peeters, C., Antoni, J., Leclère, Q., Verstraeten, T., and Helsen, J.: Multi-harmonic phase demodulation method for instantaneous angular speed estimation using harmonic weighting, Mech. Syst. Signal Pr., 167, 108533, https://doi.org/10.1016/j.ymssp.2021.108533, 2022. a
Perez-Sanjines, F., Peeters, C., Verstraeten, T., Antoni, J., Nowé, A., and Helsen, J.: Fleet-based early fault detection of wind turbine gearboxes using physics-informed deep learning based on cyclic spectral coherence, Mech. Syst. Signal Pr., 185, 109760, https://doi.org/10.1016/j.ymssp.2022.109760, 2023. a, b
Peter, R., Zappalá, D., Schamboeck, V., and Watson, S. J.: Wind turbine generator prognostics using field SCADA data, J. Phys. Conf. Ser., 2265, 032111, https://doi.org/10.1088/1742-6596/2265/3/032111, 2022. a
Randall, R. B.: Vibration-based condition monitoring: industrial, automotive and aerospace applications, John Wiley & Sons, ISBN 9780470747858, https://doi.org/10.1002/9780470977668, 2021. a
Renström, N., Bangalore, P., and Highcock, E.: System-wide anomaly detection in wind turbines using deep autoencoders, Renewable Energy, 157, 647–659, https://doi.org/10.1016/j.renene.2020.04.148, 2020. a
Tautz-Weinert, J. and Watson, S. J.: Using SCADA data for wind turbine condition monitoring–a review, IET Renew. Power Gen., 11, 382–394, https://doi.org/10.1049/iet-rpg.2016.0248, 2017. a
Verstraeten, T., Gomez Marulanda, F., Peeters, C., Daems, P.-J., Nowé, A., and Helsen, J.: Edge computing for advanced vibration signal processing, in: Surveillance, Vishno and AVE conferences, INSA-Lyon, Université de Lyon, 8–10 July 2019, Lyon, France, https://hal.science/hal-02188766, 2019a. a
Verstraeten, T., Nowé, A., Keller, J., Guo, Y., Sheng, S., and Helsen, J.: Fleetwide data-enabled reliability improvement of wind turbines, Renew. Sust. Energ. Rev., 109, 428–437, https://doi.org/10.1016/j.rser.2019.03.019, 2019b. a
Vidal, Y., Pozo, F., and Tutivén, C.: Wind Turbine Multi-Fault Detection and Classification Based on SCADA Data, Energies, 11, 3018, https://doi.org/10.3390/en11113018, 2018. a
Wang, A., Pei, Y., Qian, Z., Zareipour, H., Jing, B., and An, J.: A two-stage anomaly decomposition scheme based on multi-variable correlation extraction for wind turbine fault detection and identification, Appl. Energ., 321, 119373, https://doi.org/10.1016/j.apenergy.2022.119373, 2022a. a
Wang, J., Zhang, X., and Zeng, J.: Dynamic group-maintenance strategy for wind farms based on imperfect maintenance model, Ocean Eng., 259, 111311, https://doi.org/10.1016/j.oceaneng.2022.111311, 2022b. a
Widodo, A. and Yang, B.-S.: Support vector machine in machine condition monitoring and fault diagnosis, Mech. Syst. Signal Pr., 21, 2560–2574, https://doi.org/10.1016/j.ymssp.2006.12.007, 2007. a
Xiang, L., Yang, X., Hu, A., Su, H., and Wang, P.: Condition monitoring and anomaly detection of wind turbine based on cascaded and bidirectional deep learning networks, Appl. Energ., 305, 117925, https://doi.org/10.1016/j.apenergy.2021.117925, 2022. a
Zhang, M., Cui, H., Li, Q., Liu, J., Wang, K., and Wang, Y.: An improved sideband energy ratio for fault diagnosis of planetary gearboxes, J. Sound Vib., 491, 115712, https://doi.org/10.1016/j.jsv.2020.115712, 2021. a
Zhang, W., Yang, D., and Wang, H.: Data-Driven Methods for Predictive Maintenance of Industrial Equipment: A Survey, IEEE Syst. J., 13, 2213–2227, https://doi.org/10.1109/JSYST.2019.2905565, 2019. a
Zhuang, F., Qi, Z., Duan, K., Xi, D., Zhu, Y., Zhu, H., Xiong, H., and He, Q.: A Comprehensive Survey on Transfer Learning, P. IEEE, 109, 43–76, https://doi.org/10.1109/JPROC.2020.3004555, 2021. a
Zonta, T., da Costa, C. A., da Rosa Righi, R., de Lima, M. J., da Trindade, E. S., and Li, G. P.: Predictive maintenance in the Industry 4.0: A systematic literature review, Comput. Ind. Eng., 150, 106889, https://doi.org/10.1016/j.cie.2020.106889, 2020. a