the Creative Commons Attribution 4.0 License.
the Creative Commons Attribution 4.0 License.
 | 15 Sep 2025
Upwind vs. downwind: loads and acoustics of a 1.5 MW wind turbine
Pietro Bortolotti
Lee Jay Fingersh
Nicholas Hamilton
Arlinda Huskey
Chris Ivanov
Mark Iverson
Jonathan Keller
Scott Lambert
Jason Roadman
Derek Slaughter
Syhoune Thao
Consuelo Wells
This paper discusses the motivation, preparation, risk mitigation, execution, and results of a full-scale experiment where the conventional upwind rotor of a 1.5 MW wind turbine was operated in a downwind configuration. The experiment took place at the National Renewable Energy Laboratory Flatirons Campus in Colorado, USA, and involved the collection of loads and power together with acoustic measurements from an array of four microphones. To validate the numerical predictions of the aeroelastic solver OpenFAST in terms of loads and performance, 410 min of downwind operation and 960 min of conventional upwind operations were used. In the wind speed range from 4.5 to 12.5 m s−1, the downwind rotor generates higher damage equivalent loads for the blade root flapwise moment, blade root edgewise moment, and tower-base fore-aft moment compared to the upwind rotor. For these metrics of fatigue loads, numerical predictions match the experimental observations well. OpenFAST is, however, also seen underpredicting a power gain in the downwind rotor. In terms of acoustics, the overall sound pressure levels recorded in the field are similar between the upwind and downwind cases, but downwind operation worsens the metrics describing amplitude modulation.
- Article
(8826 KB) - Full-text XML
- BibTeX
- EndNote


This work was authored by the National Renewable Energy Laboratory for the U.S. Department of Energy (DOE) under Contract No. DE-AC36-08GO28308. The U.S. Government retains and the publisher, by accepting the article for publication, acknowledges that the U.S. Government retains a nonexclusive, paid-up, irrevocable, worldwide license to publish or reproduce the published form of this work, or allow others to do so, for U.S. Government purposes.
The vast majority of modern multi-megawatt wind turbines mount an upwind rotor, i.e., the rotor faces the wind, and the blades spin in front of the turbine tower. Upwind-oriented wind turbines have, however, not always dominated the utility-scale market. Multiple early prototypes in the 1980s flew downwind rotors (Manwell et al., 2010), and a decade ago, the manufacturer Hitachi designed, installed, and operated 2 and 5 MW downwind-oriented wind turbines in Japan. The designs and installations were both land-based and offshore. Also, downwind rotors are still fairly common in distributed wind applications, and some new multi-megawatt concepts for floating applications mount downwind rotors (https://www.x1wind.com, last access: 4 September 2025; https://www.windpowermonthly.com/article/1880758/mingyang-completes-166mw-oceanx-twin-rotor-floating-offshore-wind-platform, last access: 4 September 2025). Commercial multi-megawatt wind turbines mount upwind rotors because of historical challenges experienced by downwind rotors linked to increased acoustic emissions and fatigue loads. Both effects are caused by the interaction of the blades with the wake of the tower. In the 1980s, the two-bladed downwind rotor of the MOD-1 wind turbine installed near Boone, North Carolina, was a nuisance to residents due to excessive acoustic impulses. An analysis led by the Solar Energy Research Institute showed that the source of this excessive acoustic emission was the dynamic behavior of the lift force generated by the blades as they passed behind the lattice tower. The acoustic emissions were found to be influenced by both the complex terrain where the turbine was installed and by the various atmospheric conditions in which the MOD-1 turbine was operating (Kelley et al., 1985). The negative impact of the MOD-1 wind turbine on the neighboring communities has contributed to the dominance of upwind rotors since then.
1.1 Why downwind?
Wind turbines continue to grow in rotor size, hub height, and nameplate power. The race for the biggest wind turbine is clearly visible in the offshore market, where manufacturers have been breaking records almost yearly. In the land-based market, although growth is present, the trend has taken a different path. Wind turbines with nameplate power above 5 MW appeared more than a decade ago but have been winning a sizable share of the market only recently. This slowdown in the growth of average ratings can be explained by the push to reduce specific power (the ratio of the turbine rating to rotor swept area), as discussed in Bolinger et al. (2020). The trend of decreasing specific power is now challenged by the arrival of cost-competitive storage systems such as batteries and hydrogen and might reverse in the coming years (Wiser et al., 2022). Nonetheless, the growth in rotor size and hub height is expected to continue, pending technology innovations. Increasingly larger upwind rotors face the growing challenge of complying with the clearance between blades and tower, a constraint that downwind rotors help to alleviate. In this scenario, downwind rotor configurations resurfaced as a promising option for the next generation of machines.
The first phase of the Big Adaptive Rotor (BAR) project discussed the value of highly flexible 100 m wind turbine blades, which offer a pathway to reduce capital costs and levelized cost of energy, as well as to alleviate logistics constraints (Bortolotti et al., 2021). The study showed the technical viability of transporting these blades by using controlled flexing during rail transport. There may be economic benefits to the controlled flexing solution compared to adopting spanwise segmentation. To avoid derailing train flatcars during horizontal curves, the blades must be more flexible than usual. To accommodate the additional flexibility, the blades could be mounted either in downwind rotor configurations or in highly tilted upwind rotors. Taking advantage of the additional tilt of downwind turbines for farm-level flow benefits has also shown promising results in the numerical analyses presented in Annoni et al. (2017), Bay et al. (2019), and Cossu (2021a, b) and in scaled wind tunnel experiments (Scott et al., 2020; Nanos et al., 2020). Numerical and experimental studies show a power improvement of the wind farm when wind is aligned with a row of wind turbines whose rotors are tilted in a downwind configuration. Rotors tilted downwind deflect wakes downwards as opposed to upwards and allow higher-speed air flows to increase the power output of downstream turbines. At lower fidelity, Bay et al. (2019) report advantages between 1.5 % and 2 % in annual energy production by tilting the rotors of the turbines located on the perimeter of a 45-turbine wind farm with a 7×7 grid, leaving the four corner grid positions empty. At higher fidelity, Cossu (2021b) presents results for a 3×6 wind farm, where six turbines experience undisturbed wind speed and 12 turbines sit in the full wake. The results were generated by running 3D computational fluid dynamics with an actuator disk model. Power gains up to +40 % were obtained thanks to a combination of high tilt angles (30°) of the front and middle rows of wind turbines and a higher axial induction of the tilted rotors. Within BAR, Frontin et al. (2024) extended the high-fidelity analysis to a full sweep of wind directions for a 4×4 wind farm. These new results were far less promising, with an overall reduction in annual energy production. It should be noted that Frontin et al. (2024) explored only one wind farm configuration and did not explore the dependency of power performance on key parameters such as farm spacing or atmospheric stability.
A number of publications have also investigated the potential of highly coned downwind rotors. Conceptual studies (Loth et al., 2017) were followed by more detailed studies (Pao et al., 2021) and field tests (Kaminski et al., 2023a, b). Highly coned rotors offer a pathway to lower blade flapwise loads and consequently mass and cost savings. A last area where downwind rotors could be advantageous over upwind rotors is floating applications, where the annual energy production loss caused by the reduced swept area due to the platform pitch angle could be balanced by the downwind nacelle tilt angle. Overall, the techno-economic viability of downwind rotors has been under investigation for decades, with alternating conclusions (Bortolotti et al., 2022).
1.2 Goal of the experiment
In this scenario, the fatigue loads and acoustic emissions of large downwind rotors remain an open research topic. To narrow this gap, the BAR research team at the National Renewable Energy Laboratory (NREL) designed, planned, and executed an ambitious experiment with the goal of creating a dataset that can be used to validate numerical predictions in terms of loads, performance, and aeroacoustics of upwind and downwind rotors. The experiment aims to support the investigations around the feasibility, reliability, performance, and economic viability of downwind-oriented wind turbines. The experiment consists of operating a 1.5 MW wind turbine located at the NREL Flatirons Campus in a downwind configuration while monitoring loads, power, and aeroacoustic emissions, which can then be compared to the upwind operation of the wind turbine. To switch from upwind to downwind, the nacelle of the turbine has to yaw by 180°, and the three blades have to pitch by 180°. For the same wind direction and the same observer position, the rotor keeps spinning clockwise when viewed from upwind. The rotor, however, spins in the opposite direction with respect to the nacelle, effectively switching the rotation of the rotating elements of the drivetrain, namely, low-speed shaft, gears of the gearbox, high-speed shaft, and rotor of the generator. The pitch rate – both speed and direction – remains the same, but the pitch actuators need to operate between 180 and 270°. These changes required detailed risk analysis and mitigation steps, which are discussed in Sect. 3. The unique dataset that was generated during the experiment is used to validate the numerical predictions in terms of dynamic behavior and performance for both upwind and downwind rotor configurations. The predictions are generated by the aeroservoelastic solver OpenFAST. The experimental aeroacoustic emissions are also compared between upwind and downwind in terms of overall sound pressure and sound power levels as well as amplitude modulation.
1.3 Structure of the paper
The structure of the paper is as follows. The test turbine and the test site are introduced in Sect. 2. Next, Sect. 3 discusses the approach followed to ensure the safety and success of the experimental campaign, whereas Sect. 4 discusses the data collection and data analysis. Results are discussed in Sect. 5, with loads presented in Sect. 5.1 and acoustics in Sect. 5.2. The conclusions of the paper are given in Sect. 6.
Loads and aeroacoustic measurements were taken at and around a 1.5 MW wind turbine manufactured and sold by GE Vernova. This model is representative of a large segment of the installed wind capacity, with more than 18 000 turbines of this make and model currently in operation in the United States. The GE 1.5 MW wind turbine is built on the platform of the GE 1.5 MW SLE commercial wind turbine model and was installed at the NREL Flatirons Campus in 2008 with the objective of supporting wind energy research initiatives. The turbine has a horizontal axis and is a three-bladed, upwind turbine with full span pitch control. Table 1 provides the key descriptive information of the test turbine.

The NREL Flatirons Campus is located 13 km south of Boulder, Colorado, and the turbine is located on test site 4.0. Figure 1 shows the test turbine with its rotor in an idling downwind configuration (the leading edges of the three blades point toward the tower). The acoustic instrumentation was arrayed in the area downstream of the turbine along the prevailing wind direction, which, at the NREL Flatirons Campus, is 285°. A proprietary aeroelastic model of the turbine is available in NREL's OpenFAST framework. In the aeroelastic model, the industrial controller in the form of a compiled dynamic link library drives the generator torque and the pitch actuation.

Figure 1GE 1.5 MW wind turbine located on site 4.0 at the Flatirons Campus, with the rotor in an idling downwind configuration. Photo credit: Rafael Mudafort, NREL.
The experiment followed the approaches used in previous campaigns to characterize the mechanical loading of the turbine in various operating conditions (Santos and van Dam, 2015) and the acoustic emissions under yaw offsets (Hamilton et al., 2021). The experiment included standard load measurements along the turbine components following the International Electrotechnical Commission (IEC) standard, namely, International Electrotechnical Commission (2015), combined with multiple point measurements located to sample the acoustic emissions, including points required and suggested in International Electrotechnical Commission (2018).
Dozens of channels of data were acquired from instrumentation installed on the 135 m high M5 meteorological tower, which is located approximately two rotor diameters upstream of the test turbine, along with turbine supervisory control and data acquisition (SCADA) system channels. These include:
-
Flapwise and edgewise moments at the blade root
-
Fore-aft, side-side, and torsional moments at tower-top
-
Fore-aft and side-side moments at the tower-base
-
Main shaft torque and bending moment
-
Generator power, generator torque, rotor speed, pitch angle, and blade azimuth.
In addition, acoustic levels were recorded from four microphones located in the field. Acoustic data collection followed the procedure of International Electrotechnical Commission (2018), with the inclusion of additional microphones for directionality. One primary microphone was located at the IEC location, and three additional low-frequency microphones were placed 157 m away from the turbine. Figure 2 shows the locations of the met tower and microphones with respect to the turbine and the prevailing wind direction.
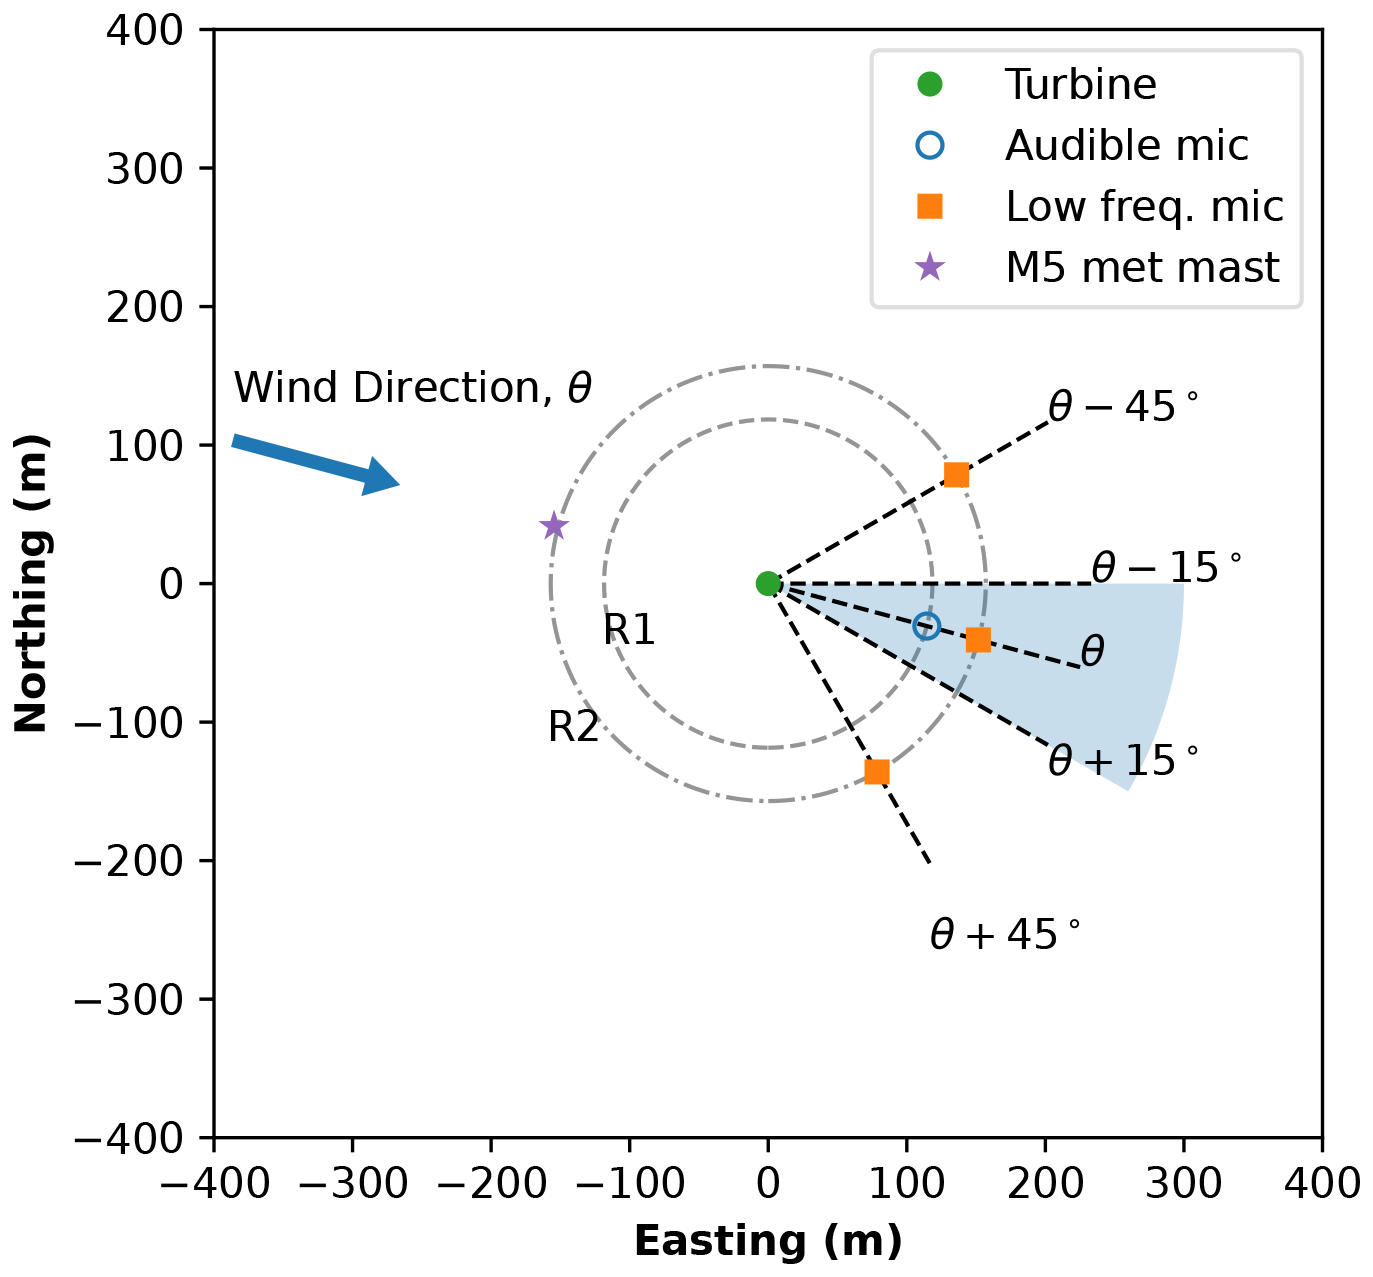
Figure 2Locations of acoustic measurements. R1 is the IEC-prescribed distance, i.e., the turbine height, which is the tower height (80 m) plus the rotor radius (38.5 m), i.e., 118.5 m (International Electrotechnical Commission, 2018). R2 is R1 plus the rotor radius, i.e., 157 m. The blue circle is at the IEC location and was the primary measurement location in the audible range. Three low-frequency microphones were installed at the orange dots. The 135 m high M5 meteorological tower is located at the purple star.
Tables A1, A2, and A3 in Appendix A list the instrumentation that were used for the test. Table A1 lists the non-load channels, Table A2 lists the load channels, and Table A3 lists the aeroacoustics channels. Following the recommendation of International Electrotechnical Commission (2018), the wind speed was measured downstream of the turbine using a cup anemometer located 10 m above the ground. Microphones with wind screens were placed in the downwind reference position and optional positions to measure the total and background noise along with the directivity. All instrumentation was recalibrated ahead of the data collection.
3.1 Risk assessment and risk mitigation
Turning the rotor of the GE 1.5 MW wind turbine from upwind to downwind operation was a challenging task, and the experiment was prepared by conducting a failure mode and effects analysis (FMEA) to investigate the risks connected to the experiment and identify risk mitigation strategies. The FMEA also underwent a third-party review led by Gulf Wind Technology. In addition to the FMEA, personnel, equipment, and environmental safety reviews were also completed.
3.1.1 FMEA
The FMEA was prepared as much as possible according to the guidelines provided by the International Electrotechnical Commission (2006) standards. The FMEA identified 20 risks, and each risk was ranked with a score for frequency and a score for severity. The product of the two scores was taken as the risk priority number (RPN). Frequency and severity scores were ranked between 1 and 5, and the risk severity number could therefore vary between 1 and 25. Table A4 lists the 10 risks that scored an RPN of 10 or above. To mitigate all risks, first, a detailed load analysis was conducted in OpenFAST running design load cases (DLCs) prescribed by International Electrotechnical Commission (2019) and load cases that simulate conditions observed at the NREL Flatirons Campus. For the latter set of simulations, inflow data were extracted from Hamilton and Debnath (2019). Load cases were run at extreme turbulence intensity and extreme positive and negative shear. Loads were monitored to ensure if and how much they increased due to the downwind orientation of the rotor; see Sect. 3.1.2 for more details. In addition, the FMEA identified reversed aerodynamic thrust, i.e., the thrust force during normal operation pulls the rotor and drivetrain from the nacelle rather than pushing it toward the nacelle, as a high-RPN risk. A mitigation strategy was designed for this risk, which is described in more detail in Sect. 3.1.3. Lastly, the FMEA ranked high the risks linked to the smaller blade-to-tower clearance. This risk is discussed in Sect. 3.1.4.
3.1.2 Load analysis in OpenFAST
The main element of the de-risking strategy consisted of running a detailed load analysis comparing loads experienced by the wind turbine in the upwind and downwind orientations. The load analysis was conducted in NREL's open-source framework OpenFAST v3.3.0. The input files to OpenFAST describing the aeroelastic behavior of the wind turbine were generated from a legacy Fast v7 model, which was in turn generated from input files of the Flex solver used by GE. Note that blades were modeled as straight Euler–Bernoulli beams and that the effects of prebend were ignored in the structural dynamics of the blades. Prebend was, however, accounted for in the calculation of the blade–tower clearance.
OpenFAST differentiated between the upwind and downwind configurations by means of the sign used for the following quantities:
-
Location of the center of gravity of the hub, which was set negative for downwind and positive for upwind
-
Overhang distance, which was set positive for downwind and negative for upwind
-
Shaft location, which was set negative for downwind and positive for upwind
-
Shaft tilt, which was set positive for downwind and negative for upwind
-
Location of the center of gravity of the nacelle, which was set negative for downwind and positive for upwind.
In the downwind case, the tower shadow was modeled using the model formulated by Powles (1983) and implemented in OpenFAST by Moriarty and Hansen (2005). The aerodynamic performance of the blades of both upwind and downwind rotors was simulated modeling lift, drag, and moment curves corresponding to medium-rough airfoil conditions. These airfoil polars were provided by GE and were validated in Madsen et al. (2025).
The inputs to OpenFAST were validated by comparing the component masses listed in the input files with the component masses listed in the technical documentation provided by GE at the time of installation and commissioning of the wind turbine. The numerical predictions and experimental measurements in terms of natural frequencies of the blade and of the entire system were also compared. The comparison was performed at 0 rpm in both OpenFAST and in the field. The latter set was extracted after a controlled shutdown maneuver brought the rotor to a full stop. Lastly, shaft tilt, rotor overhang, and tower clearance at the blade tip were compared between OpenFAST and a 3D computer-aided design model that was generated with a 3D scanner. Table 2 shows the relative differences. The OpenFAST model shows masses smaller than the specifications. However, the masses listed in the technical documentation include the fixture used for shipping, and the differences were deemed acceptable. The natural frequencies predicted by OpenFAST were close to the experimental values listed in Santos and van Dam (2015). Lastly, differences between OpenFAST and the model generated with the 3D scanner can be seen in the shaft tilt and clearance at the blade tip. Assuming that the 3D model is accurate, some of the differences can be explained by the gravitational moment acting on the rotor and effectively reducing the nominal tilt of the wind turbine. An additional test was conducted by measuring shaft tilt at multiple locations inside the nacelle and at four yaw angles. The measurements show a range of 0.5° and a dependency on the yaw angle, which might suggest that the tower is itself not perfectly vertical.
Table 2Results of the validation of the OpenFAST model of the GE 1.5 MW wind turbine. Negative values indicate values smaller in OpenFAST than the nominal/experimental values.

After the model validation, OpenFAST was coupled to the industrial controller provided by GE and was run for 3196 simulations, modeling inflow conditions prescribed by the International Electrotechnical Commission (2019) standards as well as the extreme inflow conditions observed at the NREL Flatirons Campus (Hamilton and Debnath, 2019). Table A5 lists all the DLCs run in preparation of the experiment, whereas Figs. A1, A2, A3, and A4 in Appendix A show the load rankings for the blade root combined moment, low-speed shaft combined moment, tower-top combined moment, and tower-base combined moment, respectively. OpenFAST predicts that the loads at the blade root and tower-base are dominated by storm case DLC-6.2 and do not increase in the downwind configuration. Combined moments on the drivetrain and at tower-top could increase up to +20 % by converting from upwind to downwind. However, the increases correspond to load cases that are unlikely to occur, and conversations with the manufacturers of the different nacelle components helped conclude that the risk of causing a failure in the drivetrain components by exceeding the ultimate loads was sufficiently low, thus allowing the research team to safely proceed with the experiment.
3.1.3 Reversed aerodynamic thrust
The risks of operating under reversed aerodynamic thrust received separate attention. Reversed thrust generated concerns because although the drivetrain components are designed to resist some amount of reversed thrust even during upwind operations, the design of the components is not symmetric. Attention was paid to the front cover of the main bearing. In upwind operations, thrust at the main bearing is received by a shoulder in the housing and then transmitted to the bedplate. The shoulder is on the nacelle side. There is no shoulder, however, on the rotor side. In the event of reversed thrust, whether upwind during a shutdown or because of downwind operations, the full aerodynamic thrust is received by the front cover of the main bearing. The cover is a metal plate bolted to the housing of the main bearing. A finite element analysis of the main bearing loaded under a reversed thrust of 300 kN was conducted. The value was set 50 kN higher than the ultimate thrust of 250 kN, which was obtained from the DLCs run in OpenFAST as discussed in Sect. 3.1.2. The analysis showed minimal stress, with strain levels concentrated close to the areas in the front cover next to the bolts but still well below yield limits. It was then decided to install a temperature-compensated strain gauge half-bridge on the front cover of the main bearing. One strain gauge was placed in the radial direction and monitored the radial strain of the cover, whereas the second strain gauge was placed along the circumference and compensated the first gauge for temperature effects. After the installation, the turbine in the upwind configuration was subjected to an emergency shutdown while operating with average wind speeds of 11 m s−1, which roughly corresponds to maximum aerodynamic thrust. OpenFAST predicted a peak negative thrust of 50 kN during the maneuver, but minimal strains were recorded by the gauges. After this test, the experiment proceeded with the commissioning of the downwind rotor while closely monitoring the strains during the downwind operations.
3.1.4 Reduced blade–tower clearance
Converting a rotor from upwind to downwind requires pitching the blades by 180°. When blades are prebent like those of the GE 1.5 MW wind turbine, downwind will bring the blade tips closer to the tower as opposed to farther from the tower. The results of the OpenFAST simulations in terms of blade–tower clearance as a function of wind speed are shown in Fig. A5, which depicts how the minimum clearance from the upwind rotor was clearly violated by operating the rotor in the downwind configuration. This major risk was addressed with a set of actions. First, they decided to limit data collection to 10 min average wind speeds at hub heights up to 13 m s−1, which helps avoid those conditions where the blades are pitched and unloaded and therefore fly closer to the tower. Next, 11 laser sensors were installed around the tower at a height of 45 m. The sensors measured in real time the distance between the tower and the blade section located 5 m away from the blade tip. Once the sensors were installed, the numerical predictions could be validated.
During the precommissioning of the downwind rotor, one blade was parked at a pitch of 0°, right in front of the tower. The recording of the laser sensor read 3.2 m, which was 18 cm less than what OpenFAST predicted. This mismatch could be partially explained by the mismatch between the nominal and actual shaft tilt, as discussed in Sect. 3.1.2. Figure 3 shows the comparison between numerical predictions from DLC-1.1 and DLC-1.3 and the experimental recordings obtained by the lasers during 1 d of upwind operations on 7 February 2024. The comparison returned a satisfactory match. Once the confidence in the model was established, worst-case scenarios were run for the downwind rotor, which generated a clearance of 0.8 m. The clearance in terms of probability density functions is plotted in Fig. A6. From the probability density functions, the risk of a tower strike assuming normal operation and no additional faults, such as a controller fault or blade structural failure, was quantified to be equal to .
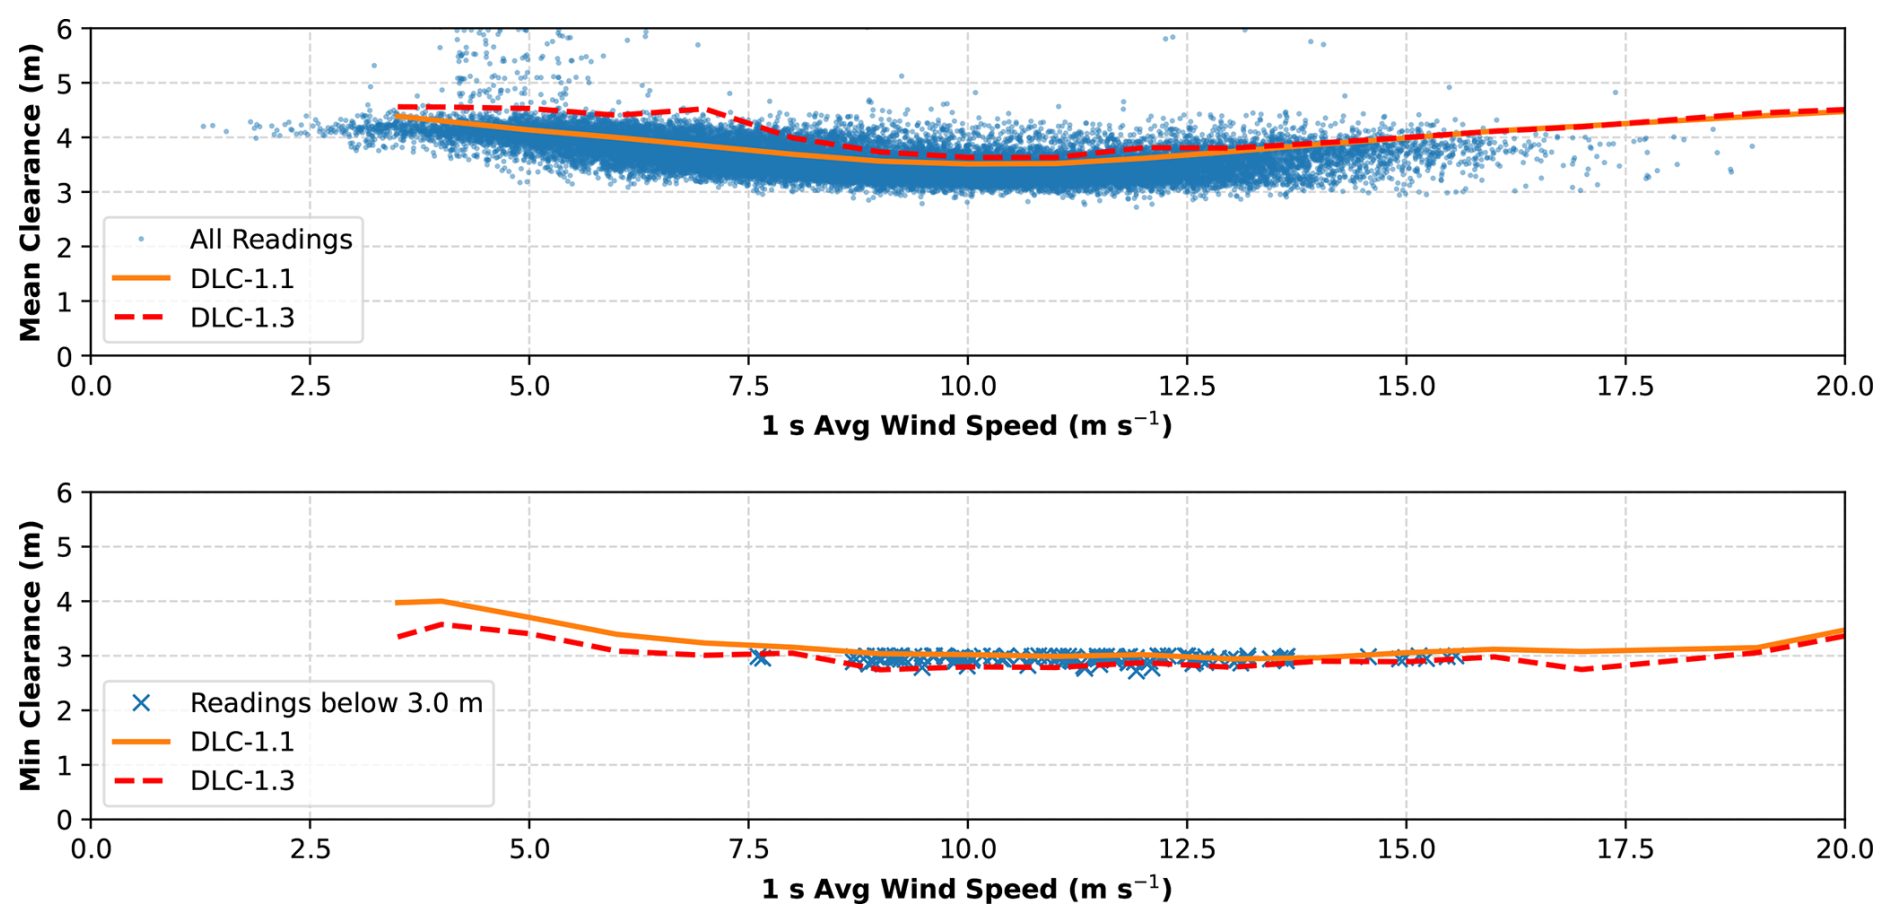
Figure 3Comparison between the numerical mean and minimum blade–tower clearance from six seeds of DLC-1.1 and DLC-1.3 and the experimental readings over 24 h for the upwind rotor of the GE 1.5 MW wind turbine. The simulations were performed with nominal nacelle tilt.
The last step to lower the risk of a potentially catastrophic tower strike during the downwind experiment consisted of quantifying the occurrence of DLC-1.4, which corresponds to an extreme coherent gust with direction change (ECD) (International Electrotechnical Commission, 2019). In total, 10 years of data collected between 2014 and 2024 at the M5 met mast installed at the NREL Flatirons Campus were analyzed. No gust was found exceeding the threshold defined by International Electrotechnical Commission (2019), namely, a gust of 15 m s−1 combined with a change in direction. The magnitude of the gust was constant across wind speeds, whereas the magnitude of the change in direction depended on the wind speed. Below 4 m s−1, the change was set to 180°. Above 4 m s−1, the prescribed direction change was smaller, as shown in Fig. 4, which also shows the experimental data points that were closest to an ECD event. Two of these points were simulated in OpenFAST by generating a coherent wind with an extreme change in direction, and the blade–tower clearance was equal to 1.6 m. On the basis of these results, it was concluded that it was safe to proceed with the experiment.
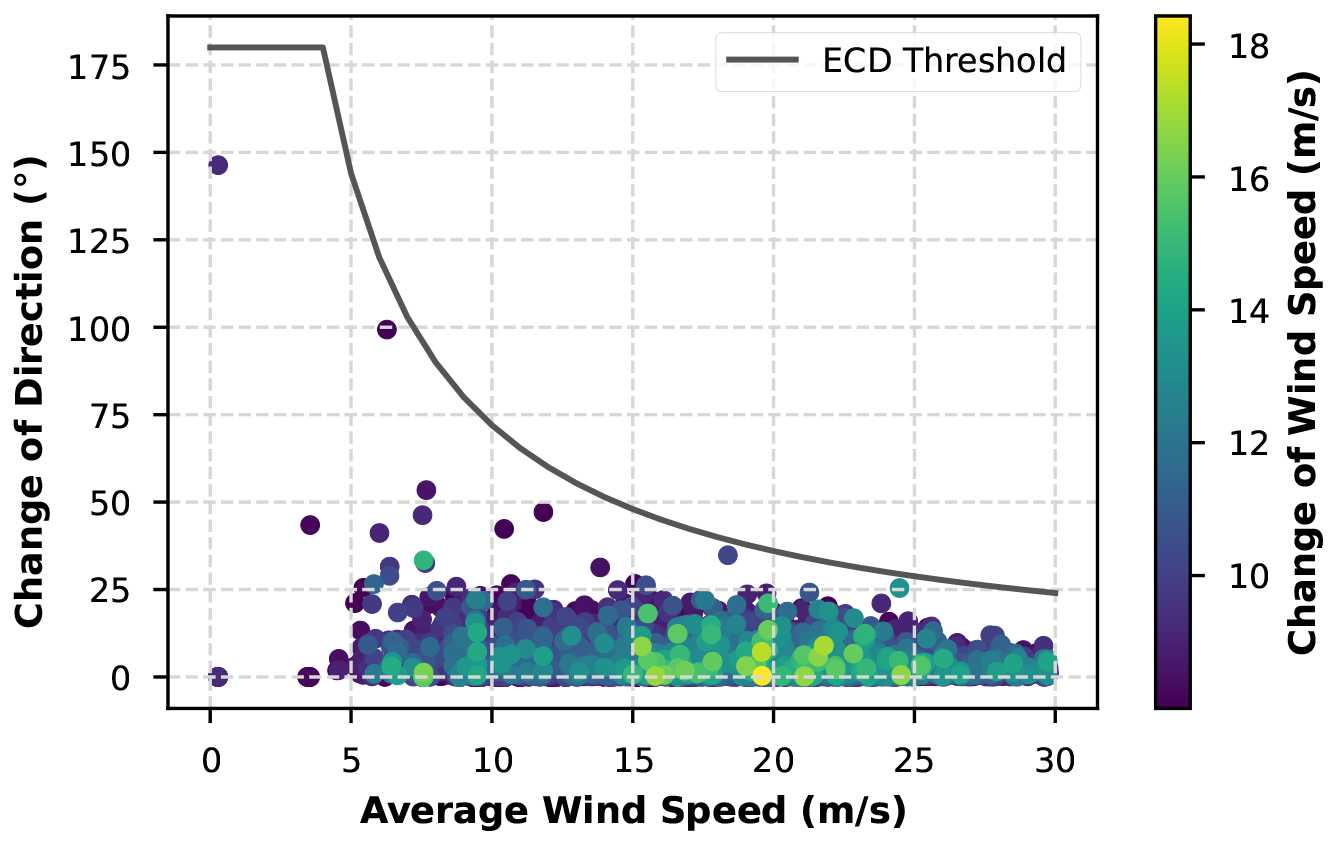
Figure 4The markers indicate ECDs recorded between 2014 and 2024 at the M5 met mast installed at the NREL Flatirons Campus. The black solid line represents the ECD as defined in International Electrotechnical Commission (2019). The definition of International Electrotechnical Commission (2019) is found to be conservative, and no gust is found exceeding the threshold.
3.2 Conversion to downwind
The team at NREL does not have the ability to change the control algorithm of the GE 1.5 MW wind turbine. However, the experiment was possible thanks to a few changes in the hardware of the machine that made the controller blind to the downwind orientation of the rotor. The first step consisted of applying a 180° offset to the three blades. Each blade is equipped with two bumpers that mark the 0° (rated) and 90° (parked) positions of the blade pitch angle. During the standard calibration process, a limit switch at the blade root passed the two positions to the controller. Six new pitch bumpers, identical to the six existing pitch bumpers, were manufactured and glued onto the nuts of the blade root t-bolts at 180 and 270°. The standard pitch calibration procedure was then started at the 180° mark. This procedure allowed achieving the offset in blade pitch, which was later qualitatively, with a photogrammetry process relying on photos shot from the ground while pointing vertically up. Table 3 lists the three pitch angles for both upwind and downwind operations, reconstructed via photogrammetry. The accuracy of the analysis based on photogrammetry was estimated to be ±0.02° based on the repeatability of the point placement and the resolution of the pictures.
Table 3Results of the photogrammetry carried out to ensure the alignment of the blade pitch among the three blades.

The next step consisted of physically turning the wind vane by 180°. Although upwind-oriented wind vanes commonly implement an offset of a few degrees to compensate for the downwash effects of the upwind rotor (Simley et al., 2021), this offset was neglected during the downwind experiment.
The third step consisted of switching the phases of the generator, which spun backwards in downwind, to enable the correct application of the generator torque given the reversed rotational speed. The wiring of the low-speed shaft proximity sensors at the gearbox junction box and the generator rotary encoder in the main downtower control cabinet was modified. This adjustment enabled the turbine control system and power converter to interpret rotational speed measurements in the reverse direction. A camera was also installed to monitor the gearbox oil sight glass after a fault was reported by the turbine controller for low gearbox oil level. The fault was attributed to reverse operation, which caused the gearbox to draw oil away from the level sensor, resulting in a low-level reading.
The fourth and last step involved installing a supervisory controller. The controller computed the 1 and 10 s averages of the wind speed measured on top of the nacelle and on the met mast at hub height. The supervisory controller also monitored the clearance between the blades and tower. Throughout the experiment, thresholds to one or more of these quantities could be set. When a threshold was violated, a small actuator located at the base of the tower mechanically pushed the idling command, sending the rotor to idling. The idling command was chosen as it triggered the mildest of the shutdown maneuvers, gradually reducing the rotor speed and unloading the three blades.
3.3 Commissioning
The experiment was conducted only in attended mode. The first commissioning test consisted of spinning the generator to the minimum rpm, which is roughly 1000 rpm, and then passing the safety checks of the GE controller. The second commissioning test consisted of connecting the generator to the grid. This step was performed on a low-wind day, when wind speeds were below 5 m s−1. After that, the turbine was ready for the actual testing campaign. During the testing, the following quantities were monitored:
-
blade–tower clearance
-
temperature signals from the gearbox and generator
-
main bearing front cover strain
-
particle counter in the gearbox oil.
The turbine was operated only when winds came consistently from the northwest sector, whereas it was not operated when winds were generated by local storms, which are known to move erratically along the plains surrounding the test site.
3.4 Experimental data collection
This section describes the data collection for loads (Sect. 3.4.1) and acoustics (Sect. 3.4.2).
3.4.1 Mechanical loads
Data collection for mechanical loads followed the guidance prescribed by International Electrotechnical Commission (2015). The data acquisition system is based on a National Instruments PXI real-time scan engine paired with a custom-developed and validated LabVIEW-based software, which synchronously records all samples with GPS time stamps. Data were saved in two parallel files: 24 h files using a 1 Hz sample rate and 10 min files using a 50 Hz sample rate. To arrive at a valid dataset, the following filters were applied to both the upwind and downwind data:
-
Data were removed when minimum power production was less than 0 kW.
-
Data were removed if the mean wind direction was outside the measurement sector (243–310°).
-
Data were removed when the mean wind speed was below the cut-in (3.5 m s−1).
-
Data were removed when the data acquisition system was not functioning normally.
-
Data were removed when critical instrumentation used in the experiment was not functioning normally.
Data were collected during the time periods specified in Table 4 for each respective dataset. Figure 5 provides the resulting capture matrices, showing the number of 10 min time periods categorized by wind speed and turbulence intensity for both the upwind and downwind datasets.
Table 4Time periods (expressed as day-month-year) and number of 10 min data samples of downwind and upwind data collection.
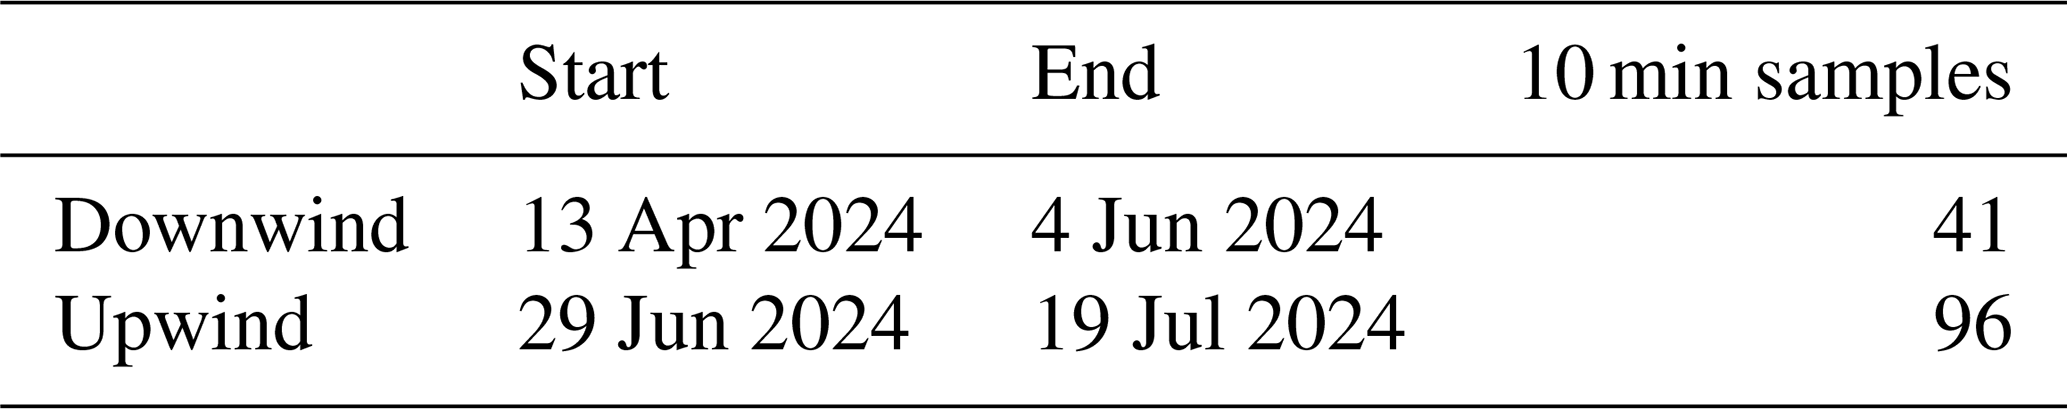
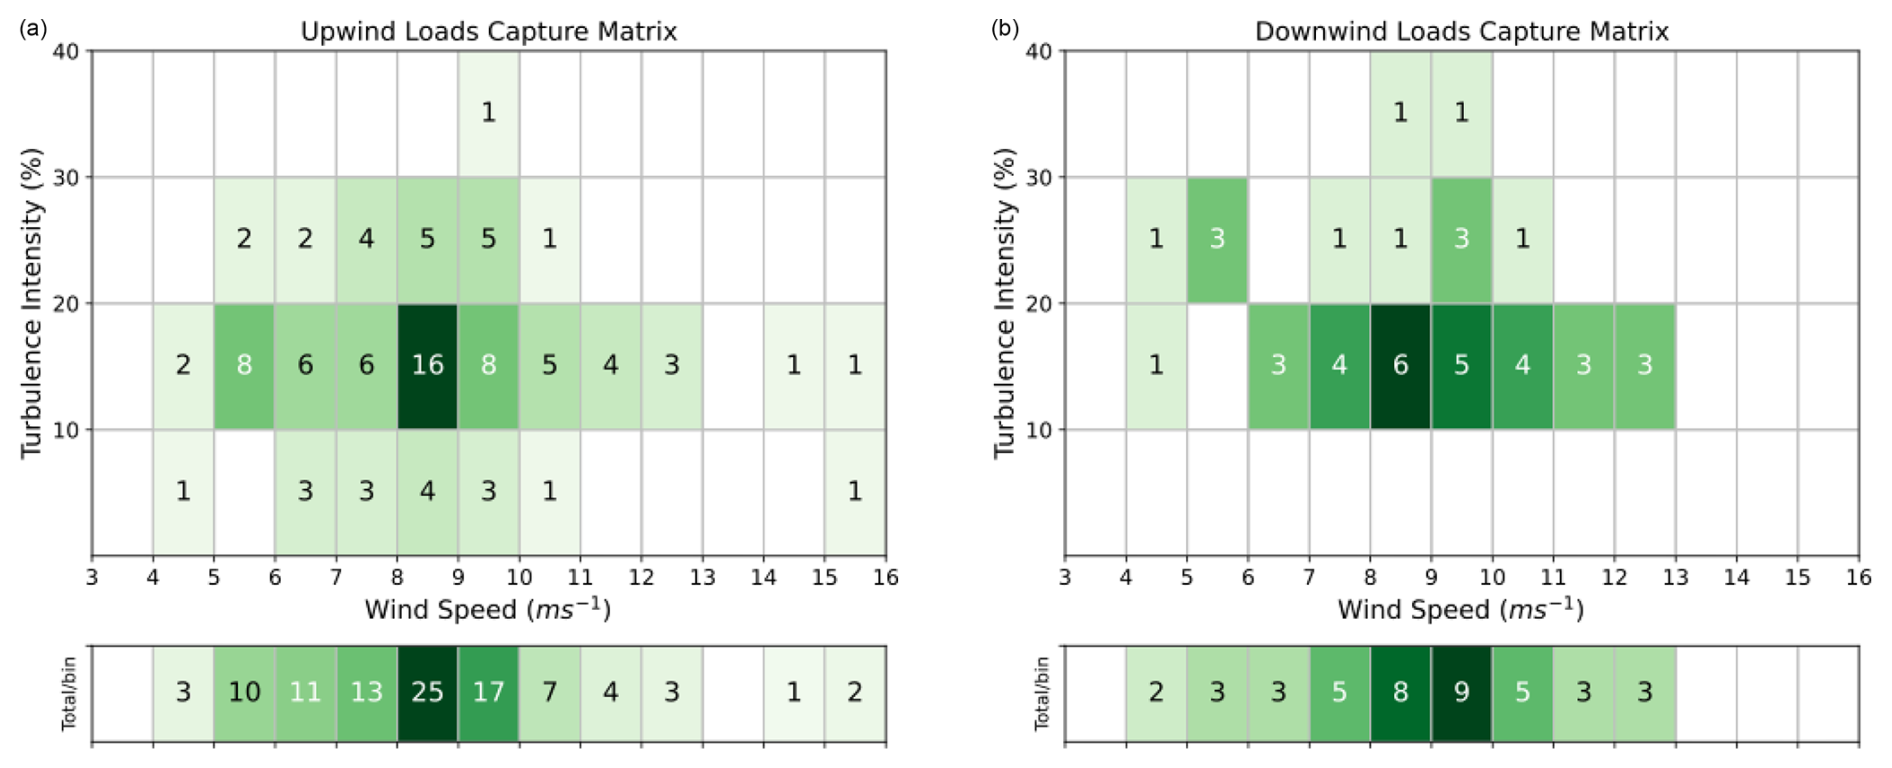
Figure 5The 10 min periods for the upwind (a) and downwind (b) datasets across wind speed and turbulence intensity.
3.4.2 Acoustics
The acoustic data acquisition system was a National Instruments cRIO-based system that stored raw sound pressure data at 51.2 kHz. Data were GPS-timestamped to allow synchronization with the turbine data acquisition system. The data acquisition system and microphone setup was a subset of the setup adopted in Hamilton et al. (2021). Recordings of the calibration tones were made at the beginning and end of every measurement period and compared to ensure minimal drift in acoustic values during the course of the experimental campaign.
Although attempts were made to collect acoustic data on multiple days, only the day of 13 April 2024 had favorable winds and lower background noise thanks to the fact that it was a Saturday and there were no other ongoing activities at the NREL Flatirons Campus. The analysis will focus on that day.
This section describes the data processing of the experimental and numerical datasets for both loads and acoustics.
4.1 Loads
4.1.1 Experimental data
The tower loads were calculated in the nacelle reference coordinate system as fore-aft and side-side bending moments using the yaw position. As per International Electrotechnical Commission (2015), the method of bins was utilized to determine bin averages and bin standard deviations for operating loads and damage equivalent loads (DELs). All data were binned by wind speed with 1 m s−1 widths starting at 3 m s−1 and ending at 16 m s−1. This upper wind speed limit was governed by the downwind operating limitations that were set as described in Sect. 3.1.4. The DEL was computed in accordance with International Electrotechnical Commission (2015):
where N is the total number of cycles, n is the number of load ranges, Ni is the number of cycles at load range i, Fi is the amplitude of load range i, and m is the Wöhler exponent. The DELs for the operating moments were calculated using material slopes m typical for the component and without Goodman correction. m was set to 4 for the tower and main shaft and to 10 for the blades. An exponent of 4 is typical for steel and cast iron, whereas an exponent of 10 is more common for fiberglass and other similar composites used in blades. A four-point rainflow counting algorithm based on the guidance from Amzallag et al. (1994) was used to analyze the high-frequency time series data for calculation of the short-term DELs.
4.1.2 Numerical data
The two OpenFAST models of the upwind and downwind configurations used during the FMEA and described in Sect. 3.1.2 were used for the generation of the numerical predictions for power and loads. OpenFAST was run with two different sets of inflows. First, for every 10 min experimental data point, six turbulent seeds were run in OpenFAST. Each set of six inflows was generated by running the solver TurbSim (Jonkman, 2014) matching the average wind speed, average turbulence intensity, and average exponential shear exponent measured on the met mast at hub height for each 10 min data point. OpenFAST was then run with the air density corresponding to each data point. This approach follows that described in Brown et al. (2024) and resulted in 246 OpenFAST simulations in the downwind case and 612 simulations in the upwind case. Note that this modeling approach aims to minimize the differences between numerical predictions and experimental observations, although it also inherently leads to numerical results where upwind and downwind face different inflow conditions, and the difference in loads and performance discussed later in Sect. 5.1 inevitably blend differences generated by the two orientations of the rotor with differences coming from the different inflow conditions. This approach, however, helps to focus on the validation of the numerical predictions. To isolate the effects of the rotor orientation, a second set of simulations was then run modeling six turbulent seeds of the normal turbulence model prescribed by International Electrotechnical Commission (2019) in DLC-1.1 between cut-in and cut-out wind speeds in steps of 2 m s−1, for a total of 72 simulations per rotor orientation. In this second set of simulations, upwind and downwind rotors face the same exact inflow. The approach followed in this second set of simulations is the same as the one often followed in existing literature, such as Bortolotti et al. (2019, 2022).
4.2 Acoustics
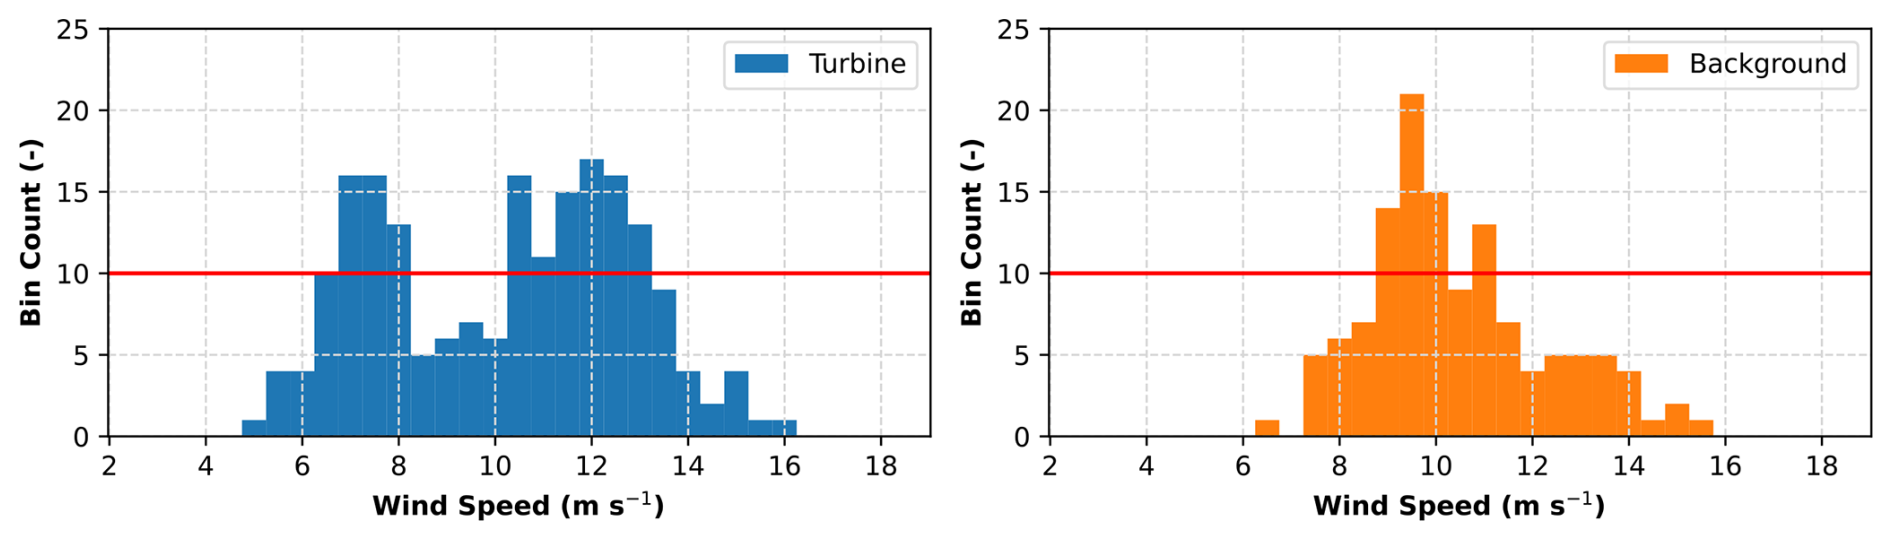
The analysis of acoustics was restricted to the experimental data, which were all listened to and quality controlled. Anything not directly part of the normal ambient acoustic signature of the turbine or background was disqualified from analysis. Interruptions that were removed included noise from wildlife (such as birds, frogs, and grasshoppers) and noise from human activities (such as aircraft and helicopters flying near the test site, cars or motorcycles riding along the nearby roads, and trains riding along the railway). Figure 6 includes a histogram of valid data collected as a function of the wind speed bin. The red line represents the minimum required data in each bin according to the standard (International Electrotechnical Commission, 2018). At certain wind speeds, the number of data points in the aeroacoustic dataset did not meet the minimum threshold required by the standards. This limitation is well known in the study. Nevertheless, we proceeded with the analysis.
During the experiment, an intermittent but audible amplitude modulation was observed, and data were processed to quantify metrics describing it. Amplitude modulation analysis followed the methods of International Electrotechnical Commission (2024) and Bass et al. (2016). It incorporated the following primary steps:
-
Calculate one-third-octave slices for the data in question with a period of 100 ms
-
Sum the bands of interest (50–200, 100–400, 200–800 Hz)
-
Analyze the band of interest in amplitude modulation identified by the model provided by the AMWG (UK Institute of Acoustics Amplitude Modulation Working Group, 2017).
Additional bands below 50–200 Hz were investigated, but it was found that the amplitude modulation energy was most prevalent in the 50–200 Hz band.
The model provided by the AMWG is documented in International Electrotechnical Commission (2024). When amplitude modulation was found to be present by the model, the output included the fundamental frequency in hertz, the prominence ratio, and the modulation depth in decibels. The number of occurrences as a function of the number of 10 s averaged samples could be calculated by comparing the number of times the model identified amplitude modulation to the number of samples presented to the model. The fundamental frequency was the dominant frequency of amplitude modulation found by the amplitude modulation detection method. The prominence ratio pAM is defined as the level to which the amplitude modulation stands out compared to the surrounding levels. The average prominence ratio was computed as defined by International Electrotechnical Commission (2024) and is shown in Eq. (2).
Here, Lpk is the magnitude of the fundamental peak, and Lm is the masking level. Both Lpk and Lm are expressed in decibels; therefore, pAM is non-dimensional. Lastly, the modulation depth is defined as the distance between the peak and valley of the modulation of the sound pressure level.
This section describes the results for loads (Sect. 5.1) and acoustics (Sect. 5.2).
5.1 Loads
The experimental data and the numerical power and load data can be compared in a number of ways. In this paper, we organized a first comparison in terms of two-by-two plots. The top-left quadrant shows a scatterplot of the raw experimental and numerical data for both the upwind and downwind configurations. The top-right corner shows the result of data binning. The bottom-left plot shows the difference in binned data between the downwind and upwind cases (downwind minus upwind), where the first line compares numerical data and the second line compares experimental data. The bottom-right plot switches the comparison and shows the difference in binned data between experimental and numerical data. The first line compares upwind data, and the second line, downwind data. Note that scatterplots were intentionally chosen over uncertainty bands for the binned data to maximize the clarity of the conclusions. Note also that the OpenFAST data refer to the simulations that model the inflow recorded in the field. The bottom-left plot also shows, however, the comparison between numerical predictions for upwind and downwind operating under the same identical inflow, namely, DLC-1.1, as discussed in Sect. 4.1.2. This last dataset isolates the differences with respect to the upwind and downwind configuration effects.
Figure 7 shows the active power of the generator. The bottom-left plot shows that both OpenFAST predictions and experimental recordings oscillate around the 0 % line above 7 m s−1. However, the solid light-green numerical line is consistently lower than the dashed dark-green experimental line, which sits above 0 % except at 7.5 m s−1. In other words, the experimental recordings show net gains for the downwind rotor compared to the upwind rotor. These gains are not clearly visible in the OpenFAST simulations and can be compared to the dash-dotted black line that shows that, during DLC-1.1, OpenFAST predicts a small drop in power for the downwind rotor. The prediction of a drop in power is consistent with the literature; see, for example, Bortolotti et al. (2019, 2022) and the references therein. Consistently with the bottom-left plot, the bottom-right plot shows that for both the upwind and downwind configurations, experimental recordings are higher than the OpenFAST predictions, with the downwind case returning a larger error. The net gains for the power of the downwind rotor observed in the experimental dataset are not obvious to justify. On the one hand, they could be an artifact caused by the limited amount of data collected in the downwind configuration. On the other hand, higher rotor power could come from aerodynamic effects that OpenFAST might struggle to capture. One source of the positive gain in power could come from the nacelle blockage effect, which, however, saw minimal impact in the high-fidelity numerical studies discussed in Anderson et al. (2020).

Figure 7Power of the upwind (UW) and downwind (DW) configurations in OpenFAST (OF) and in the field (Exp).
Figure 8 shows the DEL of the blade root flapwise moment. Statistics are averaged across the three blades. The top-left plot shows a notable spread in this quantity, which is impacted by the turbulence intensity. The bottom-right corner shows that OpenFAST is underpredicting this quantity by as much as 100 % where few data points are available and between 10 % and 30 % in the bulk of the dataset, namely, between 6.5 and 12.5 m s−1. Still, the top-right and bottom-left plots show that numerical predictions and experimental observations consistently return an increase in the DEL between 10 % and 20 % for the blade root flapwise moment in the wind speed range of 6.5 and 12.5 m s−1. In this range of wind speeds, where data are most abundant, the prediction of increasing DEL matches with both the inflow from the field and the inflow from DLC-1.1, which is represented by the black dash-dotted line. The comparison between upwind and downwind is deemed satisfactory, whereas the comparison between the experimental and numerical datasets shows differences that are generally higher than the differences quantified in Brown et al. (2024). At least a portion of these larger differences is likely to originate from the lower fidelity of the model simulating the structural dynamics of the blades of the 1.5 MW wind turbine compared to the model simulating the structural dynamics of the 2.8 MW wind turbine used in Brown et al. (2024). Nonetheless, it is reasonable to assume that the lower-fidelity structural dynamics model may cause similar errors for both upwind and downwind rotors.
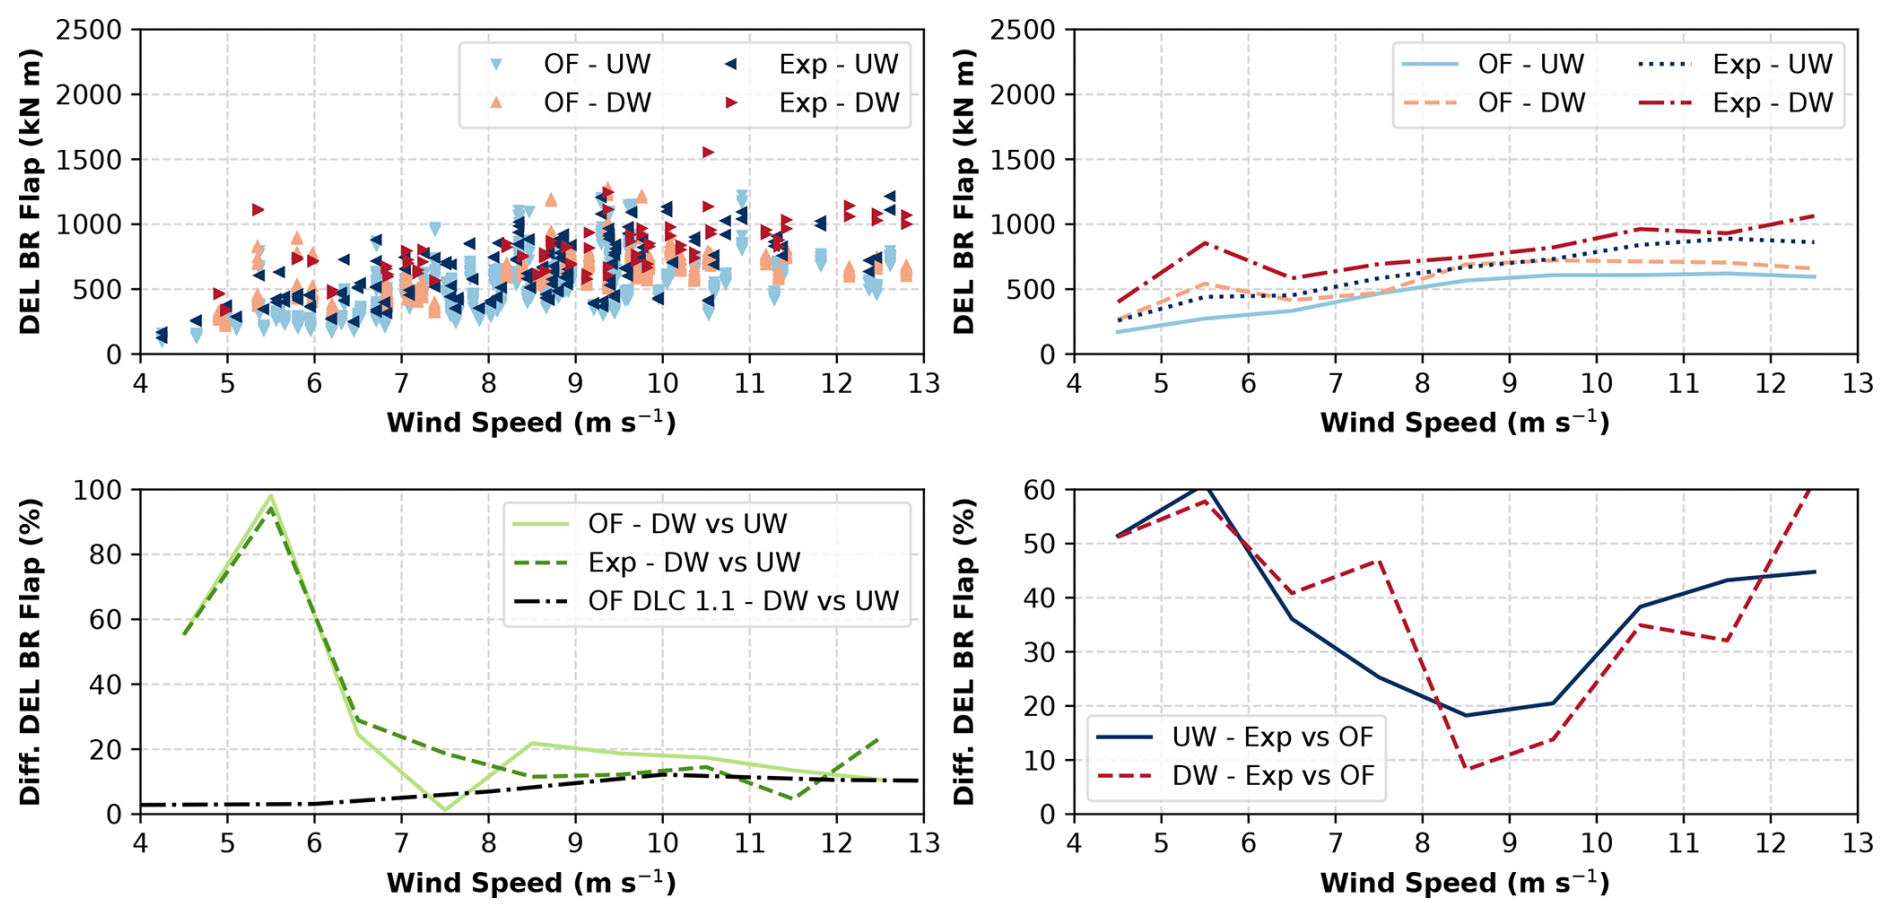
Figure 8DEL of the blade root (BR) flapwise moment of the upwind (UW) and downwind (DW) configurations in OpenFAST (OF) and in the field (Exp).
Figure 9 shows the DEL of the blade root edgewise moment. The takeaways are qualitatively similar to the ones for the DEL of the blade root flapwise moment, with a few key differences. The top-left quadrant shows a smaller spread in the data, and the bottom-left plot shows an increase in the DEL for the downwind rotor between 2 % and 10 % depending on the wind speed. Still, numerical predictions and experimental observations match in terms of trends. Also, experimental recordings are again higher than the predictions from OpenFAST. Again, it is reasonable to assume that a higher-fidelity structural dynamics solver would help reduce the differences in the bottom-right plot with respect to the errors quantified in Brown et al. (2024).
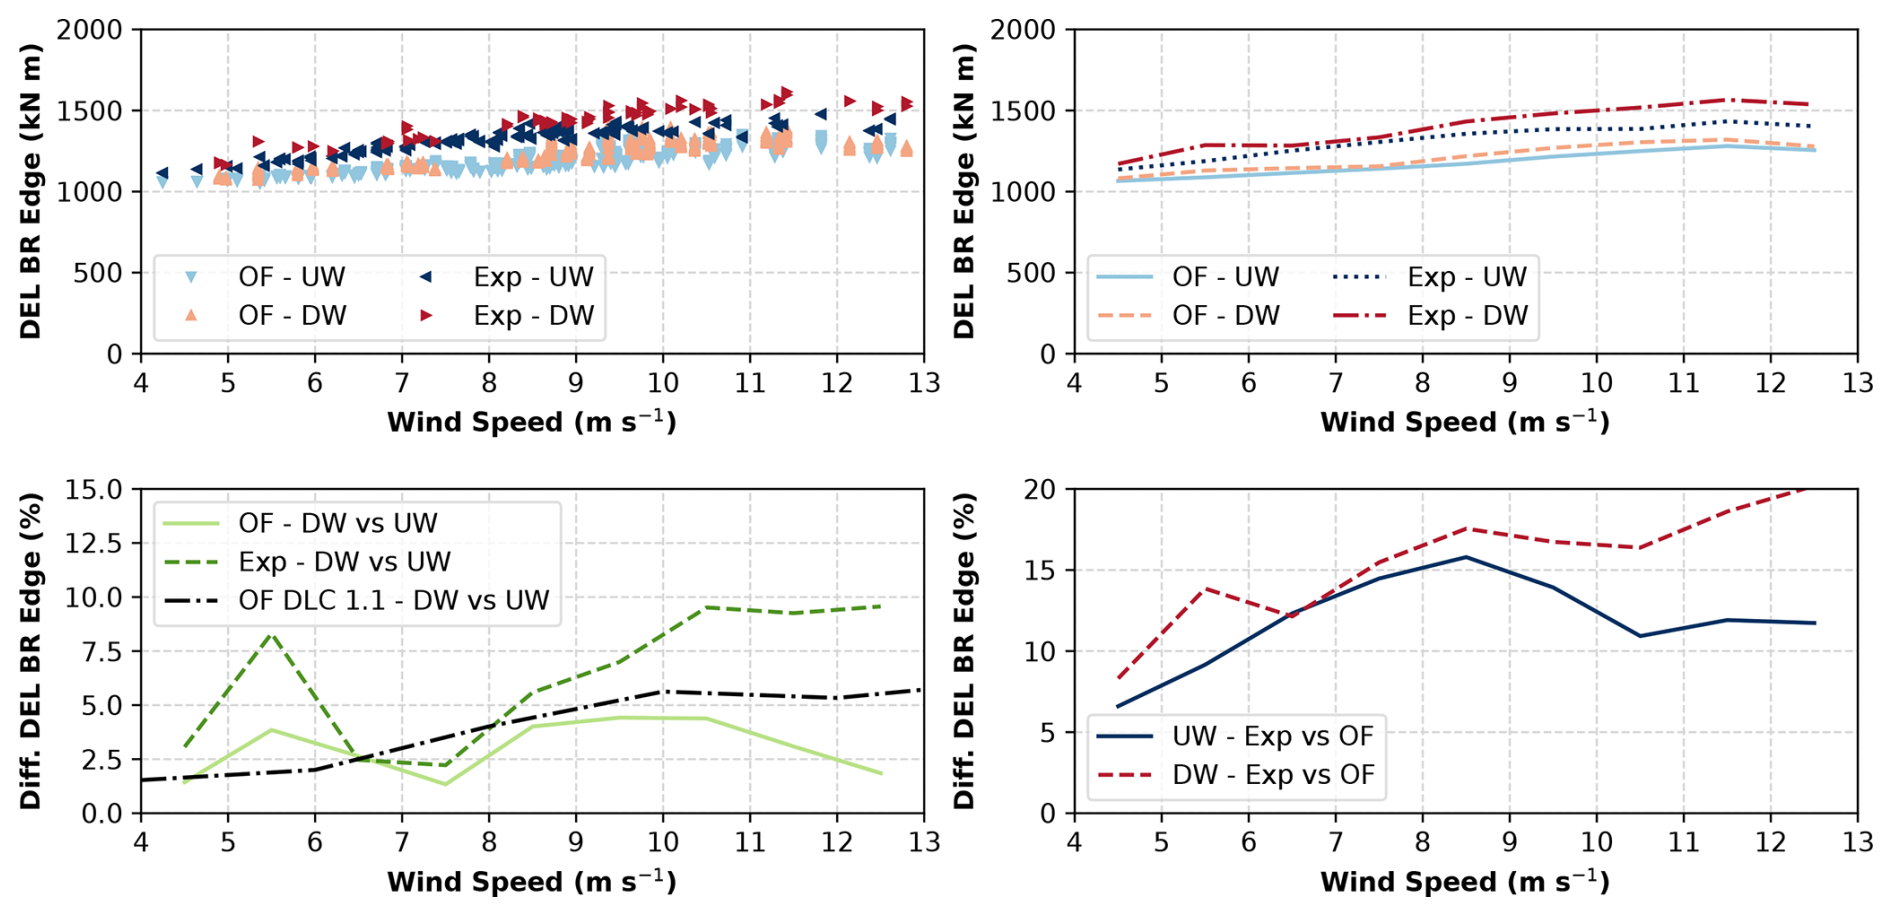
Figure 9DEL of the blade root (BR) edgewise moment of the upwind (UW) and downwind (DW) configurations in OpenFAST (OF) and in the field (Exp).
Last, Fig. 10 shows the DEL of the tower-base fore-aft moment. The takeaways are again similar to the ones from Fig. 8. The scatterplot in the top left shows a high variability of the data caused by turbulence. The binned averages reported in the top-right and bottom-left plots show an increase in the DEL between 10 % and 20 % between 6.5 and 12.5 m s−1. The increase in the solid light-green line is higher than the prediction of OpenFAST using DLC-1.1 inflow conditions and suggests that the results are influenced by turbulence. However, the trend of increasing DEL for downwind is confirmed.
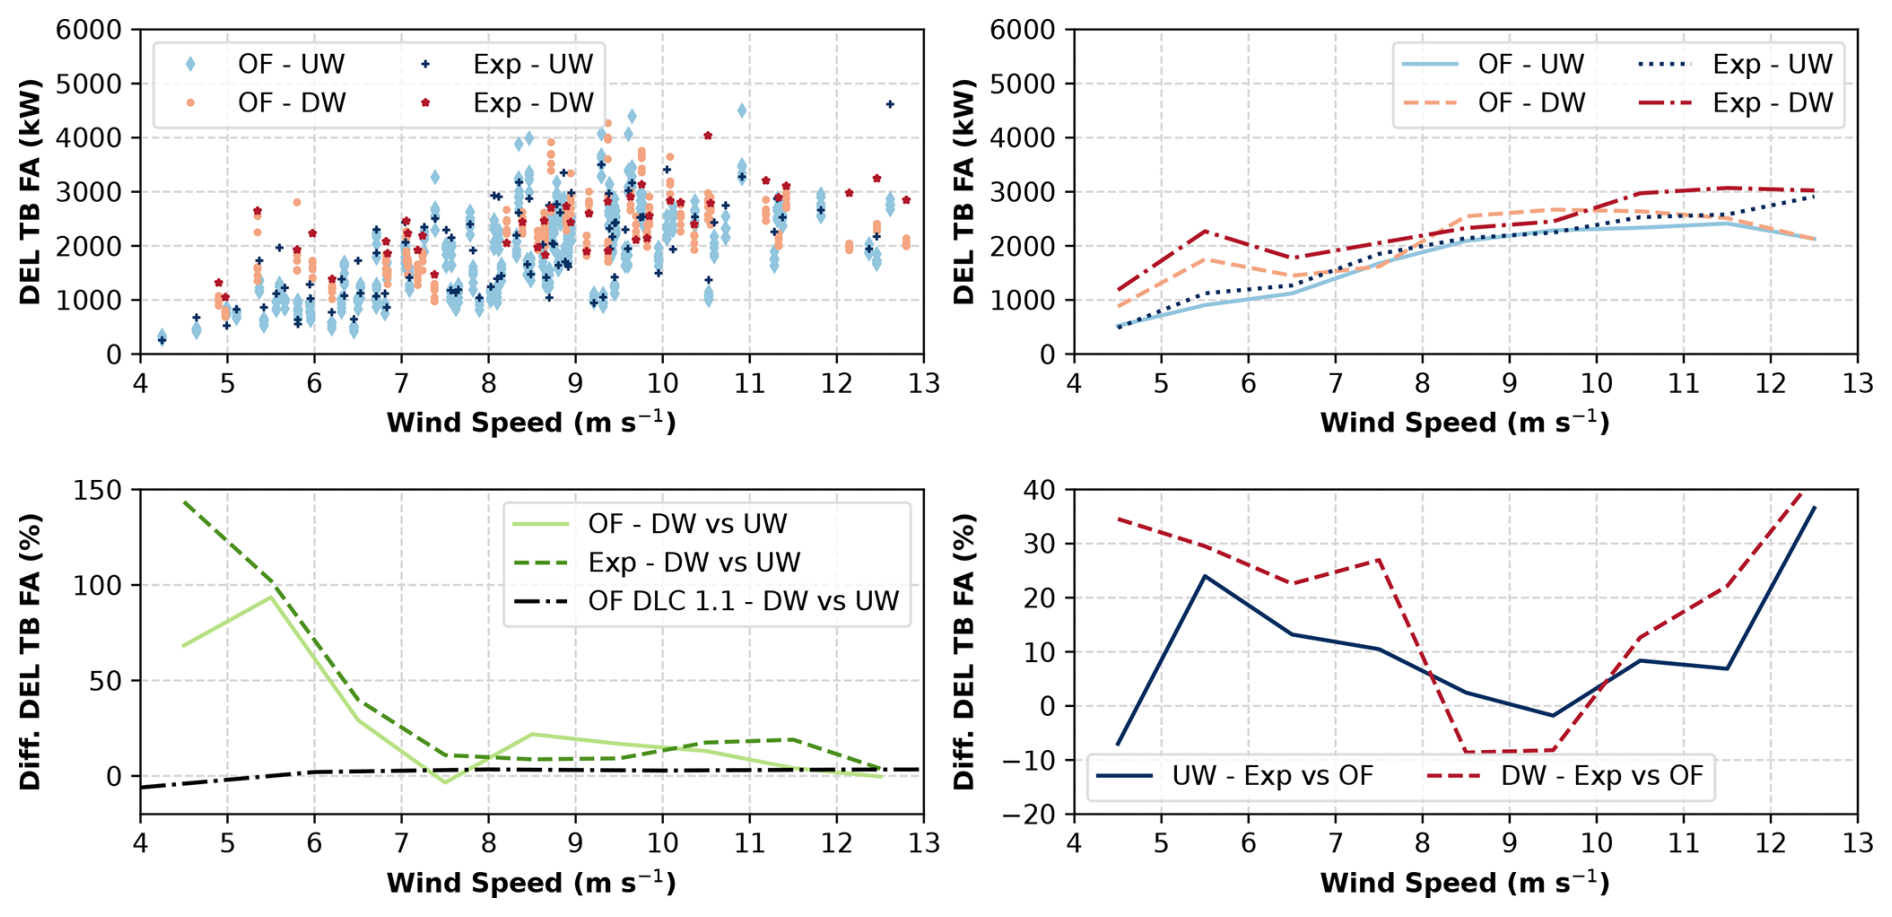
Figure 10DEL of the tower-base (TB) fore-aft (FA) moment of the upwind (UW) and downwind (DW) configurations in OpenFAST (OF) and in the field (Exp).
These figures represent just a subset of all possible visualizations of the data. More plots are provided in the Appendix. Figures A7 and A8 show the comparisons for the average blade root flapwise and edgewise moments, respectively. Figures A9 and A10 show the comparisons for the average tower-base fore-aft and side-side moments, respectively, whereas Fig. A11 shows the comparison for the DEL of the tower-base side-side moment. These plots are less conclusive than the ones presented in the main body of this article but are still included for completeness.
In some metrics, OpenFAST seems to be doing better at predicting quantities for the upwind rotor than for the downwind rotor, namely, generator power, blade root edgewise moment DEL, and possibly tower-base fore-aft moment DEL. This is however not the case for the blade root flapwise moment DEL, nor for many of the quantities plotted in the Appendix, namely, mean blade root edgewise moment, mean tower-base fore-aft moment, mean tower-base side-side moment, and tower-base side-side moment DEL. In Madsen et al. (2025), the accuracy of the tower shadow model is investigated thanks to measurements recorded by pressure belts. Those findings will shed more light on the accuracy of aeroelastic models for downwind rotors.
An additional comparison is provided in Table 5, where the power and DELs of the blade root flapwise, blade root edgewise, and tower-base fore-aft moments are weighted by a Weibull probability density function and integrated between wind speeds of 4.5 and 12.5 m s−1, which is the range of wind speeds with the highest density of data points. The Weibull probability density function is modeled with a shape factor of 2 and a mean wind speed of 7.5 m s−1, which corresponds to a scale factor of 8.46 m s−1. The first column of the table shows the comparison between upwind and downwind for the numerical predictions, whereas the second column shows the comparison for the experimental recordings. The trends discussed in Figs. 7, 8, 9, and 10 are consistently condensed into a single number. OpenFAST predicts that the downwind rotor operating in the field generates 0.5 % more power, whereas the experimental recordings return a higher gain of +3.8 %. For the DEL of the blade root flapwise moment, OpenFAST predicts a growth of 24.7 %, and the data from the field show +25.7 %. For the DEL of the blade root edgewise moment, the growth in OpenFAST is +3.1 %, and the field shows +5.9 %. Lastly, the DEL of the tower-base fore-aft moment grows by 21.1 % in OpenFAST and by 26.7 % in the field. The third column in Table 5 shows the comparison of downwind vs. upwind for the predictions of OpenFAST under the inflow of DLC-1.1. In this case, the Weibull probability density function extends from cut-in wind speed to cut-out wind speed. The changes in power and DELs, which are consistent with the literature, isolate the effects of the rotor orientation as predicted by OpenFAST and eliminate the effects of different inflow conditions.
Table 5Comparison between downwind and upwind of the generator power and key DELs weighted by Weibull probability density functions.

These results indicate that OpenFAST is capable of predicting the loads of both upwind and downwind rotors of the GE 1.5 MW wind turbine fairly accurately, especially in terms of trends. The experimental measurements confirm the prediction of higher DELs for downwind, although they suggest that the numerical predictions might be slightly underestimating the difference between upwind and downwind rotors. For power, OpenFAST predicts a small influence of the downwind orientation of the rotor, whereas the experimental measurements show a power increase.
5.2 Experimental acoustics
The acoustics dataset was processed first in terms of overall sound pressure and sound power levels, as discussed in Sect. 5.2.1, and then in terms of amplitude modulation, as discussed in Sect. 5.2.2.
5.2.1 IEC results
Valid turbine and background raw sound pressure levels plotted as a function of hub-height wind speed are shown in the top plot of Fig. 11. The downwind dataset is compared to a dataset collected during an IEC noise test conducted in 2011 for the upwind rotor and documented in Roadman and Huskey (2015). The data largely overlap. Following the analysis method defined in International Electrotechnical Commission (2018), the bottom plot in Fig. 11 shows the averaged overall sound power levels as a function of wind speed at a height of 10 m. The data show strong agreement in all but the highest wind speed bin between the upwind and downwind measurements, although the difference at higher wind speeds might be simply caused by the sparsity of data points. After this comparison was completed, focus switched to comparing the amplitude modulation to distinguish any acoustical differences between the upwind and downwind configurations.
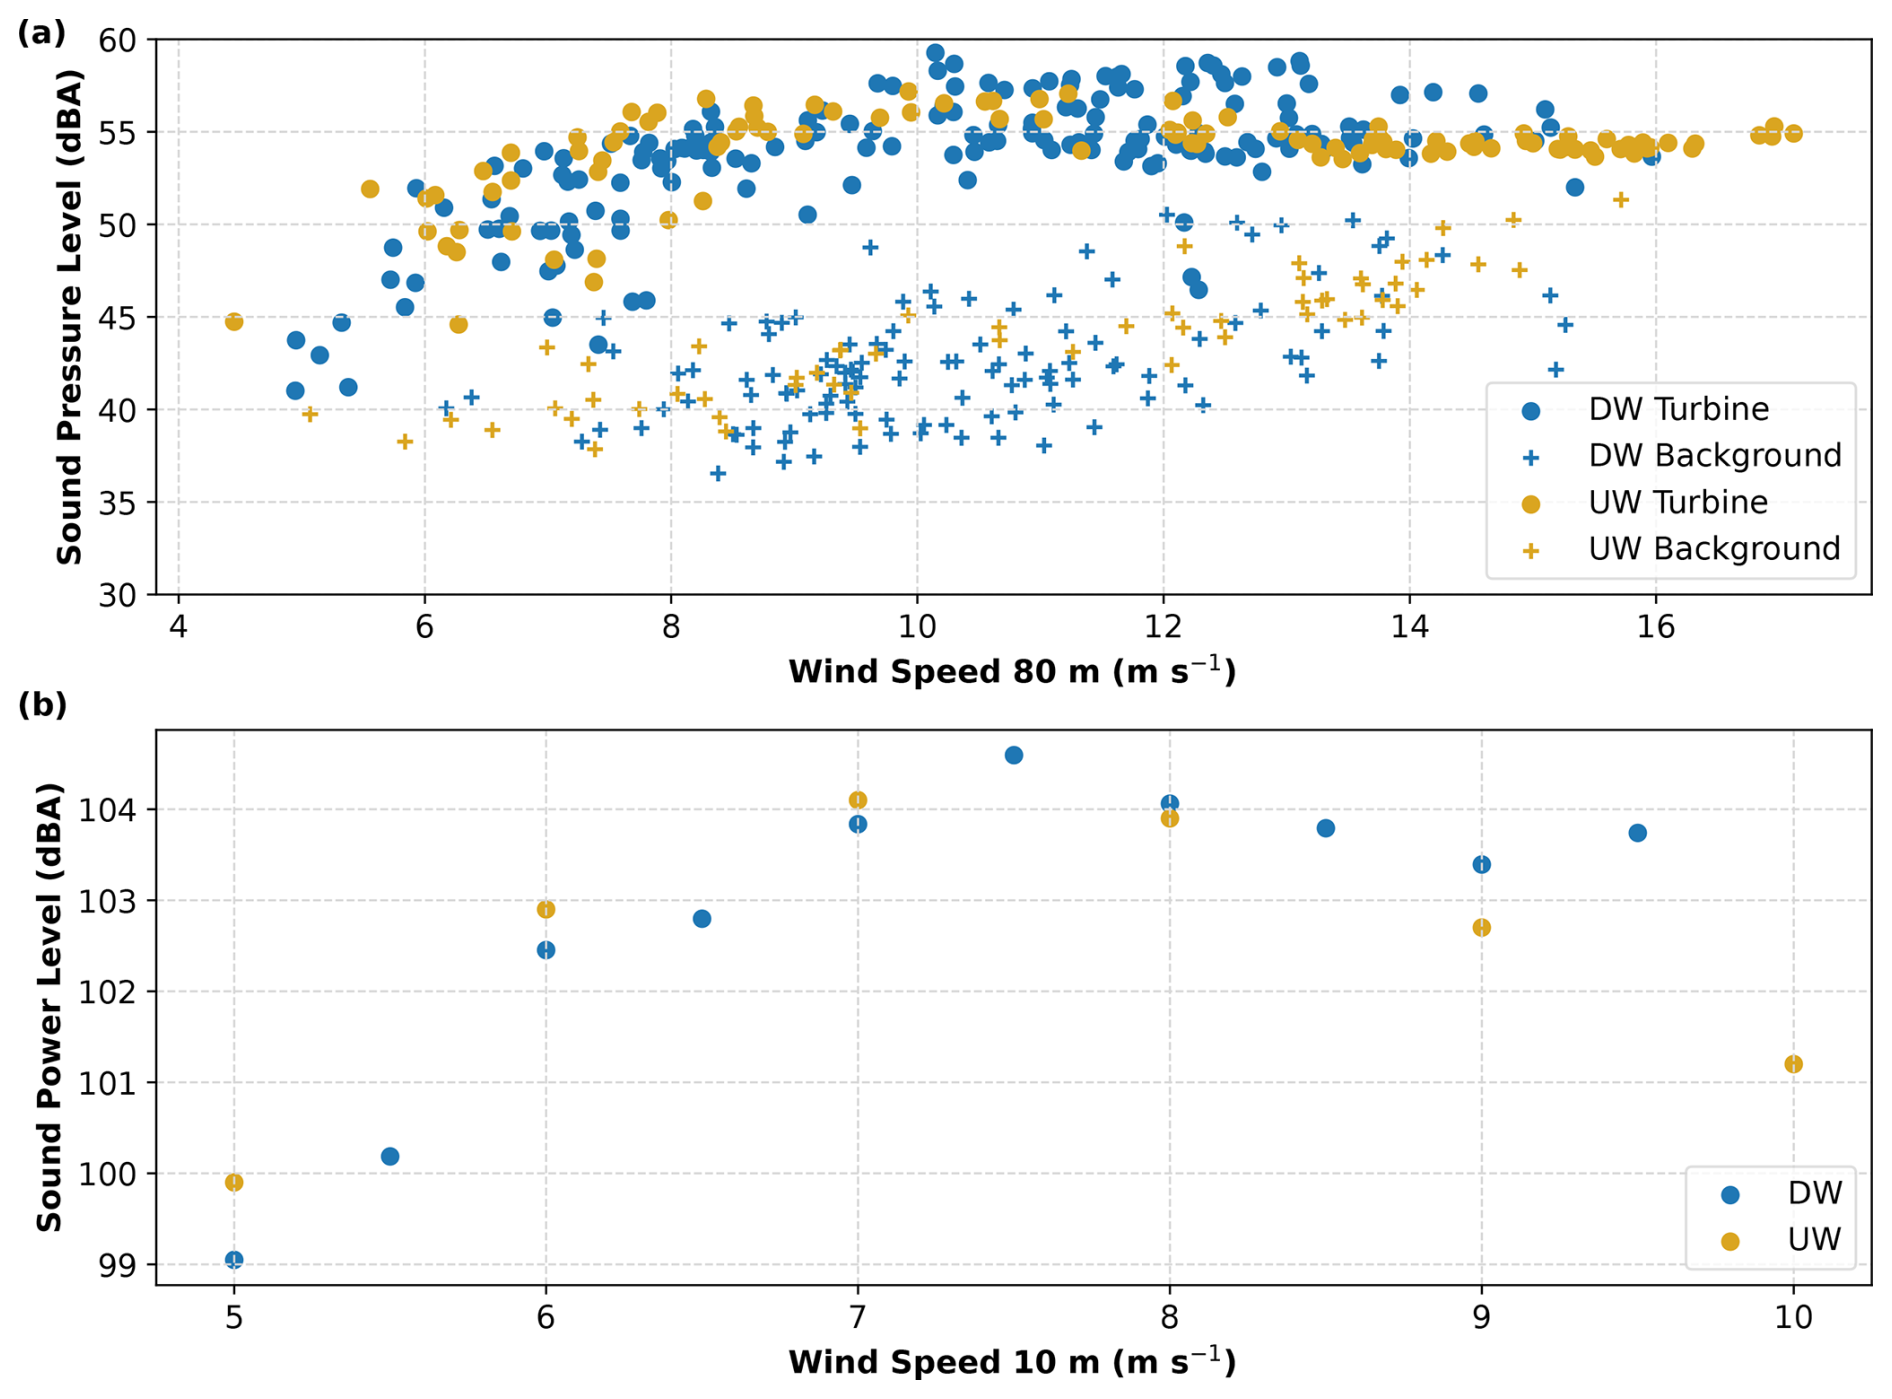
Figure 11(a) Comparison between sound pressure levels for the upwind (UW) and downwind (DW) rotors. Background data are also included. The UW dataset was collected during an IEC noise test conducted in 2011. (b) Comparison in the form of sound power levels.
5.2.2 Amplitude modulation
As amplitude modulation represented the characteristic acoustic behavior of the turbine during operation downwind, the analytical focus of the acoustic investigation centered around amplitude modulation.
First, the data were plotted in the form of spectrograms, which offer a qualitative visualization of the dataset. Figure 12 shows spectrograms of two 10 s long audio snippets of upwind operational data from 2011 and downwind operational data from the data collected on 13 April 2024. Both snippets were recorded by microphones that measured in the audible range. There is little to no amplitude modulation present in the upwind data, whereas amplitude modulation is clearly present in the downwind clip. The spectrograms were generated in Python, leveraging the open-source SciPy library with no filtering nor windowing applied to the data. Although the two spectrograms are similar, the downwind one shows vertical periodic spikes and striations at an interval corresponding to the blade passing. Vertical striation is less notable in the upwind spectrogram. Note that neither spectrogram shows horizontal striations at low frequency corresponding to the rotor harmonics, such as the spectrograms shown in Blumendeller et al. (2020). Note also that several attempts were made to plot and visualize data with finer discretization along the y axis as well as in terms of power spectral densities and fast Fourier transforms, but the differences between the upwind and downwind datasets could not be isolated and quantified rigorously.
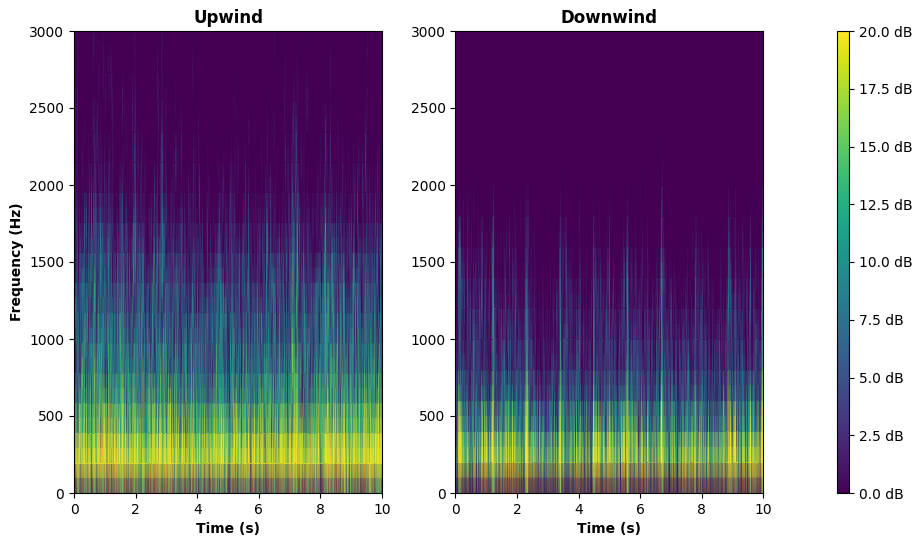
Figure 12Spectrograms of upwind and downwind turbine one-third-octave-band sound pressure levels during normal operation.
Next, the data were post-processed according to the methods for amplitude modulation described in International Electrotechnical Commission (2024), which offer a more quantitative approach than spectrograms. Figure 13 shows a plot of the fundamental frequency as identified from the amplitude modulation method and the 3P rotor harmonic as a function of time. When the turbine is operating at a rated speed of 18.3 rpm, i.e., 0.305 Hz, the method consistently shows the existence of amplitude modulation and identifies the corresponding fundamental frequency of 0.915 Hz, in line with 3 times the blade-passing frequency. In contrast, there is no correlation between the fundamental frequency of the amplitude modulation detected by the model provided by the AMWG and the rotor speed when the 3P frequency of the rotor is below 0.4 Hz, which corresponds to a rotor speed below the minimum operational rotor speed of the turbine.

Figure 13Time series of the rotor 3P harmonic, which is the frequency in hertz corresponding to 3 times the rotor speed, and the fundamental frequency detected by the amplitude modulation (AM) method. Rated rotor speed is 18.3 rpm. At rated conditions, the 3P rotor harmonic is at 0.915 Hz.
Three operational cases were studied with the amplitude modulation method: downwind, upwind, and background noise. The background noise was included as a baseline to investigate how often the method identifies false positives. The results are reported in Fig. 14. The data post-processing identifies amplitude modulation 82 % of the time for the downwind recordings, 29 % of the time for the upwind recordings, and only 7 % of the time for the background analysis. The prominence ratio is 13.5 for the downwind configuration, 2.9 for the upwind configuration, and 1.3 for the background analysis. The modulation depth is found to have a mean of 7.6 for the downwind case, 3.8 for the upwind case, and 3.7 for the background case. These results show that the downwind configuration causes more frequent and stronger events of amplitude modulation.

Figure 14Incidents of amplitude modulation (a), prominence of amplitude modulation (b), and maximum, minimum, and mean modulation depths as a function of the operating condition (c).
This paper discusses the motivation, preparation, risk mitigation, execution, and results of a full-scale experiment where the rotor of a GE 1.5 MW wind turbine was operated in a downwind configuration. In this experiment, we collected loads, performance, and acoustic measurements. Power and loads were compared to numerical predictions from the aeroelastic solver OpenFAST, which was run modeling both the inflow conditions measured in the field and the standard inflow conditions corresponding to the normal turbulence model prescribed for DLC-1.1 by International Electrotechnical Commission (2019). The key takeaways are summarized here:
-
Given the inflow measured in the field, OpenFAST predicts an increase of +0.5 % in the Weibull-weighted power for the downwind rotor. The experimental recordings show a more marked +3.8 %. Under DLC-1.1 inflow, OpenFAST predicts a drop in the Weibull-weighted power of 0.4 % for the downwind rotor.
-
The Weibull-weighted DEL of the blade root flapwise moment grows for the downwind rotor by +24.7 % in OpenFAST and by +25.7 % in the field. Under DLC-1.1 inflow, OpenFAST predicts a growth in the Weibull-weighted DEL of +7.9 %.
-
The Weibull-weighted DEL of the blade root edgewise moment grows for the downwind rotor by +3.1 % in OpenFAST and by +5.9 % in the field. During DLC-1.1, the growth is +4.0 %.
-
The Weibull-weighted DEL of the tower-base fore-aft moment grows for the downwind rotor by +21.1 % in OpenFAST, by +26.7 % in the field, and by +2.5 % during DLC-1.1.
-
Experimental overall sound pressure levels are comparable between the upwind and downwind cases, but the downwind scenario shows higher incidents, prominence ratio, and modulation depth of the amplitude modulation.
These results build confidence in the ability of OpenFAST to predict the behavior of both upwind and downwind rotors, although the growth of DEL in downwind rotors is generally slightly underpredicted, whereas OpenFAST seems to miss a positive gain in power for the downwind rotor.
Research is currently ongoing to investigate the potential of downwind rotors for offshore applications, especially for floating wind turbines, where the rotor tilt of downwind rotors compensates the average pitch angle of the floating platform and could lead to a sizable increase in power performance. Full-scale wind turbine concepts with downwind rotors are already at the prototype stage, and techno-economic analyses aim to shed more light on the advantages and drawbacks of downwind rotors for floating wind applications.
Table A1Summary of turbine instrumentation: non-load channels.


Table A4Summary of FMEA conducted between NREL and third-party consultant Gulf Wind Technology. Only risks characterized by an RPN of 10 and above are reported.

Table A5Summary of design load cases, following the International Electrotechnical Commission (2019) standards. *1-year and 50-year storm turbulent wind speeds were tuned for the NREL Flatirons Campus (FC) following Hamilton and Debnath (2019). OpenFAST could not complete a few cases, which are listed in parentheses. Those cases were excluded from the load analysis.


Figure A1Load ranking of the blade root combined bending moment between the downwind (a) and upwind (b) configurations. Downwind operations do not cause a clear increase in this ultimate load, which is dominated by storm case DLC-6.2.

Figure A2Load ranking of the low-speed shaft combined bending moment between the downwind (a) and upwind (b) configurations. Downwind operations cause a +20 % increase in the presence of an unlikely event that combines high turbulence and high shear. If this case is excluded, the increase drops to +12 % and occurs during an unlikely DLC-1.4, namely, an ECD (International Electrotechnical Commission, 2019).
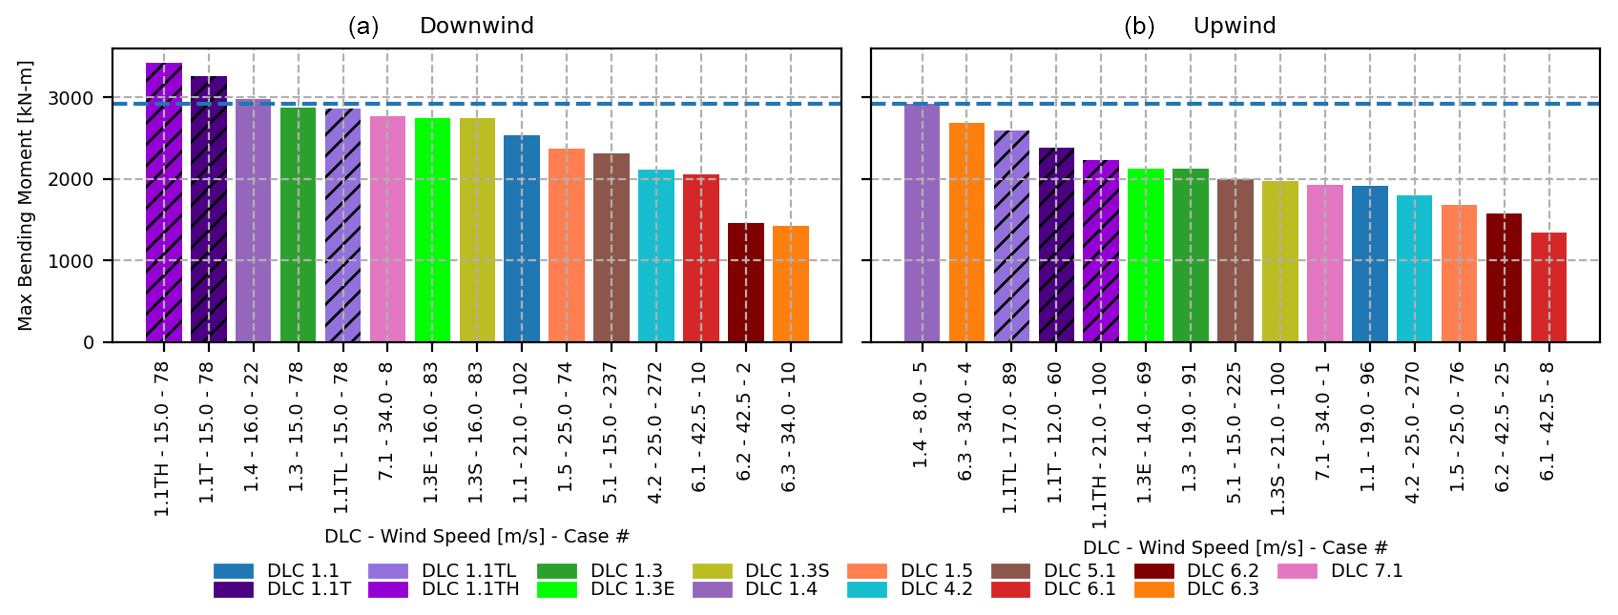
Figure A3Load ranking of the tower-top combined bending moment between the downwind (a) and upwind (b) configurations. Downwind operations cause a +16 % increase in the presence of an unlikely event that combines high turbulence and high shear. If this case is excluded, the increase drops to +2 % and occurs during an unlikely DLC-1.4, namely, an ECD (International Electrotechnical Commission, 2019).

Figure A4Load ranking of the tower-base combined bending moment between the downwind (a) and upwind (b) configurations. Downwind operations do not cause a clear increase in this ultimate load, which is dominated by storm case DLC-6.2. The red dashed line shows the nominal design limits.

Figure A5Minimum blade–tower clearance between the downwind (a) and upwind (b) configurations. The red dashed line indicates the minimum allowable clearance prescribed by International Electrotechnical Commission (2019). The experiment clearly violated the minimum clearance and was a source of risk; see Sect. 3.1.4.

Figure A6Probability density functions (PDFs) of the blade–tower clearance at each blade passage for the six turbulent seeds of each DLC listed in the legend; see Sect. 3.1.2 for more details.
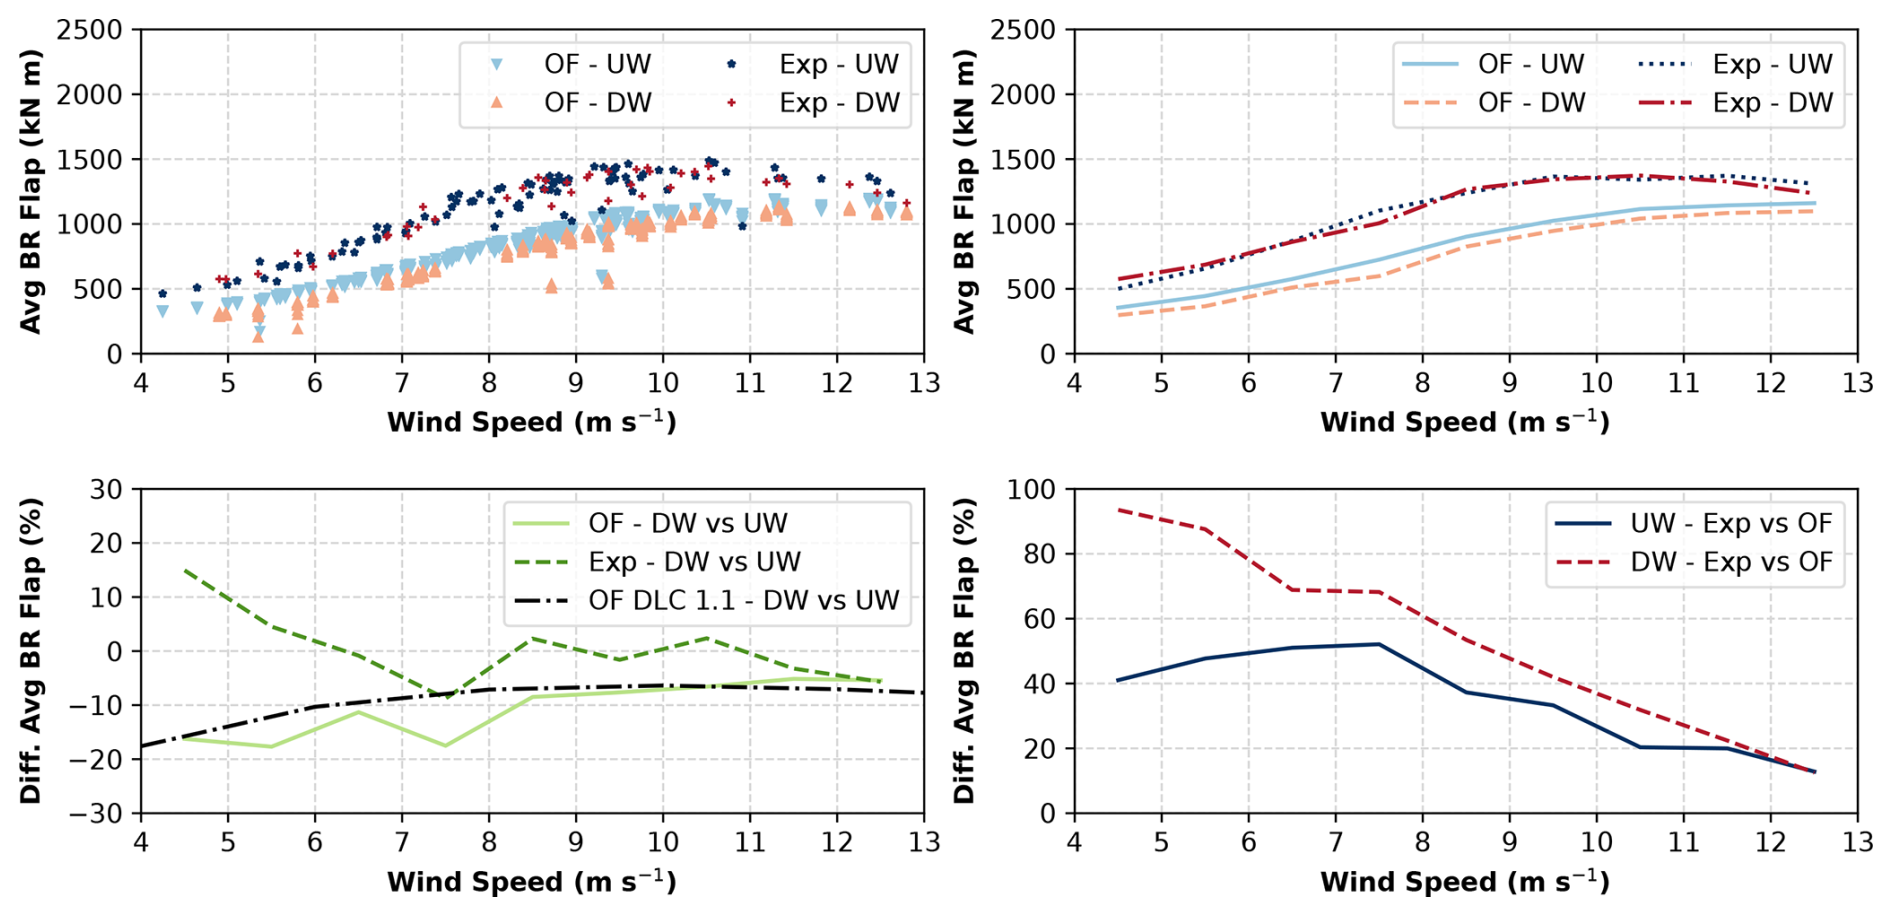
Figure A7Mean blade root (BR) flapwise moment of the upwind (UW) and downwind (DW) configurations in OpenFAST (OF) and in the field (Exp).
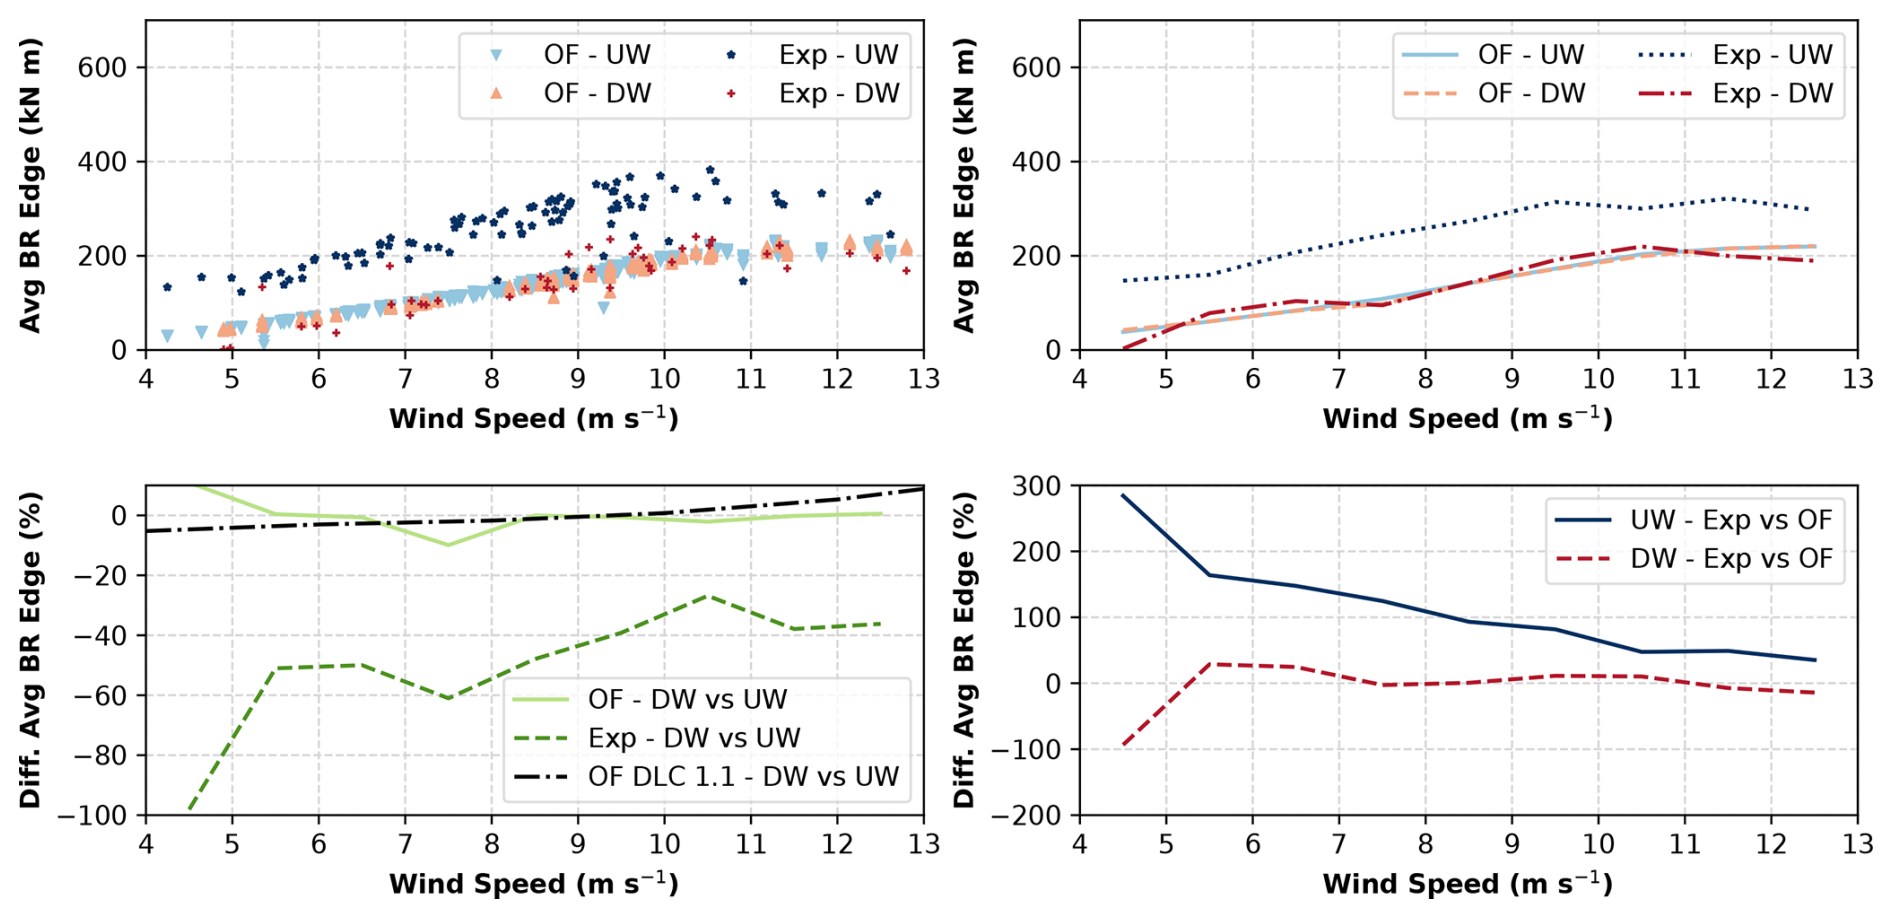
Figure A8Mean blade root (BR) edgewise moment of the upwind (UW) and downwind (DW) configurations in OpenFAST (OF) and in the field (Exp).
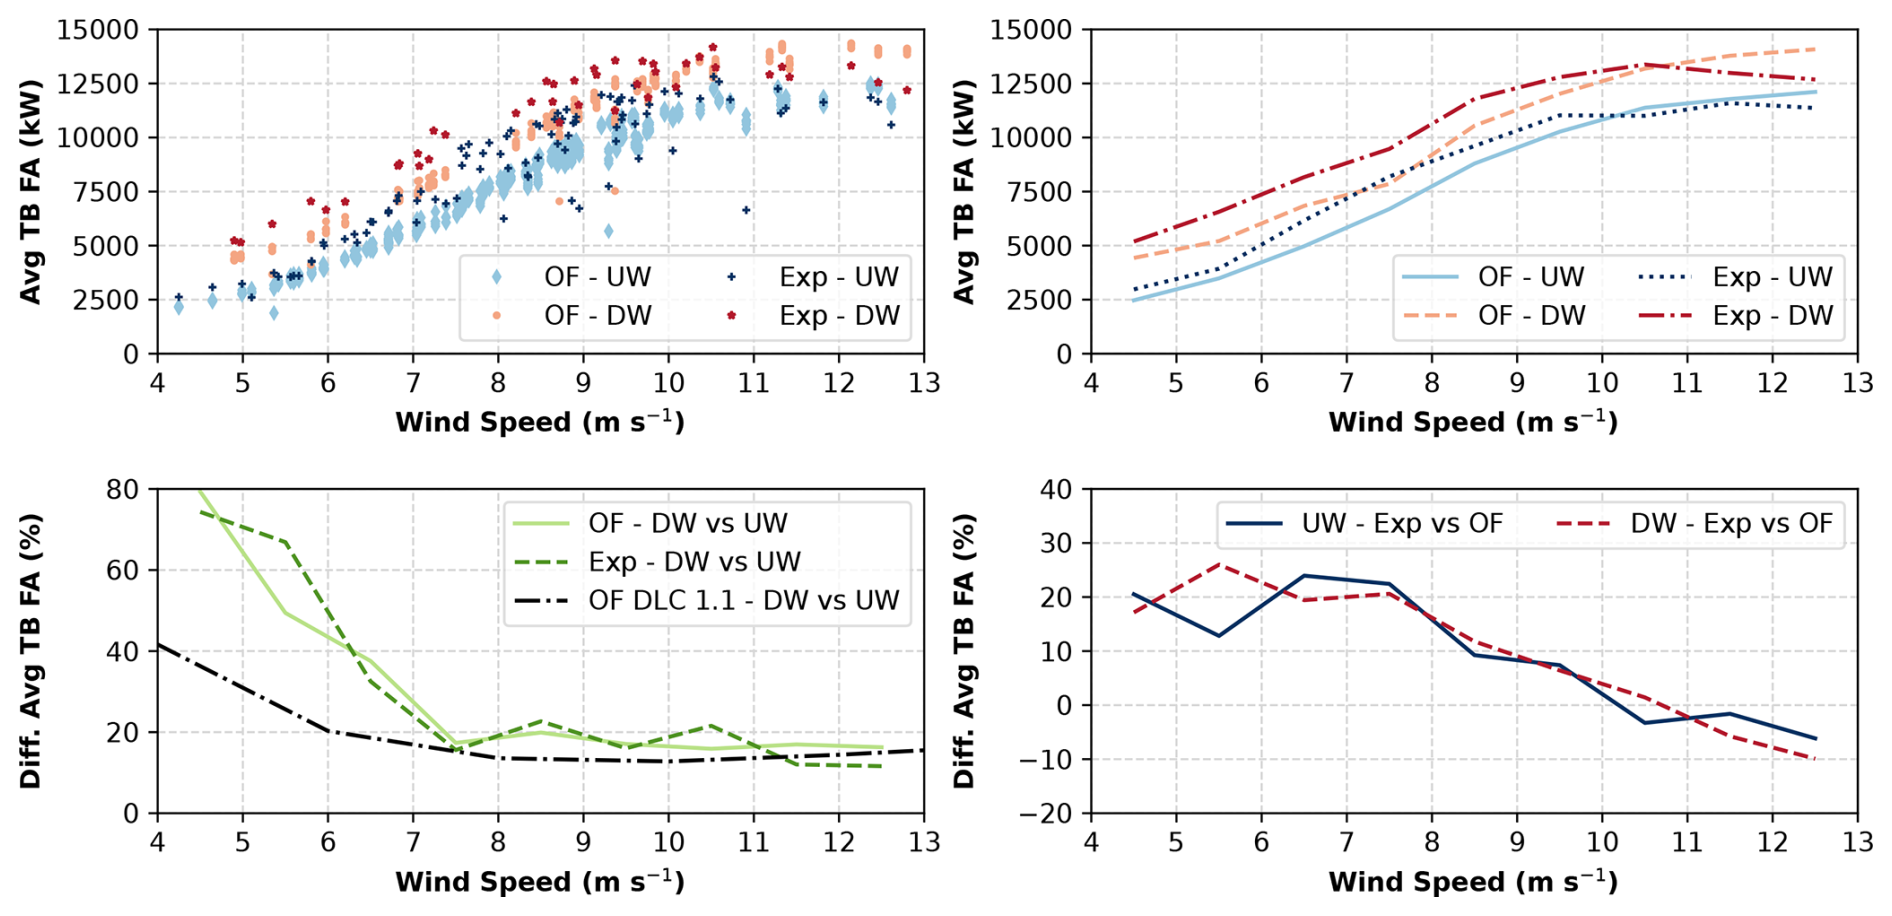
Figure A9Mean tower-base (TB) fore-aft (FA) moment of the upwind (UW) and downwind (DW) configurations in OpenFAST (OF) and in the field (Exp).
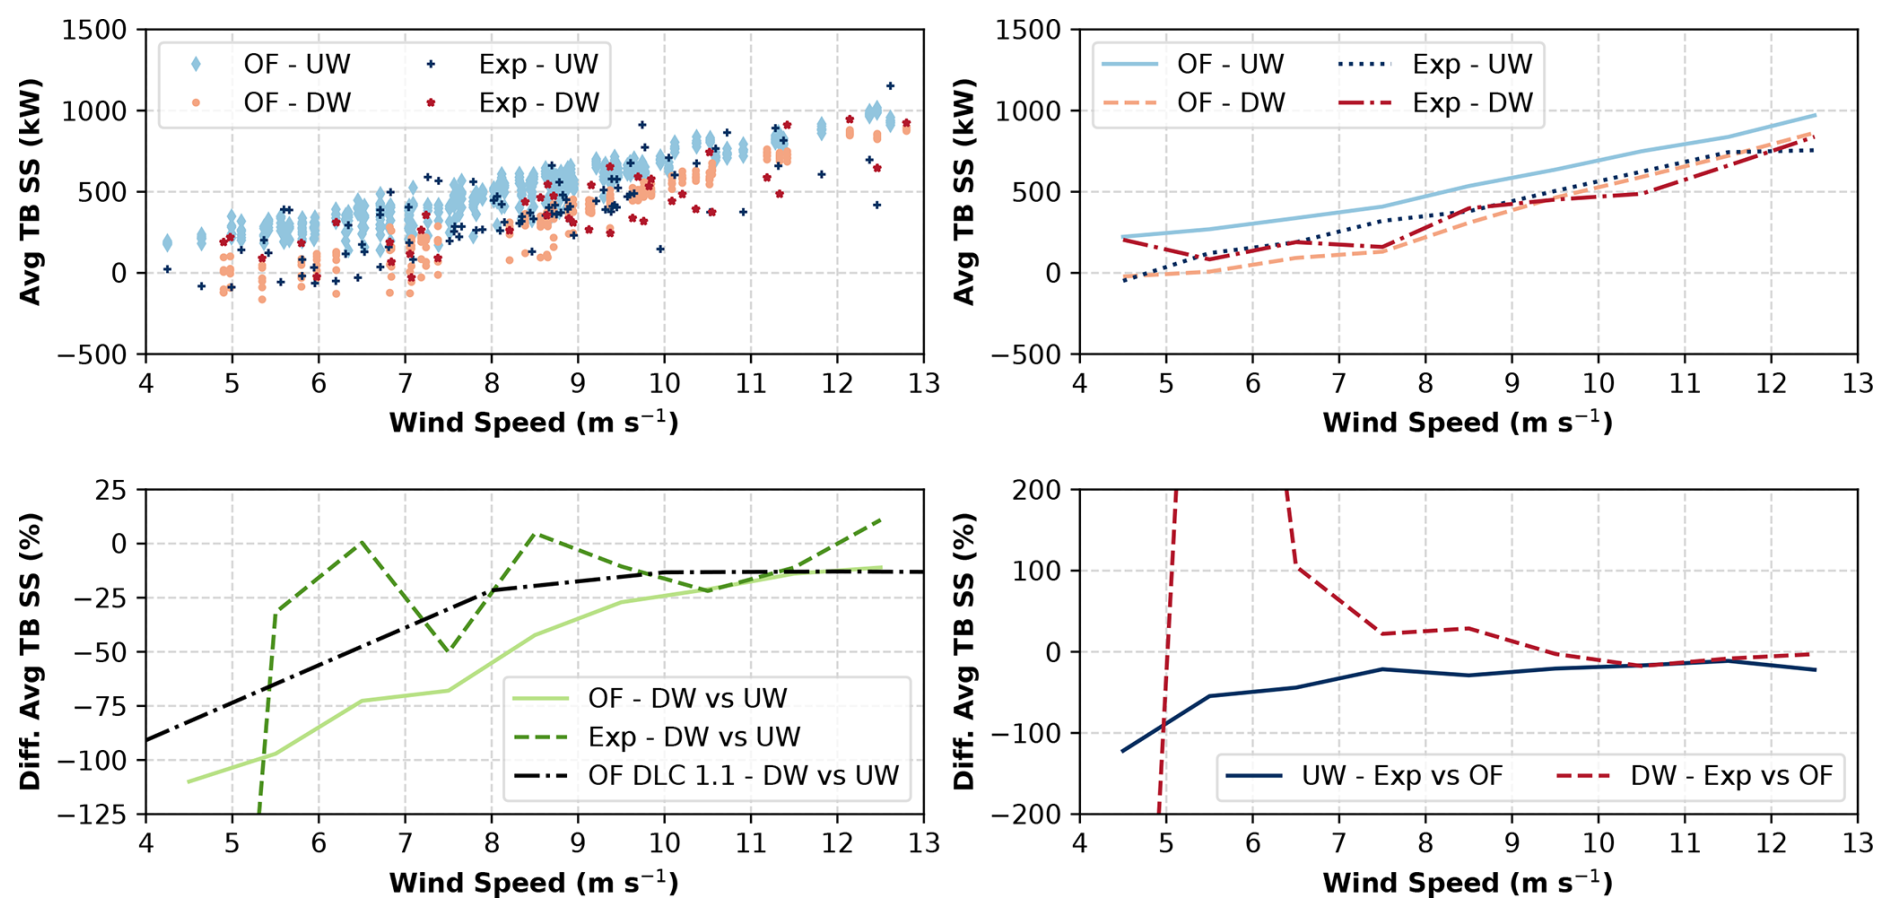
Figure A10Mean tower-base (TB) side-side (SS) moment of the upwind (UW) and downwind (DW) configurations in OpenFAST (OF) and in the field (Exp).

Figure A11DEL of tower-base (TB) side-side (SS) moment of the upwind (UW) and downwind (DW) configurations in OpenFAST (OF) and in the field (Exp).
OpenFAST is publicly available at https://github.com/OpenFAST/openfast, last access: 4 September 2025, but the input files modeling the GE 1.5 MW wind turbine are currently not available in the public domain. The authors are able to share the experimental datasets that were collected during the downwind experiment, both the turbine quantities from the SCADA and the recordings from the acoustic array in the field. If interested, please contact the corresponding author.
A number of photos and videos were collected during the experiment. The media material is available upon reasonable request.
PB led the experiment and the preparation of this paper. LJF conducted the photogrammetry to quantify the alignment of the blade pitch and advised during the FMEA. NH characterized the occurrence of extreme events at the NREL Flatirons Campus. CI led the conversion of the turbine from upwind to downwind, the collection of load data, and the load analysis. MI is the lead technician of the turbine and led all operations on the turbine. JK led the de-risking of the downwind operations on the drivetrain system. SL led the finite element modeling of the main bearing. AH and CW helped with the collection and processing of experimental acoustic data. JR manages the turbine, led the collection and the post-processing of acoustic data, and co-led the conversion and the operation of the turbine from upwind to downwind. DS led the validation of the OpenFAST model and the load analysis. ST helped with all field operations. All co-authors contributed to the paper.
The contact author has declared that none of the authors has any competing interests.
The views expressed in the article do not necessarily represent the views of the DOE or the U.S. Government.
Publisher's note: Copernicus Publications remains neutral with regard to jurisdictional claims made in the text, published maps, institutional affiliations, or any other geographical representation in this paper. While Copernicus Publications makes every effort to include appropriate place names, the final responsibility lies with the authors.
The support of management at the National Renewable Energy Laboratory and at the Wind Energy Technologies Office of the U.S. Department of Energy was critical in the de-risking and execution of such an ambitious experiment. The support of experts at component manufacturers SKF, Winergy, and HYDAC, at GE, and at Gulf Wind Technology was also critical to the success of the experiment. The assistance of Tom Levet and Robin Woodward from Hayes McKenzie was crucial to achieving the amplitude modulation results. The thorough review of Paul Veers greatly improved the final draft of this paper. All these contributions are gratefully acknowledged.
The research was performed using computational resources sponsored by the U.S. Department of Energy's Office of Energy Efficiency and Renewable Energy and located at the National Renewable Energy Laboratory.
This research has been supported by the Wind Energy Technologies Office (grant no. DE- AC36-08GO28308). Funding was provided by the U.S. Department of Energy Office of Energy Efficiency and Renewable Energy Wind Energy Technologies Office.
This paper was edited by Jonathan Whale and reviewed by two anonymous referees.
Amzallag, C., Gerey, J., Robert, J., and Bahuaud, J.: Standardization of the rainflow counting method for fatigue analysis, Int. J. Fatigue, 16, 287–293, https://doi.org/10.1016/0142-1123(94)90343-3, 1994. a
Anderson, B., Branlard, E., Vijayakumar, G., and Johnson, N.: Investigation of the nacelle blockage effect for a downwind turbine, J. Phys. Conf. Ser., 1618, 062062, https://doi.org/10.1088/1742-6596/1618/6/062062, 2020. a
Annoni, J., Scholbrock, A., Churchfield, M., and Fleming, P.: Evaluating tilt for wind plants, in: 2017 American Control Conference (ACC), 717–722, https://doi.org/10.23919/ACC.2017.7963037, 2017. a
Bass, J., Cand, M., Coles, D., Davis, R., Irvine, G., Leventhall, G., Levet, T., Miller, S., Sexton, D., and Shelton, J.: A Method for Rating Amplitude Modulation in Wind Turbine Noise, Tech. rep., Institute of Acoustics (IOA), United Kingdom, https://www.ioa.org.uk/sites/default/files/AMWG%20Final%20Report-09-08-2016_1.pdf (last access: 4 September 2025), 2016. a
Bay, C., Annoni, J., Martínez-Tossas, L. A., Pao, L. Y., and Johnson, K. E.: Flow Control Leveraging Downwind Rotors for Improved Wind Power Plant Operation, in: IEEE American Control Conference, Philadelphia, PA, https://www.nrel.gov/docs/fy19osti/73125.pdf (last access: 4 September 2025), 2019. a, b
Blumendeller, E., Kimmig, I., Huber, G., Rettler, P., and Cheng, P. W.: Investigations on Low Frequency Noises of On-Shore Wind Turbines, Acoustics, 2, 343–365, https://doi.org/10.3390/acoustics2020020, 2020. a
Bolinger, M., Lantz, E., Wiser, R., Hoen, B., Rand, J., and Hammond, R.: Opportunities for and challenges to further reductions in the “specific power” rating of wind turbines installed in the United States, Wind Engineering, 45, 0309524X19901012, https://doi.org/10.1177/0309524X19901012, 2020. a
Bortolotti, P., Kapila, A., and Bottasso, C. L.: Comparison between upwind and downwind designs of a 10 MW wind turbine rotor, Wind Energ. Sci., 4, 115–125, https://doi.org/10.5194/wes-4-115-2019, 2019. a, b
Bortolotti, P., Johnson, N., Abbas, N. J., Anderson, E., Camarena, E., and Paquette, J.: Land-based wind turbines with flexible rail-transportable blades – Part 1: Conceptual design and aeroservoelastic performance, Wind Energ. Sci., 6, 1277–1290, https://doi.org/10.5194/wes-6-1277-2021, 2021. a
Bortolotti, P., Ivanov, H., Johnson, N., Barter, G. E., Veers, P., and Namura, N.: Challenges, opportunities, and a research roadmap for downwind wind turbines, Wind Energ., 25, 354–367, https://doi.org/10.1002/we.2676, 2022. a, b, c
Brown, K., Bortolotti, P., Branlard, E., Chetan, M., Dana, S., deVelder, N., Doubrawa, P., Hamilton, N., Ivanov, H., Jonkman, J., Kelley, C., and Zalkind, D.: One-to-one aeroservoelastic validation of operational loads and performance of a 2.8 MW wind turbine model in OpenFAST, Wind Energ. Sci., 9, 1791–1810, https://doi.org/10.5194/wes-9-1791-2024, 2024. a, b, c, d
Cossu, C.: Replacing wakes with streaks in wind turbine arrays, Wind Energ., 24, 345–356, https://doi.org/10.1002/we.2577, 2021a. a
Cossu, C.: Evaluation of tilt control for wind-turbine arrays in the atmospheric boundary layer, Wind Energ. Sci., 6, 663–675, https://doi.org/10.5194/wes-6-663-2021, 2021b. a, b
Frontin, C., Vijayakumar, G., and Bortolotti, P.: Aerodynamic and production comparison of wind farms with downwind versus conventional upwind turbines, J. Phys. Conf. Ser., 2767, 092008, https://doi.org/10.1088/1742-6596/2767/9/092008, 2024. a, b
Hamilton, N. and Debnath, M. C.: National Wind Technology Center-Characterization of Atmospheric Conditions, National Renewable Energy Laboratory, Technical Report NREL/TP-5000-72091, https://doi.org/10.2172/1558599, 2019. a, b, c
Hamilton, N., Bortolotti, P. E., Jager, D., Guo, Y., Roadman, J. M., and Simley, E.: Aeroacoustic Assessment of Wind Plant Controls, National Renewable Energy Laboratory, Technical Report NREL/TP-5000-79664, https://doi.org/10.2172/1785330, 2021. a, b
International Electrotechnical Commission: IEC 60812 Ed. 2.0 B – Analysis Techniques For System Reliability – Procedure For Failure Mode And Effects Analysis (FMEA), IEC 60812-2, 2006. a
International Electrotechnical Commission: Wind Turbine Generator Systems – Part 13: Measurement of Mechanical Loads, IEC 61400-13, 2015. a, b, c, d
International Electrotechnical Commission: Wind turbines part 11: Acoustic Noise Measurement Techniques, Edition 3.1, IEC 61400-11, 2018. a, b, c, d, e, f
International Electrotechnical Commission: IEC 61400-1 – Wind energy generation systems – Part 1: Design requirements. Edition 4.0, IEC 61400-1, 2019. a, b, c, d, e, f, g, h, i, j, k, l
International Electrotechnical Commission: Wind turbines part 11-2: Acoustic noise measurement techniques – Measurement of wind turbine sound characteristics in receptor position, IEC 61400-11-2, 2024. a, b, c, d
Jonkman, B.: TurbSim user's guide v2. 00.00, Natl. Renew. Energy Lab, https://docs.nrel.gov/docs/fy06osti/39797.pdf, 2014. a
Kaminski, M., Loth, E., Fingersh, L. J., Scholbrock, A., and Selig, M.: Parked aeroelastic field rotor response for a 20 % scaled demonstrator of a 13-MW downwind turbine, Wind Energ., 26, 182–200, https://doi.org/10.1002/we.2794, 2023a. a
Kaminski, M., Simpson, J., Loth, E., Fingersh, L. J., Scholbrock, A., Johnson, N., Johnson, K., Pao, L., and Griffith, T.: Gravo-aeroelastically-scaled demonstrator field tests to represent blade response of a flexible extreme-scale downwind turbine, Renew. Energ., 218, 119217, https://doi.org/10.1016/j.renene.2023.119217, 2023b. a
Kelley, N. D., McKenna, H. E., Hemphill, R. R., Etter, C. L., Garrelts, R. L., and Linn, N. C.: Acoustic noise associated with the MOD-1 wind turbine: its source, impact, and control, Solar Energy Research Institute, https://doi.org/10.2172/5875386, 1985. a
Loth, E., Steele, A., Qin, C., Ichter, B., Selig, M. S., and Moriarty, P.: Downwind pre-aligned rotors for extreme-scale wind turbines, Wind Energ., 20, 1241–1259, https://doi.org/10.1002/we.2092, 2017. a
Madsen, H. A., Bortolotti, P., Barlas, A., Naughton, J., Kelley, C., Brown, K. A., Nikoueeyan, P., Roadman, J., Ivanov, C., Iverson, M., and Thao, S.: Detailed experimental investigation of the aerodynamics and blade/tower interaction of a 1.5 MW wind turbine in a downwind configuration, in preparation, 2025. a, b
Manwell, J., McGowan, J., and Rogers, A.: Wind Energy Explained: Theory, Design and Application, Wiley, ISBN 9780470686287, https://books.google.com/books?id=roaTx_Of0vAC (last access: 4 September 2025), 2010. a
Moriarty, P. J. and Hansen, A. C.: AeroDyn Theory Manual, National Renewable Energy Laboratory, https://doi.org/10.2172/15014831, 2005. a
Nanos, E. M., Letizia, S., Clemente, D. J. B., Wang, C., Rotea, M., Iungo, V. I., and Bottasso, C. L.: Vertical wake deflection for offshore floating wind turbines by differential ballast control, J. Phys. Conf. Ser., 1618, 022047, https://doi.org/10.1088/1742-6596/1618/2/022047, 2020. a
Pao, L. Y., Zalkind, D. S., Griffith, D. T., Chetan, M., Selig, M. S., Ananda, G. K., Bay, C. J., Stehly, T., and Loth, E.: Control co-design of 13 MW downwind two-bladed rotors to achieve 25 % reduction in levelized cost of wind energy, Annu. Rev. Control, 51, 331–343, https://doi.org/10.1016/j.arcontrol.2021.02.001, 2021. a
Powles, S.: The Effects of Tower Shadow on the Dynamics of a Horizontal-Axis Wind Turbine, Wind Eng., 7, 26–42, http://www.jstor.org/stable/43749009 (last access: 4 September 2025), 1983. a
Roadman, J. and Huskey, A.: Acoustic Noise Test Report for the U.S. Department of Energy 1.5-Megawatt Wind Turbine, National Renewable Energy Laboratory, Technical Report NREL/TP-5000-63681, https://doi.org/10.2172/1225903, 2015. a
Santos, R. and van Dam, J.: Mechanical Loads Test Report for the U.S. Department of Energy 1.5-Megawatt Wind Turbine, National Renewable Energy Laboratory, Technical Report NREL/TP-5000-63679, https://doi.org/10.2172/1215119, 2015. a, b
Scott, R., Bossuyt, J., and Cal, R. B.: Characterizing tilt effects on wind plants, J. Renew. Sustain. Ener., 12, 043302, https://doi.org/10.1063/5.0009853, 2020. a
Simley, E., Fleming, P., Girard, N., Alloin, L., Godefroy, E., and Duc, T.: Results from a wake-steering experiment at a commercial wind plant: investigating the wind speed dependence of wake-steering performance, Wind Energ. Sci., 6, 1427–1453, https://doi.org/10.5194/wes-6-1427-2021, 2021. a
UK Institute of Acoustics Amplitude Modulation Working Group: IOA AM code, https://sourceforge.net/projects/ioa-am-code/ (last access: 21 September 2024), 2017. a
Wiser, R., Bolinger, M., Hoen, B., Millstein, D., Rand, J., Barbose, G., Darghouth, N., Gorman, W., Jeong, S., and Paulos, B.: Land-Based Wind Market Report: 2022 Edition, Lawrence Berkeley National Laboratory, https://doi.org/10.2172/1882594, 2022. a
- Abstract
- Copyright statement
- Background
- Test turbine and test site
- Planning and execution of the experiment
- Experimental and numerical data analysis
- Results
- Conclusions
- Appendix A
- Code and data availability
- Video supplement
- Author contributions
- Competing interests
- Disclaimer
- Acknowledgements
- Financial support
- Review statement
- References