the Creative Commons Attribution 4.0 License.
the Creative Commons Attribution 4.0 License.
Identification of operational deflection shapes of a wind turbine gearbox using fiber-optic strain sensors on a serial production end-of-line test bench
Unai Gutierrez Santiago
Aemilius A. W. van Vondelen
Alfredo Fernández Sisón
Henk Polinder
Jan-Willem van Wingerden
Wind energy has witnessed a staggering development race, resulting in higher torque density demands for the drivetrain in general and the gearbox in particular. Accurate knowledge of the input torque and suitable models are essential to ensure reliability, but neither of them is currently available in commercial wind turbines. The present study explores how a subspace identification algorithm can be applied to fiber-optic strain sensors on a four-stage gearbox to obtain operational deflection shapes. An innovative measurement setup with 129 fiber-optic strain sensors has been installed on the outer surface of the ring gears to research the deformations caused by planet gear passage events. Operational deflection shapes have been identified by applying the multivariable output-error state space (MOESP) subspace identification method to strain signals measured on a serial production end-of-line test bench. These operational deflection shapes, driven by periodic excitations, account for almost all the energy in the measured strain signals. Their contribution is controlled by the torque applied to the gearbox. From this contribution, a torque estimate for dynamic operating conditions has been derived. Accurate knowledge of the input torque throughout the entire service life allows for future improvements in assessing the remaining useful life of wind turbine gearboxes.
- Article
(11706 KB) - Full-text XML
-
Supplement
(11024 KB) - BibTeX
- EndNote
The growth of wind energy in the last few decades has been remarkable. The Global Wind Energy Council (GWEC) reported 93.6 GW of new wind energy capacity installed in 2021, 72.5 GW onshore and 21.1 GW offshore, bringing the worldwide cumulative wind power capacity to 837 GW (GWEC, 2023). That is a 3.5 times increase in the last 10 years from a global capacity of 237.7 GW in 2011 and a staggering 35 times increase in 20 years from a total capacity of 23.9 GW in 2001 (IRENA, 2013). The projected market growth for the coming years and decades is even larger. In 2022, the International Renewable Energy Agency (IRENA) and International Energy Agency (IEA) published a road map for the energy sector to become net zero by 2050, with the aim of limiting the rise in global temperatures to 1.5 °C (IEA, 2023). According to this proposal, the annual capacity additions of wind energy should reach 390 GW by 2030, 310 GW onshore and 80 GW offshore. This means increasing the yearly installations more than 4 times compared to the ones recorded in 2021 and more than 5 times compared to the average over the last 3 years (IEA, 2023).
Table 1Average onshore wind turbine power rating, rotor diameter, and hub height.

Power rating, rotor diameter, and hub height data are from Tegen et al. (2012), Stehly et al. (2012), and Stehly and Duffy (2022). Input torque and torque density are estimated by the authors.
To facilitate such rapid growth, the main focus of industry and academia has been lowering the levelized cost of energy (LCoE) from wind (van Kuik et al., 2016). This push to lower the LCoE has resulted in a race from wind turbine manufacturers to increase the rotor diameter, power rating, and hub height of wind turbines. The evolution of size in offshore turbines has been even more dramatic because they have less stringent logistic constraints (Musial et al., 2023). To illustrate the pace of growth, the average values of wind turbines installed during the years 2011, 2016, and 2021 are summarized in Table 1. Power rating, rotor diameter, and hub heights have been provided in the yearly cost of energy reviews (Tegen et al., 2012; Stehly et al., 2012; Stehly and Duffy, 2022). The trend to increase power ratings, rotor diameter, and hub heights can be understood from a wind turbine's fundamental power generation equation (Veers et al., 2019). The power produced by a wind turbine is proportional to the air density, the power coefficient, the cubic exponent of the wind speed, and the area swept by the rotor. Increasing the hub height reduces the influence of surface friction on the wind conditions witnessed by the rotor, allowing wind turbines to operate in higher-quality resource regimes where wind velocities are higher. There are several reasons for the increase in the rotor diameter of wind turbines. Larger rotors capture more energy. The increase in energy captured by the rotor is bigger than the increase in overall turbine costs because blade lengths can be increased while many other costs remain fixed, generally leading to lower LCoE in larger turbines. More powerful turbines allow for fewer turbine installations for a given power plant capacity, lower balance-of-system costs, and fewer moving parts, therefore enhancing the reliability of the wind plant. In addition, increasing the size of the rotor relative to the generator rating allows for lowering the rated wind speed and operating more frequently at full power, resulting in a higher capacity factor.
If we assume a constant blade tip speed, torque will increase with the cube of the rotor diameter. From the yearly average power rating and rotor diameter values provided by Tegen et al. (2012), Stehly et al. (2012), and Stehly and Duffy (2022), we estimated the associated rotor torque using the maximum tip speed figures provided in the yearly reviews, which are 80 m s−1 for onshore turbines and 90 m s−1 for offshore turbines. These torque values have been added to Table 1 and show that the rotor torque of the installed turbines has increased more than 3 times onshore and more than 3.3 times offshore in a time period of just 10 years. This rate of development is unprecedented in any other industry or engineering application, and ensuring turbine reliability remains a top priority (Veers et al., 2023).
Torque is the main sizing factor for the drivetrain and the gearbox. The drivetrain makes a large contribution to the capital expenditure of the turbine and also affects other turbine costs because increasing the tower-top mass has an impact on the main frame, tower, and foundation. The pressure to lower costs and the size constraints due to handling and logistic limitations have translated into higher torque density demands for wind turbine gearboxes. The torque density values in Table 1 have been estimated using equivalent-gearbox models for such power ratings and hub diameters (Gamesa Gearbox, 2023). The increase in torque density witnessed in just a decade is enormous. Thanks to multiple technological innovations, torque densities of 200 Nm kg−1 are now considered state-of-the-art by different gearbox manufacturers (ZF-Wind-Power, 2020; Winergy, 2020; Gamesa Gearbox, 2023). For such high torque ratings and torque density values, a trend has emerged in new gearbox architectures towards more planetary stages and more planets per stage. In wind turbines with a power rating of up to 2 MW, the most widely used gearbox architecture comprises a single planetary stage and two parallel gear stages (Oyague, 2011). In the range from around 2 to 6 MW, gearboxes with two planetary stages and a single parallel stage have become mainstream. For higher power ratings, gearboxes with three planetary stages are expected to become dominant. Due to the large number of planets in the input stages and the limitations in outer diameter, the space available for planet bearings has decreased to a point where journal bearings have to be adopted because there is not enough space for roller element bearings (Nejad et al., 2022).
Overall, gearbox complexity is increasing in the pursuit of lighter designs, while maintaining gearbox reliability is mandatory to ensure low operational expenses. Two key factors are essential to achieve successful designs. On the one hand, accurate knowledge of the loading conditions throughout the complete service life of the gearbox is crucial. On the other, accurate models are required to predict its performance and maintenance requirements. Unfortunately, sensors that provide detailed load measurements of the turbine during commercial operation are not generally available (Dykes et al., 2019). It is possible to estimate the input gearbox torque from the electric currents in the generator, but normally, this information is only available through supervisory control and data acquisition (SCADA), and it cannot capture the torque fluctuations caused by the dynamic wind turbine operation, especially in damaging events like emergency brake events (Egeling et al., 2018). Even in normal operation, relatively large errors are expected when using generator currents because the power losses in the generator and the gearbox vary with torque and other operating conditions and are generally unknown.
As a consequence, a direct measurement of the actual torque is needed. The traditional method to measure torque, based on strain gauges on the rotating shaft, is considered impractical for commercial wind turbines due to the expensive nature of the equipment required and is not suitable for long-term applications (Perišić et al., 2015). The need for novel sensing technologies and measurement techniques that facilitate a fleet-wide implementation of torque measurements has resulted in great research interest. Zhang et al. (2018) explored alternative direct measuring techniques and discussed the associated technical and economic difficulties. An alternative direct measurement method, based on deformation measurements on the outer surface of the first-stage ring gear of the gearbox, was proposed by the authors of this work (Gutierrez Santiago et al., 2022). Other researchers have focused on indirect techniques or so-called virtual sensors where a model of the system is combined with data from sensors in other locations of the turbine to obtain estimated data of the input torque (Perišić et al., 2015; Azzam et al., 2021; Cappelle et al., 2021; Mehlan et al., 2023; Mora et al., 2023). These virtual sensing approaches require accurate wind turbine and drivetrain models, but the complexity of current designs exceeds modeling capabilities (Veers et al., 2023). Costly experimental evaluation is needed to achieve the desired degree of confidence (Bucher and Ewins, 2001). Data-driven modeling techniques, also referred to as system identification in the systems and controls community, provide a framework to estimate models of dynamical systems when the accuracy of physical models derived from first principles is unsatisfactory. System identification is well-established in mechanical structures (Al-Khazali and Askari, 2012), where it is more widely referred to as experimental modal analysis (EMA). EMA relies on measuring a controlled applied force, either with an instrumented impact tool or with a shaker, to identify frequency response functions and modal parameters from the system response. However, in the case of large structures, it is difficult to excite the system with enough energy to produce measurable outputs. Operational modal analysis (OMA) is an alternative output-only approach that overcomes the difficulty of exciting the system by relying on ambient broadband excitation. There is a trend to replace EMA with OMA because in OMA the excitation and boundary conditions of the system are those seen in operation and are deemed more representative of the structure's real use in service (Hermans and van der Auweraer, 1999). In the specific case of rotating machinery like wind turbine gearboxes, several factors impede using OMA (Ozbek et al., 2013). Most notably, the input excitation is unknown and may not adequately excite all modes of interest (Thibault et al., 2012), and the premise of having a white noise excitation in the frequency range of interest is violated because periodical loads due to rotating elements act on the system and typically dominate the system response (Di Lorenzo et al., 2017). Research interest in overcoming these difficulties has increased recently, and many different algorithms have been proposed. The main algorithms used for wind turbines were reviewed by van Vondelen et al. (2022) and classified using nine suitability criteria. These criteria included the accuracy of the algorithms, the ability to distinguish closely spaced modes, computational complexity, and the ability to handle periodic stationary and non-stationary excitation or harmonics. When structural modes and harmonics are widely separated and when the rotor speed is constant over time, harmonics are identified by the OMA algorithms as artificial modes with zero damping.
The main contributions of this paper are as follows:
-
We develop and describe a novel measurement setup for a wind turbine gearbox comprising 129 fiber-optic strain sensors installed and distributed around the ring gears of the three planetary stages, and we present the results of measurements performed in a serial end-of-line test bench.
-
We apply the multivariable output-error state space (MOESP) method to identify the periodic modes, referred to as operational deflection shapes, which has enabled quantifying the unknown periodic excitations and has been found to provide an estimation of the input torque of the gearbox.
Accurate knowledge of the input torque throughout the entire service life is paramount to assessing the consumed fatigue life of the gearbox, and tracking operational deflection shapes recursively over time can potentially be used as an indicator of fault detection. The remainder of the paper is structured as follows. In Sect. 2, the chosen identification framework is motivated, and the key definitions and formulation are provided. In Sect. 3, we describe the measurement setup and the test wind turbine gearbox together with the experimental conditions. In Sect. 4, the key findings of using subspace identification on strain signals are described, and, finally, Sec. 5 presents the main conclusions of this work, and recommendations are given for future work.
This section describes the theoretical formulation used to identify operational deflection shapes from strain data collected by fiber-optic sensors. Starting from the state space representation used, we justify how the periodic inputs can be modeled within the system matrix, leading to a stochastic identification problem. Once the system matrices describing the dynamic behavior have been estimated, up to a similarity transformation, we show how the state and output measurements can be reconstructed using a Kalman filter.
We assume that the system to be identified is a finite-dimensional, linear, time-invariant system, subject to measurement and process noise, which has been sampled at t=τk, where τ is the time step and k is an integer, with a general discrete-time state space representation given by
where xk∈ℝn, , wk∈ℝn, , and are the state, input signal, process noise, output signal, and measurement noise, respectively (Verhaegen and Verdult, 2007). The assumption of a linear time-invariant system is considered valid when the gearbox operates close to rated torque conditions. Under these operating conditions, contact patterns in the gear flanks are fully developed, and non-linear effects like backlash or material properties related to the torque reaction arm elastomers are not expected to play a role. The matrices , , , and are the system, control, sensor, and output matrices, respectively. The system dimension or order of the system is n, and the dimension of the output vector yk is the number of measured response signals ny.
Operational modal analysis relies on ambient broadband excitation and assumes this excitation is random white noise in the frequency range of interest. In this case, no deterministic input is considered (i.e., uk=0), which leads to the so-called stochastic realization problem. In wind turbine gearboxes, and rotating machinery in general, this premise is severely violated because the periodic action of shafts and gears dominates the system response. Greś et al. (2021) showed that it is possible to extend the stochastic realization to OMA under (unknown) periodic excitations by modeling the effect of a deterministic periodic force as a sum of a finite number of h sinusoidal frequency components such that u(t) has the following shape:
where ai, ωi, and ϕi∈ℝ are the unknown amplitude, frequency, and phase of the ith periodic input component. These components can become part of a combined state vector to eliminate the periodic input component from Eqs. (1) and (2). The following periodic state vector can be defined:
which enables the state space model in Eqs. (1) and (2) to be rewritten as a combined state space model without the periodic input u(t) as
The matrices A and C are the original system or structural matrices, and the matrices Aper and Cper correspond to the periodic unknown inputs. The matrix AB is a mapping from the periodic states at time index k into the system or structural states at time index k+1. Due to the upper-right block structure of the state matrix, the eigenvalues of the combined system are the combined set of eigenvalues of Asys and Aper. While the eigenvectors of the combined state matrix regarding the structural part become , the resulting mode shapes are Ψi. For a full derivation, interested readers are referred to Greś et al. (2021). This approach has been successfully applied to an operational offshore wind turbine and has been shown to provide accurate estimates of the first three tower bending modes (van Vondelen et al., 2023). The unknown periodic excitations in Eqs. (1) and (2) can become part of a combined state vector, yielding an equivalent state space realization shown in Eqs. (5) and (6) without the periodic input u(t). The extended system matrix can be defined as
Assuming the system admits an innovation state space representation (Verhaegen and Verdult, 2007), we can rewrite Eqs. (5) and (6) as
where the innovation signal ek is assumed to be an ergodic white noise sequence, and the matrix is the Kalman gain.
This extended system matrix is composed of A, the original or structural system matrix. It combines the periodic and structural modes, which, due to the upper-right block structure, can be distinguished because the eigenvalues of the periodic part correspond to undamped modes on the unit circle. The objective of system identification is to estimate the matrices and , up to a similarity transformation, using only the output measurement yk. For the present study, the multivariable output-error state space (MOESP) subspace method was chosen because it has been shown to provide asymptotically unbiased estimates of model parameters as long as the system input has adequate persistency of excitation (Verhaegen and Dewilde, 1992) and the RQ factorization enables a computationally efficient implementation. Furthermore, using instrumental variables, it is possible to deal with process and measurement noise. A full description and proofs of the algorithm are given in Verhaegen and Verdult (2007), and the implementation shown in this paper was accomplished using the LTI System Identification Toolbox for MATLAB® (Houtzager, 2012). The user must define three key parameters when realizing the MOESP algorithm:
-
N – the number of samples for each of the signals;
-
s – the number of block rows, used to construct the Hankel matrices;
-
n – the model order.
The matrices and are the estimates, up to a similarity transformation of and . That is, has the same eigenvalues as the matrix , and the system (, has the same input–output behavior as the original system (, ). These linear transformations are given by , , and with . The transformed state is such that . With a suitable transformation matrix, it is possible to transform the system (AT, CT) into the so-called modal form with a diagonal state-transition form or combine complex-conjugate pole pairs to form a real “block-diagonal” system in which has two-by-two real matrices along its diagonal. The dynamics of the system are completely characterized by the eigenvalues (poles) and the observed parts of the eigenvectors (mode shapes) of the matrix. The eigenvalue decomposition of is given by
For oscillatory systems, the λi values are complex. The pole locations govern the system response. Poles inside the unit circle, , give stable and convergent responses and are also called damped modes. Poles outside the unit circle, , have unstable responses. When a pole is on the unit circle, , the system exhibits a sustained oscillation (lossless), referred to as undamped. In this case, the state variable xi oscillates sinusoidally at some frequency ωi, where .
The observed part of the ith system eigenvector {ϕi} is the mode shape {Ψi} at the sensor locations given by
Both the state and the output measurements can be reconstructed using the so-called one-step-ahead predictor using the identified system and output matrices in modal form () and the transformed Kalman filter ():
where is the predicted state at time index k+1, and denotes the predicted measurement vector for time index k.
As a means of cross-validation, different datasets were used for identification and validation. As a quality measure, we used the variance accounted for (VAF), which gives a measure of how well the linear model predicts the variability of the output signal. The VAF is defined for each individual sensor signal and is expressed as
where is the output predicted by the identified model for the sth sensor, ys is the actual measurement for the sth sensor, and Var denotes the variance.
This section describes the experimental setup used for the present study. First, the main characteristics of the gearbox used for identification are described. Then, details of the fiber-optic strain sensors used and their location on the outer surface of the ring gears are shown. Lastly, the test bench used and the specifications of the tests performed for identification and validation are presented.
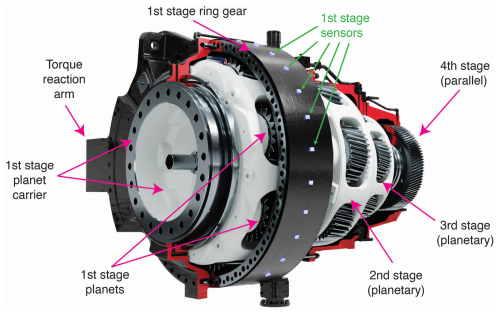
Figure 1A 3D representation of the tested gearbox with fiber-optic strain sensors on the outer surface of the first-stage ring gear. Adapted from Gamesa Gearbox (https://www.gamesagearbox.com/wind-technology/, last access: 23 January 2024).
3.1 Gearbox description
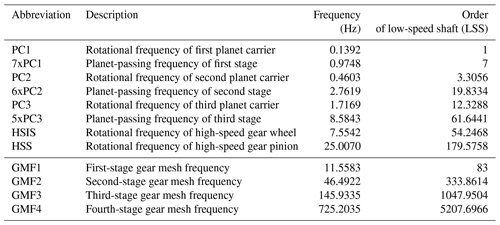
The wind turbine gearbox used for the present study is a four-stage gearbox manufactured by Gamesa Gearbox with a reference torque of 8 MNm. It is considered a suitable example of the gearbox architecture expected to dominate high-end power ratings; see Sect. 1. The gearbox has a configuration comprised of three planetary stages followed by a parallel helical gear stage. The four stages together provide a total gear ratio of 179.576. Figure 1 shows the arrangement of all the stages in the gearbox with the rotor on the left side of the picture. For clarity, only the first-stage ring gear has been fully drawn. The first input stage is a planetary stage with seven planets and has a ring gear with an outer diameter of 2107 mm. The first-stage sun is connected with a spline to the second-stage planet carrier that contains six planets. The outer diameter of the second-stage ring gear is 1790 mm. The third stage has five planets and a ring gear with an outer diameter of 1428 mm. The total weight of the gearbox is approximately 38 950 kg, which yields a torque density of 205 Nm kg−1. The planets from the first and second stage are supported by journal bearings instead of roller element bearings due to the space constraints created by the very large number of planets. The known excitation frequencies can be computed using the rotational speed and the number of teeth of the gears. The rotational frequencies of the planet carriers, the planet-passing frequencies of each stage, and the gear mesh frequencies are summarized in Table 2. These frequencies correspond to the nominal speed of 8.35 rpm in the first-stage planet carrier, which is the low-speed or input shaft.
3.2 Fiber-optic strain sensors
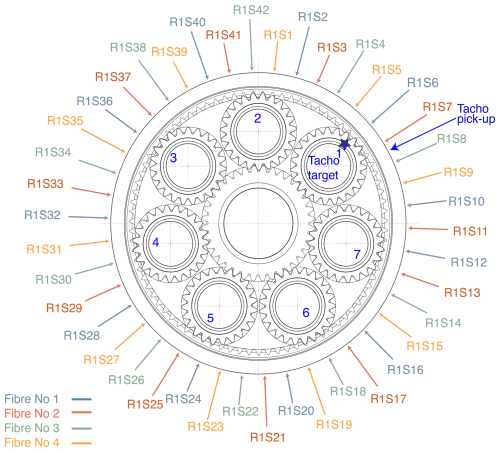
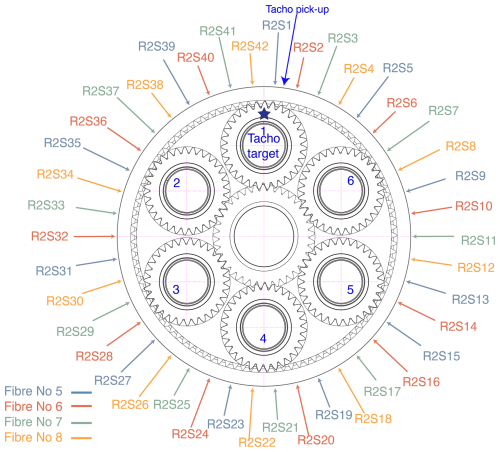
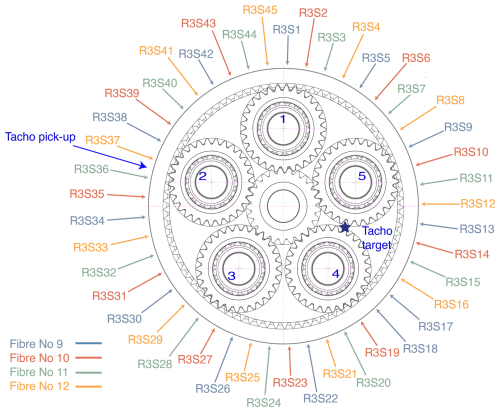
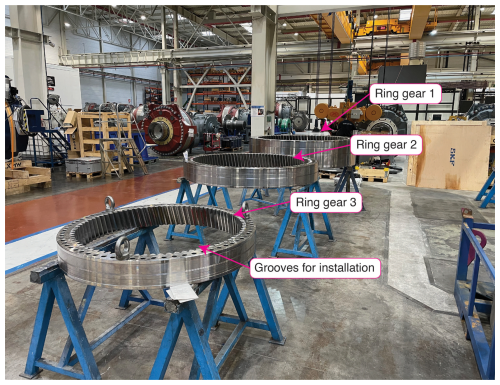
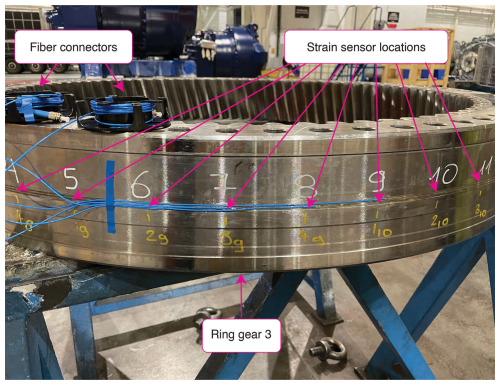
Three arrays of fiber-optic strain sensors based on fiber Bragg gratings (FBGs) were wrapped around the planetary stage ring gears. The sensor placement was designed taking into account the insights gained in Gutierrez Santiago et al. (2022), which demonstrated that because the rims are relatively thin, significant strains can be measured on the outer surface of the ring gears. In total, 12 optical fibers were installed on the test gearbox, four on each ring gear. A number of grooves were machined on the external diameter of the ring gears, in the middle section across the width of the gear between the rotor and generator side faces, to facilitate the installation process and protect the sensors during assembly and testing. Machining the grooves by turning provided a smooth finish that guaranteed an adequate bonding between the fiber and the ring gear. Figure 2 shows the detailed location of the 42 strain sensors distributed on the outer perimeter of the first-stage ring gear. The number of sensors was defined as a multiple of the planets, equally spaced around the perimeter, to ensure that the mesh events caused by the seven planets could be detected synchronously by the strain sensors. The labels of the strain sensors have been color-coded to represent the fiber in which the FBG was accommodated. The spacing between FBGs within each fiber was designed so that all fibers cover the complete perimeter of the ring. This was done to prevent losing a portion of the ring gear in case of damage to a fiber. However, all the fibers survived the complete measurement campaign satisfactorily, including assembly and disassembly operations. Sensor placement on the second- and third-stage ring gears is shown in Figs. 3 and 4, respectively. The fiber optical sensors were supplied and installed by the company Sensing360 B.V. (sensing360.com, 2021). Figure 5 shows the three ring gears used for the present work before installing the sensors, and Fig. 6 gives a detailed view of the sensor placement on the third ring gear together with the fiber routing and connectors. For a detailed description of the measurement principle and properties of fiber-optic strain sensors based on FBGs, the interested reader is referred to previous work by Gutierrez Santiago et al. (2022).
In each of the planetary stages, in addition to the fiber-optic strain sensors, inductive displacement sensors were installed to provide a pulse once per revolution of the planet carrier. The purpose of these sensors was to know the planet carrier's relative position to the strain sensors to identify which planet is responsible for the strain peaks observed in the strain signals. The relative positions of the target and the inductive sensor or pick-up are shown in Figs. 2 to 4. During the experiments, torque measurements from torque transducers installed in the high-speed shaft couplings of the test bench were logged synchronously with the fiber-optic strain data and the tachometer signals of all three stages.
3.3 Test specification
The tests presented in this study were performed on an end-of-line test bench at the assembly factory of Gamesa Gearbox (Siemens Gamesa Renewable Energy) in Lerma, Spain. The standard (IEC 61400-4, 2012) sets the design requirements for wind turbine gearboxes and establishes a mandatory requirement to perform a loaded end-of-line test for all gearbox units before their installation in a wind turbine. This test is also referred to as the run-in or gearbox conditioning test. The purpose is twofold: on the one hand, it serves as a conditioning test for bearings and gears because the gearbox is loaded progressively up to nominal torque; on the other, it provides a means for quality control. Typically, gearbox manufacturers employ a back-to-back arrangement for end-of-line testing where two gearboxes are connected through the low-speed shaft (LSS). Figure 7 shows the layout of the back-to-back arrangement used for the experiments with the test gearbox, presented in Sect. 3.1, on the left side. An electric motor provides the driving motion to the high-speed shaft (HSS) of one gearbox, and the other motor acts as a generator, providing the braking torque at the HSS of the second gearbox. The rated power of the test bench electric motors is 11.5 MW, which enabled testing the gearbox above its nominal torque. Although the test bench is designed to recreate the working conditions of the gearbox as close as possible to the wind turbine, in back-to-back test benches, torque is the only controlled input load excitation, and they generally do not have the capacity to apply bending moments to the gearbox. The mechanical interfaces at the LSS and HSS of the gearbox are different from the wind turbine, and it is not possible to reproduce the rotor inertia in the test bench. Despite these differences, we consider the back-to-back test bench results representative of the behavior of the gearbox in a wind turbine, in particular taking into account that these gearboxes are designed for operation in wind turbine drivetrains with a four-point mount suspension.
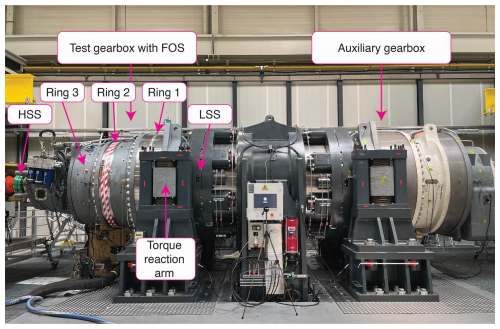
Figure 7Test gearbox on the left side of the back-to-back test bench used for end-of-line testing of wind turbine gearboxes with a maximum power capacity of 11.5 MW.
The instrumented gearbox completed a standard end-of-line test, composed of six stationary load stages under nominal speed. Once stable thermal conditions had been reached, signals from the fiber-optic strain sensors were logged at each of the run-in load stages to perform system identification. After the run-in, several design validation tests were performed, and these tests were used to collect more strain data to evaluate the state and output estimation procedures. In particular, a test to validate the structural models of the gearbox, comprised of 22 stationary torque conditions from 5 % to 110 % of its nominal value, was used to evaluate the effect of torque on the identified operational deflection shapes. Finally, different tests with dynamically changing torques were performed to quantify the contribution of the identified deflection shapes in a dynamic manner.
This section describes the key findings obtained when performing system identification on the strain signals logged during experiments performed on a serial production end-of-line test bench.
4.1 Identification using signals from all stages
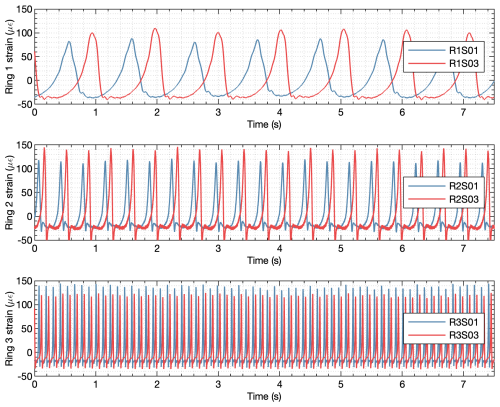
The system identification framework presented in Sect. 2 was initially applied to all available signals from the three ring gears together. Figure 8 shows a time trace of two strain sensors from each stage during a test performed with rated stationary speed and torque conditions. As can be seen, each stage has a different rotational speed, and the time interval between strain peaks corresponds to the planet-passing frequencies defined in Table 2. Within each stage, the strain signals of two sensors are shown in Fig. 8. The deformation peaks caused by the mesh forces as the planets pass close to the measurement points on the ring gears occur at different times because the sensors are at different angular positions. For clarity, only two sensors from each ring gear have been plotted in Fig. 8, but there are 42 strain signals available in the first stage, 42 in the second stage, and 45 in the third stage. The location of all sensors are shown in Figs. 2–4.
Several data preprocessing steps were performed on the raw signals logged by the optical interrogators. First, the sampling frequency was downsampled for a more efficient numerical implementation. Generally, the sampling rate should be up to about 10 times the bandwidth of interest to avoid the effects of aliasing and, simultaneously, limit the amount of high-frequency noise that contaminates the measurements (Verhaegen and Verdult, 2007). The optical interrogators used to acquire the signals during testing provided a sampling frequency of 2000 Hz in the first stage and 2500 Hz in the second and third stages. Considering the known excitation frequencies present during gearbox operation (see Table 2), different downsampled frequencies from 45 to 250 Hz were tested. The difference between resampling, interpolation, and decimation on the identified parameters was found to be negligible. Therefore, resampling with an embedded anti-aliasing filter was chosen as the downsampling method. Measurements used for identification were logged once the gearbox had reached thermal stability. Thus, the influence of temperature variations on the FOS signals was minimized. Nevertheless, a detrending step was added to ensure that the signals fed to the identification algorithm only resulted from the strain caused by the planet gear passage events. All signals were normalized using their standard deviation to have unit variance. As a last preprocessing step, a hamming window was applied to the training data sequences because it was found to reduce the variance of the identified models.
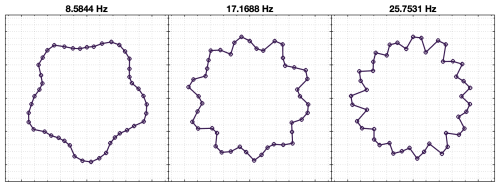
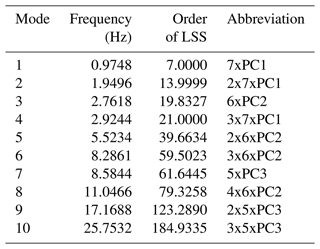
As described in Sect. 2, from sequences of discrete-time data samples of the measured signals, three parameters need to be defined to execute the MOESP algorithm. These parameters are the number of samples, N; the number of block rows, s; and the system order, n. Using fiber-optic strain signals from the total of 129 sensors (42 from the first stage, 42 from the second, and 45 from the third), different options for N, s, and n were explored. The integer s should be chosen to be about 2–3 times the maximum expected model order (Verhaegen and Verdult, 2007). The experiment duration, number of samples N, should usually be at least about 10 times the length of the slowest time constant of the system to ensure that the low-frequency behavior of the process is captured. Therefore, a trade-off between sample frequency and measurement duration must be made that is dictated by storage and/or processing limitations regarding the number of data points. After exploring different downsampled frequencies between 45 and 250 Hz, a frequency of 62.5Hz was selected. This selection was based on identified frequencies and the signal reconstructions obtained using the one-step-ahead predictor, Eq. (13). Figure 9 shows the discrete-time representation of the pole locations of the identified models using N=17 500 samples per signal, s=64 block rows, and n=20, a model order equivalent to 10 oscillatory modes. All identified poles are on the unit circle, which is expected from the periodic behavior. The corresponding frequencies associated with the identified poles are shown in Table 3. All identified frequencies match with known excitation frequencies. A description of the abbreviations used to name the frequencies can be found in Table 2. The term operational deflection shapes (ODSs) has been chosen for the observed part of the identified eigenvectors because they are caused by periodic excitations and not a structural property of the gearbox. These deflection shapes identified when using all strain signals together only influence one ring gear at a time. To illustrate this, the three mode shapes related to the planet-passing frequencies of each stage are shown in Fig. 10. For example, in the case of the mode associated with the planet passing of the first stage, with an identified frequency of 0.9750 Hz, the deformations of this mode shape in the second and third stages are negligible. This means there is very little cross-stage excitation, which is positive and one of the design objectives. Considering these results, it was decided to apply the identification algorithm on strain data from each stage individually.
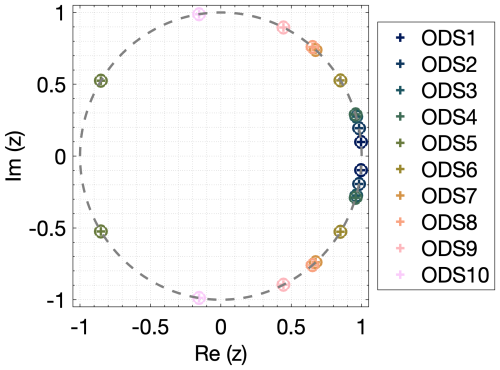
Figure 9Pole locations (eigenvalues) of the identified model using measurement signals from all three stages in a discrete-time representation (N=17 500, s=64, n=20).
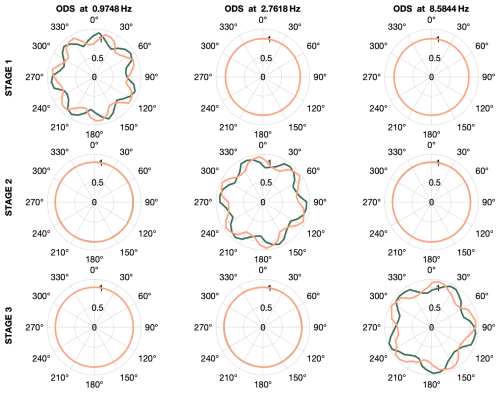
Figure 10Identified operation deflection shapes using measurement signals from all three stages. Each shape is defined by two conjugate vectors with a size equal to the number of sensors; the real part is shown in green, and the imaginary part is shown in orange.
Table 3Identified frequencies using signals from all three stages; a description of the abbreviations can be found in Table 2.
4.2 Identification using signals from the first planetary stage
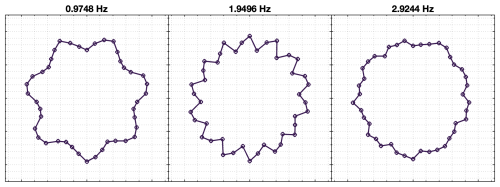
Using data from the same test, with rated torque and speed conditions shown in Fig. 8, the system identification procedure was repeated with the strain signals from the first-stage ring gear only. The same preprocessing steps detailed in Sect. 4.1 were applied, and 10 different downsampled frequencies (45.45, 50.00, 55.55, 62.50, 71.43, 83.33, 100.00, 125.00, 166.67, and 250.00 Hz) were tested to explore the effect of resampling on the identified models using a baseline setting of s=32 block rows and n=20 model orders. The number of samples was chosen to cover the same training time, defined as 256 s, in all sampling frequencies. The different identified models were evaluated based on their identified frequencies (eigenvalues) and how well newly measured data from validation tests could be reconstructed using the identified operational deflection shapes. As in the case of all stages, the difference between identified frequencies using different sampling frequencies was found to be small. Again, all identified poles were on top of the unit circle, corresponding to undamped modes. To evaluate the accuracy of the reconstructed outputs, data for validation were acquired using the same experimental conditions as for training the models: applying stationary rated torque and speed and waiting for temperatures across the gearbox to stabilize. With the identified system matrices, the system's state and output signals can be reconstructed using Eq. (12). The Kalman filter was not considered for model validation because the intention is to evaluate how the identified system matrices represent the measured signals. In this case, the system's behavior is modeled as an autonomous system oscillating from a non-zero initial condition which can be derived from Eq. (13). As the identified damping coefficients are close to zero, the modules of the state show little variation throughout the duration of the validation datasets. Figure 12 shows a comparison of the measured signal from sensor R1S01 (first sensor of first-stage ring gear) against the reconstructed output using identified models with three different sampling frequencies. Very high variance accounted for (VAF) values were obtained with the reconstructed outputs. The highest average VAF was 99.68 % obtained for a sampling frequency of 62.5 Hz, and the lowest value was 98.40 % for the case of 250 Hz. For this reason, 62.5 Hz was used as a sampling frequency to search for suitable s and n parameters. Table 4 shows the average VAFs obtained for different combinations of s block rows and n model orders. The VAF value presented is the average of the 42 sensors. Increasing the model order and the number of block rows improved the fit between the reconstructed and measured signals; an average VAF value of 99.00 % was already achieved with s=32 and n=10. This VAF could be increased up to 99.90 % when further increasing s and n to s=128 and n=32. As with other practical applications of system identification (Hermans and van der Auweraer, 1999), we did not observe a big gap in VAFs from one model order to the next. Table 5 shows the frequencies of the 10 deflection shapes identified using s=128 and n=20. Up to n=18, all the deflection shapes correspond to multiples of the planet-passing frequency (7 times the carrier rotational frequency), and for larger model orders, the planet carrier rotational frequency is also identified. Figure 11 shows the deflection shapes associated with the planet-passing frequency and the first two integer multiples or harmonics. Due to the given spatial resolution (42 sensors around the ring gear), it is not possible to represent higher-frequency mode shapes accurately as they provoke a spatial aliasing effect. This, however, does not affect the output reconstruction of individual sensors as long as the sampling frequency is high enough for the identified modes.
Table 5Identified frequency measurement signals from the first stage using s=128 and n=20 (10 modes).
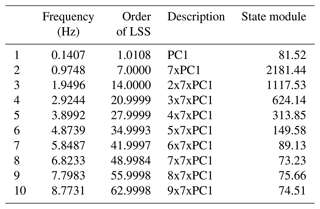
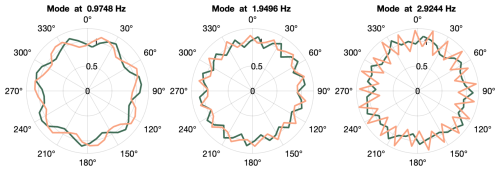
Figure 11Deflection shapes from the first three harmonics of the planet-passing frequency using measurement signals from the first stage. Each shape is defined by two conjugate vectors; the real part is shown in green, and the imaginary part is shown in orange.
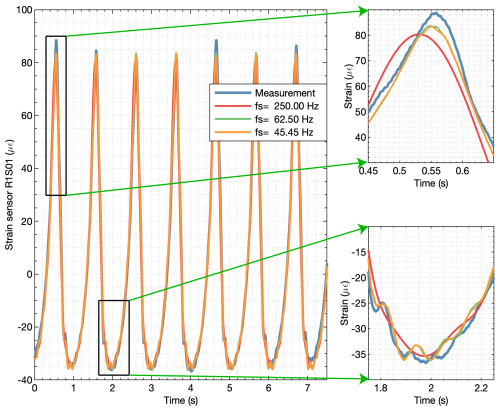
Figure 12Output reconstruction of strain signal R1S01 using models identified with different sampling frequencies.
The reconstructed output signals shown in Fig. 12 were computed using the system matrices only, finding the initial state conditions, and assuming the system behaves like an autonomous system. We can improve the state estimation using Eq. (13) with the Kalman filter. This allows for the analysis of strain measurements from tests with variable torque. The states associated with each mode shape convey the contribution of each mode to the measured strain signals. For the validation test performed using stationary rated torque and speed, the average modulus values of the states associated with the operational deflection shapes are shown in Table 5. The system matrix was transformed into diagonal form, with the eigenvalues in the diagonal. As described in Sect. 2, these eigenvalues are complex numbers, and for oscillatory systems they come in conjugate pairs. Therefore, two states, which are also conjugate imaginary numbers, are associated with a pair of eigenvalues. From these values, we can infer that the contribution of the first deflection shape, which is related to the rotation of the planet carrier, is relatively small. The second deflection shape, created by the passing of the planets at 7 times the planet carrier frequency, is the most dominant mode shape, and its higher harmonics have a descending contribution.
4.3 Effect of torque on identified models and state variables
Once a model has been identified using suitable training data, that is, the operational deflection shapes and their frequencies have been found, the associated states can be computed using the one-step-ahead predictor, Eq. (12). When the state variables are computed for tests with stationary torque conditions, the modulus of the state remains almost constant and only exhibits small changes. These small changes are also evident in the test bench torque signals and in the peak values of the fiber-optic strain signals; see Fig. 8. In Fig. 13, a depiction of the strains reconstructed using only the first three operational deflection shapes associated with the passing of the planets is shown. To evaluate the effect of torque on the identified deflection shapes, a test comprised of 22 stationary torque conditions from 5 % to 110 % of its nominal value was performed. This test was originally intended to validate the structural models of the gearbox. Once stability in torque and speed was reached, data were recorded for 240 s for each torque condition. Torque data from two test bench torque sensors installed in the high-speed shafts (HSSs) were logged synchronously with the fiber-optic strain data. From these two sensors, the torque at the low-speed shaft (LSS) was estimated as the average value of both high-speed shafts multiplied by the gear ratio. This assumes that the gear losses are equal in both gearboxes, which is not exactly true because the two gearboxes tested were not identical, and the torque level in the gearbox acting as a reducer is slightly higher, but it is considered a good approximation to evaluate the effect of torque.
The 22 data recordings at different torques were used to identify operational deflection shapes. Figure 14 shows the deflection shapes of the mode corresponding to the planet-passing frequency of the first stage (7 times the rotational frequency of the carrier) from 55 % to 100 % of the nominal torque. When the system matrix is transformed into a diagonal form, as described in Sect. 2, each mode {ϕi} comes in conjugate pairs of imaginary numbers. For clarity, only the real component of the mode shape is shown in a linear format, and the magnitudes have been normalized using the norm of the deflection shape at nominal torque. The shapes are very similar, with only very slight differences observed when the torque drops below 65 % of nominal torque. The gearbox is designed to operate in near-rated torque conditions where the gear microgeometry has been optimized.
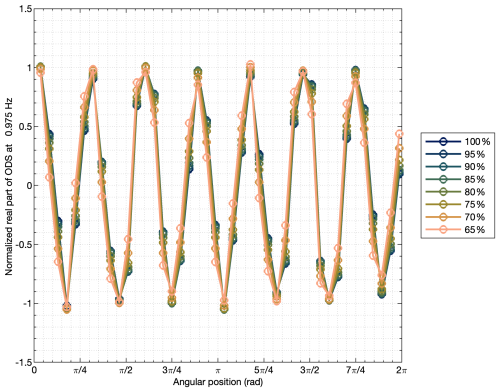
Figure 14Operational deflection shapes (real part) using datasets at different torque levels for identification.
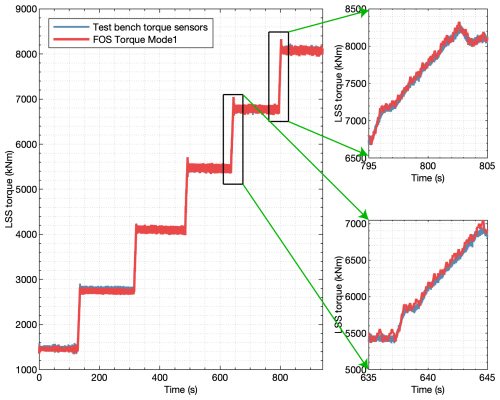
This observation led to evaluating the relationship between the contribution of mode shapes identified at nominal torque conditions for the 22 load stages. Using the identified ODSs at nominal torque, the corresponding states were computed for the data recordings at different torques. When using the diagonal form, the state variables are also conjugate imaginary numbers. The moduli or absolute values of the state variables for each test against torque are shown in Fig. 15. The modulus or absolute value of the states associated with the first deflection shape does not exhibit any relationship with torque. However, all the states associated with the planet-passing frequency and its harmonics show a very strong relationship with torque. A polynomial fit was computed between the module of the state and torque, which can be used to estimate torque from a known state value. To demonstrate this, we performed a test with six torque levels. In Fig. 16, the torque estimation from the test bench torque sensors is compared to the torque estimation using the state variable associated with the planet passing of the first stage. As can be seen, the torque estimate using the planet-passing mode closely follows the behavior of the torque estimate from the test bench torque sensors with a similar pattern. As mentioned before, the torque sensors are placed in the HSS of both gearboxes in the back-to-back arrangement, and a comparison with a direct measurement in the input LSS is suggested to further evaluate the accuracy of the new estimation method.
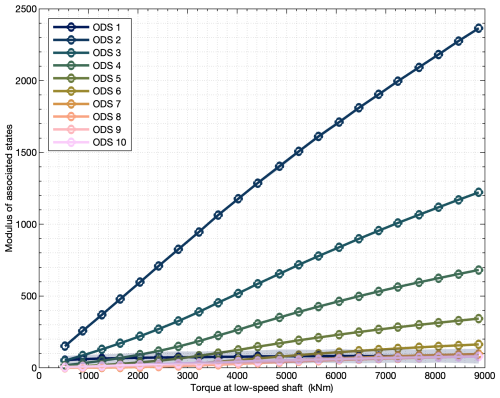
Figure 15Average moduli of states associated with each ODS against a low-speed shaft torque (from test bench sensors).
This article presents a novel measurement setup of 129 fiber-optic strain sensors distributed around the three ring gears of a modern wind turbine gearbox. The subspace identification multivariable output-error state space (MOESP) method has been applied to experiments performed on a serial production end-of-line test bench and has been found to provide consistent estimates. Using signals from tests with stationary torque and speed conditions, all identified eigenvalues and eigenvectors correspond to periodic excitations related to shaft rotations, planet passing, and gear mesh frequencies. When performing system identification on data from all three stages, the identified deflection shapes have been found to cover only one stage at a time. Therefore, no cross-excitation between stages was observed, which is in line with one of the design intents to minimize cross-stage interactions. Therefore, it can be concluded that the identification algorithm can be applied to strain data from each stage individually.
For each planetary stage, the effect of the different identification parameters that can be chosen in the MOESP algorithm has been explored. Measurements from model validation tests, with the same torque and speed conditions as the ones used for identification or training, have been used to evaluate the identified frequencies and mode shapes. The variance accounted for (VAF) between the validation measurements and the reconstructed outputs, simulating the system's behavior as an autonomous system oscillating from a non-zero initial condition, has been used as a metric. For the signals of the first-stage ring gear, average VAF values above 99 % were achieved between the signals measured in the validation tests and the reconstructed signals for suitable combinations of s block rows and n model orders. Therefore, the identified deflection shapes can reproduce the behavior of the gearbox accurately, and the contribution of the periodic excitations accounts for almost all the energy in the measured strain signals. The effect of torque on the identified deflection shapes has been studied, and no noticeable differences in the planet-passing mode shapes were observed for torques above 65 % of the nominal value. For strain recordings from tests with dynamically changing torque conditions, the contribution of the periodic modes has been quantified through the states associated with the operational deflection shapes identified at nominal torque. The contribution of the deflection shapes produced by the passing of planets is controlled by the amount of input torque applied to the gearbox. Using this contribution, an estimate of the input torque has been demonstrated for dynamic operating conditions.
Accurate knowledge of the input torque is critical for ensuring the reliability of wind turbine gearboxes. Measuring the input torque throughout the service history of every gearbox in a fleet would enable an improved assessment of the consumed fatigue life. This is important because the loading conditions are site-specific, and allowing for an individual evaluation of each gearbox can lead to a better understanding of current gearbox failure modes. The system identification framework presented in this article can be applied recursively to track the operational deflection shapes over time. This is proposed for fault detection in the planetary stage components. Three avenues are suggested for future work. First, it is recommended that the accuracy of the torque estimate produced by the strain measurements on the outer surface of the ring gear be quantified against a conventional direct measurement in the input shaft. When assessing the accuracy, the effects of non-torque loads, i.e., axial forces and bending moments, should be explored. Second, we suggest researching different sensor configurations and loading conditions that can excite the structural modes. Finally, it is suggested that the fault detection capabilities of trending the operational deflection shapes be investigated, ideally by seeding known faults in components of the planetary stages and evaluating their impact on the identified mode shapes.
A1 Identification using signals from the second and third planetary stages
The same identification exercise presented in Sect. 4.2 was performed for the strain signals acquired for the second and third stages. Using the same approach as for the first stage, a suitable sampling frequency was selected first, and then the effects of the identification parameters, s, n, and N, were explored. For the second stage, a sampling frequency of 208.33 Hz was found to give satisfactory identification results. Table A1 shows the frequencies associated with the deflection shapes using s=128 and n=20. In this case, all identified frequencies correspond to the planet-passing frequency, 6 times the carrier rotational frequency, and its harmonics. The first three identified mode shapes of the second stage are shown in Fig. A1, and a depiction of the reconstructed strain signals using these deflection shapes is shown in Fig. A2. In this case, due to the higher frequency and frames per second, the animation had to be reduced and could not match the identified frequencies. For the third stage, a sampling frequency of 625 Hz was chosen, and the identified frequencies are shown in Table A2. In this case, using s=128 and n=20, the first nine identified frequencies correspond to the planet-passing harmonics (third stage has five planets). The last identified frequency corresponds to twice the gear mesh frequency of the second stage. The second-stage ring gear drives the third-stage planet carrier. However, the contribution of this mode is very small. The first three identified mode shapes of the third stage are shown in Fig. A3, and an illustration of the strains reconstructed using these deflection shapes is shown in Fig. A4. Again, the allowable frames per second could not match the identified frequencies, and the speed of the animation had to be reduced.
Table A1Identified frequencies using measurement signals from the second stage with s=128 and n=20 (10 modes).
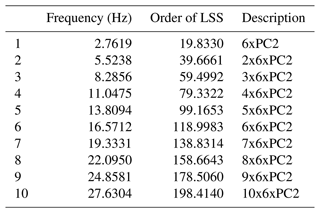
Table A2Identified frequencies using measurement signals from the third stage with s=128 and n=20 (10 modes).
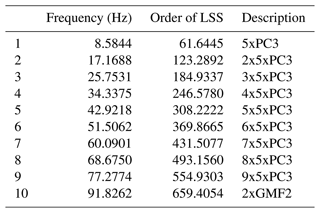
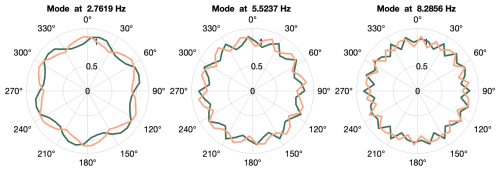
Figure A1Deflection shapes from the first three harmonics of the planet-passing frequency using measurement signals from the second stage. Each shape is defined by two conjugate vectors; the real part is shown in green, and the imaginary part is shown in orange.
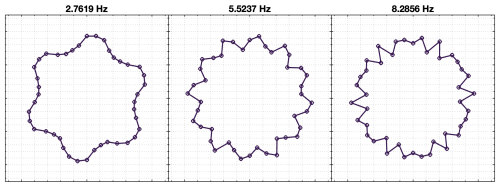
Figure A2Simulated strains on the second-stage ring gear associated with the first three planet-passing modes. An animation of a planet carrier revolution can be accessed in a supplementary video file.
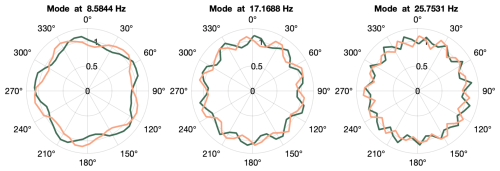
Figure A3Deflection shapes from the first three harmonics of the planet-passing frequency using measurement signals from the third stage. Each shape is defined by two conjugate vectors; the real part is shown in green, and the imaginary part is shown in orange.
Due to confidentiality agreements with research collaborators, the raw data and the software code used to produce the results shown in this publication can only be made available to researchers subject to a non-disclosure agreement. Details of the data and how to request access are available from the 4TU.ResearchData repository at https://doi.org/10.4121/8e6138ca-ad8e-4639-98d5-3ae95bcf9ef5.v1 (Gutierrez Santiago, 2024).
The supplement related to this article is available online at: https://doi.org/10.5194/wes-10-207-2025-supplement.
UGS conducted the tests and performed the data analysis presented in the paper. All authors provided important input to this research work through discussions, feedback, and paper improvement.
At least one of the (co-)authors is a member of the editorial board of Wind Energy Science. The peer-review process was guided by an independent editor, and the authors also have no other competing interests to declare.
Publisher's note: Copernicus Publications remains neutral with regard to jurisdictional claims made in the text, published maps, institutional affiliations, or any other geographical representation in this paper. While Copernicus Publications makes every effort to include appropriate place names, the final responsibility lies with the authors.
We would like to sincerely acknowledge the support of Gamesa Gearbox (Siemens Gamesa Renewable Energy) and TU Delft, which made this research possible, and the collaboration with Sensing360 B.V. The authors would also like to thank their Siemens Gamesa colleagues, who helped during the installation of the sensors and the execution of the tests. Plots in this article were generated using the open-access scientific color map package (https://doi.org/10.5281/zenodo.1243862) by Crameri (2019).
This paper was edited by Yi Guo and reviewed by two anonymous referees.
Al-Khazali, H. and Askari, M.: System Identification in Rotating Structures Using Vibration and Modal Analysis, in: Topics in Modal Analysis I, Vol. 5, edited by: Allemang, R., De Clerck, J., Niezrecki, C., and Blough, J., Springer, New York, NY, 481–497, ISBN 978-1-4614-2425-3, 2012. a
Azzam, B., Baseer, A., Schelenz, R., and Jacobs, G.: Development of a Wind Turbine Gearbox Virtual Sensor using Multibody Simulation and Artificial Neural Networks, Forschung im Ingenieurwesen, 85, 1–19, https://doi.org/10.1007/s10010-021-00460-3, 2021. a
Bucher, I. and Ewins, D.: Modal analysis and testing of rotating structures, Philos. T. Roy. Soc. Lond. A, 359, 61–96, https://doi.org/10.1098/rsta.2000.0714, 2001. a
Cappelle, C., Cattebeke, M., Bosmans, J., Kirchner, M., Croes, J., and Desmet, W.: Sensor selection for cost-effective virtual torque measurements on a wind turbine gearboxAuswahl der Sensoren für kostengünstige virtuelle Momentenmessung eines Windenergieanlagengetriebes, Forschung im Ingenieurwesen, 85, 325–334, https://doi.org/10.1007/s10010-021-00464-z, 2021. a
Crameri, F.: Scientific Colour Maps, Zenodo [data set], https://doi.org/10.5281/zenodo.1243862, 2019. a
Di Lorenzo, E., Manzato, S., Peeters, B., Marulo, F., Desmet, W., Schober, W., Bienert, J., Aenlle, M., and Fernandez, P.: Operational Modal Analysis For Rotating Machines: Challenges and Solutions, Università degli Studi di Napoli Federico II, https://doi.org/10.6093/UNINA/FEDOA/11469, 2017. a
Dykes, K. L., Veers, P. S., Lantz, E. J., Holttinen, H., Carlson, O., Tuohy, A., Sempreviva, A. M., Clifton, A., Rodrigo, J. S., Berry, D. S., Laird, D., Carron, W. S., Moriarty, P. J., Marquis, M., Meneveau, C., Peinke, J., Paquette, J., Johnson, N., Pao, L., Fleming, P. A., Bottasso, C., Lehtomaki, V., Robertson, A. N., Muskulus, M., Manwell, J., Tande, J. O., Sethuraman, L., Roberts, J. O., and Fields, M. J.: IEA Wind TCP: Results of IEA Wind TCP Workshop on a Grand Vision for Wind Energy Technology, https://doi.org/10.2172/1508509, 2019. a
Egeling, T., Hidding, E., Hövelbrinks, N.and Endemann, D., Uhlending, M., Bonnet, P.and Dekkers, R., Hendicx, W., and Vandermeulen, W.: Digital gearbox use case, https://www.winergy-group.com/en/DigitalGearboxUseCase (last access: 24 November 2021), 2018. a
Gamesa Gearbox: Gamesa Energy Transmission, https://www.gamesagearbox.com/wind-technology/ (last access: 23 January 2024), 2023. a, b
Greś, S., Döhler, M., Andersen, P., and Mevel, L.: Kalman filter-based subspace identification for operational modal analysis under unmeasured periodic excitation, Mech. Syst. Sig. Process., 146, 106996, https://doi.org/10.1016/j.ymssp.2020.106996, 2021. a, b
Gutierrez Santiago, U.: QBOX fiber-optic strain data for identification of operational deflection shapes, Version 1, 4TU.ResearchData [data set], https://doi.org/10.4121/8e6138ca-ad8e-4639-98d5-3ae95bcf9ef5.v1, 2024. a
Gutierrez Santiago, U., Fernández Sisón, A., Polinder, H., and van Wingerden, J.-W.: Input torque measurements for wind turbine gearboxes using fiber-optic strain sensors, Wind Energ. Sci., 7, 505–521, https://doi.org/10.5194/wes-7-505-2022, 2022. a, b, c
GWEC: Global Wind Report 2022, https://gwec.net/global-wind-report-2022/ (last access: 23 May 2023), 2023. a
Hermans, L. and van der Auweraer, H.: Modal Testing And Analysis Of Structures Under Operational Conditions: industrial applications, Mech. Syst. Sig. Process., 13, 193–216, https://doi.org/10.1006/mssp.1998.1211, 1999. a, b
Houtzager, I.: LTI System Identification Toolbox, https://www.dcsc.tudelft.nl/~jwvanwingerden/lti/ltitoolbox_product_page.html (last access: 13 June 2024), 2012. a
IEA: Wind energy in Europe: 2022 Statistics and the outlook for 2023–2027, https://www.iea.org/reports/net-zero-by-2050// (last access: 23 May 2023), 2023. a, b
IEC 61400-4: Wind turbines – Part 4: Design requirements for wind turbine gearboxes, https://www.iso.org/standard/44298.html (last access: 8 May 2024), 2012. a
IRENA: International Wind Energy Development: World Market Update, https://www.irena.org/-/media/Files/IRENA/Agency/Publication/2013/GWEC/IRENA_GWEC_WindReport_Global-Wind-Market-Update.pdf?la=en&hash=C93BDEB6DE8C4ED9EB0899B8AE7C62E3978F2985 (last access: 23 May 2023), 2013. a
Mehlan, F., Keller, J., and Nejad, A. R.: Virtual sensing of wind turbine hub loads and drivetrain fatigue damage, Forschung im Ingenieurwesen, 87, 1–12, https://doi.org/10.1007/s10010-023-00627-0, 2023. a
Mora, B., Basurko, J., Sabahi, I., Leturiondo, U., and Albizuri, J.: Strain Virtual Sensing for Structural Health Monitoring under Variable Loads, Sensors, 23, 4706, https://doi.org/10.3390/s23104706, 2023. a
Musial, W., Spitsen, P., Duffy, P., Beiter, P. Marquis, M., Hammond, R., and Shields, M.: 2022 Offshore Wind Market Report, https://www.energy.gov/sites/default/files/2022-09/offshore-wind-market-report-2022-v2.pdf (last access: 23 May 2023), 2023. a
Nejad, A. R., Keller, J., Guo, Y., Sheng, S., Polinder, H., Watson, S., Dong, J., Qin, Z., Ebrahimi, A., Schelenz, R., Gutiérrez Guzmán, F., Cornel, D., Golafshan, R., Jacobs, G., Blockmans, B., Bosmans, J., Pluymers, B., Carroll, J., Koukoura, S., Hart, E., McDonald, A., Natarajan, A., Torsvik, J., Moghadam, F. K., Daems, P.-J., Verstraeten, T., Peeters, C., and Helsen, J.: Wind turbine drivetrains: state-of-the-art technologies and future development trends, Wind Energ. Sci., 7, 387–411, https://doi.org/10.5194/wes-7-387-2022, 2022. a
Oyague, F.: Gearbox Reliability Collaborative (GRC) Description and Loading, https://doi.org/10.2172/1030848, 2011. a
Ozbek, M., Meng, F., and Rixen, D. J.: Challenges in testing and monitoring the in-operation vibration characteristics of wind turbines, Mech. Syst. Sig. Process., 41, 649–666, https://doi.org/10.1016/j.ymssp.2013.07.023, 2013. a
Perišić, N., Kirkegaard, P. H., and Pedersen, B. J.: Cost-effective shaft torque observer for condition monitoring of wind turbines, Wind Energy, 18, 1–19, https://doi.org/10.1002/we.1678, 2015. a, b
sensing360.com: Sensing 360 B.V., https://sensing360.com (last access: 30 April 2021), 2021. a
Stehly, T. and Duffy, P.: 2021 Cost of Wind Energy Review, https://www.nrel.gov/docs/fy23osti/84774.pdf (last access: 23 May 2023), 2022. a, b, c
Stehly, T., Heimiller, D., and Scott, G.: 2016 Cost of Wind Energy Review, https://www.nrel.gov/docs/fy18osti/70363.pdf (last access: 23 May 2023), 2012. a, b, c
Tegen, S., Lantz, E., Hand, M., Maples, B., Smith, A., and Schwabe, P.: 2011 Cost of Wind Energy Review, https://www.nrel.gov/docs/fy13osti/56266.pdf (last access: 23 May 2023), 2012. a, b, c
Thibault, L., Marinone, T., Avitabile, P., and Van Karsen, C.: Comparison of Modal Parameters Estimated from Operational and Experimental Modal Analysis Approaches, in: Topics in Modal Analysis I, Vol. 5, edited by: Allemang, R., De Clerck, J., Niezrecki, C., and Blough, J., Springer, New York, NY, 77–88, ISBN 978-1-4614-2425-3, 2012. a
van Kuik, G. A. M., Peinke, J., Nijssen, R., Lekou, D., Mann, J., Sørensen, J. N., Ferreira, C., van Wingerden, J. W., Schlipf, D., Gebraad, P., Polinder, H., Abrahamsen, A., van Bussel, G. J. W., Sørensen, J. D., Tavner, P., Bottasso, C. L., Muskulus, M., Matha, D., Lindeboom, H. J., Degraer, S., Kramer, O., Lehnhoff, S., Sonnenschein, M., Sørensen, P. E., Künneke, R. W., Morthorst, P. E., and Skytte, K.: Long-term research challenges in wind energy – a research agenda by the European Academy of Wind Energy, Wind Energ. Sci., 1, 1–39, https://doi.org/10.5194/wes-1-1-2016, 2016. a
van Vondelen, A. A. W., Navalkar, S. T., Iliopoulos, A., van der Hoek, D. C., and van Wingerden, J.-W.: Damping identification of offshore wind turbines using operational modal analysis: a review, Wind Energ. Sci., 7, 161–184, https://doi.org/10.5194/wes-7-161-2022, 2022. a
van Vondelen, A. A. W., Iliopoulos, A., Navalkar, S. T., van der Hoek, D. C., and van Wingerden, J.-W.: Modal analysis of an operational offshore wind turbine using enhanced Kalman filter-based subspace identification, Wind Energy, 26, 923–945, https://doi.org/10.1002/we.2849, 2023. a
Veers, P., Dykes, K., Lantz, E., Barth, S., Bottasso, C. L., Carlson, O., Clifton, A., Green, J., Green, P., Holttinen, H., Laird, D., Lehtomäki, V., Lundquist, J. K., Manwell, J., Marquis, M., Meneveau, C., Moriarty, P., Munduate, X., Muskulus, M., Naughton, J., Pao, L., Paquette, J., Peinke, J., Robertson, A., Rodrigo, J. S., Sempreviva, A. M., Smith, J. C., Tuohy, A., and Wiser, R.: Grand challenges in the science of wind energy, Science, 366, eaau2027, https://doi.org/10.1126/science.aau2027, 2019. a
Veers, P., Bottasso, C. L., Manuel, L., Naughton, J., Pao, L., Paquette, J., Robertson, A., Robinson, M., Ananthan, S., Barlas, T., Bianchini, A., Bredmose, H., Horcas, S. G., Keller, J., Madsen, H. A., Manwell, J., Moriarty, P., Nolet, S., and Rinker, J.: Grand challenges in the design, manufacture, and operation of future wind turbine systems, Wind Energ. Sci., 8, 1071–1131, https://doi.org/10.5194/wes-8-1071-2023, 2023. a, b
Verhaegen, M. and Dewilde, P.: Subspace model identification Part 1. The output-error state-space model identification class of algorithms, Int. J. Control, 56, 1187–1210, https://doi.org/10.1080/00207179208934363, 1992. a
Verhaegen, M. and Verdult, V.: Filtering and system identification: a least squares apporach, Cambridge University Press, Cambridge, ISBN 9780511618888, https://doi.org/10.1017/CBO9780511618888, 2007. a, b, c, d, e
Winergy: High Density Gear Units Winergy Website, https://www.winergy-group.com/en/Products/Gear-Units/High-Density/p/HighDensityX (last access: 23 May 2023), 2020. a
ZF-Wind-Power: ZF Wind Power breaks 200 Nm/kg torque density barrier with the modular gearbox platform SHIFT 7k, https://press.zf.com/press/en/releases/release_22016.html (last access: 23 May 2023), 2020. a
Zhang, H., Ortiz de Luna, R., Pilas, M., and Wenske, J.: A study of mechanical torque measurement on the wind turbine drive train – ways and feasibilities, Wind Energy, 21, 1406–1422, https://doi.org/10.1002/we.2263, 2018. a
- Abstract
- Introduction
- Formulation of the subspace system identification method
- Experimental setup
- Identification of operational deflection shapes
- Conclusions
- Appendix A
- Code and data availability
- Author contributions
- Competing interests
- Disclaimer
- Acknowledgements
- Review statement
- References
- Supplement


