the Creative Commons Attribution 4.0 License.
the Creative Commons Attribution 4.0 License.
 | 24 Oct 2025
Building a diverse and equitable distributed wind workforce: a strategic approach to collaborator selection
Kamila Kazimierczuk
Micah Taylor
Danielle Preziuso
Andrew White
The demand for a skilled distributed wind (DW) workforce is rising with industry growth and recent federal support for technology adoption. However, challenges persist in scaling the industry. For example, DW installers have reported difficulties in hiring, and workforce development opportunities have not been fully realized in rural and remote disadvantaged communities with economically viable DW potential. According to the US Energy and Employment Report (USEER), the wind energy workforce continues to have below-average representation of women, people of color, and other marginalized groups. The transition to a cleaner energy future is an opportunity to change that. As more renewables, including DW, come online, scaling workforce capacity can be done in tandem with supporting workforce diversity. Moreover, to promote fair and equitable outcomes in workforce development, efforts to address limited workforce capacity should encourage participation from under-resourced and underrepresented populations. Engaging underrepresented populations helps close skill gaps and ensures that the wind energy sector benefits from diverse perspectives, driving innovation and more effective solutions. Additionally, prioritizing workforce diversity ensures that marginalized communities share in the benefits of the clean energy transition, ultimately supporting the long-term sustainability and inclusivity of the industry. This work presents a replicable equity-driven rubric to identify potential industry and academic collaborators for workforce development programming. The rubric identifies and considers workforce partners outside of traditional networks across locational, institutional, and socioeconomic criteria to advance new partnership-building opportunities in areas favorable for DW. These collaborative opportunities can serve as case studies for improving the future scale-up of equitable clean energy workforce partnerships.
- Article
(1696 KB) - Full-text XML
-
Supplement
(323 KB) - BibTeX
- EndNote


Wind energy is the largest source of renewable electricity in the United States in terms of cumulative installed capacity and is one of the fastest-growing sources of electricity overall – requiring a skilled workforce to support industry growth (Climate Central, 2024; McDermott-Murphy, 2024; ACP, 2021) Technological maturity, advanced manufacturing improvements, and cost reductions have made wind cheaper than conventional fossil fuels, stimulating growth across the wind sector. Policy momentum is also stimulating wind workforce development. The Inflation Reduction Act (IRA) provides up to 30 % credit for eligible investments in wind projects that adhere to prevailing wage standards and employ apprentices from Department of Labor (DOL) registered apprenticeship programs (US DOL, 2021; US DOE EERE, 2023). Federal decarbonization targets and state renewable portfolio plans have further elevated wind energy as a key part of the larger energy transition.
Deploying wind energy technologies at the distribution level of the grid, commonly called distributed wind (DW) (Preziuso et al., 2022), has been primed for growth. Unlike utility-scale land-based (LBW) and offshore wind (OSW), which provide power to distant end users, DW stays relatively local – built in the communities and backyards of the individuals using its power, with technology sized to the application. DW utilizes small, middle, and large (i.e., utility-scale) turbines to serve on-site power demand or local loads (US DOE EERE, 2024). While LBW and OSW represent the most significant portion of installed generation capacity, DW is a growing part of this wind energy mix. Over the last 10 years, domestic DW installed capacity grew 10 % on average annually (Sheridan et al., 2024). During that time, the US Department of Energy (DOE) continued investments in developing, certifying, and commercializing DW technologies – awarding 30 companies more than USD 18.5 million to improve DW interoperability, cost competitiveness, and design (NREL, 2024a). These investments have driven gradual reductions in the levelized cost of energy (LCOE) for DW, with LCOE conservatively projected to drop by more than 40 % across technology sizes by the end of the decade (compared to 2022) (NREL, 2024b) This decade has also witnessed significant activity in the small wind market, with several international turbine manufacturers entering the US market and new domestic start-ups working towards product commercialization (Sheridan et al., 2024). These advancements and investments, alongside federal initiatives providing customer-facing financial support and opportunities, position DW for more widespread adoption. For example, the IRA allocates grant funding to the US Department of Agriculture (USDA) for underutilized technologies like DW through the Rural and Agricultural Income & Savings from Renewable Energy (RAISE) Initiative (U.S. DOE, 2024b). Under this initiative, in collaboration with the DOE, the USDA aims to assist 400 individual farmers in deploying smaller-scale on-site wind projects (Hallett, 2024; Parker et al., 2024). The Federal Energy Regulatory Commission's 2020 order enabling distributed energy resources to participate in wholesale electricity markets further offers compelling revenue streams for potential DW projects (Tapio and Preziuso, 2024). These initiatives build substantial momentum for continued industry growth, emphasizing the need to focus more on creating a skilled workforce in the DW energy sector to prepare for future deployments effectively.
The 2024 US Energy and Employment Report (USEER) highlights that wind energy employment grew by 4.6 % in 2023, adding 5715 jobs. Unionization rates in clean energy sectors, including wind, have surpassed those in the broader energy industry, indicating a shift towards more organized labor in the sector. Furthermore, projections by the National Renewable Energy Laboratory (NREL) estimate that the demand for wind energy workers could reach 258 000 by 2030 (U.S. DOE, 2024a). These trends underscore the importance of initiatives dedicated to developing a skilled workforce to meet the growing demands of the distributed wind sector.
DW workforce needs differ meaningfully from LBW, which has more established workforce pipelines and centralized training efforts. Due to the localized and varied nature of DW systems, DW deployment often requires multifunctional workers with expertise in multiple specialized areas, such as electrical work, permitting, and site-specific customization. Also, unlike LBW, which benefits from economies of scale and standardized processes, DW installations must navigate diverse regulatory environments, terrain, and customer needs, forcing the workforce to be versatile and adaptable to deal with project nuances. These differences remain incompletely mapped, which magnifies a key gap in DW workforce development.
To date, DW workforce development has received fragmented attention, with periodic efforts led by installers to increase the workforce in response to sector growth (Parker et al., 2024). Even so, the number of installers and service providers in the DW industry is still limited, potentially hindering market growth (Garbe et al., 2024). In addition, economically favorable locations for DW projects, which can create jobs, strongly correlate with disadvantaged communities facing social, economic, or environmental barriers that hinder access to resources and opportunities (McCabe et al., 2022). These combined challenges point to an opportunity space: working with minority-serving institutions (MSIs) and nontraditional academic providers that support underrepresented demographics, especially those located in wind-favorable areas, to help build a diverse and equitable DW workforce.
This paper showcases the first phase of an effort to pair industry partners (i.e., DW installers) with academic institutions to build tailored DW workforce development programs. The initial phase of collaborator identification showcased in this work utilizes a replicable rubric grounded in equitable principles to ensure prioritization of underrepresented demographics in workforce development. Subsequent phases of project work include collaborative workshops to outline workforce skill needs and define place-based characteristics (e.g., existing resources, infrastructure, population) that can inform workforce development solutions responsive to industry needs and the communities they serve. The aim of these efforts is to guide more targeted training and certification to support scalable and sustainable DW workforce development.
The remainder of the Introduction will discuss gaps in the DW workforce landscape and provide more background on the approach to addressing workforce capacity and diversity needs. Section 2 outlines the methodology used to develop the rubric, including background on energy equity and its application to this work and the implementation of the rubric in spatial analysis software to produce results (i.e., potential academic institutions for partnerships). Section 3 reviews the results of rubric implementation, followed by Sect. 4, which provides discussion and reflections. We conclude with future work in Sect. 5.
1.1 Gaps in distributed wind workforce development
Both small- and large-scale DW installers and manufacturers have reported difficulty hiring qualified candidates in recent years (Figs. 1 and 2)1, reflecting a broader challenge in finding qualified candidates, as well as connecting qualified candidates to jobs, across DW industry segments (Orrell et al., 2023; Stefek et al., 2022). Gaining wind energy-specific skills and work experience and identifying positions aligned with candidate skills were noted as primary drivers for this challenge. An additional challenge is the geographic disconnect between where wind industry jobs are located and where the potential workforce is willing to live (Stefek et al., 2022). The findings highlight a missing link between wind industry employers, the potential workforce, and educational institutions in building and connecting qualified and skilled career seekers to compatible wind jobs.
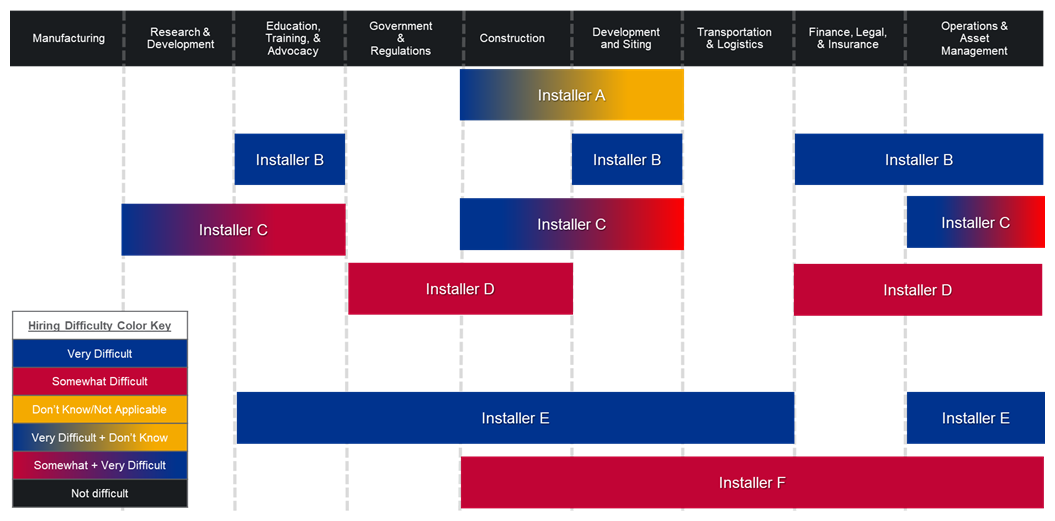
Figure 1Data gathered for the 2022 Distributed Wind Market Report revealed that most DW installers have difficulty hiring across all industry segments. For example, Installer D worked across government and regulations, construction, finance, and operations segments and reported finding hiring somewhat difficult.
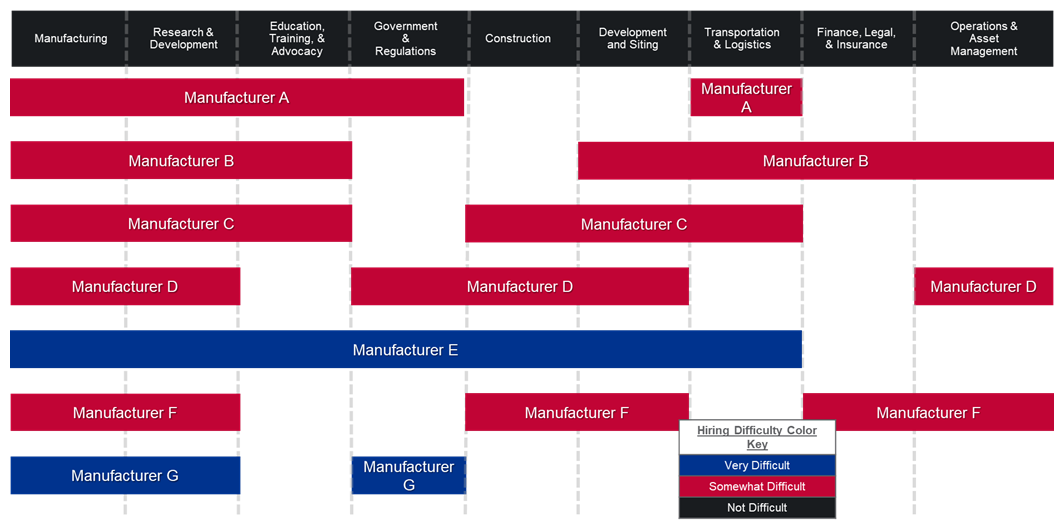
Figure 2Data gathered for the 2022 Distributed Wind Market Report revealed that most DW manufacturers had difficulty hiring across all industry segments, as evidenced by each company's blue or red shading.
An additional gap in DW workforce development is the sector's lack of overarching training and certification programs. Unlike the LBW and OSW sectors, DW's workforce development is a relatively new objective and is not centralized or undertaken by an organizing state or federal agency. There are dedicated and specialized university programs, state-run training services, and accreditation boards for LBW and OSW, such as NYSERDA's OSW training institute and DOL-approved apprenticeship programs. However, DW efforts to date have been ad hoc and administered by key industry players in its limited network. For instance, the North American Board of Certified Energy Practitioners (NABCEP) brought together a group of small wind experts comprised of educators, installers, and other experienced wind energy leaders in 2010 to develop a Small Wind Associate Certification (NABCEP, 2010). By January 2012, nine candidates had received certification, but the program was indefinitely suspended for unknown reasons as of September 2012, and no new applications were accepted (Oteri and Sinclair, 2012; NABCEP, 2018).
Overall, the wind energy industry has a below-average representation of marginalized groups, and the transition to a cleaner energy future is an opportunity to shift that dynamic. Currently, the wind workforce is disproportionately ∼ 70 % male compared to the US average of ∼ 53 %, and the representation of Black or African American workers and individuals with disabilities is lower than the national averages of 12 % and 4 %, respectively (McDowell et al., 2024). To support a just and equitable clean energy transition, job creation and workforce development opportunities must be distributed fairly and encourage participation from communities currently underrepresented in or underserved by the energy sector. The collaborator selection approach supports this goal by prioritizing partnerships with academic institutions that serve underrepresented demographics, such as MSIs, community colleges, and nontraditional academic providers. An additional aim is to tailor programs to suit the unique economic and demographic characteristics and existing resources and infrastructure at each partnering institution. This strategy helps diversify the future DW workforce and ensure that workforce pathways are inclusive and accessible.
In parallel, DW as a technology provides a unique opportunity to advance energy equity through its site-specific, localized nature. Unlike utility-scale LBW, which generates bulk electricity often transported far from its point of origin, DW serves local customers and loads directly. This place-based model creates opportunities for local job creation and community economic development that align with broader goals of equitable clean energy deployment (US DOE EERE, 2024). Focusing on community-connected solutions and equitable collaborator selection helps ensure that both the process and the outcomes of DW deployment contribute to a more inclusive energy future.
1.2 Overall approach
The goals of this overarching work are to strategize pathways for increased workforce diversity and support training solution development via industry and institutional collaboration since these actors are foundational for hiring. On the industry side, this includes working with distributed wind installers and developers with boots-on-the-ground knowledge of skill needs to inform effective technical programs and close qualification gaps on the recruitment end. On the institutional side, this includes working with MSIs, community colleges, and nontraditional academic providers that support students from underrepresented and disadvantaged backgrounds to help drive interest in DW careers and highlight visibility for various career opportunities. Regional partnerships between industry institutions and academic leaders facilitate connections among geographically proximate entities that can establish a positive feedback loop, ensuring a synergistic relationship between DW industry employers and educational programs critical to supporting workforce expansion.
For sustainability, maximum sector impact, and advancement of diversity and equity objectives, the collaborator selection approach requires a robust and replicable methodology that concurrently centers the sector's needs and opportunities and the project objectives. Relative to the wind industry as a whole, the DW sector is small with roughly 1.1 GW of installed capacity at the time of writing (Sheridan et al., 2024). This results in a limited sample size for industry partners; industry selection criteria can be defined by interest and availability. However, the potential academic partners are on the order of thousands and thus require a more strategic selection method. Utilizing quantifiable selection criteria supports a more rigorous, fair, and effective partnership process. A quantifiable methodology minimizes bias, ensuring decisions are based on measurable data rather than subjective opinions. It allows for a standardized evaluation process, promotes transparency in decision-making, makes it easier to justify selection decisions, and ensures alignment with the project objectives. Because of this, we utilized an equity-driven rubric that prioritizes academic organizations supporting underserved groups in rural, wind-rich communities to create equitable partnership opportunities in critical workforce development areas.
This work has two direct value streams for potential partners: academic collaborators receive hands-on curriculum building through program development informed by industry technical expertise, and industry collaborators benefit from accelerated workforce development that plays into hiring needs across various industry segments. Direct collaboration, education, and technical expertise are combined to address local and regional needs. Overall, the project develops a framework for outreach, engagement, and program development that increases market readiness for accelerated DW deployment through equitable workforce growth.
This section outlines the materials and methods for developing the collaborator selection rubric, prioritizing education providers supporting underserved communities in wind-rich areas. The methodology ensures a replicable and transparent selection process, centering on equity to enhance workforce diversity in the DW sector. The following subsections detail the equity priorities, scoring criteria, and spatial analysis techniques employed to accomplish the project's objectives.
2.1 Equity priorities
As mentioned, the first phase of these workforce efforts is geared toward identifying and advancing new and equitable partnership opportunities with education providers and industry leaders. There is tremendous potential to increase the number of wind energy workers and, more importantly, the diversity of the DW energy workforce by engaging MSIs and technical and trade schools, especially those located in areas favorable for DW deployment. Engaging these institutions can also support local economic development since high-wind-resource-quality areas can often be in remote, economically distressed communities. Disadvantaged communities represent 47 % of all parcels where behind-the-meter DW applications can be sited and 43 % of all parcels where front-of-the-meter DW applications can be sited within the contiguous United States (McCabe et al., 2022). Further, the Midwest, Heartland, Northeast, and portions of the Mountain West regions where DW's economic potential is high intersect with swaths of rural America (McCabe et al., 2022). Identifying partnership opportunities capitalizes on these correlations through specific equity priorities that ensure collaboration with academic organizations supporting underserved groups.
Four equity priorities were defined to prioritize collaboration with academic organizations supporting underserved groups in wind-rich communities. These priorities aim to enhance collaboration with academic organizations that support underserved groups, thereby addressing systemic barriers and fostering diversity within the workforce. Below are the specific priorities.
-
Prioritize currently underserved or underrepresented groups in the DW industry. As defined in Executive Orders 13985 (2021), 14020 (2021), and 14091 (2023), the term “underserved communities” refers to those populations as well as geographic communities that have been systematically denied the opportunity to participate fully in aspects of economic, social, and civil life and may include Black, Latino, Indigenous and Native American, Asian American, Native Hawaiian, and Pacific Islander persons and other persons of color; members of religious minorities; women and girls; LGBTQI+ persons; persons with disabilities; persons who live in rural areas; persons who live in United States Territories; persons otherwise adversely affected by persistent poverty or inequality; and individuals who belong to multiple such communities. Underserved communities also include individuals with limited proficiency in English, whether they use spoken language, sign language, or other communication methods, per Executive Order 14094. The energy sector has a below-average representation of Hispanic or Latinx workers and Black or African American workers and a below-average proportion of women (BW Research Partnership, 2021).
-
Prioritize MSIs, community colleges, and technical and trade programs. MSIs align with equity priority 1, while community colleges and technical and trade programs are often dedicated to skilled job training, such as those required for the DW workforce. They may also have registered apprenticeship programs (RAPs) that are relevant for compliance with the IRA funding.
-
Prioritize rural areas due to high DW deployment potential and unique energy equity considerations for rural loads. Rural areas represented a significant percentage of newly installed US DW projects deployed in 2022 (Orrell et al., 2023). Consumers with rural energy loads are more likely to have a higher energy burden, experience more significant grid reliability challenges, and be exposed to more aging and inefficient grid infrastructure than their metropolitan counterparts (Parker et al., 2023).
-
Prioritize institutions within 100 mi of active installers. “Active” installers are defined as having at least three or more projects in the last 5 years (Orrell et al., 2023). The rubric focuses on installers rather than manufacturers because installers represent part of the project cycle segment that needs expansion to meet increased demand for DW in the future. Being place-based by nature, DW needs a local workforce that is connected to installers for service projects. The proximity radius is applied to ease travel needs and collaboration once partnerships are established, while also addressing the challenge of the geographic disconnect between the locations of wind industry jobs and the areas where the potential workforce is willing to reside. While this 100 mi radius (measured in straight-line distance) does not reflect real-world travel times, it provides a standardized and spatially consistent measure of regional proximity. Future work may consider using drive-time buffers or travel network analyses, particularly for rural geographies.
2.2 Rubric development
The rubric acts as a strategic tool for advancing justice-driven priorities by incorporating weighted locational, institutional, and socioeconomic criteria that align with the project's equity objectives. We acknowledge that it is not a neutral selection mechanism and weighting is not meant to assign a rank to potential collaborators or act as a precise measure for determining suitability. Instead, it illuminates academic organizations with favorable characteristics for DW workforce development aligned with the project's objectives. Each rubric criterion is framed through the lenses of procedural and recognition justice. Procedural justice looks at the fairness of decision-making processes, ensuring participants can define, drive, and hold accountable program decisions and outcomes (Jenkins et al., 2016; Heffron and McCauley, 2017). Recognition justice emphasizes the need to understand different vulnerability types and specific needs among social groups, especially marginalized communities (van Uffelen, 2022; Jenkins et al., 2016). Both justice aspects apply transparency, accountability, and due-process principles; transparency brings about accountability by empowering people with information to hold institutions accountable and shed light on decision-making processes (Tarekegne et al., 2021; Lanckton and DeVar, 2021).
Thus, to further these principles of procedural and recognition justice, we utilize this rubric as a measurable evaluation criterion (i.e., metrics) to make it easier to hold the project accountable in participant selection. The rubric criterion combines two types of equity metrics: target metrics and tracking metrics (Tarekegne et al., 2021). Target metrics capture descriptive analytics on populations and are demographic-specific measurements. They speak to recognition justice and will contribute to diverse workforce representation. Tracking metrics reflect progress measurement (i.e., program sustainability, self-ownership, longevity) and can evaluate how well an effort has helped a target community. They speak to procedural justice and how well workforce development programs address local perspectives. Tracking metrics will further set appropriate, achievable equity-related goals to undo past disparities. Both types of metrics will inform collaborators of ways to increase program efficacy and reach.
Further, the rubric streamlines the evaluation of potential academic collaborators. The rubric criterion abstract procedural and recognition justice uses principles from energy justice roots and re-aligns them towards diversity, equity, inclusion, and accessibility (DEIA) in order to achieve the equity priorities. The criterion categories align with recognition justice. The methodology for collaborator evaluation aligns with procedural justice. Examples of other energy equity and justice work that uses a rubric for evaluation include the American Council for an Energy-Efficient Economy (ACEEE) scorecards (Kresowik et al., 2025) and the “Justice in 100” scorecard from the Initiative for Energy Justice (Lanckton and DeVar, 2021).
It is important to note that there are other justice dimensions not fully addressed by this work such as distributional justice, which concerns how benefits and burdens are shared across communities. While our focus on procedural and recognition justice aligns with the project's goals and practical scope, we acknowledge the broader conceptual foundation laid by environmental justice scholarship, e.g., Schlosberg (2004), which has emphasized the interconnection of recognition, participation, and equity as essential to achieving meaningful justice. Contemporary frameworks like energy justice and energy equity (Kresowik et al., 2025; Lanckton and Devar, 2021), which we apply throughout this work, build on these foundations while offering more targeted guidance for the clean energy transition (National Academies of Sciences, Engineering, Medicine (NASEM), 2021; Heffron and McCauley, 2017) and workforce development (International Labor Organization, 2015; IRENA and ILO, 2024).
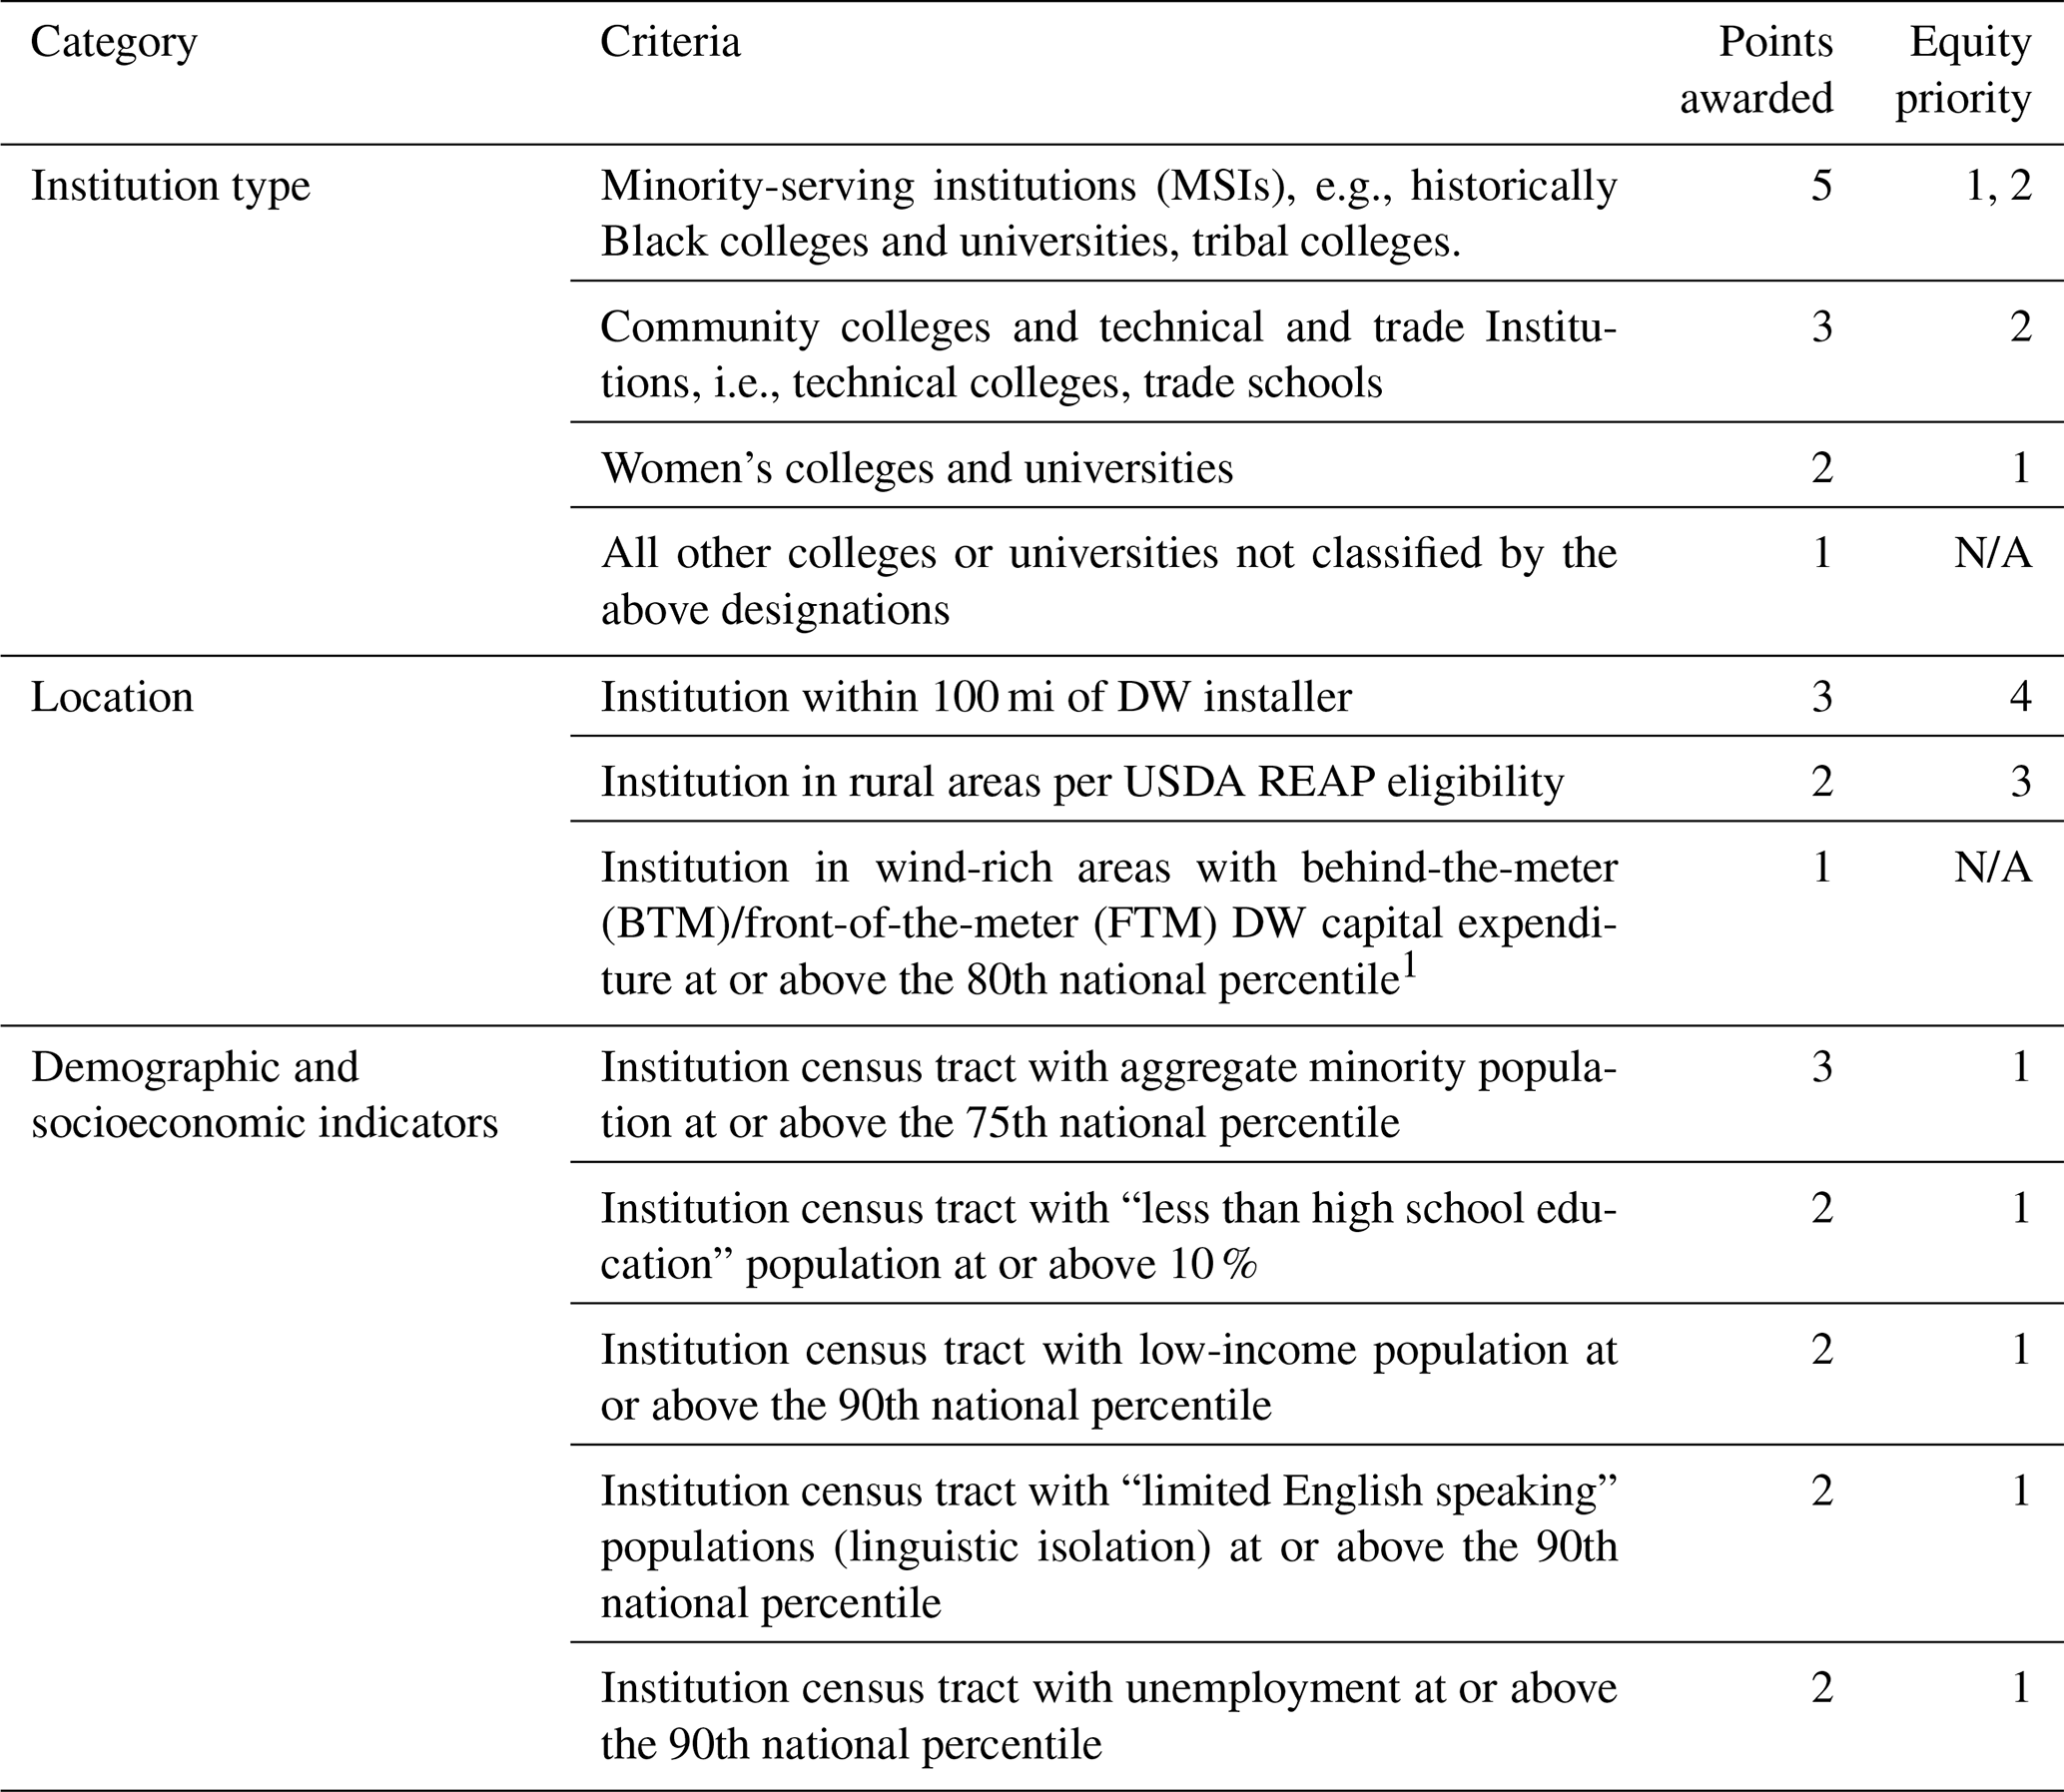
There are three criterion categories with a subset of metrics aligned with the equity priorities, as shown in Table 1.
-
Institution type considers what kind of academic institution the potential academic partner is. Because of Equity Priority 2, MSIs, community colleges, technical and trade programs2, and women's colleges receive 5, 3, and 2 points, respectively. Institutions not classified in these three designations get 1 point. Weightings reflect the scale of underrepresentation in the workforce per statistics in the USEER (U.S. DOE, 2024a); women currently comprise a larger proportion of the workforce than most minority groups. Existing wind programs did not get additional points because of the objective to build up new programs and curriculum (1) through partnerships with new institutions and (2) in areas with predominantly underserved and underrepresented groups.
-
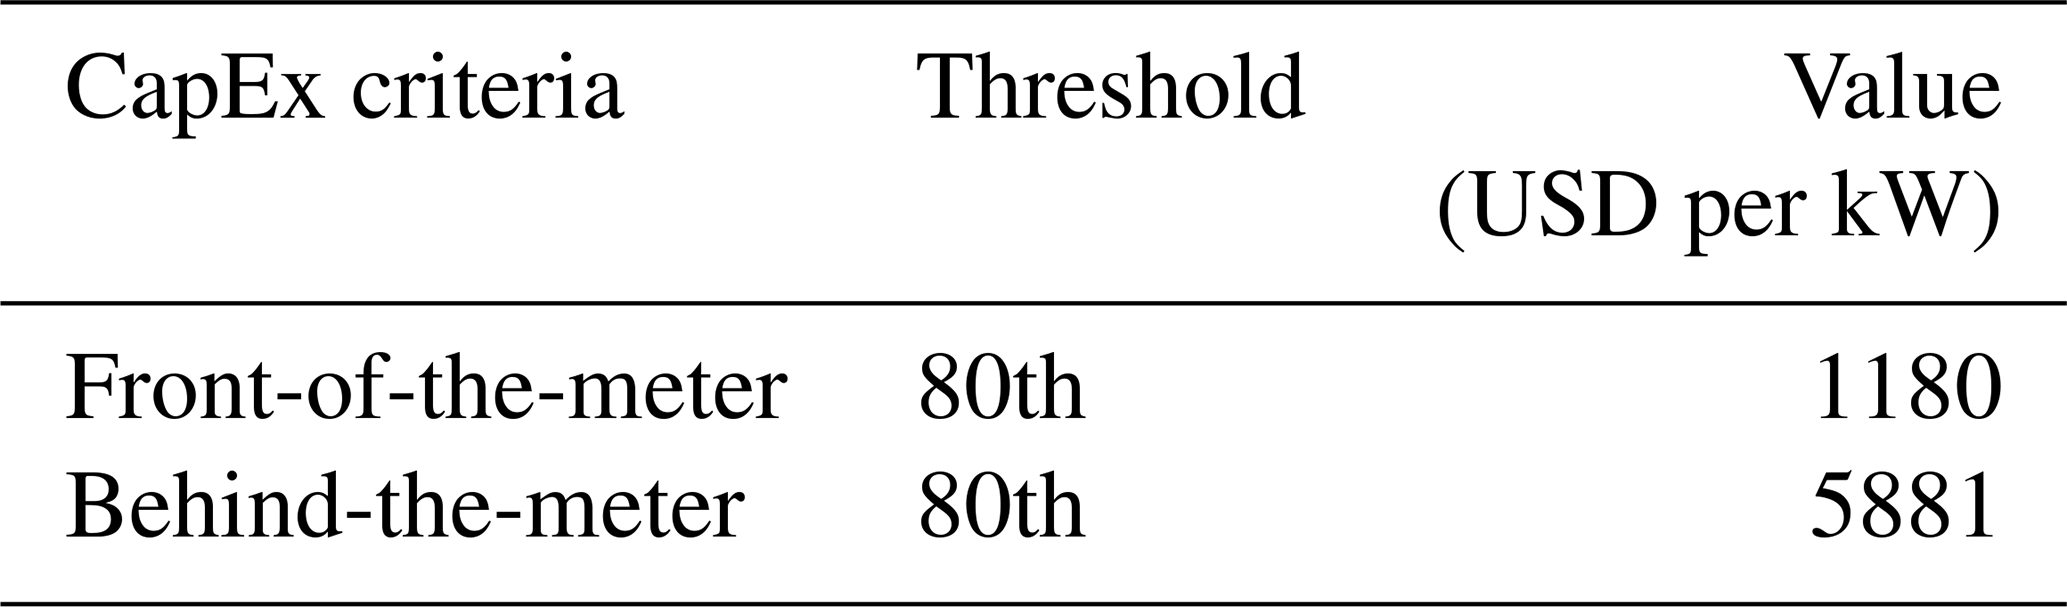
Location considers where the institution is located. Because of Equity Priority 4, institutions within 100 mi of the installer get 3 points. Because of Equity Priority 3, areas classified as rural per the US Department of Agriculture's Rural Energy for America Program (REAP)3 eligibility get 2 points. Institutions in or near wind-rich areas get 1 point. Wind richness is defined per the Distributed Wind Energy Futures Study (McCabe et al., 2022) through capital expenditure thresholds.4 Though break-even costs do not necessarily capture all “wind-rich” locations, areas above the 80th percentile, along with a combination of other factors, are considered economically favorable for DW deployments (see Table 3).
-
Demographic and socioeconomic indicators characterize the disadvantages in the census tract where the institution is located. Because of Equity Priority 1, institution census tracts with the aggregate minority population at or above the 75th percentile get 3 points. Minority status is determined by the Environmental Protection Agency's EJSCREEN tool, which helps identify areas with environmental burdens and vulnerable populations (US EPA, 2024a). Because of the overall goals of this work, workforce development disadvantage indicators are worth 2 points. These indicators include linguistic isolation, low median income, poverty level, an unemployment rate at or above the 90th percentile, and high school education above 10 %. These indicators are explained in further detail in the overview of socioeconomic indicators for EJSCREEN (US EPA, 2024b).
Table 1The collaborator selection criterion is utilized in a weighted rubric aligned with equity priorities in Sect. 2. N/A indicates equity priorities are not applicable to these criteria.
The scoring formulas were applied to every academic institution and technical and trade school in the United States. The highest theoretical score possible is 25, a case in which an academic institution would be awarded 8 points for qualifying as a minority-serving community college (5 points for MSI type; 3 points for community college institution type), 3 points for being within 100 mi of a DW installer, 2 points for being located in a rural area, 1 point for being located in a wind-rich area, and 11 points for meeting all socioeconomic criteria thresholds. The higher the score, the more likely the institution satisfies the project objectives and equity priorities.
2.3 Spatial and mapping implementation
A Geographic Information System (GIS) combined with RStudio was used to score all post-secondary education institutions, with the list of colleges and universities (C&U) supplied by HIFLD (HIFLD, 2020) and based on the scoring rubric outlined in Sect. 2.2. Institution types (e.g., MSI, community college) were pre-labeled within this data layer. First, the MSIs were read in (NASA, 2024). The left_join() function from dplyr packages combined both datasets based on address fields. The updated C&U data were then read into Arc GIS Pro as xy data. The C&U layer was then spatially joined5 with demographic and socioeconomic indicators from EJSCREEN (Table 2).
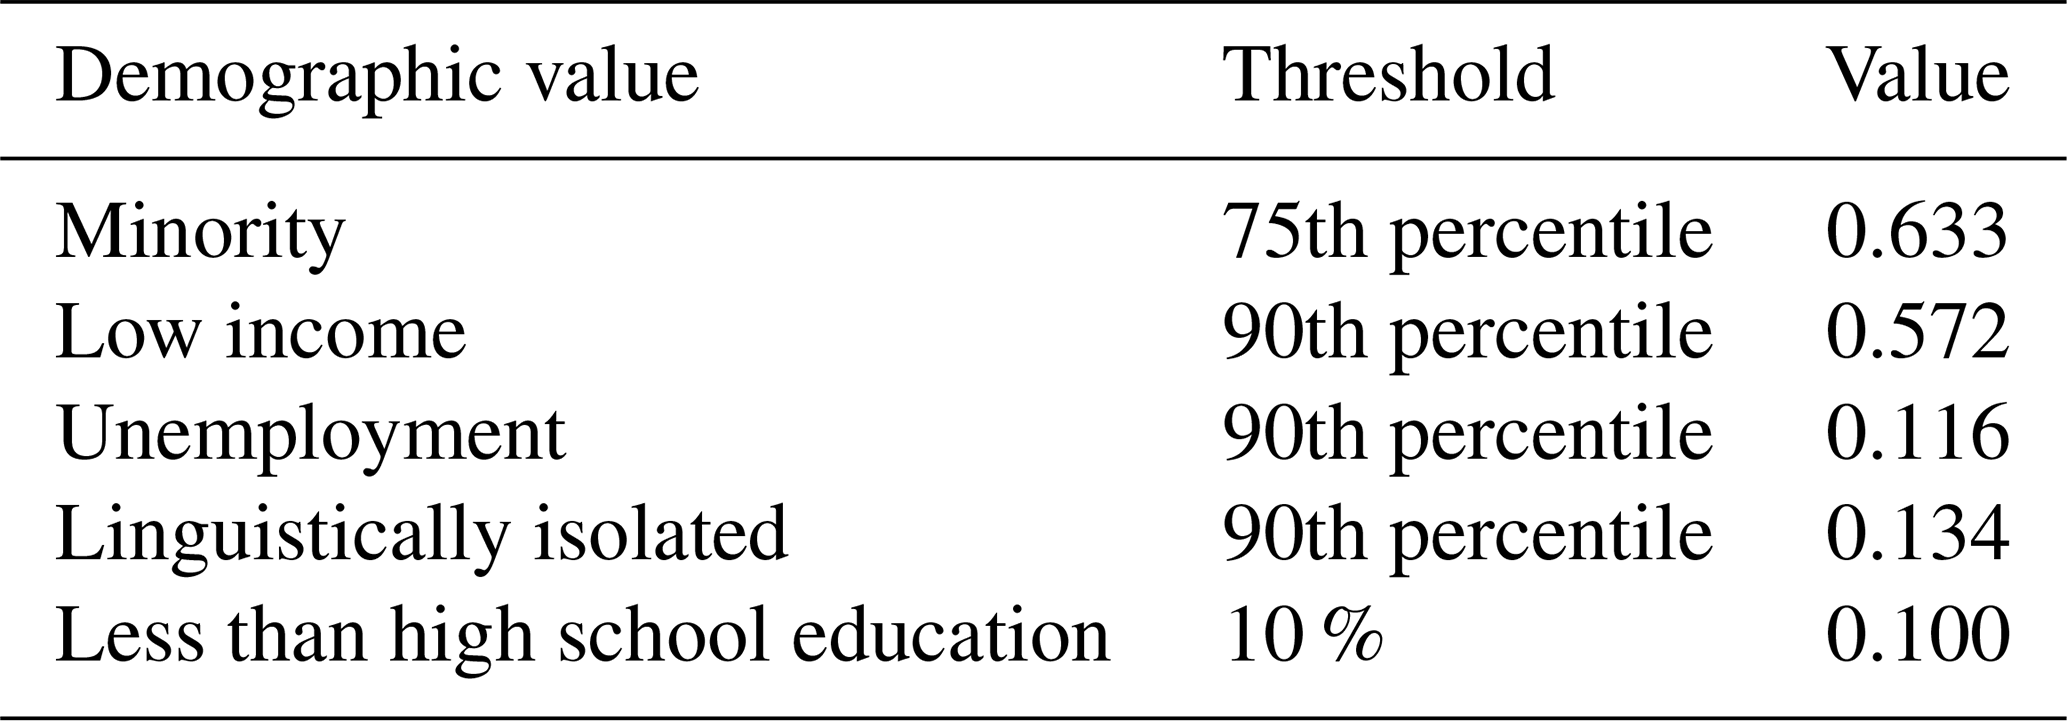
Table 2Demographic value thresholds derived from R extraction of all US Census Tracts.
For the location criterion, rural status, defined by USDA REAP eligibility, was spatially joined to the C&U layer as target features with the intersect match option. To assess proximity to DW installers, point locations of institutions and addresses of installer headquarters were geo-located. With C&U as input features, we select by location with “relationship” as “within a distance,” “selecting features” as the installer point locations, and “search distance” as 100 “US survey miles.” We then added a new field to the C&U layer as a yes/no to installer proximity. Next, the wind richness data were added to the C&U layer by spatially joining dWind data, which considers the front-of-the-meter and behind-the-meter CapEx thresholds. To get the respective thresholds for these attributes according to the scoring rubric, the Python Pandas library was used to extract those values from the entirety of the Distributed Wind Energy Futures Study (Table 3).
Table 3CapEx thresholds derived from GIS outputs based on the Distributed Wind Energy Futures Study (McCabe et al., 2022).
This GIS analysis resulted in a single CSV file containing institutional, locational, and socioeconomic scores for all C&U. These CSV files were converted to Excel spreadsheets and combined for post-processing, which included manually scoring the 25 women's colleges, removing “specialized” educational institutions, such as performing arts schools, cosmetology schools, and seminaries, and filtering out academic institutions located outside the contiguous US, for which there are multiple data gaps (e.g., no CapEx data are available for AK, HI, and US Territories). The final step in post-processing was validating the GIS results by embedding formulas in the spreadsheet to verify the final scores.
The preliminary pre-processed dataset contained 6839 institutions. After pre-processing to remove flight training, cosmetology and barber, fine arts, and educational support programs and manually adding points for women's colleges, the final dataset contained 5106 post-secondary institutions with scores ranging from 1 to 23, with a mean of 7.5 and median of 7. Because of the active installer criteria, i.e., at least three or more projects in the last 5 years, fewer than 20 installers are included in the results. They also reflect the highly responsive DW industry partners known to be interested in supporting the DW workforce efforts. There were 25 women's colleges, 1538 junior and community colleges, 1034 technical and trade schools, 794 MSIs, and 2102 other institutions. Figure 3 shows the resulting scores for the schools compared with installer locations. Alaska and Hawaii are not included in the results due to unreliable data on wind richness.
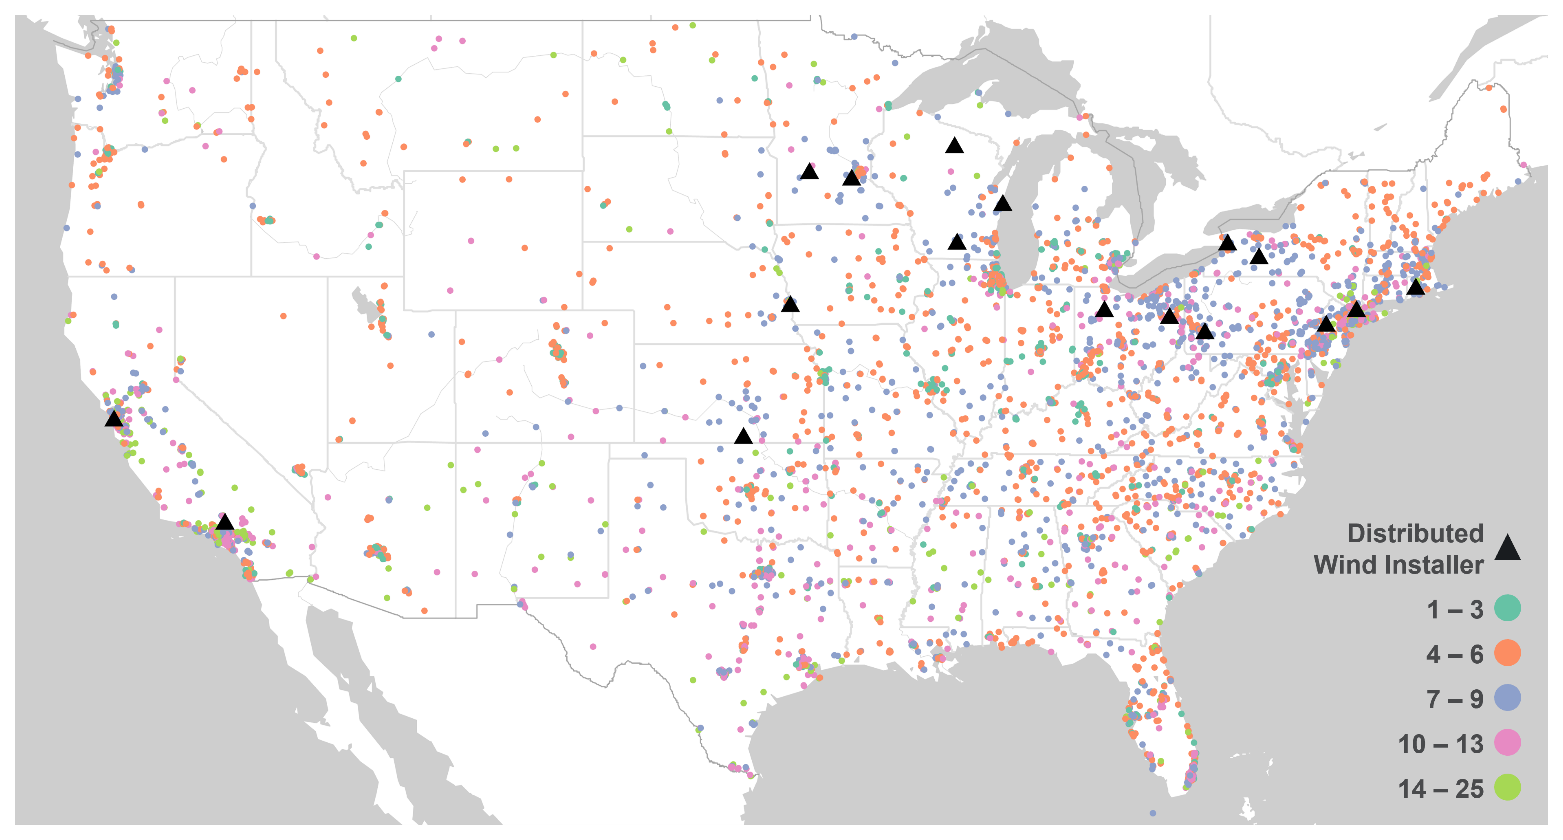
Figure 3Final score map for all institutions in the contiguous US with installers included.
A regional and institutional assessment gives insight into the distribution of scores. Figure 4 shows a breakdown of scores by institution type. In regions such as the Southwest (SW) and Southeast (SE), many high-scoring schools are MSIs (Fig. 4a) with scores of 10 or above but no nearby installers. This discrepancy indicates a potential challenge in aligning high-scoring academic institutions with local industry needs. Institutions located in regions characterized as rural by USDA REAP criteria scored higher due to their alignment with equity priorities. Additionally, areas that are wind-rich gave a small geographic advantage to institutions in these regions. Institutions within 100 mi of an installer (Fig. 4b) primarily scored in the 4 to 9 range, indicating the small impact of the proximity criteria on final scores. Institutions with scores 20 or above achieved those scores by fulfilling all socioeconomic and demographic criteria in addition to the maximum institution points (Fig. 4d).
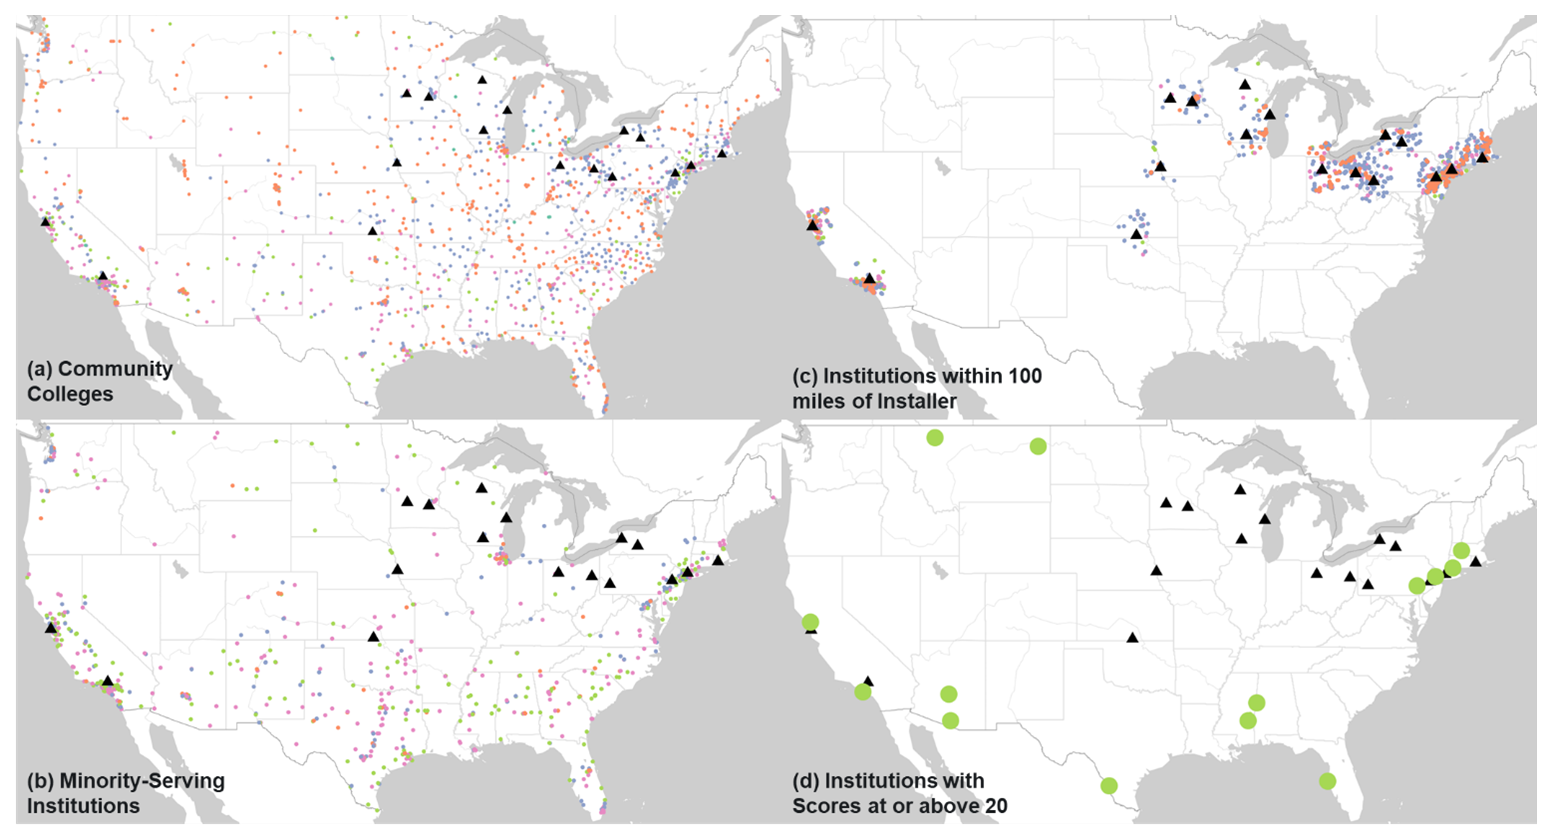
Figure 4Scores for (a) junior and community colleges, (b) MSIs, (c) institutions that meet the installer proximity criteria, and (d) institutions with scores above 20.
A further assessment of the score frequencies in Figure 5a shows a skewed right tail distribution, indicating that the majority of institutions scored below 9, with outliers above 15 and below 2. The right skew suggests that while most institutions have limited alignment with equity priorities, there are outliers where institutions score much higher. The 3 to 9 score range had the highest frequency, with about 65 % of institutions falling in this interval, reflecting the institutions with low socioeconomic and demographic scores and those with minimal points in the institution category. Scores above 15 are mostly MSIs and junior colleges with high scores in the location and socioeconomic categories.
The violin plots (Fig. 5b) are variations of the traditional box-and-whisker plots that provide insights into the variability of scores within each institutional category. The median scores for MSIs are notably the highest, likely reflecting these institutions' long-standing commitments to supporting underrepresented communities. The rubric weights capture this characteristic by giving 5 points to MSIs. In contrast, junior and community colleges exhibit the widest range and greatest variability in scores, which may reflect the diversity of student populations and resources available across different colleges. Institutions that do not fit into the MSI, junior college, women's college, or trade/technical school categories had the most outliers, with some institutions showing exceptional performance against the rubric and others not.
The distribution of scores also reflects deliberate weighting choices intended to target the most underrepresented groups in the DW workforce. For example, while women's colleges received points in the rubric, institutions serving racial and ethnic minority communities – such as MSIs – were weighted more heavily. This is because, although women remain underrepresented in DW, they currently make up a larger share of the workforce than most racial and ethnic minority groups (U.S. DOE, 2024a). As a result, institutions aligned with those demographics tended to score higher, particularly in the Southeast and Southwest regions, where MSIs are more prevalent. This outcome illustrates how the rubric's design prioritizes demographic groups with the most acute representation gaps, even if that means some institutions with strong equity credentials in other areas scored lower. These trade-offs highlight the normative dimensions of the rubric and the need for ongoing refinement to ensure transparency, balance, and alignment with evolving workforce priorities.
The multimodal nature of the distributions across all institutional categories suggests that each group has varied characteristics that would make it suitable for the workforce efforts. Some institutions may be well suited locationally, but because of their student population, they lose out on institutional points. Conversely, some institutions dominated the institution criterion but may not be located in census tracts that fit the rubric's socioeconomic and demographic requirements. These visualizations help illustrate the rubric's performance disparities and aid future refinement of the collaborator selection approach.
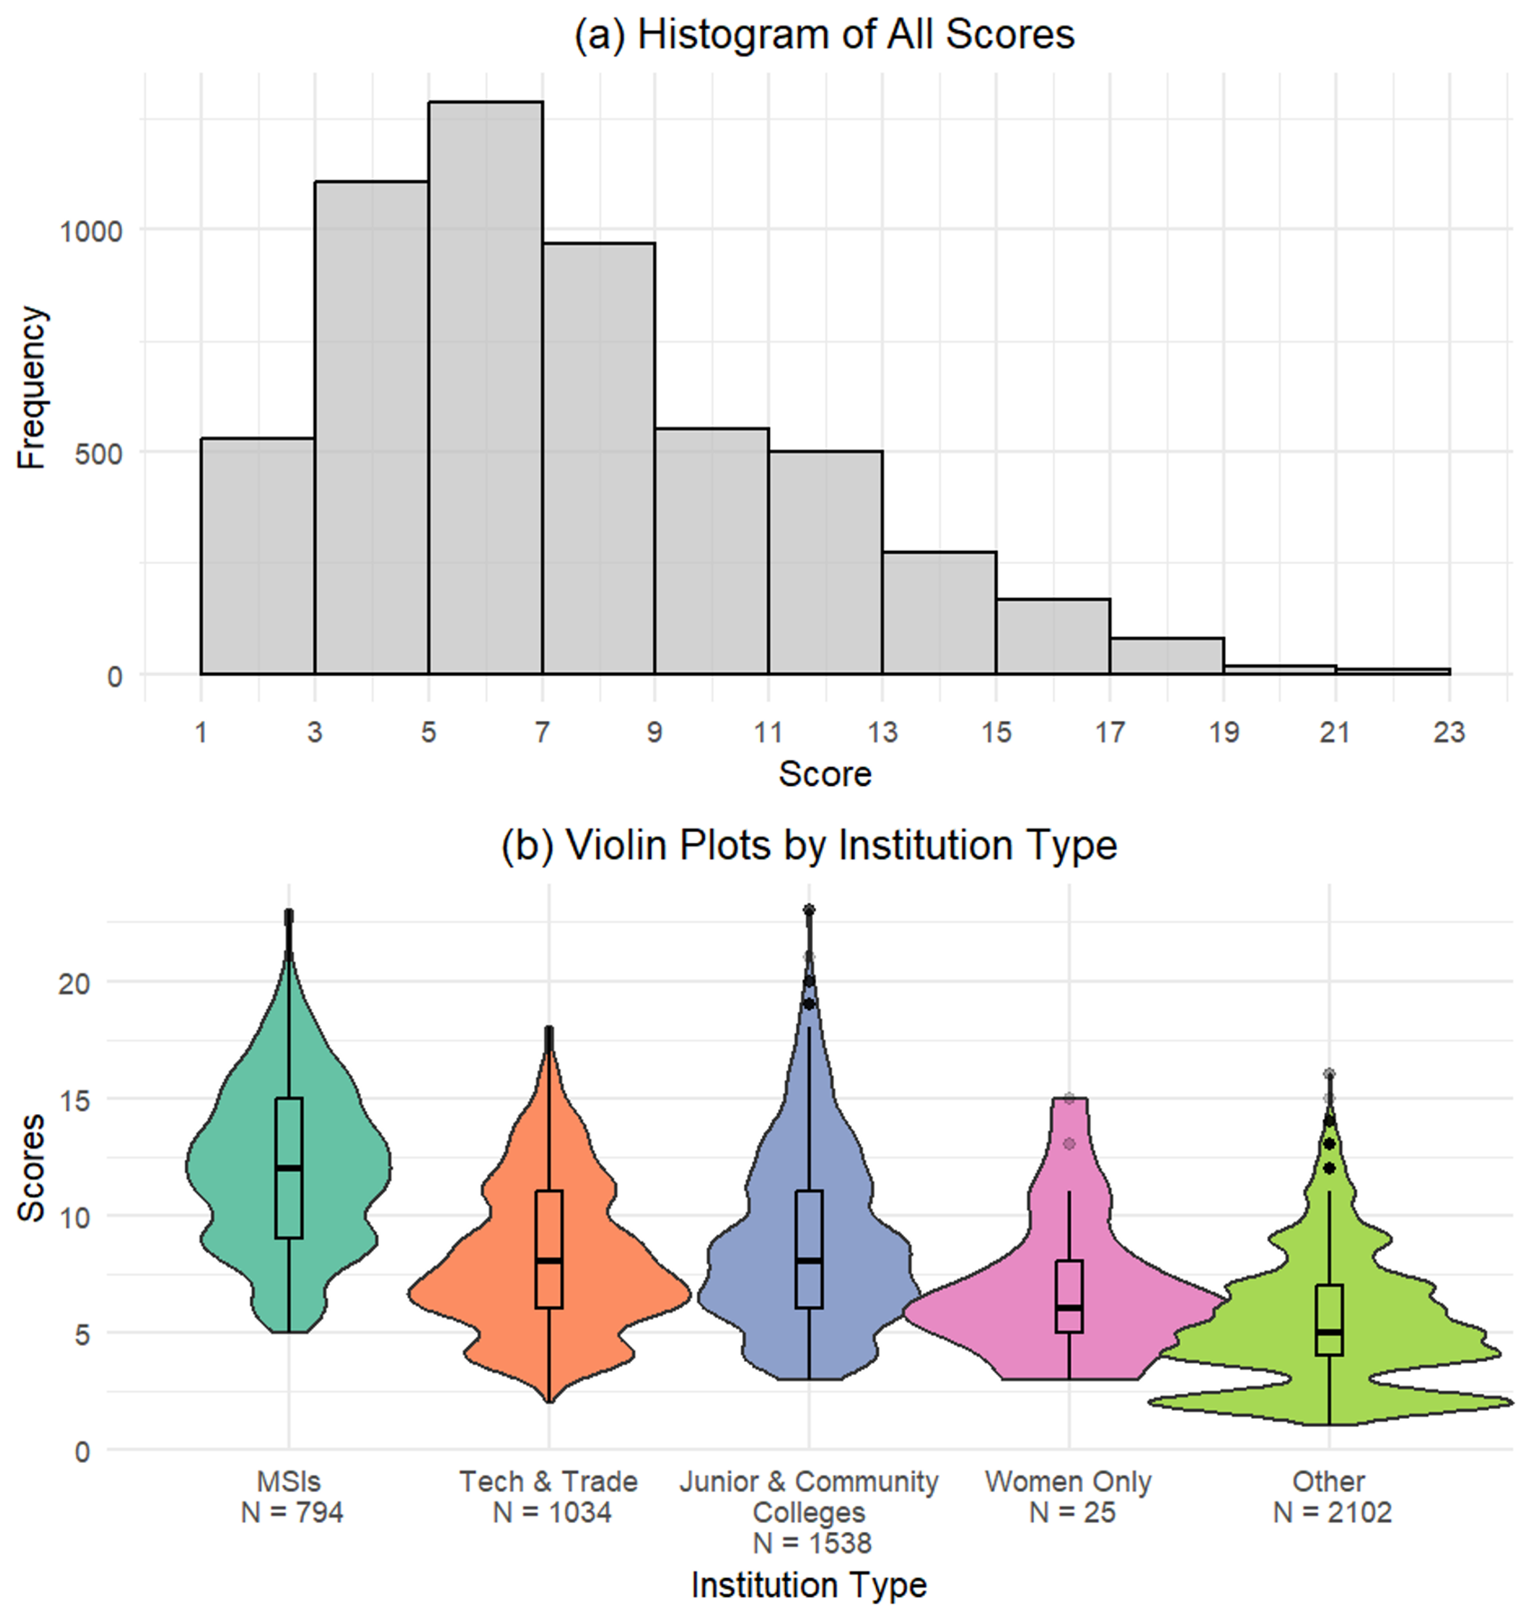
Figure 5The distribution of scores illustrated by (a) a histogram and (b) violin plots showcasing the interquartile ranges and distribution shapes by institution type. Note that total counts exceed 5106 due to institutions falling in multiple categories.
In evaluating the rubric's success in meeting project objectives, we can consider whether the rubric effectively prioritized institutions that support underserved and underrepresented communities, particularly in rural, wind-rich areas. The highest-scoring institutions do reflect these equity priorities. And, after performing outreach to these top-scoring institutions, those selected for final partnerships reflect a mix of institution types with varying geographic, institutional, and socioeconomic profiles.
However, there is inherent tension and trade-off in optimizing objectives. While the project aims to prioritize wind-rich areas, underrepresented institutions, and proximity to DW installers, achieving balance remains challenging. For example, some high-scoring institutions might not be located near DW installers. Rural areas and the Midwest and Northeast regions had institutions with scores above 20 that best balanced the workforce objectives. The small number of active installers (i.e., underdeveloped market) relative to institutions that meet some of the equity priorities influences this tension and reflects a challenge given the state of the industry. However, it also points to a gap and future research area that can refine the rubric's criteria.
Given that the DW industry network is relatively small with many key stakeholders already over-taxed through involvement in other DOE-based R&D efforts, the results point to new connections and partnership opportunities that can broaden the DOE's overall network. Leveraging workforce efforts for utility-scale or offshore wind is an option to expand partnerships. However, it demands considerable financial resources, staff time, and infrastructure, which DW companies might find challenging to secure. In addition, the DW sector boasts a multifunctional worker model requiring employees with broad abilities that are difficult to translate to the wind industry at large (Parker et al., 2024). Applying the rubric leverages the relatively small and overstretched DW industry network to locate new stakeholders aligning with the project's equity and workforce development objectives.
The application of the equity-driven rubric can serve as a strategic tool to identify and engage academic institutions and vocational programs in wind-rich, underserved areas that currently lack nearby DW installers. The DW workforce efforts can foster local workforce development, tailored curriculum building, and strategic partnerships by prioritizing MSIs and community colleges, particularly those scoring high on the rubric but lacking nearby installers. This approach can potentially attract new installers to the SE and SW regions by highlighting untapped market opportunities and demonstrating a ready and diverse workforce. These efforts, in turn, could motivate DW companies to expand their operations into these high-scoring areas, ultimately increasing the number of installers and developers in regions currently underserved by the industry.
With the collaborator analysis complete, the next steps for the workforce effort are to initiate outreach with the highest-scoring institutions and the installer in the closest proximity and work with selected collaborators to (a) outline workforce skill needs and place-based characteristics that can be strategically leveraged to support equitable workforce development through a series of workshops and (b) use the information gathered to blueprint locally tailored, industry-responsive training solutions that engage and prepare the next generation of wind energy workers. Although small in scale, these collaborative opportunities highlight a way to scale up equitable partnerships to address DW workforce needs more comprehensively.
Building on these opportunities, a recent effort to develop a workforce roadmap for the DW sector defined two goals essential for initiating workforce development (Parker et al., 2024). Goal 1 is to increase the interest, awareness, and visibility of the DW industry through new recruitment methods. Goal 2 is to meet the near-term need for multifunction workers while planning for long-term diversity of positions by identifying programs addressing distinct skill needs. Aligning these roadmap strategies with the equity-driven approach presents a timely opportunity to support longer-term workforce planning. While the workforce effort advances new partnerships to collaborate on local training solutions for future installation workers, the uptake of more DW will necessitate more holistic workforce development – requiring skill mapping to identify the types of positions, beyond installers and developers, supporting project rollout. Future efforts will also help us better understand the role of training program expansion in emerging or underdeveloped markets and how workforce development in these areas can support long-term industry growth and regional equity.
The data used are publicly available and can be accessed through HIFLD (2020), NASA (2024), US EPA (2024a), US EPA (2024b), and McCabe et al. (2022). The code is deposited in the Wind Energy Science journal's FAIR-aligned data repository at https://doi.org/10.5281/zenodo.17371486 (Parker, 2025).
The supplement related to this article is available online at https://doi.org/10.5194/wes-10-2351-2025-supplement.
K.P. designed the rubric and prepared the paper with contributions from all co-authors. D.P. and M.T. developed the code and performed the spatial and mapping implementation. K.K. and A.W. contributed to the paper writing and approach development.
The contact author has declared that none of the authors has any competing interests.
Publisher’s note: Copernicus Publications remains neutral with regard to jurisdictional claims made in the text, published maps, institutional affiliations, or any other geographical representation in this paper. While Copernicus Publications makes every effort to include appropriate place names, the final responsibility lies with the authors. Views expressed in the text are those of the authors and do not necessarily reflect the views of the publisher.
This article is part of the special issue “NAWEA/WindTech 2024”. It is a result of the NAWEA/WindTech 2024, New Brunswick, United States, 30 October–1 November 2024.
The authors thank the anonymous WES reviewers for their suggestions to improve the paper.
This research has been supported by the Department of Energy under grant no. DE-AC05-76RL01830.
This paper was edited by David Rudolph and reviewed by three anonymous referees.
ACP: Clean Energy Labor Supply, American Clean Power, https://cleanpower.org/wp-content/uploads/2021/06/ACP-Labor-Supply-Report.pdf (last access: 1 December 2024), 2021.
BW Research Partnership: Diversity in the U.S. Energy Workforce: Data Findings to Inform State Energy, Climate, and Workforce Development Policies and Programs, National Association of State Energy Officials, National Association of State Energy OfficialsDE-ED0000754, https://www.naseo.org/data/sites/1/documents/publications/Workforce%20Diversity%20Data%20Findings%20MASTER%20Final42.pdf (last access: 1 December 2024), 2021.
Climate Central: A Decade of Growth in Solar and Wind Power: Trends Across the U.S., https://assets.ctfassets.net/cxgxgstp8r5d/5Vty7kLXwx4csHEm4ztlJ7/a9f69694c2af467387cb3c088f171127/2024WindSolar_Edited.pdf (last access: 1 November 2024), 2024.
Garbe, J. T., Preziuso, D. C., Parker, K. M., White, A. L., Moncheur de Rieudotte, M. P., and Wells-Driscoll, J.: Journey Mapping Distributed Wind Deployment: Installer Perspectives, United States, Medium: ED, https://doi.org/10.2172/2462815, 2024.
Hallett, L.: New USDA/DOE Initiative to Help Farmers Access Wind Energy, https://www.usda.gov/about-usda/news/press-releases/2024/02/26/department-agriculture-department-energy-launch-initiative-help-farmers-reduce-costs-underutilized (last access: 26 October 2024), 2024.
Heffron, R. J. and McCauley, D.: The concept of energy justice across the disciplines, Energy Policy, 105, 658–667, https://doi.org/10.1016/j.enpol.2017.03.018, 2017.
HIFLD: Colleges and Universities, US Department of Homeland Security Geospatial Management Office [data set], https://catalog.data.gov/dataset/colleges-and-universities-a60d4 (last access: 11 October 2024), 2020.
International Labor Organization: Guidelines for a just transition towards environmentally sustainable economies and societies for all, International Labor Organization, Switzerland, https://www.ilo.org/sites/default/files/wcmsp5/groups/public/%40ed_emp/%40emp_ent/documents/publication/wcms_432859.pdf (15 October 2024), 2015.
IRENA and ILO: Renewable energy and jobs: Annual review 2024, International Renewable Energy Agency International Labour Organization, https://www.irena.org/-/media/Files/IRENA/Agency/Publication/2024/Oct/IRENA_Renewable_energy_and_jobs_2024.pdf (last access: 27 October 2024), 2024.
Jenkins, K., McCauley, D., Heffron, R., Stephan, H., and Rehner, R.: Energy justice: A conceptual review, Energy Research & Social Science, 11, 174–182, https://doi.org/10.1016/j.erss.2015.10.004, 2016.
Kresowik, M., Subramanian, S., Specian, M., Bradley-Wright, F., Ghosh, D., Mooney, P., Fraser, A., Sosa-Kalter, S., Fadie, B., and Mauer, J.: The 2025 State Energy Efficiency Scorecard, American Council for an Energy-Efficient Economy (ACEEE), Washington D.C., https://www.aceee.org/research-report/u2502 (last access: 20 October 2024), 2025.
Lanckton, T. and DeVar, S.: Justice in 100 Metrics: Tools for Measuring Equity in 100 % Renewable Energy Policy Implementation, https://iejusa.org/wp-content/uploads/2021/03/Justice-in-100-Metrics-2021.pdf (last access: 27 October 2025), 2021.
McCabe, K., Prasanna, A., Lockshin, J., Bhaskar, P., Bowen, T., Baranowski, R., Sigrin, B., and Lantz, E.: Distributed Wind Energy Futures Study, National Renewable Energy Laboratory, Golden, CONREL/TP-7A40-82519, https://www.nrel.gov/docs/fy22osti/82519.pdf (last access: 5 October 2024), 2022.
McDermott-Murphy, C.: Wind Energy Needs More Workers – and Fast,Office of Energy Efficiency and Renewable Energy, Department of Energy, https://windexchange.energy.gov/news/7181 (last access: 27 October 2024), 2024.
McDowell, B., Stefek, J., Smith, E., Pons, B., and Ahmad, Q.: National Wind Energy Workforce Assessment: Challenges, Opportunities, and Future Needs, National Renewable Energy Laboratory, https://www.nrel.gov/docs/fy24osti/87670.pdf (last access: 5 October 2024), 2024.
NABCEP: Small Wind Certification Comes to NABCEP, https://www.nabcep.org/news/small-wind-certification-comes-to-nabcep/ (last access: 1 November 2024), 2010.
NABCEP: NABCEP Certification Handbook, North American Board of Certified Energy Practitioners, Inc., https://www.nabcep.org/wp-content/uploads/2018/02/NABCEP-Certification-Handbook-V2018.compressed.pdf (last access: 23 October 2025), 2018.
NASA: Minority Serving Institutions Exchange [data set], https://msiexchange.nasa.gov/institutions (last access: 1 October 2025), 2024.
National Academies of Sciences, Engineering, Medicine (NASEM): Accelerating Decarbonization of the U.S. Energy System, The National Academies Press, Washington, DC, 268 pp., https://doi.org/10.17226/25932, 2021.
National Renewable Energy Laboratory (NREL): Competitiveness Improvement Project: https://www.nrel.gov/wind/competitiveness-improvement-project.html (last access: 15 October 2024), 2024a.
National Renewable Energy Laboratory (NREL): Distributed Wind Annual Technology Baseline, https://atb.nrel.gov/electricity/2024/distributed_wind (last access: 20 October 2024), 2024b.
Orrell, A., Sheridan, L., Kazimierczuk, K., and Fensch, A.: Distributed Wind Market Report: 2023 Edition, U.S. Department of Energy PNNL-34661, https://www.energy.gov/sites/default/files/2023-08/distributed-wind-market-report-2023-edition_0.pdf (last access: 13 October 2024), 2023.
Oteri, F. and Sinclair, K.: Certification for Small Wind Turbine Installers: What's the Hang Up?, Preprint, United States, https://docs.nrel.gov/docs/fy12osti/54411.pdf (last access: 26 October 2024), 2012.
Parker, K. M., Fensch, A. M., Kazimierczuk, K., Barrows, S. E., and Tarekegne, B. W.: Energy Equity Opportunities in Distributed Wind Hybrid Systems for Rural Loads, United States, https://doi.org/10.2172/2001005, 2023.
Parker, K. M., Esaki-Kua, L. A., and Preziuso, D. C.: Towards a Workforce Roadmap for Distributed Wind: Phase 1 – Identifying Needs and Barriers, Pacific Northwest National Laboratory, PNNL-36420, https://www.osti.gov/biblio/2440158 (last access: 14 October 2024), 2024.
Parker, K.: Code and data repository for “Building a diverse and equitable distributed wind workforce: a strategic approach to collaborator selection”, GitHub [code], https://doi.org/10.5281/zenodo.17371486, 2025.
Preziuso, D., Orrell, A., and Lantz, E.: Categorizing distributed wind energy installations in the United States to inform research and stakeholder priorities, Energy, Sustainability and Society, 12, 31, https://doi.org/10.1186/s13705-022-00357-1, 2022.
Schlosberg, D.: Reconceiving Environmental Justice: Global Movements And Political Theories, Environmental Politics, 13, 517–540, 10.1080/0964401042000229025, 2004.
Sheridan, L. M., Kazimierczuk, K., Garbe, J. T., and Preziuso, D. C.: Distributed Wind Market Report: 2024 Edition, United States, 60 pp., https://doi.org/10.2172/2428926, 2024.
Stefek, J., Christol, C., Smith, T. R., Kotarbinski, M., and McDowell, B.: Defining the Wind Energy Workforce Gap, National Renewable Energy Laboratory, https://www.nrel.gov/docs/fy23osti/82907.pdf (last access: 5 October 2025), 2022.
Tapio, R. M. and Preziuso, D. C.: Distributed Wind and Impacts of FERC Order No. 2222 Implementation, Pacific Northwest National Laboratory (PNNL), Richland, WA (United States), United States, 21 pp., https://doi.org/10.2172/2429341, 2024.
Tarekegne, B. W., Pennell, G. R., Preziuso, D. C., and O'Neil, R. S.: Review of Energy Equity Metrics, https://www.pnnl.gov/main/publications/external/technical_reports/PNNL-32179.pdf (last access: 1 October 2024), 2021.
U.S. DOE: United States Energy & Employment Report 2024, U.S. Department of Energy, https://www.energy.gov/sites/default/files/2024-08/2024%20USEER%20FINAL.pdf (last access: 2 October 2024), 2024a.
U.S. DOE: RAISE Initiative, https://www.energy.gov/eere/wind/raise-initiative, last access: 15 October 2024b.
US DOE EERE: Advancing the Growth of the U.S. Wind Industry: Federal Incentives, Funding, and Partnership Opportunities, https://www.energy.gov/sites/default/files/2023-04/eere-wind-weto-funding-taxday-factsheet-fy23.pdf (last access: 22 October 2024), 2023.
US DOE EERE: Local Benefits of Distributed Wind, Energy Efficiency and Renewable Energy, https://www.pnnl.gov/sites/default/files/media/file/Local-Benefits-Distributed-Wind-April-2024.pdf (last access: 1 November 2024), 2024.
US DOL: Apprenticeship Programs [data set], https://www.dol.gov/agencies/eta/apprenticeship/about/statistics/2021 (last access: 29 October 2024), 2021.
US EPA: EJSCREEN, United States Environmental Protection Agency [code], https://pedp-ejscreen.azurewebsites.net/ (last access: 27 October 2024), 2024a.
US EPA: EJScreen Technical Documentation, Version 2.3, Washington, D.C., https://www.epa.gov/system/files/documents/2024-07/ejscreen-tech-doc-version-2-3.pdf (last access: 16 October 2024), 2024b.
van Uffelen, N.: Revisiting recognition in energy justice, Energy Research & Social Science, 92, 102764, https://doi.org/10.1016/j.erss.2022.102764, 2022.
Manufacturers and installers were provided identical surveys. There are manufacturers that identified themselves as also conducting turbine construction and thus provided responses for the construction and development segments.
RAPs were not awarded additional points beyond the 2 allocated for all technical and trade programs.
All locations not in “ineligible areas” meet the USDA's definition of rural for REAP applications, which is a target funding source for the RAISE initiative: https://eligibility.sc.egov.usda.gov/eligibility/welcomeAction.do;jsessionid=sbaz4pqebSEqobTswlZfSdIM (last access: 1 October 2024).
Threshold CapEx is an indicator of the amount of capital that could be invested for a system at a specific site while still maintaining profitability; higher threshold CapEx values mean higher favorability for DW energy.
Spatially joined refers to the process of combining two datasets based on their geographic relationship or spatial proximity, rather than their attributes alone. This means that features from one dataset are linked to features in another dataset based on their locations (e.g., points, lines, or polygons) within a defined spatial area.