the Creative Commons Attribution 4.0 License.
the Creative Commons Attribution 4.0 License.
 | 01 Dec 2025
Fault detection in wind turbines using health index monitoring with variational autoencoders
Shun Wang
Francesc Pozo
As wind energy capacity expands globally, ensuring the operational reliability and economic viability of wind turbines has become a critical industrial challenge. Effective fault detection systems are essential for minimizing high maintenance costs and preventing catastrophic failures. To address this need, this paper presents a semi-supervised framework designed to identify anomalies in wind turbines using only healthy operational data. The methodology begins by extracting a comprehensive set of features from the time and frequency domains of raw vibration signals to capture a rich representation of the dynamics of wind turbines. A variational autoencoder, a deep generative model, is then trained exclusively on these features from healthy operational periods to learn a robust model of normal behavior and generate reconstruction errors as health indicators with exponentially weighted moving average smoothing to enhance robustness and reduce false alarms. The framework is evaluated using public data from the Aventa AV-7 ETH Zurich research wind turbine, which includes multiple failure events. Experimental results demonstrate effective and early detection of pitch faults, as well as accurate detection of icing events and aerodynamic imbalances. The proposed approach therefore offers a robust and practical solution to improving operational safety and enabling proactive maintenance of wind turbines.
- Article
(8119 KB) - Full-text XML
- BibTeX
- EndNote


Wind energy has become a major renewable technology, with global installed capacity reaching 1136 GW in 2024 (Council, 2025). Despite this growth, the increasing deployment of wind turbines, particularly in remote and challenging offshore environments, has underscored significant operational and maintenance (O&M) challenges. These challenges directly threaten the economic viability of wind energy projects, as O&M costs can constitute 20 %–30 % of the levelized cost of electricity (Ren et al., 2021; Irena, 2018).
Wind turbines operate in highly dynamic and stressful conditions, experiencing aerodynamic, gravitational, centrifugal, gyroscopic, and hydrodynamic loads (Badihi et al., 2022). These harsh operational environments, combined with the remote locations of wind installations, make turbines particularly susceptible to component failures and premature degradation. Consequently, there is an urgent and critical need for effective condition monitoring and predictive maintenance strategies to improve turbine reliability and reduce operational expenditures.
Prognostics and health management (PHM) has become an indispensable framework to optimize wind turbine maintenance (Cuesta et al., 2025). PHM encompasses three core tasks: fault detection (identifying when a fault occurs), fault diagnosis (determining the type and location of the fault), and prognostics (predicting the remaining useful life of the components) (Cuesta et al., 2025). Among these, fault detection represents the foundation for effective maintenance strategies, enabling early identification of component degradation before failures occur.
Modern wind turbines are equipped with both supervisory control and data acquisition (SCADA) systems and high-frequency condition monitoring systems (CMSs). While SCADA systems provide low-frequency (e.g., 10 min intervals) operational data, CMSs, particularly through vibration monitoring, capture high-frequency signals essential for health assessment. Vibration signals contain rich and detailed information about the health of rotating machinery, revealing characteristic fault signatures in components such as blades, gearboxes, and bearings that are undetectable in SCADA data (Ashkarkalaei et al., 2025; Castellani et al., 2024).
Current fault detection approaches are broadly categorized into model-based methods (Habibi et al., 2019) and data-driven approaches (Abid et al., 2021; Chesterman et al., 2023). Model-based methods use relevant professional knowledge to establish physical representations based on first principles but are often difficult to generalize and require constant updates to reflect real-world operational complexities (Dey et al., 2015; Ashkarkalaei et al., 2025). In contrast, data-driven methods have gained significant traction by learning directly from sensor data without the need for an explicit physical model (Pandit and Wang, 2024; Xu et al., 2024; Rezamand et al., 2020). Early data-driven techniques focused on the use of signal processing to extract statistical features and health indices (HIs) from time-domain (Wang et al., 2025b) and frequency-domain data (Jiang et al., 2011; Ying et al., 2025). More recently, advances in machine learning, and deep learning in particular, have enabled the automatic extraction of complex patterns. Architectures such as convolutional neural networks (Jiang et al., 2018), recurrent neural networks (Yu et al., 2020; Encalada-Dávila et al., 2022), and autoencoders (AEs) (Chen et al., 2021; Wang et al., 2025a) are now widely used to improve fault detection performance.
However, existing data-driven approaches for vibration analysis have predominantly focused on single-channel signals, thereby overlooking the rich, system-level information available in a multi-channel wind turbine setup. Effectively utilizing such data presents several key challenges. First, the high dimensionality of raw multi-channel vibration signals leads to increased computational burden and can cause overfitting when training samples are limited, as models may capture spurious correlations rather than true operational patterns. Feature extraction addresses these challenges by reducing the input space to a manageable set of physically interpretable features. Second, the scarcity of labeled fault data in operational settings makes supervised learning impractical. Furthermore, the inherent variability of operating conditions (for example, wind speed) can cause anomaly detection models like traditional AEs to produce false alarms, affecting their reliability. Therefore, a robust fault detection framework must effectively handle high-dimensional data, operate without fault examples, and provide stable indications of degradation.
To address the unique challenges of analyzing multi-channel vibration data, this study introduces an integrated fault detection framework. To manage the high dimensionality and complexity inherent in the raw signals, the framework first employs a feature engineering module. This step extracts a comprehensive set of features from the multi-channel vibration data and concatenates them into a unified, system-level feature vector, making the subsequent learning task more tractable and effective. To overcome the common issue of scarce fault data in industrial settings, our framework then utilizes a semi-supervised learning paradigm centered on a variational autoencoder (VAE). By training on data from healthy operations, the VAE learns a robust probabilistic model of the system's normal behavior. Finally, to ensure stable and reliable detection while minimizing false alarms caused by operational variability, the raw reconstruction error from the VAE is processed using an exponentially weighted moving average (EWMA). This post-processing step smooths the resulting health index, effectively filtering transient noise while highlighting persistent trends indicative of true degradation.
The effectiveness of the framework is demonstrated on the Aventa AV-7 ETH Zurich research wind turbine (Chatzi et al., 2023). The experimental results show early detection of pitch faults and accurate identification of icing events and aerodynamic imbalances. This work has been developed to participate in the ASCE-EMI Structural Health Monitoring for Wind Energy Challenge (WeDoWind, 2025), which is part of the WeDoWind RTDT Research Affiliate Program space, and in collaboration with the ASCE Structural Health Monitoring & Control Committee.
This section reviews data-driven fault detection methods for wind turbines, first by explaining the different machine learning paradigms and then by focusing on autoencoder-based models commonly used for anomaly detection.
2.1 Learning paradigms for wind turbine fault detection
Machine-learning- and deep-learning-based fault detection methods are typically categorized into supervised, unsupervised, and semi-supervised approaches. Supervised methods are powerful but depend on large and accurately labeled datasets that represent both normal and various faulty states (Dibaj et al., 2023; Yang et al., 2024). However, these methods face significant practical limitations in the wind energy domain due to the diverse and unpredictable nature of faults and the immense difficulty of obtaining a comprehensive, labeled dataset for every possible failure mode (Rezamand et al., 2020). Collecting such data on site is both challenging and time-consuming, limiting the applicability of supervised approaches.
Unsupervised learning operates on entirely unlabeled datasets, attempting to identify anomalies without any prior knowledge of the turbine's health status. The core assumption is that faults are rare and structurally distinct from the majority of the data. Models such as the isolation forest (Xu et al., 2023) or clustering-based algorithms work by identifying these lonely points that are few and different. However, this poses a challenge in complex operational settings. The primary limitation is the inability to differentiate between a genuine, subtle fault and a benign but infrequent operational state (e.g., a specific startup sequence or emergency stop). Since the model lacks a defined concept of normal, any rare event can be flagged as an anomaly, which can lead to a high false alarm rate.
Semi-supervised learning, particularly methods focused on normal behavior modeling, presents a pragmatic and effective compromise. In this paradigm, a model is trained exclusively on healthy turbine operational data, which allows it to develop a detailed understanding of normal behavior (Chesterman et al., 2023). These approaches avoid the need for labeled fault data, relying on the assumption that anomalies will manifest as deviations from normal operational patterns. This paradigm includes various strategies, including regression-based (Encalada-Dávila et al., 2022; Bilendo et al., 2023), reconstruction-based (Jin et al., 2024; Wu et al., 2023; Chen et al., 2023), and one-class classification methods (Tutivén et al., 2022). Among these methods, autoencoder-based reconstruction methods, which learn to recreate healthy data from a compressed representation, have become particularly prominent.
2.2 Autoencoder-based anomaly detection and health index construction
Within the semi-supervised framework, autoencoders and their variants have become prominent models for anomaly detection. The fundamental principle is to train a model to accurately reconstruct its input data. When trained exclusively on healthy data, the AE learns a compressed representation of normal operational patterns. Consequently, it will exhibit a low reconstruction error (RE) for healthy, seen data but a significantly higher RE for unseen, anomalous data. This RE is a powerful and widely used foundation for building a health index, where increasing RE values signal potential degradation (Jiang et al., 2017).
The research community has progressively improved AE architectures to improve the performance of wind turbine fault detection. For example, Jiang et al. (2017) employed a denoising autoencoder, while Chen et al. (2020) used stacked denoising autoencoders to improve robustness. Wang et al. (2022) proposed an improved autoencoder specifically designed to improve the accuracy of fault detection. More complex models have also been developed by integrating AEs with other deep learning techniques. For example, long short-term memory and autoencoder (LSTM-AE) networks (Chen et al., 2021) capture temporal dependencies in the data, enhancing the model's ability to detect subtle fault patterns over time. Similarly, convolutional neural network and conditional variational autoencoder (CNN-CVAE) models (Liu et al., 2022) and long short-term memory and stacked denoising autoencoder (LSTM-SDAE) models (Zhang et al., 2022) have been proposed to further improve detection capabilities.
Among these autoencoder variants, variational autoencoders offer particular advantages for wind turbine fault detection. Unlike the deterministic autoencoders described above, which learn fixed point-to-point mappings, VAEs employ a probabilistic framework that models underlying data distributions. This distinction is especially valuable for wind turbine applications where vibration signals exhibit inherent variability even during healthy operation due to load fluctuations, speed variations, environmental factors, and measurement noise. The probabilistic approach provides better generalization, reduces overfitting risk, and maintains robust performance even with limited training data.
Despite these architectural advances, significant challenges persist, particularly when applying these models to the high-dimensional, multi-channel vibration data addressed in this paper. First, the direct application of these models to high-dimensional raw vibration signals can obscure fault signatures and increase the complexity of the model. Second, the raw HI derived from the reconstruction error is often volatile and susceptible to fluctuations from varying operational conditions, leading to false alarms. To address these, the proposed method begins with targeted feature engineering to distill robust, low-dimensional inputs from raw signals. A variational autoencoder is then employed, which is a probabilistic generative model known for its ability to learn a smooth, well-regularized representation of normal behavior. Finally, a post-processing step is used, applying an exponentially weighted moving average to the VAE's reconstruction errors for a stable and reliable HI.
This section provides the key components of the framework, including feature extraction, the variational autoencoder, and the application of an exponentially weighted moving average for anomaly detection.

Figure 1An overview of the proposed framework. Initially, the time-domain and frequency-domain features of a single vibration signal are first extracted. The extracted features are then encoded into a latent distribution characterized by a mean vector (μ) and a standard deviation vector (σ). A latent vector z is sampled from this distribution and passed through the decoder to reconstruct these features. The reconstruction process is guided by a loss function that combines reconstruction loss and Kullback–Leibler (KL) divergence.
Table 1Formulae for the selected features in time and frequency domains.
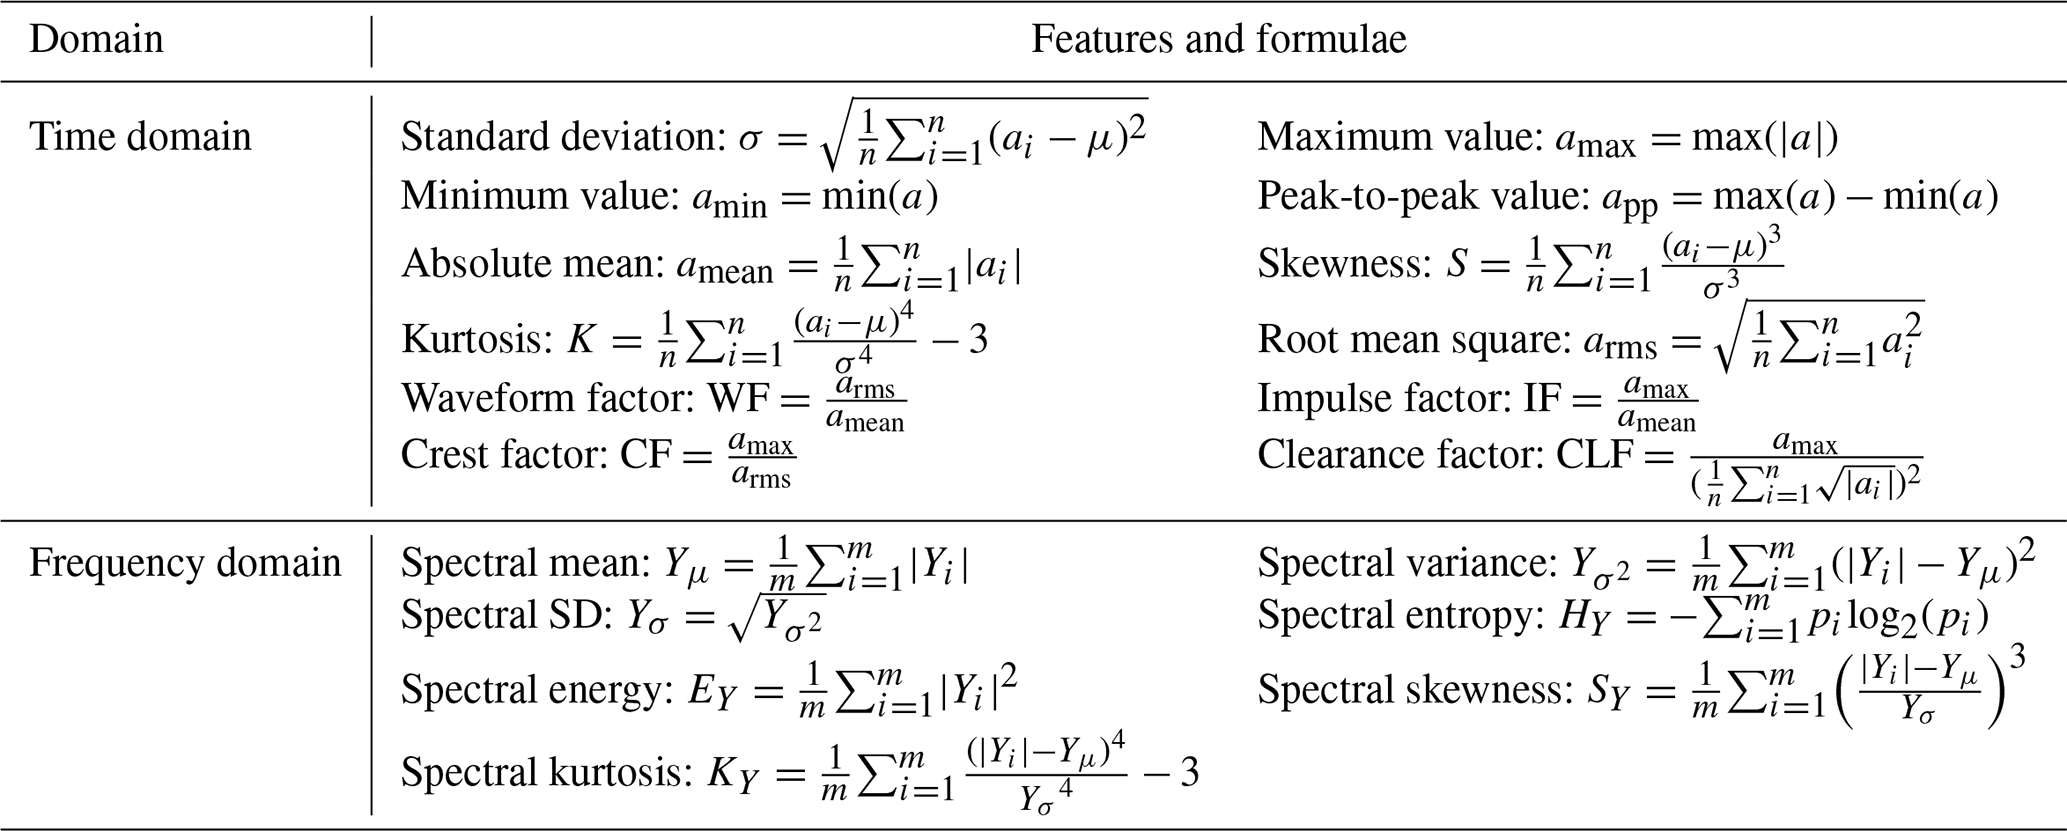
Note: {ai} represents the time-domain vibration signal, n is the total number of sampling points, μ is the mean, σ is the standard deviation, arms is the RMS, amean is the absolute mean, and amax, amin denote maximum and minimum values. {Yi} represents the magnitude of frequency components from FFT, m is the number of frequency bins, and .
3.1 Overview
The general structure of the framework is illustrated in Fig. 1. It begins by extracting features from raw vibration signals, which capture critical time- and frequency-domain characteristics. These extracted features are then input to the VAE, which encodes them into a low-dimensional latent space. To ensure the latent space is continuous and well-structured, it is regularized to approximate a multivariate standard normal distribution 𝒩(0,I), a standard choice in VAE formulations that enables tractable optimization through closed-form Kullback–Leibler (KL) divergence computation (Doersch, 2016). The decoder then reconstructs the input features from this latent representation. The reconstruction process within the VAE is guided by a loss function that combines the reconstruction loss and KL divergence, ensuring accurate reconstruction and effective latent space regularization.
3.2 Feature extraction
Feature extraction is performed on each vibration sample to characterize the dynamic behavior of the turbine. A total of 19 distinct time-domain and frequency-domain features are extracted, as detailed in Table 1. These features are selected based on their demonstrated effectiveness in structural health monitoring and fault detection for rotating machinery and wind turbine components (Ding et al., 2021; Li et al., 2024; Sandoval et al., 2021; Zhou et al., 2022). Specifically, time-domain features provide insight into statistical and physical properties, such as signal variability, energy, and peaks, which are essential for identifying transient faults and irregular patterns. On the other hand, frequency-domain features capture the spectral characteristics of the vibration signal, enabling the identification of fault-specific harmonics and energy distributions. By integrating features from both domains, a holistic representation of the signal is achieved, enhancing the robustness and reliability of anomaly detection.
For frequency-domain feature extraction, the fast Fourier transform (FFT) is applied to each sample (2000 data points, corresponding to 10 s of operation at a 200 Hz sampling rate). The FFT converts the time-domain vibration signal into the frequency domain, yielding complex-valued frequency components , where m is the number of frequency bins. The magnitude spectrum is computed, and the normalized power distribution is used for spectral entropy calculation. The seven frequency-domain features, including spectral mean, variance, standard deviation, entropy, energy, skewness, and kurtosis, are then computed based on this magnitude spectrum, as defined in Table 1.
It is important to acknowledge that the features selected in this study are general statistical and spectral indicators rather than wind-turbine-specific characteristics. Previous research has demonstrated the effectiveness of physics-informed features such as rotor frequency (1P), blade passing frequency (3P for three-bladed turbines), structural modal frequencies, damping ratios, and mode shapes for detecting specific fault mechanisms (Bertelè et al., 2018; Riva et al., 2016; Cacciola et al., 2016; Chen and Griffith, 2023). These turbine-specific features can directly reveal whether, for example, a mass imbalance has increased 1P amplitude or whether aerodynamic asymmetries are affecting 3P harmonics, offering superior physical interpretability. Our choice of general features avoids the need for detailed system identification or turbine-specific modeling, enabling broader applicability across different turbine models.
3.3 Variational autoencoder
Following the extraction of features, the resulting feature vector, denoted as x∈ℝN, is processed using a variational autoencoder to model the feature distribution of normal operational data. The VAE framework consists of two main components: an encoder, , which maps features x into a latent distribution characterized by mean μ∈ℝM and variance σ2∈ℝM, and a decoder, , which reconstructs the original features x from the latent codes z∈ℝM, where M is the latent space dimension. The structure of the VAE model is illustrated in Fig. 1.
Unlike traditional deterministic autoencoders that learn point-to-point mappings, VAEs employ a probabilistic framework that models data distributions rather than individual data points (Doersch, 2016; Kingma and Welling, 2014). This probabilistic nature makes VAEs particularly suitable for fault detection applications where there are inherent signal variations even in healthy machinery due to factors such as load fluctuations, speed variations, or measurement noise (Yan et al., 2021). Traditional autoencoders minimize reconstruction loss through deterministic mapping. In contrast, VAEs learn the underlying probability distribution pdata(x) using latent variables z through variational inference (Mylonas et al., 2021; Doersch, 2016). The encoder Qϕ(x) outputs parameters of a multivariate Gaussian distribution (mean μ(x) and variance σ2(x)) (Singh et al., 2024, 2025), while the decoder Pθ(z) reconstructs features from sampled latent codes. This probabilistic approach enables better handling of data variability.
The VAE is trained to maximize the evidence lower bound (ELBO) by minimizing the combined loss of reconstruction error and KL divergence. The reconstruction loss measures the difference between the original input data and its reconstruction from the latent space. This loss ensures that the VAE accurately captures the underlying structure of the features. The reconstruction loss is defined as
where xi∈ℝN represents the ith input feature vector, is the reconstructed feature vector, and n is the total number of samples in the batch. This loss encourages the encoder Qϕ and decoder Pθ to work together to reconstruct the input x as accurately as possible.
In addition to the reconstruction loss, the VAE incorporates a KL divergence loss, which ensures that the learned latent codes z approximate a prior distribution, typically a multivariate standard normal distribution 𝒩(0,I), where 0 is the zero vector, and I is the identity matrix (Doersch, 2016). The KL divergence loss (Rolinek et al., 2019) is given by
where μi,j and σi,j are the mean and standard deviation for the jth dimension of the latent variable zi, and M is the dimensionality of the latent space. This loss term ensures that the distribution of latent variables remains close to the desired prior distribution.
The total loss function for the VAE combines the reconstruction loss and the KL divergence loss:
By minimizing this total loss during training, the VAE learns to capture meaningful latent representations that can be used for fault detection and assessment. To enable backpropagation through the stochastic sampling process, the reparameterization trick (Doersch, 2016) is employed. Specifically, the latent variable z is expressed as
where εi∈ℝM is a random vector sampled from a multivariate standard normal distribution, ⊙ denotes element-wise multiplication (Hadamard product), and are the mean and standard deviation vectors predicted by the encoder network. This reparameterization allows the gradients to flow through μ and σ during optimization, enabling efficient training of the VAE. The training procedure is detailed in Algorithm 1.
Algorithm 1Training procedure for the proposed fault detection method.
In this work, the input and output layers of the VAE each contain N = 266 neurons, corresponding to the 266 features derived from vibration signal analysis (19 time- and frequency-domain features from 14 channels). This ensures that the network can encode and reconstruct the complete set of features effectively. The encoder compresses the input data through three hidden layers with 128, 64, and 32 neurons, respectively, each followed by batch normalization and ReLU activation to ensure stable and efficient training. The latent space is represented by two fully connected layers: one for the mean (M = 16 neurons) and one for the log variance (M = 16 neurons), resulting in a latent representation size of M=16. The decoder reconstructs the input features by symmetrically expanding the latent representation through layers with 32, 64, and 128 neurons, before mapping it back to the original N-dimensional space in the output layer. Batch normalization and ReLU activations are also used in the decoder to maintain stability and improve performance.
3.4 Exponentially weighted moving average
The exponentially weighted moving average is applied as the final step in monitoring the health of the wind turbine. This statistical tool is particularly effective in detecting small shifts or trends in data over time, making it ideal for fault detection in wind turbines (Sun et al., 2023; He et al., 2023). The EWMA smooths the reconstruction errors (REs) obtained from VAE, reducing noise and highlighting deviations indicative of potential faults.
The EWMA statistic, denoted as Zt, is calculated recursively as
where REt is the reconstruction error at time t, and λ is the smoothing parameter (), controlling the influence of recent errors versus historical trends. The smoothing parameter λ controls the sensitivity of the EWMA. Smaller values of λ assign more weight to historical data, reducing the impact of short-term fluctuations and producing a smoother curve. This increases stability but may delay the detection of abrupt changes. On the other hand, larger values of λ give more weight to recent errors, making the chart more sensitive to sudden deviations but potentially more prone to false alarms caused by noise. In monitoring applications, the typical values for λ are between 0.05 and 0.3 (He et al., 2023; Su et al., 2022; Liu et al., 2021). In this study, λ, set to 0.2, is selected as a compromise, providing a balance that allows the EWMA to respond to significant anomalies while maintaining robustness against transient noise.

3.5 Proposed HI construction method
The proposed health index construction method, as outlined in Fig. 2, consists of a training stage and a monitoring stage, with the following detailed steps.
Training stage
In the training stage, historical vibration data collected during the normal operation of the wind turbine are first preprocessed to remove outliers and trends, ensuring that the dataset accurately reflects the normal behavior of the turbine. The data are then divided into training and validation samples. Training samples are used to extract features and train the model, while validation samples are used to set threshold limits to decide when a sample is diagnosed as faulty. Features are extracted from both the time and the frequency domains to comprehensively characterize the signal's dynamics, resulting in 19 distinct attributes that capture critical aspects of the vibration signals. A VAE model is then trained on the features extracted from the training samples to learn the normal operating patterns of the turbine. The VAE encodes these features into a latent space and reconstructs them, minimizing the reconstruction error for normal data.
Once the VAE model is trained, the REs are computed for both the training and the validation datasets. These REs are then smoothed using an EWMA, which reduces noise and highlights trends in the data. The threshold for anomaly detection is set as the maximum EWMA value observed in the combined training and validation datasets. This threshold serves as the baseline for distinguishing normal from abnormal conditions during monitoring. This approach is rooted in the assumption that the training and validation datasets represent normal and healthy turbine operations. Since these datasets are drawn exclusively from normal conditions, no alarms should be triggered within them. Thus, the maximum EWMA value from these datasets serves as a reliable benchmark or threshold: it represents the upper limit of what can be considered normal for healthy turbine operations.
Monitoring stage
In the monitoring stage, real-time vibration data collected during turbine operations undergo the same preprocessing and feature extraction steps as in the training stage. The extracted features are then inputted into the trained VAE, which computes the reconstruction errors for each test sample. These reconstruction errors are fed into the EWMA, which tracks deviations from the normal operational baseline established during the training stage. The EWMA smooths the fluctuations in reconstruction errors, enabling the detection of gradual trends or abrupt changes. If the EWMA value exceeds the predefined threshold, the turbine condition is marked as abnormal, signaling the potential onset of a fault. In contrast, if the HI remains within the threshold, the turbine is classified as operating under normal conditions.
This section details the experimental validation of the proposed fault detection framework. It begins by describing the dataset and the specific fault scenarios used, followed by a summary of the data preprocessing steps, and finally, a thorough presentation and discussion of the monitoring results.

Figure 3Sensor layout for wind turbine measurements (Chatzi et al., 2023): (a) diagram of the sensor placement on the nacelle, (b) accelerometers mounted on the nacelle main frame, (c) accelerometers installed on the bearing housing and generator, and (d) accelerometers positioned on the tower top transition piece.
4.1 Experimental dataset description
The experimental dataset used is sourced from the Aventa AV-7 research wind turbine, located in Taggenberg, which is managed by the ETH Zurich Department of Structural Health Monitoring (Chatzi et al., 2023). To comprehensively monitor the operational health of the wind turbine, vibration sensors are placed in critical locations, including the tower, the nacelle, the main shaft bearing, and the generator, as shown in Fig. 3. These locations are chosen because they represent key components of the turbine where faults, such as structural instability, aerodynamic imbalances, or mechanical wear, are most likely to originate or propagate. By analyzing the vibration signals from these locations, the framework is able to capture a wide range of potential anomalies.
Table 2Channel names and corresponding locations of vibration signals used in the analysis.
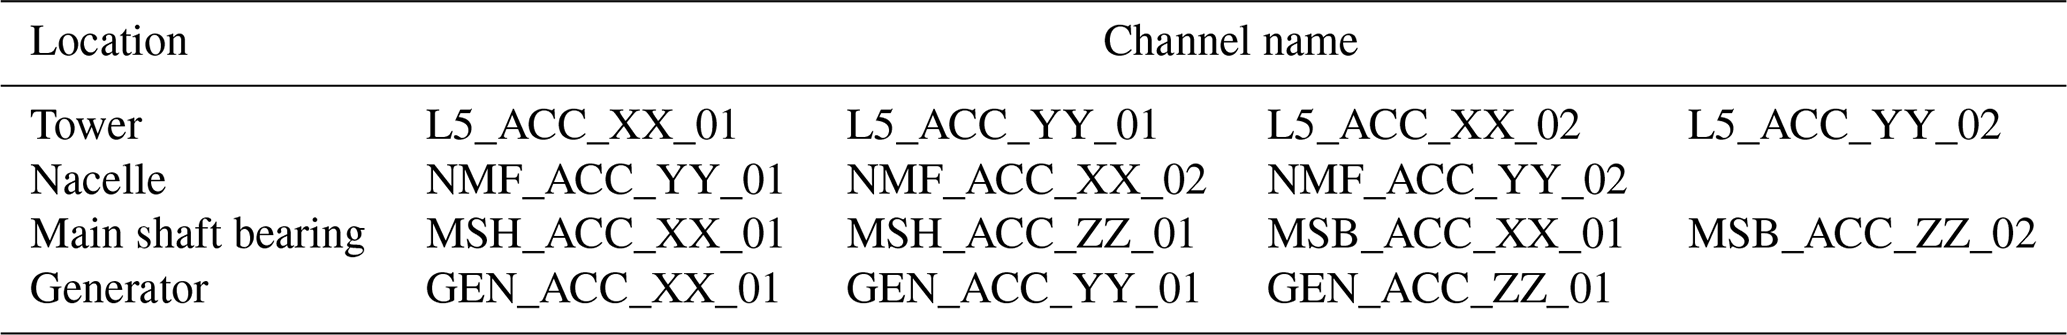
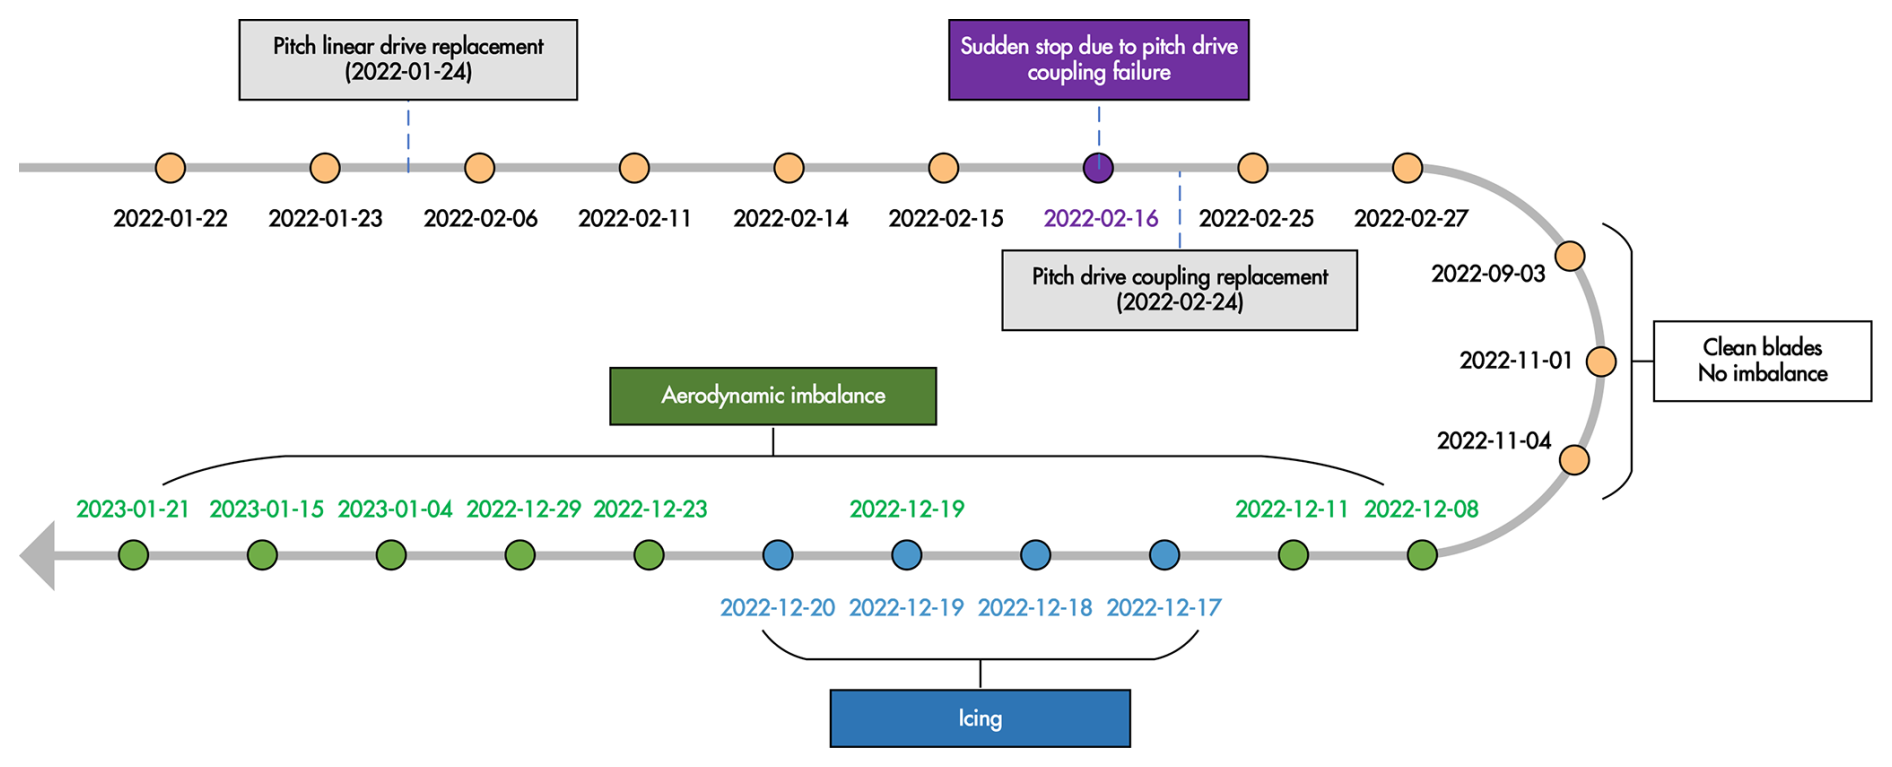
Figure 4Timeline of failures and maintenance for the Aventa AV-7 ETH Zurich research wind turbine.

Figure 5Illustration of wind turbine events (Chatzi et al., 2023): (a) failure of the pitch drive system caused by a broken flexible coupling; (b) aerodynamic imbalance due to roughness tape applied to the blade, simulating surface roughness effects; and (c) icing on the blade.
The analysis uses data from 14 specific vibration channels (Table 2) that are highly relevant to diagnosing the health of critical turbine components. The multi-location sensor placement ensures robust fault detection for various fault types. The complete operational history, including maintenance activities and fault periods, is summarized in the timeline in Fig. 4. This study specifically focuses on three distinct fault scenarios, chosen to represent a diverse set of real-world challenges: a mechanical breakdown, a simulated operational anomaly, and an environmental fault. These events, illustrated in Fig. 5, include the following:
-
Pitch drive failure. A mechanical failure of a pitch drive coupling occurred on 16 February 2022, when a flexible coupling in the pitch drive system broke, as shown in Fig. 5a. This event led to a complete turbine stop, representing a critical component failure.
-
Aerodynamic imbalance. This condition was intentionally simulated from 19 December 2022 to 15 January 2023. As depicted in Fig. 5b, this was achieved by applying roughness tape to a blade to mimic the effects of surface degradation on aerodynamic efficiency, such as leading-edge erosion (Visbech et al., 2023).
-
Icing events. Naturally occurring blade icing was recorded during a period of cold weather from 10 to 19 December 2022. This environmental fault, shown in Fig. 5c, affects both aerodynamic performance and mass balance.
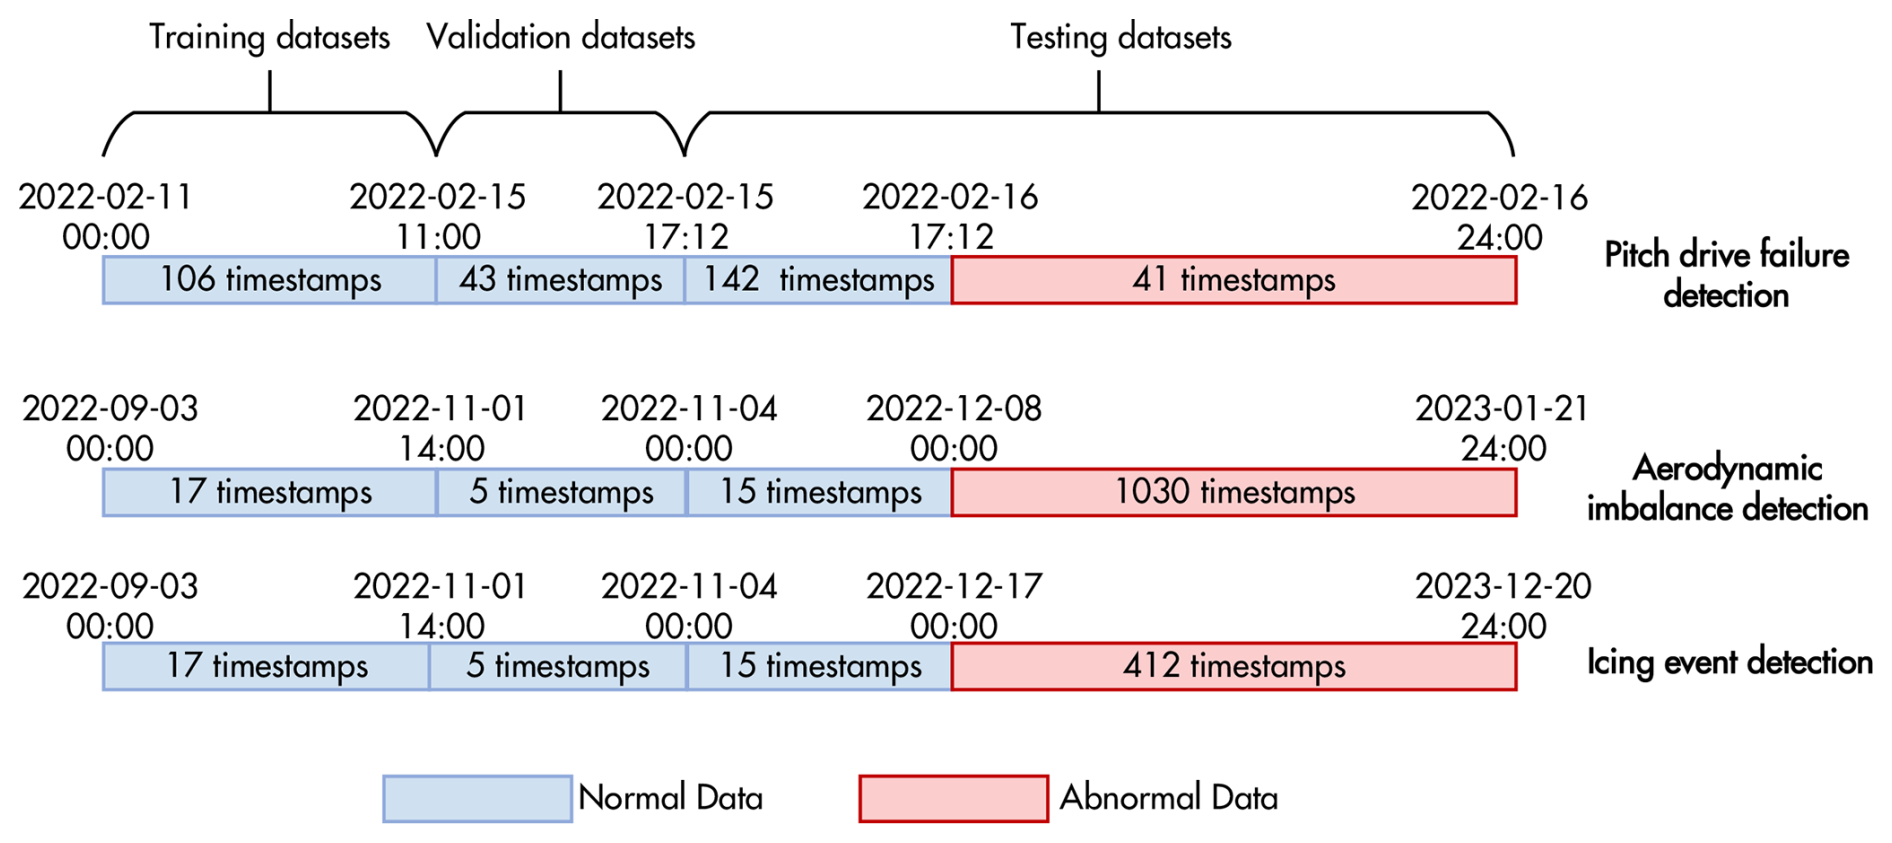
To prepare the data for the semi-supervised model, the dataset is partitioned into training, validation, and testing sets based on the operational timeline, as illustrated in Fig. 6. A fundamental principle of this division is that training and validation sets consist exclusively of data from confirmed healthy operational periods, ensuring the VAE learns an accurate representation of normal turbine behavior without contamination from fault signatures.
Table 3Number of timestamps and samples for training, validation, and testing datasets in three detection tasks.
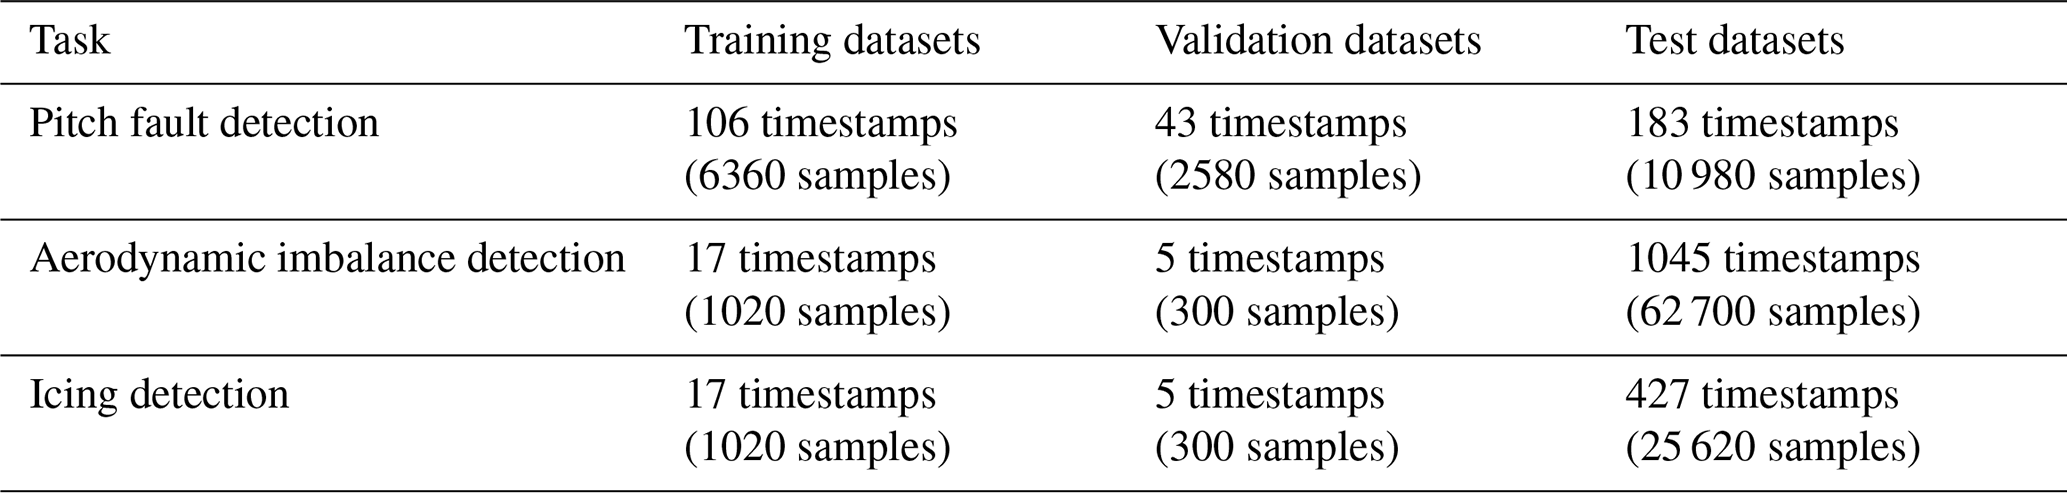
The dataset division follows a chronological approach to maintain temporal consistency. Validation sets are selected from periods immediately following the training periods, ensuring they reflect similar operational conditions while remaining independent for threshold establishment. In contrast to the training and validation sets, test sets contain both normal and faulty operation periods, enabling comprehensive evaluation of the framework's ability to distinguish between healthy and faulty conditions. This mixed composition allows assessment of detection accuracy, false alarm rates, and the framework's robustness under realistic operational scenarios. The specific composition and temporal coverage of each dataset are detailed in Fig. 6 and Table 3.
4.2 Data preprocessing
The quality and reliability of the anomaly detection method heavily depend on proper data preprocessing. In this study, a comprehensive pipeline is implemented to ensure data quality and prepare raw vibration signals for subsequent feature extraction and model training. This pipeline includes outlier removal, data segmentation, detrending, and feature normalization.
4.2.1 Outlier removal
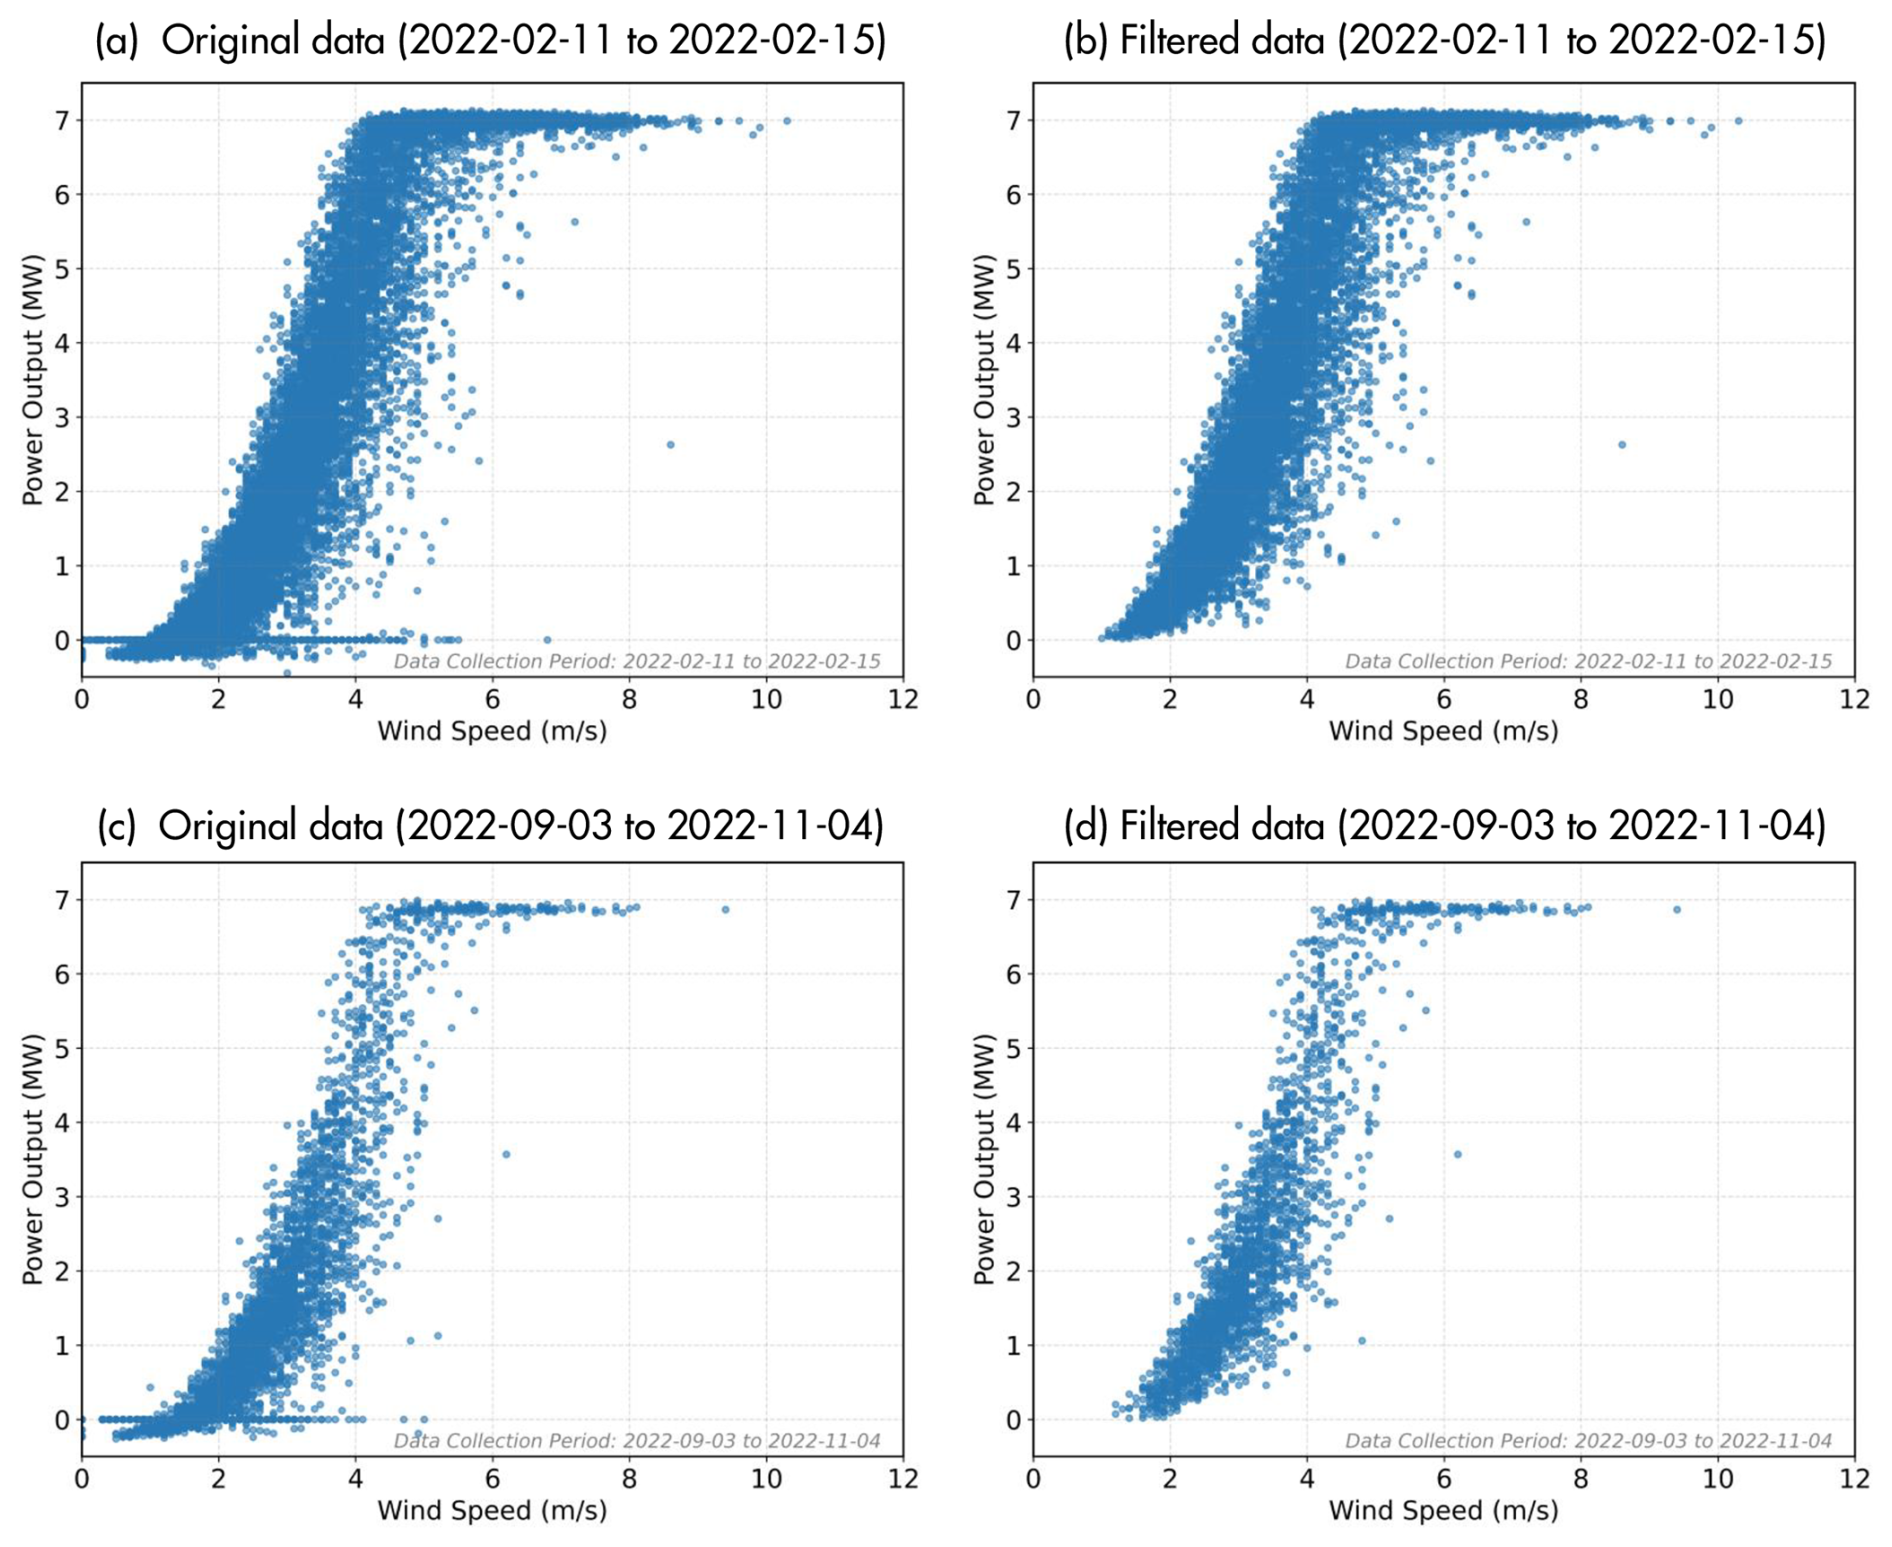
To ensure that the training and validation datasets accurately represent true healthy operating conditions, the turbine's power output is used as the primary indicator of its operational state. Any timestamp where the corresponding power measurement is anomalous (e.g., zero or negative values) is flagged as invalid. Subsequently, for any timestamp flagged, the associated vibration data are discarded from the analysis. Discarding these timestamps ensures that the dataset more accurately represents the normal operating conditions of the wind turbines. Figure 7 clearly illustrates the effectiveness of this step, comparing power curves before (Fig. 7a and c) and after (Fig. 7b and d) outlier removal for two distinct time periods.
4.2.2 Data segmentation
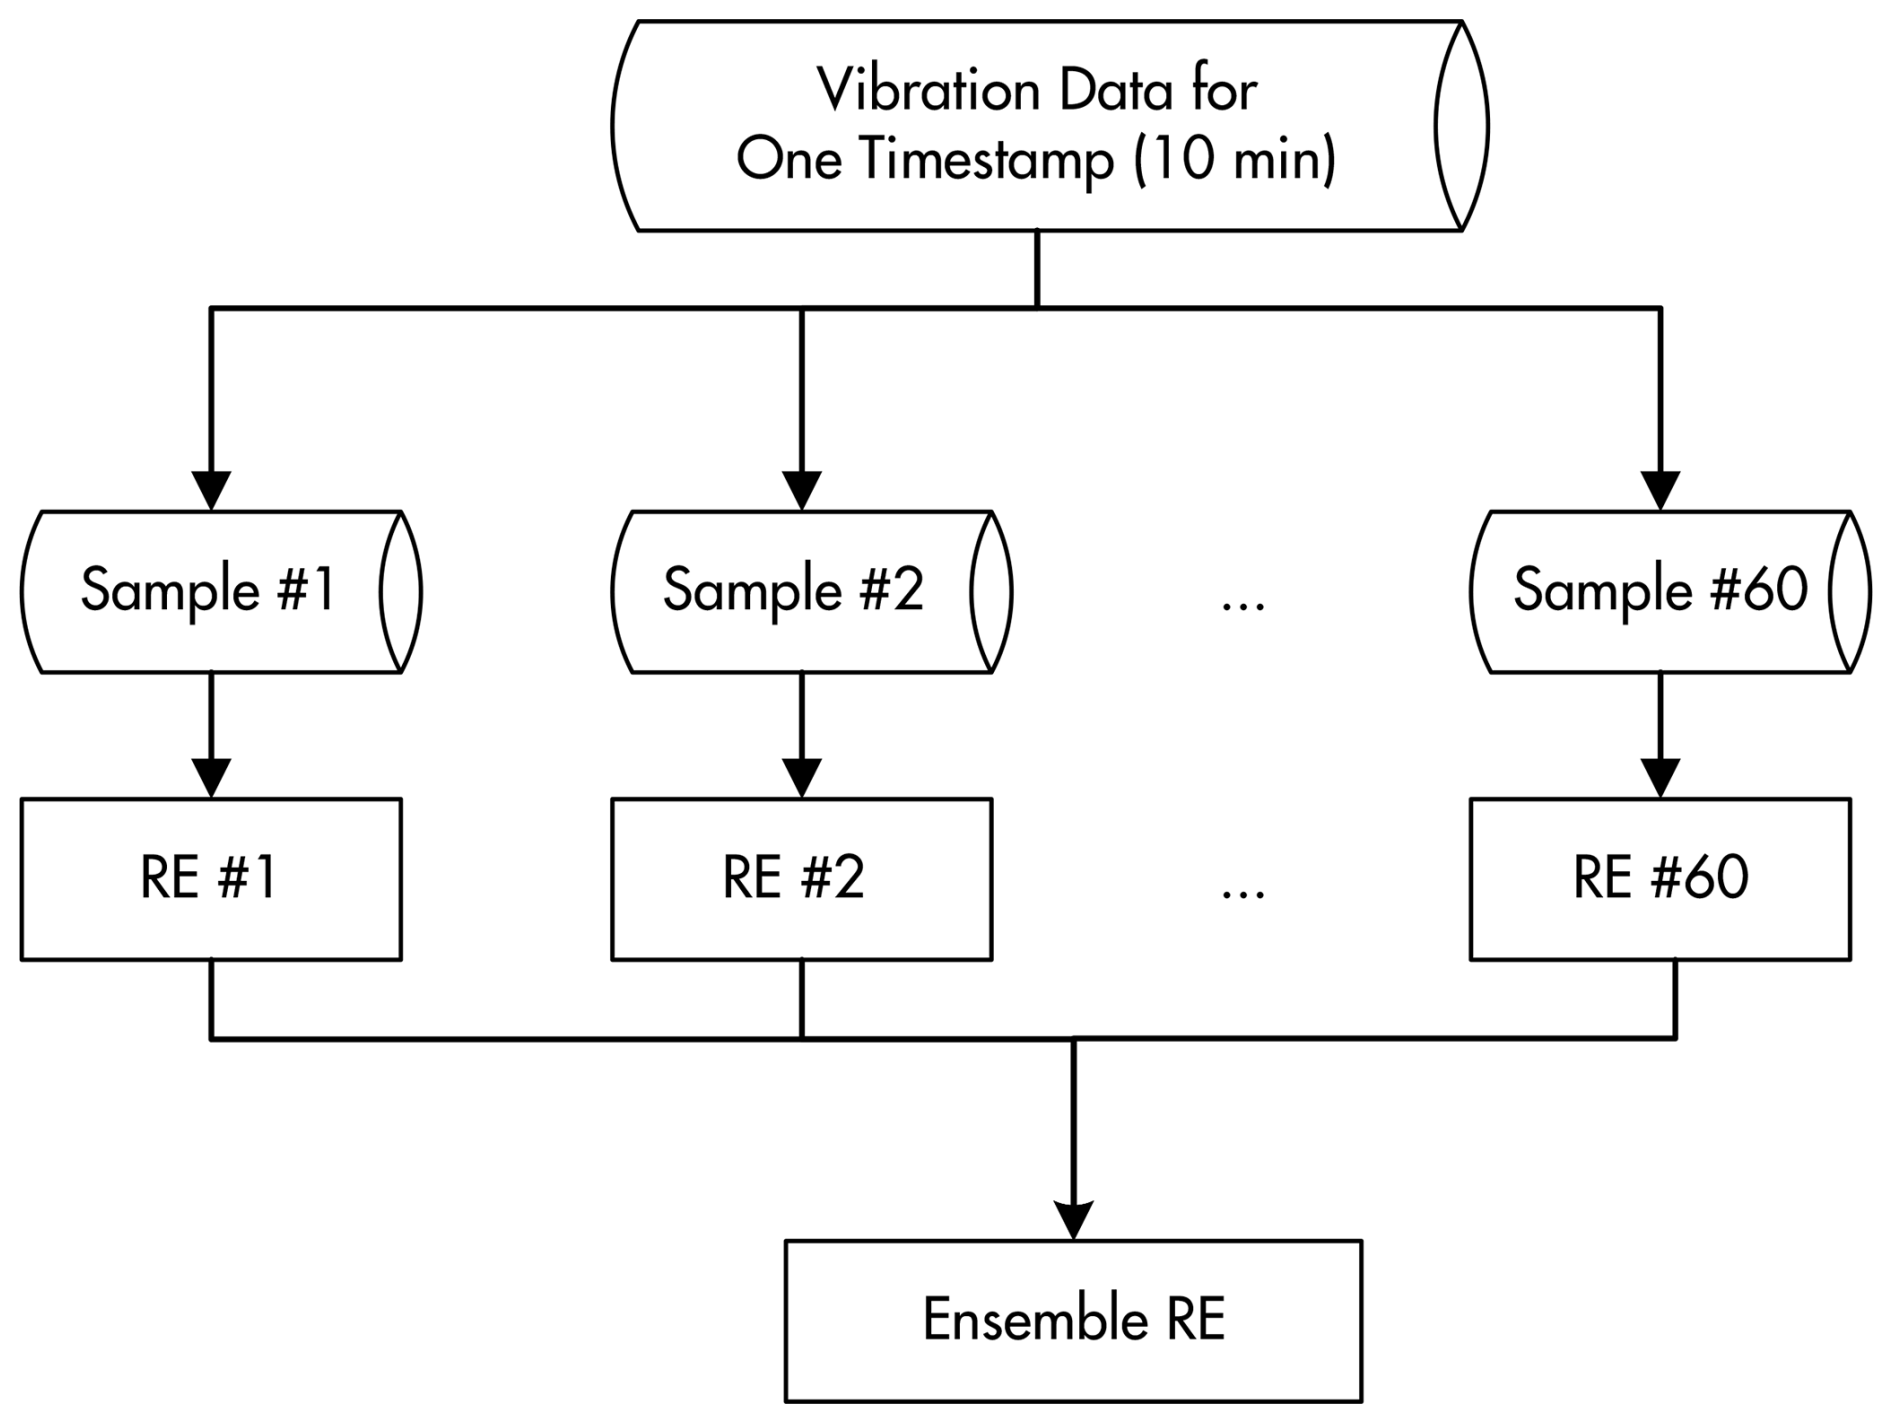
Each record or timestamp consists of approximately 10 min of vibration data sampled at 200 Hz. To process these data, the record is divided into 60 non-overlapping sub-samples, with each sub-sample containing 2000 data points (corresponding to 10 s of operation). Timestamps with less than 10 min of data are excluded to ensure uniformity. For each 10 s sub-sample, the reconstruction error is calculated. Subsequently, the average of these 60 individual REs is computed to derive a single ensemble RE for the entire 10 min record. This ensemble averaging strategy provides a more stable and robust representation of the turbine's operational state, effectively minimizing the influence of transient fluctuations on the health indicator. The data segmentation process is visually explained in Fig. 8.
4.2.3 Detrending
Unlike typical vibration signals that oscillate around zero, the experimental vibration data from the Aventa AV-7 exhibited exclusively positive values, likely due to the specific data acquisition settings. To counteract any inherent biases or drifts that could affect the analysis, detrending is applied to the vibration signals to ensure that the signals oscillate around zero. Specifically, in this work, detrending is achieved by subtracting the mean value of each sample from its own data points. This ensures that each sample is centered around zero, without any biases introduced by the data acquisition settings.
4.2.4 Feature normalization
Following extraction of features in the time and frequency domains from detrended vibration signals, min–max scaling is applied to normalize these features. This standardization step is critical for machine learning models, as it brings all features to a comparable scale, preventing features with larger numerical ranges from dominating the learning process. Crucially, the maximum and minimum values for scaling are computed exclusively from the training dataset, ensuring data consistency and standardization throughout model training, while preventing information leakage from the test set.
4.3 Experimental results
The performance of the proposed framework is systematically evaluated in three distinct fault scenarios, showcasing its robust capabilities to detect various types of anomalies. Each type of fault, including pitch drive failure, aerodynamic imbalance, and icing event, presents unique challenges in monitoring wind turbine health, thereby providing a comprehensive validation of the framework.
To demonstrate the effectiveness of the proposed approach, comparative analysis is conducted with several baseline methods using the same 14-channel vibration signals. The baseline methods include a standard autoencoder (AE), denoising autoencoder (DAE) (Chen et al., 2020), deep support vector data description (Deep SVDD) (Peng et al., 2025), one-class support vector machine (OC-SVM) (Ghiasi et al., 2024), and standard variational autoencoder (VAE). The configurations are as follows:
-
To directly evaluate the impact of the input type, AE, DAE, and Deep SVDD are tested with both feature-based (F) and raw signal (R) inputs.
-
The OC-SVM method, which conventionally operates on a feature space, is applied directly to the engineered features, referred to as OC−SVMF.
-
To create a direct ablation baseline for our framework, a standard VAE is applied to the raw signal (VAER).
For fair comparison, all baseline methods adopt identical network architectures and training procedures. The encoder compresses input data through three hidden layers with 128, 64, and 32 neurons, while the decoder symmetrically reconstructs the input through layers with 32, 64, and 128 neurons. Batch normalization and ReLU activations are applied in both the encoder and the decoder to maintain stability and improve performance. All models are implemented using PyTorch and optimized using the Adam optimizer with a learning rate of 0.001, batch size of 256, and maximum of 100 epochs on an NVIDIA 4060 GPU. The convergence of all models during training is confirmed, with the corresponding loss curves presented in Appendix A.
4.3.1 Case I: pitch drive failure
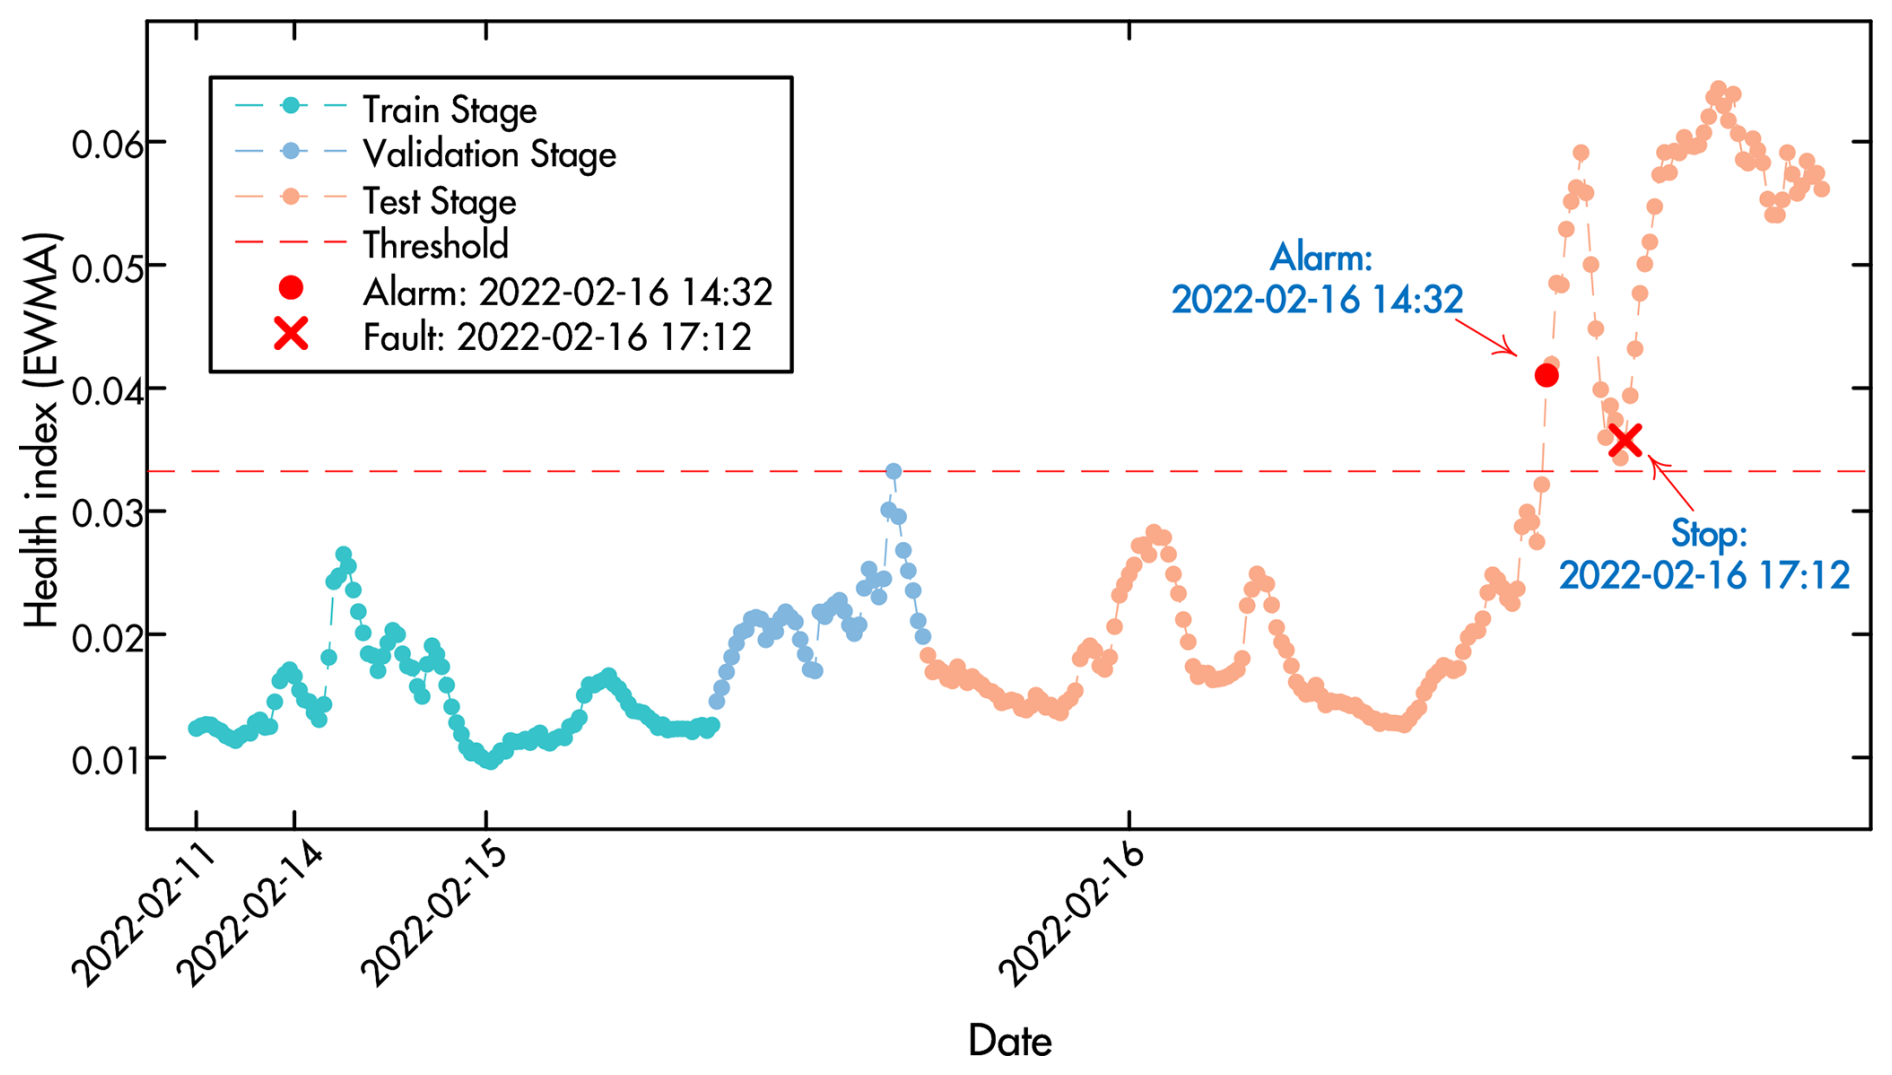
Figure 9 illustrates the result of the pitch drive failure monitoring using the proposed method. The green dots represent the HI during the training stage, while the blue dots show the HI values from the validation stage used to set the threshold (horizontal red dashed line). The orange dots depict the HI during the monitoring (testing) stage including both normal and faulty data.
The framework demonstrates the capability to provide early warning for this progressive fault. As shown in Fig. 9, an alarm is triggered at 14:32 UTC, providing a 2.5 h lead time before the actual turbine shutdown at 17:12 UTC. While this lead time is insufficient for comprehensive maintenance planning in operational scenarios, the result validates the framework's ability to detect early signs of pitch drive degradation before complete failure occurs.
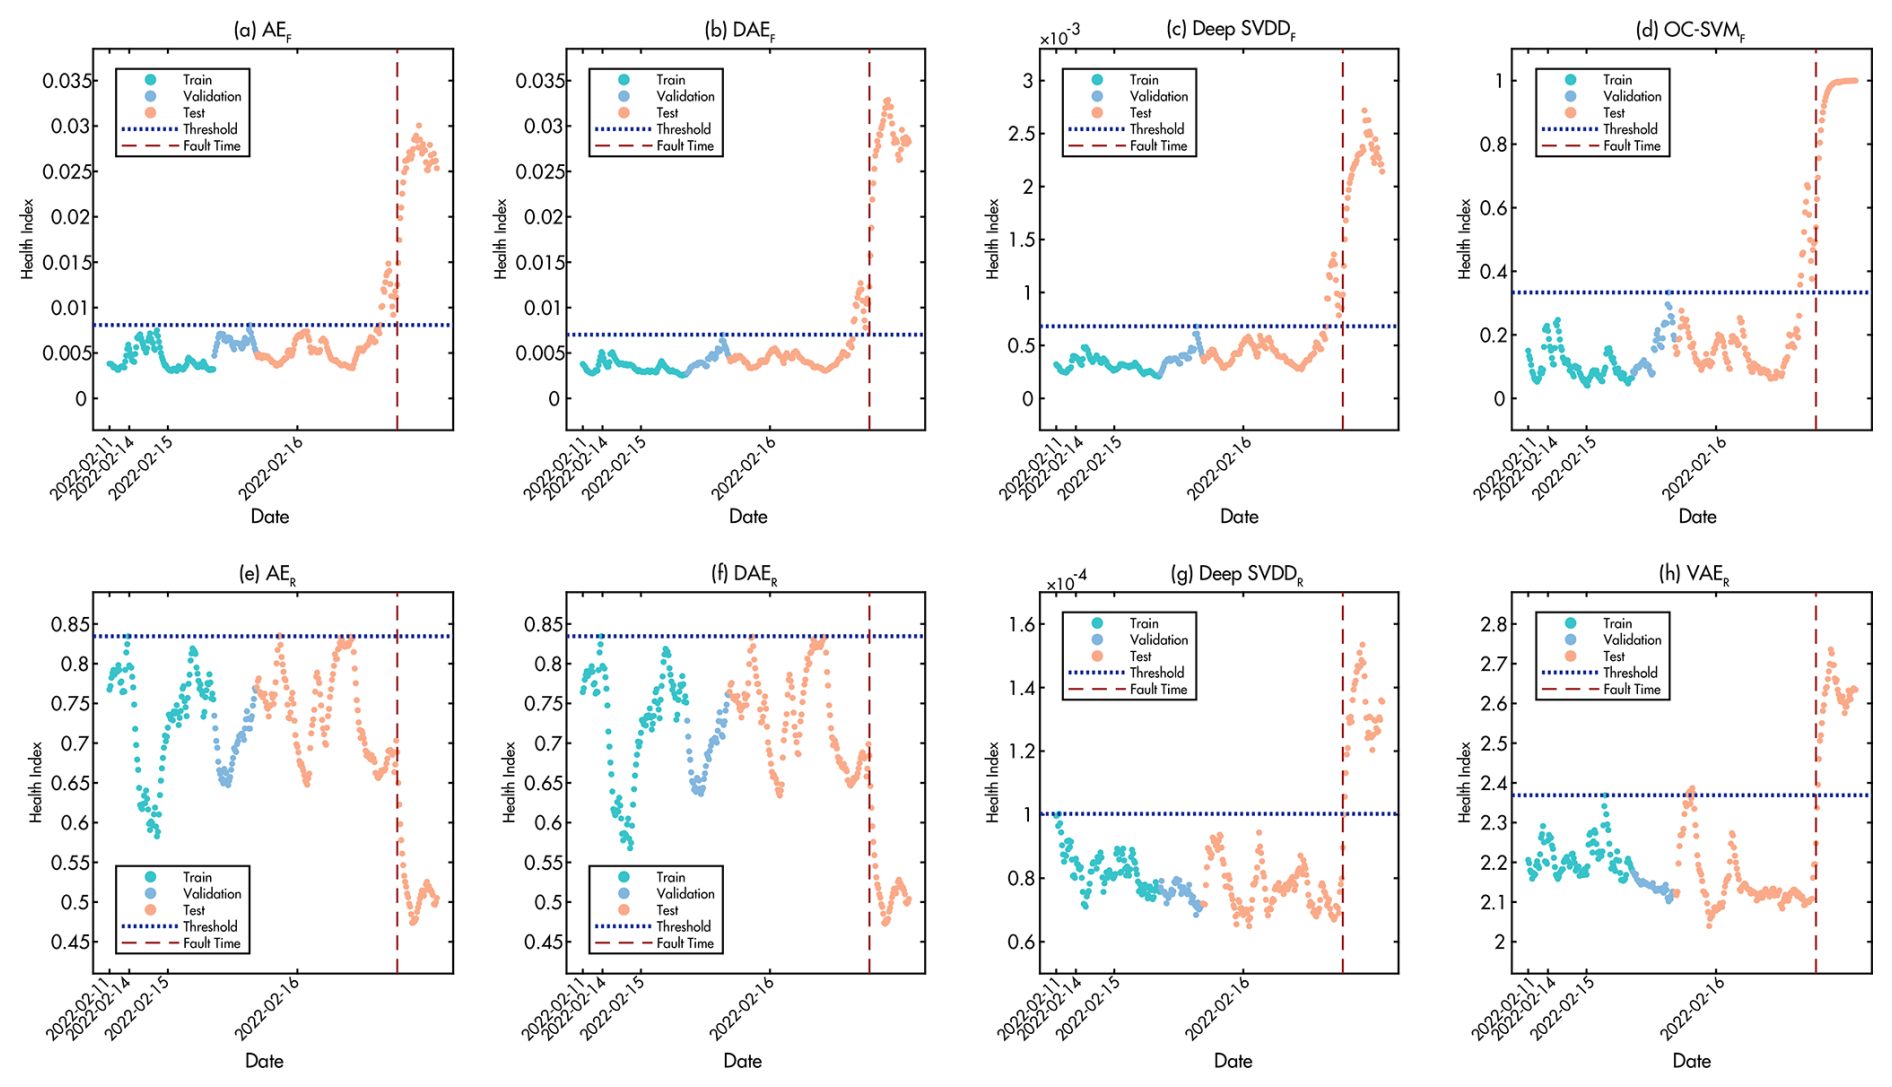
Figure 10Health index comparison of baseline methods during Case I pitch drive failure detection. The figure shows (a–d) methods with feature-based input and (e–h) methods with raw signal input. The red dashed line indicates the fault occurrence time, while the blue dotted line represents the detection threshold.
The performance of baseline methods is detailed in Fig. 10. The methods with feature-based input (F) demonstrate superior early warning capabilities. Specifically, AEF, DAEF, Deep SVDDF, and OC−SVMF all successfully provide early warnings approximately 2.5 h before the actual turbine shutdown, with HI values clearly crossing the threshold well in advance of fault occurrence. In contrast, the methods with raw signal input (R) exhibit significantly inferior performance patterns. AER and DAER fail to detect the fault entirely. Deep SVDDR and VAER provide fault indication only at the moment of fault occurrence without early warning capability, while VAER suffers from frequent false alarms during normal operation periods.
This comparison clearly demonstrates the superior performance of methods using feature-based input over those using raw signal input for complex fault detection tasks, highlighting the critical importance of proper feature engineering in achieving reliable early warning capabilities.
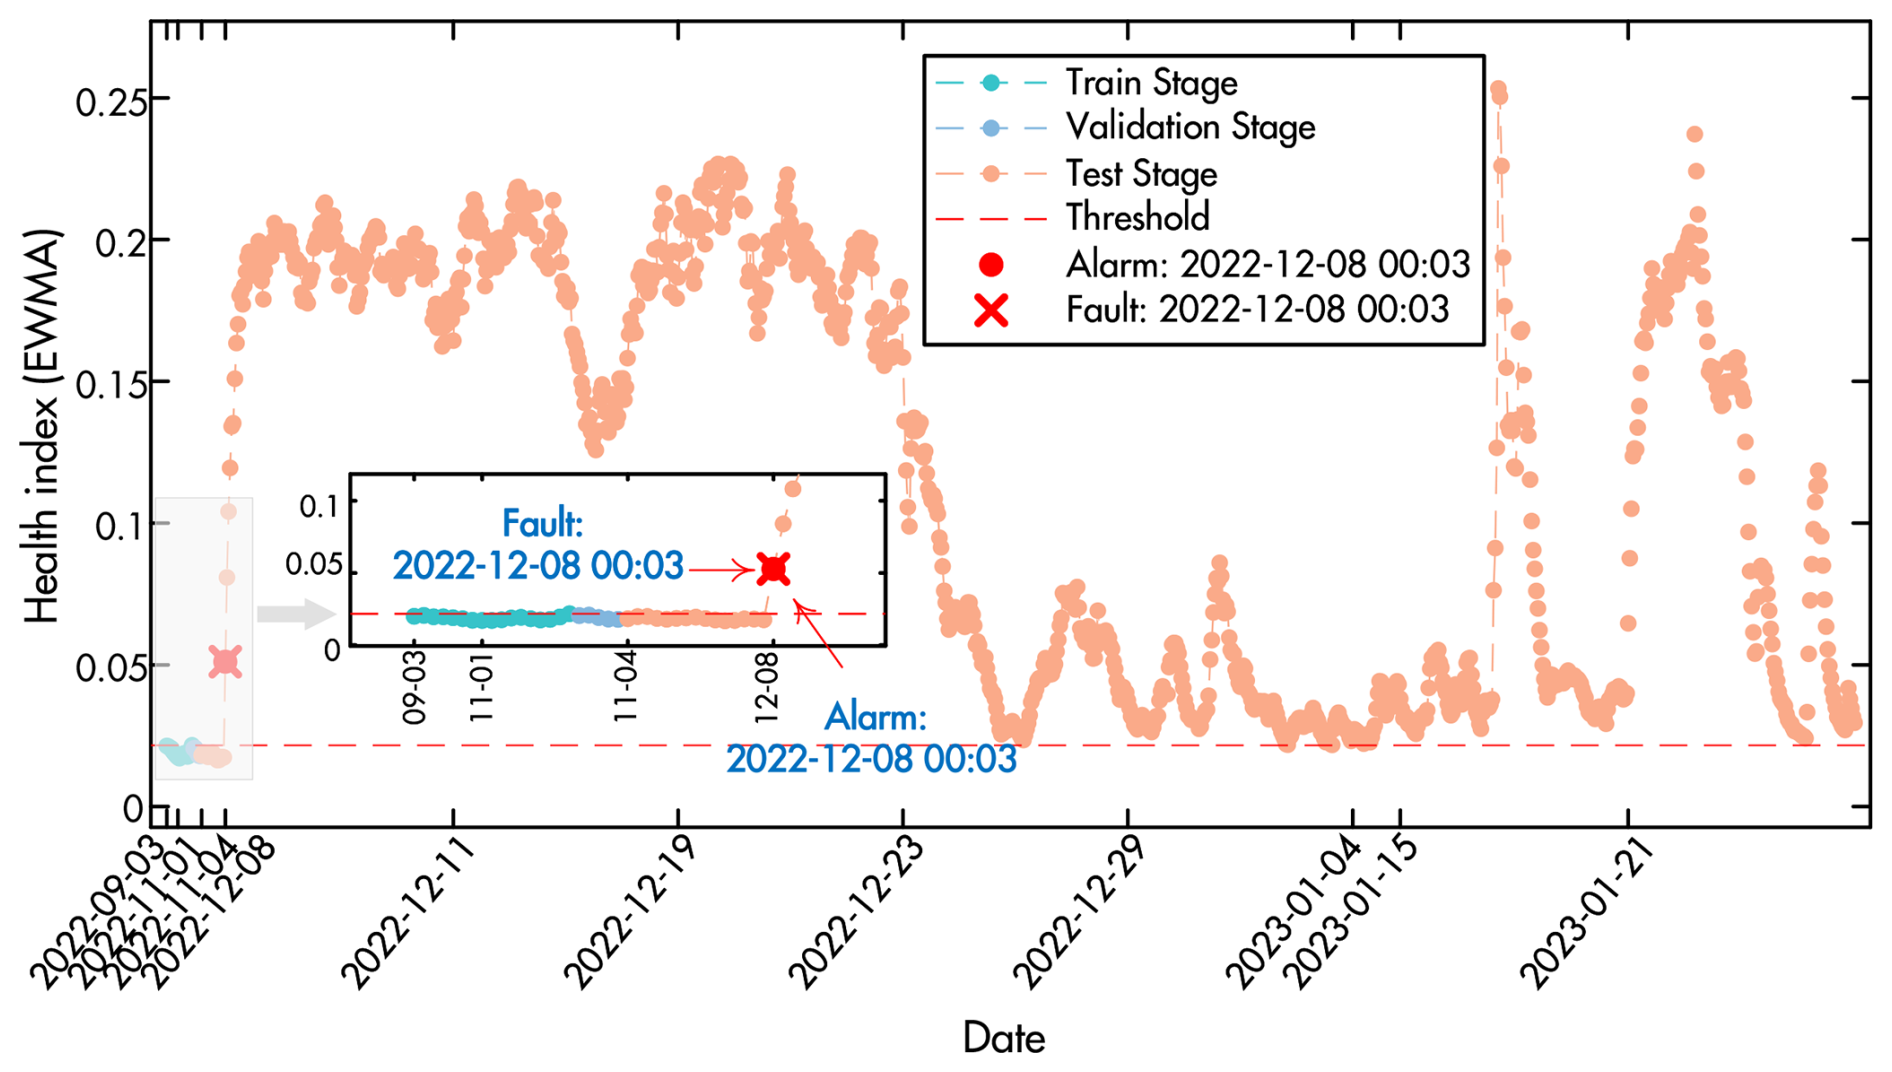
Figure 11Monitoring result for wind turbine aerodynamic imbalance using the proposed method.
4.3.2 Case II: aerodynamic imbalance
Figure 11 illustrates the monitoring results for aerodynamic imbalance detection using the proposed method. The red dashed threshold line represents the decision boundary for imbalance detection. On 8 December 2022, an imbalance event is accurately detected, as indicated by the spike in the health index that crosses the threshold line, triggering an immediate alarm. The proposed method achieves precise detection with no false alarms during normal operation periods and no missed detections during fault occurrence, demonstrating excellent discrimination capability between normal and faulty conditions.
Unlike rapidly progressing mechanical failures such as pitch drive faults, aerodynamic imbalances represent static conditions with potentially indefinite time to failure. The framework's robust and accurate detection of such faults (achieving 100 % accuracy with zero false alarms) offers significant practical value for operational wind farms. Early identification of aerodynamic imbalances enables timely corrective actions that minimize performance losses, prevent secondary damage to turbine components, and optimize energy production efficiency.
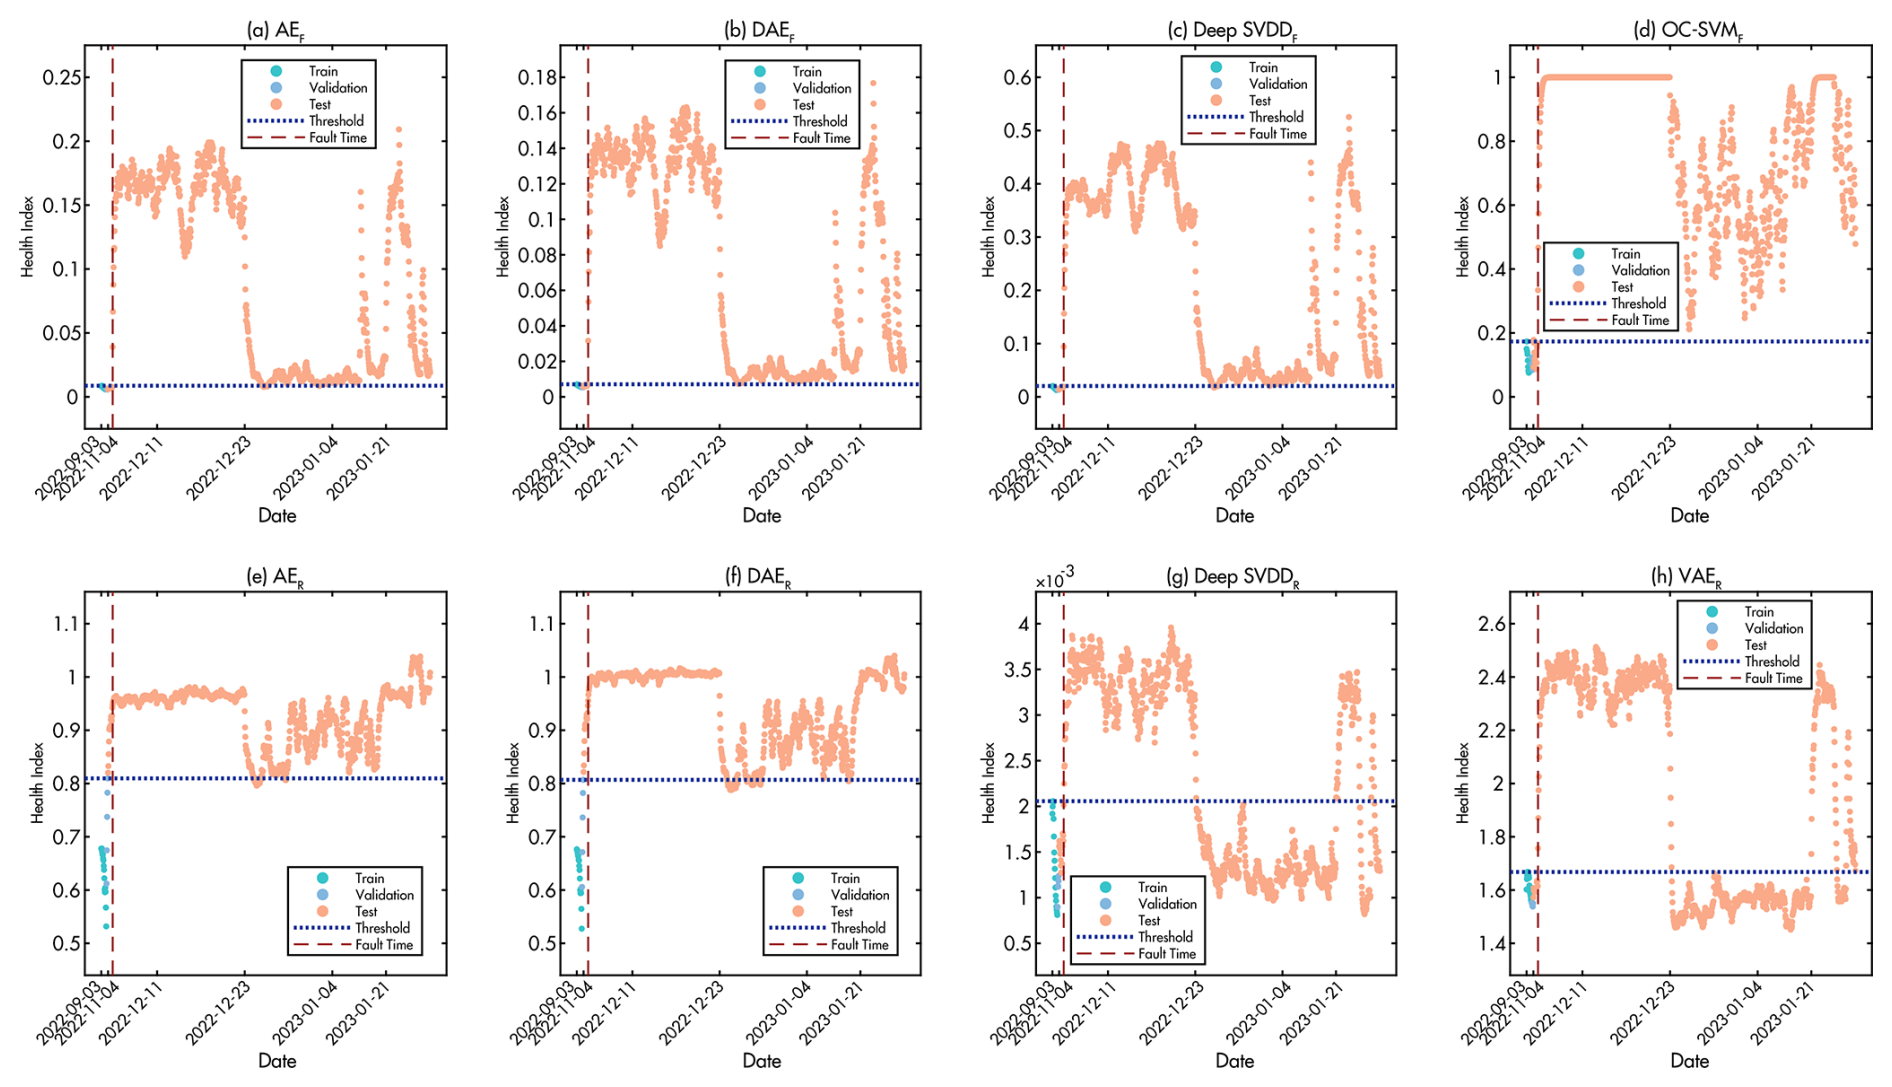
Figure 12Health index comparison of baseline methods during Case II aerodynamic imbalance detection. The figure shows (a–d) methods with feature-based input and (e–h) methods with raw signal input. The red dashed line indicates the fault occurrence time, while the blue dotted line represents the detection threshold.
The performance of the baseline methods, detailed in Fig. 12, varies significantly in terms of reliability, even though all feature-based methods successfully identify the imbalance event. Specifically, OC−SVMF is compromised by false alarms during normal operational phases. In contrast, AEF and Deep SVDDF provide a stable baseline free of false alarms but suffers from some missed detections during the fault period. Among all baselines, DAEF demonstrates exceptional performance in this case, achieving a perfect detection record with metrics identical to the proposed method. The methods using raw signal input (R variants) proved largely ineffective, suffering from high rates of both false alarms and missed detections. This again highlights the proposed framework's consistent and reliable performance across different conditions.

4.3.3 Case III: icing event
The monitoring process for detecting icing events using the proposed method is illustrated in Fig. 13. On 17 December 2022, a significant spike in the EWMA value crosses the red dashed threshold line, triggering an alarm. This rapid increase in the HI value provides a clear indication of the fault's occurrence. The results demonstrate that the proposed framework accurately identifies the icing event without any false alarms or missed detections, as evidenced by the clear distinction between normal and faulty conditions in the figure.
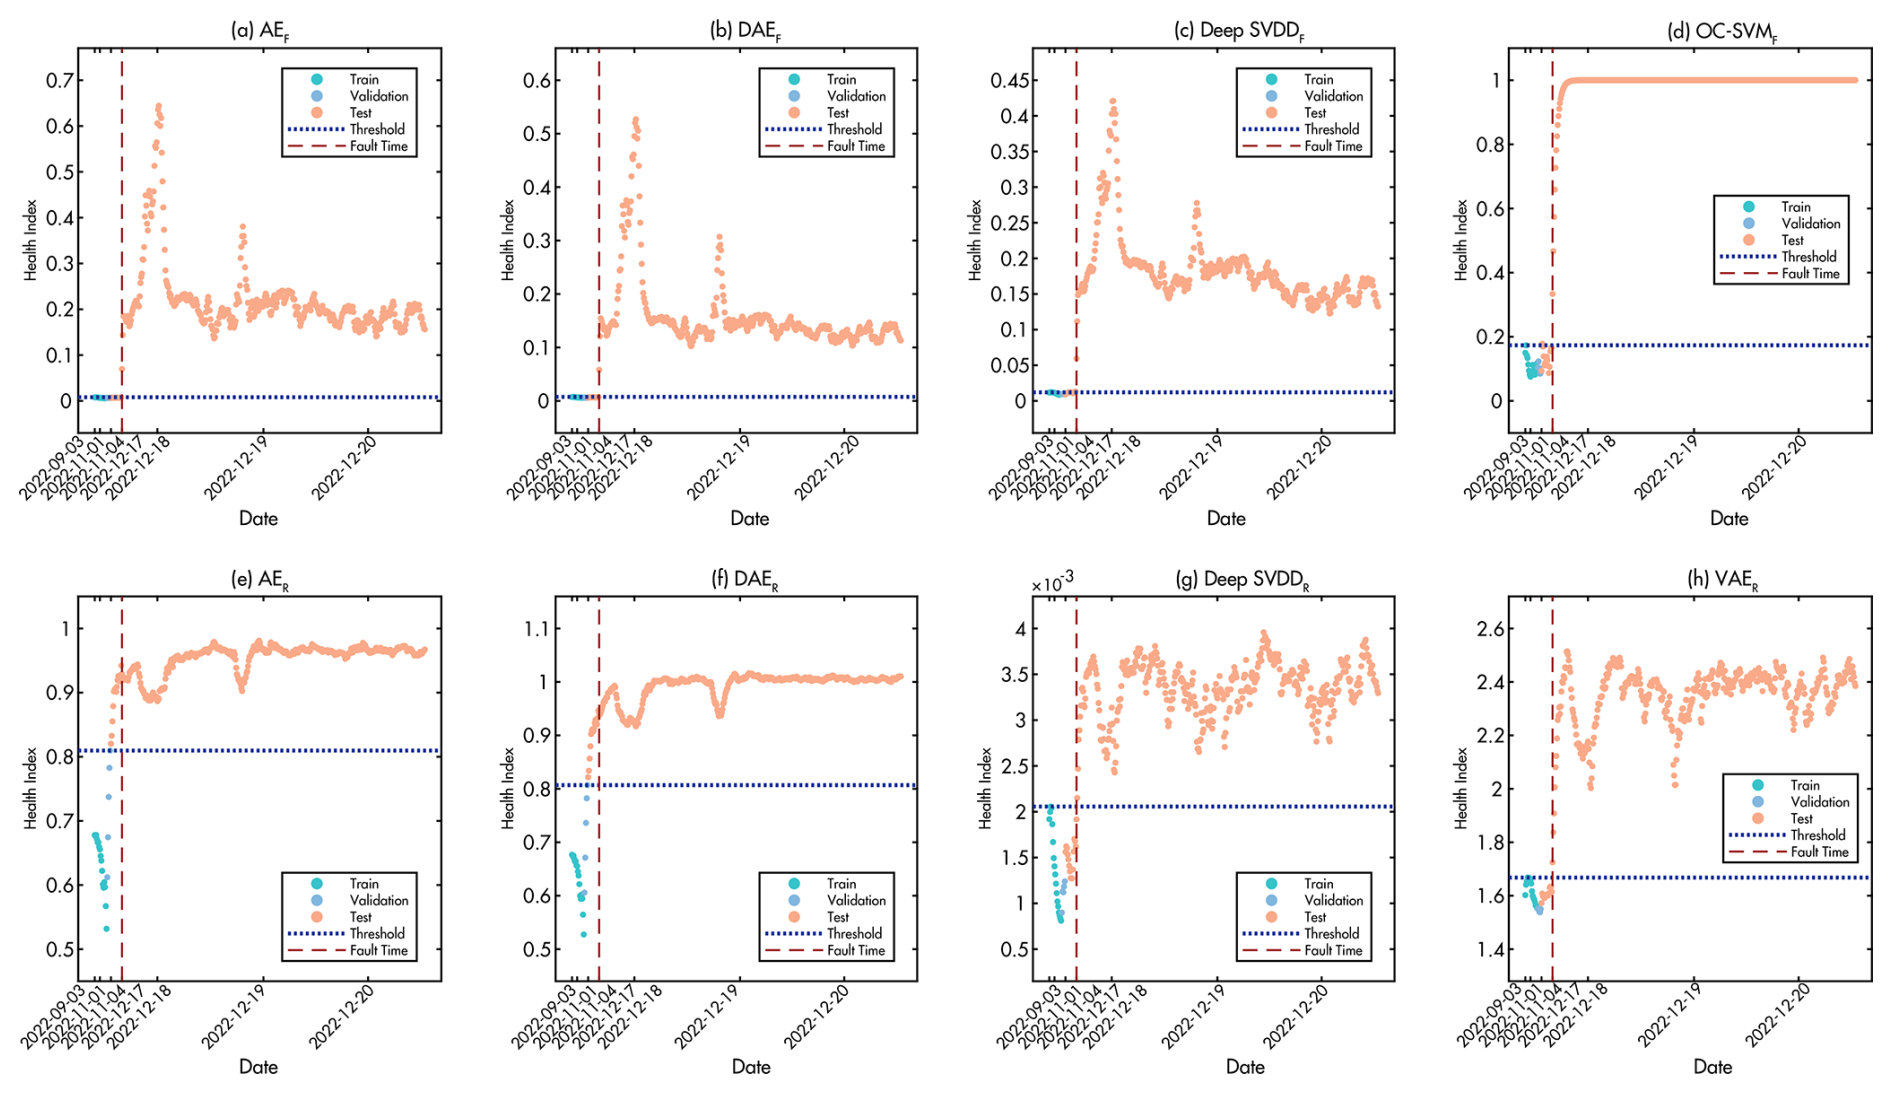
Figure 14Health index comparison of baseline methods during Case III icing event detection. The figure shows (a–d) methods with feature-based input and (e–h) methods with raw signal input. The red dashed line indicates the fault occurrence time, while the blue dotted line represents the detection threshold.
The baseline comparison in Fig. 14 shows that while most methods could detect the icing event, their reliability varied significantly. All feature-based methods (F variants) once again provided clear and stable fault signatures. The most notable deficiency is observed in the raw signal variants of AE and DAE, where both AER and DAER suffer from high baseline variability, leading to numerous false alarms during periods of normal operation. The other baseline methods are able to identify the fault without this significant false alarm issue. This result further underscores the superiority of the proposed framework, which delivers accurate fault detection while ensuring a stable and reliable baseline.
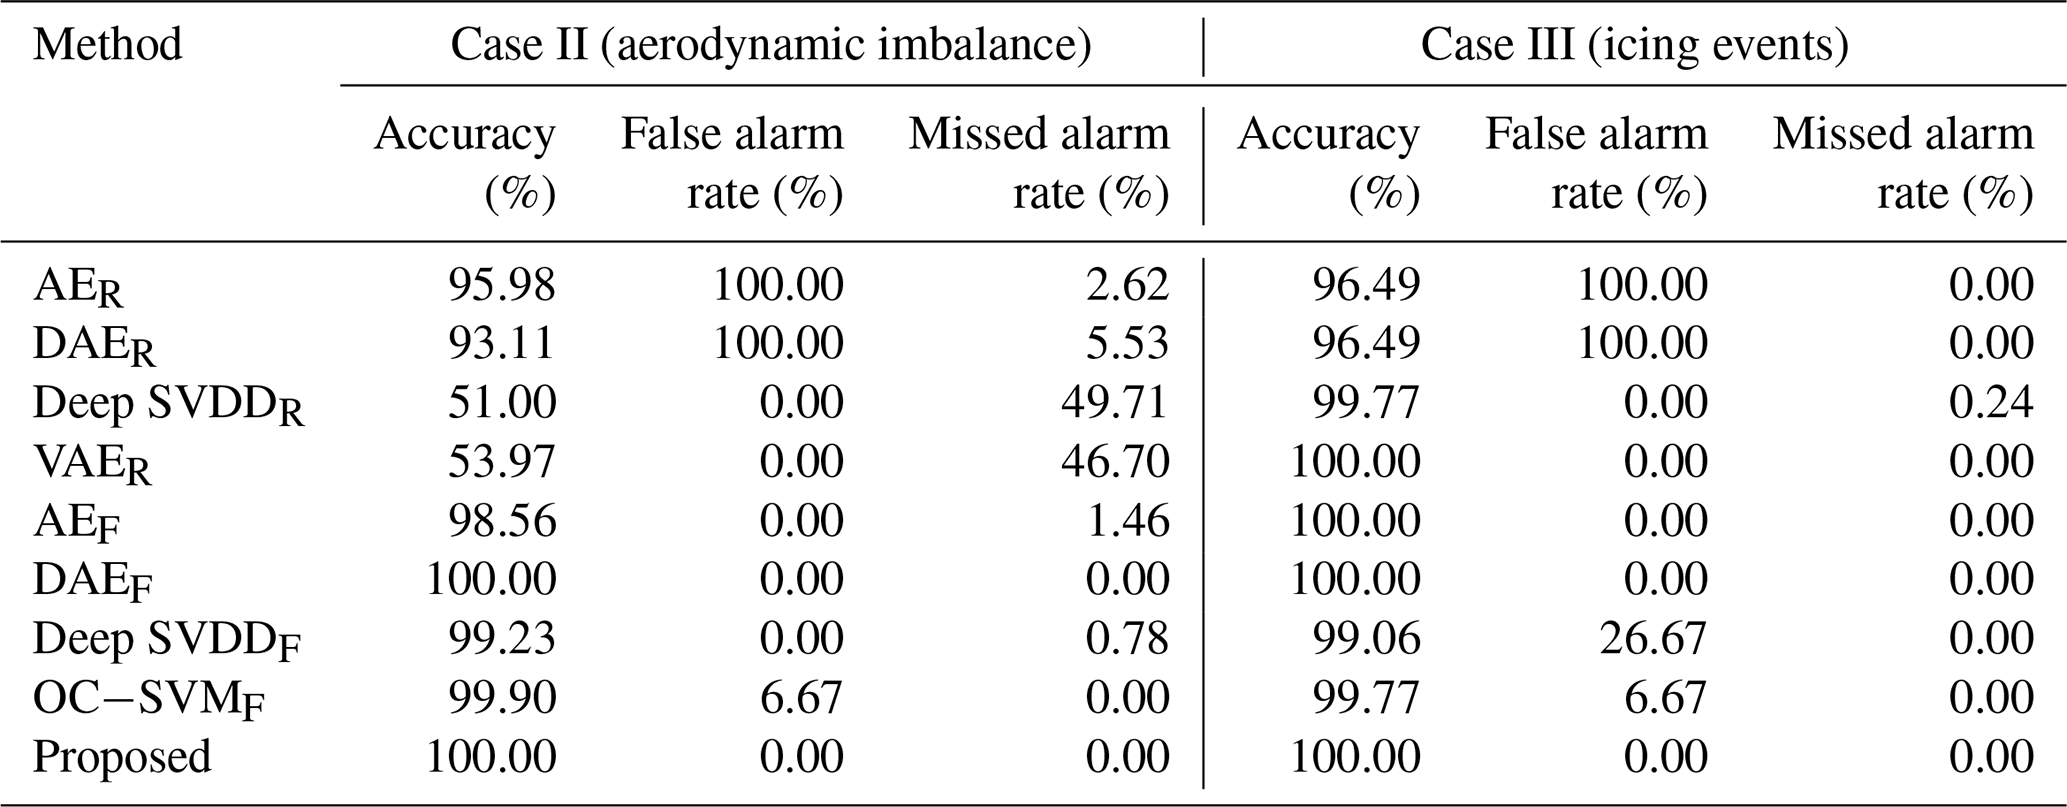
Table 4Performance comparison of different methods on imbalance and icing events.
4.3.4 Performance metrics
To quantitatively evaluate and compare the fault detection performance of the different HI construction methods, Table 4 presents a comprehensive quantitative comparison of different methods for aerodynamic imbalance (Case II) and icing events (Case III). These two cases provide clearly defined fault labels based on operational records, enabling precise evaluation of false alarm rates and missed alarm rates alongside conventional accuracy metrics. Here, Case I (pitch drive failure) is excluded from this quantitative analysis as it is primarily intended for assessing the early warning capabilities of the models due to its progressive failure characteristics.
As shown in Table 4, the proposed framework consistently demonstrates excellent performance, achieving 100 % accuracy with zero false alarm and missed alarm rates in both test scenarios. This robust and reliable performance validates the effectiveness of our integrated approach. The consistent performance across all scenarios demonstrates the robustness of the VAE-based approach. The probabilistic modeling and KL regularization contribute to stable health indices with minimal false alarms, as evidenced by the zero false alarm rate achieved across all test cases. Notably, DAEF also achieves identical perfect scores in both cases, demonstrating the effectiveness of feature-based autoencoder approaches for these fault types.
Furthermore, the quantitative results confirm the superiority of methods using feature-based input over those using raw signal input under identical network architectures. This contrast highlights that well-engineered features can effectively reduce dimensionality and filter noise, thereby accentuating fault-related information crucial for robust detection from complex multi-channel vibration signals.
In summary, the comprehensive evaluation validates that by synergizing effective feature engineering with a VAE-based detector and EWMA smoothing, our framework offers a highly reliable and robust solution with strong potential for practical deployment.
4.4 Hyperparameter analysis
To validate the robustness of the proposed framework, sensitivity analysis is conducted on key parameters: the VAE latent space dimension and the EWMA smoothing parameter λ.
Table 5Performance comparison of different latent space dimensions for aerodynamic imbalance and icing detection.
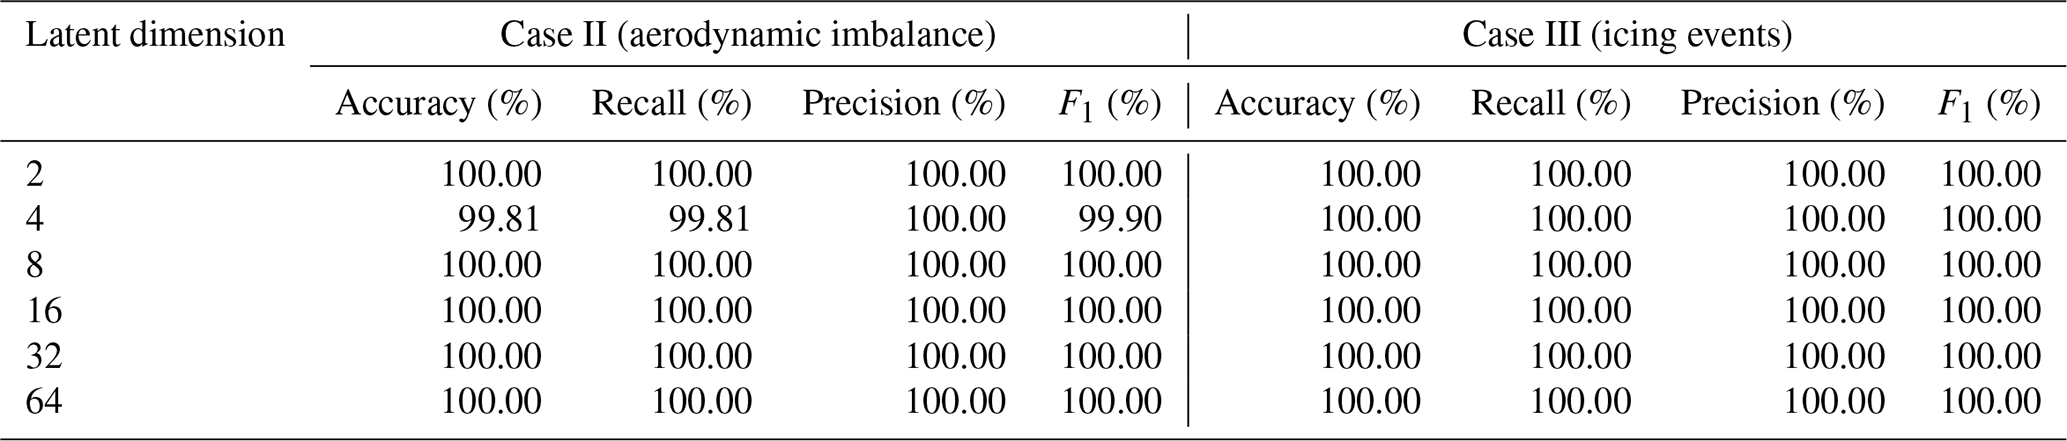
4.4.1 Latent space dimension
The latent space dimension is a critical hyperparameter in VAE architecture that affects the model's capacity to capture normal operational patterns. The performance for aerodynamic imbalance and icing detection is evaluated with latent dimensions of 2, 4, 8, 16, 32, and 64, while other architectural parameters were held constant. Table 5 presents the detection performance across different dimensions.
The results demonstrate that the proposed framework is robust to the choice of latent space dimension, achieving perfect or near-perfect performance across a wide range of dimensions. All tested dimensions achieve 100 % accuracy for icing detection (Case III). For aerodynamic imbalance detection (Case II), latent dimensions of 2, 8, 16, 32, and 64 all achieve perfect performance with 100 % accuracy, while dimension 4 achieves near-perfect performance at 99.81 % accuracy. This consistent high performance across different latent dimensions indicates that the framework is not sensitive to this hyperparameter and can maintain excellent detection capability across a broad range of configurations. This robustness is particularly valuable for practical deployment, as it reduces the need for extensive hyperparameter tuning and suggests the method can generalize well across different operational scenarios.
Table 6The performance metrics (accuracy, recall, precision, and F1 score) for different values of λ in the EWMA method for aerodynamic imbalance.
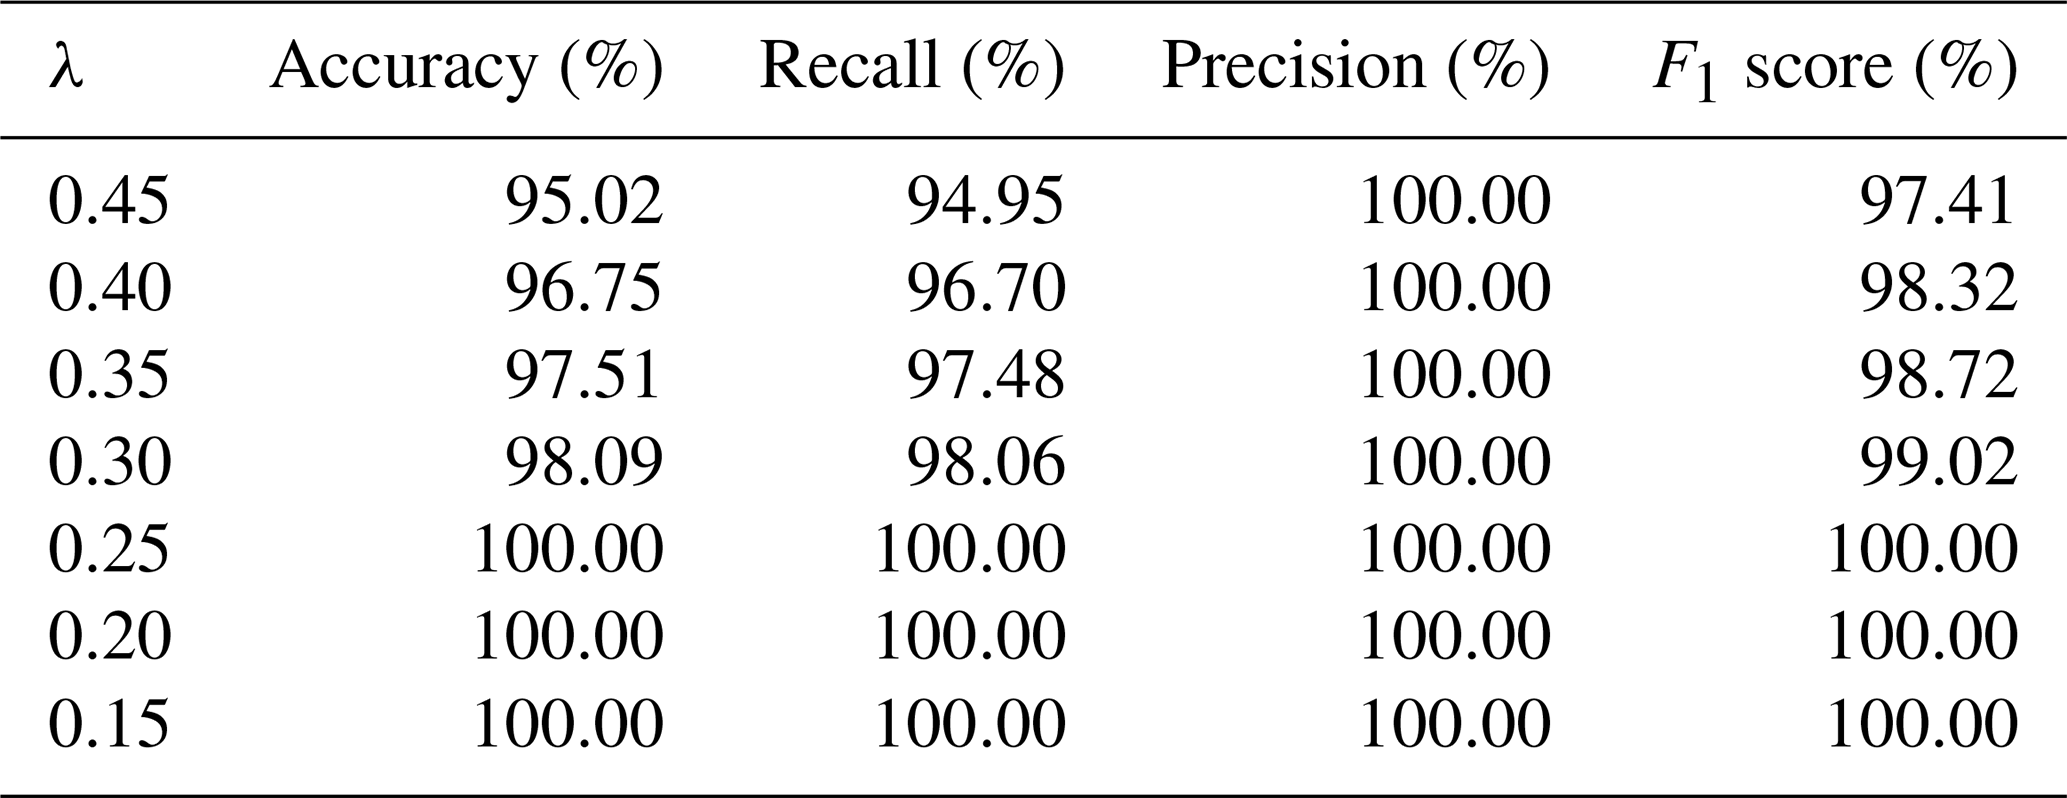
4.4.2 EWMA smoothing parameter
In addition, the impact of the smoothing parameter λ in the EWMA method on the fault detection performance is analyzed. Table 6 summarizes the performance metrics (accuracy, recall, precision, and F1 score) for different values of the parameter λ in the context of detection of aerodynamic imbalances.
Higher values of λ (e.g., 0.45 and 0.4) assign greater weight to recent errors, making the EWMA chart more sensitive to abrupt deviations. However, this increased sensitivity can result in a higher likelihood of false alarms caused by noise. As λ decreases to 0.35 and 0.3, the performance improves, achieving near-perfect results. At λ=0.25, the model achieves perfect scores in all metrics, with the accuracy, recall, precision, and F1 scores reaching 100 %. This trend continues for even smaller values of λ (e.g., 0.2 and 0.15), where the model consistently maintains perfect detection performance. The results show that lower values of λ result in a progressively smoother EWMA curve, reducing false alarms while maintaining accurate and early detection of anomalies. Based on this analysis, a value of λ=0.2 is chosen for the proposed framework, ensuring reliable anomaly detection with high and consistent performance in all metrics evaluated.
Table 7Computational efficiency for feature extraction, model training, and inference.
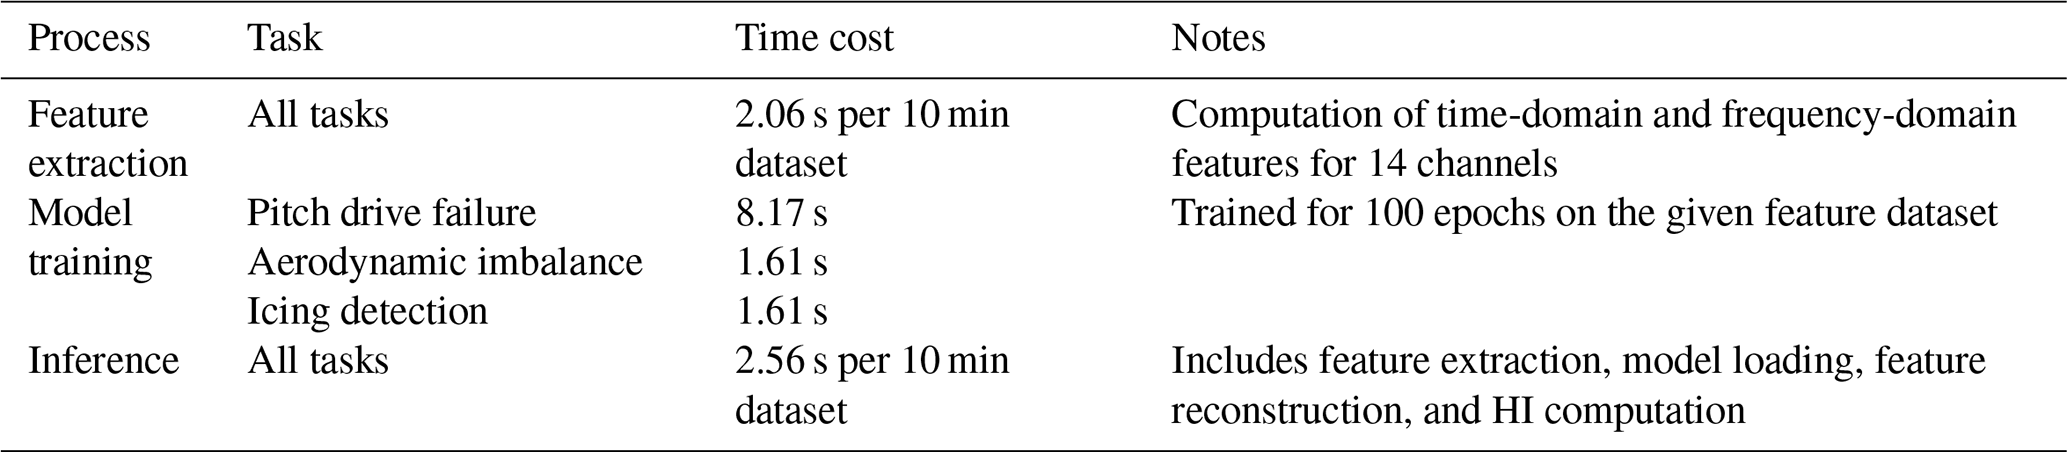
4.5 Computational efficiency
The computational efficiency of the proposed framework is assessed to ensure its suitability for real-time wind turbine monitoring and fault detection, as shown in Table 7. All models are implemented using PyTorch, and training and inference tasks are executed on hardware with the following specifications: GPU, NVIDIA GeForce RTX 4060; CPU, Intel Core i7-13700K; and memory, 32 GB RAM. Feature extraction, which involves computing 19 time- and frequency-domain features across 14 vibration signal channels, requires an average of 2.06 s per 10 min dataset. Model training times vary by task, reflecting the size and complexity of the dataset. The inference process, which includes feature extraction, model loading, feature reconstruction, and HI computation for anomaly detection, required an average of 2.56 s per 10 min dataset. These computational times demonstrate the practical viability of the framework for continuous, near-real-time monitoring applications in wind turbine operations.
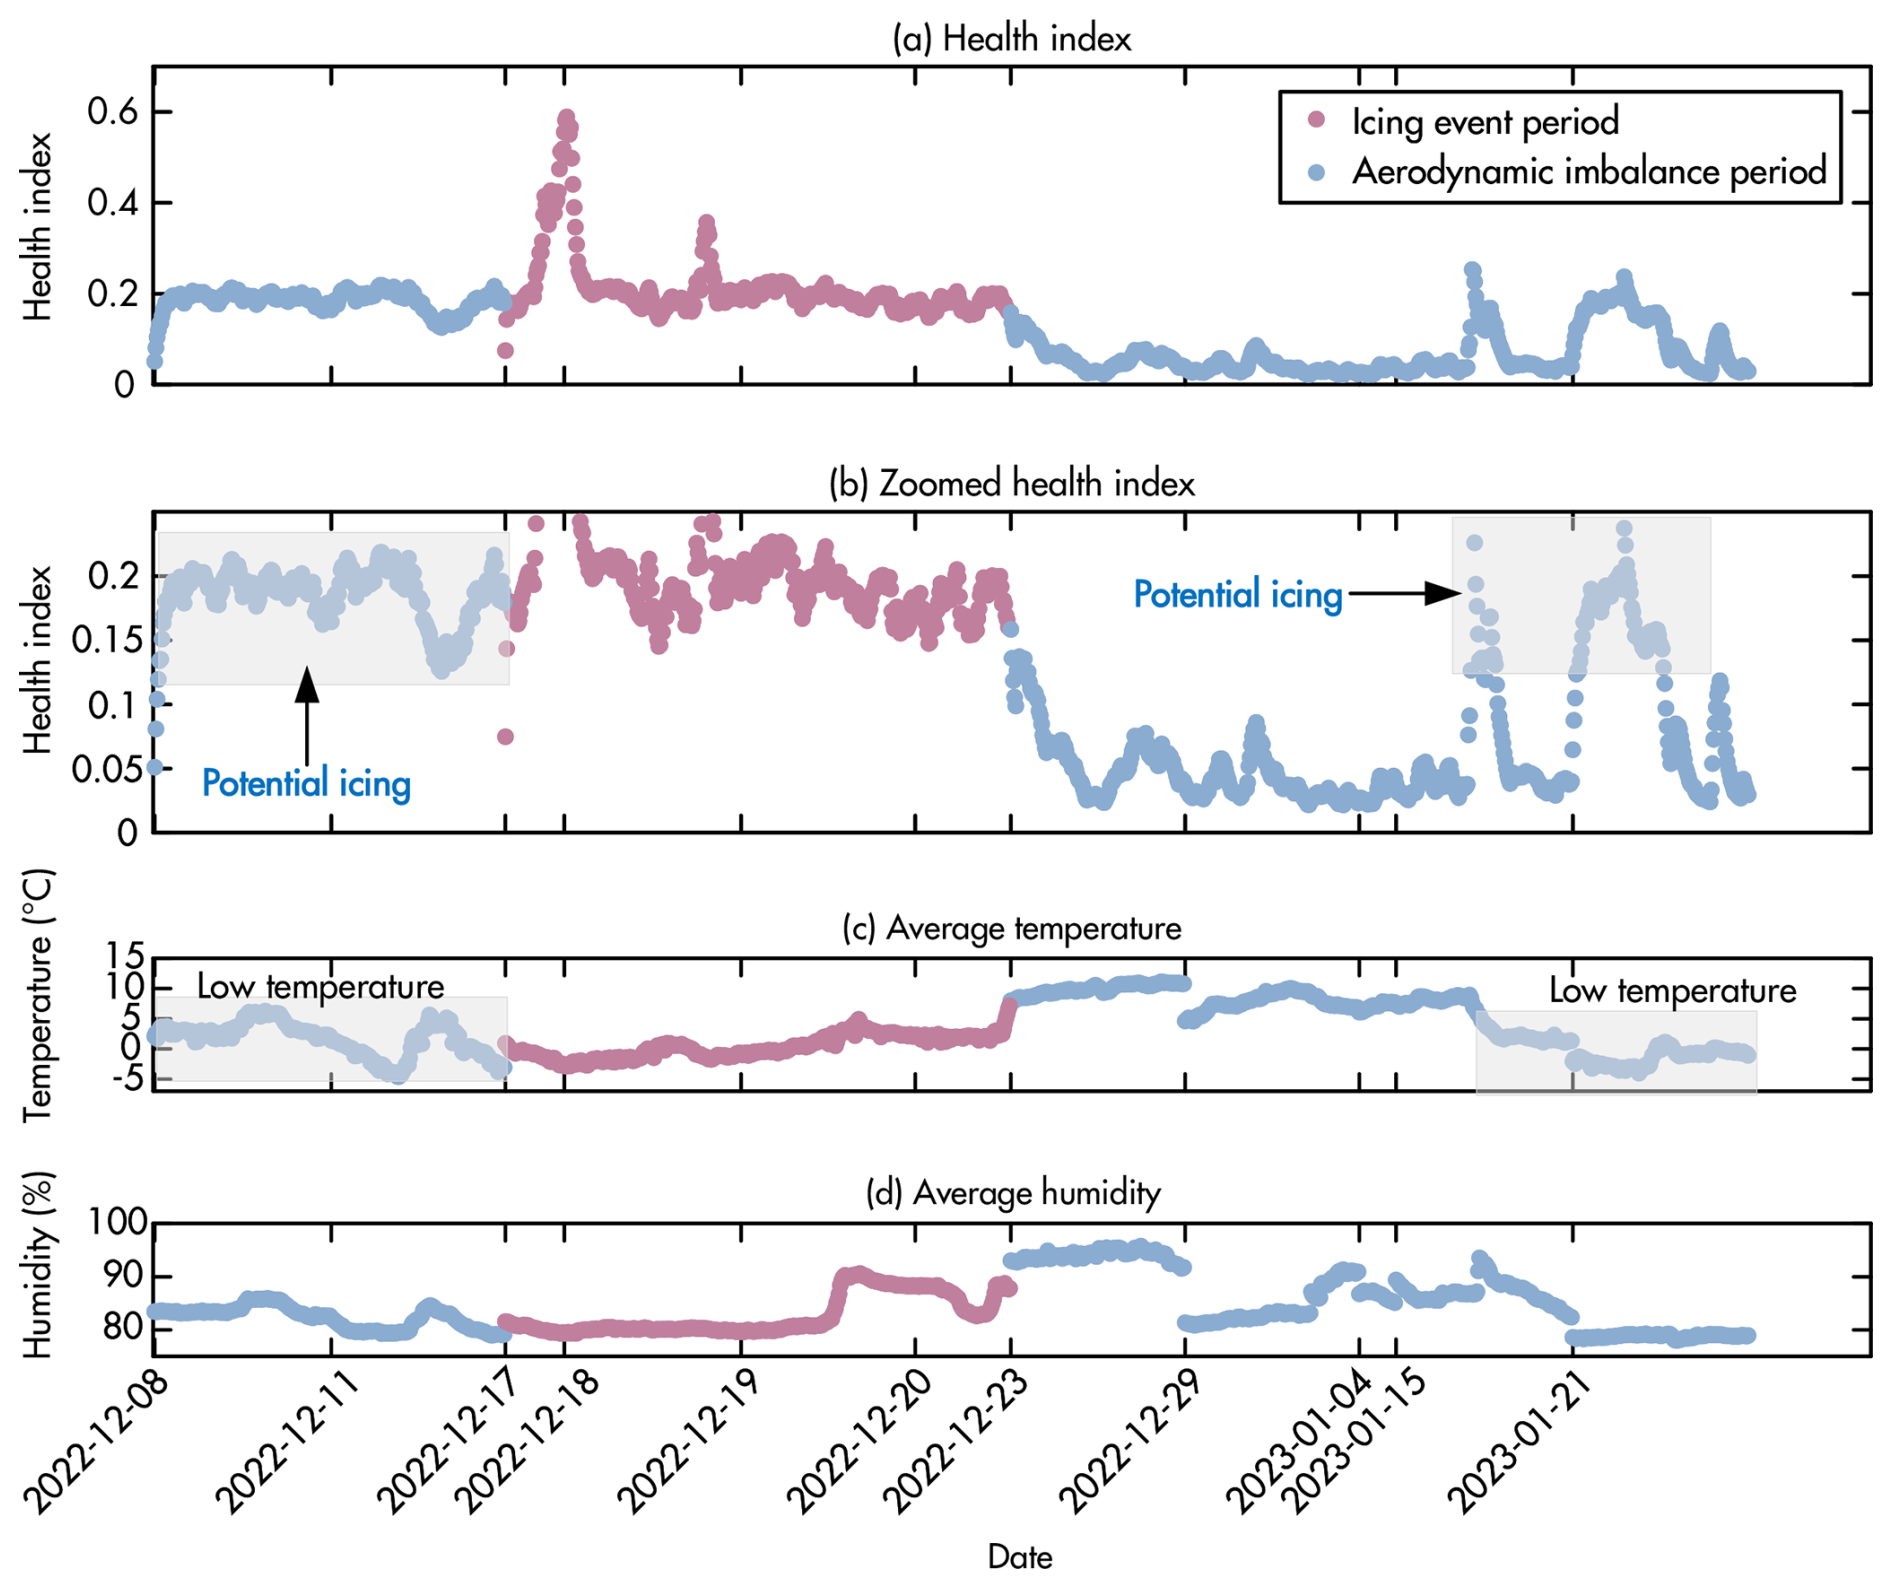
Figure 15(a) Comparison of HI values for icing events and aerodynamic imbalance periods, (b) zoomed-in HI values, (c) temperature data trends, and (d) humidity data trends during the monitoring period.
4.6 Discussion
This section provides a more profound insight into the framework's ability to interpret and differentiate between various fault types based on the HI values, particularly focusing on icing events and aerodynamic imbalances. Figure 15 graphically illustrates the HI values alongside the relevant environmental data.
Rotor icing not only alters the aerodynamic properties of the blades but also introduces mass imbalance, leading to pronounced deviations in vibration signals. These combined effects typically result in higher reconstruction errors and higher HI values. In contrast, the aerodynamic imbalance caused by the roughness tape is primarily localized, with less severe effects on the rotor dynamics, often producing lower HI values. As shown in Fig. 15a and b, HI values during icing events are generally higher than those observed during aerodynamic imbalance periods, except for the period from 8 to 11 December 2022.
In particular, as can be seen in Fig. 15b, during the period from 8 to 11 December 2022, highlighted in the shaded region, the framework detected HI values comparable to those observed during the confirmed icing event from 17 to 20 December 2022. Analysis of environmental data, including low temperatures and high humidity (Fig. 15c and d), suggests that the conditions were conducive to icing formation. This raises the hypothesis that icing may have co-occurred with aerodynamic imbalance during this period. Similarly, there are potential indications of icing events on 15 and 21 January 2023, based on similar environmental conditions.
This ability to identify periods with high HI values correlating with conducive environmental conditions, even without direct fault labels, underscores the framework's potential for proactive and insightful operational diagnostics. If these potential icing events were to be confirmed, a simple threshold on the HI values could effectively differentiate between icing and aerodynamic imbalance, based on their distinct HI magnitudes. The results from this analysis highlight the framework's advanced potential not only for detecting anomalies but also for contributing to the differentiation of fault types based on their characteristic HI signatures.
This paper presented a semi-supervised fault detection framework that integrates multi-channel vibration analysis with deep learning. The core of the methodology is to build a robust model of a wind turbine's normal operational state using only healthy data. This is achieved by training a variational autoencoder on a comprehensive set of time-domain and frequency-domain features extracted from vibration signals. An exponentially weighted moving average is then applied to the VAE's reconstruction error to create a stable and reliable health index, minimizing the risk of false alarms. The framework's effectiveness is validated on the ETH Zurich research turbine dataset, covering three distinct fault types. The experimental results demonstrate a high level of performance. Notably, the framework provided a 2.5 h early warning for a critical pitch drive failure and achieved perfect (100 %) accuracy in detecting both simulated aerodynamic imbalances and naturally occurring icing events. The experimental results validate the framework's effectiveness in providing timely and accurate fault detection, offering sufficient lead time for proactive maintenance. These findings confirm that the approach provides timely and accurate fault detection, a capability crucial for enhancing operational reliability and minimizing downtime.
While the framework demonstrates promising detection capability, several limitations exist. The models were trained on data from a single turbine during specific measurement campaigns, and generalization to other turbines or extended operational periods requires further validation. The framework provides anomaly detection without detailed fault diagnosis, and the use of general statistical features limits physical interpretability compared to wind-turbine-specific features. Additionally, as a static baseline approach, the framework would require periodic retraining or integration with alarm management systems for long-term deployment to handle gradual turbine aging while maintaining sensitivity to new faults. Future work should address these limitations through validation across multiple turbines and extended operational periods, extension to fault localization and identification capabilities, exploration of hybrid approaches combining general features with physics-informed characteristics, and investigation of adaptive learning strategies for sustained operational deployment.
Figure A1 presents the training convergence behavior for both Model 1 and Model 2. Both models demonstrate successful learning, with the total loss decreasing steadily and stabilizing, indicating effective learning of normal operational patterns and proper regularization of the latent space.
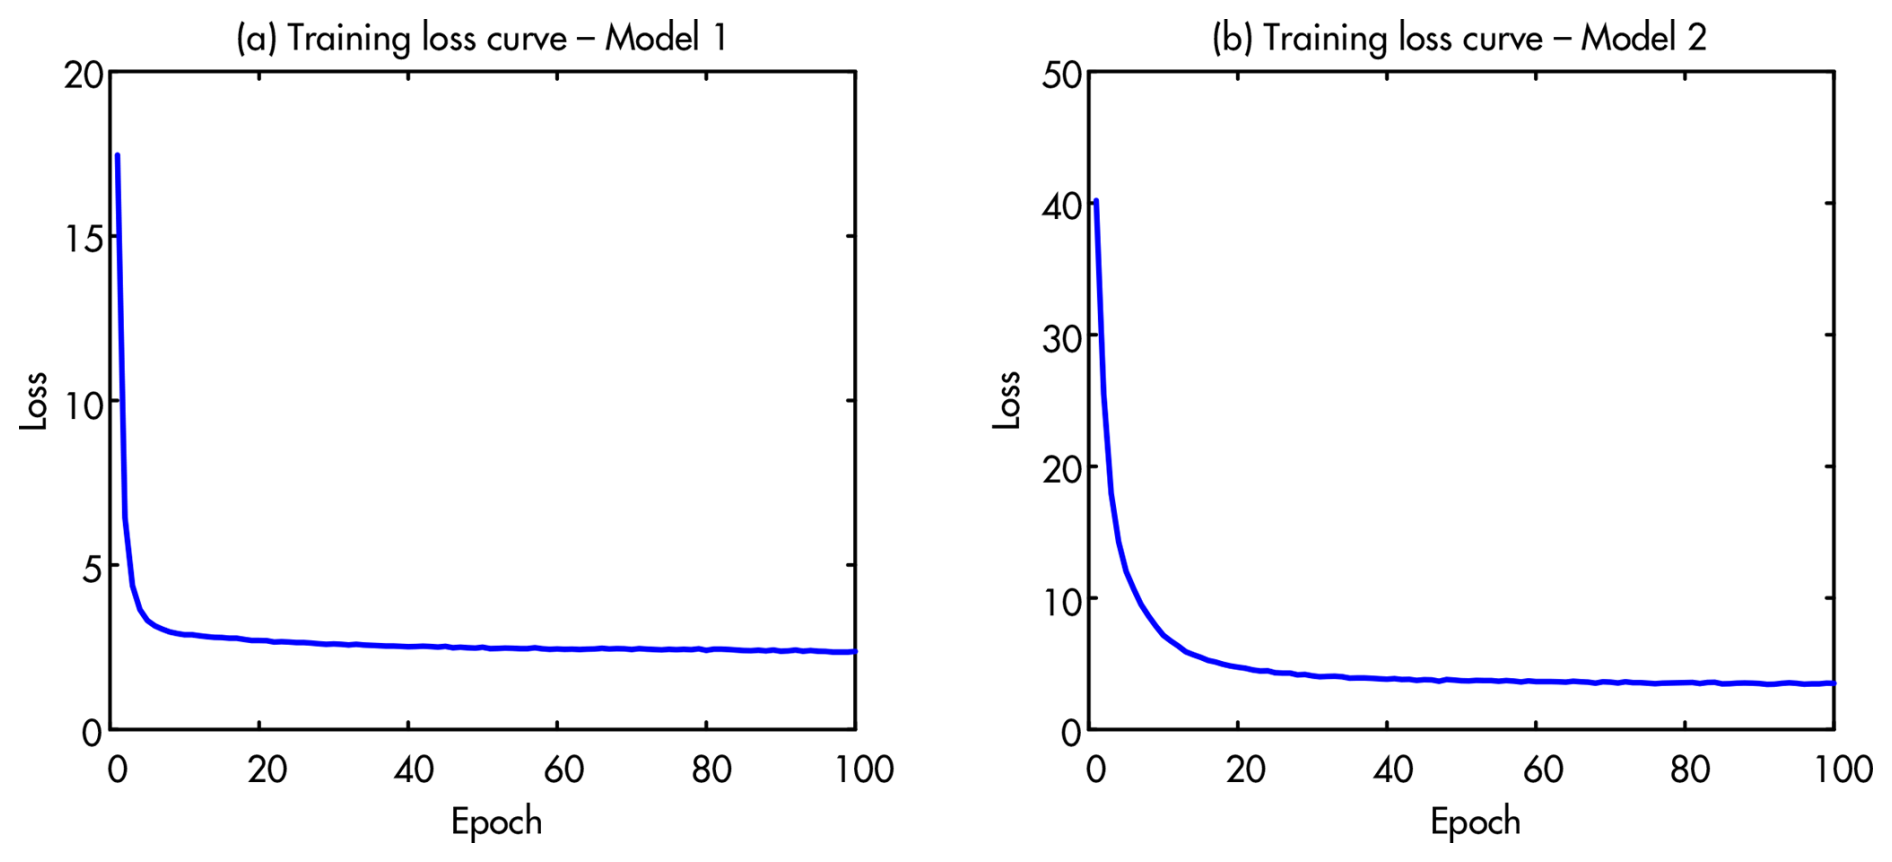
Figure A1Training convergence curves for (a) Model 1 (pitch fault detection) and (b) Model 2 (aerodynamic imbalance and icing detection), showing the total loss over 100 training epochs.
The source code is publicly available at https://github.com/shun-wang1/wedowind-challenge-ASCE-EMI/tree/main.
The challenge dataset was provided through Zenodo https://doi.org/10.5281/zenodo.8229750 (Chatzi et al., 2023).
SW contributed to the paper by performing data analysis, developing methodology, and preparing the original draft of the manuscript. YV and FP contributed to the paper by conducting formal analysis, securing funding for the project, and reviewing and editing the paper.
At least one of the (co-)authors is a member of the editorial board of Wind Energy Science. The peer-review process was guided by an independent editor, and the authors also have no other competing interests to declare.
Publisher's note: Copernicus Publications remains neutral with regard to jurisdictional claims made in the text, published maps, institutional affiliations, or any other geographical representation in this paper. While Copernicus Publications makes every effort to include appropriate place names, the final responsibility lies with the authors. Views expressed in the text are those of the authors and do not necessarily reflect the views of the publisher.
This work is partially funded by (i) grant PID2021-122132OB-C21, funded by MCIN/AEI/10.13039/501100011033 and the ERDF “A way of making Europe” project of the European Union; (ii) grant TED2021-129512B-I00, funded by MCIN/AEI/10.13039/ 501100011033 and the European Union NextGenerationEU/PRTR; and (iii) grant 2021-SGR-01044, funded by the Generalitat de Catalunya.
This research has been supported by the Agencia Estatal de Investigación (grant nos. PID2021-122132OB-C21 and TED2021-129512B-I00) and the Generalitat de Catalunya, Agència de Gestió d'Ajuts Universitaris i de Recerca (grant no. 2021-SGR-01044).
This paper was edited by Nikolay Dimitrov and reviewed by three anonymous referees.
Abid, A., Khan, M. T., and Iqbal, J.: A review on fault detection and diagnosis techniques: basics and beyond, Artificial Intelligence Review, 54, 3639–3664, 2021. a
Ashkarkalaei, M., Ghiasi, R., Pakrashi, V., and Malekjafarian, A.: Feature selection for unsupervised defect detection of a wind turbine blade considering operational and environmental conditions, Mechanical Systems and Signal Processing, 230, 112568, https://doi.org/10.1016/j.ymssp.2025.112568, 2025. a, b
Badihi, H., Zhang, Y., Jiang, B., Pillay, P., and Rakheja, S.: A comprehensive review on signal-based and model-based condition monitoring of wind turbines: Fault diagnosis and lifetime prognosis, Proceedings of the IEEE, 110, 754–806, 2022. a
Bertelè, M., Bottasso, C. L., and Cacciola, S.: Automatic detection and correction of pitch misalignment in wind turbine rotors, Wind Energ. Sci., 3, 791–803, https://doi.org/10.5194/wes-3-791-2018, 2018. a
Bilendo, F., Lu, N., Badihi, H., Meyer, A., Cali, Ü., and Cambron, P.: Multitarget normal behavior model based on heterogeneous stacked regressions and change-point detection for wind turbine condition monitoring, IEEE Transactions on Industrial Informatics, 20, 5171–5181, 2023. a
Cacciola, S., Agud, I. M., and Bottasso, C. L.: Detection of rotor imbalance, including root cause, severity and location, Journal of Physics: Conference Series, 753, 072003, https://doi.org/10.1088/1742-6596/753/7/072003, 2016. a
Castellani, F., Natili, F., Astolfi, D., and Vidal, Y.: Wind turbine gearbox condition monitoring through the sequential analysis of industrial SCADA and vibration data, Energy Reports, 12, 750–761, 2024. a
Chatzi, E., Abdallah, I., Hofsäß, M., Bischoff, O., Barber, S., and Marykovskiy, Y.: Aventa AV-7 ETH Zurich Research Wind Turbine SCADA and high frequency Structural Health Monitoring (SHM) data, Zenodo [Data set], https://doi.org/10.5281/zenodo.8229750, 2023. a
Chatzi, E., Abdallah, I., Hofsäß, M., Bischoff, O., Barber, S., and Marykovskiy, Y.: Aventa AV-7 ETH Zurich Research Wind Turbine SCADA and High-Frequency Structural Health Monitoring (SHM) Data, Zenodo, https://doi.org/10.5281/zenodo.8229750, 2023. a, b, c, d
Chen, H., Liu, H., Chu, X., Liu, Q., and Xue, D.: Anomaly detection and critical SCADA parameters identification for wind turbines based on LSTM-AE neural network, Renewable Energy, 172, 829–840, 2021. a, b
Chen, J., Li, J., Chen, W., Wang, Y., and Jiang, T.: Anomaly detection for wind turbines based on the reconstruction of condition parameters using stacked denoising autoencoders, Renewable Energy, 147, 1469–1480, 2020. a, b
Chen, W., Zhou, H., Cheng, L., and Xia, M.: Condition Monitoring and Anomaly Detection of Wind Turbines using Temporal Convolutional Informer and Robust Dynamic Mahalanobis Mahalanobis Distance, IEEE Transactions on Instrumentation and Measurement, 72, https://doi.org/10.1109/TIM.2023.3329105, 2023. a
Chen, Y. and Griffith, D. T.: Blade mass imbalance identification and estimation for three-bladed wind turbine rotor based on modal analysis, Mechanical Systems and Signal Processing, 197, 110341, https://doi.org/10.1016/j.ymssp.2023.110341 2023. a
Chesterman, X., Verstraeten, T., Daems, P.-J., Nowé, A., and Helsen, J.: Overview of normal behavior modeling approaches for SCADA-based wind turbine condition monitoring demonstrated on data from operational wind farms, Wind Energ. Sci., 8, 893–924, https://doi.org/10.5194/wes-8-893-2023, 2023. a, b
Council, G. W. E.: Global Wind Report 2025, https://www.gwec.net/reports/globalwindreport/ (last access: 27 November 2025), 2025. a
Cuesta, J., Leturiondo, U., Vidal, Y., and Pozo, F.: A review of prognostics and health management techniques in wind energy, Reliability Engineering & System Safety, 260, 111004, https://doi.org/10.1016/j.ress.2025.111004, 2025. a, b
Dey, S., Pisu, P., and Ayalew, B.: A comparative study of three fault diagnosis schemes for wind turbines, IEEE Transactions on Control Systems Technology, 23, 1853–1868, 2015. a
Dibaj, A., Gao, Z., and Nejad, A. R.: Fault detection of offshore wind turbine drivetrains in different environmental conditions through optimal selection of vibration measurements, Renewable Energy, 203, 161–176, 2023. a
Ding, P., Jia, M., and Yan, X.: Stationary subspaces-vector autoregressive with exogenous terms methodology for degradation trend estimation of rolling and slewing bearings, Mechanical Systems and Signal Processing, 150, 107293, https://doi.org/10.1016/j.ymssp.2020.107293, 2021. a
Doersch, C.: Tutorial on variational autoencoders, arXiv [preprint], arXiv:1606.05908, 2016. a, b, c, d, e
Encalada-Dávila, Á., Moyón, L., Tutivén, C., Puruncajas, B., and Vidal, Y.: Early fault detection in the main bearing of wind turbines based on Gated Recurrent Unit (GRU) neural networks and SCADA data, IEEE/ASME Transactions on Mechatronics, 27, 5583–5593, 2022. a, b
Ghiasi, R., Khan, M. A., Sorrentino, D., Diaine, C., and Malekjafarian, A.: An unsupervised anomaly detection framework for onboard monitoring of railway track geometrical defects using one-class support vector machine, Engineering Applications of Artificial Intelligence, 133, 108167, https://doi.org/10.1016/j.engappai.2024.108167, 2024. a
Habibi, H., Howard, I., and Simani, S.: Reliability improvement of wind turbine power generation using model-based fault detection and fault tolerant control: A review, Renewable Energy, 135, 877–896, 2019. a
He, Y., Liu, J., Wu, S., and Wang, X.: Condition monitoring and fault detection of wind turbine driveline with the implementation of deep residual long short-term memory network, IEEE Sensors Journal, 23, 13360–13376, 2023. a, b
Irena, I.: Renewable power generation costs in 2017, Report, International Renewable Energy Agency, Abu Dhabi, https://www.irena.org/publications/2018/Jan/Renewable-power-generation-costs-in-2017 (last access: 27 November 2025), 2018. a
Jiang, G., Xie, P., He, H., and Yan, J.: Wind turbine fault detection using a denoising autoencoder with temporal information, IEEE/ASME Transactions on Mechatronics, 23, 89–100, 2017. a, b
Jiang, G., He, H., Yan, J., and Xie, P.: Multiscale convolutional neural networks for fault diagnosis of wind turbine gearbox, IEEE Transactions on Industrial Electronics, 66, 3196–3207, 2018. a
Jiang, Y., Tang, B., Qin, Y., and Liu, W.: Feature extraction method of wind turbine based on adaptive Morlet wavelet and SVD, Renewable Energy, 36, 2146–2153, 2011. a
Jin, X., Lv, S., Kong, Z., Yang, H., Zhang, Y., Guo, Y., and Xu, Z.: Graph Spatio-Temporal Networks for Condition Monitoring of Wind Turbine, IEEE Transactions on Sustainable Energy, 15, https://doi.org/10.1109/TSTE.2024.3411884, 2024. a
Kingma, D. P. and Welling, M.: Auto-encoding variational bayes, in: Proceedings of the 2nd International Conference on Learning Representations (ICLR), Banff, AB, Canada, https://doi.org/10.48550/arXiv.1312.6114, 2014. a
Li, X., Cheng, C., and Peng, Z.: Unsupervised construction of health indicator for rotating machinery via multi-criterion feature selection and attentive variational autoencoder, Science China Technological Sciences, 67, 1524–1537, 2024. a
Liu, J., Yang, G., Li, X., Hao, S., Guan, Y., and Li, Y.: A deep generative model based on CNN-CVAE for wind turbine condition monitoring, Measurement Science and Technology, 34, 035902, https://doi.org/10.1088/1361-6501/aca496, 2022. a
Liu, X., Teng, W., Wu, S., Wu, X., Liu, Y., and Ma, Z.: Sparse dictionary learning based adversarial variational auto-encoders for fault identification of wind turbines, Measurement, 183, 109810, https://doi.org/10.1016/j.measurement.2021.109810, 2021. a
Mylonas, C., Abdallah, I., and Chatzi, E.: Conditional variational autoencoders for probabilistic wind turbine blade fatigue estimation using Supervisory, Control, and Data Acquisition data, Wind Energy, 24, 1122–1139, 2021. a
Pandit, R. and Wang, J.: A comprehensive review on enhancing wind turbine applications with advanced SCADA data analytics and practical insights, IET Renewable Power Generation, 18, 722–742, 2024. a
Peng, D., Desmet, W., and Gryllias, K.: Reconstruction-based deep unsupervised adaptive threshold support vector data description for wind turbine anomaly detection, Reliability Engineering & System Safety, 260, 110995, https://doi.org/10.1016/j.ress.2025.110995, 2025. a
Ren, Z., Verma, A. S., Li, Y., Teuwen, J. J., and Jiang, Z.: Offshore wind turbine operations and maintenance: A state-of-the-art review, Renewable and Sustainable Energy Reviews, 144, 110886, https://doi.org/10.1016/j.rser.2021.110886, 2021. a
Rezamand, M., Kordestani, M., Carriveau, R., Ting, D. S.-K., Orchard, M. E., and Saif, M.: Critical wind turbine components prognostics: A comprehensive review, IEEE Transactions on Instrumentation and Measurement, 69, 9306–9328, 2020. a, b
Riva, R., Cacciola, S., and Bottasso, C. L.: Periodic stability analysis of wind turbines operating in turbulent wind conditions, Wind Energ. Sci., 1, 177–203, https://doi.org/10.5194/wes-1-177-2016, 2016. a
Rolinek, M., Zietlow, D., and Martius, G.: Variational autoencoders pursue pca directions (by accident), in: Proceedings of the IEEE/CVF Conference on Computer Vision and Pattern Recognition, pp. 12406–12415, https://doi.org/10.1109/CVPR.2019.01269, 2019. a
Sandoval, D., Leturiondo, U., Vidal, Y., and Pozo, F.: Entropy indicators: An approach for low-speed bearing diagnosis, Sensors, 21, 849, https://doi.org/10.3390/s21030849, 2021. a
Singh, D., Dwight, R., and Viré, A.: Probabilistic surrogate modeling of damage equivalent loads on onshore and offshore wind turbines using mixture density networks, Wind Energ. Sci., 9, 1885–1904, https://doi.org/10.5194/wes-9-1885-2024, 2024. a
Singh, D., Haugen, E., Laugesen, K., P. Dwight, R., and Viré, A.: Data-driven probabilistic surrogate model for floating wind turbine lifetime damage equivalent load prediction, Wind Energ. Sci. Discuss. [preprint], https://doi.org/10.5194/wes-2025-24, in review, 2025. a
Su, X., Shan, Y., Li, C., Mi, Y., Fu, Y., and Dong, Z.: Spatial-temporal attention and GRU based interpretable condition monitoring of offshore wind turbine gearboxes, IET Renewable Power Generation, 16, 402–415, 2022. a
Sun, S., Li, Q., Hu, W., Liang, Z., Wang, T., and Chu, F.: Wind turbine blade breakage detection based on environment-adapted contrastive learning, Renewable Energy, 219, 119487, https://doi.org/10.1016/j.renene.2023.119487, 2023. a
Tutivén, C., Vidal, Y., Insuasty, A., Campoverde-Vilela, L., and Achicanoy, W.: Early fault diagnosis strategy for WT main bearings based on SCADA data and one-class SVM, Energies, 15, 4381, https://doi.org/10.3390/en15124381, 2022. a
Visbech, J., Göçmen, T., Özçakmak, Ö. S., Meyer Forsting, A., Hannesdóttir, Á., and Réthoré, P.-E.: Aerodynamic effects of leading-edge erosion in wind farm flow modeling, Wind Energ. Sci., 9, 1811–1826, https://doi.org/10.5194/wes-9-1811-2024, 2024. a
Wang, A., Qian, Z., Pei, Y., and Jing, B.: A de-ambiguous condition monitoring scheme for wind turbines using least squares generative adversarial networks, Renewable Energy, 185, 267–279, 2022. a
Wang, S., Vidal, Y., and Pozo, F.: An unsupervised approach to early fault detection and performance degradation assessment in bearings, Advanced Engineering Informatics, 68, 103620, https://doi.org/10.1016/j.aei.2025.103620, 2025a. a
Wang, Z., Zhang, M., Chen, H., Li, J., Li, G., Zhao, J., Yao, L., Zhang, J., and Chu, F.: A generalized fault diagnosis framework for rotating machinery based on phase entropy, Reliability Engineering & System Safety, 256, 110745, https://doi.org/10.1016/j.ress.2024.110745, 2025b. a
WeDoWind: The RTDT Research Affiliate Programme Space, https://www.wedowind.ch/spaces/the-rtdt-research-affiliate-programme-space (last access: 27 November 2025), 2025. a
Wu, P., Wang, Y., Zhang, X., Gao, J., Wang, L., and Liu, Y.: Wind Turbine Blade Breakage Monitoring with Mogrifier LSTM Autoencoder, IEEE Transactions on Instrumentation and Measurement, 72, https://doi.org/10.1109/TIM.2023.3323967, 2023. a
Xu, H., Pang, G., Wang, Y., and Wang, Y.: Deep isolation forest for anomaly detection, IEEE Transactions on Knowledge and Data Engineering, 35, 12591–12604, 2023. a
Xu, X., Huang, X., Bian, H., Wu, J., Liang, C., and Cong, F.: Total process of fault diagnosis for wind turbine gearbox, from the perspective of combination with feature extraction and machine learning: A review, Energy and AI, 15, 100318, https://doi.org/10.1016/j.egyai.2023.100318, 2024. a
Yan, X., Xu, Y., She, D., and Zhang, W.: Reliable fault diagnosis of bearings using an optimized stacked variational denoising auto-encoder, Entropy, 24, 36, 2021. a
Yang, T., Jiang, L., Guo, Y., Han, Q., and Li, X.: LTFM-net framework: Advanced intelligent diagnostics and interpretability of insulated bearing faults in offshore wind turbines under complex operational conditions, Ocean Engineering, 309, 118533, https://doi.org/10.1016/j.oceaneng.2024.118533, 2024. a
Ying, W., Li, Y., Noman, K., Zheng, J., Wang, D., Feng, K., and Li, Z.: Stockwell transform spectral amplitude modulation method for rotating machinery fault diagnosis, Mechanical Systems and Signal Processing, 223, 111884, https://doi.org/10.1016/j.ymssp.2024.111884, 2025. a
Yu, W., Kim, I. Y., and Mechefske, C.: An improved similarity-based prognostic algorithm for RUL estimation using an RNN autoencoder scheme, Reliability Engineering & System Safety, 199, 106926, https://doi.org/10.1016/j.ress.2020.106926, 2020. a
Zhang, C., Hu, D., and Yang, T.: Anomaly detection and diagnosis for wind turbines using long short-term memory-based stacked denoising autoencoders and XGBoost, Reliability Engineering & System Safety, 222, 108445, https://doi.org/10.1016/j.ress.2022.108445, 2022. a
Zhou, H., Huang, X., Wen, G., Lei, Z., Dong, S., Zhang, P., and Chen, X.: Construction of health indicators for condition monitoring of rotating machinery: A review of the research, Expert Systems with Applications, 203, 117297, https://doi.org/10.1016/j.eswa.2022.117297, 2022. a