the Creative Commons Attribution 4.0 License.
the Creative Commons Attribution 4.0 License.
Proof of concept for multirotor systems with vortex-generating modes for regenerative wind energy: a study based on numerical simulations and experimental data
Flavio Avila Correia Martins
Alexander van Zuijlen
Carlos Simão Ferreira
This study investigates the potential of regenerative wind farming using multirotor systems equipped with paired multirotor-sized wings, termed atmospheric boundary layer control (ABL-control) devices, positioned in the near-wake region of the multirotor. These ABL-control devices generate vortical flow structures that enhance vertical momentum flux from the flow above the wind farm into the wind farm flow, thereby accelerating the wake recovery process. This work presents numerical assessments of a single multirotor system equipped with various ABL-control configurations. The wind flow is modeled using steady-state Reynolds-averaged Navier–Stokes (RANS) computations, with the multirotor and ABL-control devices represented by three-dimensional actuator surface models based on momentum theory. Force coefficient data for the actuator surface models, as well as validation data for the numerical computations, were obtained from a scaled model at TU Delft's Open Jet Facility. The performance of the ABL-control devices was evaluated by analyzing the net momentum entrained from the flow above the wind farm and the total pressure and power available in the wake. The results indicate that, when the ABL-control strategy is employed, vertical momentum flux may become the dominant mechanism for wake recovery. In configurations with two or four ABL-control wings, the total wind power in the wake recovers to 95 % of the free-stream value at positions as early as downstream of the multirotor system, representing a recovery rate that is approximately an order of magnitude faster than that observed in the baseline wake without ABL-control capabilities. It should be noted, however, that this study employs a simplified numerical setup to provide a proof of concept, and the current findings are not yet directly applicable to real-world scenarios.
- Article
(5619 KB) - Full-text XML
- BibTeX
- EndNote
Our energy transition goals require a substantial increase in installed wind power capacity, which is typically achieved by expanding the number and size of wind farms. However, scaling up wind farms – whether onshore or offshore – introduces various challenges, including technical, environmental, economic, and social acceptance issues. For instance, large onshore wind farms can lead to conflicts with nearby communities due to noise and visual-impact concerns (Zerrahn, 2017; McKenna et al., 2015). Similarly, large offshore wind farms often encounter high operational and energy transmission costs (Sadorsky, 2021). To address the demand for larger wind farm areas, it is crucial to improve the ratio of total power output per unit of land or sea surface area by enhancing the wake recovery process. This study evaluates multiple configurations of a novel atmospheric boundary layer control (ABL-control) strategy (Ferreira et al., 2024) which enhances vertical momentum flux within a wind farm, thereby increasing the total power output per unit area.
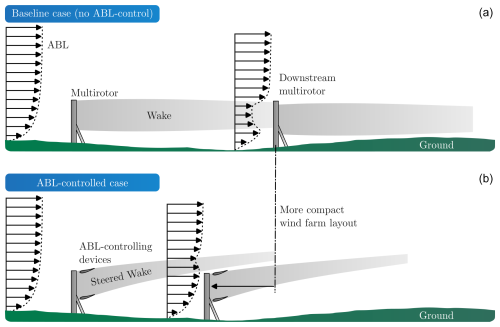
Figure 1The figure provides a schematic representation of the wake generated by a multirotor system, shown before (a) and after (b) the implementation of ABL-control systems. The ABL control directs the wake upward into the atmosphere, enhancing vertical momentum flux and accelerating wake recovery. This mechanism allows ABL-controlled wind farms to achieve higher power output per unit of land or sea area, facilitating a more compact wind farm design.
The need for larger wind farms is intrinsically linked to the spacing required to ensure effective wind energy recovery between successive wind turbines (refer to the top diagram in Fig. 1). Given that the characteristic height of the ABL typically extends to approximately 1 km, wind farms spanning areas of 10–20 km or more can approach the asymptotic limit of “infinite” wind farms. In this regime, the boundary layer flow may achieve a fully developed state, wherein the majority of kinetic energy must be entrained from above the farm (Abkar and Porté-Agel, 2013). As turbulent mixing under these conditions is inefficient in transferring momentum from the flow above the farm to the wind farm flow, improved strategies for optimizing wind farm power output are required. The most prevalent strategies for this purpose can be broadly categorized into two strategies: (i) thrust vectoring and (ii) thrust magnitude control.
Thrust vectoring strategies aim to introduce cross-flow momentum, steering the wake of upstream turbines away from downwind turbines. Numerous studies have focused on improving wind farm power output through yaw-control strategies for thrust vectoring (Howland et al., 2019). According to Newton's third law, the thrust exerted by a turbine on the wind generates an equal and opposite reaction force. Thus, if an upstream turbine is yawed positively, the wake will skew negatively and vice versa. Research on yaw control for wake steering has been ongoing for at least 2 decades, with significant advancements in the last 10 years, particularly for horizontal-axis wind turbines (HAWTs) (Houck, 2022). Various methods have been explored to optimize yaw angle controllers (Doekemeijer et al., 2020; Simley et al., 2020). For instance, Doekemeijer et al. (2020) reported a 1.4 % increase in energy yield in their simulations compared to a baseline case, while Simley et al. (2020) found improvements of up to 3.24 % using a variable yaw-control strategy. In vertical-axis wind turbine (VAWT) farms, wake deflection is typically achieved by modifying the rotor blade configuration to introduce momentum transfer driven by vorticity into the wake. For example, Huang et al. (2023) reported a 13.1 % increase in energy yield compared to a baseline case when implementing active pitch control in their VAWT experiments.
Thrust vectoring can also be achieved via blade-pitch control strategies, which aim to manipulate a turbine's induction factor by dynamically adjusting its operating point to steer the wake (Dilip and Porté-Agel, 2017). Wake recovery through blade-pitch control has gained attention more recently. For example, Ferreira (2009) explored how pitched H- and W-type VAWTs generate two counter-rotating tip vortices at the blade ends, enhancing wake deflection compared to non-pitched blades (Tescione et al., 2014; Ryan et al., 2016; Wei et al., 2021). Similarly, Jadeja (2018) examined the topologies of wakes deflected by pitched VAWTs using actuator line models with unsteady Reynolds-averaged Navier–Stokes (RANS) simulations, finding that wake-deflection strategies via VAWT blade pitching do not compromise the performance of upstream turbines, unlike yaw-control strategies. Additionally, Huang (2023) measured wake deflections of an H-shaped VAWT at various pitching angles, demonstrating that blade-tip vortices could effectively double the rate of lateral wake deflection through active pitch control.
Thrust magnitude control strategies aim to mitigate power losses by accelerating wake recovery. A common approach within this framework is axial induction control, where the goal is to modulate the wake strength of upstream turbines to enhance overall wind farm power production. This strategy involves reducing the induction factor of upstream turbines to increase the kinetic energy available to downstream turbines (Bartl and Sætran, 2016). Most research on axial induction control relies on low-fidelity simulations and analytical models that approximate wake–turbine and wake–wake interactions, yielding promising results (Abbes and Allagui, 2016; Ahmad et al., 2019). However, as noted by Kheirabadi and Nagamune (2019), power gains observed in experimental implementations of axial induction control have been relatively modest.
Innovative thrust magnitude control strategies such as pulse (Munters and Meyers, 2018) and helix (Frederik et al., 2020) have also been investigated. The pulse method involves rapid pulsating pitch adjustments to reduce load peaks and manage power output (van den Berg et al., 2023). Both pulse and helix methods disturb the wake through dynamic blade pitching, initiating natural mixing processes closer to the turbines. In the pulse method, the pitch angle of all rotor blades is varied collectively in a sinusoidal pattern. Conversely, the helix strategy controls the blade-pitch angle individually, with sinusoidal variations and phase offsets between the blades. Simulation studies indicate that these methods can increase the power output of a two-turbine wind farm by up to 5 % with the pulse method and up to 7.5 % with the helix method under turbulent inflow conditions (Frederik et al., 2020).
Despite their potential, the wake recovery strategies mentioned above share common limitations. They necessitate complex modifications to wind farm control algorithms, which may conflict with reliability and safety-oriented controls. These strategies can also impose additional loading patterns on conventional turbine designs, potentially leading to premature failures (Wang et al., 2020). Moreover, they typically penalize the performance of individual turbines to enhance wake re-energizing, with the expectation that the downstream turbines' power gains will outweigh the upstream losses. As a result, total power production increases are rarely more than about 30 % under optimal laboratory conditions (Bader et al., 2018). For example, Gebraad et al. (2017) reported a 5 % increase in annual energy production at the Princess Amalia Wind Farm in the Netherlands using a combined layout optimization and yaw steering control strategy. Therefore, these methodologies may have limited potential for reducing wind farm size in real-world scenarios.
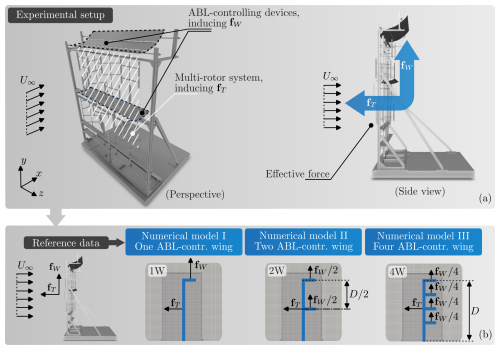
Figure 2Panel (a) provides an overview of the reference experimental setup, while panel (b) presents the corresponding numerical model based on momentum theory. In the experimental setup, the thrust force vector of the multirotor system, fT, and the effective aerodynamic force of the ABL-control system, fW, are measured. In the numerical model, these forces are distributed homogeneously in a cell-weighted fashion to replicate the experimental conditions.
This study presents a wake-steering strategy aimed at enhancing the energy potential of wind farms, thereby enabling more compact wind farm layouts. We explore the use of multirotor systems equipped with rotor-sized wings, referred to as ABL-control devices, which are positioned in the near-wake region (see Fig. 1b). These rotor-sized wings generate vortical structures that enhance vertical momentum flux from above the ABL into the wind farm, thereby allowing for denser turbine configurations. While ABL-control systems are envisioned as comprising multiple multirotor setups with integrated ABL-control mechanisms, this paper focuses on evaluating the performance of a single multirotor system equipped with ABL-control devices. Both the multirotor and ABL-control devices are modeled using three-dimensional actuator surface models based on momentum theory (see Fig. 2).
Steady-state Reynolds-averaged Navier–Stokes (RANS) simulations with a uniform, laminar inlet are performed using OpenFOAM to evaluate this proof-of-concept regenerative wind energy system. It is important to highlight that the study utilizes a simplified numerical setup aimed at demonstrating proof of concept, and thus the findings are not yet directly applicable to real-world scenarios. The impact of induced drag by the ABL-control wings is assessed by comparing simulation models with and without induced drag, allowing for the isolation of additional wake induction effects resulting from the wings' drag. The performance of the ABL-control devices is evaluated based on the total pressure and streamwise momentum flux within the ABL across the wind farm. These numerical results are further supported by experimental data obtained from a scaled multirotor system at TU Delft's Open Jet Facility.
This paper is organized as follows. In Sect. 2, the governing equations, numerical setup, and description of the assessed test cases are presented. In Sect. 3, results are discussed. Section 3.2 delves into the main flow features of the ABL-controlled flows via analyses of the velocity and vorticity fields for different possible ABL device configurations. Section 3.3 is concerned with assessing the performance of the different ABL device layouts via analyses of the momentum fluxes and with quantifying the total pressure and power available in the wake.
2.1 The numerical model
We model the flow around the actuator surfaces using the steady-state Reynolds-averaged Navier–Stokes (RANS) equations for incompressible, turbulent flows (Darwish and Moukalled, 2016), defined as follows:
In Eqs. (1) and (2), represents the velocity vector, p is pressure, ρ is fluid density, and ν is the kinematic viscosity. The term represents the Reynolds stress tensor, coupling the mean flow with turbulence. Here, overbars, , denote time-averaged components, while primes, , represent fluctuations.
In this model, fT denotes the homogeneously distributed effective thrust force of the multirotor system, while fW represents the aerodynamic forces exerted by the ABL-control wings. These forces are uniformly distributed across the cells of the numerical model, simulating a steady-state flow condition. Due to the simplicity of the aerodynamic loads applied, unsteady models are deferred, and higher-fidelity simulations, such as large-eddy simulations (LESs), are considered unnecessary for this proof-of-concept study, which aims to maximize the number of analyzed configurations. As discussed in Sect. 3.1, the steady-state RANS model is sufficient for this proof-of-concept investigation.
Turbulent flow within the wind farm is modeled using the shear-stress-transport (SST) k–ω model (Menter et al., 2003), selected based on uncertainty assessments by Hornshøj-Møller et al. (2021). The SST model falls within the class of linear-eddy-viscosity RANS models, assuming a linear relationship between Reynolds stresses and the mean strain rate, following Boussinesq's hypothesis:
where νt is the eddy viscosity, is the mean strain-rate tensor, I is the identity tensor, and is the turbulent kinetic energy. The eddy viscosity is calculated from k and the specific dissipation rate, ω, using the following relationships:
Here, Tk,∞ and U∞ are the far-field turbulence intensity and velocity, respectively, with . The constant Cμ is 0.09, and D represents the reference length scale, which is the side length of the multirotor system (Fig. 2).
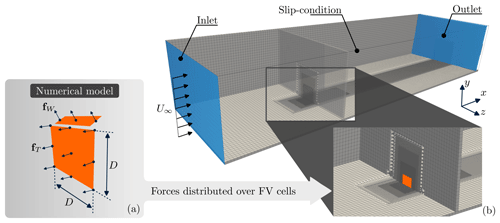
Figure 3Panel (a) shows details of the numerical model based on momentum theory; panel (b) shows details of the computational domain with the actuator forces modeled as momentum sources. The computational domain is highlighted at the top.
The effects of the multirotor system and ABL-control wings are modeled as body forces (Wu and Porté-Agel, 2011), distributed uniformly across the finite-volume cells corresponding to the multirotor and wing regions. The thrust force, fT, is incorporated into the momentum equation (Eq. 2) and calculated as
where CT is the experimentally measured thrust coefficient and D2 is the projected area of the multirotor system. Similarly, the force exerted by the ABL-control wings, fW, is represented as
where is the wing's effective force coefficient. These force coefficients, CT and CW, are determined from experimental data obtained from TU Delft's Open Jet Facility (Lignarolo et al., 2014). Further details on the experimental facility can be found in the corresponding reference.
2.2 Numerical setup
In this study, all numerical simulations were performed using OpenFOAM v9 (Greenshields, 2023; Weller et al., 1998), incorporating momentum sources fW and fT and calculated via a momentum-theory-based code developed by the authors (Martins, 2024). These momentum sources were distributed across the computational grid in a cell-volume-weighted manner, centered on the finite-volume cells representing the multirotor systems and the ABL-control wings. The multirotor region was modeled as a single finite-volume cell in the streamwise direction, extending 1D in the spanwise (z) direction. The height of the multirotor region is also 1D, with the base located at a distance of above the ground. The ABL-control wings were similarly represented as regions that were 1 finite-volume cell thick with a span of 1D. The computational domain measured in the streamwise (x), spanwise (z), and vertical (y) directions, respectively, with the multirotor array positioned 10D downstream of the inlet. These domain dimensions satisfy the minimum requirements necessary to mitigate boundary effects on turbine performance, as outlined by Rezaeiha et al. (2017) and Gargallo-Peiró et al. (2018). A schematic of the numerical setup is provided in Fig. 3.
A steady-state, incompressible solver, simpleFoam, was used for the simulations, utilizing the SIMPLE algorithm for pressure–velocity coupling. Gaussian integration was applied with different interpolation schemes for spatial discretization. Specifically, second-order linear interpolation was employed for gradient terms, second-order bounded upwind interpolation was employed for divergence terms, and second-order linearly corrected interpolation was employed for Laplacian terms. The pressure field was solved using a geometric agglomerated algebraic multigrid (V-cycle) solver with a Gauss–Seidel preconditioner, while its symmetric version was used for velocity and turbulence variables. An error tolerance of 1 × 10⁻⁶ was adopted for all smooth solvers.
Typically, modeling a neutral ABL involves prescribing inlet boundary conditions that provide log-law profiles for velocity and turbulence relative to the ground (Parekh and Verstappen, 2023). However, for this proof-of-concept study, a simplified approach was adopted, applying uniform (Dirichlet) profiles for both velocity and turbulence quantities at the inlet, with a zero-gradient (Neumann) boundary condition for pressure. This simplification helps generalize the results by removing complexities associated with ground-normal velocity profiles. The top and side boundaries of the domain were assigned no-slip (Dirichlet) boundary conditions for velocity, pressure, and turbulence variables, while the outlet boundary was modeled as a free-stream condition with zero-gradient pressure. The bottom boundary employed a slip (Neumann) condition for velocity and turbulence quantities, with a zero-gradient condition for pressure.
The free-stream velocity, U∞, corresponds to a Reynolds number based on the multirotor side length, , of approximately 4 × 10⁸. Turbulence quantities were computed assuming a baseline free-stream turbulence intensity of Tk,∞ = 1 %. Although this turbulence intensity does not fully replicate typical atmospheric conditions, it is consistent with experimental data obtained from tests conducted at TU Delft's Open Jet Facility. This selection ensures that the multirotor system is evaluated in an idealized environment where blade-tip vortices are minimally influenced by turbulence. It is important to note that if higher turbulence intensity levels were adopted, wake recovery due to turbulent mixing would be more pronounced than in the cases examined in this study.
2.3 Case descriptions
This study explores seven distinct configurations of wind regenerative systems, each comprising multirotor setups combined with four, two, one, or no ABL-control wings. To assess the impact of induced drag from the ABL-system wings on overall performance, the numerical models are divided into two categories: those accounting for induced drag and those without it. This distinction is critical, as the induced drag of the wings may intensify the multirotor's wake, potentially outweighing the wake regeneration benefits of the system.
Table 1The table provides a summary of the relevant operational parameters for the analyzed wind regenerative system configurations. The nomenclature is defined as follows: “nW” represents a configuration with n ABL-control wings, and “ND” (i.e., “no drag”) indicates the absence of induced drag from the wings.
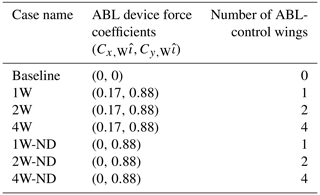
The thrust coefficient CT used in the simulations is based on experimental measurements of a scaled multirotor system operating at a tip-speed ratio of 3.1, yielding an effective thrust coefficient of approximately CT = 0.72. The ABL-control system is characterized by an effective lift coefficient of Cy,W = 0.82 and an induced-drag coefficient of Cx,W = 0.17. In all test cases, the momentum sources fT and fW are kept constant and uniformly distributed among the wings in a cell-volume-weighted fashion (refer to the lower panel of Fig. 2). A detailed summary of the cases investigated, along with their respective nomenclature, is presented in Table 1. Additional test cases are discussed in detail in Martins et al. (2024).
3.1 Grid convergence and computational model validation
The cell sizing was optimized to minimize the effect of grid resolution on total pressure, pt, defined as . Grid convergence was deemed achieved when the total pressure, measured at various planes downstream of the multirotor, exhibited consistency (within 1 %) despite further grid refinements. Successive grid refinements were implemented by halving the cell size, Δl.
Through the grid convergence study, the following cell sizes were found to be sufficient: in the near-wake region (defined as a box centered on the turbine), along the wake, and in the far-field region. This grid configuration produced a computational mesh of approximately 2.4 × 10⁶ cells, ensuring each blade-tip vortex was resolved by approximately eight finite-volume cells at formation. A schematic representation of the computational grid is provided in Fig. 3.
Table 2Results of the grid convergence analysis. The “Fine” mesh was selected for the final simulations. The relative error denotes the normalized difference between two consecutive grid refinements.

The grid convergence analysis results are summarized in Table 2, where the “Fine” mesh configuration was adopted for this study. The relative error between consecutive grid refinements was calculated as the normalized error in total wake pressure, pt.
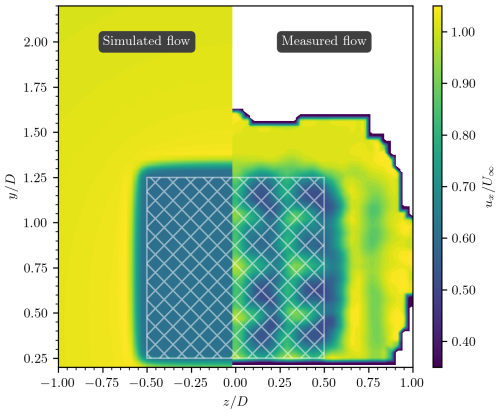
Figure 4Comparison of simulated (left) and experimental (right) flow fields behind a disk actuator model and the multirotor setup, respectively. The hatched white region denotes the multirotor's projected area. The figure presents ux-velocity colored fields at , with no ABL control applied. The experimental velocity field was reconstructed from time-averaged particle image velocimetry (PIV) data (see Bensason et al., 2024, and Broertjes et al., 2024), while the numerical results were obtained in this study using RANS computations.
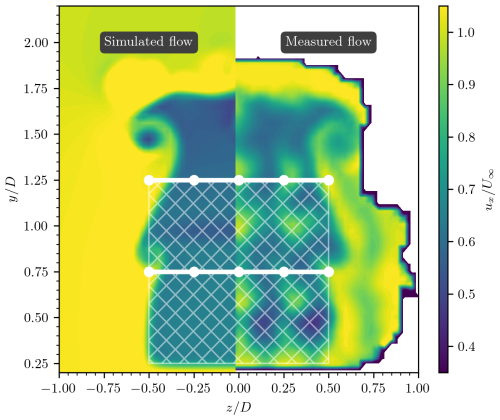
Figure 5Comparison between simulated flows (left) and experimental flows (right) behind the ABL-controlled setups. The hatched white region denotes the multirotor's projected area. The ABL-control devices are depicted by the dotted line segments. The figure shows ux-velocity color fields at . The experimental velocity field was reconstructed from time-averaged PIV data (see Bensason et al., 2024), while the numerical results were obtained in this study using RANS computations. A visual inspection reveals a strong correlation between the numerical and experimental reference results.
Following the grid convergence analysis, the present numerical model was validated by comparing its results to experimental data obtained at TU Delft's Open Jet Facility, with a Reynolds number of ReD∼ 3.8 × 10⁵. Figures 4 and 5 present the wake profiles, color-coded by the normalized streamwise velocity () at (one multirotor side length downstream of the multirotor system), for both the numerical and the experimental setups. The reference velocity was derived from time-averaged particle image velocimetry (PIV) data. Detailed descriptions of the experimental setup are available in Bensason et al. (2024) and Broertjes et al. (2024).
Figure 4 displays a comparison of () fields at without ABL-control devices. The numerical results demonstrate a uniform induction field, defined as , within the region behind the multirotor (represented by the hatched white area), consistent with the homogeneously distributed thrust coefficient. In contrast, the experimental results reveal local velocity fluctuations resulting from the discrete nature of the scaled multirotor array, consisting of a 4 × 4 vertical-axis rotor configuration. Despite these differences, the figure demonstrates a strong correlation between the numerical and experimental results, underscoring the validity of the numerical model.
In Fig. 5, the validation is extended to include the effects of ABL-control wings. The setup consists of a multirotor system coupled with a dual ABL-control system. In this configuration, one ABL-control wing is positioned at and the other at . The ux-velocity fields at are presented for both experimental and numerical results. The core of the measured blade-tip vortex is located at , while the simulated vortex core is found at , resulting in a positional error of approximately 1.7 %. At , PIV measurements from Bensason et al. (2024) place the vortex core at , whereas the numerical model predicts a position of , corresponding to a 3.2 % error.
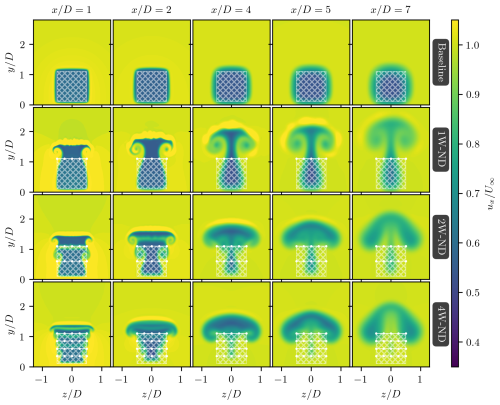
Figure 6Streamwise velocity contours at various downstream locations, , behind the multirotor system (with the rotor's projected area shown as the hatched white region). The top row shows the baseline case without ABL-control devices, while the subsequent rows present cases with 1, 2, and 4 wings, respectively (wings indicated by dotted white lines). The effects of the wings' induced drag are excluded from these simulations.
3.2 ABL-controlled wake characteristics
Figure 6 illustrates the normalized streamwise velocity fields, , at various planes downstream of the multirotor system (with the coordinate origin, , at the location of the multirotor system). In all panels, the hatched white region denotes the multirotor's projected area, whereas the ABL-control devices are indicated by dotted line segments. The top panels represent the wake for the baseline case, without ABL-control features, while the subsequent rows show results for increasing numbers of ABL-control devices. These cases are labeled 1W-ND (one wing, no induced drag), 2W-ND (two wings, no induced drag), and 4W-ND (four wings, no induced drag). The induced-drag effects of the wings are neglected in these simulations.
In the ABL-controlled cases, the wakes exhibit, in general, an upward motion with lateral expansion, driven by the counter-rotating wing-tip vortices. For the 1W-ND case, wake flow parcels near the midplane () ascend faster than those near the wing-tip vortices (), which reach the region above the turbine () at lower velocities. In the absence of ABL control (baseline case), wake recovery depends primarily on momentum exchange through velocity fluctuations at the wake's outer shear layers, a process significantly less efficient than the wake-steering technique employed in this study. This can be seen in the larger volume of high-induction flow that remains below in the baseline case compared to the ABL-controlled configurations. These conclusions are expected to hold for flows with higher free-stream turbulence intensities, provided large-scale vortical structures are not dissipated by flow instabilities.
The velocity fields in Fig. 6 demonstrate that the advection of high-induction fluid parcels into the flow above the wake region is significantly enhanced when using two or more wings, as observed in Cases 2W-ND and 4W-ND, compared to the single-wing configuration (1W-ND). This increased efficiency is evidenced by the narrower velocity-deficit region in the wake for in Cases 2W-ND and 4W-ND, relative to 1W-ND. However, despite the more effective upward advection of the wake enabled by the additional wings in Cases 2W-ND and 4W-ND, the maximum height of the high-induction flow in these configurations is lower than that observed in Case 1W-ND. For example, at , the maximum height of the wake reaches in Case 1W-ND, whereas in Cases 2W-ND and 4W-ND, the wake height is limited to . It is important to note that the total vertical force exerted is identical across all ABL-controlled cases.
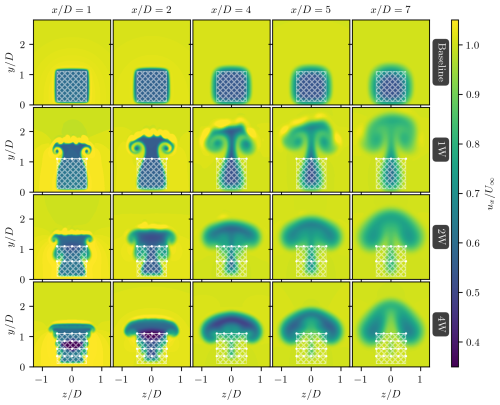
Figure 7This figure extends the results shown in Fig. 6, accounting for the effects of the wing's induced drag. Each panel shows the streamwise-colored wake behind the multirotor system (the rotor's projected area represented by the hatched white region) at different downwind locations, . Underneath the top baseline row, each row shows, from top to bottom, results for the ABL-controlled system with 1, 2, and 4 wings, respectively (represented by dotted white line segments).
Figure 7 extends the results shown in Fig. 6 to account for the blade's induced drag (see Table 1). The comparison of the setups without induced drag (i.e., Cases 1W-ND, 2W-ND, and 4W-ND, shown in Fig. 6) to the results with induced drag (i.e., Cases 1W, 2W, and 4W, shown in Fig. 7) reveals that the main flow features of the ABL-controlled systems, such as the vortices' formation, shedding, and advection, are not significantly affected by the induced drag. This last conclusion is especially true for the cases with more wings, where the effective drag force is distributed over a larger flow region. For Case 1W, for which results are shown in the second row of Fig. 7, the concentrated drag force induced on the flow by the single ABL-control wing breaks up instabilities over the outer shear layers of the wake. Such instabilities, which originated due to the local curvatures in the induction field behind the drag-inducing wing, are more pronounced in the near-wake region, i.e., at , and are quickly diffused under the action of viscosity.
Wake flows incorporating ABL-control devices exhibit enhanced momentum exchange between the wake flow region and the flow above, primarily facilitated by wing-tip vortices. Note that we refer to the region below as the “wake flow region”. To fully understand the mechanisms responsible for the upward motion of the wake, particularly why momentum-deficit fluid parcels are advected at varying rates depending on the number and positioning of the wings across different planes, visual analysis of the velocity fields alone is insufficient. Instead, a more comprehensive understanding is gained through an examination of the vorticity fields.
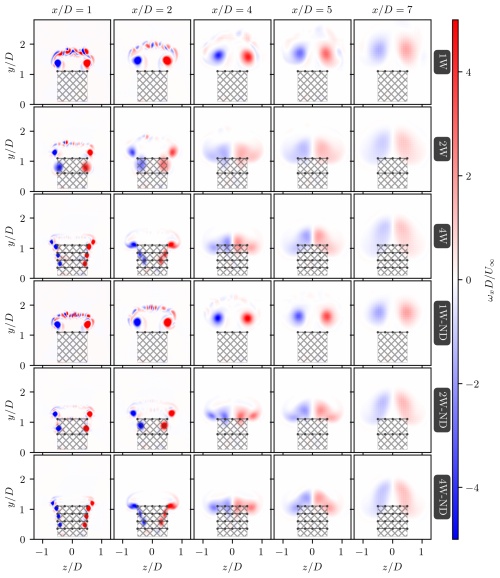
Figure 8Streamwise vorticity contours highlighting the wing-tip vortices generated by different ABL-control configurations. From top to bottom, rows represent results for 1, 2, and 4 ABL-control wings with (first–third rows) and without (fourth–sixth rows) induced drag (depicted as dotted black line segments), respectively.
Figure 8 presents the normalized streamwise vorticity fields, , at various cross-sectional planes downstream of the ABL-controlled multirotor system, showing the influence of an increasing number of wings. Figure 8 compares the vorticity-colored wakes at , 2, 4, 5, and 7 for cases involving varying numbers of ABL-control wings. To facilitate analysis, cases both with and without the effect of wing-induced drag are displayed, while the baseline case without wings is omitted. The hatched dark-gray region denotes the projected area of the multirotor, and dotted black lines represent the wings. In Case 1W-ND (fourth row), the vorticity fields reveal two counter-rotating wing-tip vortices, which are advected upward. This causes upward displacement of the wake toward the symmetry plane () while inducing downwash in the high-momentum flow above the wake flow region at . For Cases 2W-ND and 4W-ND, a similar upward displacement of the wake is observed, though the driving mechanisms behind this advection differ significantly from Case 1W-ND, warranting further analysis.
To further dissect the ABL-controlled flow dynamics in Cases 2W-ND and 4W-ND, the wake advection process is subdivided into three distinct stages: (i) vortex formation (), (ii) vortex coalescence (), and (iii) vortex advection (). These stages capture the progressive mechanisms of wake displacement.
During the vortex formation stage, wing-tip vortices are carried downstream by the mean flow. Simultaneously, vortices above the barycenter of the vortical system (the horizontal line equally dividing the vortices) are pushed outward from the symmetry plane, while those below are drawn inward toward it. This lateral self-induced motion is visible at in Cases 2W-ND and 4W-ND (Fig. 8).
In the vortex coalescence stage, the low-pressure cores of the wing-tip vortices serve as attractors, leading to the merging of vortices into two skewed counter-rotating structures, as observed at . Finally, in the vortex advection stage (), the mutual induction fields of these vortices propel the paired structures upward into the atmosphere. Notably, in Case 1W-ND, vortex advection occurs concurrently with vortex formation, which explains the more rapid upward advection of the vortex pair compared to the other cases, as previously seen in Fig. 7.
Additionally, Fig. 8 presents the vorticity fields for cases including the effects of wing-induced drag (1W, 2W, and 4W). A comparison between setups with and without induced drag shows that, despite the substantial contribution of Cx,W, the overall dynamics of the wing-tip vortices remain largely unaffected. However, drag forces introduce flow instabilities into the upper regions of the wake, which are associated with increased turbulent mixing. These three-dimensional instabilities may enhance interactions between the wake flow region and the flow above.
Given that wing-tip vortices serve as the primary mechanism for transporting low-momentum wake flow upward while simultaneously drawing high-momentum ABL flow downward, a simplified analysis of these vortices using the Kutta–Joukowski theorem is deemed relevant. Denoting the circulation around a closed contour in an arbitrary cross-flow plane (yz) by Γx and assuming a conservative flow, the Kutta–Joukowski theorem allows us to approximate the circulation associated with the wing-tip vortices in Case 1W (or 1W-ND) as
From potential flow theory, it is known that the tangential velocity uθ induced by a point vortex at a distance r from the vortex center is given by . Under the assumption of a conservative flow, it follows that the vertical velocity uy, induced at the symmetry plane by the two wing-tip vortices of a single ABL-control wing, is approximately
This result indicates that the upward advection of fluid parcels scales with U∞ near the plane due to the action of the wing-tip vortices. By contrast, the vertical velocity induced by one wing-tip vortex on another, scaled by the distance D, is , leading to the following ratio:
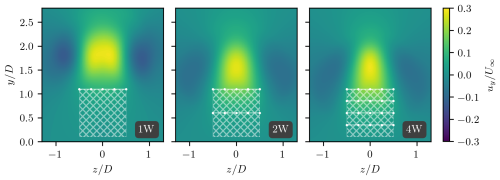
Figure 9Vertical velocity in ABL-controlled setups. The hatched white region represents the rotor's projected area, and the dotted white lines depict the ABL-control devices. This figure confirms the behavior described by Eq. (10), showing maximum uy at the plane.
The result in Eq. (10) explains why wake flow parcels near are advected upward more rapidly than those closer to the vortical structures themselves. This behavior is confirmed in Fig. 9, which shows uy-colored velocity fields at for various ABL-controlled wakes. The figure presents results for Cases 1W, 2W, and 4W (left to right), while results for the non-drag cases (1W-ND, 2W-ND, and 4W-ND) are omitted for brevity, as they exhibit similar behavior.
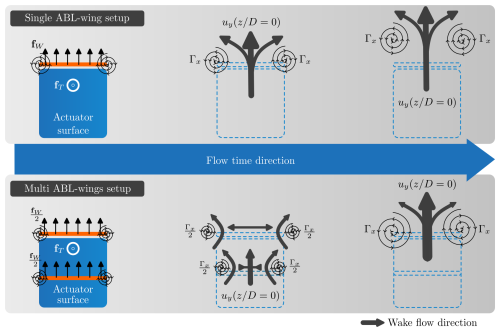
Figure 10Schematic diagram illustrating the mechanisms driving upward advection in the wake. Setups with a single wing (represented by orange line segments) move wing-tip vortices farther up into the atmosphere. In contrast, setups with multiple wings elevate the wing-tip vortices more slowly but more efficiently transport low-momentum flow upward.
As previously mentioned, the visual inspection of the velocity and vorticity fields (Figs. 7 and 8) suggests that setups with more wings enhance the advection of low-momentum fluid parcels compared to the setup with a single wing. Re-examining this in light of potential flow theory, the circulation associated with each wing-tip vortex, Γx, causes vortices generated by wings at lower heights to push those at higher locations outward. Simultaneously, vortices at higher locations exert an inward influence on those below. This phenomenon is evident from the relative positions of the vortex cores along the y axis in the panels of Cases 2W and 4W (Fig. 8).
During the vortex coalescence stage, the low-pressure cores of the wing-tip vortices act as centers of attraction, promoting the merging of multiple vortices into two counter-rotating structures. The induced velocity fields generated by the circulation of the topmost vortices aid the upward advection of the lower vortices, driven by the pressure field. This coalescence, followed by upward advection, occurs around (Fig. 8). Consequently, at approximately , the low-momentum fluid parcels trapped within the vortices encounter favorable conditions for upward movement into the higher regions of the ABL. The requirement for vortex formation and coalescence before efficient wake advection explains why systems with more wings are slower at elevating the wing-tip vortices, despite being more efficient at transporting low-momentum flow upward.
From this analysis, the most significant distinction among the ABL-control configurations examined emerges when categorizing them into two groups: single-wing setups and those with multiple wings. Figure 10 presents a schematic diagram illustrating the momentum transfer mechanisms observed in these two types of configurations. In the diagram, arrow thickness represents velocity field intensity, while vortex cores are depicted as spirals. Flow evolution is illustrated in three stages, progressing from left to right for both configuration types.
3.3 Momentum entrainment
In the previous subsection, the wake topology of ABL-controlled systems was analyzed using velocity and vorticity fields. This subsection focuses on the momentum and energy balances within the ABL-controlled flows for the different design strategies considered in Cases 1W, 2W, 4W, 1W-ND, 2W-ND, and 4W-ND.
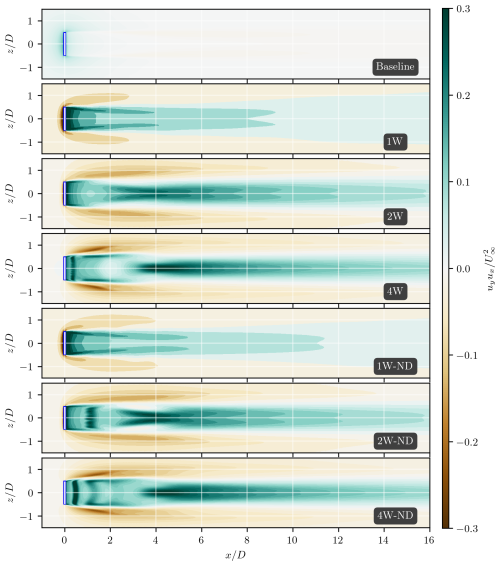
Figure 11Products of vertical and streamwise velocities at the top of the disk actuator model (represented as a white box) plane, with .
In the RANS framework, the momentum flux across a differential surface element dS enclosing the wake behind the multirotor system is given by . In the finite-volume approach, this expression is approximated as , where j denotes the index of the finite-volume cells that form the surface S in the computational fluid dynamics (CFD) mesh and Sj represents the surface area vector of the cell. Considering that the computational mesh is composed of planes with uniform cell sizes, Δl, and the cells are represented by cubic finite-volume elements, the surface area vector can be expressed as . Under this assumption, the momentum transferred across the jth cell is for the y-normal (horizontal) plane and for the z-normal (vertical) plane. Therefore, the streamwise momentum transferred across these planes is for the horizontal plane and for the vertical plane.
To evaluate the streamwise momentum exchanged between the wake flow and the surrounding fluid, we propose using the normalized velocity products and across the horizontal and vertical planes, respectively.
Figure 11 presents the velocity products on a horizontal plane at , offering a qualitative assessment of the impact of ABL control on streamwise momentum flux. Positive values of the product uyux indicate momentum transfer from below the plane to above, while negative values signify the entrainment of high-momentum ABL flow into the wake, which is most prevalent at . The results shown in Fig. 11 corroborate previous findings from the velocity field analysis discussed in Sect. 3.2. They confirm that all ABL-controlled configurations significantly enhance vertical momentum exchange between the flow above and the wake flow, consistent with the higher-vertical-velocity components observed in these setups. Furthermore, the uyux fields demonstrate a notable performance improvement when employing the two- and four-wing designs compared to the single-wing configuration in Case 1W. This improvement is attributed to a more uniform distribution of circulation Γx across the wake, which reduces the average distance between the vortex core and the low-momentum flow regions within the wake, thereby increasing momentum flux across the plane.
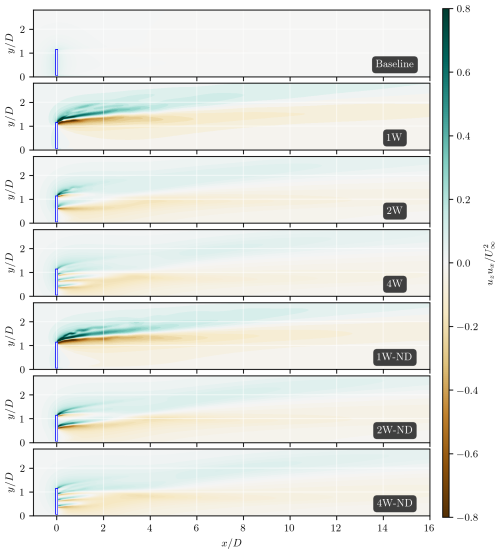
Figure 12Crosswind and streamwise velocity products at a plane on the left-hand side of the disk actuator model (represented as a white box) at .
Figure 12 shows the velocity product uzux from a side-plane view at . Positive values indicate momentum transfer in the z direction (out of the plane), while negative values represent momentum transfer in the opposite direction. In configurations with a single wing, such as Cases 1W and 1W-ND, momentum exchange is predominantly concentrated in the near-wake region, driven largely by the tip vortices generated by the ABL-control device. In contrast, configurations with multiple wings exhibit a more evenly distributed momentum exchange between the wake and the surrounding flow across the various ABL-control devices. The velocity products also demonstrate that regions of positive momentum entrainment (represented by red-shifted colors) remain aligned behind the disk actuator further downstream in multi-wing setups. This suggests that although configurations with additional wings may be less effective at rapidly advecting wing-tip vortices upward, they are more efficient at introducing high-momentum flow into the wake from the sides.
Comparing the momentum fluxes between the wake and the surrounding flow for models with and without induced drag from ABL-control wings reveals that the distribution of induced drag significantly influences the dynamics of the ABL-controlled flows. The results in Figs. 11 and 12 indicate that higher-momentum fluxes occur when induced drag is concentrated on a single wing, as seen in Case 1W. For cases where induced drag is concentrated on the top wing element (at ), there are larger velocity gradients in the near-wake region. These gradients, combined with the shearing processes in the outer layers of the wake flow, result in increased vorticity production and, consequently, more vigorous turbulent mixing. In configurations with multiple wings, this effect is distributed over a larger portion of the wake, resulting in a less pronounced impact on the wake dynamics.
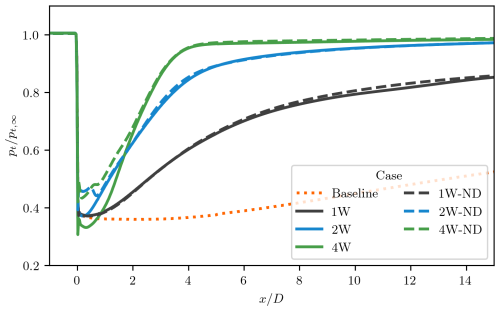
Figure 13Total pressure distribution in the wake as a function of the streamwise coordinate, , for all cases examined in this study. The total pressure is integrated within a box-shaped volume corresponding to the rotor's projected area. Dashed and solid curves represent ABL-controlled setups with and without wing-induced drag, respectively. The dotted line represents the results for the system without ABL control.
The efficiency of the ABL-control strategy is further evaluated through the total pressure, pt≈pt(x), defined as
This total pressure is integrated within a flow volume corresponding to the projected cross-sectional area of the actuator disk surface, defined as . The variation in total pressure along the wake, pt(x), is presented in Fig. 13.
According to momentum theory, the total pressure behind an actuator disk can be expressed as
where a is the induction factor, with . Momentum theory further relates the induction factor a to the thrust coefficient CT of the actuator disk through . For the system analyzed here, momentum theory predicts the total pressure in the wake to be approximately . However, in the current viscous wake model, momentum recovery is driven by turbulent velocity fluctuations within the streamtube (as observed in the baseline case). Nonetheless, when an ABL-control strategy is implemented, wake recovery is significantly accelerated due to wake steering, making turbulent velocity fluctuations a secondary mechanism for momentum entrainment and wake recovery.
Consistent with the results depicted in Figs. 11 and 12, the total pressure integrated along the wake demonstrates that design strategies incorporating multiple wings expedite wake recovery. Specifically, in Cases 2W and 4W, the total pressure reaches 95 % of the free-stream value at approximately and , respectively. By contrast, in the baseline case, where no ABL-control devices are present, wake recovery is significantly slower, and this degree of recovery is not observed within the current computational domain extending to .
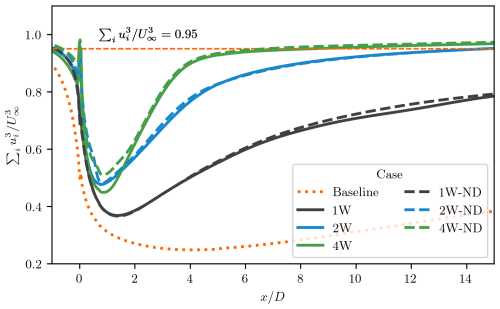
Figure 14Cubed velocity for all cases examined in this study. Dashed lines represent systems without wing-induced drag, while solid lines represent systems with wing-induced drag. The dotted line corresponds to the system without ABL control, with the dashed orange line indicating the 0.95 recovery plateau for reference.
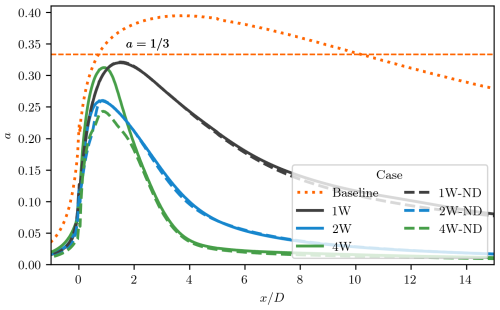
Figure 15Effective induction factor in the wake for all cases examined in this study. Dashed lines represent systems without wing-induced drag, while solid lines represent systems with wing-induced drag. The dotted line corresponds to the system without ABL control, with the dashed orange line indicating the plateau, corresponding to the Betz limit.
In addition to total pressure, the analysis is extended to the cubed velocity, , shown in Fig. 14. While total pressure reflects the energy available within the wake, the cubed velocity is a more suitable metric for evaluating the wind power available for extraction in the wake region. The cubed-velocity profiles in Fig. 14 show a marked improvement in power recovery when ABL-control strategies are applied. This improvement is particularly evident when comparing the baseline case to Cases 1W and 1W-ND. A similar enhancement is observed when comparing the two-wing configuration to the single-wing setup. Notably, the four-wing system demonstrates the fastest wake recovery among the configurations examined, reaching 95 % of the free-stream velocity at downstream of the multirotor system. These findings highlight the potential of ABL-control technology in comparison to current systems lacking such features.
The power coefficients for the multirotor systems investigated in this study are estimated by computing the lumped streamwise force–velocity product within the multirotor finite-volume cell region. Specifically, in this numerical analysis, the power P extracted from the flow by the force field fT is estimated using the following cell-weighted expression:
where Δlj represents the x-projected area of the jth finite-volume cell in the multirotor flow region. From this expression, the power coefficient for the baseline configuration is numerically estimated to be 0.58. For Cases 1W, 2W, and 4W, the power coefficients are found to be 0.65, 0.64, and 0.65, respectively. In the baseline configuration, where no ABL control is applied, the wake behavior aligns closely with the one-dimensional momentum theory, resulting in a Cp value that closely approximates , as expected.
Notice also that the enhanced power extraction observed in wake-steered configurations is expected, as lower induction values at are achieved in the near-wake region for a fixed CT. In these cases, the reduction in induction without compromising CT is driven by the ABL-control wings, which accelerate the streamwise flow in the near-wake region. Figure 15 shows the induction factor curves in the wake of the assessed systems, with the plateau included for reference. However, while the ABL-control wings contribute to enhanced energy extraction within the parameter space of this CFD study and the corresponding experimental dataset, they may not necessarily enhance mechanical power conversion under different operational conditions.
Lastly, it is important to acknowledge that the present study employs a simplified numerical model intended primarily as a proof of concept. Consequently, the results presented here are not yet directly applicable to real-world scenarios. Additional research is required to comprehensively evaluate the potential benefits of wake recovery under atmospheric inflow conditions.
This study introduces and evaluates a novel concept for regenerative wind energy, utilizing paired multirotor and multirotor-sized wings – termed atmospheric boundary layer control (ABL-control) devices – positioned in the near-wake region. These ABL-control devices generate vortical structures within the wake flow, enhancing the vertical momentum flux from the flow above the wake flow into the wake flow region, thereby facilitating wake recovery and potentially increasing power generation per land or sea area. The multirotor system and ABL-control devices are modeled using three-dimensional actuator surface models based on momentum theory. The analysis of velocity and vorticity fields reveals that large wing-tip vortices advect low-momentum fluid parcels upward from the wake flow while drawing high-momentum flow from above downward. Additionally, it was observed that the induced drag of the large wings within the ABL-control system could slightly enhance the mixing process at the outer shear layers of the wake, particularly in setups with significant and concentrated induced-drag forces. These findings suggest that the induced drag may be beneficial for the ABL-control strategy. Furthermore, the examination of momentum flux and total pressure indicates that with the adoption of ABL-control strategies, vertical momentum flux becomes the primary mechanism for wake recovery, while velocity fluctuations play a secondary role under the assessed flow conditions. Notably, in the four-winged ABL-control strategy, the total pressure and power in the wake recovered to 95 % of the free-stream values at downstream positions of approximately and , respectively. These results underscore the potential of this technology to reduce the land or sea area required for wind farms. However, further research is needed to assess the effectiveness of this regenerative strategy under atmospheric inflow conditions, as the current findings are not yet directly applicable to real-world scenarios.
The primary code base which enables the multirotor system simulations with vortex-generating modes is hosted on GitHub. You can access it via the following link: https://doi.org/10.5281/zenodo.11615669 (Martins, 2024). This repository includes detailed documentation and example scripts to facilitate the replication and extension of our work.
The database presented in this study is available from the corresponding author upon reasonable request. The database is compressed in Python's Pickle library and relies on several open-source libraries, including NumPy, Pickle, SciPy, and Matplotlib.
FACM: formal analysis, writing, code development. AvZ: supervision, technical review. CSF: funding acquisition, supervision, technical review.
The contact author has declared that none of the authors has any competing interests.
Publisher's note: Copernicus Publications remains neutral with regard to jurisdictional claims made in the text, published maps, institutional affiliations, or any other geographical representation in this paper. While Copernicus Publications makes every effort to include appropriate place names, the final responsibility lies with the authors.
The authors would like to express their sincere gratitude to Thomas Broertjes for providing them with the computer-aided design (CAD) model of the multirotor system.
This paper was edited by Johan Meyers and reviewed by two anonymous referees.
Abbes, M. and Allagui, M.: Centralized control strategy for energy maximization of large array wind turbines, Sustain. Cities Soc., 25, 82–89, 2016. a
Abkar, M. and Porté-Agel, F.: The effect of free-atmosphere stratification on boundary-layer flow and power output from very large wind farms, Energies, 6, 2338–2361, 2013. a
Ahmad, T., Basit, A., Anwar, J., Coupiac, O., Kazemtabrizi, B., and Matthews, P. C.: Fast processing intelligent wind farm controller for production maximisation, Energies, 12, 544, https://doi.org/10.3390/en12030544, 2019. a
Bader, S. H., Inguva, V., and Perot, J. B.: Improving the efficiency of wind farms via wake manipulation, Wind Energy, 21, 1239–1253, https://doi.org/10.1002/we.2226, 2018. a
Bartl, J. and Sætran, L.: Experimental testing of axial induction based control strategies for wake control and wind farm optimization, J. Phys. Conf. Ser., 753, 032–035, 2016. a
Bensason, D., Sciacchitano, A., and Ferreira, C.: Experimental study of the impact of blade-tip mounted rotors on the X-Rotor vertical-axis wind turbine, J. Phys. Conf. Ser., 2767, 072016, https://doi.org/10.1088/1742-6596/2767/7/072016, 2024. a, b, c, d
Broertjes, T., Bensason, D., Sciacchitano, A., and Ferreira, C.: Lift-induced wake re-energization for a vawt-based multi-rotor system, J. Phys. Conf. Ser., 2767, 072012, https://doi.org/10.1088/1742-6596/2767/7/072012, 2024. a, b
Darwish, M. and Moukalled, F.: The finite volume method in computational fluid dynamics: an advanced introduction with OpenFOAM® and Matlab®, Springer International Publishing, Cham, 103–135, ISBN 978-3-319-16874-6, https://doi.org/10.1007/978-3-319-16874-6_5, 2016. a
Dilip, D. and Porté-Agel, F.: Wind turbine wake mitigation through blade pitch offset, Energies, 10, 757, https://doi.org/10.3390/en10060757, 2017. a
Doekemeijer, B. M., van der Hoek, D., and van Wingerden, J.-W.: Closed-loop model-based wind farm control using FLORIS under time-varying inflow conditions, Renew. Energ., 156, 719–730, 2020. a, b
Ferreira, C., Bensason, D., Broertjes, T. J., Sciacchitano, A., Martins, F. A., and Ajay, A. G.: Enhancing Wind Farm Efficiency Through Active Control of the Atmospheric Boundary Layer's Vertical Entrainment of Momentum, J. Phys. Conf. Ser., 2767, 092107, https://doi.org/10.1088/1742-6596/2767/9/092107, 2024. a
Ferreira, C. S.: The near wake of the VAWT, PhD Thesis, TU Delft, the Netherlands, 2009. a
Frederik, J. A., Weber, R., Cacciola, S., Campagnolo, F., Croce, A., Bottasso, C., and van Wingerden, J.-W.: Periodic dynamic induction control of wind farms: proving the potential in simulations and wind tunnel experiments, Wind Energ. Sci., 5, 245–257, https://doi.org/10.5194/wes-5-245-2020, 2020. a, b
Gargallo-Peiró, A., Avila, M., Owen, H., Prieto-Godino, L., and Folch, A.: Mesh generation, sizing and convergence for onshore and offshore wind farm Atmospheric Boundary Layer flow simulation with actuator discs, J. Comput. Phys., 375, 209–227, 2018. a
Gebraad, P., Thomas, J. J., Ning, A., Fleming, P., and Dykes, K.: Maximization of the annual energy production of wind power plants by optimization of layout and yaw-based wake control, Wind Energy, 20, 97–107, https://doi.org/10.1002/we.1993, 2017. a
Greenshields, C.: OpenFOAM v11 User Guide, The OpenFOAM Foundation, London, UK, https://doc.cfd.direct/openfoam/user-guide-v11 (last access: 1 March 2024), 2023. a
Hornshøj-Møller, S. D., Nielsen, P. D., Forooghi, P., and Abkar, M.: Quantifying structural uncertainties in Reynolds-averaged Navier–Stokes simulations of wind turbine wakes, Renew. Energ., 164, 1550–1558, 2021. a
Houck, D. R.: Review of wake management techniques for wind turbines, Wind Energy, 25, 195–220, 2022. a
Howland, M. F., Lele, S. K., and Dabiri, J. O.: Wind farm power optimization through wake steering, P. Natl. Acad. Sci. USA, 116, 14495–14500, 2019. a
Huang, M.: Wake and wind farm aerodynamics of vertical axis wind turbines, Dissertation (TU Delft), Delft University of Technology, https://doi.org/10.4233/uuid:14619578-e44f-45bb-a213-a9d179a54264, 2023. a
Huang, M., Sciacchitano, A., and Ferreira, C.: Experimental and numerical study of the wake deflections of scaled vertical axis wind turbine models, J. Phys. Conf. Ser., 2505, 012019, https://doi.org/10.1088/1742-6596/2505/1/012019, 2023. a
Jadeja, A.: Wake Deflection Technique for Vertical Axis Wind Turbines using Actuator Line Model in OpenFOAM, Master's thesis, Delft University of Technology, 2018. a
Kheirabadi, A. C. and Nagamune, R.: A quantitative review of wind farm control with the objective of wind farm power maximization, J. Wind Eng. Ind. Aerod., 192, 45–73, 2019. a
Lignarolo, L. E., Ragni, D., Krishnaswami, C., Chen, Q., Ferreira, C. J. S., and van Bussel, G. J.: Experimental analysis of the wake of a horizontal-axis wind-turbine model, Renew. Energ., 70, 31–46, https://doi.org/10.1016/j.renene.2014.01.020, 2014. a
Martins, F. A., Ferreira, C. S., and Van Zuijlen, A.: Numerical investigation of atmospheric boundary layer control in wind farms with multirotor systems, J. Phys. Conf. Ser., 2767, 072006, https://doi.org/10.1088/1742-6596/2767/7/072006, 2024. a
Martins, F. A. C.: My Research Software, Zenodo [software], https://doi.org/10.5281/zenodo.11615669, 2024. a, b
McKenna, R. v., Hollnaicher, S., vd Leye, P. O., and Fichtner, W.: Cost-potentials for large onshore wind turbines in Europe, Energy, 83, 217–229, 2015. a
Menter, F. R., Kuntz, M., and Langtry, R.: Ten years of industrial experience with the SST turbulence model, Turbulence, Heat and Mass Transfer, 4, 625–632, 2003. a
Munters, W. and Meyers, J.: Towards practical dynamic induction control of wind farms: analysis of optimally controlled wind-farm boundary layers and sinusoidal induction control of first-row turbines, Wind Energ. Sci., 3, 409–425, https://doi.org/10.5194/wes-3-409-2018, 2018. a
Parekh, J. and Verstappen, R.: Uncertainty quantification analysis for simulation of wakes in wind-farms using a stochastic RANS solver, compared with a deep learning approach, Comput. Fluids, 257, 105867, https://doi.org/10.1016/j.compfluid.2023.105867, 2023. a
Rezaeiha, A., Kalkman, I., and Blocken, B.: CFD simulation of a vertical axis wind turbine operating at a moderate tip speed ratio: Guidelines for minimum domain size and azimuthal increment, Renew. Energ., 107, 373–385, 2017. a
Ryan, K. J., Coletti, F., Elkins, C. J., Dabiri, J. O., and Eaton, J. K.: Three-dimensional flow field around and downstream of a subscale model rotating vertical axis wind turbine, Exp. Fluids, 57, 1–15, 2016. a
Sadorsky, P.: Wind energy for sustainable development: Driving factors and future outlook, J. Clea. Prod., 289, 125779, https://doi.org/10.1016/j.jclepro.2020.125779, 2021. a
Simley, E., Fleming, P., and King, J.: Design and analysis of a wake steering controller with wind direction variability, Wind Energ. Sci., 5, 451–468, https://doi.org/10.5194/wes-5-451-2020, 2020. a, b
Tescione, G., Ragni, D., He, C., Ferreira, C. S., and Van Bussel, G.: Near wake flow analysis of a vertical axis wind turbine by stereoscopic particle image velocimetry, Renew. Energ., 70, 47–61, 2014. a
van den Berg, D., de Tavernier, D., and van Wingerden, J.-W.: The dynamic coupling between the pulse wake mixing strategy and floating wind turbines, Wind Energ. Sci., 8, 849–864, https://doi.org/10.5194/wes-8-849-2023, 2023. a
Wang, C., Campagnolo, F., and Bottasso, C. L.: Does the use of load-reducing IPC on a wake-steering turbine affect wake behavior?, J. Phys. Conf. Ser., 1618, 022–035, https://doi.org/10.1088/1742-6596/1618/2/022035, 2020. a
Wei, N. J., Brownstein, I. D., Cardona, J. L., Howland, M. F., and Dabiri, J. O.: Near-wake structure of full-scale vertical-axis wind turbines, J. Fluid Mech., 914, A17, https://doi.org/10.1017/jfm.2020.578, 2021. a
Weller, H. G., Tabor, G., Jasak, H., and Fureby, C.: A tensorial approach to computational continuum mechanics using object-oriented techniques, Comput. Phys., 12, 620–631, 1998. a
Wu, Y.-T. and Porté-Agel, F.: Large-eddy simulation of wind-turbine wakes: evaluation of turbine parametrisations, Bound.-Lay. Meteorol., 138, 345–366, 2011. a
Zerrahn, A.: Wind power and externalities, Ecol. Econ., 141, 245–260, 2017. a


