the Creative Commons Attribution 4.0 License.
the Creative Commons Attribution 4.0 License.
 | 11 Apr 2025
On the influence of cross-sectional deformations on the aerodynamic performance of wind turbine rotor blades
Julia Gebauer
Felix Prigge
Dominik Ahrens
Lars Wein
Claudio Balzani
The aerodynamic performance of a wind turbine rotor blade depends on the geometry of the airfoils used. The airfoil shape can be affected by elastic deformations of the blade during operation due to structural loads. This paper provides an initial estimation of the extent to which cross-sectional deformations influence the aerodynamic loads on the rotor. The IEA 15 MW reference wind turbine model is used for this study. A constant wind field at rated wind speed is applied as an operational load test case. The resulting loads are calculated by an aero-servo-elastic simulation of the turbine. The loads are applied to a three-dimensional (3D) finite shell element model of the rotor blade, which serves to calculate the cross-sectional deformations. For the individual cross-sections in the deformed configuration, the new lift and drag coefficients are calculated. These are then included in the aero-servo-elastic simulation, and the obtained results are compared with those of the initial simulation that is based on the undeformed cross-sections. The cross-sectional deformations consist of a change in the chord length and the geometry of the trailing edge panels and depend on the azimuth position of the blade. The change in the airfoil geometries results in altered aerodynamic characteristics and therefore a deviation of the blade root bending moments, the maximum change of which is −1.4 % in the in-plane direction and +0.71 % in the out-of-plane direction. These results show that cross-sectional deformations have a minor influence on the internal loads of rotor blades in normal operation.
- Article
(4317 KB) - Full-text XML
- BibTeX
- EndNote


The rotor blade is a crucial element in the generation of electrical power from wind in modern wind turbines. The blades are exposed to a wide range of loads during their lifetime, including a combination of aerodynamic, gravitational, inertial, transient, and gyroscopic loads (Hau, 2013; Söker, 2013; Liu et al., 2017; Burton et al., 2021). The wind inflow and the blade mass in particular contribute significantly to out-of-plane and in-plane bending moments.
The amount of energy that can be extracted from wind depends on the aerodynamic design of the rotor blade, i.e. the shape of the outer shell. The aerodynamic design is a sequence of airfoils that are threaded along the blade axis. A high lift-to-drag ratio in each individual airfoil is desirable for maximum power generation. The geometry of the airfoil and the angle of attack, which depends on the aerodynamic twist angle, are crucial for high aerodynamic performance. However, a high power output is normally accompanied by high aerodynamic and consequentially high mechanical loads acting on the blade. Thus, a compromise must always be found in the blade design between aerodynamic and structural performance (Hansen, 2015; Bak, 2023).
The structural design of a rotor blade provides high stiffness and strength with respect to its weight. In the context of this paper, the structural design of the blade defines its resistance against cross-sectional deformations and thus the resistance against changes in the blade geometry and the resulting aerodynamic performance. The cross-sectional stiffness depends on the choice of materials, the structural topology, and the lay-up of the composite structures (Schürmann, 2007; Vassilopoulos, 2013). With currently used materials and classical blade topologies and lay-ups, and the tendency towards larger rotor blades, the weight, the generated power, and thus the structural loads – which are understood as the internal forces and moments in the blades and other structural members – increase. When optimising the design with the minimisation of the blade mass as an optimisation target, an increasingly elastic behaviour of the blade is expected, including the elasticity and flexibility of the cross-sections. This also means, however, that the aerodynamically designed shell, which is reinforced by the structural components of the blade, is more susceptible to changes in the overall geometry during operation.
Typically, aero-servo-elastic multi-body simulation tools are utilised to design the rotor blade. Well-known tools in the market are, for instance, OpenFAST (National Renewable Energy Laboratory, 2023) and HAWC2 (Larsen and Hansen, 2023). While the aerodynamic module of these tools is usually based on the blade element momentum theory (Madsen et al., 2020; Jonkman et al., 2015), there are different levels of fidelity for the structural module. The HAWC2 structural model uses a Timoshenko beam embedded in a multi-body formulation with the option to use a fully populated stiffness matrix (Kim et al., 2013). In OpenFAST one can choose between a modal reduction based on the Euler–Bernoulli beam theory (ElastoDyn, National Renewable Energy Laboratory, 2024b) and a geometrically exact finite beam element formulation (BeamDyn, National Renewable Energy Laboratory, 2024a; Hodges, 2006). All these structural models have in common that geometrically non-linear deformations at the cross-sectional level are not considered.
Ovalisations of thin-walled beam structures with circular cross-sections were described by Brazier (1927). This Brazier effect was analytically described by Cecchini and Weaver (2005) for symmetric two-bay airfoil slices. In the meantime, blade tests have revealed that cross-sectional deformations occur in rotor blades. Haselbach et al. (2016) have shown experimentally and numerically that critical bending moments lead to cross-sectional deformation and thus an opening of the trailing edge. Eder and Bitsche (2015b) conducted a fracture analysis for the trailing edge bonding of rotor blades and were able to show that in-plane deformations lead significantly to damage in the trailing edge adhesive. Jensen et al. (2012) studied a box girder experimentally and numerically. Here, the stresses in the shear webs could be measured as a result of the cross-sectional deformations. Eder and Bitsche (2015a) presented an analysis of asymmetric airfoils under bi-axial bending and discussed the reduction in the fatigue life of the adhesive joints as a consequence of cross-sectional deformations. However, the aforementioned publications did not investigate the aero-elastic coupling that cross-sectional deformations may result in.
A change in the geometry of the aerodynamic shell and thus the airfoils can result from various aspects. Rosemeier and Saathoff (2020) investigated the change in geometry due to thermal residual stresses arising from the cool-down during manufacturing and the subsequent changes in lift and drag coefficients. They pointed out that the lift-to-drag ratios change particularly in the inboard regions of the blade. Simulations showed that the loads decreased, and thus the fatigue life increased, which was accompanied by a reduction in power production. Leading edge erosion can also change the airfoil geometry due to removal of material. Gaudern (2014) investigated two cross-sections with different relative thicknesses in wind tunnel experiments. An increase in drag and a decrease in lift resulted in a significant decrease in overall performance. The airfoil geometry is also influenced by icing. Etemaddar et al. (2014) showed that the drag coefficient increases significantly, while the lift coefficient decreases slightly. Additionally, the authors compared thrust and power output for different wind speeds. They reported a shift of the power curve towards higher wind speeds, resulting in a higher rated wind speed and a lower power output in the partial load region. It can therefore be concluded that it is important to know possible cross-sectional changes and their impact on the performance of the wind turbine.
Preliminary work on the quantification of in-plane cross-sectional deformations of rotor blades due to mechanical loads was presented in Gebauer and Balzani (2023) and Balzani and Gebauer (2023). Therein, a three-dimensional (3D) finite-element model was used to calculate the deformed blade shape based on the bending moment distributions from aero-servo-elastic simulations. The deformed positions of nodes associated with a cross-section of interest were projected onto a plane that was considered the cross-sectional plane in the deformed configuration, and the deformed shape of the cross-section was obtained. The deformations on the cross-section level were generally relatively small. However, it is not clear if small cross-sectional deformations can already influence the aerodynamic behaviour of the blades and with it have an aero-elastic coupling effect. This holds true especially since, to the best of the authors' knowledge, the load-induced impact of cross-sectional deformations on the aerodynamic behaviour of the airfoils and coupling with the aero-elastic response of the blades have not yet been investigated by other authors.
Since normal operation is the most common condition in the life of a wind turbine, the following research question arises: to what extent do cross-sectional deformations affect the aerodynamic performance of the rotor under operational conditions? A simple test case with respect to the normal operation of the wind turbine and a constant wind field is selected for the initial investigation presented in this paper. The aim is to provide a first quantification of the aero-structural coupling due to cross-sectional deformations.
The content of the paper is organised in four sections. The workflow and methods are described in Sect. 2. In Sect. 3, the cross-sectional deformations are analysed for a reference turbine, and the changes in chord length and lift and drag coefficients are presented. The impact of the geometrical changes on the aero-elastic turbine response are examined and discussed in Sect. 4. Section 5 draws conclusions and gives an outlook on future work.
The study is conducted on the model of the IEA 15 MW reference wind turbine (RWT). The rotor blades have a length of 117 m. Data of the wind turbine for load simulations and the blades to create a 3D finite-element (FE) model are provided in Gaertner et al. (2020). To analyse the influence of the cross-sectional deformations of the rotor blade on the wind turbine behaviour, a two-stage process is applied. A flowchart of the process is given in Fig. 1.
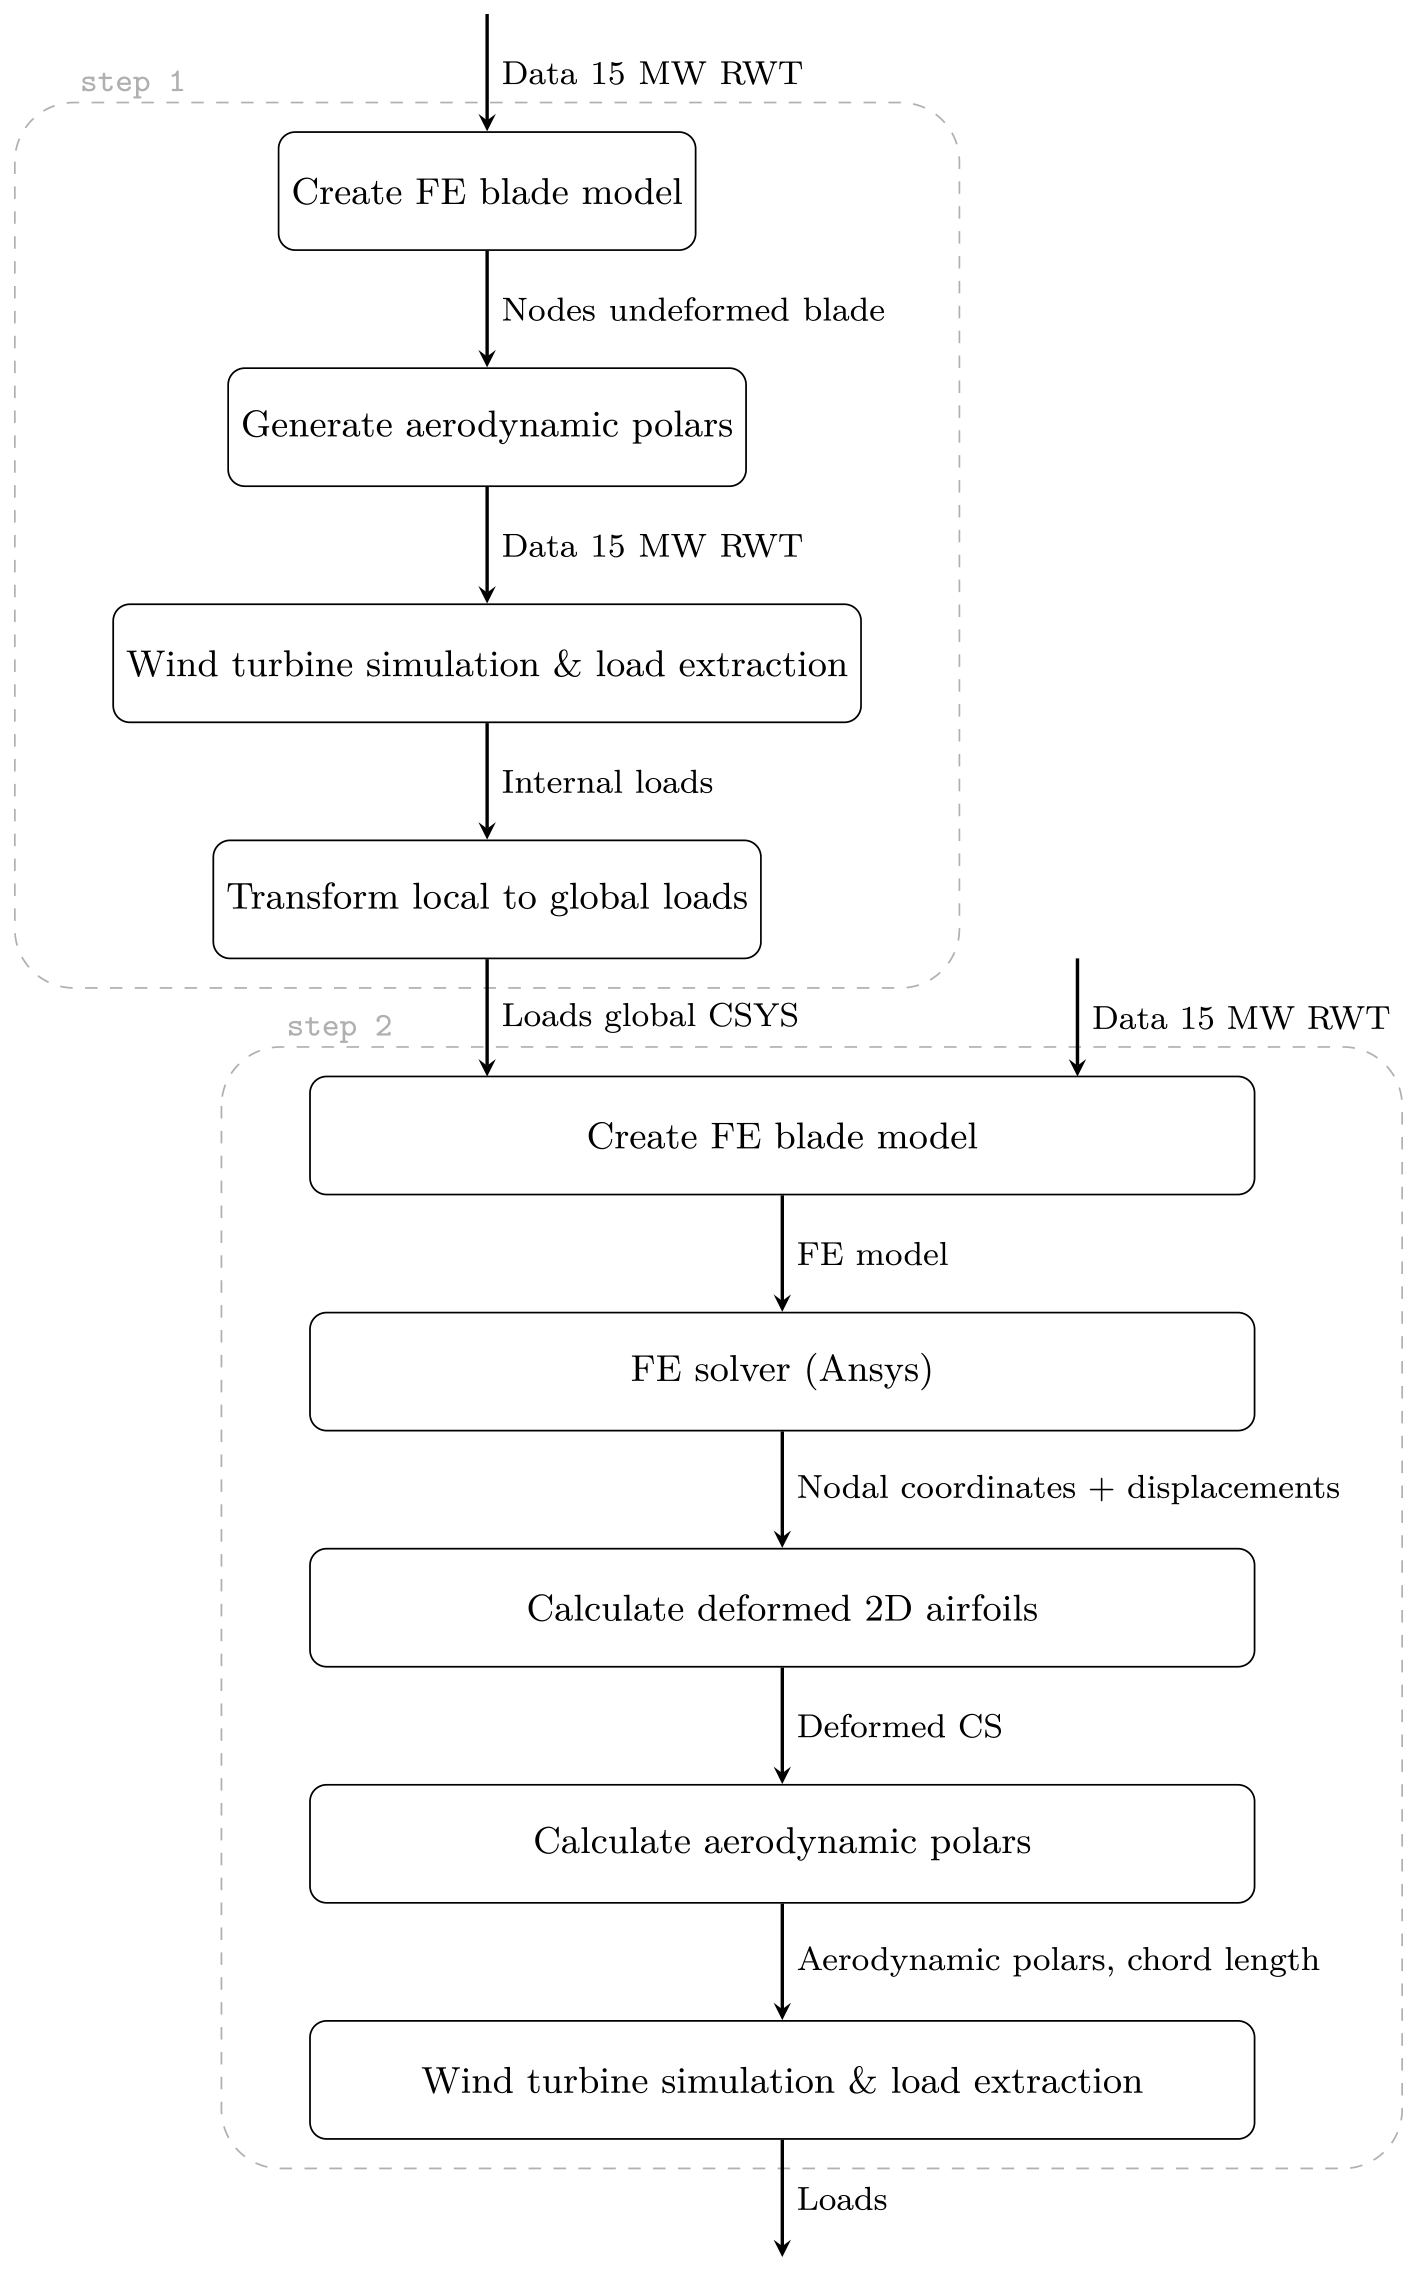
Figure 1Flowchart of the routine to calculate the internal loads in the rotor blades taking into account cross-sectional (CS) deformations in the airfoil polars.
First, a 3D FE model of the rotor blade was created to obtain the 3D blade geometry. Based on the FE model geometry, the aerodynamic polars were calculated for each nodal position along the blade. The polars were fed back into the turbine simulation model and were used to calculate the aerodynamic loads via the blade element momentum theory (Jonkman et al., 2015). For the load calculation (considering aerodynamic and gravitational loading), an aero-servo-elastic simulation of the turbine was performed. The extracted loads were transformed into a global coordinate system that is used in the 3D FE simulation. With the FE model and the transformed loads, a simulation was started using an FE solver assuming clamped boundary conditions at the blade root. The deformed 2D cross-sections were then calculated from the resulting 3D blade model in the deformed configuration. For the procedure to extract the deformed cross-sections, the reader is referred to Gebauer and Balzani (2023) and Balzani and Gebauer (2023). The deformed cross-sections were used to recalculate the lift and drag coefficients. The aerodynamic polars were re-imported into the wind turbine simulation model, the aero-servo-elastic simulation was repeated, and the results were analysed with respect to a change in loads and turbine behaviour. The individual steps are described in the following sections in more detail.
2.1 A 3D structural model of the blade
In order to determine the impact of cross-sectional deformations on the rotor aerodynamics and the wind turbine behaviour, the rotor blade must be modelled with sufficient accuracy. Moreover, the blade model must allow for the extraction of deformed shapes of the cross-sections, as this information is needed for a subsequent turbine simulation. A 3D finite shell element model was thus employed, as such a model provides a reasonable compromise between accuracy and computation time. The blade model was created with the in-house Model Creation and Analysis (MoCA) tool that had been validated earlier using a physical full-scale blade test (Noever-Castelos et al., 2022) and had thus been proven to provide a sufficient level of accuracy. The blade model is shown in Fig. 2.
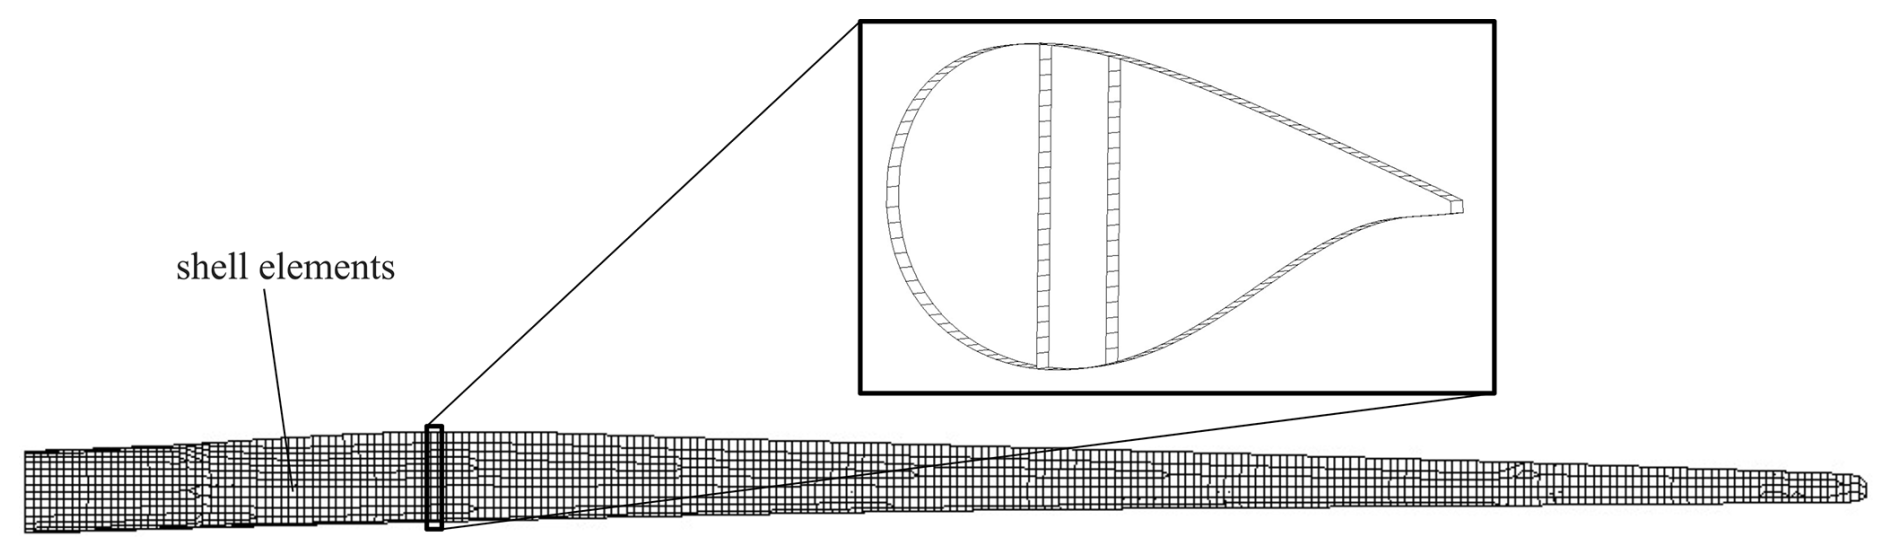
Figure 2Finite-element mesh of the 15 MW reference wind turbine blade. For visualisation purposes, the blade was meshed more coarsely than in the simulations. The zoomed-in view shows a slice of the blade model with one element in the longitudinal direction at the maximum chord position.
The 3D FE blade model was verified against the beam model of the reference turbine by comparing the longitudinal distributions of the chord length, the relative thickness, and the flapwise and edgewise stiffnesses. A detailed description of the verification can be found in Appendix A. The relative deviation ϵ is used for the verification and subsequent analyses.
The relative deviation is only evaluated at spanwise positions where data points are available for both the reference and the FE model. The FE model was used to calculate the cross-sectional deformations at a later stage of this study. The FE solver was Ansys® (2020). For a consistent comparison of the aerodynamic behaviour of the undeformed and the deformed blade and due to the small differences between the structural behaviour of the reference model and that of the 3D FE model, the FE model was used in the following, and the blade data from the reference turbine description were modified accordingly. This includes the relative thickness distribution, i.e. the aerodynamic description of the blade.
A mesh convergence study with respect to natural frequencies was carried out for the 3D FE model. The converged mesh consisted of 128 986 nodes and 131 008 quadrilateral, 4-node shell elements with linear shape functions and 6 nodal degrees of freedom (element type SHELL181, Ansys®, 2020).
For the geometrically non-linear FE simulations, the rotor blade was fully clamped at the blade root. The loads were calculated via an aero-servo-elastic turbine simulation (see Sect. 2.3). Concentrated forces in the out-of-plane and in-plane directions of the rotor were applied to the 3D model at discrete locations along the blade span. The magnitude of the forces was calibrated so that the flapwise and edgewise bending moments from the load simulations were well approximated. Applying flapwise and edgewise bending moments simultaneously results in a static and multi-axial load scenario.
The loads were applied via multi-point constraints that represented a load introduction similar to load frames used in physical full-scale blade testing (IEC61400-23, 2001). As described in Noever-Castelos et al. (2022), an extra node is introduced at the load frame position. Here, the master node is defined at the shear centre of this cross-section. The substitute loads then act on the load frame position in the respective shear centre, which was calculated with BECAS (Blasques and Stolpe, 2012). The loads affect the deformations in the spanwise vicinity of the load frames. According to IEC61400-23 (2001), a region corresponding to the chord length cannot be taken into account in the spanwise direction on both sides of the load frames (Saint-Venant principle). At the same time, the bending moment must be mapped as accurately as possible. For the positioning of the load frames, the blade was divided into 50 equidistant points. An investigation was carried out for two, three, four, and five load frames, in which the effect of spanwise positions on the utilisable blade length and the error in the bending moment were calculated. In all cases, the clamping at the blade root was considered the first load frame.
Based on the results of this investigation, five load frames were selected and positioned along the blade; see the bottom image of Fig. 3. The cross-sectional deformations were only evaluated between the load frame regions marked by dashed vertical lines. To be able to also analyse the areas around the load frames, a second set of four load frames shifted in the spanwise direction was used; see the top plot of Fig. 3. Hence, for each load case, two simulations were performed with four and five load frames, respectively. The outermost blade tip was not considered a possible load frame position, as 3D FE simulations have shown that stability issues would arise otherwise. This is acceptable because the outermost region of the blade is not subjected to high mechanical loads. Hence, high cross-sectional deformations are not expected there.
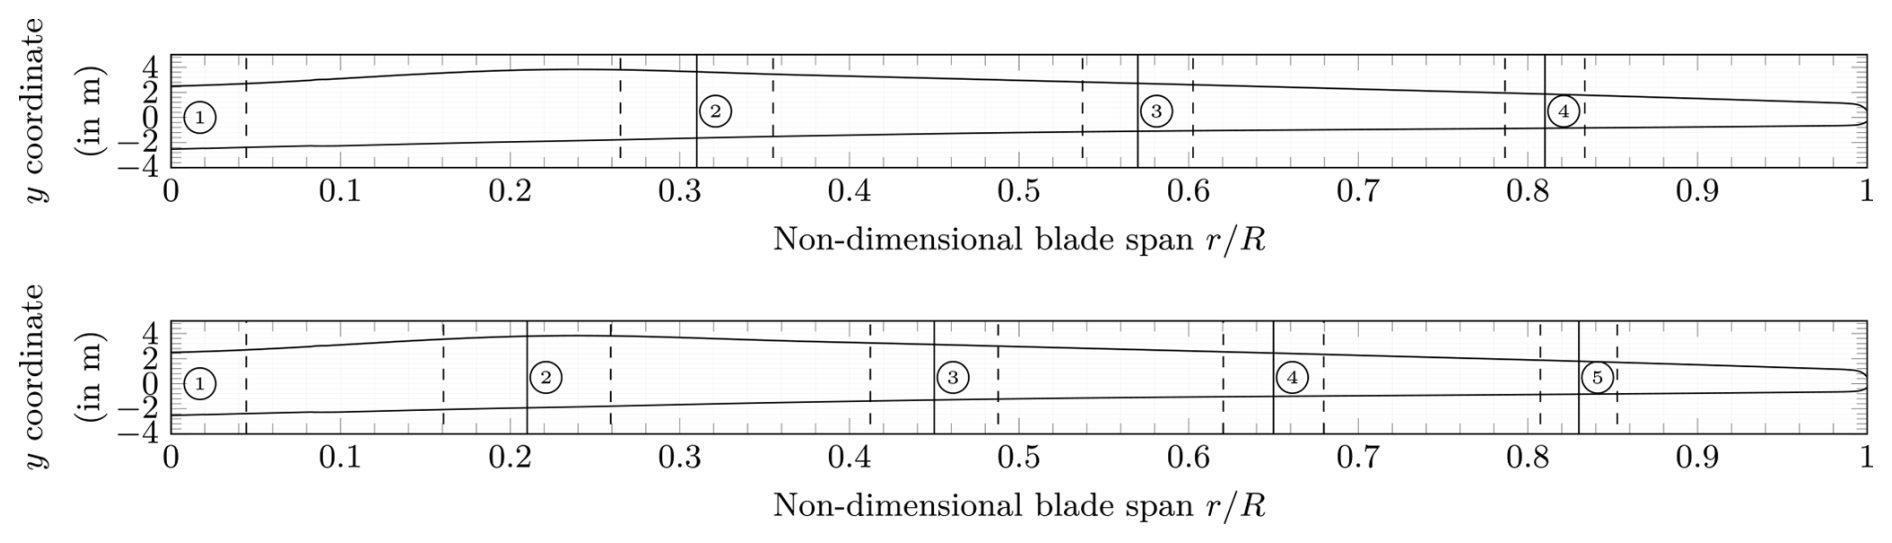
Figure 3Load frame positions. The solid lines represent the radial load frame positions in the FE model. The dashed lines indicate the areas that cannot be evaluated.
2.2 Airfoil polars
For the deformed cross-sections, the airfoil polars needed to be calculated. For a consistent comparison, the polars of the undeformed cross-sections had to be calculated with the same method. The panel method implemented in XFOIL (Drela, 1989) was used for this purpose. It is known that XFOIL predicts the linear range of the lift coefficient well (Lennie et al., 2015) for thin airfoils; i.e. the results are good for small angles of attack. In the analysed operational load test case, the turbine operation mode mostly revealed angles of attack of less than 10°, which were only exceeded in the blade root area. High-fidelity computational fluid dynamics (CFD) was used to verify the polars and ensure the validity of the XFOIL results. Details of the CFD simulations are given in Appendix B.
The results of the unsteady Reynolds-averaged Navier–Stokes (URANS) simulations are compared with the XFOIL results in Fig. 4. The lift coefficients agree very well. We can thus conclude that XFOIL can be used for the calculation of the polars along the blade. In particular, in the outboard region of the blade (see on the right of Fig. 4), the XFOIL results are very accurate for an angle of attack up to 10° and almost coincide with the URANS results. For the thicker airfoils closer to the blade root, there is a slight deviation at higher angles of attack (>6°). However, since the deviation is small and due to the substantially lower computational cost, XFOIL was also used here for the analysis of the aero-elastic impact of cross-sectional deformations.
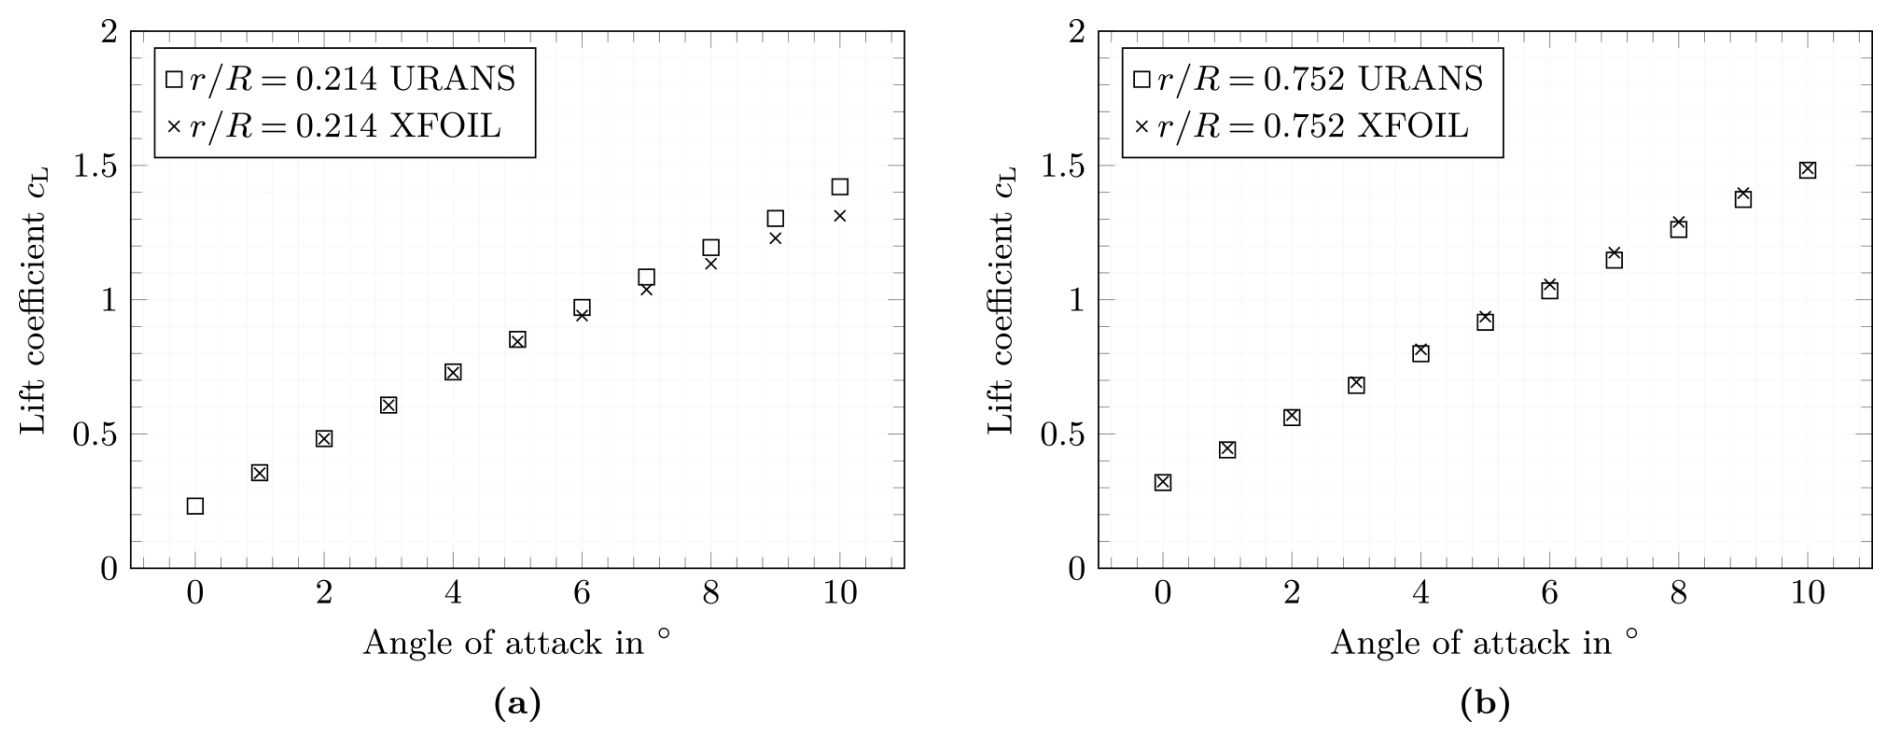
Figure 4Lift coefficient calculated with URANS and XFOIL. The maximum sampling error is and was calculated according to Ries et al. (2018).
2.3 Aero-servo-elastic response of the wind turbine
Aero-servo-elastic simulations were carried out to determine the overall dynamic response of the wind turbine and to calculate the loads that the rotor blades are exposed to. The turbine simulations were carried out in two stages. The first simulation was executed to observe the behaviour of the system with undeformed cross-sections in the blade. The second simulation was carried out for deformed cross-sections so that the dynamic behaviour of the turbine with and without cross-sectional deformations could be compared.
The aero-servo-elastic simulations were performed with OpenFAST (National Renewable Energy Laboratory, 2023). ElastoDyn (National Renewable Energy Laboratory, 2024b) was used to model the structural dynamics of the blades. Therein, an Euler–Bernoulli beam theory in combination with a modal reduction is employed, where the first two flap- and the first edgewise bending modes are considered. In this study, torsion loads were neglected in the 3D model under the assumption that cross-sectional deformations are bending dominated (recall Brazier, 1927).
To focus on the influence of the cross-sectional deformations on the aero-elastic behaviour of the turbine, a constant wind field at rated wind speed of 10.5 m s−1 was chosen in this investigation. At this wind speed the rotor experiences the highest thrust force. Moreover, this is the point at which the rotor blade is not yet pitched so that flap- and edgewise directions coincide with the out-of-plane and in-plane directions with respect to the rotor plane.
The duration of the aero-servo-elastic simulation was 700 s. From this time span the first 100 s was removed as a transient period. The remaining 600 s was used for the analysis. A full periodic rotation of one rotor blade was analysed, and the blade positions with an azimuth angle were the basis of the subsequent investigations; see also the blade highlighted in blue in Fig. 5. A simulation was carried out to extract the reference loads along the blade for the aforementioned azimuth positions. The flapwise and edgewise bending moments were applied to the 3D FE model, with which the deformed cross-section shapes were calculated. The new polars were determined with XFOIL and were fed into additional aero-servo-elastic simulations. Hence, five aero-servo-elastic simulations were carried out, one with undeformed cross-sections and four with deformed cross-sections calculated from the bending moment distributions at the four azimuth positions mentioned above and highlighted in Fig. 5.
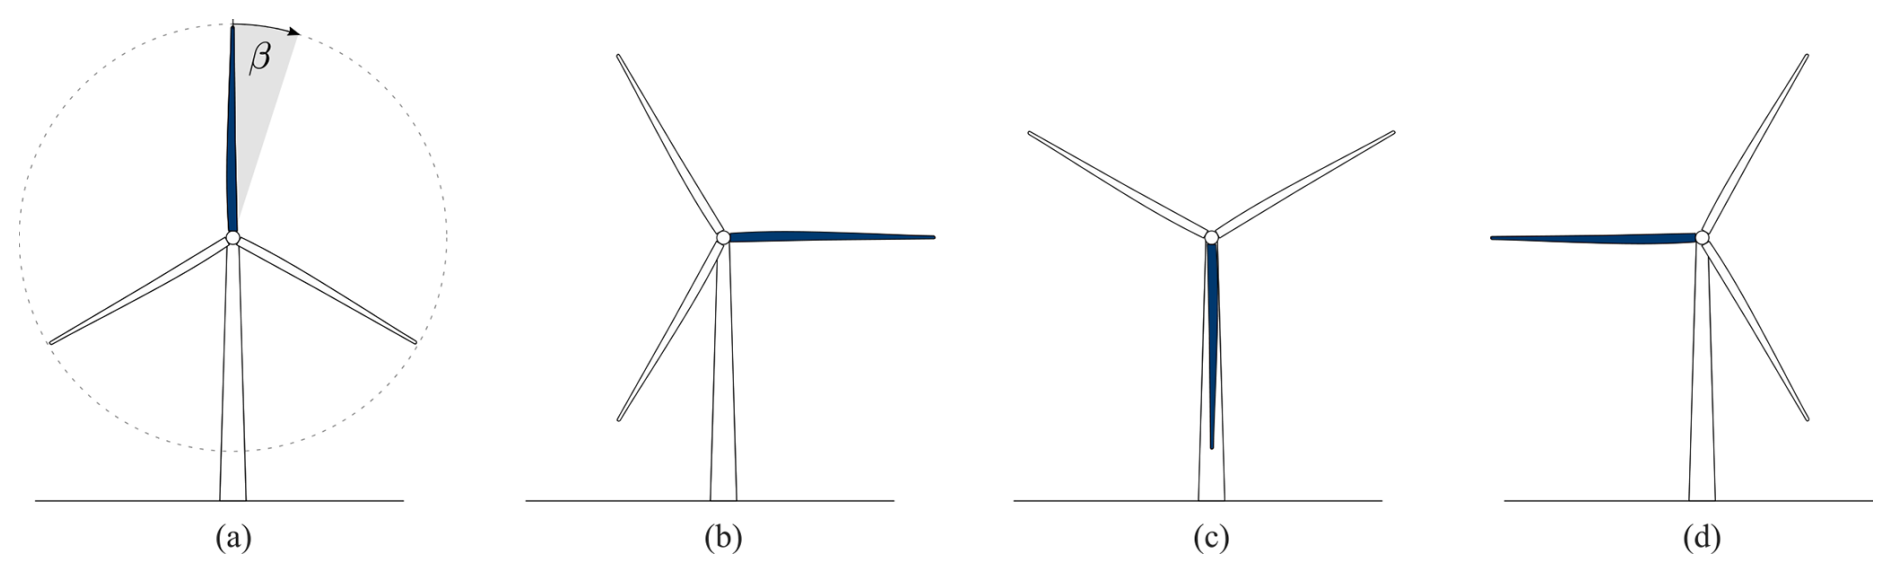
Figure 5Wind turbine rotor positions considered in this study. The rotor blade loads are evaluated at four azimuth angles β indicated by the blue rotor blade, i.e. (a) β=0°, (b) β=90°, (c) β=180°, and (d) β=270°.
In this section, the cross-sectional deformations at two exemplary positions along the blade are discussed.
Recall the blade element theory (Hau, 2013). Each rotor blade is divided into so-called blade elements. The lift and drag forces on a blade element level, which are denoted by dFL and dFD, can be calculated in steady-state conditions by the relations
where ρ denotes the mass density of air, cL(α) and cD(α) are the lift and drag coefficients at a given angle of attack α, urel is the relative inflow velocity, c is the chord length, and dr is the radial extension of the blade element under consideration. The change in airfoil geometry due to deformation can affect the chord length c as well as the lift and drag coefficients and can therefore have an impact on the lift and drag forces.
3.1 Change in airfoil shape
The internal loads at the four rotor positions (blade at 3, 6, 9, and 12 o'clock) were extracted. These bending moments were transformed into the global blade coordinate system, which was required for the 3D FE simulations. The resulting bending moments are shown together with the azimuth blade positions in Fig. 6. The dashed lines represent the flapwise bending moment, while the dash-dotted lines represent the edgewise bending moment. In each blade position the absolute values of the bending moments are the highest at the blade root and continuously decrease to zero at the blade tip. The bending moments were each applied to the 3D FE blade model. The deformed 2D cross-sections were extracted from the resulting deformed rotor blade. The largest cross-sectional deformations occurred in radial areas in the vicinity of and , where rA is the radius at position A, rB is the radius at position B, and R is the radius at the blade tip. Therefore, the cross-sections at these radial positions were selected for a detailed evaluation of the cross-sectional deformations. The undeformed and deformed cross-sections at these radial positions are shown on the right-hand side of Fig. 6. For visualisation purposes, the chord lengths of the cross-sections are normalised, and the deformation vectors are magnified by a scaling factor of 5. The shear webs are not shown, since they are not important for the aerodynamic forces. The black lines show the undeformed geometries of the cross-sections, while the red lines show the deformed cross-sections. In between, arrows are used to highlight the deflection vectors.
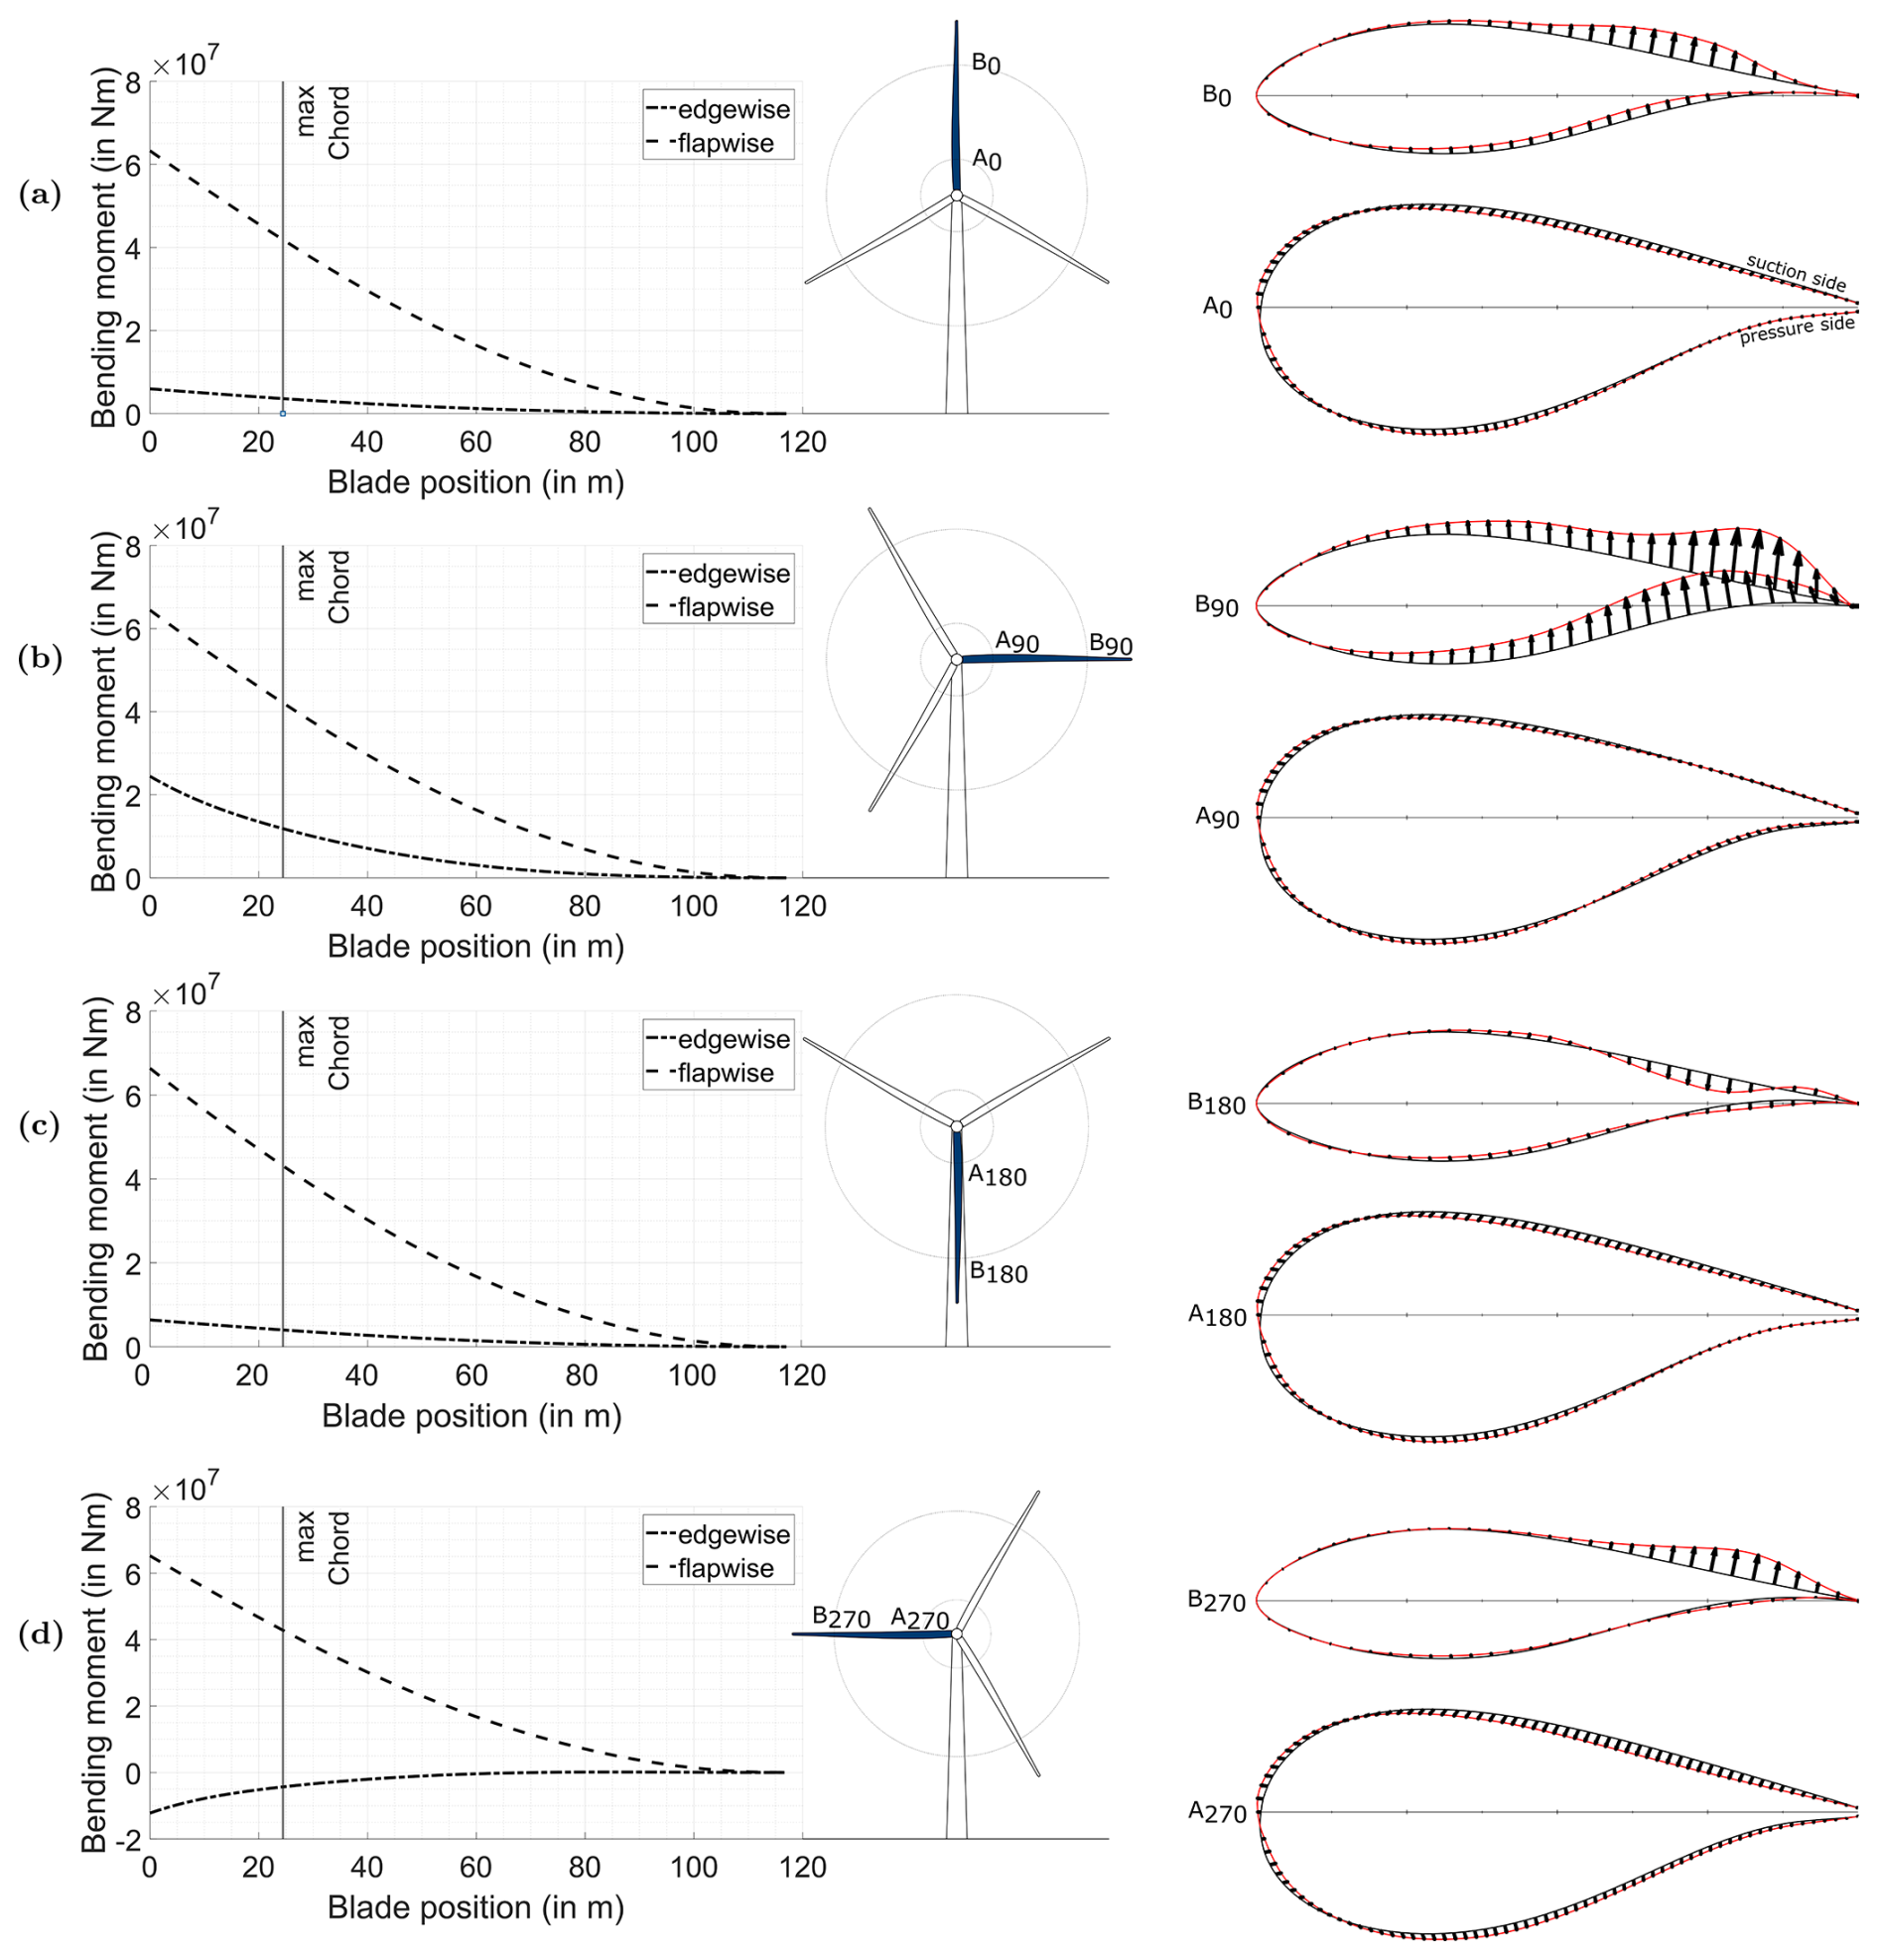
Figure 6Bending moment distributions and cross-sectional deformations at two positions along the rotor blade for four different azimuth positions of the blade. The rotor positions are and . The azimuth positions are (a) β=0° (12 o'clock), (b) β=90° (3 o'clock), (c) β=180° (6 o'clock), and (d) β=270° (9 o'clock).
Figure 6a shows the rotor blade pointing upwards (12 o'clock) so that its weight has a negligible effect on the bending moments. Both the flapwise and the edgewise bending moments have a positive sign. This means that the blade bends towards the suction side and towards the leading edge. The maximum flapwise bending moment is approximately 10.6 times bigger than the maximum edgewise bending moment. For the cross-section A at β=0° (denoted by A0), small deformations are detectable. The cross-section B does not show any deformation around the leading edge at any of the four positions of the blade. At β=0° (denoted by B0), the deformation at the trailing edge is also almost zero. However, in the trailing edge shell of the suction side, there is a significant deformation out of the cross-section and on the pressure side into the cross-section in a long region between the shear webs and the trailing edge.
As shown in Fig. 6b, the tip of the rotor blade points to the side at β=90° (3 o'clock), with the leading edge downwards. In this position, the weight of the blade has a major influence on the edgewise bending moment. Hence, the edgewise bending moment is bigger than at β=0°. Since the wind field is constant, the flapwise bending moment remains almost the same. The maximum flapwise bending moment is still approximately 2.6 times bigger than the edgewise bending moment. The sign of the edgewise bending moment is a major difference in loading between A90 and A270, and the magnitude of the edgewise bending moment changes significantly during one rotation. Contrarily, the flapwise bending moment is almost constant. The deformation in the vicinity of the trailing edge changes with the rotation, but in the other regions of the cross-section the deformation is constant. Hence, the deformation in the vicinity of the trailing edge seems to be governed by the edgewise bending moment (rotation of the trailing edge clockwise for positive edgewise bending moments and rotation of the trailing edge counter-clockwise for negative edgewise bending moments). The rest of the deformation is similar in all positions and is thus dominated by flapwise bending. The deformation at β=90° (denoted by B90) shows an additional rotation clockwise, which is similar to the findings in cross-section A. Hence, the deformation out of the cross-section on the suction side and into the cross-section on the pressure side is more pronounced compared to B0.
At a blade position of β=180° (6 o'clock), the rotor blade is vertically aligned and points downwards; see Fig. 6c. The bending moments are similar to those at a blade position of β=0° because the blade's weight is negligible, and the bending moments are governed by aerodynamic forces. At β=180° (denoted by B180), the deformation shows a clear difference compared to B0. It appears as if there was a buckle into the cross-section close to the trailing edge on the suction side and a small buckle out of the cross-section on the pressure side.
At a blade position of β=270° (9 o'clock), the blade tip points to the side with the leading edge upwards; see Fig. 6d. The weight is now counteracting the circumferential aerodynamic forces so that the edgewise bending moments become negative. The absolute values of the flapwise bending moment at the blade root is 5.3 times bigger compared to the edgewise bending moment. The deformation at β=270° (denoted by B270) looks qualitatively similar to B90, but the amplitude is much smaller. The dependencies between the cross-sectional deformations and the loading situations associated with the blade positions are not as clear for cross-section B as for cross-section A.
The cross-sectional deformations were determined for all cross-sections along the blade. However, due to space limitations, they cannot be discussed in detail here. Nevertheless, the changes in chord length and in lift and drag coefficients are presented in the following for all cross-sections.
3.2 Change in chord length
In addition to the actual change in geometry, a change in chord length due to the cross-sectional warping was observed. The chord length is defined as the distance between the leading and the trailing edge and was computed for the deformed cross-sections. The relative deviations between the chord length of the undeformed and the deformed cross-sections are plotted in Fig. 7. Each graph represents one blade position. The relative deviation is plotted against the normalised spanwise coordinate , where r is the actual spanwise position.
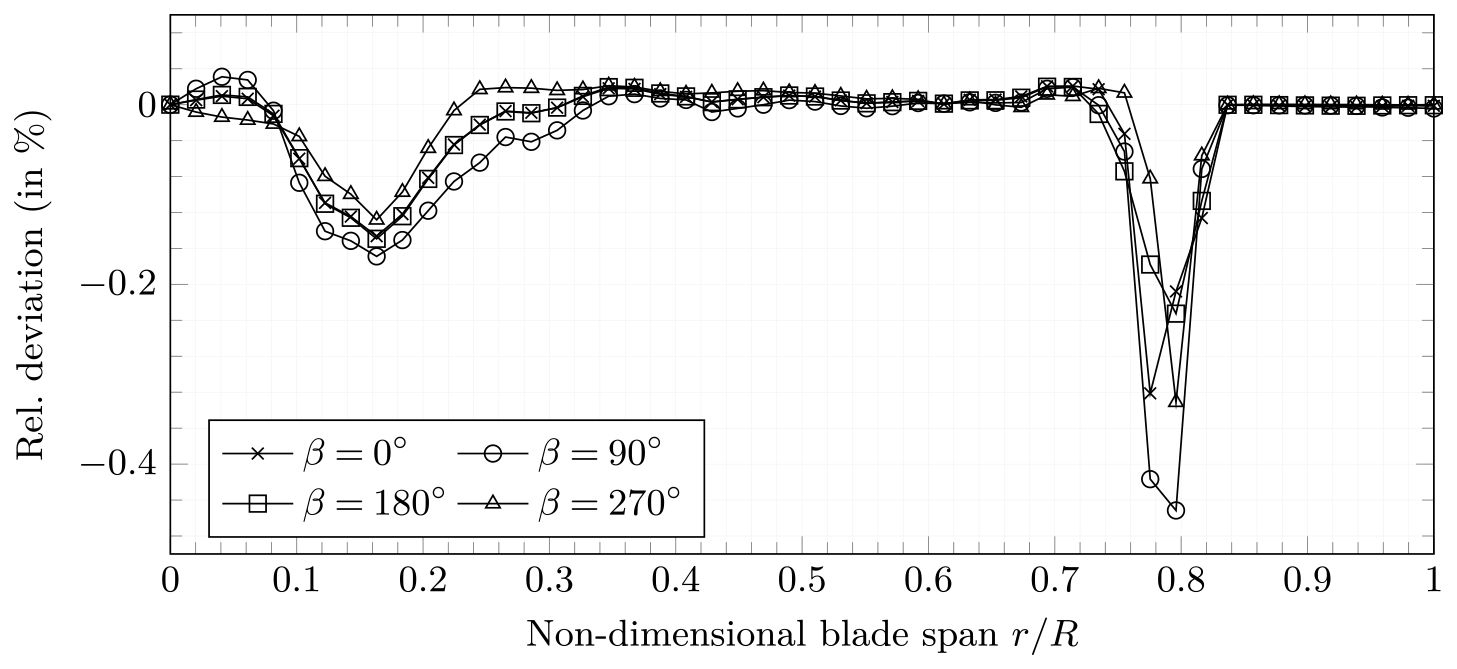
Figure 7Relative deviation of the chord length between the deformed and the undeformed cross-section, plotted as a function of the normalised spanwise position along the blade.
The relative deviations of the chord length show a similar behaviour for all four blade positions. There are two regions along the blade with a significant decrease in chord length. These are between and between , which correlates with the observation that the largest cross-sectional deformations occur in these regions, as mentioned in Sect. 3.1. The combination of the highest chord lengths and high bending moments in the first region results in relatively high cross-sectional deformations and thus in a chord length decrease of −0.16 %. The cross-section A that was exemplarily chosen in Sect. 3.1 is located in this region. In the second of the aforementioned regions, where the cross-section B from Sect. 3.1 is located, the maximum decrease in chord length is −0.45 %. A possible influence of the outermost load frame on the local cross-sectional deformations was investigated by pushing the load frame more to the tip. The local deformations remained. Hence, it was concluded that the deformations in this region are a matter of structural blade design and rather due to transition to buckling than a load introduction effect. Because there is no load frame beyond 82 % blade length, no bending moments occur in this portion of the blade in the numerical model and consequently no deformations of the cross-sections. The radial positions between 30 % and 70 % blade length show a negligible amount of chord length deviation for the investigated load cases, again confirming the observation mentioned in Sect. 3.1 that the cross-sectional deformations are small in this region. The spanwise positions up to 10 % blade length are not evaluated here because of multiple reasons. First, the deformations of the numerical model are not representative due to the fixed boundary conditions at the blade root. Second, the aerodynamic coefficients of the airfoils used in this section of the blade cannot be evaluated with XFOIL because of relative thicknesses that are too high. Due to the small radius, the resulting small relative inflow velocity, and the absence of an aerodynamic airfoil (this is the transition region from a circle to an airfoil), this area of the blade has only a very small to negligible contribution to the aerodynamic performance and the aerodynamic loads of the blade so that the error is considered negligible.
In general, the observed local chord length variations in two regions of the blade correlate with the findings from Sect. 3.1. The decrease in chord lengths due to cross-sectional warping, when considered in isolation, would result in a decrease in aerodynamic forces and thus in a decrease in bending moments in the blade; see Eq. (1). However, the decrease in chord length is generally small (below 1 %). It is thus expected that its influence on the aerodynamic behaviour of the rotor is small compared to the influence of airfoil geometry changes due to cross-sectional warping on the lift and drag coefficients and on the resulting aerodynamic loads and associated bending moments. The impact of deformation-related geometry changes on the aerodynamic coefficients is thus investigated in Sect. 3.3.
3.3 Change in lift and drag coefficients
The deformed cross-sections were used to recalculate the aerodynamic performance of the blade in operation. Therefore, XFOIL simulations were conducted with the new cross-section geometries for the four blade positions. The results were included in the aero-servo-elastic simulations. Because time-dependent changes in airfoils cannot be modelled in OpenFAST, one simulation was conducted for each load scenario of the four blade positions using the same deformation for the entire rotor. The four simulations were then evaluated only at the rotor blade position corresponding to the position where the load was extracted. The lift and drag coefficients, each plotted against the normalised spanwise position along the blade for the four blade azimuth positions, are presented on the left-hand side of Fig. 8. Qualitatively, the distributions of the coefficients are similar for all blade positions. Quantitatively, there is a slight difference in lift coefficients depending on the blade position. For instance, the highest lift coefficients are observed at the blade position of β=270°, whereas the lowest lift coefficients are observed at the blade position of β=90°. The quantitative difference in drag coefficients is not significant. There is only a very small tendency that the drag coefficient is the smallest when the blade points upwards (β=0°) and the highest when the blade points downwards (β=180°). In the spanwise regions around rA and rB, there are irregularities in the aerodynamic coefficients, especially in lift. These are associated with more significant and local cross-sectional deformations in these regions; see also Sect. 3.1 and 3.2. In the inboard region close to rA, the impact on the rotor performance is considered small due to the short lever arm, i.e. distance between the cross-section and the blade root. In the vicinity of rB, however, the increase in lift coefficient can impact the blade root bending moment more significantly. This is discussed in more detail in Sect. 4.
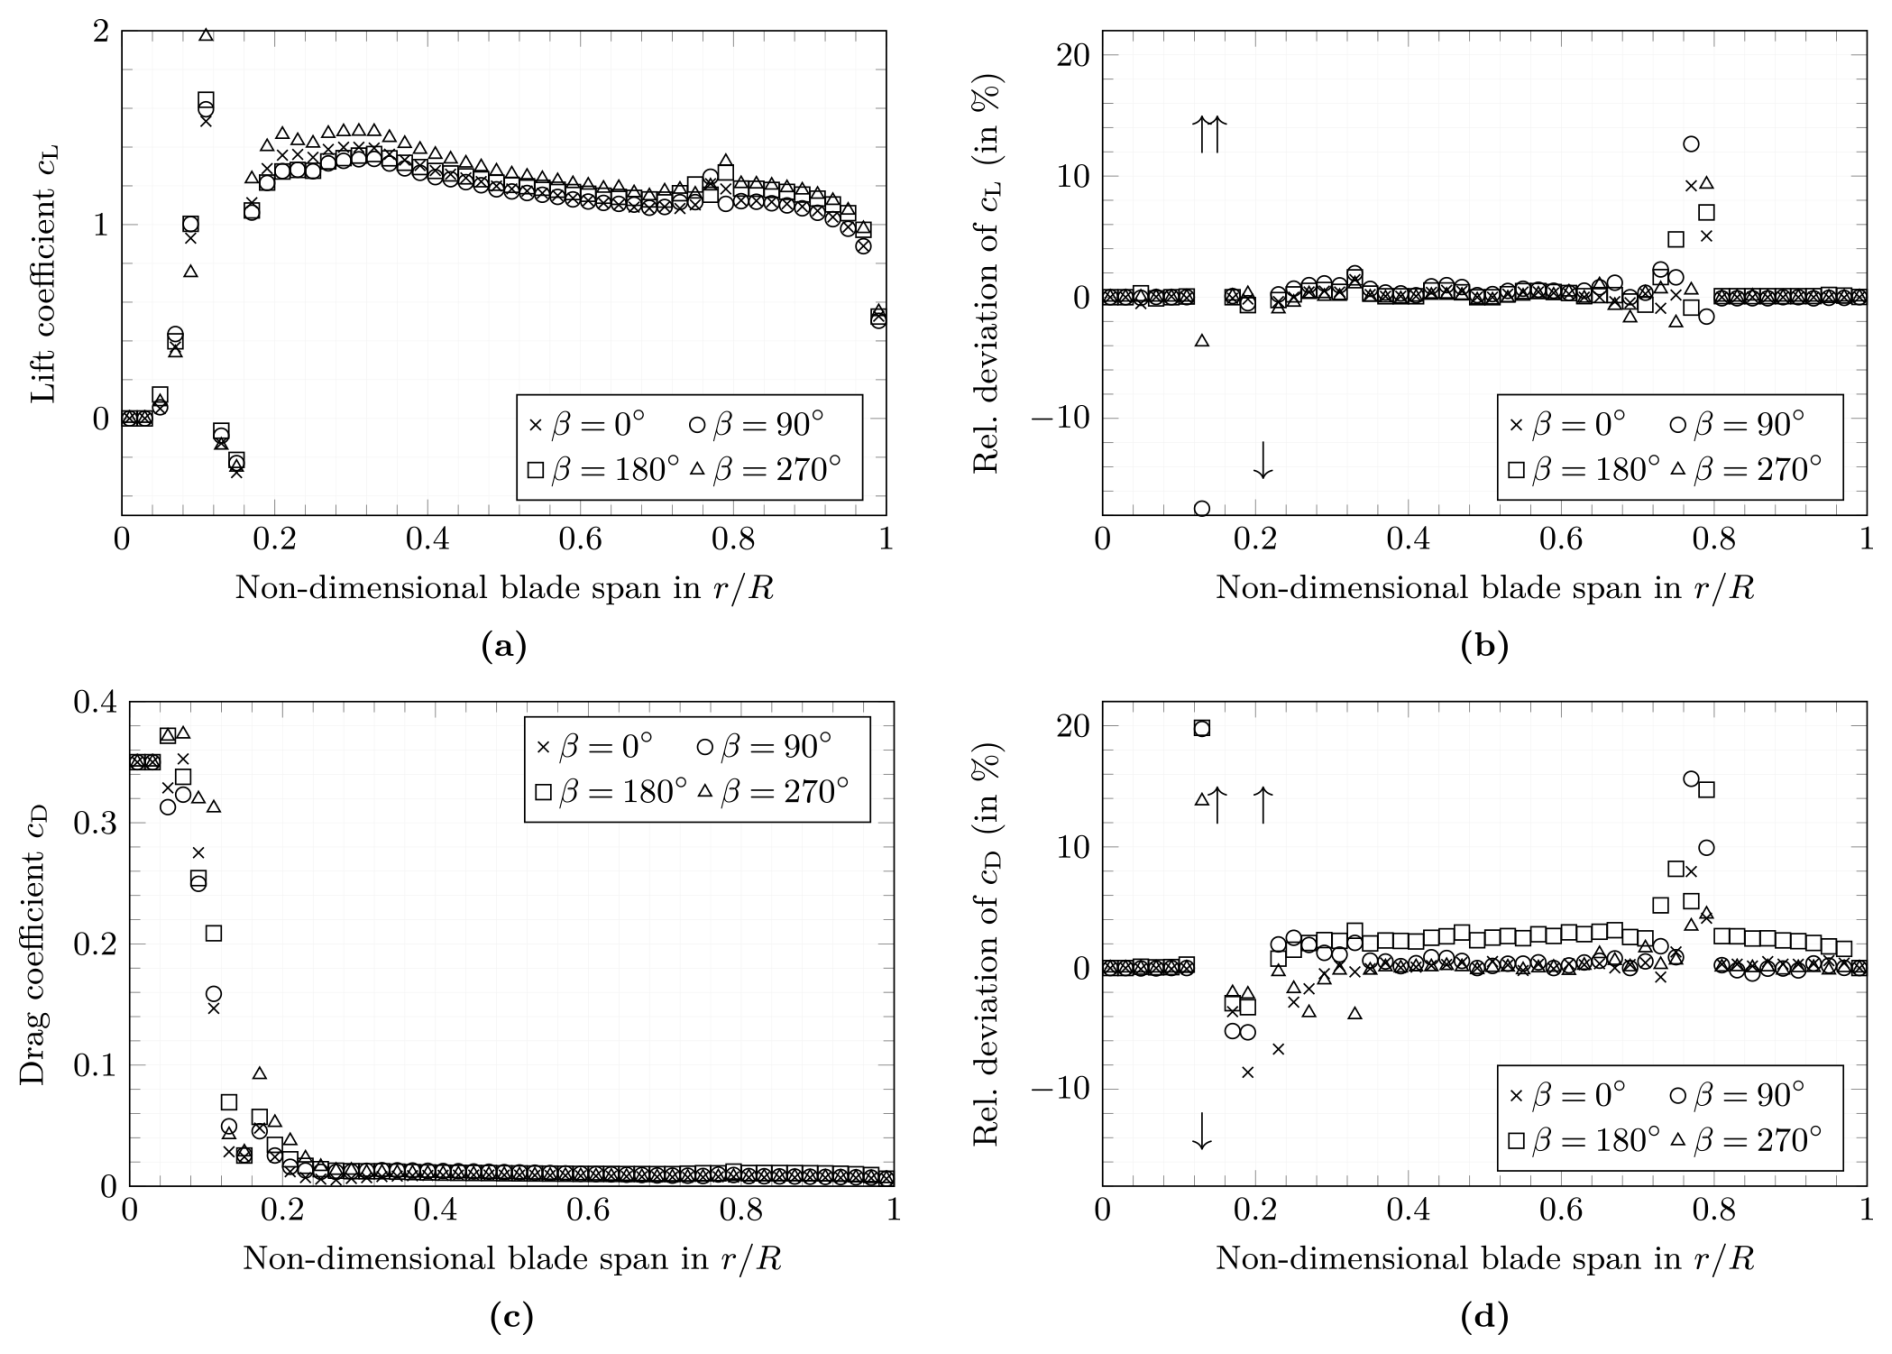
Figure 8Comparison of the aerodynamic performance. The lift coefficient (a), the relative deviation of the lift coefficient (b), the drag coefficient (c), and the relative deviation of the drag coefficient (d) are plotted as functions of the normalised spanwise position along the blade for the four analysed azimuth positions of the blade. The values are taken from the respective OpenFAST simulations.
Note that the angles of attack also change within one rotor revolution due to the tilt and cone angles in the rotor and the associated vertically inclined inflow. Hence, we need to look at the relative deviations in lift and drag coefficients, which are shown on the right-hand side of Fig. 8. The two regions around rA and rB show a pronounced change in aerodynamic properties. The inboard region around rA corresponds with the region of maximum chord length. There, the trailing edge panels are the longest panels without stiffeners (shear webs) in the blade and are more susceptible to bending within the plane of the cross-section. Moreover, due to the high chord length in this region, small relative changes in aerodynamic coefficients have a high absolute impact on the aerodynamic forces. However, although the highest relative lift coefficient deviation of 146 % is observed here, this region close to the blade root does not play a major role in the aerodynamic performance of the rotor due to the short lever arm. Moreover, the XFOIL results for distorted cross-sections may not be very accurate at these positions because of the high relative thicknesses of the airfoils; see also Sect. 3.2. The deviation around rB is likely linked to a lack of stiffness in this area so that the local deformation is associated with transition to buckling, which matches with the local buckle-like deformations in the trailing edge panels reported in Sect. 3.1. This design weakness is also in accordance with the fact that the blade is not in the final design stage (Gaertner et al., 2020).
When comparing Fig. 8b and Fig. 8d, it can be seen that the cross-sectional deformations lead to a small relative increase in the lift coefficients and a somewhat higher relative increase in the drag coefficients along the blade, which is consistent with the literature (Gaudern, 2014). This is accompanied with a more significant variation in the absolute lift coefficients and a minor variation in the absolute drag coefficients. Since the lift coefficients generally increase, especially in the outboard region of the blade around rB, and the lift forces contribute to the thrust forces and thus to out-of-plane bending to the largest extent, the out-of-plane bending moments are supposed to increase due to the cross-sectional deformations. The increase in drag, on the contrary, will have the biggest impact on the in-plane (edgewise) bending moments, as they predominantly decrease the circumferential forces producing torque. This holds especially for the blade positions of β=0° and β=180° because the aerodynamic forces are governing the edgewise bending moments in these positions, whereas the blade mass is governing the edgewise bending moments in horizontal blade positions. The effect of the cross-sectional deformations on the blade root bending moments is investigated in the following section in more detail.
The aim of this section is to compare the wind turbine behaviour with and without the cross-sectional deformations of the blade. For the comparison, the chord length distribution and the aerodynamic coefficients were updated in the aero-servo-elastic simulations. For the cross-sectional deformations in each blade azimuth position, an OpenFAST simulation was carried out in which the new aerodynamic parameters were used for all three blades. The in-plane and out-of-plane blade root bending moments for one full rotation of the rotor are analysed in the following.
The in-plane blade root bending moments are plotted in Fig. 9. The continuous black line represents the configuration with undeformed cross-sections. The values that are compared with those including the cross-sectional deformations are highlighted by cross markers. Circular markers are used to show the blade root bending moments based on the cross-sectional deformations calculated for the respective azimuth position of the blade. The deviations are relatively small. Hence, the relative deviation ϵ was calculated for all blade positions and is included in Fig. 9. At azimuth positions of β=0° and β=180°, the relative deviations are comparably high with % and %, respectively. They are at least 1 order of magnitude smaller at blade positions of β=90° and β=270° with % and %, respectively. The higher deviation in the vertical blade positions was expected and is in line with the findings of Sect. 3 because the in-plane bending is governed by aerodynamic forces in these cases, which in turn are affected by the cross-sectional deformations. In the horizontal blade positions, the in-plane bending is governed by the blade's mass, which is independent of the cross-sectional deformations. From the relative deviation in chord length presented in Sect. 3.2, one may expect that the loads are most influenced at β=90°. Since the highest deviation in loads occurs for the horizontal blade positions instead, we conclude that the change in general airfoil geometry due to cross-sectional deformations and its influence on the lift and drag coefficients have a higher impact on the change in aerodynamic loads than the deviation in chord length. This is supported by the observation that the relative change in the drag coefficient, which affects the in-plane bending more than the lift coefficient, is of a higher magnitude than the change in chord length; cf. Sect. 3.
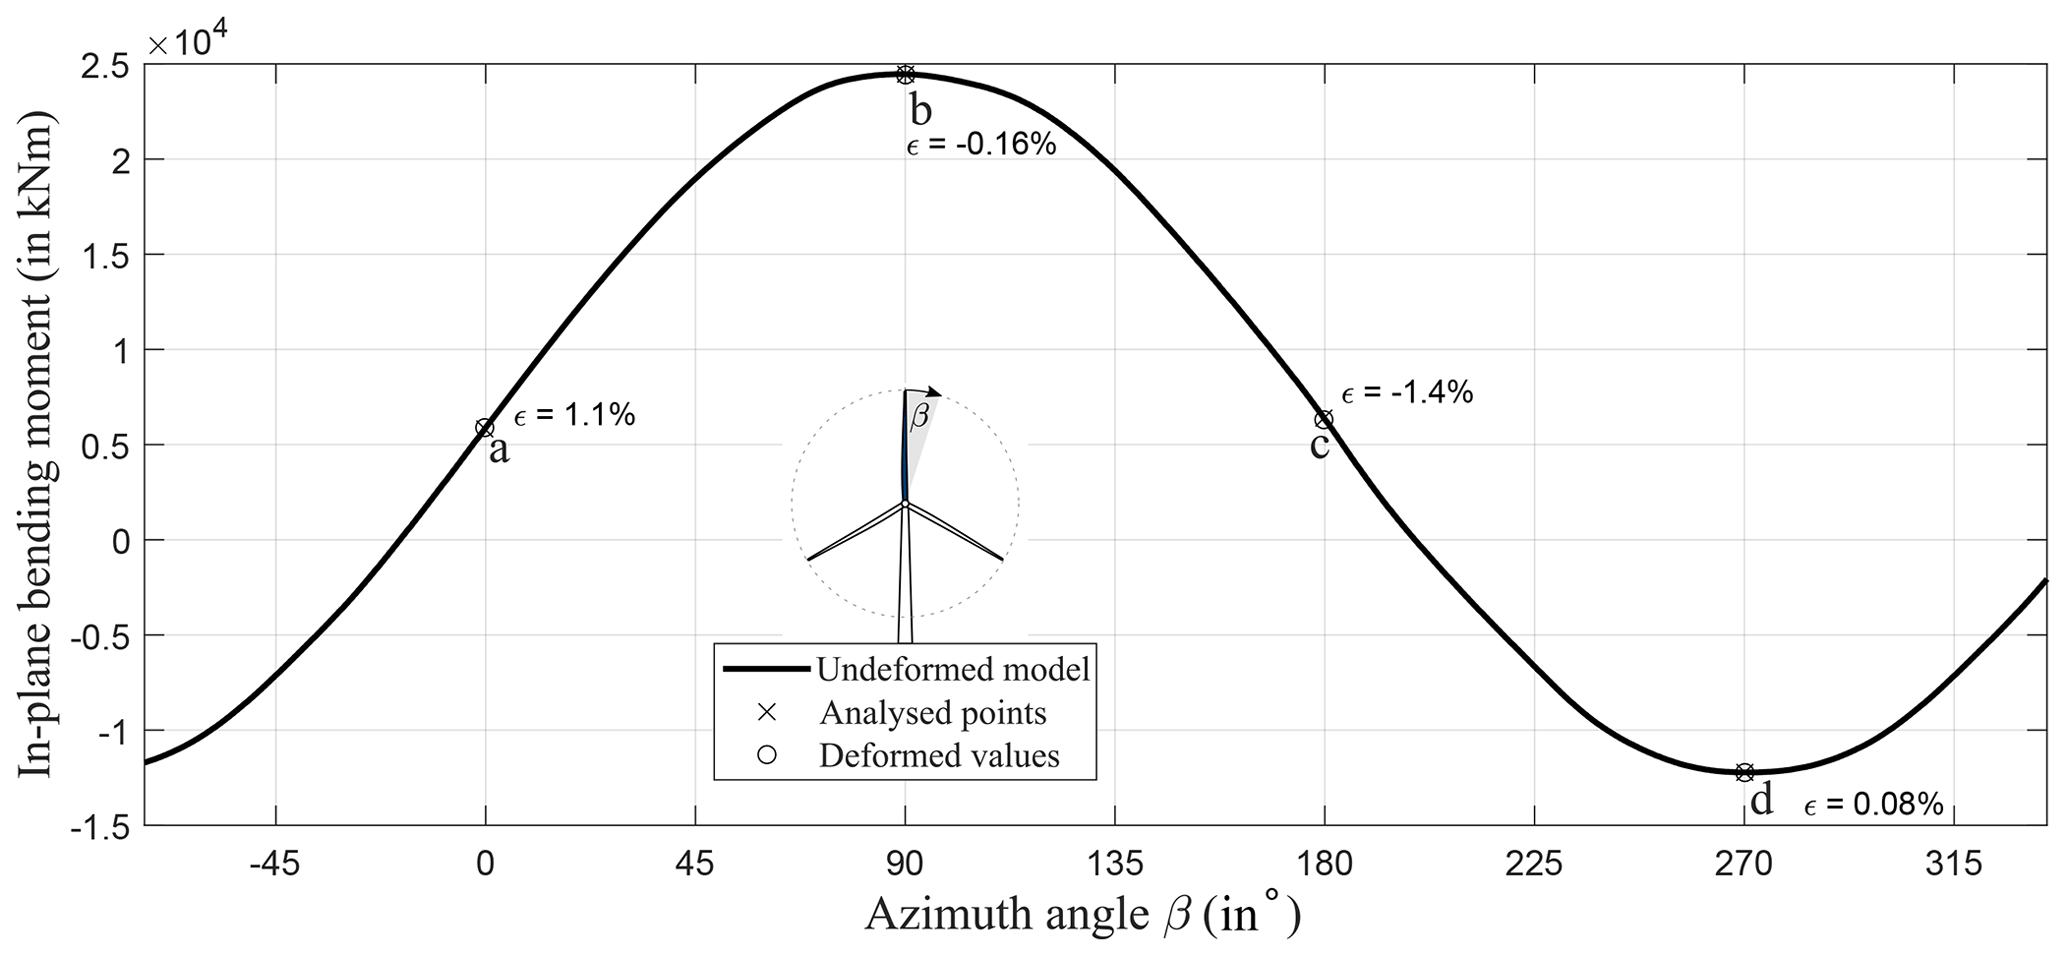
Figure 9Comparison of the in-plane blade root bending moments. The turbine response with cross-sectional deformations in the four analysed azimuth positions is compared with the turbine response without cross-sectional deformations.
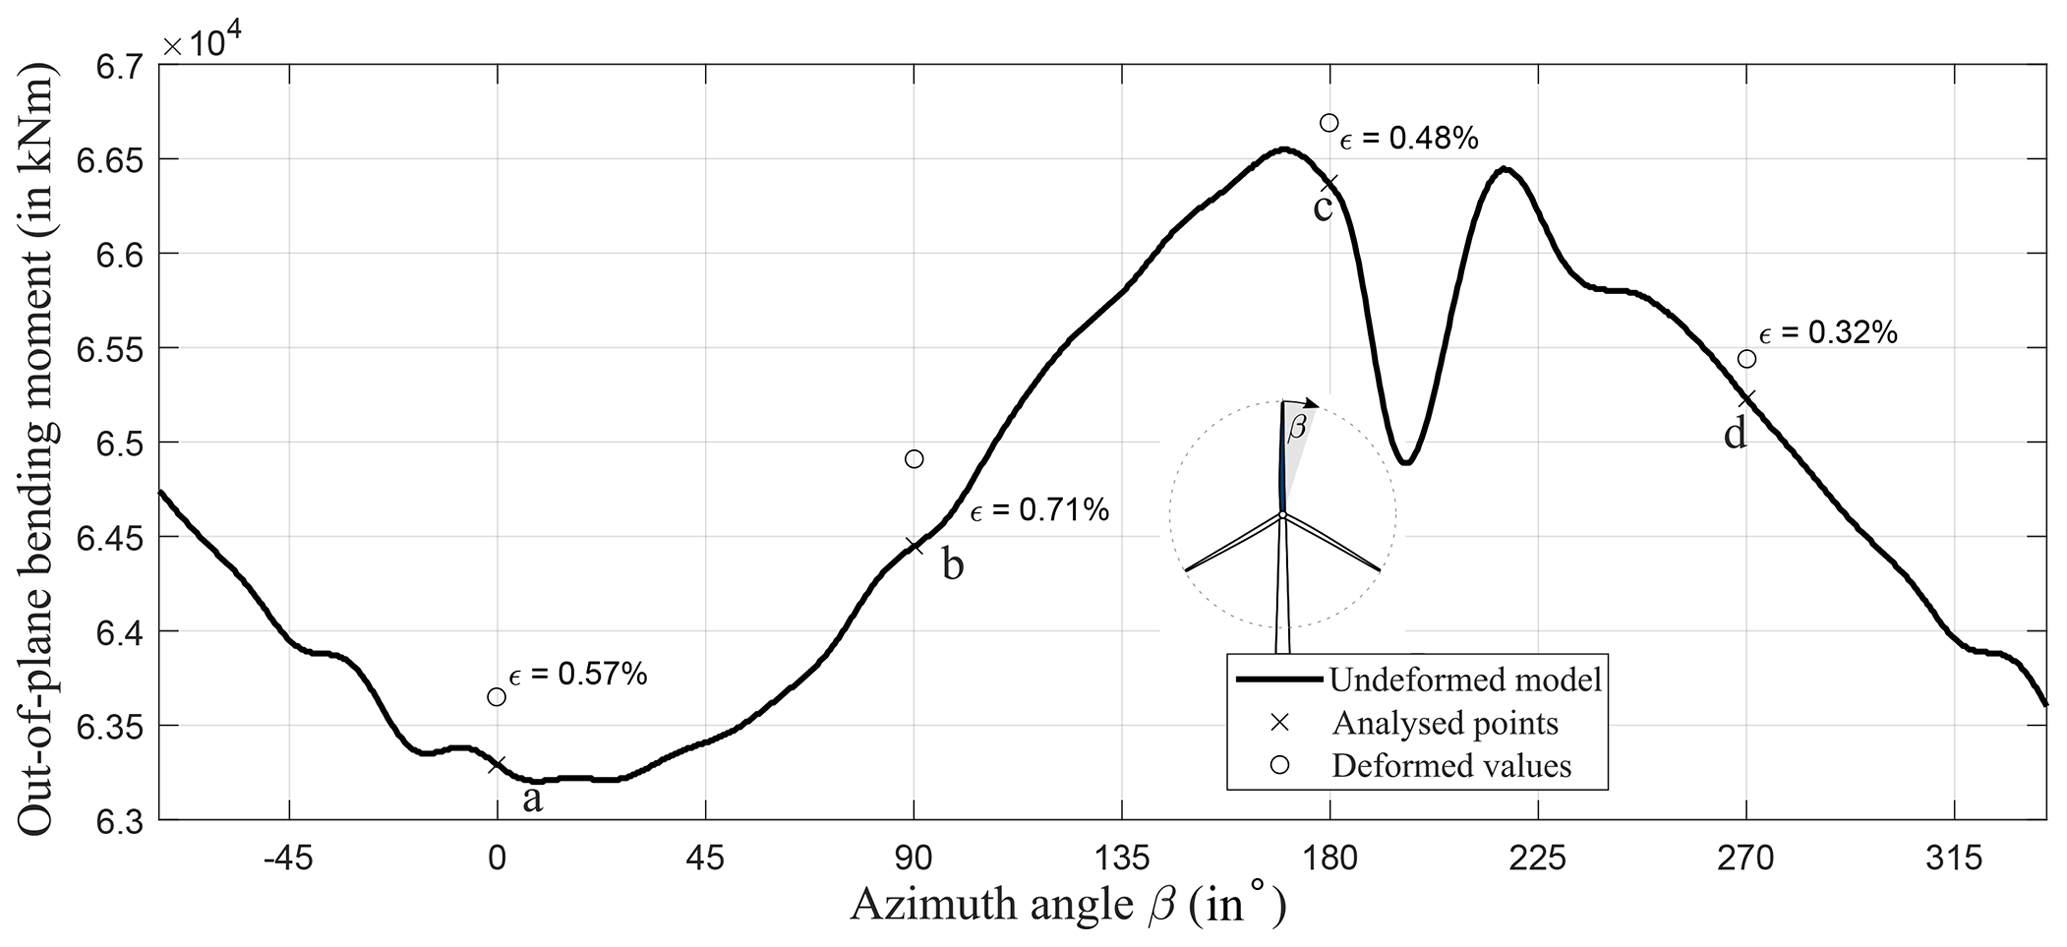
Figure 10Comparison of the out-of-plane blade root bending moments. The turbine response with cross-sectional deformations in the four analysed azimuth positions is compared with the turbine response without cross-sectional deformations.
The out-of-plane blade root bending moments are plotted in Fig. 10. The relative deviation is of the same order of magnitude for all rotor positions. The smallest deviation of ϵ=0.32 % occurs at an azimuth position of β=270° and the biggest deviation of ϵ=0.71 % at β=90°. Hence, the smallest and biggest deviations are observed in the horizontal blade positions. The relative deviations for the vertical blade positions are approximately the mean values of the relative deviations for the horizontal positions with ϵ=0.57 % at β=0° and ϵ=0.48 % at β=180°. The increase in the out-of-plane blade root bending moment is caused by the increase in lift coefficients along the blade; see Sect. 3.3. This matches with the fact that the lift forces contribute to rotor thrust to the highest extent, which results in out-of-plane bending. Contrarily, the decrease in chord length would have resulted in a decrease in lift and drag and thus in a decrease in the out-of-plane blade root bending moment, which does not occur. We thus conclude that the shape distortions of the airfoils due to cross-sectional deformations and their impact on the lift coefficients along the blade are of higher importance than the chord length variation.
This paper provides a first study analysing aero-elastic simulations of a wind turbine taking into account cross-sectional deformations in the rotor blades. To the best of the authors' knowledge, such investigation has not been carried out before by other groups.
The wind turbine model under investigation was the IEA 15 MW reference wind turbine. An initial simulation was carried out using aerodynamic coefficients (i.e. lift and drag coefficients) calculated with XFOIL. A simple load case was applied using a constant wind field at rated wind speed. Four different bending moment distributions based on the azimuth angles of the blade were applied to a detailed 3D FE model of the rotor blade. The 3D FE model was used to calculate the deformed shapes of the cross-sections along the blade, which formed the basis of a new calculation of lift and drag coefficients. Additionally, the change in chord lengths was computed. Both new polars and new chord length distributions were implemented in the aero-elastic turbine model. The deformations were in particular present locally in the vicinity of 20 % of the blade span, where the maximum chord position was located, and 80 % of the blade span. They were governed by bending in the trailing edge panels in the cross-sectional plane. The largest changes in chord lengths were also identified at these positions, which shows an expected coupling between cross-sectional distortion and shortening of the chord lengths. The relative deviation of the chord lengths in the deformed cross-sections was found to be below −0.45 %. Four new OpenFAST simulations were performed, including the newly calculated airfoil polars and chord length distributions that were calculated for four different azimuth positions of the blade. The results showed a maximum change in the blade root bending moments of −1.4 % for the in-plane bending moment and +0.71 % for the out-of plane bending moment. The results revealed that the shape distortion of the airfoils and the resulting change in airfoil characteristics (lift and drag coefficients) have the biggest influence on the variation in the blade root bending moments, whereas the decrease in chord length has a minor and negligible effect.
The aforementioned relative deviations are associated with a load scenario of normal operation at rated wind speed and thus with maximum operational loading (i.e. maximum thrust and torque). Nevertheless, the deviations in root bending moments are quite small. It can thus be concluded that the impact of cross-sectional deformations on the aero-elastic response of the turbine is small (and potentially negligible) for normal operation. However, it should be noted that this conclusion is design-specific, meaning that the aero-elastic effect can be more pronounced in other turbines depending on the design philosophy with respect to the blade's stiffness. To derive more general conclusions, different turbines and rotor blades could be analysed. Moreover, higher degrees of loading, e.g. from extreme load cases, may result in higher cross-sectional deformations and thus higher aero-structural couplings. Hence, a broader variety of load scenarios including combined loading with torsion from extreme conditions should be investigated in future work. Independent of particular results, the methodology presented in this paper could be used to numerically verify the absence of potentially undesirable aero-elastic couplings originating from cross-sectional deformations during the design, which could help to increase the reliability of wind turbines in the future.
Figure A1 shows selected geometrical (panels a–b) and structural (panels c–d) data as functions along the blade span for both the reference model and the FE model. The geometrical data comprise the chord length (a) and the relative thickness (b), and the structural data comprise the bending stiffnesses in the flapwise (out-of-plane bending; see Fig. A1c) and the edgewise (in-plane bending; see Fig. A1d) directions. For the MoCA model, the bending stiffnesses were calculated using BECAS (Blasques and Stolpe, 2012), which is a FEM tool that provides cross-sectional stiffness and mass matrices based on a 2D FE model and is widely used in the research community and the wind energy industry. The geometric parameters were chosen because they have a major influence on the aerodynamic behaviour of the rotor. The flapwise and edgewise stiffnesses were selected as structural representatives because the investigations focus on the bending behaviour of the blades. In all subplots of Fig. A1, the data from the FE model are displayed by cross markers and those of the IEA 15 MW RWT model by circle markers.
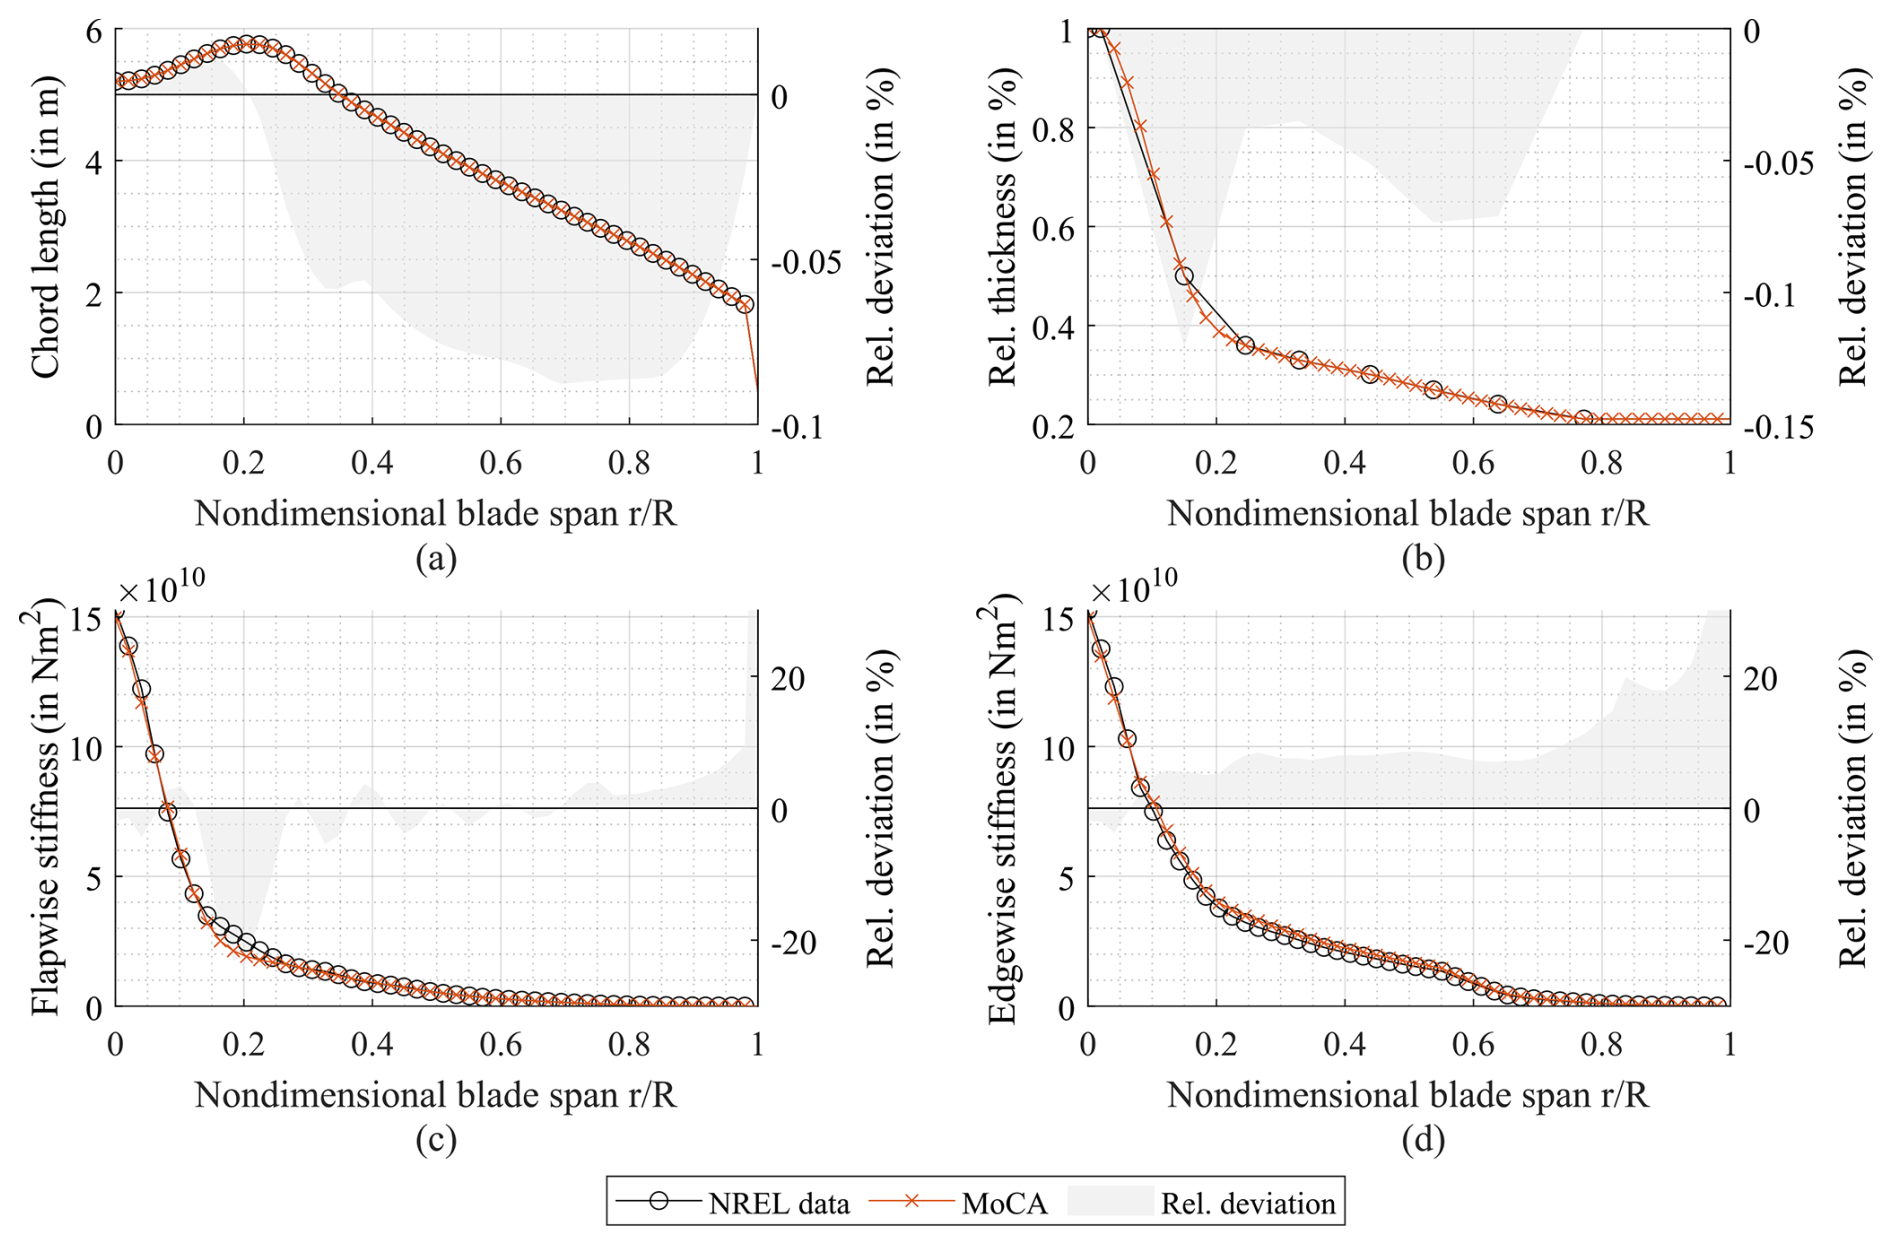
Figure A1Comparison of the MoCA-based FE model and the IEA 15 MW reference turbine model. The chord length (a), the relative thickness (b), and the flapwise (c) and edgewise (d) stiffnesses are plotted as functions of the normalised blade span. The differences between the models are presented as relative deviation.
Figure A1 shows that the relative deviation of the chord length is below −0.1 %. This parameter is therefore considered to be accurately mapped. The relative thickness is also well represented in the FE model at spanwise positions where data points are given in the NREL data of the reference model (relative deviation below −0.12 %). However, in the reference model, the resolution of data points is relatively coarse, which are only given at the positions where the basic airfoils are defined. In the FE model, data points are also calculated equidistantly in between using piecewise cubic interpolation splines. Particularly in the region where the geometry has large gradients, i.e. at spanwise positions of , this results in significant deviations compared to a linear interpolation in the reference model plotted in Fig. A1.
The flapwise and edgewise bending stiffnesses are plotted exemplarily together with the reference turbine data in Fig. A1c and d. The stiffnesses generally agree very well. The deviation is largely less than −10 %. However, it can be seen that there is a significant deviation in the flapwise bending stiffness of up to −22 % in the range of the maximum chord length (around ). This is due to the difference in relative thickness, which defines the distance between the spar caps and thus has a major impact on the flapwise bending stiffness. A significant difference in both the flapwise and the edgewise stiffnesses occurs at the blade tip due to a difference in chord length at the tip. However, from a structural point of view, the blade tip is irrelevant because the free end of the blade is unloaded. Moreover, the relative deviation increases towards the tip because the absolute stiffness values decrease and approach zero towards the tip. The general small deviation of stiffnesses is likely due to differences in the tool chain to extract stiffnesses from a 3D model, where the processes of data calculation in the reference model are not absolutely clear.
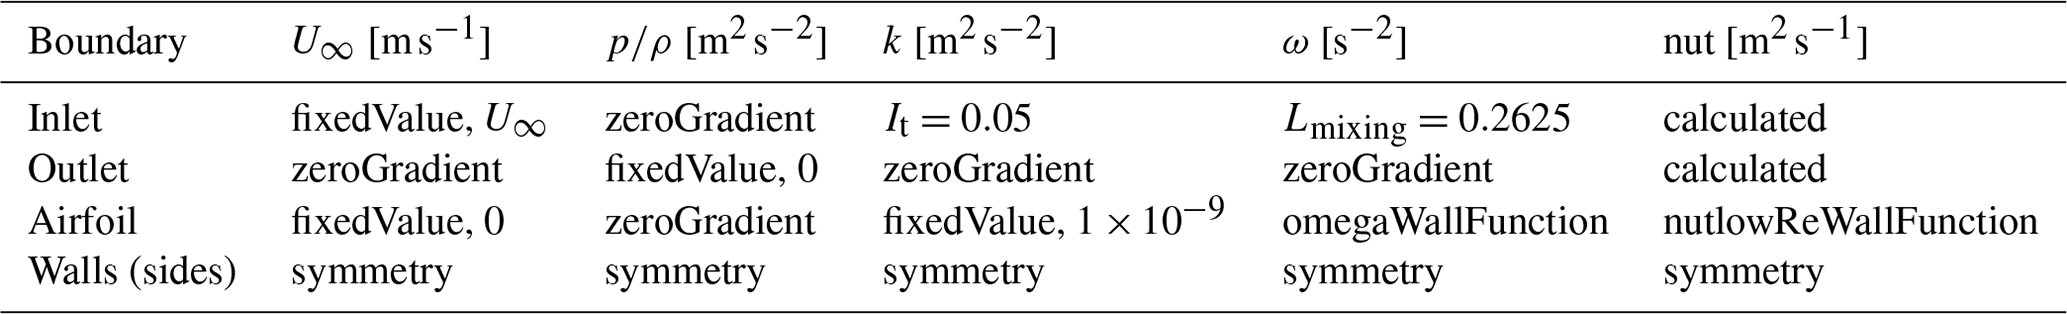
Utilising the open-source CFD solver OpenFOAM v2012, a 3D transient unsteady Reynolds-averaged Navier–Stokes (URANS) simulation was conducted to determine the static polars of two selected deformed airfoils at spanwise positions of and . The simulation was executed for a Reynolds number of . The primary objective was to verify the lift and drag coefficients in the linear region of XFOIL. The computational domain, which is illustrated in Fig. B1, takes the form of a cylinder with a diameter of 50c and a length of 1c in the spanwise direction, where c is the chord length. These dimensions, previously employed by Yalcin et al. (2021), have proven effective in obtaining simulation results independent of far-field and spanwise mesh resolution. This allows for an in-depth analysis of flow phenomena around the airfoil. Boundary conditions for the computational domain are outlined in Table B1. Specifically, at the inlet, a uniform velocity and a zero gradient for kinematic pressure are applied, while at the outlet, a zero gradient for the velocity and a uniform kinematic pressure of (indicating incompressible flow) are enforced. Wall boundaries adopt a symmetry condition, except for the airfoil surface where a zero-velocity condition prevails. Initial values for the internal fields are estimated using the inlet velocity, the hydraulic diameter, and the turbulence intensity (TI=0.1 %). The simulation employs the transient and incompressible pimpleFoam solver, incorporating the PIMPLE (merged PISO–SIMPLE) algorithm for pressure and velocity coupling (Issa, 1986). OpenFOAM utilises the finite-volume (fV) method to discretise differential terms in the RANS equation. The discretisation of the governing system of equations relies on a second-order finite-volume approach in both space and time. Spatial discretisation employs a second-order upwind method as outlined by Warming and Beam (1976), while temporal discretisation follows the implicit three-point backward Euler scheme. Turbulence-related additional terms are modelled using the shear stress transport (SST) model, as introduced by Menter (1994), because it was successfully validated for the prediction of dynamic stall by Ahrens et al. (2022). Laminar-to-turbulent transition is considered in the XFOIL calculation. Since the boundary layer transitions to turbulent very close to the leading edge, fully turbulent boundary layers are assumed in CFD. This was experimentally shown by Kiefer et al. (2022). A summary of the applied numerical schemes can be found in Table B2.
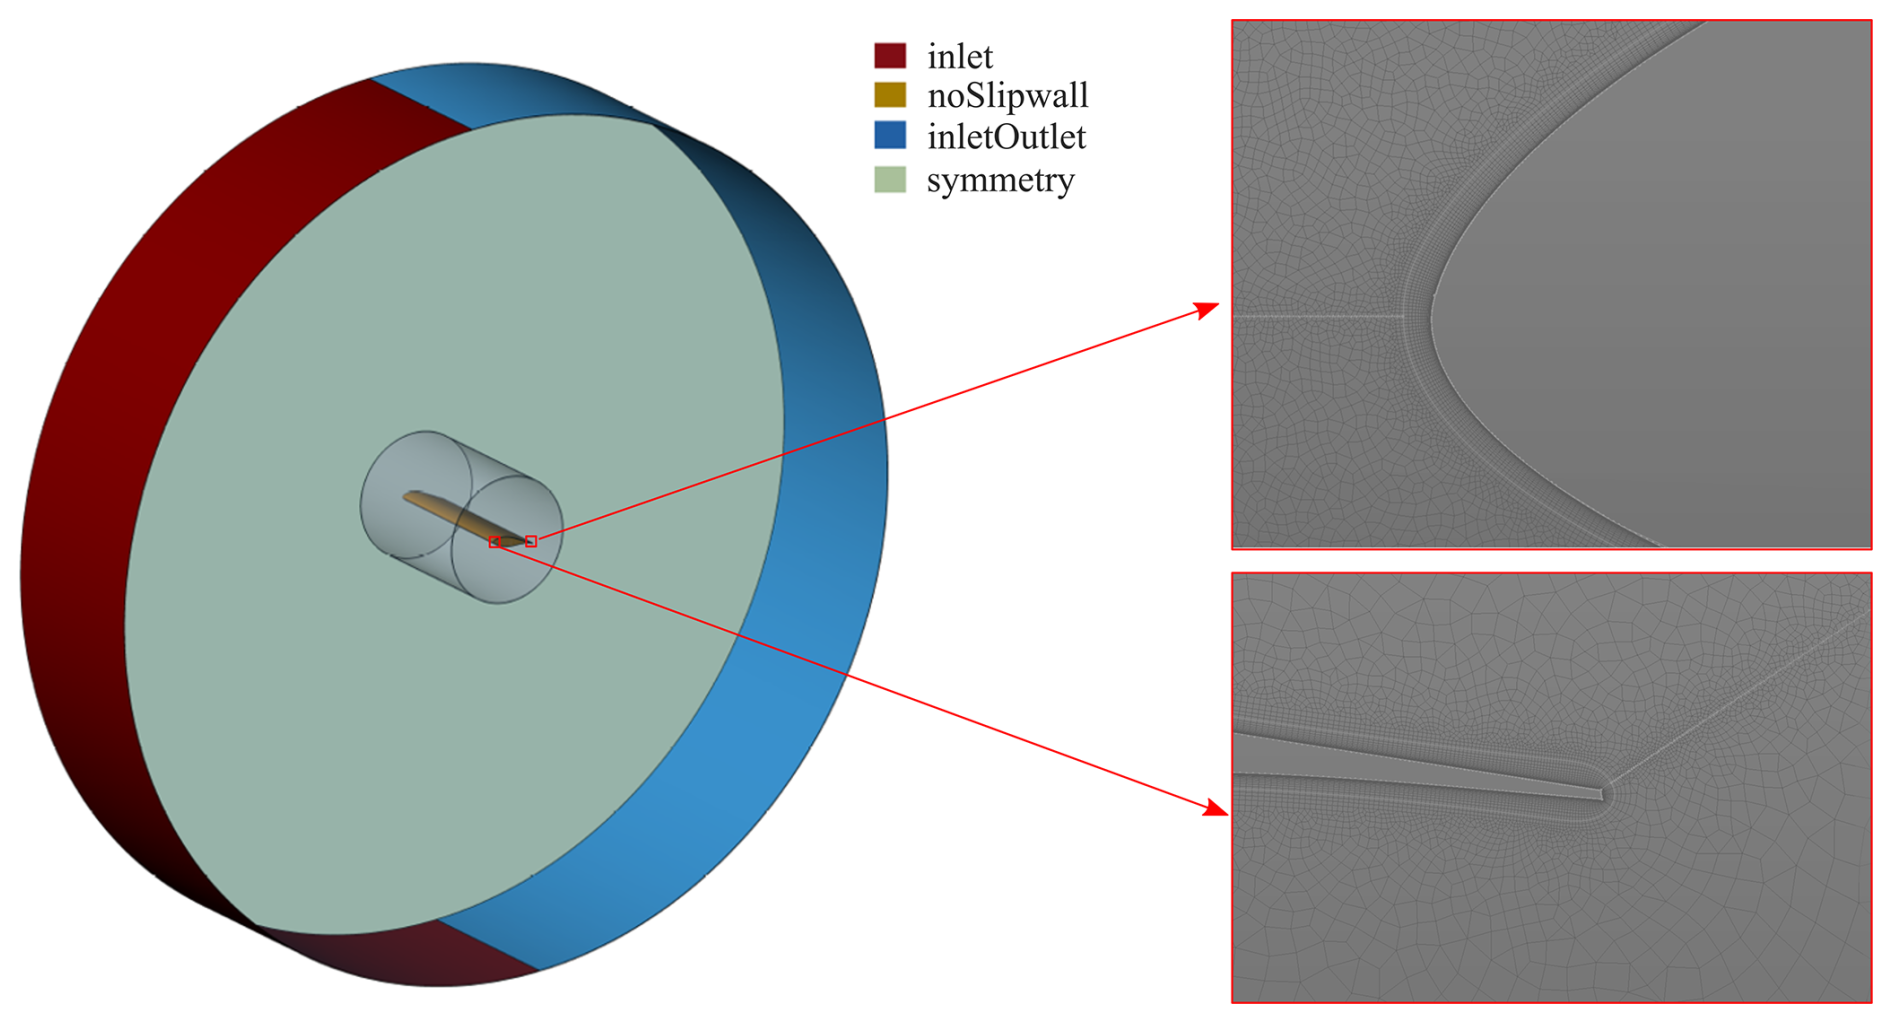
Figure B1Boundary conditions and dimensions of the computational domain used to simulate the static polars with URANS.
Table B1Initial and boundary conditions for the URANS simulations.
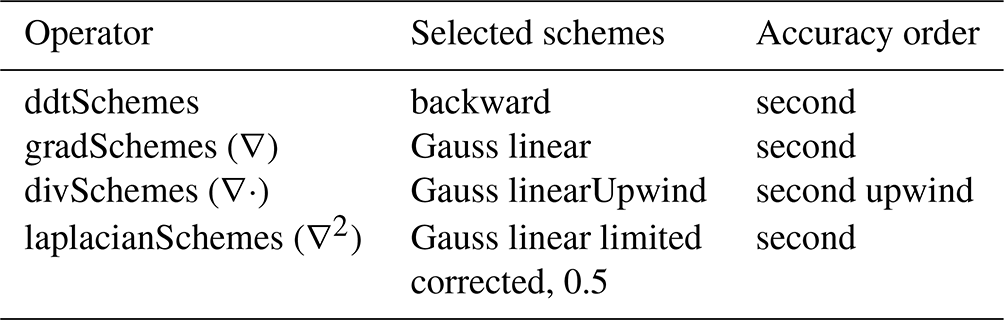
Statistical convergence was monitored using the methodology introduced by Ries et al. (2018). The maximum ensemble error for all simulations was . The non-dimensional cell height is
during all time steps, and in the streamwise direction. Vitulano et al. (2025) conducted a mesh dependency study for the FFA-W3-211 profile at a Reynolds number of 1.8×10⁶, showing almost no sensitivity between 12×104 and 74×104 cells in the 2D plane. Kim et al. (2025) presented a mesh sensitivity study for the FFA-W3-211 profile at a Reynolds number of 15×106, showing that further refinement of the mesh in the spanwise direction has a negligible influence on the prediction of the dynamic stall cycles. They used 35×104 cells in the 2D plane with 20 cells in the spanwise direction of the 3D model. A more precise comparison with Vitulano et al. (2025) is not possible because they do not report non-dimensional cell sizes, and they used a wall-function approach. A mesh dependency study for slim profiles at a Reynolds number of 0.4×10⁶ was done by Ahrens et al. (2022), showing that a mesh with and is sufficient to investigate integral blade loads during a dynamic stall cycle. Therefore, the cell dimensions used in this paper are assumed to yield mesh-independent predictions of lift and drag coefficients, especially in the linear region of XFOIL.
The raw and processed data required to reproduce these findings cannot be shared at this time due to legal reasons.
JG wrote the paper, conducted the literature research, implemented pre- and post-processing scripts, carried out the simulations (except CFD), and prepared the figures. FP contributed to the calculation of deformed cross-sections on the basis of 3D FE analyses and internally reviewed the paper. DA conducted CFD analyses and wrote the CFD part of Sect. 2.2 and Appendix B. LW supervised DA and internally reviewed the paper. CB provided scientific guidance and supervision to JG in all project phases, internally reviewed the paper, and was responsible for funding acquisition.
The contact author has declared that none of the authors has any competing interests.
Publisher's note: Copernicus Publications remains neutral with regard to jurisdictional claims made in the text, published maps, institutional affiliations, or any other geographical representation in this paper. While Copernicus Publications makes every effort to include appropriate place names, the final responsibility lies with the authors.
The authors gratefully acknowledge the computing time granted by the Resource Allocation Board and provided on the supercomputers Lise and Emmy at NHR@ZIB and NHR@Göttingen as part of the NHR infrastructure. The calculations for this research were conducted with computing resources under project nii00172. The authors acknowledge the financial support.
This research has been supported by the Deutsche Forschungsgemeinschaft (grant no. SFB1463 – project ID 434502799).
The publication of this article was funded by the open-access fund of Leibniz Universität Hannover.
This paper was edited by Mingming Zhang and reviewed by two anonymous referees.
Ahrens, J. D., Ziesse, M., Wein, L., and Seume, J. R.: A Novel And Costeffective Approach To Simulating Dynamic Stall On Rotating Wind Turbine Blades With A Changing Angle Of Attack, GPPS Chania, https://doi.org/10.33737/gpps22-tc-13, 2022. a, b
Ansys®: Academic Research Mechanical APDL, Relase 2020 R2, 2020. a, b
Bak, C.: Aerodynamic design of wind turbine rotors, in: Advances in wind turbine blade design and materials, edited by: Brøndsted, P., Nijssen, R., and Goutianos, S., Woodhead Publishing, 79–128, https://doi.org/10.1016/B978-0-08-103007-3.00001-X, 2023. a
Balzani, C. and Gebauer, J.: Impact of shell structure stiffness on aero-structural coupling in wind turbine rotor blades, IOP Conf. Ser.-Mat. Sci., 1293, 012025, https://doi.org/10.1088/1757-899X/1293/1/012025, 2023. a, b
Blasques, J. P. and Stolpe, M.: Multi-material topology optimization of laminated composite beam cross sections, Compos. Struct., 94, 3278–3289, 2012. a, b
Brazier, L.: On the flexure of thin cylindrical shells and other “thin” sections, P. R. Soc. Lond. A-Conta., 116, 104–114, 1927. a, b
Burton, T., Jenkins, N., Bossanyi, E., Sharpe, D., and Graham, M.: Wind energy handbook, 3rd edn., Wiley, ISBN 9781119451150, 2021. a
Cecchini, L. S. and Weaver, P. M.: Brazier effect in multibay airfoil sections, AIAA J., 43, 2252–2258, 2005. a
Drela, M.: XFOIL: An Analysis and Design System for Low Reynolds Number Airfoils, in: Low Reynolds Number Aerodynamics: Proceedings of the Conference Note Dame, Indiana, USA, 5–7 June 1989, edited by: Mueller, T. J., Springer Verlag, 1–12, https://doi.org/10.1007/978-3-642-84010-4, 1989. a
Eder, M. A. and Bitsche, R.: A qualitative analytical investigation of geometrically nonlinear effects in wind turbine blade cross sections, Thin Wall. Struct., 93, 1–9, 2015a. a
Eder, M. A. and Bitsche, R. D.: Fracture analysis of adhesive joints in wind turbine blades, Wind Energy, 18, 1007–1022, https://doi.org/10.1002/we.1744, 2015b. a
Etemaddar, M., Hansen, M. O. L., and Moan, T.: Wind turbine aerodynamic response under atmospheric icing conditions, Wind Energy, 17, 241–265, 2014. a
Gaertner, E., Rinker, J., Sethuraman, L., Zahle, F., Anderson, B., Barter, G., Abbas, N., Meng, F., Bortolotti, P., Skrzypinski, W., Scott, G., Feil, R., Bredmose, H., Dykes, K., Shields, M., Allen, C., and Viselli, A.: Definition of the IEA 15-Megawatt Offshore Reference Wind, Tech. Rep. NREL/TP-5000-75698, National Renewable Energy Laboratory, Golden, CO, 2020. a, b
Gaudern, N.: A practical study of the aerodynamic impact of wind turbine blade leading edge erosion, J. Phys. Conf. Ser., 524, 012031, https://doi.org/10.1088/1742-6596/524/1/012031, 2014. a, b
Gebauer, J. and Balzani, C.: Cross-Sectional Deformation of Wind Turbine Rotor Blades, in: International Ocean and Polar Engineering Conference, Ottawa, Canada, 19–23 June, paper no. ISOPE-I-23-048, 2023. a, b
Hansen, M. O. L.: Aerodynamics of wind turbines, 3rd edn., Earthscan from Routledge, ISBN 9781315769981, 2015. a
Haselbach, P. U., Eder, M. A., and Belloni, F.: A comprehensive investigation of trailing edge damage in a wind turbine rotor blade, Wind Energy, 19, 1871–1888, https://doi.org/10.1002/we.1956, 2016. a
Hau, E.: Wind turbines: fundamentals, technologies, application, economics, 3rd edn., Springer, ISBN 9783642271519, 2013. a, b
Hodges, D. H.: Nonlinear composite beam theory, American Institute of Aeronautics and Astronautics, https://doi.org/10.2514/4.866821, 2006. a
IEC61400-23: Wind turbine generator systems – Part 23: Full-scale structural testing of rotor blades, 1st edn., International Electrotechnical Commission, IEC61400-23., 2001. a, b
Issa, R. I.: Solution of the implicitly discretised fluid flow equations by operator-splitting, J. Comput. Phys., 62, 40–65, 1986. a
Jensen, F., Weaver, P., Cecchini, L., Stang, H., and Nielsen, R.: The Brazier effect in wind turbine blades and its influence on design, Wind Energy, 15, 319–333, 2012. a
Jonkman, J. M., Hayman, G., Jonkman, B., Damiani, R., and Murray, R.: AeroDyn v15 user's guide and theory manual, NREL Draft Report, 46, 2015. a, b
Kiefer, J., Brunner, C. E., Hansen, M. O., and Hultmark, M.: Dynamic stall at high Reynolds numbers induced by ramp-type pitching motions, J. Fluid Mech., 938, A10, https://doi.org/10.1017/jfm.2022.70, 2022. a
Kim, H. R., Printezis, J. A., Ahrens, J. D., Seume, J. R., and Wein, L.: Characterization of dynamic stall of a wind turbine airfoil with a high Reynolds number, Wind Energ. Sci., 10, 161–175, https://doi.org/10.5194/wes-10-161-2025, 2025. a
Kim, T., Hansen, A. M., and Branner, K.: Development of an anisotropic beam finite element for composite wind turbine blades in multibody system, Renew. Energ., 59, 172–183, 2013. a
Larsen, T. J. and Hansen, A. M.: How 2 HAWC2, the user’s manual, ver. 13.1, ISBN 978 87 550 3583 6, 2023. a
Lennie, M., Pechlivanoglou, G., Marten, D., Nayeri, C. N., and Paschereit, O.: A review of wind turbine polar data and its effect on fatigue loads simulation accuracy, Turbo Expo: Power for Land, Sea, and Air, 15–19 June 2015, Montreal, Quebec, Canada, 56802, V009T46A018, https://doi.org/10.1115/GT2015-43249, 2015. a
Liu, X., Lu, C., Liang, S., Godbole, A., and Chen, Y.: Vibration-induced aerodynamic loads on large horizontal axis wind turbine blades, Appl. Energ., 185, 1109–1119, 2017. a
Madsen, H. A., Larsen, T. J., Pirrung, G. R., Li, A., and Zahle, F.: Implementation of the blade element momentum model on a polar grid and its aeroelastic load impact, Wind Energ. Sci., 5, 1–27, https://doi.org/10.5194/wes-5-1-2020, 2020. a
Menter, F. R.: Two-equation eddy-viscosity turbulence models for engineering applications, AIAA J., 32, 1598–1605, https://doi.org/10.2514/3.12149, 1994. a
National Renewable Energy Laboratory: OpenFAST User Documentation, https://openfast.readthedocs.io/en/main/, last access: 19 December 2023. a, b
National Renewable Energy Laboratory: BeamDyn User Guide and Theory Manual, https://openfast.readthedocs.io/en/main/source/user/elastodyn/index.html, last access: 21 October 2024a. a
National Renewable Energy Laboratory: ElastoDyn Users Guide and Theory Manual, https://openfast.readthedocs.io/en/main/source/user/elastodyn/index.html, last access: 8 July 2024b. a, b
Noever-Castelos, P., Haller, B., and Balzani, C.: Validation of a modeling methodology for wind turbine rotor blades based on a full-scale blade test, Wind Energ. Sci., 7, 105–127, https://doi.org/10.5194/wes-7-105-2022, 2022. a, b
Ries, F., Nishad, K., Dressler, L., Janicka, J., and Sadiki, A.: Evaluating large eddy simulation results based on error analysis, Theor. Comp. Fluid Dyn., 32, 733–752, 2018. a, b
Rosemeier, M. and Saathoff, M.: Impact of manufacture-induced blade shape distortion on turbine loads and energy yield, J. Phys. Conf. Ser., 1618, 052011, https://doi.org/10.1088/1742-6596/1618/5/052011, 2020. a
Schürmann, H.: Konstruieren mit Faser-Kunststoff-Verbunden, vol. 2, Springer, https://doi.org/10.1007/978-3-540-72190-1, 2007. a
Söker, H.: Loads on wind turbine blades, in: Advances in Wind Turbine Blade Design and Materials, edited by: Brøndsted, P. and Nijssen, R. P. L., Woodhead Publishing, 55–78, https://doi.org/10.1016/B978-0-08-103007-3.00002-1, 2013. a
Vassilopoulos, A. P.: Fatigue life prediction of wind turbine blade composite materials, in: Advances in wind turbine blade design and materials, edited by: Brøndsted, P. and Nijssen, R. P. L., Woodhead Publishing, 251–297, https://doi.org/10.1533/9780857097286.2.251, 2013. a
Vitulano, M. C., De Tavernier, D., De Stefano, G., and von Terzi, D.: Numerical analysis of transonic flow over the FFA-W3-211 wind turbine tip airfoil, Wind Energ. Sci., 10, 103–116, https://doi.org/10.5194/wes-10-103-2025, 2025. a, b
Warming, R. F. and Beam, R. M.: Upwind Second-Order Difference Schemes and Applications in Aerodynamic Flows, AIAA J., 14, 1241–1249, https://doi.org/10.2514/3.61457, 1976. a
Yalcin, O., Cengiz, K., Wein, L., Özyörük, Y., and Seume, J. R.: Transitional DDES Study over a Circular Cylinder and an Airfoil Profile, The 13th International ERCOFTAC symposium on engineering, turbulence, modelling and measurements, 15–17 September 2021, Rhodes, Greece, 2021. a
- Abstract
- Introduction
- Methods
- Cross-sectional deformations
- Coupling effect on the turbine behaviour
- Conclusions and outlook
- Appendix A: Comparison of FE model and IEA 15 MW reference turbine
- Appendix B: Verification of airfoil polars between XFOIL and CFD
- Code and data availability
- Author contributions
- Competing interests
- Disclaimer
- Acknowledgements
- Financial support
- Review statement
- References