
the Creative Commons Attribution 4.0 License.
the Creative Commons Attribution 4.0 License.
 | 26 May 2026
Benchmarking of three DWM-based wake models at below-rated wind speeds
Øyvind Waage Hanssen-Bauer
Paula Doubrawa
Helge A. Madsen
Henrik Asmuth
Jason Jonkman
Gunner C. Larsen
Stefan Ivanell
Roy Stenbro
Wind turbine wake models are essential tools for predicting power losses and structural loads in wind farms. Among these, the dynamic wake meandering (DWM) model, included as a recommended approach in the International Electrotechnical Commission design standard, is a widely used engineering-fidelity method that balances accuracy and computational cost. This study compares the performance of three DWM-based wake model implementations (from the Technical University of Denmark, the National Renewable Energy Laboratory, and the Institute for Energy Technology) under below-rated wind speed conditions. Model predictions of wake flow, power output, and structural loads for a four-turbine row are evaluated across different ambient turbulence levels and wind-direction misalignments and compared against high-fidelity large-eddy simulation results. All three models captured the overall wake evolution and mean turbine performance with reasonable accuracy; their predicted time-averaged thrust and power were typically within 5 %–10 % of the large-eddy simulation benchmark. However, notable differences emerged in wake structure and unsteady load predictions, with discrepancies increasing for turbines further downstream. These differences highlight the importance of modelling choices such as wake summation and turbulence treatment, which strongly influence power-deficit and fatigue-load predictions. Comparison with large-eddy simulations reveals each approach's strengths and weaknesses, indicating where improvements are needed. Overall, the findings point to specific refinements for DWM models to improve their fidelity, ultimately enabling more robust wake predictions for wind farm design and operation.
- Article
(6776 KB) - Full-text XML
- BibTeX
- EndNote


The wind energy industry has undergone significant development since its beginning, evolving from isolated, low-efficiency turbines to large-scale, modern wind farms. In these farms, spatial constraints and the need to minimize infrastructure and maintenance costs often lead to farm layouts with tightly spaced turbines. This evolution has increased the focus on turbine–turbine interactions, as wake effects have been identified as a major contributor to energy losses and elevated structural loads throughout the farm.
To maximize energy yield, the industry commonly employs simplified engineering models for steady-state wake prediction during design and operational planning. However, wakes from upstream turbines not only reduce wind speeds but also generate unsteady turbulence, which impacts the performance and fatigue loading of downstream machines. Because steady-state models are inherently unable to capture these unsteady flow phenomena, they are not suitable for load assessments. Instead, the industry commonly relies on the effective turbulence model (International Electrotechnical Commission, 2019) for structural load calculations, which does not simulate individual wakes explicitly but approximates their impact by artificially increasing the ambient turbulence intensity. An alternative approach to consider wake effects on turbine loads according to international wind turbine design standards is the dynamic wake meandering (DWM) model (Larsen et al., 2008; Madsen et al., 2010; Larsen et al., 2013). This approach explicitly simulates individual wakes as convecting, meandering flow fields, where the velocity deficit is advected downstream with stochastic lateral and vertical motion driven by ambient large-scale turbulence, superimposed on an ambient wind field. By capturing key unsteady wake dynamics such as meandering and advection, DWM-based models include physical phenomena that are absent from simpler steady-state models, yet remain orders of magnitude more computationally efficient than high-fidelity large-eddy simulations (LESs). Recent work by Doubrawa et al. (2023) showed that even though the effective turbulence model and the DWM model predict similar intra-farm flow characteristics and, when coupled with aeroelastic solvers, turbine structural loads on average, much more insight and directional variability arise from the DWM model that the effective turbulence model cannot resolve. DWM models enable realistic load predictions under waked conditions – an essential capability for wind farm design and certification.
Since its introduction in the early 2000s, the DWM model has undergone continuous refinement. Several research groups have proposed enhancements or modifications to the original formulation, including alternative meandering algorithms, variations in wake-deficit shapes (Doubrawa et al., 2017; Branlard et al., 2023; Bernard et al., 2024), improved wake superposition techniques (Machefaux et al., 2016; de Vaal and Muskulus, 2021), and more advanced treatments of wake-added turbulence (Madsen et al., 2005; Keck et al., 2015; Branlard et al., 2024). These efforts have led to a range of DWM-based implementations, such as the original model integrated with DTU's aeroelastic software HAWC2, NREL's FAST.Farm tool (Jonkman et al., 2017), and the more recent WIFET wake model (Hanssen-Bauer et al., 2020; de Vaal and Muskulus, 2021), each incorporating unique sub-models. While grounded in the same core physical principles, their predictions can differ substantially due to implementation choices.
DWM-based models have been calibrated and compared with high-fidelity large-eddy simulations coupled with LES actuator-line turbine models (LES-ALM) (Madsen et al., 2010; Jonkman et al., 2018; Doubrawa et al., 2018; Shaler and Jonkman, 2021; Hanssen-Bauer et al., 2020) and also validated with full-scale field measurements (Madsen et al., 2010; Larsen et al., 2013, 2015, 2017). Direct intercomparisons between different DWM implementations remain limited, with a few notable exceptions. The benchmarking study by Asmuth et al. (2022) compared six numerical models – including DWM implementations from DTU and NREL and the LES-ALM software Ellipsys3D – with full-scale measurements from the DanAero experiment. That study focused on a two-turbine setup under below-rated wind conditions, analysing one full-wake and one partial-wake case. The benchmark concluded that the numerical models of varying fidelity generally captured mean wake characteristics and azimuthal variations in aerodynamic forces with a mean relative error of 15 %–20 %. While the compared quantities were not consistently better captured by the high-fidelity LES than the DWM models, it was concluded that this to some extent could be related to the difficulties for LESs in capturing correct ambient inflow conditions. However, the scope in this study was limited to the response of two turbines and the wake flow behind only the upstream rotor, leaving the effects of multiple interacting wakes unexamined.
In another benchmarking study, Bernard et al. (2024) compared three different DWM implementations, together with the effective turbulence model and LES, against measurement data from an offshore wind farm with 6 MW turbines located in the North Sea. This comparison presented the response of one turbine in the second row of the wind farm for below-rated wind speeds and different inflow directions, resulting in both free inflow and inflow partially affected by the wake of a single upstream turbine. The study showed that the effective turbulence model is generally conservative, while standard DWM implementations tend to underestimate tower-top fatigue damage. Furthermore, it was demonstrated that a modified DWM implementation incorporating wake distortion provided accurate and conservative loading assessments within 8 % of full-scale offshore measurements.
Our recent comparison of DWM-based models extended the benchmarking to an above-rated wind speed case, involving a four-turbine row aligned with the incoming wind and a single ambient turbulence condition (Hanssen-Bauer et al., 2023). That study revealed substantial discrepancies between the model implementations. While time-averaged wake deficits and power outputs were generally consistent across models and in reasonable agreement with LES, fatigue-load predictions diverged significantly further downstream, with differences reaching up to 25 % of reference values. These results underscore how implementation details, such as wake-merging methods and turbulence modelling, can critically affect load predictions, even under otherwise comparable conditions. They also highlight the need for continued evaluation and improvement of engineering-fidelity wake models before they can be fully relied upon in design and certification workflows.
Table 1Inflow conditions at hub height, resulting pre-defined RPM values, and rotor tilt angle for the simulation cases.

In the present study, we extend the earlier above-rated comparison to systematically evaluate three DWM-based wake models under below-rated wind speed conditions while introducing two further variables: ambient turbulence intensity and wind-direction misalignment. Specifically, we analyse three inflow conditions representative of low- to moderately high-turbulence environments and two wind alignment scenarios – one with flow aligned with the turbine row, resulting in a full-wake configuration, and another with a small offset angle introducing a partial-wake condition. A high-fidelity LES-ALM is used as the reference benchmark, following the methodology of our previous study (Hanssen-Bauer et al., 2023). This setup enables an in-depth assessment of wake evolution, power production, and structural load indicators along a row of turbines for each DWM model, across all combinations of wind speed, turbulence, and alignment.
The primary objectives of this study are twofold: (1) to evaluate each DWM model's accuracy relative to LES predictions, identifying deviations in wake behaviour and turbine fatigue response, and (2) to investigate how differences in sub-modelling strategies – such as wake meandering formulations, velocity-deficit profiles, multi-wake superposition methods, and wake-added turbulence treatments – affect model performance. By isolating and analysing these factors, we aim to explain the observed differences and identify the most influential modelling assumptions, thereby informing future development of accurate, robust engineering-fidelity wake models for wind farm applications.
In this study, we compare three different DWM-based wake models with high-fidelity LES-ALM. The original DWM model developed at the Technical University of Denmark (DTU) is referred to as DWMDTU. The second DWM model uses the National Renewable Energy Laboratory (NREL) DWM implementation in FAST.Farm, named DWMNREL in this study. The third model, named DWMIFE, uses the WIFET Farm DWM implementation from the Institute for Energy Technology (IFE). This model is newly developed in the NEXTFARM project (RCN, 2025) and is an extension to the aeroelastic tool 3DFloat (Nygaard et al., 2016). The LES-ALM simulations were performed by Uppsala University and are hereafter called LESUU.
2.1 Test cases
In this study, we consider the same simple farm layout as in Hanssen-Bauer et al. (2023), a row of four NREL 5 MW reference turbines (Jonkman et al., 2009) spaced 7.5 diameters (7.5 D) apart. The NREL 5 MW turbine has a rotor diameter of D = 126 m, a hub height of 90 m, a rated speed of 11.4 m s−1, and a rated aerodynamic power of 5.3 MW. All numerical models, both DWM and LES, use the same incoming wind field, the LES-generated precursor described in Sect. 2.3. In this way, we exclude the effect of different inflow models and can investigate the differences in the wake models and their isolated impact on power and fatigue loads. However, an important exception is the computation of the meandering in the DWMDTU model, which is derived from a Mann turbulence box with a grid size of 1 diameter (Madsen et al., 2008, 2010). As this approach is an integrated part of the model and its calibrated parameters, we found it necessary not to deviate from this setup.
Three wind fields with varying ambient turbulence intensity (TIa) were generated, representing low-, medium-, and high-turbulence-inflow conditions. Table 1 provides details about the flow at hub height for the different cases. While the aim was to have three wind fields with identical below-rated mean wind speed at hub height, in practice the mean wind speeds differ slightly. For the highest-TIa case, the mean wind speed is close to, but still below, the rated wind speed. The inflow data provided to the DWM models were sampled in a separate precursor run of the main LES without turbines, in a plane 1 D upstream of the position of the most upstream turbine (hereafter referred to as Turbine 1). This approach ensures that the inflows seen by the turbines are as similar as possible. For the DWM simulations, the LES-generated wind field was imposed 1 D upstream of Turbine 1, and the simulations were run for 52.5 min. To exclude transient effects at the beginning of the simulations, the first 7.5 min was discarded, resulting in an effective simulation length of tsim = 45 min. This corresponds to for the different cases, where Lx is the longitudinal length of the flow domain, and U∞ is the mean undisturbed ambient wind speed.
In total, four simulation cases were run in this study. Three cases had the mean wind direction aligned with turbine row but with varying inflow turbulence conditions, yielding fully waked configurations. Here, the turbines downstream of Turbine 1 were operating in fully waked conditions. The fourth case was run with medium-ambient-turbulence conditions but with an offset angle of 5° between the mean wind direction and the turbine row, resulting in a scenario where Turbines 2–4 operated under partially waked conditions. In all cases, the rotors were aligned with the mean wind direction (i.e. no intentional yaw misalignment). Due to an error in the setup of the LES-ALM simulation for the first case, the rotor was run with 0° tilt rather than the correct 5° tilt angle of the NREL 5 MW turbine. As the LES-ALM simulations are computationally expensive, it was decided to keep a 0° tilt angle for the first case and adjust the DWM simulations accordingly, while for the remaining cases the tilt angle was set to 5° (see Table 1).
As in Hanssen-Bauer et al. (2023), the turbines were forced to operate at fixed rotor speeds and blade pitch angles in all simulations. These predefined values were set by first running the DWMIFE and DWMNREL models with variable rotor speed and blade pitch using the same inflow, then taking the mean of the time-averaged values from those runs for the final simulations. The resulting rotor speeds are given in Table 1, while the blade pitch angles were 0° for all turbines, as expected for below-rated conditions. As described in Sect. 2.2.4, DWMDTU's approach for multiple-wake situations is to consider the meandered wake deficit from each upstream turbine as if operating in isolation (i.e. experiencing free-stream velocity). The DWMDTU approach thus differs from the other models by running all upstream wake-generating turbines at free-stream velocity, except for the turbine whose loads are being calculated. For example, when computing the loads of Turbine 4, Turbines 1 to 3 are set to the rotor speed given for Turbine 1 in Table 1, while Turbine 4 is set to the RPM specified for that turbine.
To ensure comparability with the LES-ALM, we ran the aeroelastic solvers coupled to the DWM wake models with rigid rotors and excluded all tower effects. Aerodynamic forces, including gravity forces, along the blade span were output from all simulations, and power and loads were calculated from these forces using identical algorithms. This is the same procedure used in Hanssen-Bauer et al. (2023).
To compare fatigue-damage calculations for the different wake models, 45 min damage-equivalent loads (DELs) were calculated. Based on the Palmgren–Miner damage summation rule with Goodman's correction, a DEL is a load that, at a chosen equivalent number of cycles – here (i.e. a load at 1 Hz for 45 min) – produces the same fatigue damage as the summation of damage from the K different load ranges Sk with Nk cycles, determined using rainflow counting (Rychlik, 1987):
where the material-specific Wöhler coefficient m in Eq. (1) is set to m=3 for calculations on the tower and to m=10 for the blade.
2.2 The DWM models
The original DWM model is based on the assumption that the quasi-steady wake deficit, obtained from a thin shear-layer approximation of the Navier–Stokes equations, meanders in a stochastic manner due to the large-scale turbulent structures in the wind and that the self-generated turbulence field in the wake can be superimposed onto the wake deficit and exposed to the same dynamics. In this study, we compare three DWM-based wake models from DTU, NREL, and IFE. An overview of the differences between these three DWM model implementations is given in Hanssen-Bauer et al. (2023). What follows is a summary of the most important differences needed to understand the discrepancies in the results.
2.2.1 Initial wake velocity deficit
DWMDTU and DWMNREL obtain the initial velocity profile behind the turbine from the blade element momentum (BEM) model (Madsen et al., 2008, 2010), but the wake profile is adjusted by including a simple closed-form modification to account for pressure recovery in the near-wake region. DWMIFE, on the other hand, assumes a Gaussian wake-deficit profile at all downstream positions, and the initial wake centre deficit is obtained from CT(U) tables of the thrust coefficient as a function of wind speed for the specific turbine.
2.2.2 Thin shear-layer approximation and eddy viscosity model
All three DWM implementations build on the same assumption of an axisymmetric wake with a thin shear-layer approximation of the Navier–Stokes equations, where the pressure term is neglected. As a turbulence closure, an eddy viscosity model consisting of two terms is applied. The first term models the contribution related to the ambient wind shear and scales with the turbulence intensity, while the second term is related to the wake shear. The model includes filter functions to adjust the model in the near-wake region where the assumption of negligible pressure variations is not valid. The details of the eddy viscosity model, along with its associated filter functions and calibration constants, vary among the DWM implementations (for details, see Madsen et al., 2010; Jonkman et al., 2017; de Vaal and Muskulus, 2021).
2.2.3 Wake transport velocity
The wake deficit is transported downstream by the wind, but since the free-stream velocity is itself disturbed by the deficit, the choice of wake transport velocity is not trivial. DWMDTU applies a transport velocity of U∞, and DWMIFE uses the approximation 0.8 U∞, estimated by Keck et al. (2013). DWMNREL, on the other hand, calculates the local velocity at the position of each wake slice, which varies in both time and space; therefore, the wake accelerates from the near wake to the far wake because the wake deficits are stronger in the near wake and weaken further downwind.
2.2.4 Wake summation
For situations with multiple wakes, where a turbine's incoming flow field is affected by more than one upstream wake, DWMDTU distinguishes between below- and above-rated wind speed conditions (Larsen et al., 2015):
Here, U∞ is the undisturbed free-stream velocity, is the wake velocity induced by turbine i, and Ur is the turbine's rated wind speed. In this study the wind speed is always below rated, so the upper expression is used. This maximum-deficit operator looks at the meandered wake deficit from each upstream turbine operating in isolation (i.e. under free-stream conditions) and assumes that the total incoming wake deficit can be approximated by the maximum single-wake deficit, evaluated at each radial position of the turbine of interest.
DWMNREL superimposes axial velocity deficits using a local root-sum-square method, where the wake of each turbine is calculated using that turbine's local incoming wind velocity. In other words, the wakes are calculated sequentially from upstream to downstream (Jonkman et al., 2017):
Here, U∞ is again the undisturbed free-stream velocity, is the local incoming wind velocity at turbine i, and is the wake velocity induced by turbine i.
Radial velocity-deficit fields are superimposed using a linear summation method in the same sequential manner as the axial component.
DWMIFE uses the momentum-conserving summation method derived by Zong and Porté-Agel (2020a) for wake superposition. This is an iterative method in which the velocity deficits from the upstream turbines are summed with weights based on the ratio of each individual wake's mean convection velocity to the combined wakes' convection velocity Uc(x):
where
and
The integrals in Eqs. (5) and (6) are solved numerically over a cross-section with 64 grid points in each dimension, spaced Δy=Δz = 10 m apart and centred on the wake centre.
2.2.5 Tilt and yaw misalignment
The DWMDTU and DWMIFE implementations used in this study do not account for any flow effects due to tilt or yaw misalignment between the rotor and the flow. However, the latest version of DWMDTU includes a model for flow effects due to yaw misalignment, using Hill's vortex analogy (Larsen et al., 2020). By contrast, DWMNREL accounts for tilt and yaw misalignments, which thereby influence wake deflection (Jonkman et al., 2017). The wake planes in the DWMNREL model are oriented by the rotor centreline rather than the wind direction, causing the wake to deflect based on tilt and yaw misalignment because a wake deficit normal to the tilted/yawed rotor introduces a velocity component that is not parallel to the incoming flow. DWMNREL also has a newly implemented curled-wake model with improved accuracy for large rotor misalignments (Branlard et al., 2023), but this extension is not used in the present study.
2.2.6 Ground effects
DWMNREL does not yet have a model to account for ground effects on the flow field. Both DWMDTU and DWMIFE do include ground effect models, but these were not used for the simulations in this study. In the case of DWMIFE, a mirror-based ground effect model was used in the simulations in Hanssen-Bauer et al. (2023), but it was later found to produce unrealistically high deficits near the ground. DWMIFE showed better agreement when this model was turned off.
2.2.7 Wake-added turbulence and turbulence build-up
Wake-added turbulence is the self-generated small-scale turbulence in a turbine's wake due to wake shear and the breakdown of the wake tip vortices and comes in addition to the conventional atmospheric boundary layer turbulence. Of the three DWM implementations, DWMDTU is the only one including a wake-added turbulence model in the simulations performed for this study. In the early development of the DWM model at DTU, detailed inflow measurements on a full-scale turbine, including angle of attack and relative velocity at a blade section, were used for validation. Comparisons between model simulations and these measurements made it clear that additional turbulence beyond that generated by wake meandering had to be modelled (Madsen et al., 2005). In practice, the wake's self-generated turbulence, particularly important under stable stratification of the atmospheric boundary layer, is modelled based on an isotropic Mann turbulence box with a smaller length scale1 than the ambient turbulence and transformed into an inhomogeneous turbulence field by a scaling factor kmt that varies radially based on the wake-deficit strength and the wake shear-layer velocity gradient:
Here km1=0.6 and km2=0.35 are empirical factors tuned by comparison with inflow and load measurements on a full-scale turbine (Madsen et al., 2008) and with actuator-line simulations (Madsen et al., 2010). Later, an improvement to the original model to account for turbulence build-up inside a wind farm was suggested (Keck et al., 2015), but this is not included in the current DWMDTU model.
The DWMNREL results do not include any wake-added turbulence model in this study. However, an improved wake-added turbulence model has recently been implemented in FAST.Farm (Branlard et al., 2024).
DWMIFE does not include a wake-added turbulence model for load calculations analogous to the one in the original DWM model. However, the increased turbulence intensity in the wake due to the turbulence-generating wake-deficit shear is modelled through the eddy-viscosity formulation in the wake-deficit model, and the total contribution of increased turbulence from all upstream wakes is estimated by a root-sum-square summation (de Vaal and Muskulus, 2021). Thus, the increased effective turbulence intensity experienced by a turbine operating under waked conditions is taken into account and affects the development of its own wake downstream. Note that this summation of turbulence contributions from upstream wakes differs from the momentum-conserving method in Eq. (4) used for summation of the velocity deficits.
2.2.8 Aeroelastic solvers
All DWM models are coupled to an aeroelastic solver for calculating blade forces. DWMDTU is coupled to HAWC2 (Madsen et al., 2020), DWMNREL to OpenFAST (Jonkman et al., 2025), and DWMIFE to 3DFloat (Nygaard et al., 2016). In all these aeroelastic solvers the blade forces are obtained from BEM with Prandtl blade-tip correction (Glauert, 1935), although in different implementations. DWMNREL's OpenFAST additionally includes a blade-root correction.
2.3 Large-eddy simulations
The LES-ALM reference case (LESUU) and the three inflow wind fields used by all numerical models in this study are computed using the EllipSys3D numerical framework (Michelsen, 1994a, b; Sørensen, 1995), the same solver used in our above-rated comparison (Hanssen-Bauer et al., 2023). This solver also participated in the aforementioned benchmarking study against full-scale measurements (Asmuth et al., 2022), although under the name LES-EllipSys3D or LESDTU.
The three inflow wind fields are generated using a bi-periodic precursor simulation of a pressure-driven isothermal boundary layer. The computational domain extends Lz = 1280 m in the vertical direction, Lx=6Lz in the streamwise direction, and Ly=4Lz in the lateral direction. The grid is uniform in all coordinate directions, with Δx = 20 m and Δy=Δz = 10 m. A symmetry boundary condition is imposed at the domain top. At the surface, shear stress is prescribed using Monin–Obukhov similarity theory (Monin and Obukhov, 1954) and the local instantaneous velocity sampled at the first grid point above the boundary. Inflow data for the main LES-ALM simulation, which are also used by the DWM models, are extracted after a spin-up time of 30 000 s.
The domain of the LESUU simulation (including wind turbines) has the same dimensions as the precursor. The inlet is located 6D upstream of Turbine 1. In the turbine and wake region, the grid is uniform with a resolution of = 3.9375 m, starting 3 D upstream of Turbine 1 and extending 33 D in the streamwise direction and 4 D in both the lateral and the vertical directions. Outside this inner region, the grid is smoothly stretched towards the boundaries. The turbine rotors are represented using ALMs (Sørensen and Shen, 2002), with each blade discretized into 32 elements. The ALM body forces are projected onto the grid with a three-dimensional Gaussian smearing function of width ϵ=2Δx. To mitigate spurious induction effects arising from the finite core size of root and tip vortices, the smearing correction proposed by Meyer Forsting et al. (2019) is applied. Following a spin-up of 30 min, the main simulation is run for 45 min.
2.4 Wake tracking
From the flow field generated by LESUU, wake centre positions were tracked using NREL's Python toolbox SAMWICh. The wake centres were identified for each time step in a plane 5 D downstream of each turbine (normal to the wind direction) using the two-dimensional Gaussian fit method (Trujillo et al., 2011) as implemented in SAMWICh. To minimize algorithm error, the search area was limited to ± 1.25 D laterally from the turbine location and between −0.5 D and D vertically relative to hub height. After obtaining the wake centre time series for each turbine and downstream location, four post-processing steps were applied to reduce error in the wake centre estimates. These post-processing steps were determined based on a separate analysis of DWMNREL simulation results, where SAMWICh wake centre detections were compared to actual wake centre values output directly from DWMNREL:
-
Edge detection removal. Wake centres detected at the edge of the search area were discarded and filled in by linear interpolation.
-
Spike Removal 1. A median filter with a kernel size of 15 s was applied to remove spurious spikes in the wake centre time series.
-
Jump removal. To remove remaining jumps in the wake centre time series, a moving average was applied to segments starting 20 s before the first and 20 s after the last consecutive points, exceeding a maximum allowable gradient of 0.2 D s−1.
-
Spike Removal 2. A final median filter (identical to step 2) ensured that any spikes introduced by step 3, primarily due to the arbitrary selected segment length, were reduced in the post-processed wake centre time series.
Despite the improvements after post-processing the raw wake centres, the SAMWICh-derived centres did still at times differ from the centres computed by DWMNREL. This discrepancy could occur because SAMWICh tracks the aggregate deficit made up of more than one wake deeper in the farm. The difference between the standard deviation of the wake centre time series tracked by SAMWICh and that obtained directly from DWMNREL remained below 0.06 D (i.e. 6 % of the rotor diameter) for all inflow cases and for both lateral and vertical wake centre coordinates.
3.1 Fully waked cases with varying ambient turbulence
In this section, we present a detailed comparison of the three DWM-based models under fully waked conditions for a row of four turbines exposed to aligned inflow. Three cases corresponding to low-, medium-, and high-ambient-turbulence conditions are considered while maintaining below-rated wind speeds. We assess time-averaged flow fields, wake centre positions, power production, thrust forces, blade loads, and fatigue to identify key differences between the models and examine the influence of sub-modelling strategies.
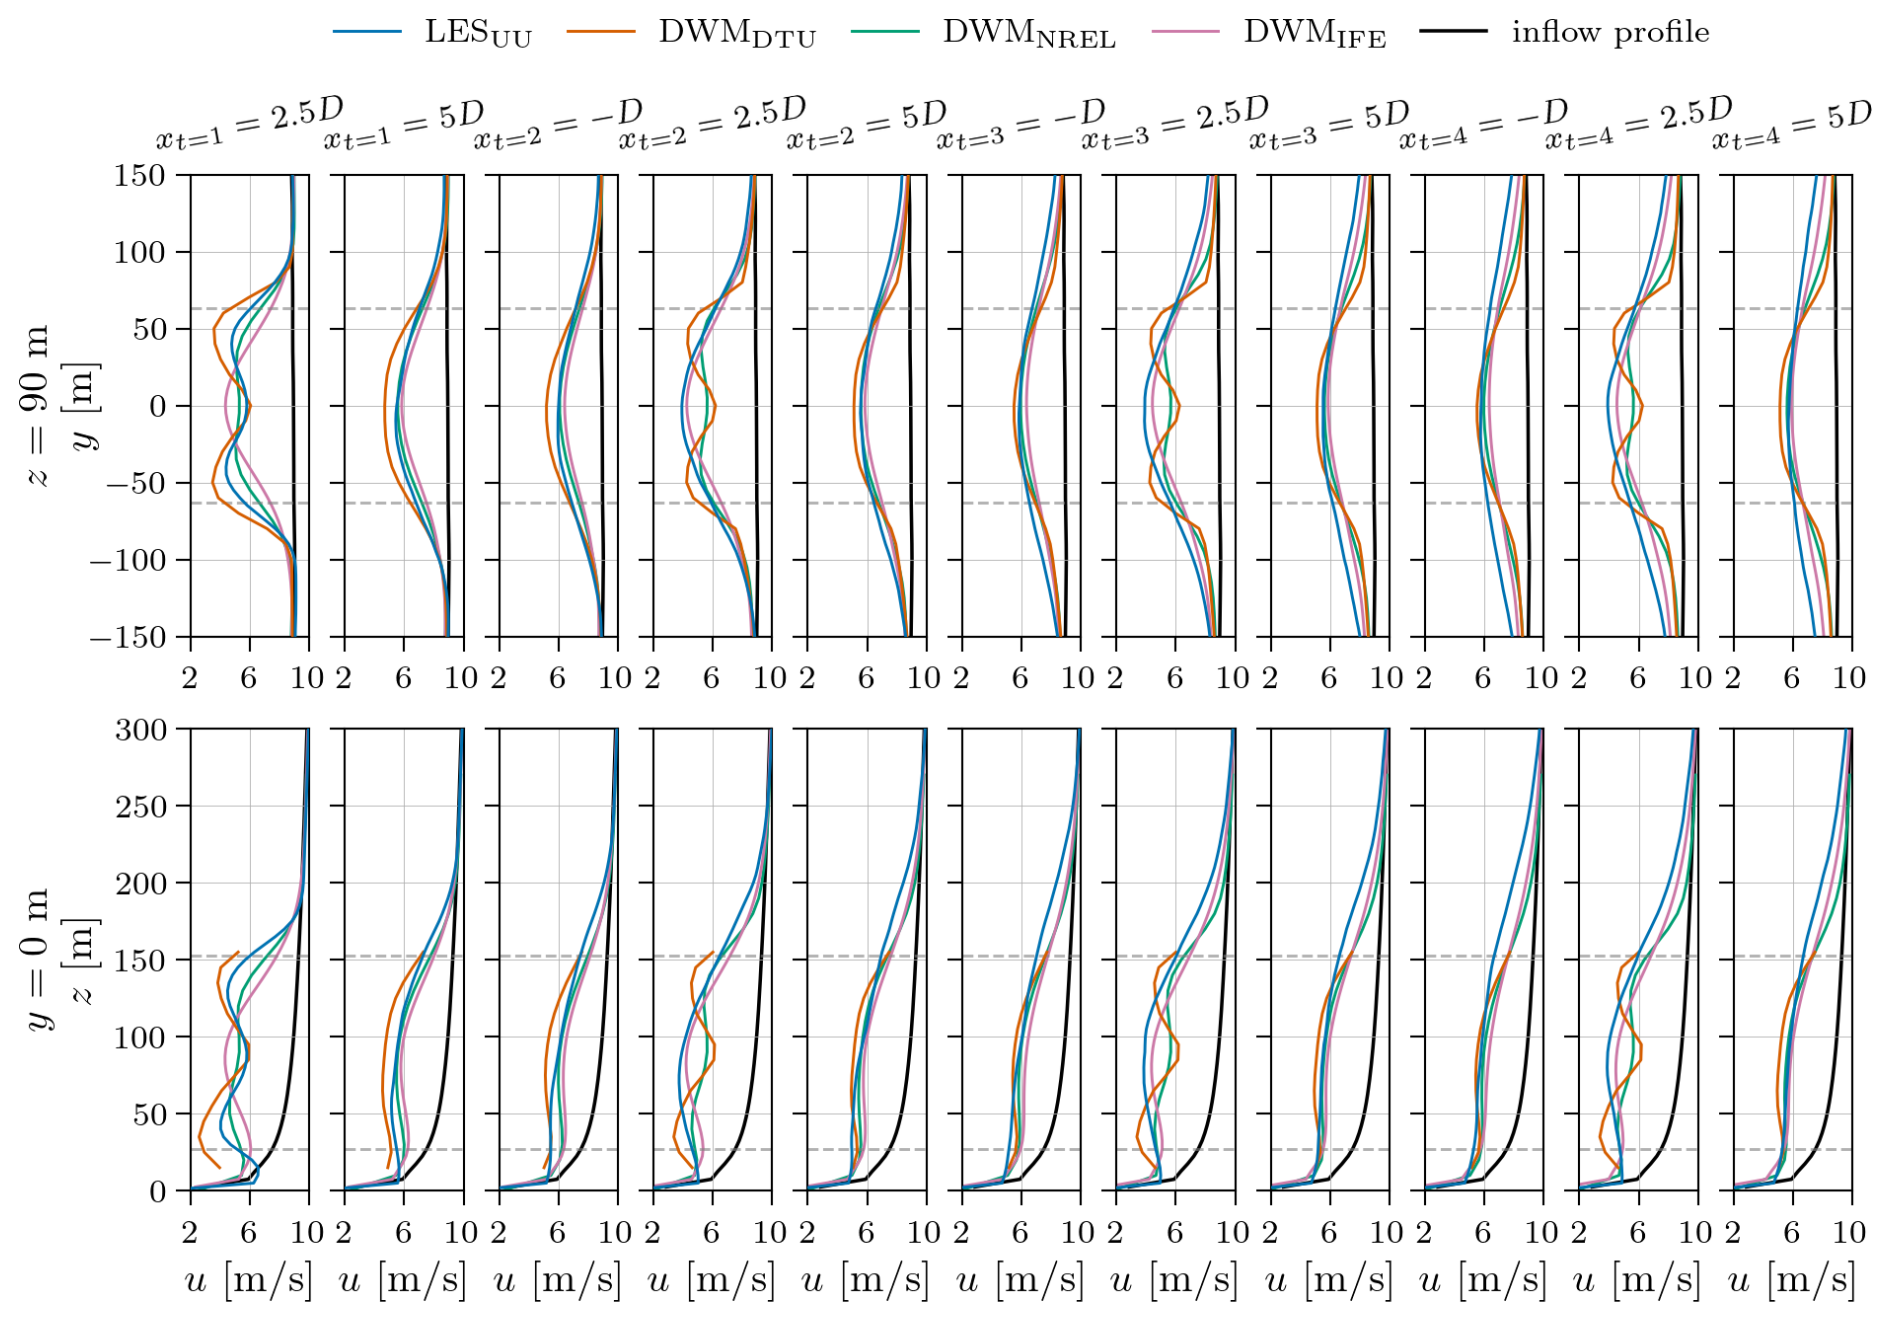
Figure 1Time-averaged velocity profiles for the aligned-incoming-wind case with low ambient turbulence (TIa = 4.6 %). Horizontal dashed lines indicate the rotor-swept area.
3.1.1 Mean velocity profiles
Figure 1 shows time-averaged velocity profiles at −1 D, 2.5 D, and 5 D relative to the four turbines' streamwise positions for the low-ambient-turbulence case (TIa = 4.6 %). The upper row shows horizontal profiles at hub height, and the lower row shows vertical profiles at the turbines' lateral centre. Horizontal dashed lines indicate the range of the turbine's rotor-swept area. In the near wake of Turbine 1 at xt=1 = 2.5 D, all models except DWMIFE show velocity profiles with two minima reflecting the rotor thrust distribution. For DWMDTU, this characteristic near-wake profile is more pronounced than the LES profile, with lower velocities at the minima and higher velocities near hub height, whereas the opposite is true for DWMNREL. Both DWMDTU and DWMNREL predict the initial velocity profile downstream of the turbine using the BEM model. DWMIFE, by contrast, assumes a Gaussian wake-deficit profile for all x downstream of the turbine. For LESUU, DWMDTU, and DWMNREL, the velocity-deficit profiles have nearly reached a Gaussian-like shape by xt=1 = 5 D. While all models show similar shapes for the horizontal profiles at xt=1 = 5 D and , the vertical profile of LESUU differs slightly in shape from the others, with relatively larger deficits at the lower part of the rotor-swept area compared to the upper part. For Turbines 2–4, both DWMNREL and DWMDTU estimate the transition from BEM to Gaussian shape later than LESUU, which already shows a Gaussian profile at x=2.5 D. While the DWM models show symmetric horizontal velocity deficits for the developed profiles, the LESUU deficit has its maximum at y<0. This small asymmetry in LESUU, which becomes more pronounced for higher-ambient-turbulence cases, is discussed in Sect. 3.1.2 when wake centre positions are presented. At the wake centre, DWMIFE generally tends to underpredict the deficit slightly compared to LESUU. DWMNREL shows good agreement with LESUU at the wake centre at x = 5 D and , while DWMDTU tends to slightly overpredict the centreline deficit at these positions.
DWMDTU and DWMNREL show only minor differences in the flow downstream of Turbines 2–4 compared to Turbine 1. By contrast, the wakes of DWMIFE and LESUU show significant development as the deficit outside the rotor-swept area increases along the row of turbines. Hence, DWMIFE and LESUU show lower velocity gradients in the wake shear layer between the deficit and the ambient flow for all waked turbines, especially for Turbine 4, compared to DWMDTU and DWMNREL. The momentum-conserving wake summation method in DWMIFE (Eq. 4) seems to capture the impact of far-upstream wakes, which have expanded over a long distance, but still produces weaker deficits towards the sides and above the rotor compared to LESUU. By contrast, the wake-deficit profiles predicted by DWMDTU and DWMNREL show less lateral and vertical spreading. The maximum-deficit operator in the DWMDTU model derives the incoming deficit at each radial position as the smallest deficit found among all upstream turbines' meandered deficits (see Eq. 2 and Larsen et al., 2013). This causes DWMDTU to predict only small variations in the incoming velocity field for Turbines 2–4, resulting in similar wake profiles along the row. The fact that DWMNREL predicts only minor variations in the wake flow for Turbines 2–4 is more surprising given the sequential multi-wake handling in this model (see Eq. 3). However, the closer agreement of DWMIFE with LESUU in predicting wake development along the turbine row may also stem from DWMIFE being the only DWM implementation that incorporates a turbulence build-up model. This model accounts for the elevated incoming turbulence levels experienced by Turbines 2–4 due to added turbulence in upstream wakes, leading to faster wake recovery through enhanced mixing and momentum entrainment from the ambient flow.
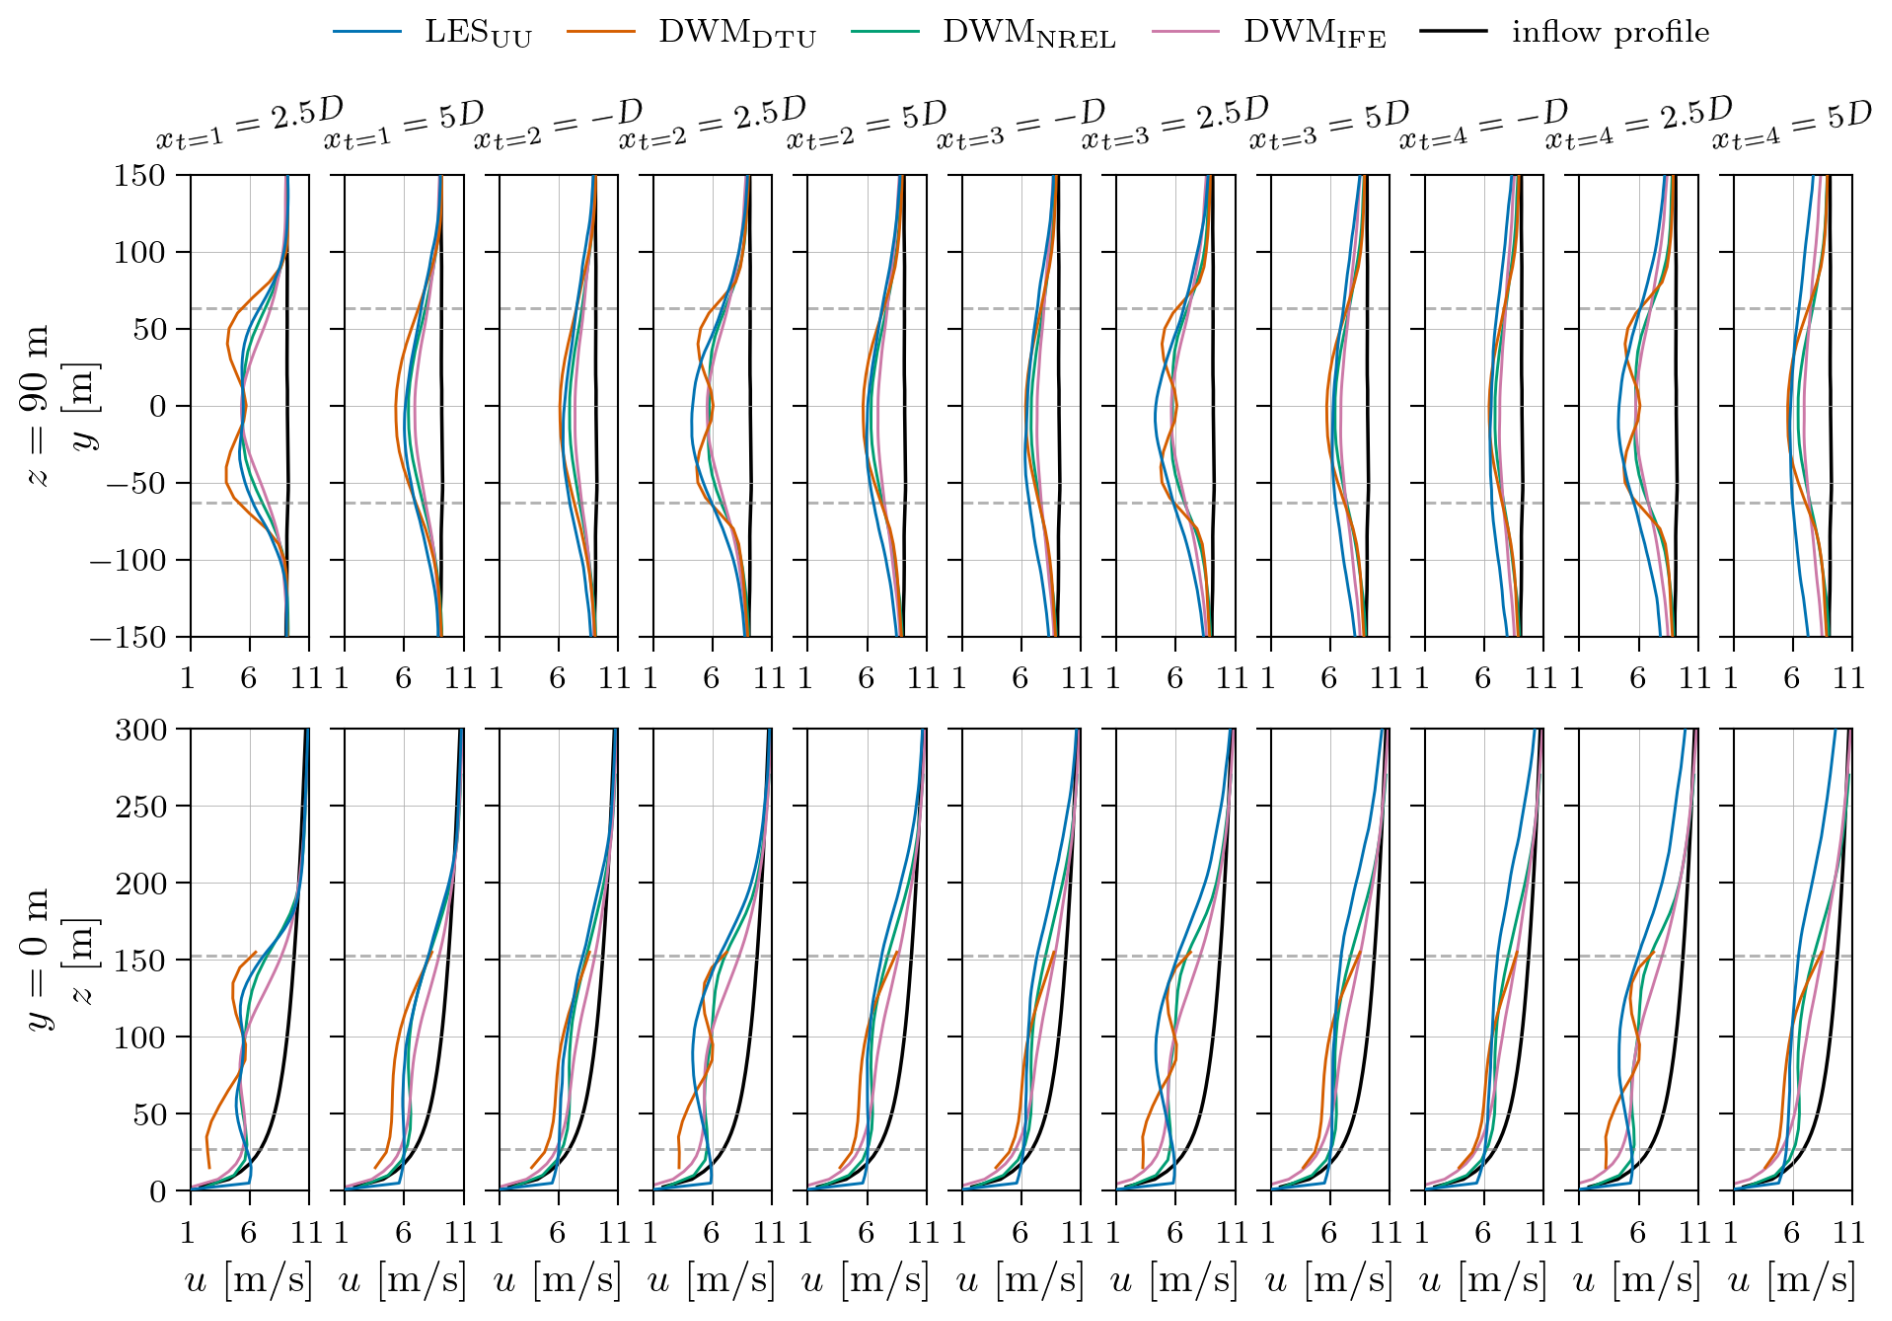
Figure 2Time-averaged velocity profiles for the aligned-incoming-wind case with medium ambient turbulence (TIa = 8.8 %). Horizontal dashed lines indicate the rotor-swept area.
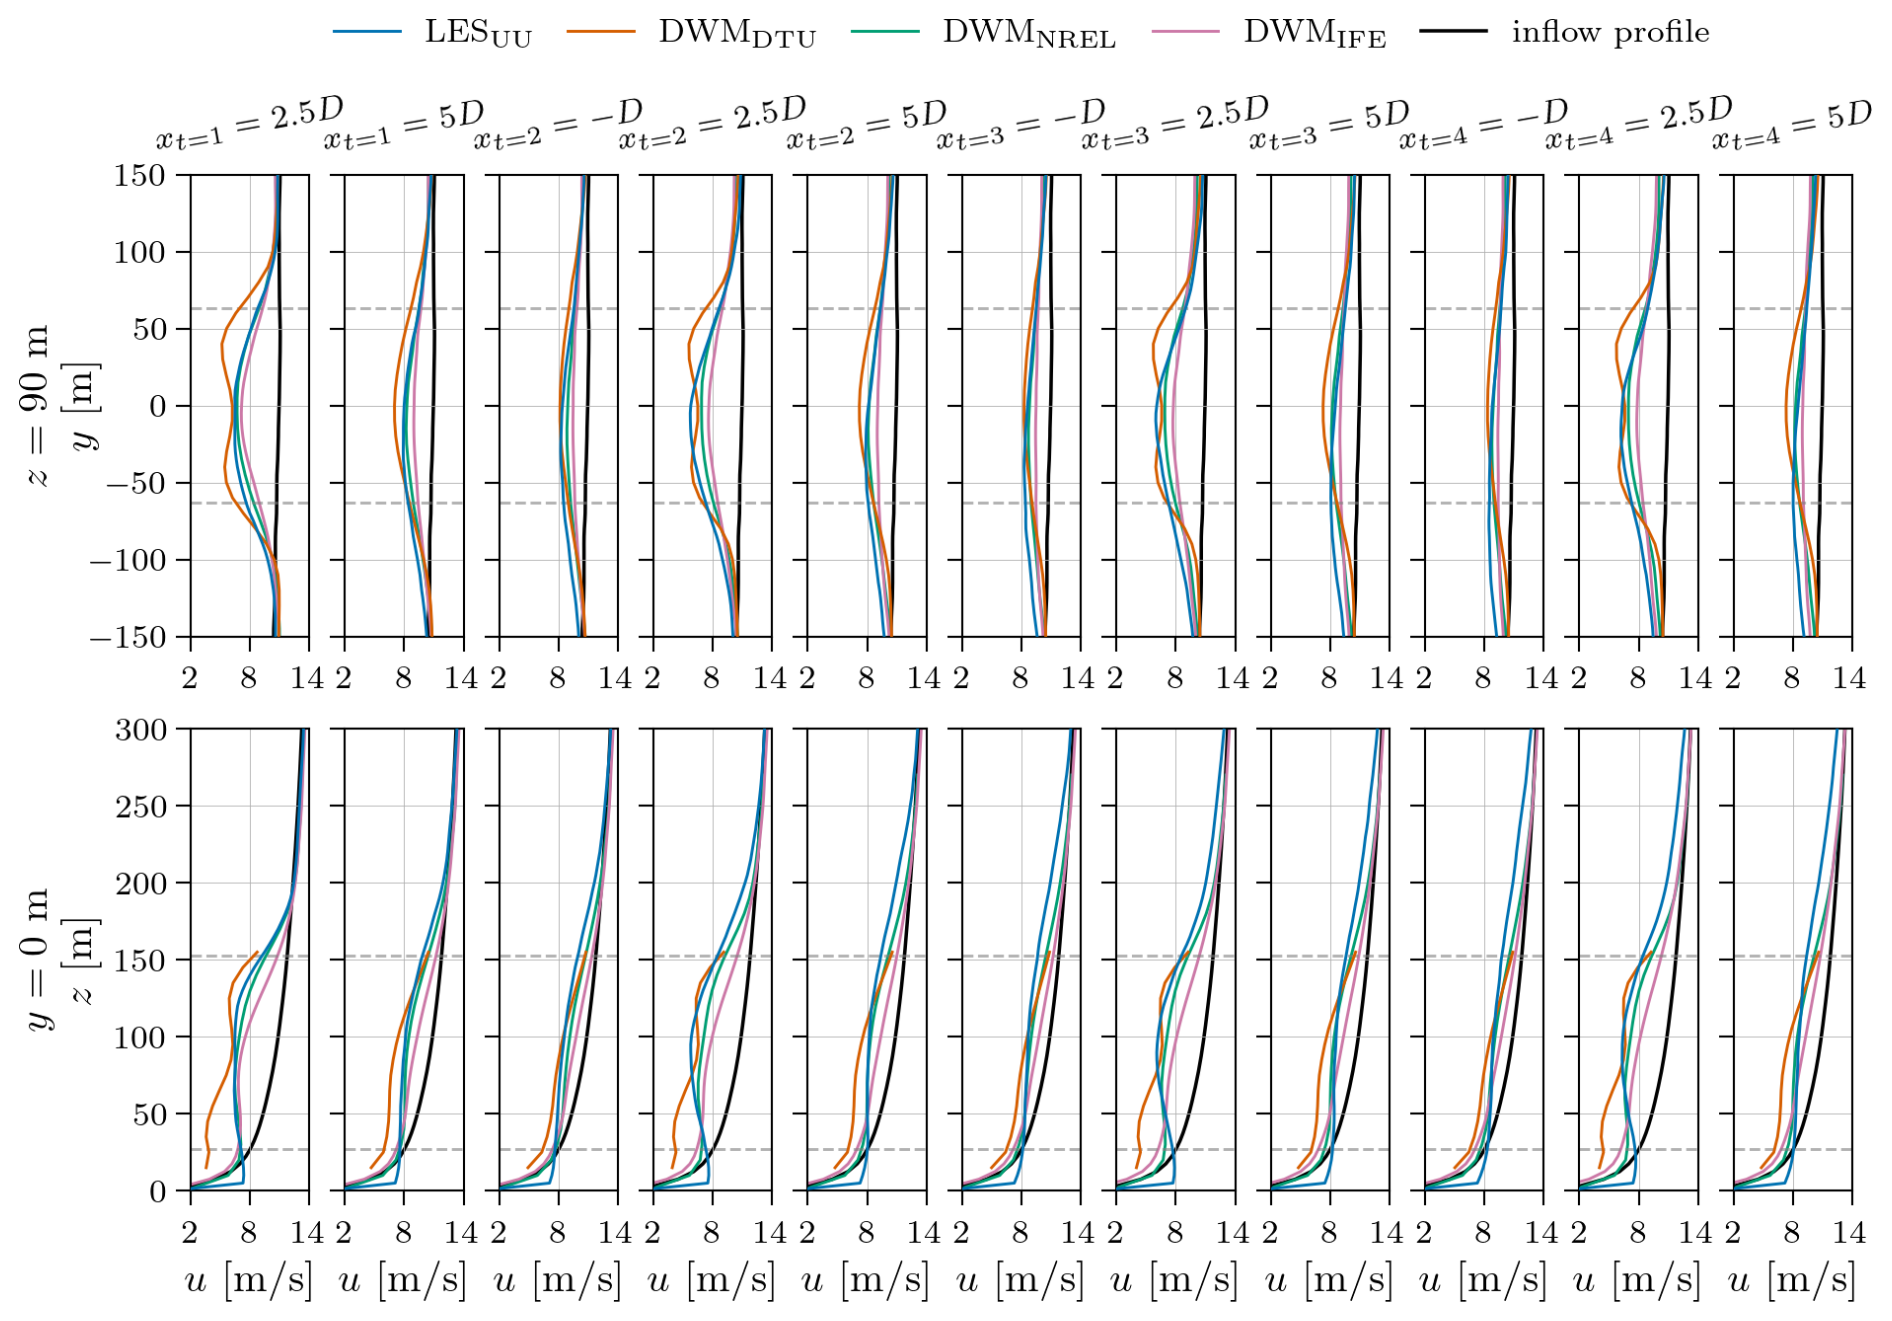
Figure 3Time-averaged velocity profiles for the aligned-incoming-wind case with high ambient turbulence (TIa = 12 %). Horizontal dashed lines indicate the rotor-swept area.
Figures 2 and 3 show time-averaged velocity profiles for the medium- (TIa = 8.8 %) and high-ambient-turbulence (TIa = 12 %) cases, respectively. The wake development behind each turbine is similar to the low-turbulence case, but higher turbulence levels and thus stronger meandering lead to faster wake recovery and a quicker transition toward Gaussian profiles. As in the low-turbulence case, DWMDTU shows a more distinct near-wake profile than the other models at x=2.5 D for all turbines and for both TIa = 8.8 % and TIa = 12 %. Under medium ambient turbulence, only traces of the characteristic near-wake profile are visible in the wakes of DWMNREL and LESUU (evident at x = 2.5 D downstream of all turbines for DWMNREL and only at xt=1 = 2.5 D downstream of Turbine 1 for LESUU). For the high-ambient-turbulence case, the wakes predicted by both DWMNREL and LESUU have developed to Gaussian profiles by x = 2.5 D behind all turbines. It should be noted, however, that for power and load predictions, the near wake at x = 2.5 D has minor importance.
More relevant are the profiles at x = 5 D downstream and just upstream of the next turbine in the row. Here, DWMIFE, and to a lesser degree DWMNREL, tends to underpredict the centreline deficit, while DWMDTU slightly overpredicts the deficit compared to LESUU. As in the TIa = 4.6 % case, DWMIFE is the only DWM model that captures the increase in deficit outside the rotor span in the horizontal profiles along the turbine row, although not to the same extent as LESUU. For the vertical profiles, however, DWMIFE does not show such an increase along the row. Again, DWMDTU and DWMNREL show only minor development in the flow along the turbine row when comparing the wakes of Turbine 1 and Turbine 2 and especially when comparing the wakes of Turbines 2–4.
LESUU shows some notable differences in the flow field as the ambient turbulence level increases: as mentioned, the asymmetry about y=0 becomes more pronounced for higher ambient turbulence, and a strong acceleration of the flow appears near the surface behind all turbines. In addition, the wake moves slightly upward, noticeable behind Turbine 2 and further downstream. This upward deflection is likely due to the non-zero turbine tilt angle for the TIa = 8.8 % and TIa = 12 % cases, which causes the wakes to deflect upwards. DWMNREL is the only DWM model that accounts for rotor tilt when calculating the flow. Even though an upward wake deflection is not evident for DWMNREL in the velocity profiles, it becomes visible in the wake centre position plots in Sect. 3.1.2.
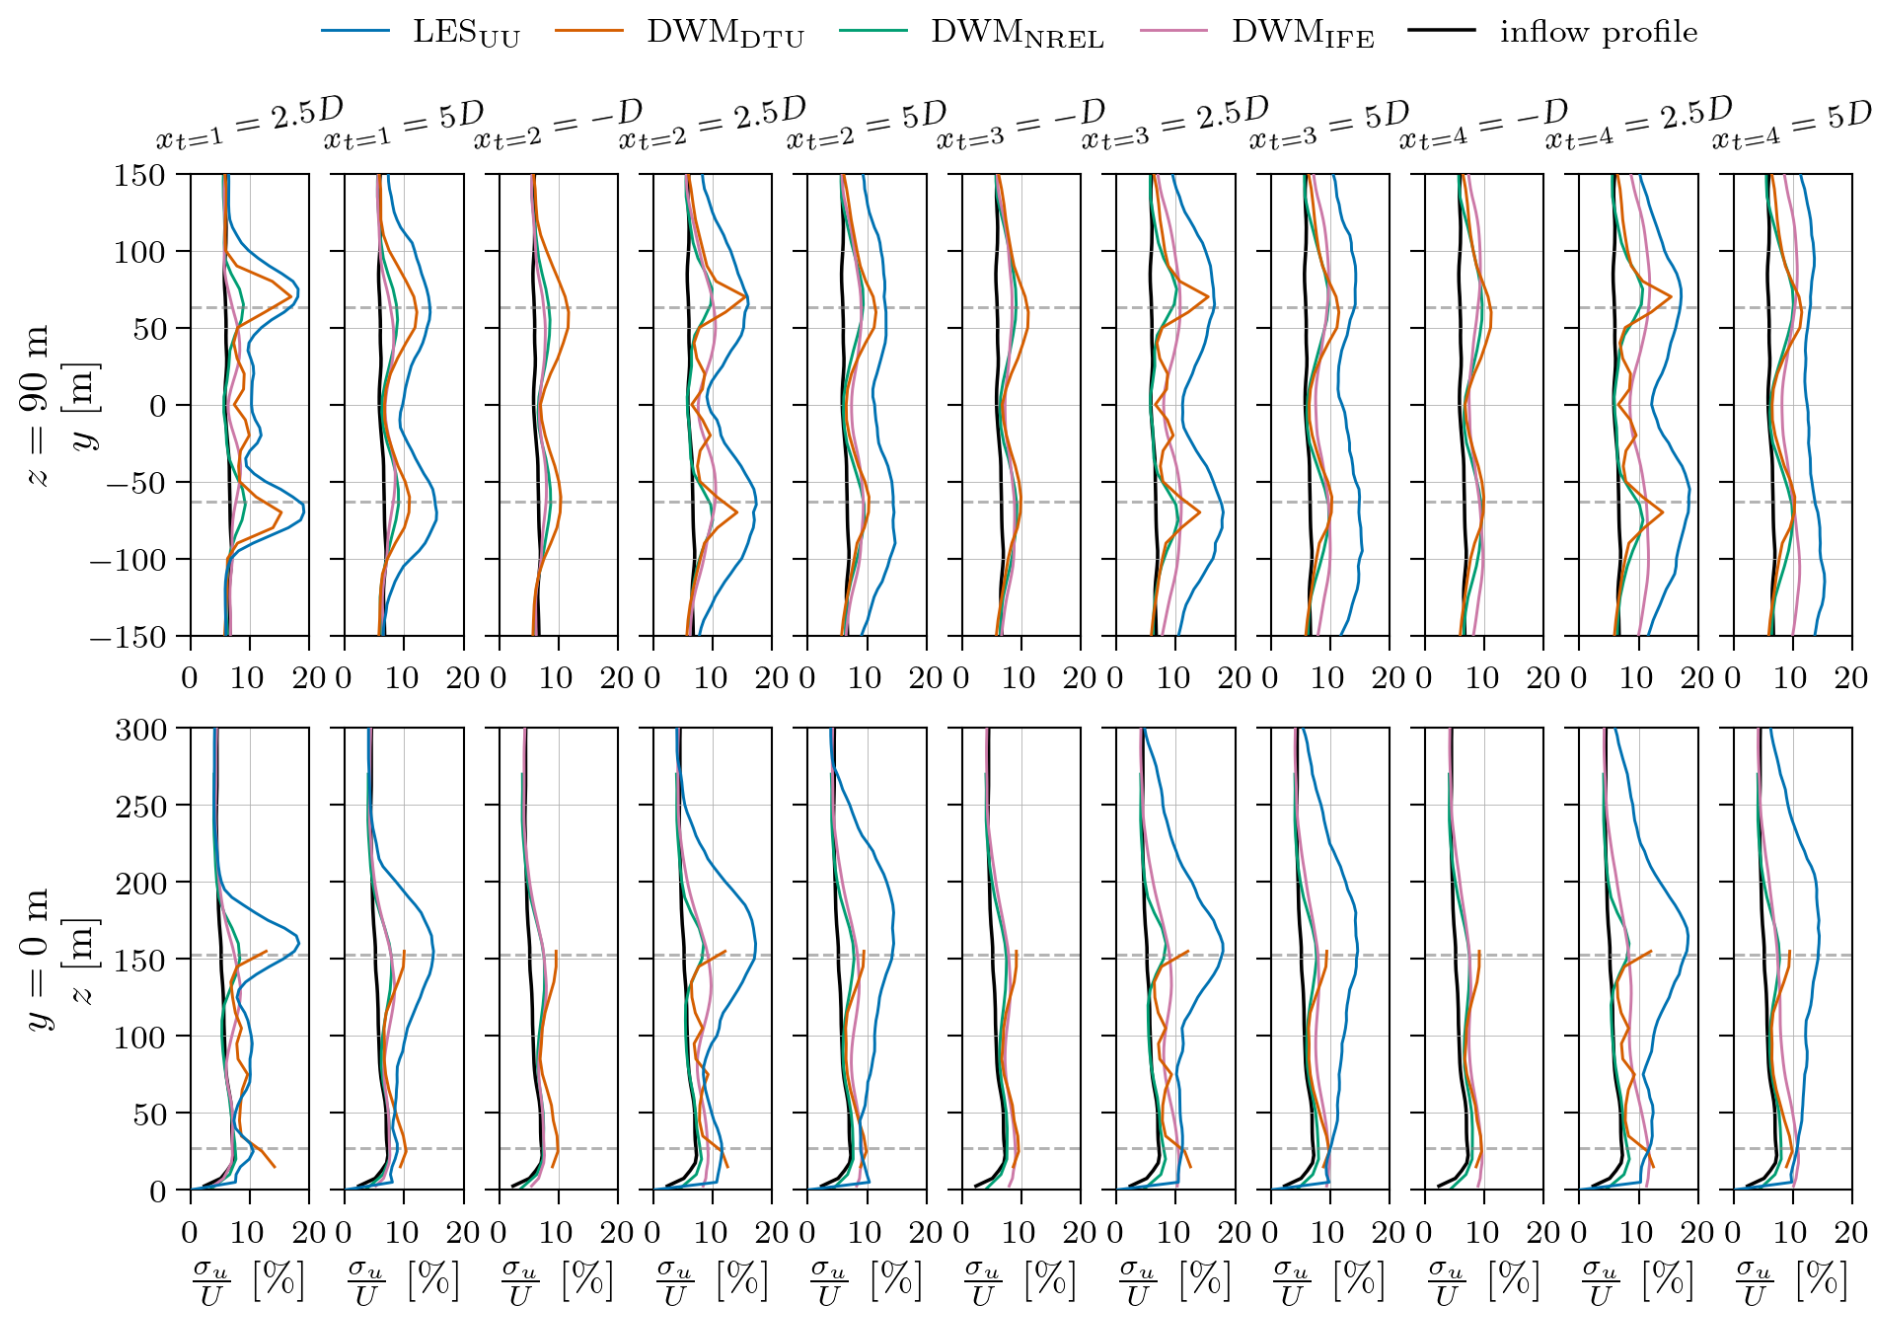
Figure 4Profiles of velocity standard deviation for the aligned-incoming-wind case with low ambient turbulence (TIa = 4.6 %). Horizontal dashed lines indicate the rotor-swept area. LESUU data are not available at due to a lack of time-resolved data at this axial position.
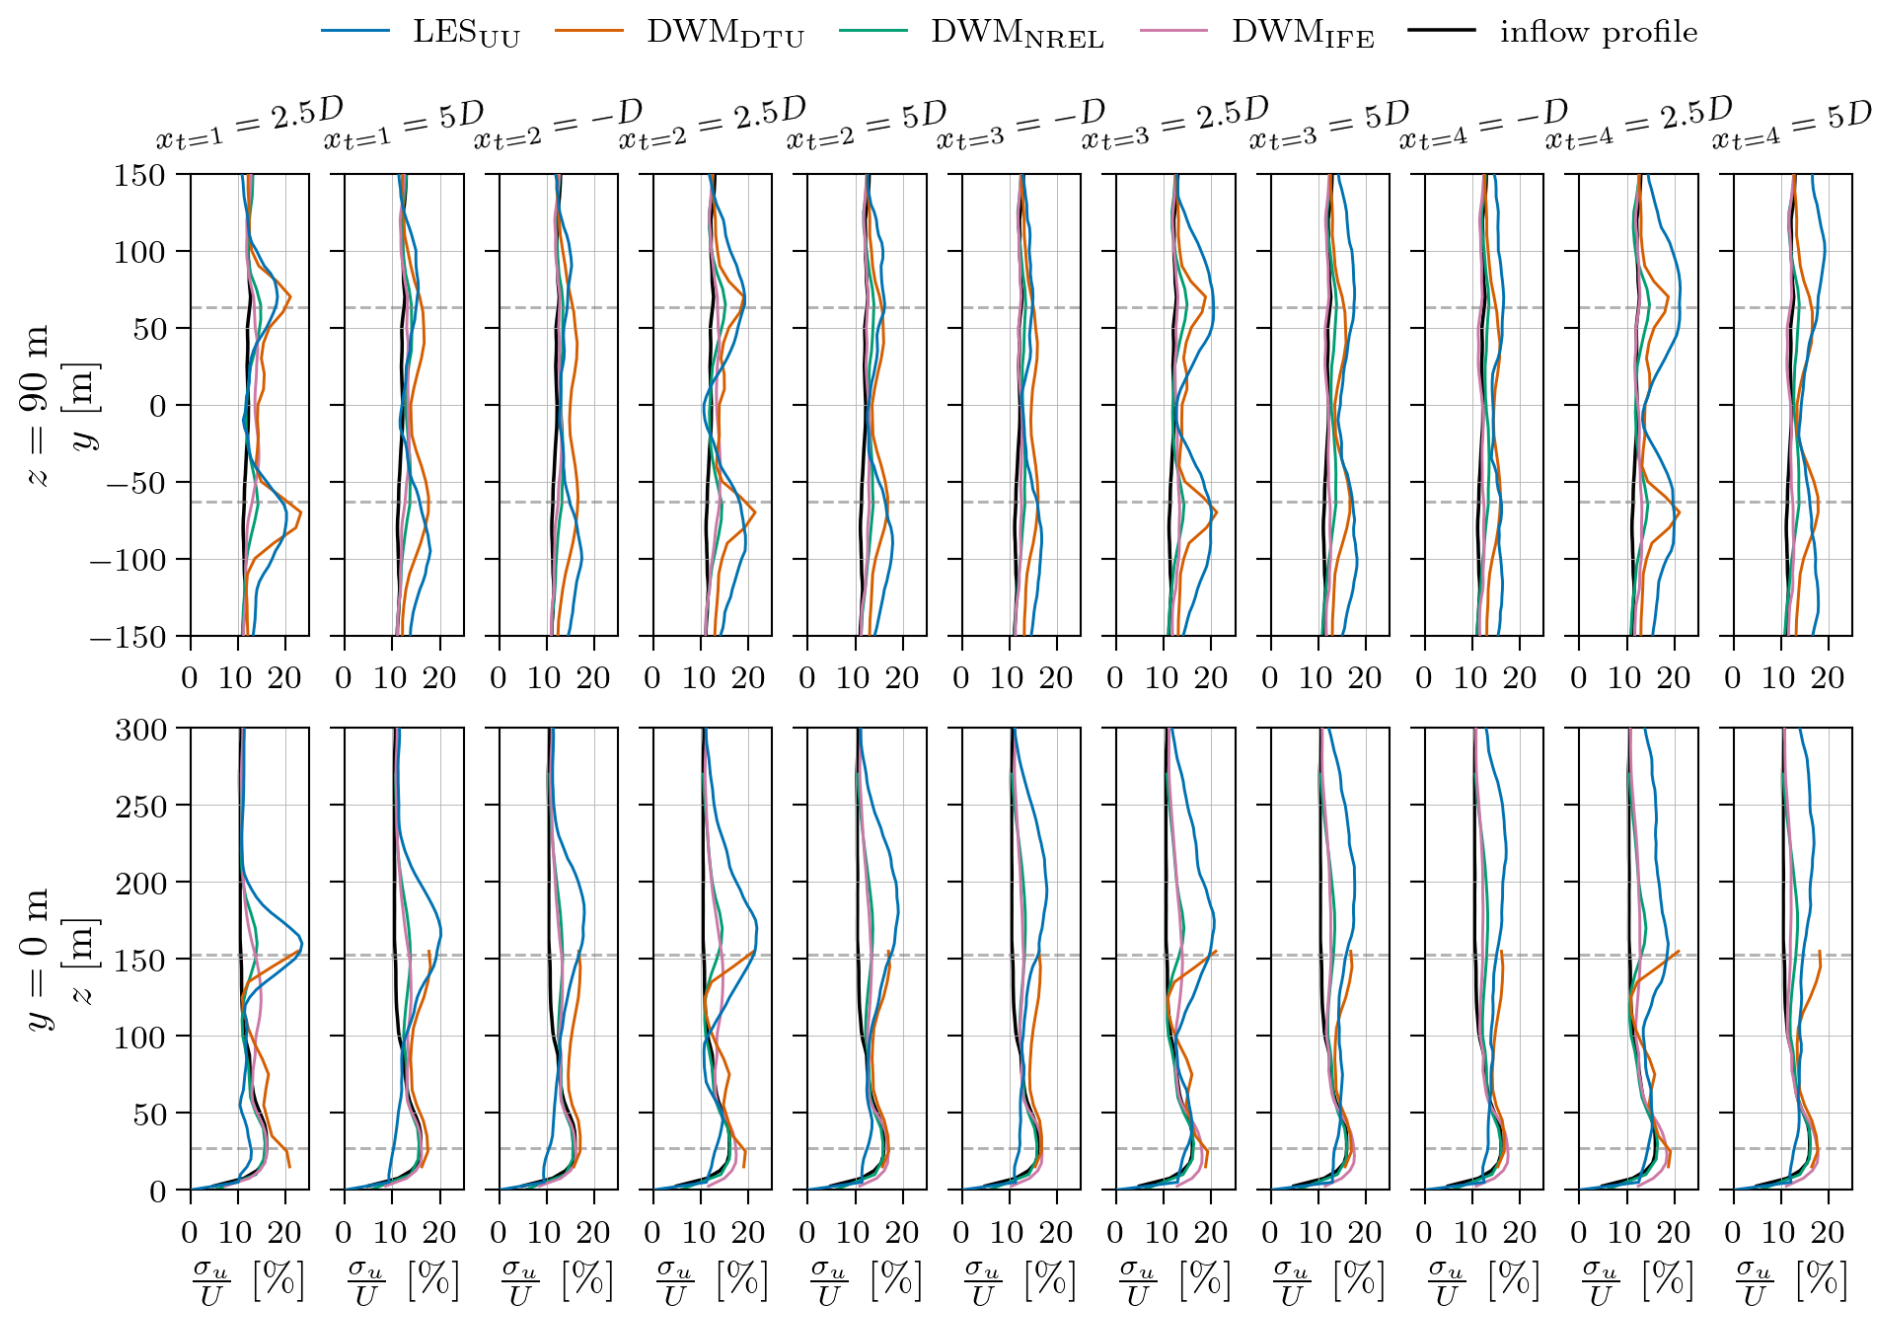
Figure 5Profiles of velocity standard deviation for the aligned-incoming-wind case with medium ambient turbulence (TIa = 8.8 %). Horizontal dashed lines indicate the rotor-swept area.
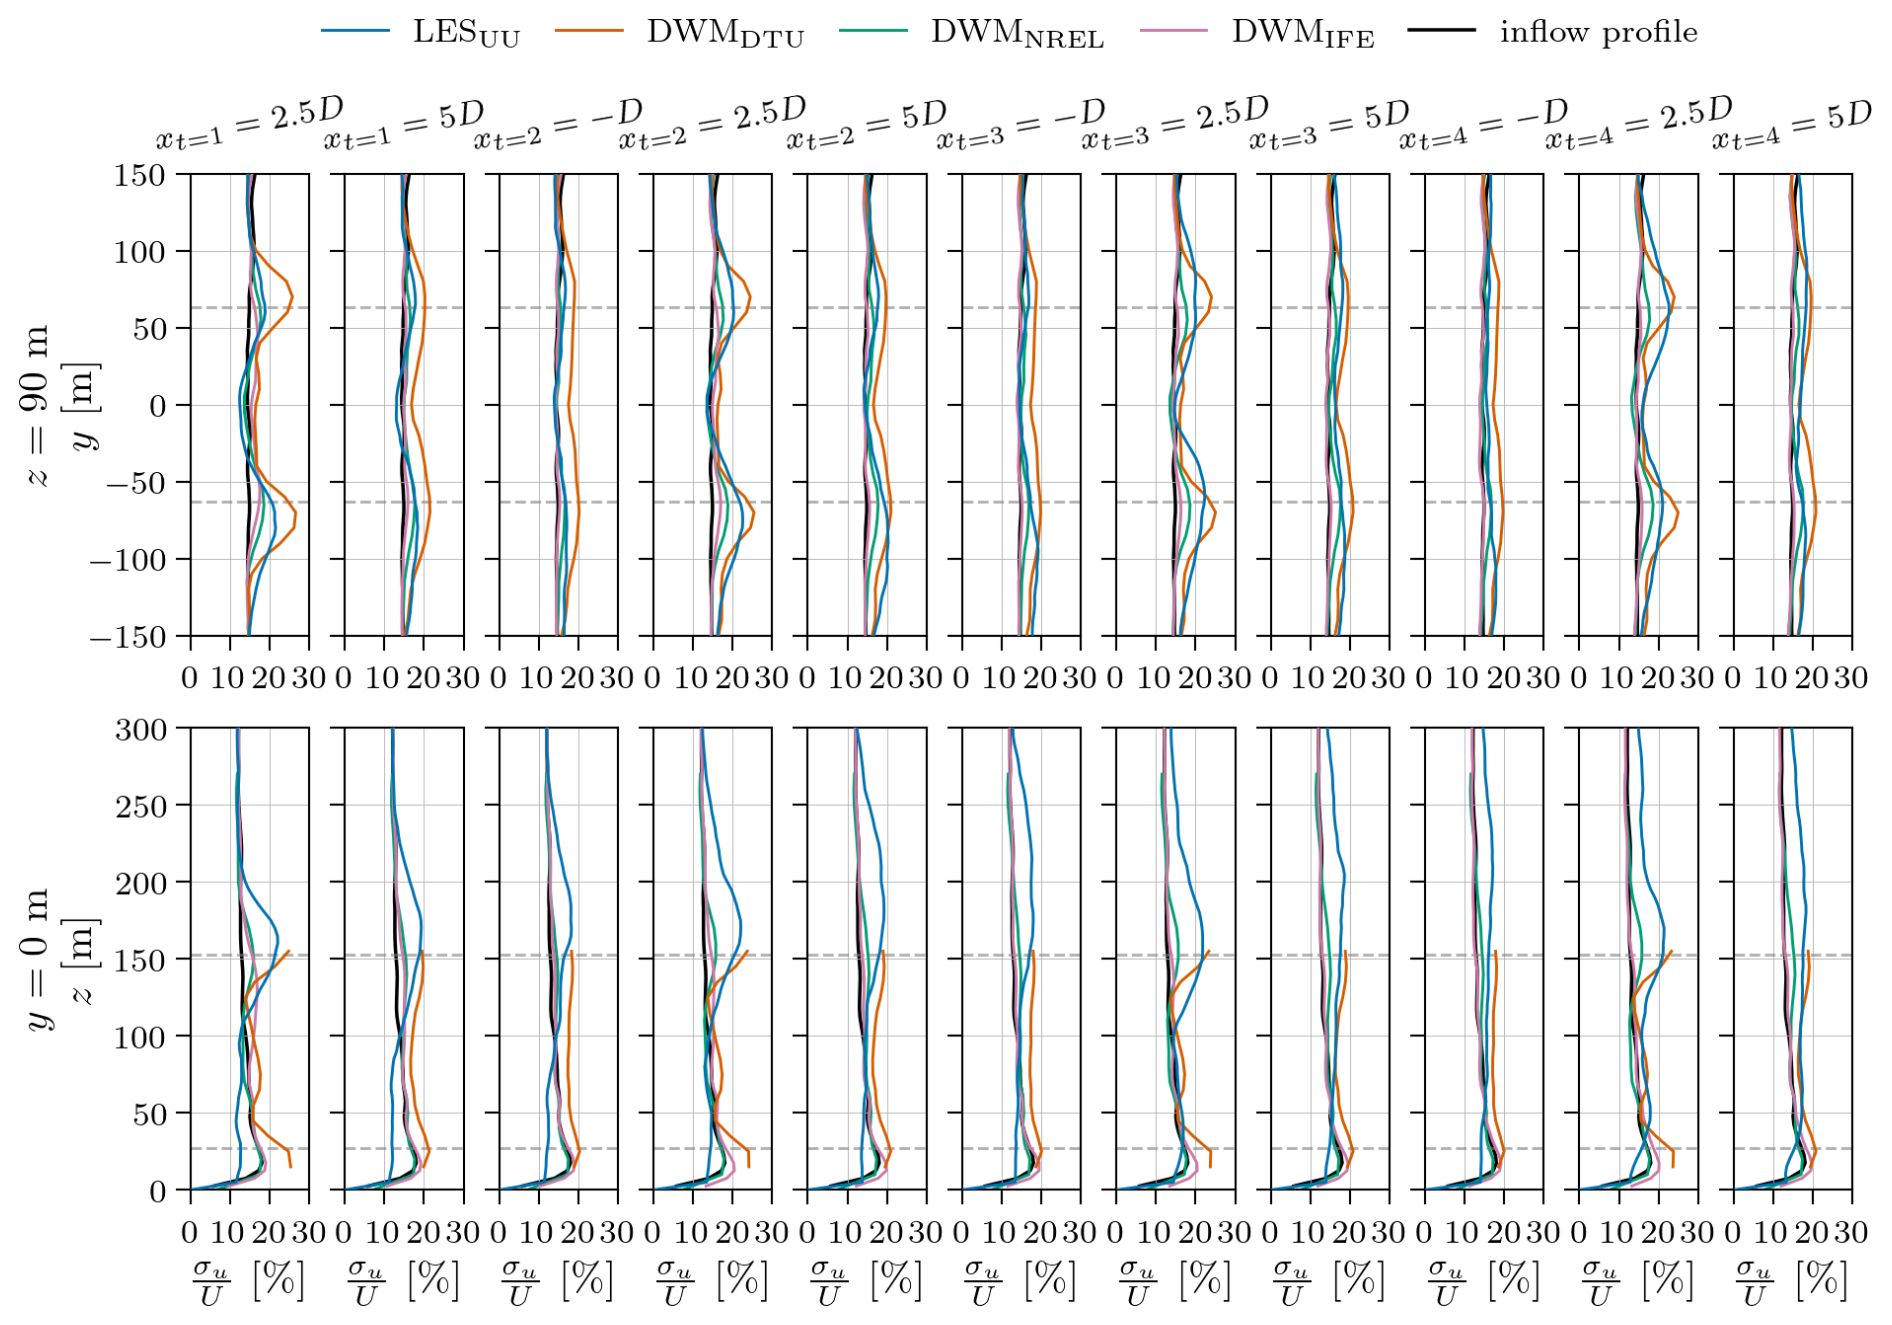
Figure 6Profiles of velocity standard deviation for the aligned-incoming-wind case with high ambient turbulence (TIa = 12 %). Horizontal dashed lines indicate the rotor-swept area.
Figures 4–6 show profiles of the axial velocity standard deviation, σu, for the three ambient turbulence levels. In general, LESUU exhibits much higher σu levels than DWMNREL and DWMIFE. DWMDTU, however, the only DWM implementation in this study that includes a wake-added turbulence model, shows comparable levels to LESUU at TIa = 8.8 % and even higher at TIa = 12 %. For all ambient turbulence levels, the shapes of DWMDTU's σu profiles downstream of Turbine 1 are in fairly good agreement with LESUU, except near the surface. This deviation from LESUU could stem directly from the wake-added turbulence formulation but also from differences in predicted wake shape, since the wake shape affects the wake-added turbulence via the velocity gradient. The instantaneous wake shape also impacts σu in all models through wake meandering, since areas with higher velocity gradients in the wake experience larger temporal velocity fluctuations as the wake meanders. Deeper into the farm, it becomes clear that the absence of a turbulence build-up model in DWMDTU, as addressed in Keck et al. (2015) and Branlard et al. (2024), amplifies the differences along the turbine row. Even though the DWMIFE implementation does not include a wake-added turbulence model, it includes a model for turbulence build-up. This is evident in the low-ambient-turbulence case shown in Fig. 4, where σu levels in DWMIFE increase along the row and approach those of LESUU in the wake of Turbine 4. This increase is not observed in Figs. 5 and 6, possibly because the ambient turbulence is already high in those cases, making the relative wake turbulence build-up smaller.
3.1.2 Wake centre positions
Figures 7 and 8 show distributions of horizontal and vertical wake centre positions relative to the hub positions, at axial positions 5 D downstream of each turbine in the row, under low- and high-ambient-turbulence conditions (the medium-ambient-turbulence case is shown in Fig. A3 in Appendix A). The distributions are shown as box-and-whisker plots, where the box spans the first and third quartiles, and the orange line within the box denotes the median wake centre position. Whiskers extend to the most extreme non-outlier data point, and outliers, shown as circles, are defined as points outside the box beyond 1.5 times the box size (1.5(Q3−Q1)). For models labelled with a subscript “S”, the wake centres were tracked using NREL's SAMWICh toolbox, described in Sect. 2.4. For the other models, wake centres come directly from each DWM model's own meandering algorithm. For DWMNREL, we show both the wake centres from SAMWICh and those directly from DWM to illustrate differences between these two approaches.
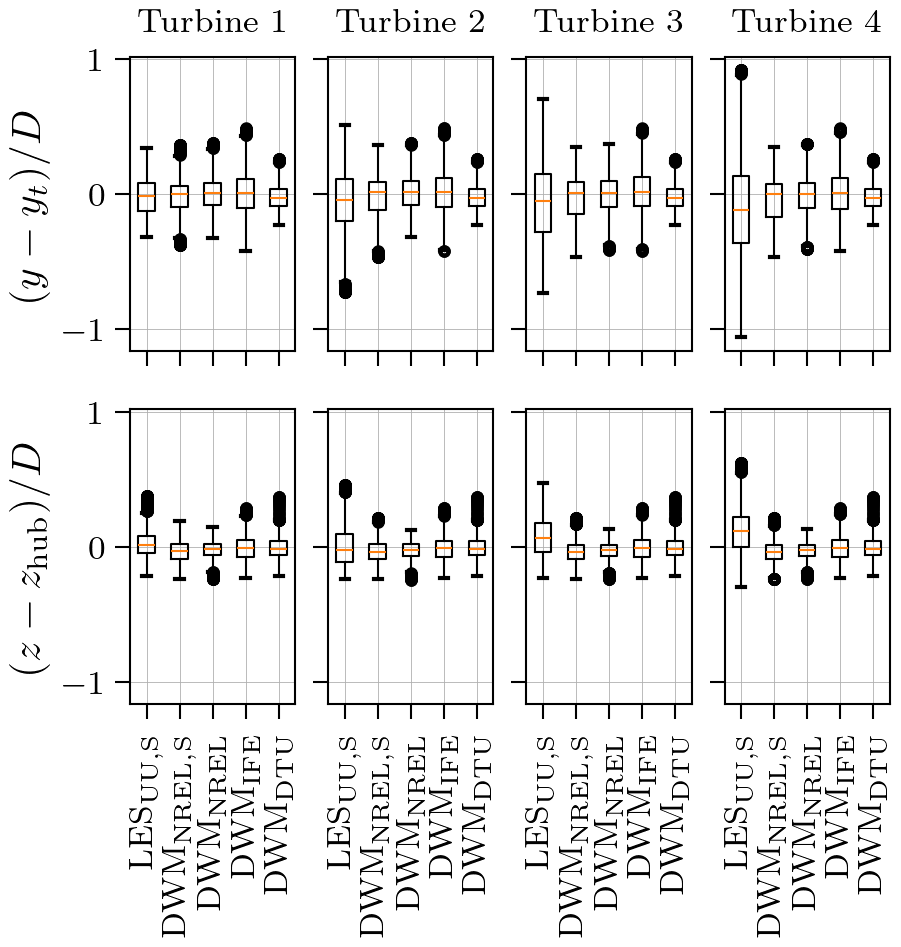
Figure 7Box plots of horizontal (upper row) and vertical (lower row) wake centre positions at x = 5 D behind the turbines for the aligned-incoming-wind case with low ambient turbulence (TIa = 4.6 %).
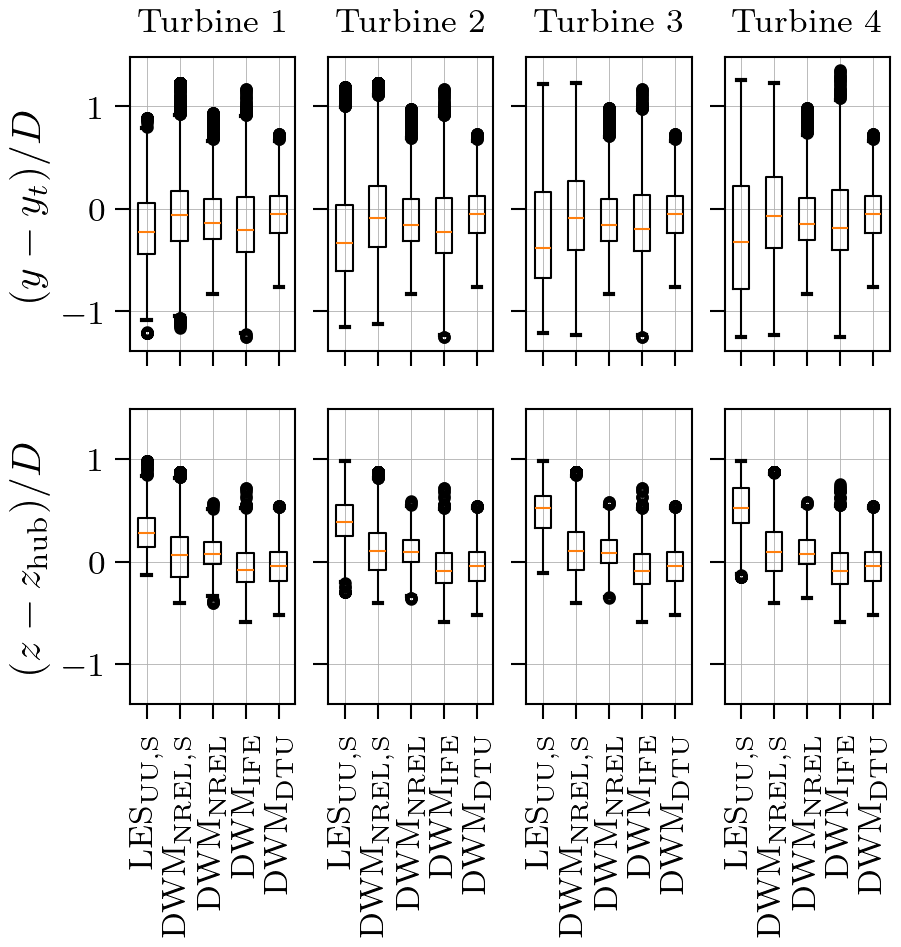
Figure 8Box plots of horizontal (upper row) and vertical (lower row) wake centre positions at x = 5 D behind the turbines for the aligned-incoming-wind case with high ambient turbulence (TIa = 12 %).
At TIa = 4.6 % all models predict the median wake centre of Turbine 1 to remain near the hub position (0,0) in the plots. In this low-ambient-turbulence case, the turbines are modelled with zero rotor tilt. The DWM models similarly keep the median wake positions of Turbines 2–4 near (0,0), whereas in LESUU the wakes shift slightly upward and to the right (negative y) further down the turbine row. At TIa = 12 %, the trends are similar, except that the LESUU wake moves further upwards, and the DWMNREL wake also shifts slightly above hub height. In the TIa = 12 % case the turbines were operated with a 5° rotor tilt. Notably, any misalignment of the rotor with the inflow is known to deflect the wake (Clayton and Filby, 1982), so a positive tilt is expected to deflect the wake upward. DWMNREL is the only DWM model that accounts for wake deflection from tilt or yaw misalignment, which is reflected in the results. At TIa = 12 %, the median positions of the wake centres clearly shift to the right (negative y) with downstream distance for all models except DWMDTU, where the meandering is driven by a separate Mann box and not by the LES inflow. The LES precursor has a small mean y-velocity component of −0.23 m s−1 at hub position for the TIa = 12 % case. If the wakes simply advected with this lateral velocity like passive tracers, they would move about ∼ −17 m∼ −0.13 D in the y direction at 5 D downstream. This is of the same order as the median wake displacements predicted by the DWM models at 5 D downstream for all turbines and thus likely explains the slight lateral asymmetry seen in those cases. By the same reasoning, a mean vertical velocity of −0.076 m s−1 in the inflow would move the wake centre by ∼ −0.043 D over 5 D. This is of the same order as the upward shifts predicted by DWMDTU and DWMIFE, whereas LESUU and DWMNREL show upward deflection since the contribution from rotor tilt is dominating.
In LESUU, the median horizontal positions of the wakes show a horizontal displacement in all cases: the largest in the high-turbulence case, consistent with the −0.23 m s−1 mean y velocity, but even in the low- and medium-turbulence cases where the mean y velocity is near zero (0.0126 and −0.0710 m s−1, respectively). These asymmetries in the LESUU flow become more pronounced further down the turbine row. Notably, even without any rotor misalignment between the rotor and the incoming wind, wake deflections have been observed previously in both experiments (Bartl et al., 2018; Bossuyt et al., 2021) and LES studies (Fleming et al., 2014). As explained in detail by Zong and Porté-Agel (2020b), for an anti-clockwise-rotating wake in an undisturbed shear layer with a positive vertical velocity gradient in the rotor area, it follows from the streamwise momentum equation that the momentum balance causes the wake to deflect to the left. Conversely, the difference in tip vortex strength between the upper and lower half of the wake will tend to deflect it to the right. These two opposing effects, which are not captured by the axisymmetric DWM wake models, likely explain why LESUU predicts a greater wake deflection than the DWM models. Similarly, differences in tip vortex strength between the left and right sides of the wake, captured in the three-dimensional LESUU flow, can drive the wake upward, explaining the larger upward wake deflections in LESUU compared to DWM.
All models show greater horizontal meandering than vertical, and all show increased meandering at higher TIa. For Turbine 1, the models agree well on the meandering level. However, DWMIFE tends to produce slightly more meandering than the other DWM models. It matches LES more closely in the low-ambient-turbulence case but slightly overestimates meandering at high ambient turbulence. According to Keck et al. (2013), a lower wake transport velocity leads to increased levels of meandering, consistent with the higher meandering levels for DWMIFE relative to DWMDTU (DWMIFE and DWMDTU approximate the wake transport velocities to 0.8U∞ and U∞, respectively; see Sect. 2.2.3 for details). DWMNREL and DWMNREL,S show excellent agreement in median wake positions for all ambient turbulence cases and in meandering levels for the low-ambient-turbulence case. However, under high ambient turbulence, DWMNREL,S predicts a larger wake position spread than DWMNREL. This is expected as the SAMWICh algorithm becomes less accurate with increasing background turbulence, since the turbulence effectively acts as noise for the tracking algorithm.
For Turbines 2–4, the wake position distributions diverge more between the models. While the wake of LESUU shows a ∼ 50 % increase in wake spread from Turbine 1 to 2, the DWM models show no significant change. The wake meandering of LESUU continues to increase from Turbines 2–4. In DWM, however, all turbine wakes are subjected to the same ambient turbulence field, with no contribution from wake-added turbulence to meandering. Therefore, the meandering does not increase for downstream turbines. It is also worth noting that SAMWICh tracks the combined effect from all upstream wakes; for example at Turbine 4 it identifies the sum of the wakes from Turbines 1 to 4. Because the meandering of an isolated wake grows with downstream distance, the upstream turbine wakes, which have travelled farther, might contribute additional meandering to the combined wake tracked downstream of Turbines 2–4 by SAMWICh. In fact, DWMNREL,S shows a slight increase in meandering along the row for both TIa = 4.6 % and TIa = 12 % that is not present in DWMNREL, suggesting that tracking the combined wake can capture some growth in meandering. Therefore, some differences in the apparent wake meandering between LESUU and the DWM models may arise from the different wake centre identification methods.
3.1.3 Power and thrust
Figures 9 and 10 show time-averaged thrust and aerodynamic power for the three levels of ambient turbulence investigated. While all models are in good agreement for the thrust of Turbine 1, LESUU predicts about 10 % higher power than the DWM models for this turbine. As expected, all models show a significant drop in both thrust and power from Turbine 1 to Turbines 2–4 (which operate under waked conditions). For DWMNREL, DWMIFE, and LESUU, thrust and power continue to decrease slightly from Turbines 2–4 in the low- and medium-ambient-turbulence cases. By contrast, DWMDTU shows a larger initial drop in thrust and power from Turbine 1 to 2 compared to the two other DWM models. It then predicts an increase in these quantities from Turbine 2 to Turbine 3 and 4. A similar effect has been observed in full-scale measurements at the Lillgrund wind farm under comparable conditions (below-rated wind speeds, low ambient turbulence) but with more closely spaced turbines (see e.g. Madsen et al., 2016). At TIa = 12 %, the drop from Turbine 1 to 2 is smaller for all models, as expected with higher ambient turbulence due to faster wake recovery. For Turbines 2–4, DWMDTU shows nearly constant thrust and power, instead of the increase seen at low and medium ambient turbulence. LESUU, however, shows a slight increase in thrust and power from Turbines 3 and 4 at TIa = 12 %. This behaviour could be due to turbulence build-up along the turbine row, which accelerates wake recovery deeper into the farm.
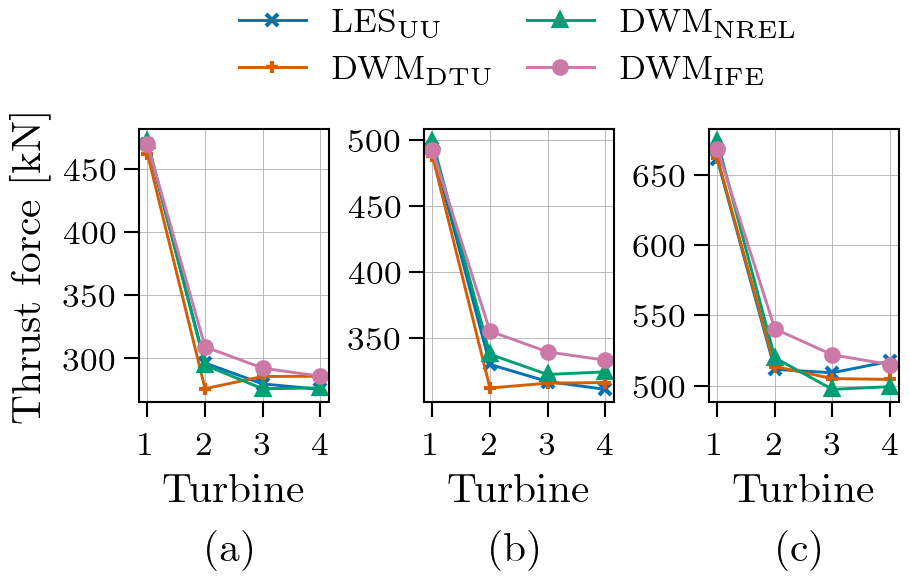
Figure 9Mean thrust force for the aligned-incoming-wind case with (a) low (TIa = 4.6 %), (b) medium (TIa = 8.8 %), and (c) high (TIa = 12 %) ambient turbulence.
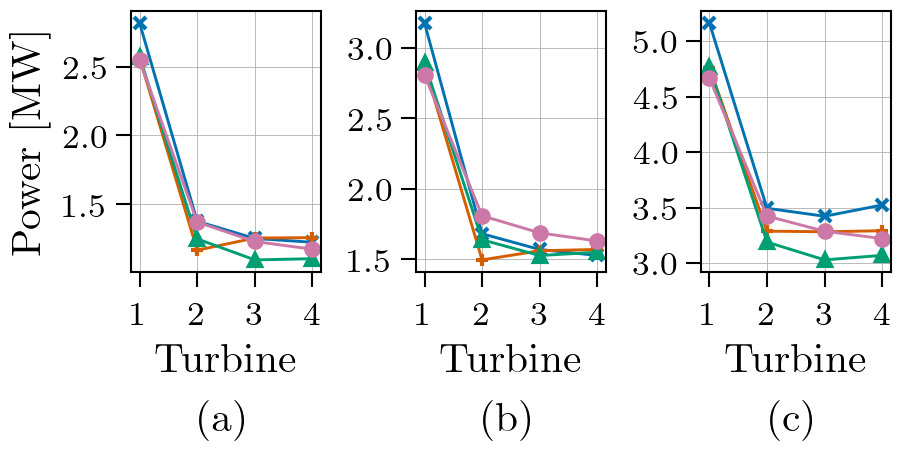
3.1.4 Blade forces
Figure 11 shows the time-averaged tangential and normal force distributions along the radial positions of the blades for the low-ambient-turbulence case. The results are qualitatively similar for the higher-ambient-turbulence cases (Figs. A4 and A5 in Appendix A). Overall, the models are in good agreement. However, LESUU predicts higher tangential forces than the DWM models in the middle section of the blades, consistent with its higher power predictions in Fig. 10. Since Turbine 1 experiences the same inflow in all models, the differences observed for that turbine must come from differences in the turbine aerodynamic models (ALM in LESUU and BEM variants in the DWM models; see Sect. 2.2.8 for details). Similar differences in the shape of the tangential force distribution between ALM and BEM have been reported in previous studies (Liu et al., 2022), though not as pronounced as observed here. The force-distribution plots further show that for the TIa = 4.6 % and TIa = 8.8 % cases, where DWMDTU predicts increased thrust and power for Turbines 3 and 4 relative to Turbine 2, both normal and tangential forces tend to be higher compared to the other models at the outer part of the blade () for the last two turbines in the row. For the normal forces, which are nearly an order of magnitude larger than the tangential forces, the relative differences between the models are small.
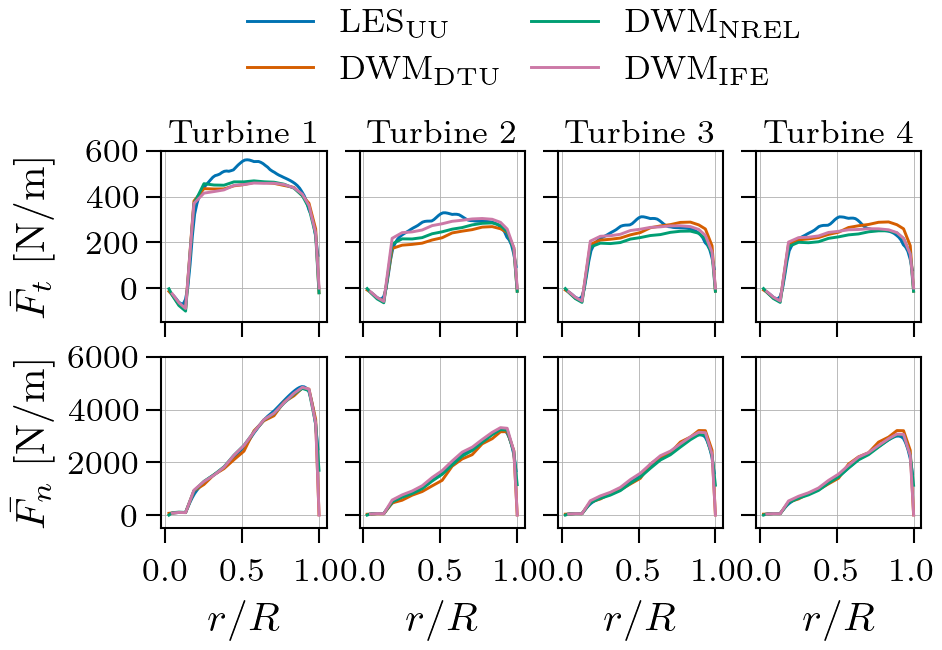
Figure 11Time-averaged blade force as a function of blade radius for the aligned-incoming-wind case with low ambient turbulence (TIa = 4.6 %).
Figures 12 and 13 show the azimuthal variation in the normal component of the blade force at four radial blade positions for the low- and high-ambient-turbulence cases, respectively (the medium-ambient-turbulence case is given in Fig. A6 in Appendix A). The time-averaged normal force at each radial position, (from Fig. 11), has been subtracted from the azimuthally varying force and the result normalized by to show only the relative force variation over a rotation. is azimuthally binned by Δϕ=12° using all blade rotations from the 45 min simulation. The maximum blade force occurs around ϕ=0°, when the blade points upwards and experiences the highest wind speeds. Conversely, the minimum blade force occurs around ϕ = 180°. As noted in Sect. 2.1, the tower is not modelled, so any variation in wind speed experienced by the blades is solely due to wind shear and, for Turbines 2–4, the influence of upstream wakes. In all models, the amplitude of force variation increases towards the blade tip for every turbine.
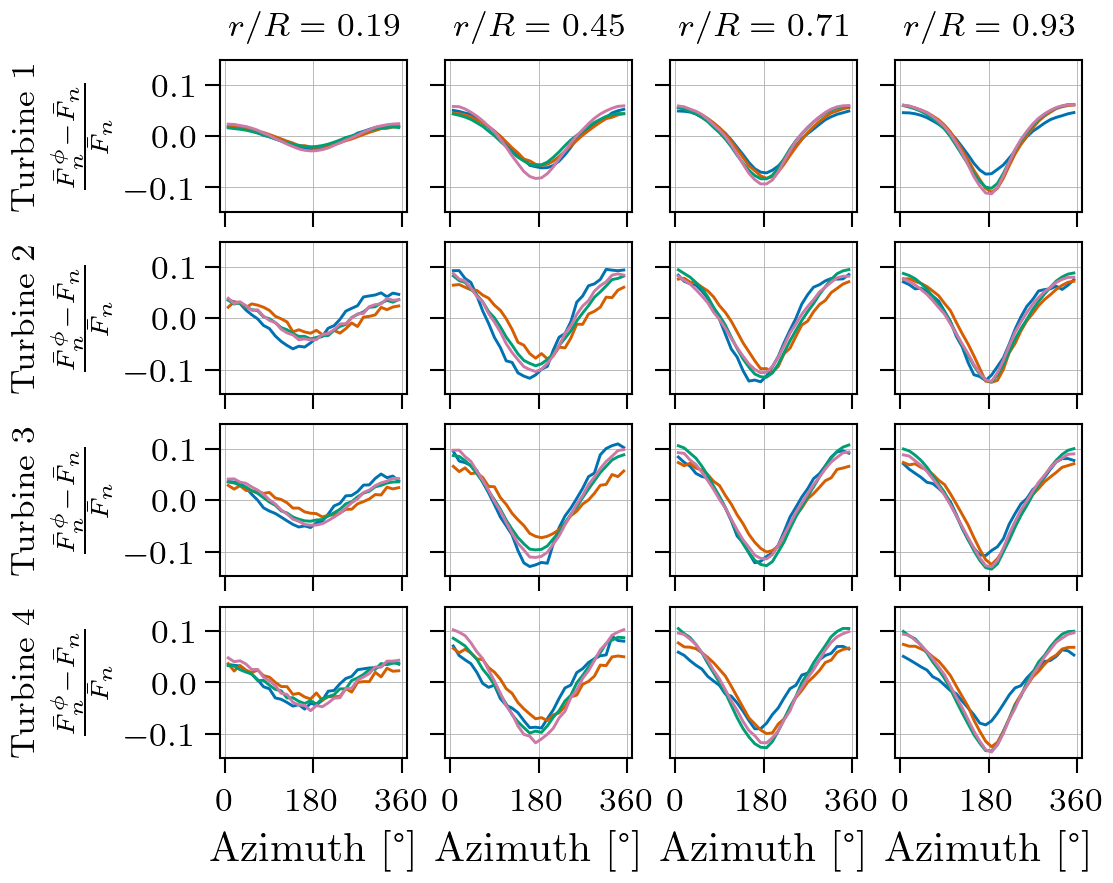
Figure 12Relative difference between mean normal blade force per azimuthal bin and total normal force for the aligned-incoming-wind case with low ambient turbulence (TIa = 4.6 %). For legend, see Fig. 11.
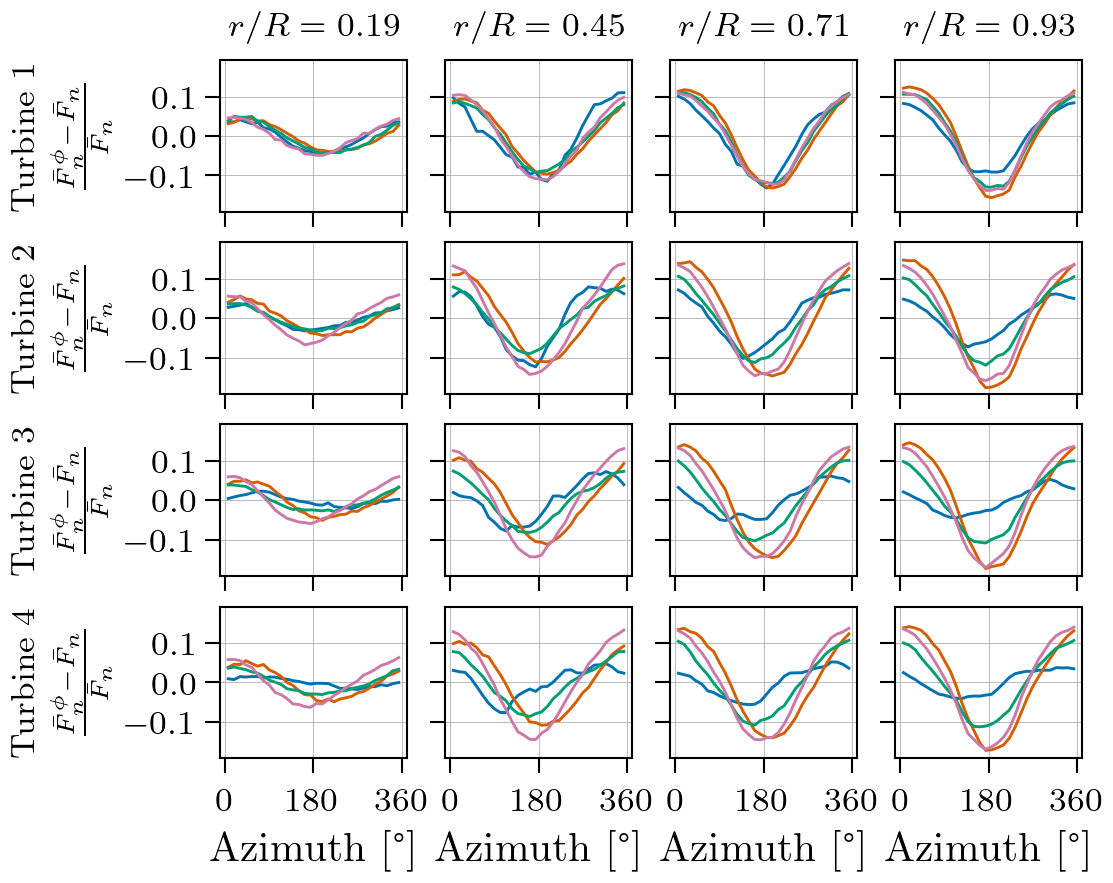
Figure 13Relative difference between mean normal blade force per azimuthal bin and total normal force for the aligned-incoming-wind case with high ambient turbulence (TIa = 12 %). For legend, see Fig. 11.
For the low-ambient-turbulence case in Fig. 12, the models generally agree on the shape of the force variation. However, the phase of the DWMDTU's force variation is slightly shifted to higher ϕ for Turbines 2–4 compared to the other models. The force variation amplitudes also generally agree well between the models; however, LESUU shows slightly smaller amplitudes than the DWM models at , even for Turbine 1 where all models share the same inflow. As before, differences observed for this turbine arise from differences in the turbine aerodynamic models. In particular, the deviations at are likely related to the tip corrections. The ALM in LESUU uses a vortex-based tip-smearing correction, whereas BEM in the DWM models applies the Prandtl tip correction (see Sect. 2.2.8 for details).
For high ambient turbulence (Fig. 13), the model differences are more pronounced. For the turbines operating under waked conditions, LESUU exhibits a phase shift to smaller ϕ (i.e. peaks occur at ϕ < 180°), whereas DWMDTU again shows a slight shift to larger ϕ (peaks at ϕ > 180°). In LESUU, this shift is greatest for Turbines 3 and 4: the maxima move from about 0 to 300° and the minima from around 180 to 150°. As noted earlier (Fig. 8), the wakes shift slightly to the right when looking downstream (to negative y), which shifts the regime of the highest wind to the left. Equivalently, the region of the lowest wind shifts to the right, to ϕ < 180°. As in the TIa = 4.6 % case, LESUU predicts smaller force variation amplitudes than the DWM models at the blade tip for Turbine 1, supporting the conclusion that there are differences in the turbine aerodynamic models. For the turbines operating under waked conditions (2–4), the models show large deviations in amplitude. LESUU yields smaller force variation amplitudes than the DWM models, with DWMNREL coming closest. While the amplitudes of the force variations remain approximately constant for all turbines in DWMDTU and DWMIFE, they decrease downstream along the turbine row for LESUU and DWMNREL.
For Turbines 2–4, differences in their incoming wind fields are the main source of the discrepancies in blade force variations between the models. The amplitudes of the force variations depend on the variation in velocity that the blades experience over a rotation. For instance, a vertical velocity profile with smaller variations over the rotor-swept area, as seen in LESUU at and in Figs. 2 and 3, yields smaller force variations on the blades of Turbines 3 and 4. Conversely, the higher-velocity gradients in the DWMDTU and DWMIFE profiles result in larger force variation amplitudes.
3.1.5 Fatigue
Figure 14 shows 45 min damage-equivalent loads (DELs; see Sect. 2.1 for details) for the blade-root flapwise bending moment, using a Wöhler coefficient of 10 for the blades. For the low-ambient-turbulence case (Fig. 14a), LESUU shows a large increase in DEL from Turbine 1 to 2, followed by a constant level further down the turbine row. DWMDTU agrees very well with LESUU in this case, except it gives a slightly higher DEL at Turbine 2. By contrast, DWMNREL and DWMIFE do not capture this increase in DELs from Turbine 1 to 2 but predict nearly the same DEL for all turbines.
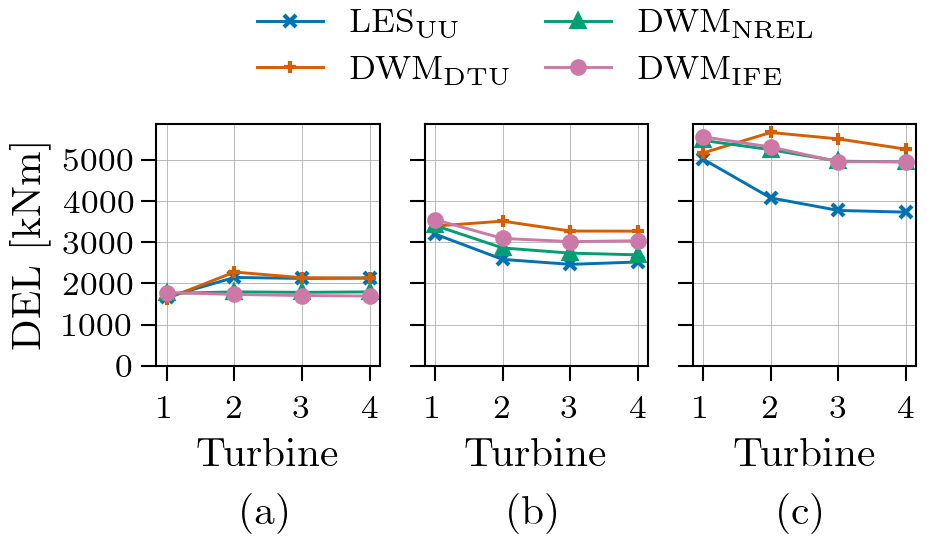
Figure 14Fatigue of blade-root flapwise bending moment for the aligned-incoming-wind case with ambient turbulence of (a) TIa = 4.6 %, (b) TIa = 8.8 %, and (c) TIa = 12 %.
Figure 14 also shows that blade-root flapwise bending moment DELs increase with ambient turbulence for all models. DWMDTU shows a similar trend from Turbines 1 to 4 at all TIa levels: an increase from Turbine 1 to 2 and then a slight decrease for the turbines further downstream. The other models show a different development along the turbine row at higher TIa. At TIa = 8.8 % and TIa = 12 %, LESUU estimates a substantial decrease (about 15 %–20 %) from Turbine 1 to 2, followed by roughly constant levels from Turbines 2–4. DWMNREL and DWMIFE show a similar trend along the turbine row but at higher overall DEL levels.
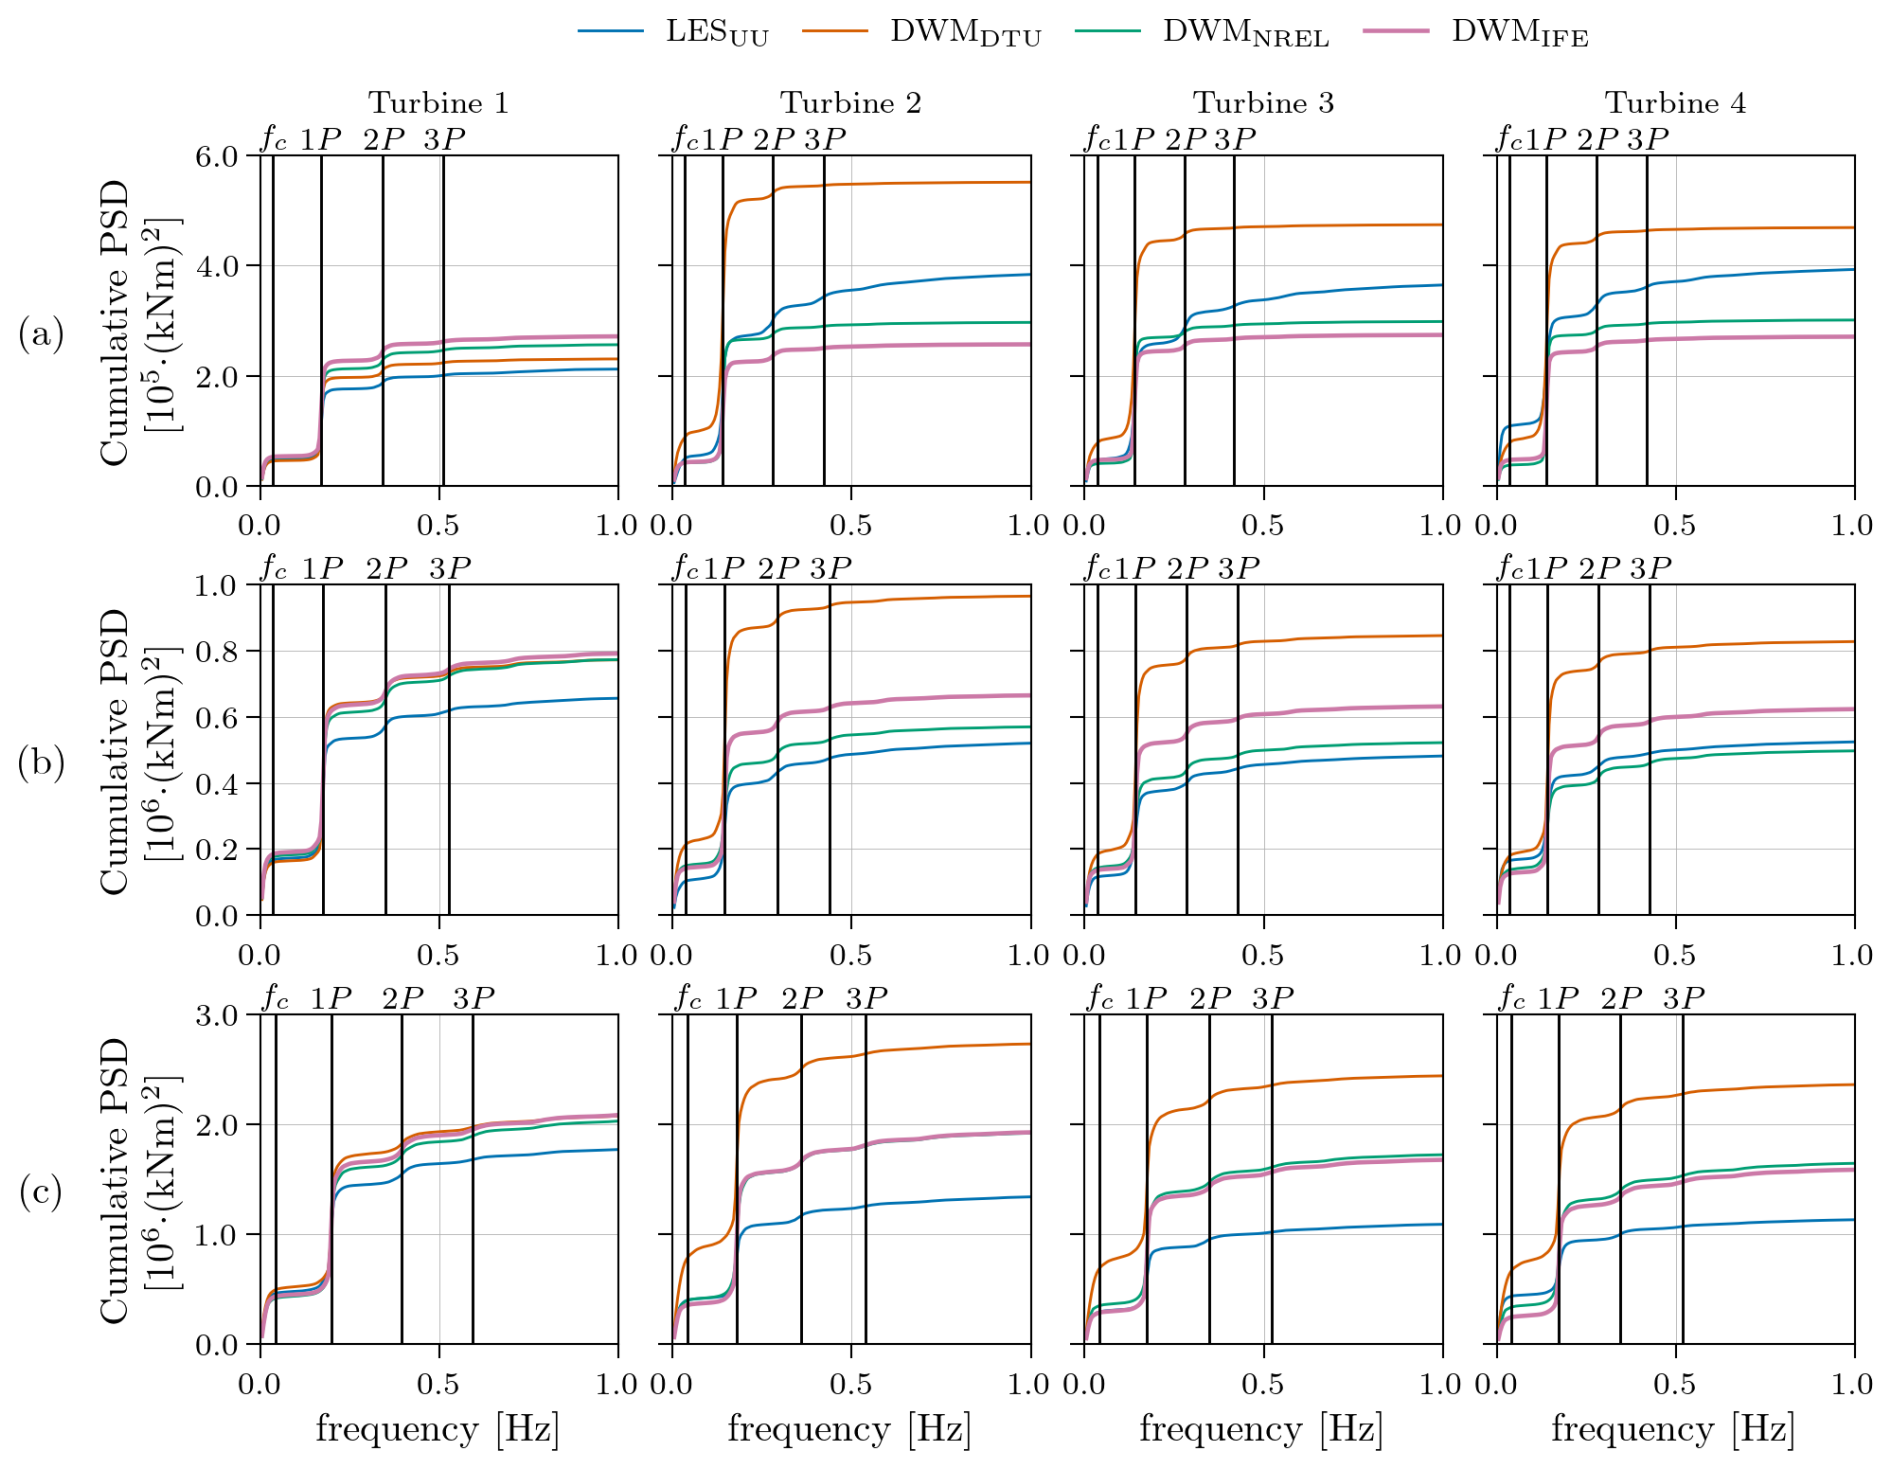
Figure 15Energy spectra of blade-root flapwise bending moment for the aligned-incoming-wind case with ambient turbulence of (a) TIa = 4.6 %, (b) TIa = 8.8 %, and (c) TIa = 12 %.
To investigate these DEL differences, Fig. 15 presents the power spectral density (PSD) of the blade-root flapwise bending moment, shown as cumulative integrals. All models' spectra exhibit jumps at the 1P frequency and its harmonics, as well as in the low-frequency range below fc. 1P corresponds to the frequency of one blade revolution, and the jumps in the cumulative integral correspond to peaks in the standard PSD. is the meandering cut-off frequency, and loads associated with wake meandering are expected to appear below fc (Larsen et al., 2008; Larsen and Lio, 2025). However, since Turbine 1 experiences undisturbed inflow (no upstream wake), its energy in the PSD below fc represents a baseline without wake meandering energy. Surprisingly, DWMDTU is the only model that consistently estimates a significant increase in energy below fc when comparing Turbine 1 to the turbines operating under waked conditions. LESUU does show some variation in energy below fc, for example an increase from Turbine 3 to 4 in the low-ambient-turbulence case. This change aligns with the increased meandering observed in Fig. 7, particularly in the lateral direction.
DWMNREL and DWMIFE show fairly good agreement with LESUU in terms of energy at the 1P frequency. For these models, the 1P energy levels scale with the amplitudes of the blade-force variations in Figs. 12 and 13: DWMIFE has the highest amplitudes and highest 1P energy and LESUU the lowest. DWMDTU, however, shows significantly higher 1P energy for the turbines operating under waked conditions (especially for Turbine 2) compared to the other models, and the 1P energy does not scale with the blade-force variation amplitude. At frequencies above 1P, LESUU shows higher energy levels in the waked turbines compared to Turbine 1 for the low-ambient-turbulence case. Energy at the harmonics of 1P (2P, 3P, 4P, etc.) arises from asymmetric blade loading (i.e. deviations from purely sinusoidal force variation). In LESUU, the instantaneous wakes can be highly asymmetric and only approximately axisymmetric on average, so Turbines 2–4 experience increased energy at these harmonic frequencies compared to Turbine 1. In addition, wake-generated turbulence, which has a much smaller length scale than the ambient turbulence (Madsen et al., 2010), contributes to increased energy at higher frequencies for the turbines operating under waked conditions. None of the DWM models predict a notable increase in high-frequency energy for the waked turbines. The DWM models assume axisymmetric wakes, which do not directly cause asymmetric blade loading on the turbines operating under waked conditions, only indirectly via meandering. Somewhat unexpectedly, DWMDTU's wake-added turbulence model does not generate the increased high-frequency energy for the waked turbines as was observed in the LESUU results. At higher ambient turbulence, even LESUU shows no visible increase in high-frequency energy from Turbine 1 to Turbines 2–4. This is likely because the wake-added turbulence in these cases is negligible compared to the already high ambient turbulence.
Even though DWMDTU matches LESUU well in terms of blade-root DELs for the low-ambient-turbulence case in Fig. 14, the underlying contributions in the PSD differ between the two models. In DWMDTU, the DEL increase from Turbine 1 to Turbines 2–4 is mainly driven by higher energy at 1P and also below fc at all ambient turbulence levels. For LESUU, the DEL increase in the low-ambient-turbulence case comes from a combination of increased energy associated with 1P frequency and higher. For the higher-ambient-turbulence cases, the negligible wake-added turbulence levels and the decreasing energy at 1P frequency in LESUU cause DELs to reduce along the turbine row. For these cases, DWMNREL and DWMIFE follow the same trend and align more closely with LESUU.
Figures 16 and 17 show 45 min DELs for the tower-top yaw moment and tower-base fore–aft bending moment, respectively, using a Wöhler coefficient of 3 for the tower. For all cases, the models show good agreement on Turbine 1's tower DELs. For the low-ambient-turbulence case, LESUU predicts considerably higher tower DELs than the DWM models for Turbines 2–4. Among the DWM models, DWMDTU comes closest to LESUU and is the only one to reproduce a similar development in DELs along the turbine row. At higher ambient turbulence, LESUU and the DWM models are in closer agreement for the turbines operating under waked conditions. Consistent with the blade load results, tower loads increase with ambient turbulence intensity. The cumulative PSD of the tower-base fore–aft bending moment in Fig. 18 shows jumps below fc and at the 3P frequency for all models. LESUU also exhibits energy at multiples of 3P, visible as small jumps at 6P. Energy below fc contributes more significantly to tower loads than it does for the blade loads shown in Fig. 15. Similar to the blade load results, DWMDTU is the only model consistently predicting higher energy below fc for Turbines 2–4 compared to Turbine 1. All models predict similar 3P energy for Turbine 1. However, only LESUU shows increased 3P and 6P energy for the downstream turbines relative to Turbine 1. This is likely due to the asymmetric loading caused by the instantaneous LES wakes, as discussed earlier for the blade loads. These increases diminish with higher ambient turbulence, and by TIa = 12 %, all models predict similar energy at 3P and above for every turbine. The tower-top yaw moment PSD in Fig. A7 in Appendix A shows qualitatively similar behaviour to the tower-base fore–aft moment.
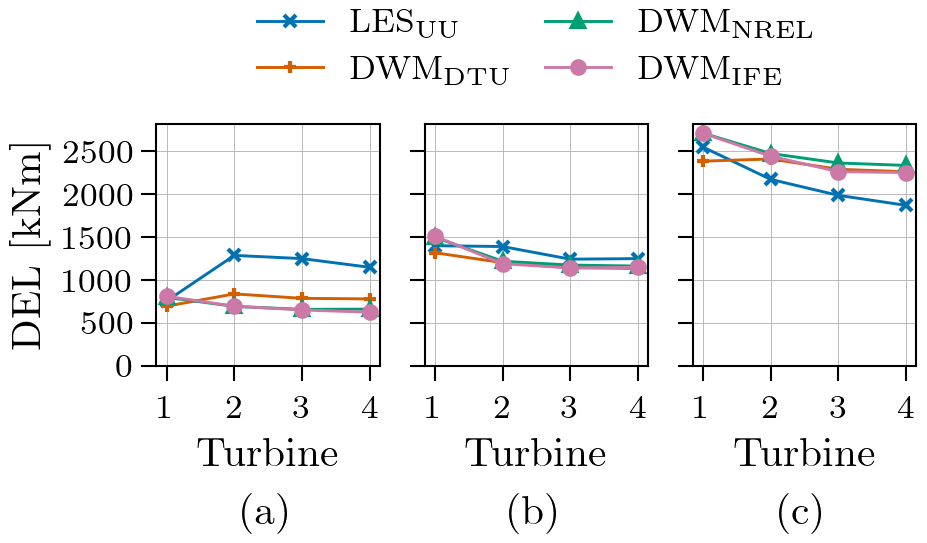
Figure 16Fatigue of tower-top yaw moment for the aligned-incoming-wind case with ambient turbulence of (a) TIa = 4.6 %, (b) TIa = 8.8 %, and (c) TIa = 12 %.
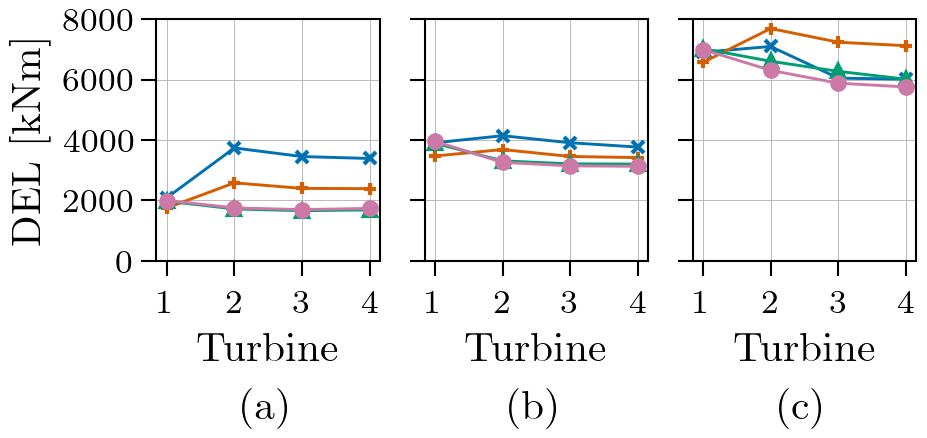
Figure 17Fatigue of tower-base fore–aft bending moment for the aligned-incoming-wind case with ambient turbulence of (a) TIa = 4.6 %, (b) TIa = 8.8 %, and (c) TIa = 12 %. For legend, see Fig. 16.
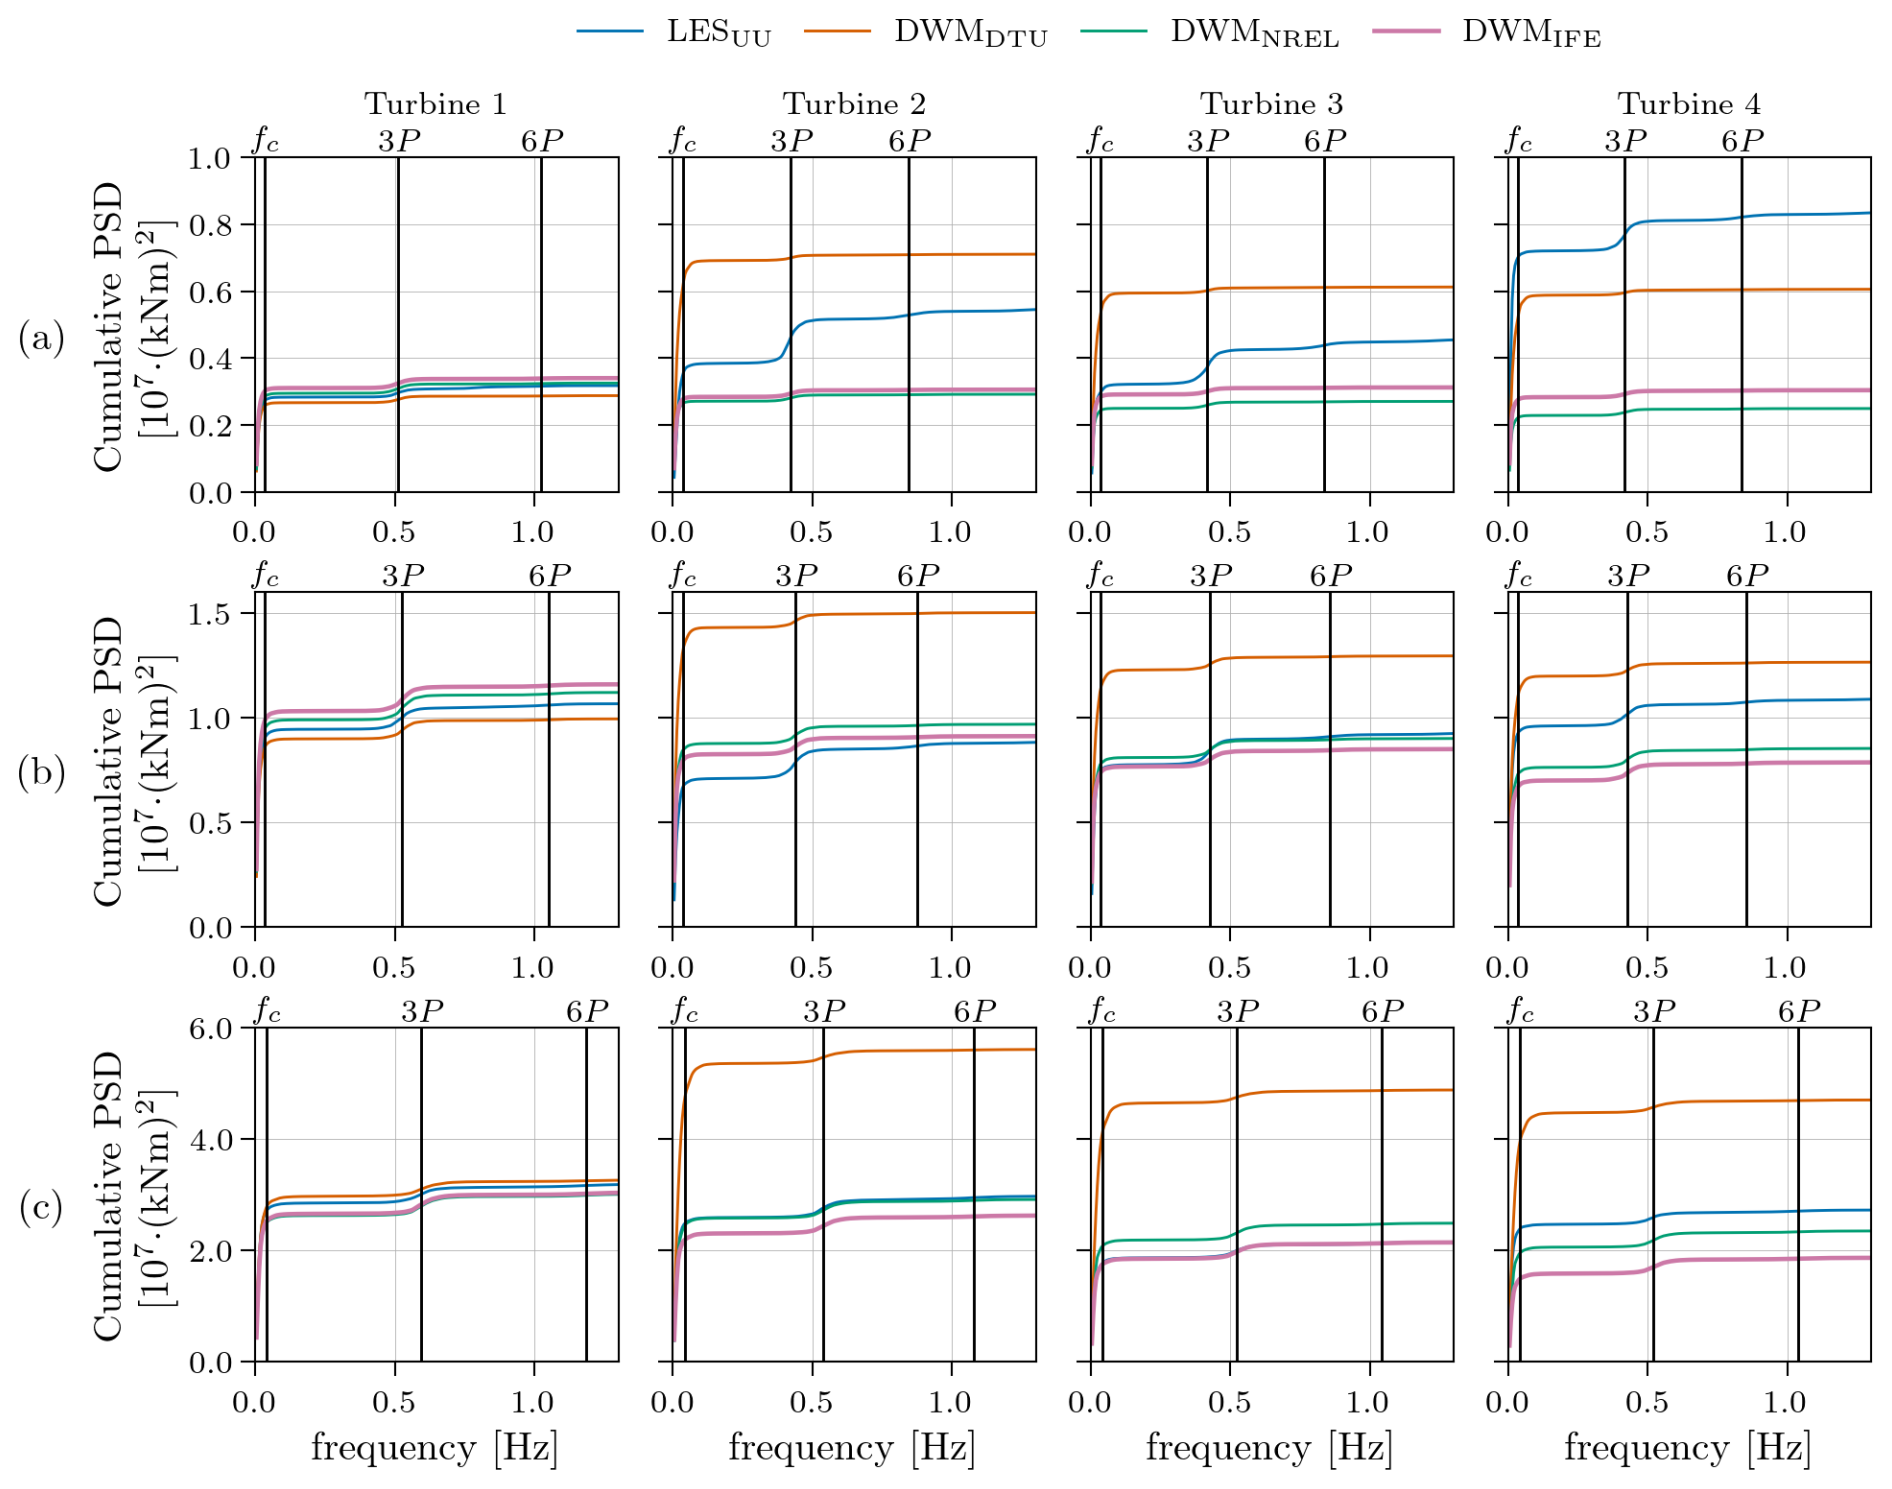
Figure 18Energy spectra of tower-base fore–aft bending moment for the aligned-incoming-wind case with ambient turbulence of (a) TIa = 4.6 %, (b) TIa = 8.8 %, and (c) TIa = 12 %.
3.2 Partially waked case
This section extends the analysis to a more complex inflow scenario by introducing a small misalignment between the mean wind direction and the turbine row. The resulting partial-wake configuration better reflects typical operational conditions in wind farms, where turbines are rarely aligned perfectly with the wind. The same ambient conditions as the medium-ambient-turbulence case in Sect. 3.1 are used but with a 5° inflow angle offset relative to the turbine row and with no yaw misalignment of the turbines themselves. We evaluate model performance in terms of time-averaged flow fields, wake centre positions, power production, thrust forces, blade loads, and fatigue. The results allow us to further examine each model's ability to capture asymmetric flow and loading effects.
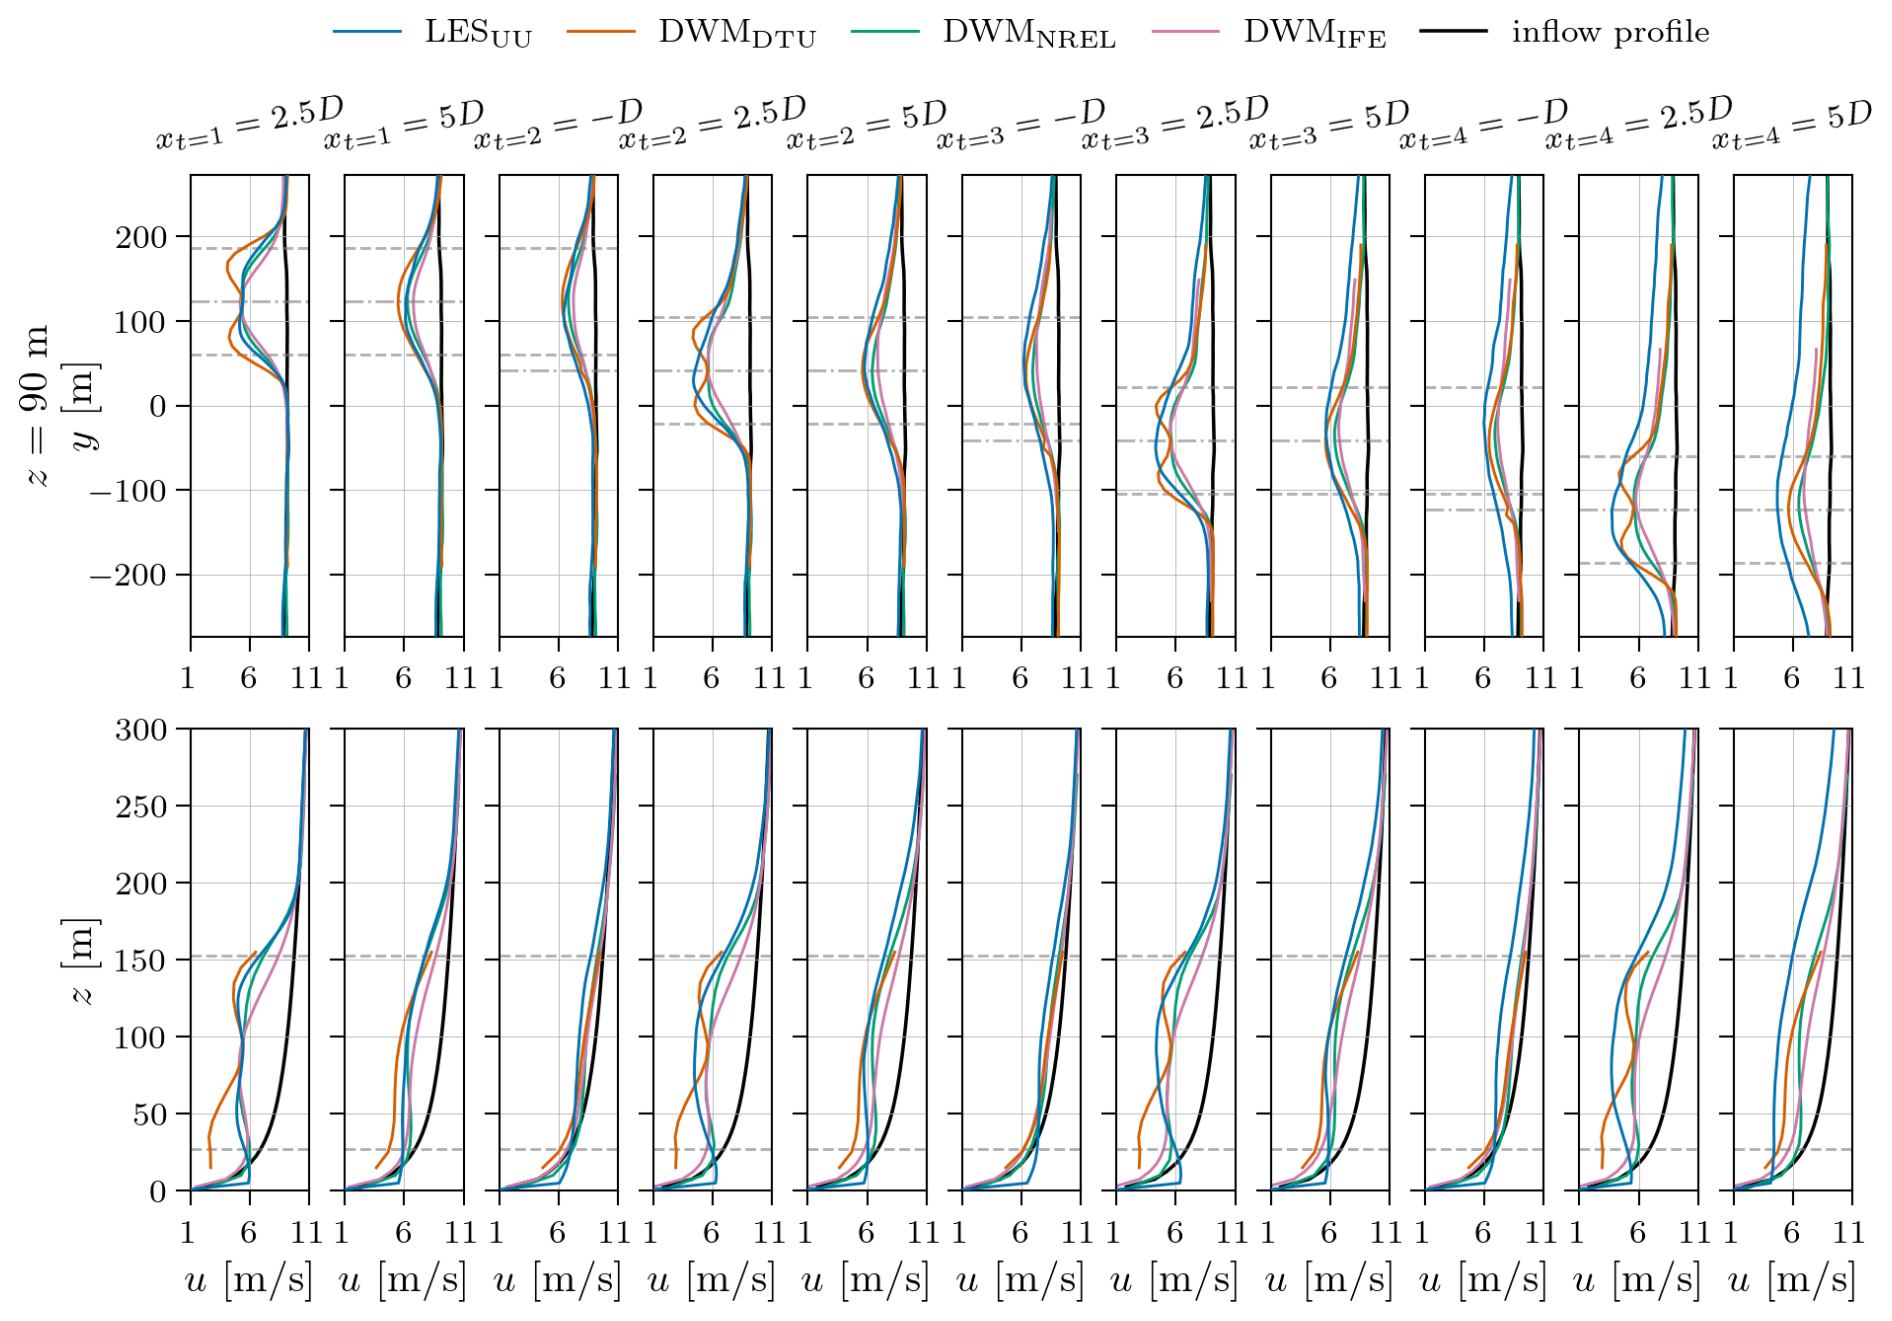
Figure 19Time-averaged velocity profiles for the partially waked case (5° inflow angle) with medium ambient turbulence (TIa = 8.8 %). Horizontal dashed lines indicate the rotor-swept area of the closest upstream turbine, and horizontal dash–dot lines indicate at which lateral position the corresponding vertical profiles are plotted.
3.2.1 Mean velocity profiles
Figure 19 shows time-averaged velocity profiles at the axial positions −1 D, 2.5 D, and 5 D relative to each of the four turbines, for the partially waked case with ambient turbulence TIa = 8.8 %. The upper row shows horizontal profiles at hub height, and the lower row shows vertical profiles at the turbine's lateral centre. Horizontal dashed lines indicate the range of the turbine's rotor-swept area of the nearest upstream turbine, and horizontal dash–dot lines mark the lateral positions at which the corresponding vertical profiles are taken. Since the ambient conditions of the partially waked case match the fully waked case with medium ambient turbulence, the flow behind and the response of Turbine 1 are similar: DWMDTU shows a distinct near-wake profile, whereas DWMNREL and LESUU show only traces of it. As in the fully waked case, DWMIFE, and to a lesser degree DWMNREL, tends to underpredict the centreline deficit. DWMDTU, by contrast, slightly overpredicts the deficit in Turbine 1's wake compared to LESUU but then gradually underpredicts it further down the turbine row. Due to the asymmetric inflow for Turbines 2–4, all models predict that the wakes of these turbines spread more to the left side when looking downstream. However, as in the fully waked case, LESUU shows a greater increase in deficit outside and above the rotor span compared to the DWM models deeper into the turbine row.
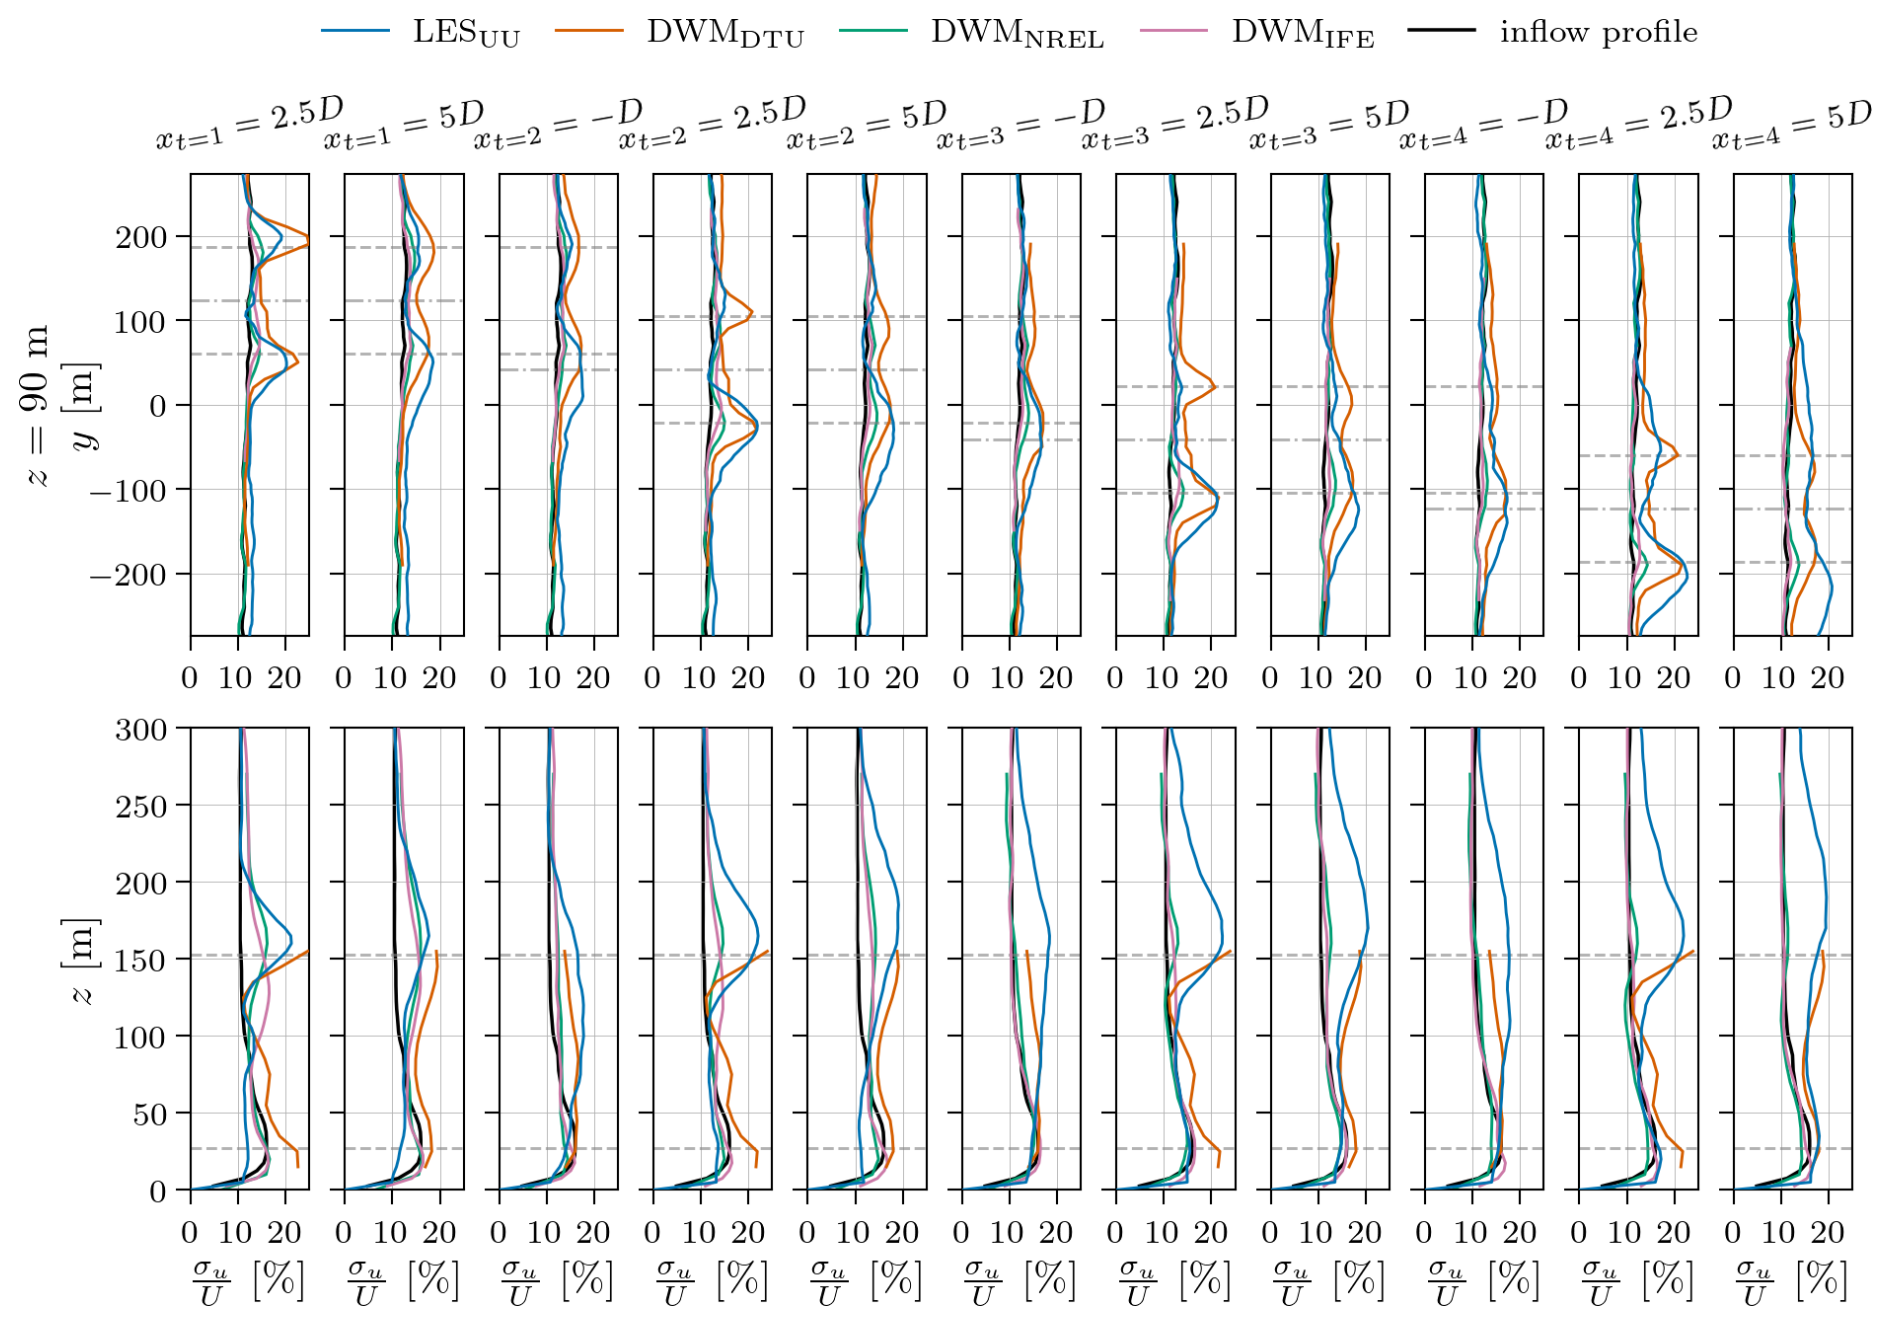
Figure 20Profiles of velocity standard deviation for the partially waked case (5° inflow angle) with medium ambient turbulence (TIa = 8.8 %). Horizontal dashed lines indicate the rotor-swept area of the closest upstream turbine, and horizontal dash–dot lines indicate at which lateral position the corresponding vertical profiles are plotted.
Figure 20 shows profiles of velocity standard deviation σu for the partially waked case. As in the fully waked case with medium ambient turbulence, LESUU and DWMDTU show much higher σu levels than DWMNREL and DWMIFE. DWMDTU matches LESUU particularly well in the shear layer on the right side of the wake when looking downstream, whereas larger differences appear in the left-side shear layer and in the vertical profile.
3.2.2 Wake centre positions
Figure 21 shows box-and-whisker plots of the horizontal and vertical wake centre positions at 5 D downstream of each turbine for the partially waked case. For LESUU,S, the wake centre positions are tracked using the SAMWICh toolbox (Sect. 2.4), whereas for the DWM models, the wake centre positions are taken directly from the meandering algorithm in the DWM simulation.
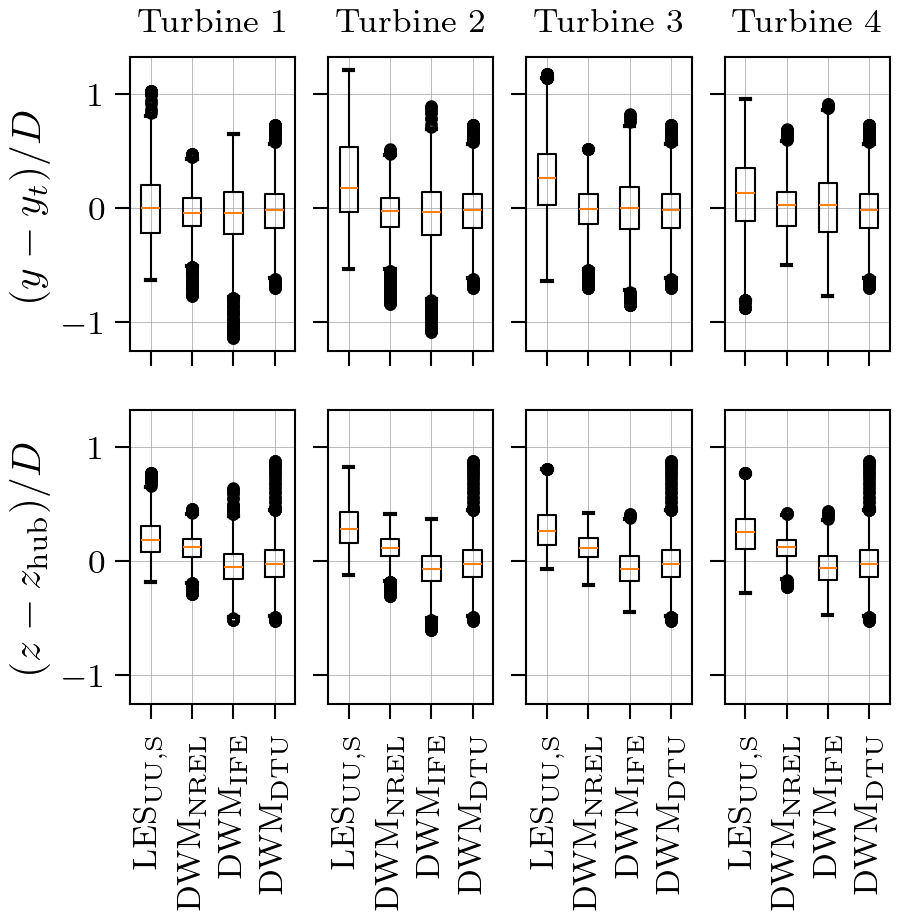
Figure 21Box plots of horizontal (upper row) and vertical (lower row) wake centre positions at x = 5 D behind the turbines for the partially waked case (5° inflow angle) with medium ambient turbulence (TIa = 8.8 %).
For Turbine 1, all models predict that the median wake centre position stays approximately at the turbine position laterally (). For the DWM models, this holds for Turbines 2–4 as well, whereas LESUU,S predicts the median wake centre positions shifted slightly to the left when looking downstream (). In this skewed inflow setup, each turbine is offset to the left of the one behind it; for example, Turbine 1 is located 0.65 D, 1.31 D, and 1.96 D to the left of Turbines 2–4, respectively. Since SAMWICh tracks the combined wake from all the upstream turbines, the leftward shift in the LESUU,S wake centre distributions may be influenced by the upstream wakes' position rather than a true deflection of the individual wakes. Alternatively, this asymmetry could be caused by the vertical shear in the inflow causing a horizontal wake deflection, as discussed in Sect. 3.1.2. However, that mechanism does not explain why only the wakes of Turbines 2–4 show a leftward deflection and not the wake of Turbine 1, nor why the deflection is in the opposite direction to what was seen in the aligned-inflow case.
As in the aligned-inflow cases (Sect. 3.1), LESUU and to a lesser extent DWMNREL predict that the wakes deflect upward above hub height because of the 5° rotor tilt. And also in agreement with the previous results, all models show more horizontal than vertical meandering. However, unlike the aligned case, LESUU does not show a large increase in meandering levels further down the row under partial-wake conditions.
3.2.3 Power and thrust
Figure 22 shows time-averaged thrust force and power for each turbine in the partially waked case. As expected, Turbine 1 exhibits similar thrust and power to the fully waked case with the same medium-ambient-turbulence conditions. However, small differences do appear because of variations in the incoming wind field at the two lateral positions of Turbine 1 in the fully waked case (y=0) and in the partially waked case (y≈ 123 m). As in the fully waked case, LESUU shows about 10 % higher power compared to the DWM models for Turbine 1. For Turbines 2–4, the DWM models are in good agreement, whereas LESUU shows a significant drop in both thrust and power between Turbines 3 and 4. This drop comes from the deeper deficit in front of Turbine 4 as a result of a much wider horizontal wake predicted by LESUU, visible at in Fig. 19.
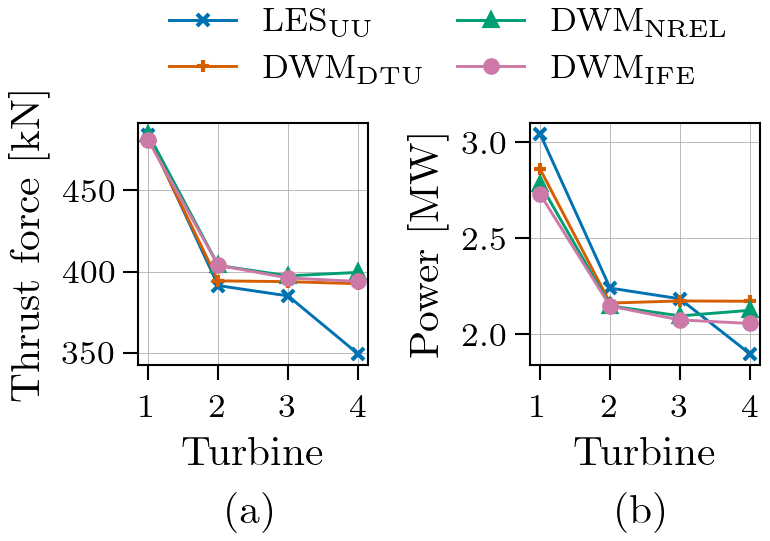
Figure 22(a) Mean thrust force and (b) mean power for the partially waked case (5° inflow angle) with medium ambient turbulence (TIa = 8.8 %).
3.2.4 Blade forces
The time-averaged tangential and normal force distributions along the blade span for the partially waked case (Fig. A8 in Appendix A) show qualitatively similar trends to the fully waked case, with good agreement among the DWM models, while LESUU shows higher tangential forces in the mid-span region of the blades. Figure 23 presents the azimuthal variation in the normal blade force at four radial positions along the blade for all four turbines in the partially waked case. For Turbine 1, the models generally agree on the shape of the force variations, with some amplitude differences near the blade tip. However, larger deviations are seen among the models for Turbines 2–4 under partially waked conditions. In LESUU, the force minimum is shifted about 90° towards larger ϕ for Turbines 2–4, meaning that the lowest force occurs when the blades point straight to the left. The lowest velocity in the incoming wind field is therefore towards the wake of the upstream turbine. For DWMIFE, on the other hand, the minimum force is shifted only slightly towards larger ϕ. Because DWMIFE predicts a weaker wake deficit, the blades experience the lowest force when near the bottom of their rotation, where the velocity of the incoming flow is low due to shear. DWMDTU and DWMNREL predict a force minimum at about the same ϕ as LESUU for all radial positions along the blade. However, at the outer part of the blade, a second minimum appears at approximately the same ϕ as estimated by DWMIFE. When a blade is pointing downward, its tip passes through a region where the DWM models predict significantly sharper vertical velocity gradients than LESUU (see Fig. 19). As a result, the DWM models predict a force minimum at ϕ≈ 180° on the outer blade sections, even under partially waked conditions.
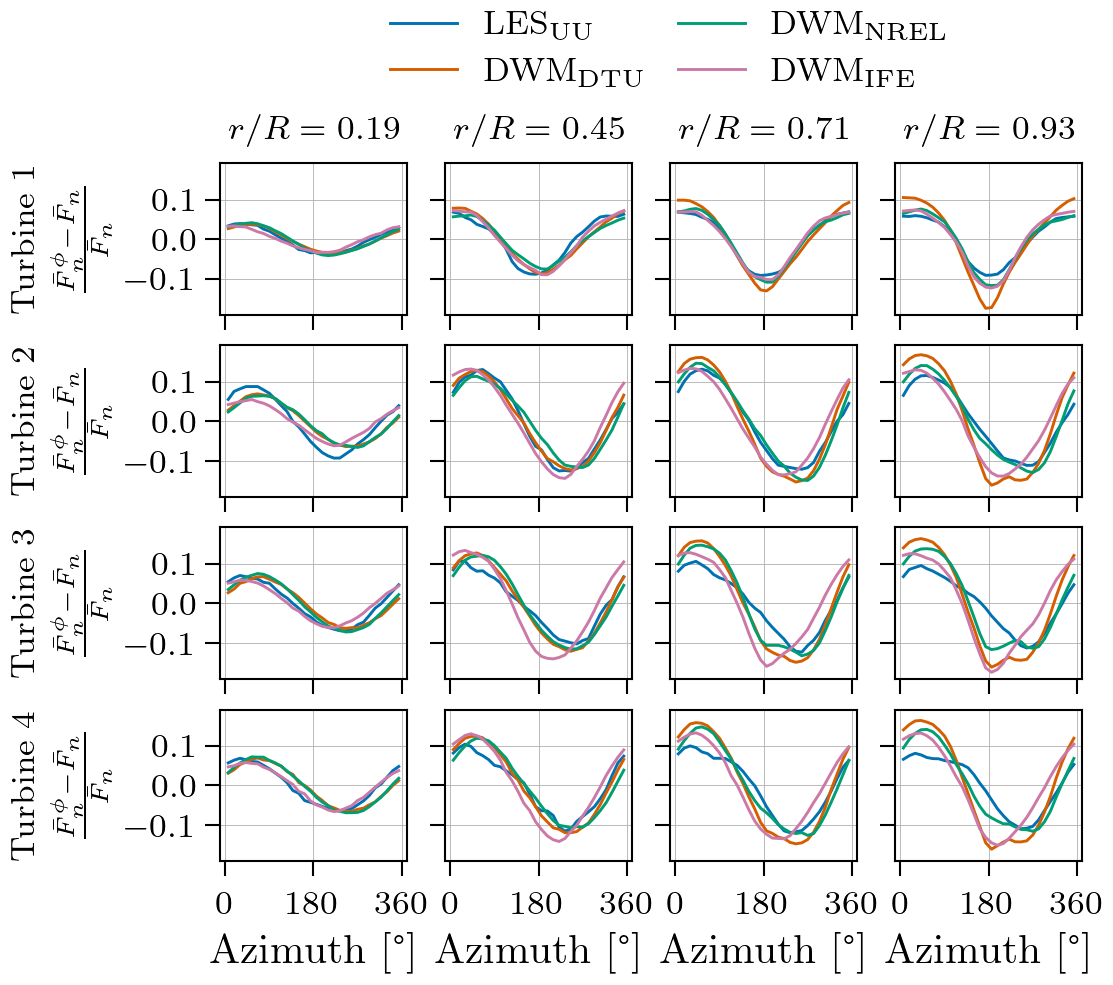
Figure 23Relative difference between mean normal blade force per azimuthal bin and total normal force for the partially waked case (5° inflow angle) with medium ambient turbulence (TIa = 8.8 %).
3.2.5 Fatigue
Figure 24 shows the 45 min DELs for the (a) blade-root flapwise bending moment, (b) tower-top yaw moment, and (c) tower-base fore–aft bending moment for the partially waked case. DWMDTU is the only DWM model to capture a development along the turbine row similar to LESUU. However, it slightly overpredicts the blade DELs and underpredicts the tower DELs compared to LESUU. DWMDTU and LESUU both estimate increasing DELs from Turbine 1 to 2. In these models, the reduced loads due to decreased mean wind are compensated for by increased turbulence downstream of Turbine 1, modelled in DWMDTU by the wake-added turbulence model. By contrast, DWMNREL and DWMIFE lack a wake-added turbulence model, with the result that Turbines 2–4 have lower DELs than Turbine 1.
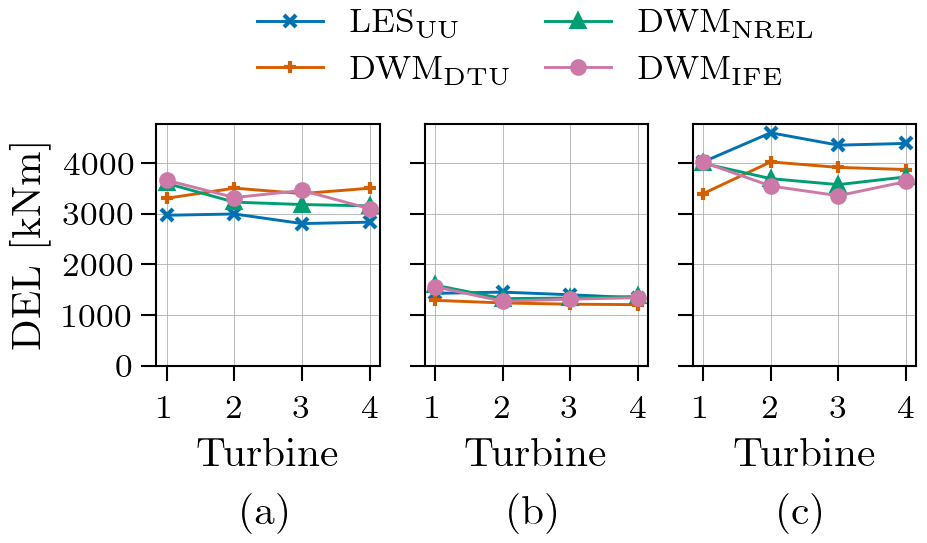
Figure 24Fatigue of (a) blade-root flapwise bending moment, (b) tower-top yaw moment, and (c) tower-base fore–aft bending moment for the partially waked case (5° inflow angle) with medium ambient turbulence (TIa = 8.8 %).
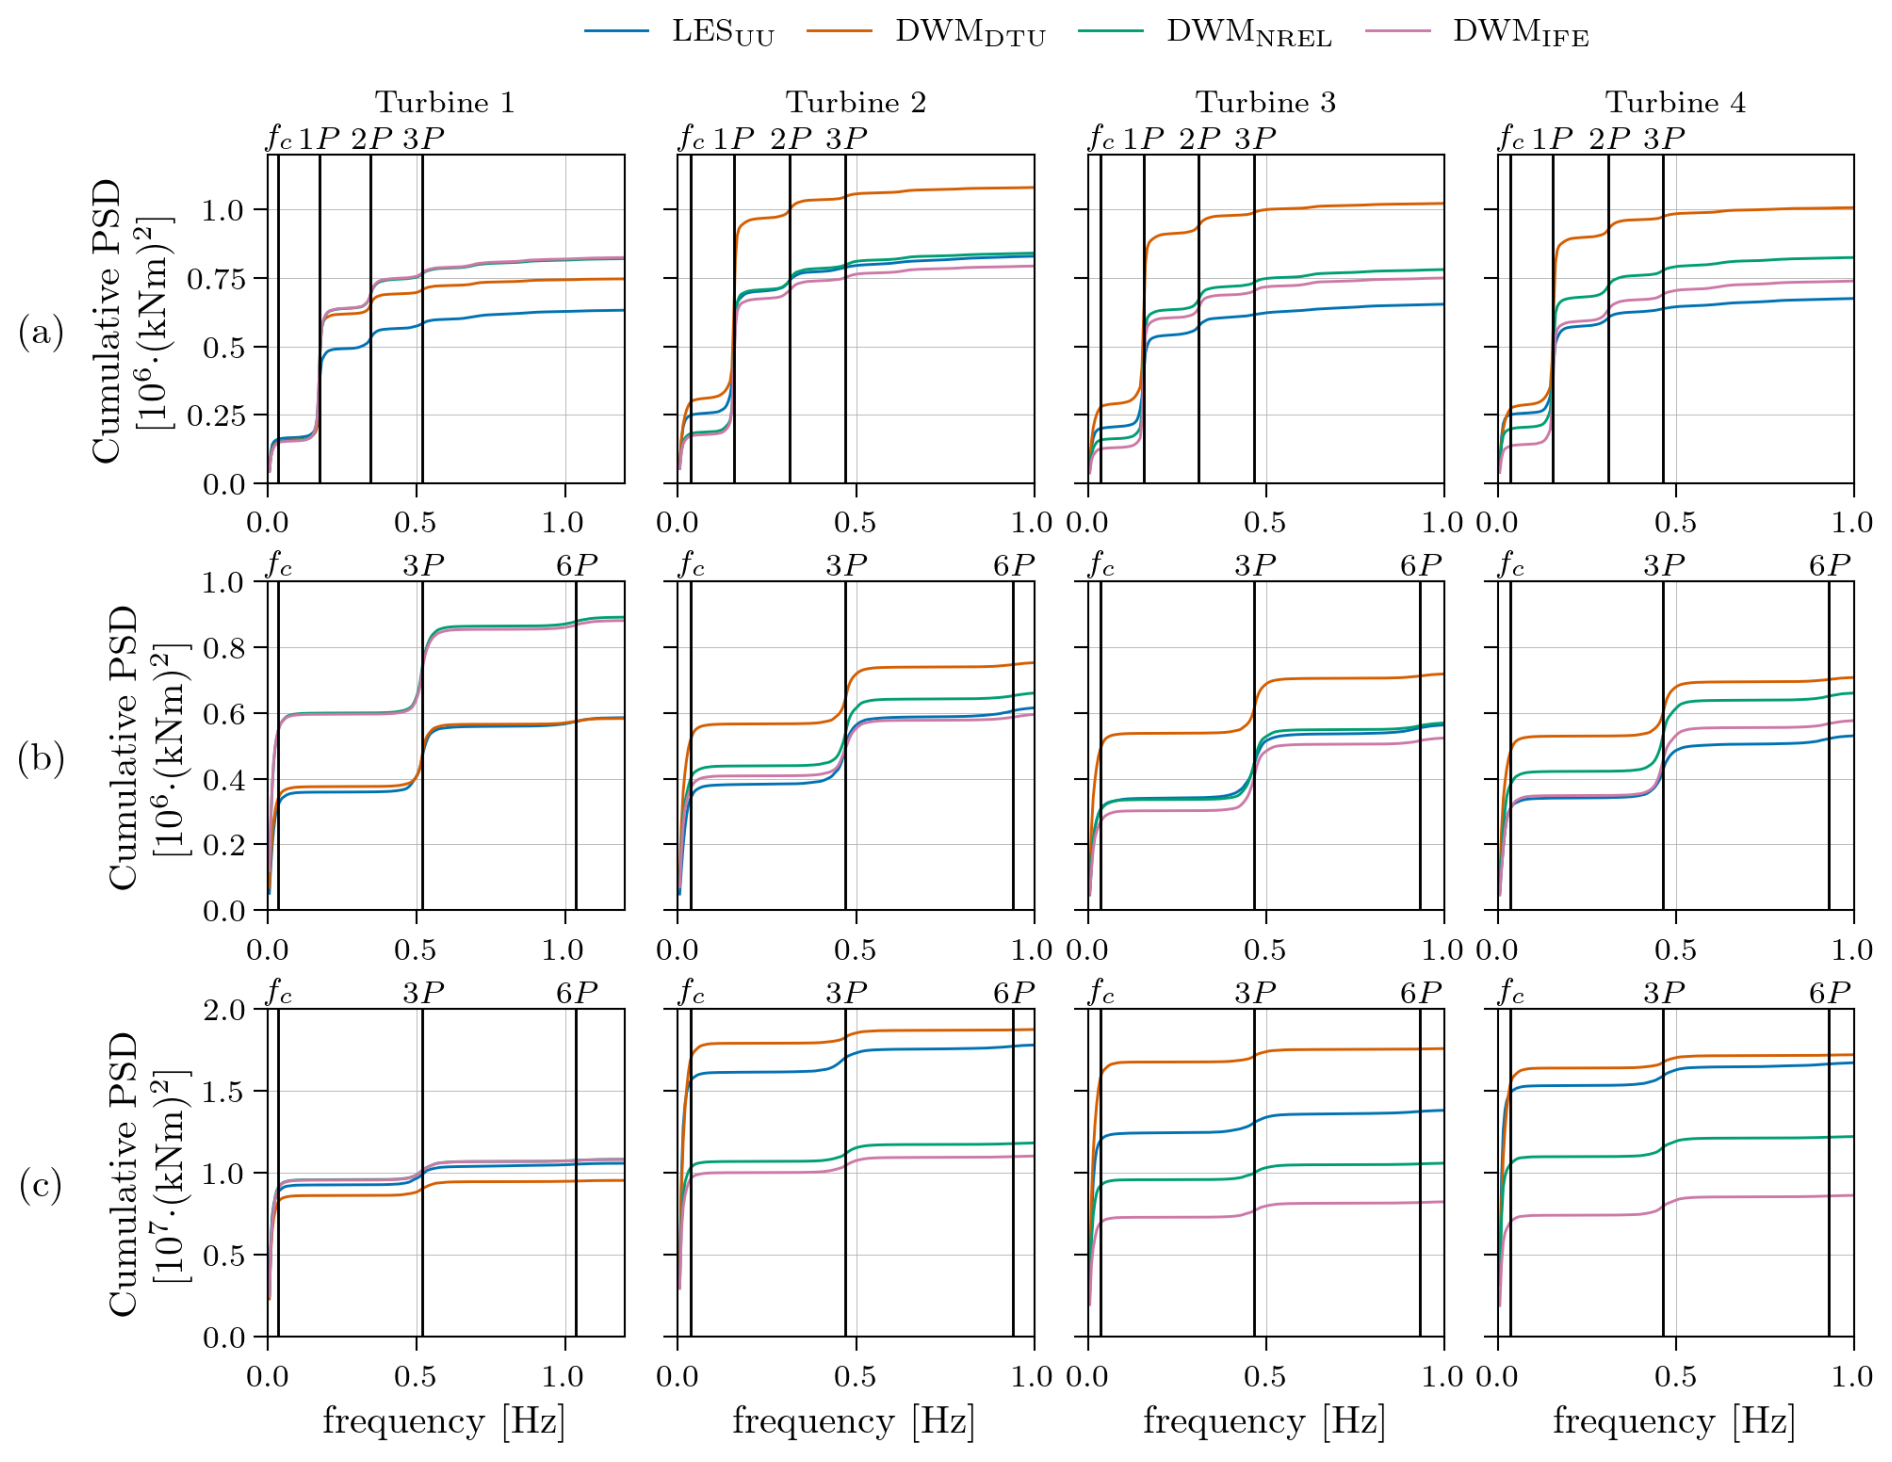
Figure 25Energy spectra of (a) blade-root flapwise bending moment, (b) tower-top yaw moment, and (c) tower-base fore–aft bending moment for the partially waked case (5° inflow angle) with medium ambient turbulence (TIa = 8.8 %).
The PSDs of the loads presented in Fig. 25 show that DWMDTU predicts more energy below fc for Turbines 2–4 than the other models, as was also seen in the fully waked case. However, in the fully waked case, LESUU showed no significant change in energy below fc along the turbine row, whereas here LESUU does exhibit an increase in low-frequency energy from Turbine 1 to the waked turbines for both the blade-root flapwise and the tower-base fore–aft bending moments.
The blade-root flapwise bending moment spectra in Fig. 25a show that the DWM models estimate more energy at the 1P frequency and its harmonics than LESUU for all turbines, which is likely the main cause of the higher DELs estimated by the DWM models. As in the fully waked case, the levels of energy at the 1P frequency correspond well with the blade-force variation amplitudes seen in Fig. 23 for all models except DWMDTU. Again, DWMDTU does not show a direct relationship between 1P energy and blade-force variation amplitude: it predicts a larger increase in 1P energy from Turbine 1 to the waked turbines than the blade-force variation amplitude indicates.
In the frequency spectra of tower-top yaw moments in Fig. 25b, LESUU shows no significant change in energy below fc between the turbines, while the small decrease in 3P energy along the turbine row coincides well with the change in DELs. DWMNREL and DWMIFE show a significant decrease in energy below fc for the turbines operating under waked conditions, which, together with a decrease in energy at 3P frequency, reduce the tower-top yaw moment DELs. Finally, DWMDTU shows nearly constant DELs as a result of increased energy below fc and decreased energy at 3P frequency for the waked turbines compared to Turbine 1.
For the tower-base fore–aft bending moment, DWMNREL and DWMIFE show DEL trends that correlate with the energy at 3P frequency, whereas for LESUU and DWMDTU, changes in energy below fc dominate the DEL evolution along the turbine row.
The comparative evaluation of the three DWM-based wake models against LES reveals generally good agreement in overall wake evolution and turbine performance trends, with notable discrepancies in specific wake features and load predictions.
4.1 Wake modelling
All three DWM models capture the qualitative shape and decay of the wake deficits along the turbine row, but there are systematic differences in deficit magnitude and shape when compared to LES. Immediately downstream of the first turbine, the DWMDTU model produces a more pronounced near-wake profile than observed in the LES, whereas DWMNREL tends to produce a deficit that is more developed towards a Gaussian profile. For the turbines operating under waked conditions, LESUU already shows a Gaussian-like velocity profile at x = 2.5 D. This is likely due to added turbulence in the turbine wakes, which increases the turbulence levels experienced by downstream turbines and enhances wake recovery through faster mixing. Neither DWMDTU nor DWMNREL capture this increase in wake recovery rate between Turbine 1 and the downstream turbines operating under waked conditions. Interestingly, DWMIFE's Gaussian profile therefore tends to outperform the other DWM models in the near-wake region of the waked turbines. Although DWMDTU includes a wake-added turbulence model, it is only applied in the aeroelastic solver and does not influence wake development. Consequently, increased wake recovery due to elevated downstream turbulence is not captured in the velocity field. The newly implemented wake-added turbulence model in DWMNREL couples wake-added turbulence with meandering (Branlard et al., 2024). Although it was not applied in this study, it may improve agreement in future comparisons. Nonetheless, both DWMDTU and DWMNREL exhibit faster wake recovery at higher ambient turbulence, as expected.
In the far-wake regions for the aligned case (e.g. xt=i = 5 D, ), DWMDTU generally overestimates the centreline deficit slightly, while DWMIFE slightly underestimates it. DWMNREL falls in between and is often closest to LESUU in these regions. However, for the partial wake case, DWMDTU appears to match LESUU most closely. The DWMDTU model uses a superposition method in which, under below-rated conditions, the velocity deficit at each point is taken as the largest deficit among all individual meandering wakes of upstream turbines. In contrast, DWMNREL and DWMIFE incorporate wake summation schemes in which all upstream wakes, calculated sequentially down the row, contribute to the total flow field to varying extents. While DWMNREL does not capture the evolution of the flow field along the turbine row significantly better than DWMDTU, DWMIFE shows improved accuracy in the wake periphery, where the LESUU deficit build-up is substantial. The accumulation of turbulence intensity along the turbine row in the DWMIFE model, which affects its eddy-viscosity closure, may also contribute to the differences observed relative to the other DWM models. However, DWMIFE's performance degrades at higher ambient turbulence, suggesting that the term in its eddy-viscosity model related to ambient wind shear scaling with turbulence intensity should be calibrated.
Vertical velocity profiles play a critical role in load predictions as they affect the azimuthal variation in the inflow felt by turbine blades, directly influencing blade 1P loading. Rotor tilt induces an upward wake deflection, which is captured by LESUU and by DWMNREL (the only DWM model that incorporates tilt) but not by DWMDTU or DWMIFE. Notably, LESUU predicts even greater upward deflections than DWMNREL. This deflection increases with downstream distance and occurs even in the low-turbulence case without any rotor tilt. Greater horizontal deflections of the wake positions are also observed in the LESUU results. This suggests that wake rotation and tip vortex effects, which are not accounted for in current DWM formulations, cause additional deflections. The curled-wake extension to DWMNREL (Branlard et al., 2023), which was not used in the present simulations, could potentially help reduce these discrepancies.
The box plots of wake centre positions show that the predicted meandering levels for the first turbine in the row agree well among all DWM models and LESUU. Wake meandering is consistently stronger in the horizontal direction than the vertical across all models, consistent with the fact that large-scale vertical turbulence energy is lower than large-scale lateral turbulence energy for conventional flat-terrain conditions. However, the downstream growth of meandering amplitude is underrepresented: while LESUU shows a 50 % increase from Turbine 1 to 2 (with continued growth beyond), the DWM models maintain nearly constant meandering levels. This discrepancy may result from the models' reliance on the same ambient turbulence field for all wakes, without accounting for the additional turbulence from upstream wakes, which leads to underprediction of wake spreading in deep turbine arrays. Hanssen-Bauer et al. (2023) suggest that this could be addressed by coupling the wake-added turbulence model with the meandering routine so that both ambient and wake-added turbulence contribute to wake motion. In fact, the new wake-added turbulence model in DWMNREL (Branlard et al., 2024) implements this approach. However, if wake-added turbulence does significantly contribute to wake meandering, it is in conflict with the traditional DWM assumption that meandering is driven only by large-scale turbulence while wake-added turbulence captures smaller scales. Nevertheless, important future work is to check this assumption by testing the new DWMNREL wake-added turbulence model.
As shown in the σu profiles (Figs. 4–6 and 20), the wake-added turbulence model in DWMDTU clearly improves its turbulence predictions. DWMNREL and DWMIFE, lacking such a scheme, significantly underpredict σu in the turbine wakes across all cases. The influence of wake turbulence on the flow field is evident in snapshots of instantaneous velocity profiles. In the low-ambient-turbulence case in Fig. A1, DWMNREL and DWMIFE show relatively smooth wake profiles, whereas LESUU and DWMDTU produce more turbulent profiles. In the high-ambient-turbulence case shown in Fig. A2, the wakes do not dominate the flow field as much due to the already high background turbulence, and differences between the models are less pronounced.
Even with a wake-added turbulence model, DWMDTU still shows discrepancies relative to LESUU. These may partly stem from differences in wake shape that influence the added turbulence via the velocity gradient input. Furthermore, DWMDTU clearly lacks a model for turbulence build-up along the turbine row, especially evident in the low-ambient-turbulence case. Here LESUU shows increasing σu along the row even as the mean deficit and velocity gradients decrease, which contradicts the wake-added turbulence formulation in Eq. (7). A possible reformulation of the current wake-added turbulence approach could be to treat Eq. (7) as a source term (which it is) and then combine it with an accumulation term and a decay term. The DWM modelling improvements by Keck et al. (2015) should also be considered as they account for the impact of ambient vertical wind shear on eddy viscosity and model the build-up of wake-added turbulence. Comparisons with ALM simulations show that including these improvements can reduce turbulence intensity deviations by up to 40 % by the eighth turbine in a row (Keck et al., 2015).
4.2 Power and thrust predictions
Despite differences in flow details, all three DWM-based models reproduce the general trends in time-averaged turbine power and thrust observed in the LES benchmark, staying within 5 %–10 % of the LES results. Surprisingly, while the DWM models show good agreement in power prediction for Turbine 1 where the inflow is identical for all models, LESUU consistently predicts about 10 % higher power output. This discrepancy arises because LESUU predicts higher tangential forces in the middle sections of the blades compared to the DWM models, likely due to differences in the turbine aerodynamic models, as discussed in Sect. 3.1.4. If this turbine–model discrepancy is consistent across all wind speeds, its impact can be adjusted by normalizing all turbine powers by the power of Turbine 1, as shown in Fig. 26 (see Appendix B for further discussion of this approach's validity). With this normalization, LESUU's power output generally aligns well with DWMNREL for all turbines, while DWMDTU and especially DWMIFE typically overestimate the power for Turbines 2–4. The exception is the partially waked case with a 5° inflow angle relative to the turbine row, which reveals the consequence of the DWM models failing to capture the significant velocity-deficit build-up outside the rotor span. In LESUU, this build-up causes a drop in power from Turbine 3 to 4 that is not captured by the DWM models. For Turbine 4, LESUU estimates the power to be 17 %–18 % lower than in the DWM models. This highlights the importance of accurately predicting wake spreading, particularly under real-world conditions where perfect alignment is rare. Failing to capture wake spreading can lead to a non-negligible overestimation of a wind farm's annual energy production. In this regard, the momentum-conserving superposition method applied in DWMIFE is a promising approach, as it produces greater wake spreading and a more accurate increase in the off-rotor-span deficit, particularly in the low-ambient-turbulence case. However, the generally poor performance of this DWM implementation in estimating wake-deficit strength for the medium- and high-ambient-turbulence cases prevents us from seeing the full potential of the momentum-conserving summation method in the partially waked scenario.
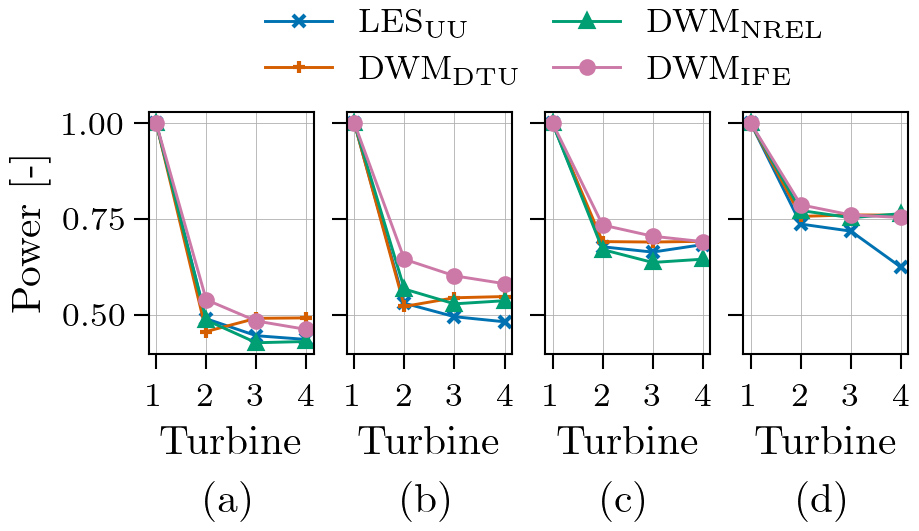
Figure 26Mean power for the aligned-incoming-wind case with (a) low (TIa = 4.6 %), (b) medium (TIa = 8.8 %), and (c) high (TIa = 12 %) ambient turbulence and (d) for the partially waked case (5° inflow angle) with medium ambient turbulence (TIa = 8.8 %). For each model, the power outputs are normalized by the power of Turbine 1.
4.3 Fatigue-load predictions
Fatigue-load predictions represent the area of greatest divergence between the DWM and LES results, underscoring the challenges of modelling wake-induced unsteady inflow conditions and their structural consequences. While all three DWM models are able to reproduce the general trends in time-averaged loads (e.g. mean blade forces and mean thrust), their predictions of DELs vary substantially. The deviations are the largest for the turbines operating under waked conditions, though differences are also evident for Turbine 1, which likely originate from differences in the aeroelastic solvers. As with power, the influence of the aeroelastic solver can be limited by normalizing all turbine DELs by the DEL of Turbine 1 (see Appendix B for a discussion of this approach's validity). The resulting normalized DELs for the blade-root flapwise bending moment and the tower-base fore–aft bending moment are shown in Figs. 27 and 28, respectively. Even though the normalization reduces the spread between the models slightly, the overall picture is the same. For the low-ambient-turbulence case, the DWM models tend to estimate lower blade loads and especially lower tower loads for the waked turbines compared to LES. For this case, DWMDTU is closest to LESUU in terms of DEL magnitude and its development along the turbine row. For higher ambient turbulence, the deviations between DWM and LESUU are smaller. The DWM models predict a larger increase in DELs with rising ambient turbulence compared to LESUU. Consequently, in the high-ambient-turbulence case, the DWM models, and especially DWMDTU, predict higher DELs than LESUU, particularly for blade loads.
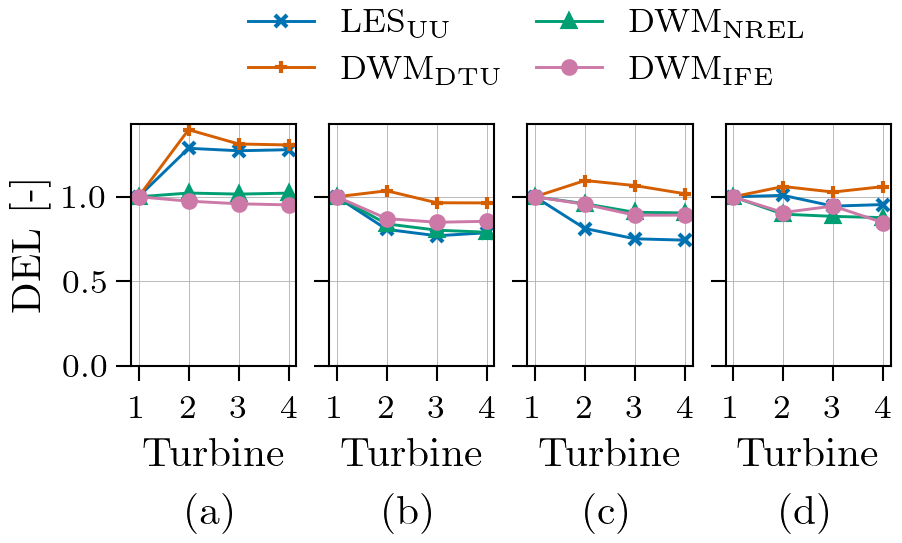
Figure 27Fatigue of blade-root flapwise bending moment for the aligned-incoming-wind case with ambient turbulence of (a) TIa = 4.6 %, (b) TIa = 8.8 %, and (c) TIa = 12 % and (d) for the partially waked case (5° inflow angle) with medium ambient turbulence (TIa = 8.8 %). For each model, the DELs are normalized by the DEL of Turbine 1.
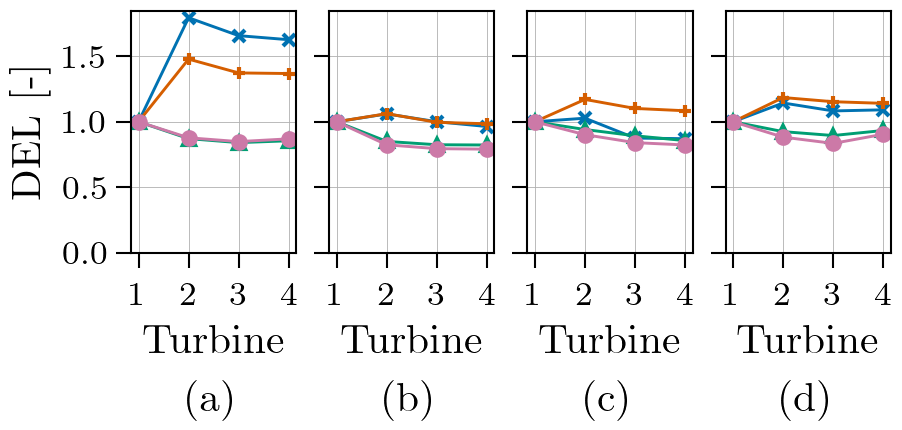
Figure 28Fatigue of tower-base fore–aft bending moment for the aligned-incoming-wind case with ambient turbulence of (a) TIa = 4.6 %, (b) TIa = 8.8 %, and (c) TIa = 12 % and (d) for the partially waked case (5° inflow angle) with medium ambient turbulence (TIa = 8.8 %). For each model, the DELs are normalized by the DEL of Turbine 1. For legend, see Fig. 27.
Spectral analysis reveals that all DWM models tend to overestimate the energy content at the 1P frequency for the blade loads. This is related to higher azimuthal blade-force variations predicted by the DWM models, which is a direct consequence of the shapes of their predicted wake velocity profiles. However, for some models, especially DWMDTU, the azimuthal blade-force variations seen in Figs. 12, 13, and 23 do not scale with the energy at the 1P frequency as expected. As explained in Hanssen-Bauer et al. (2023), this mismatch likely comes from a wake meandering effect. When an upstream wake meanders, it moves normal to the wind direction. This causes additional velocity gradients when a wake only partially covers a downstream turbines' rotor area. These partially waked conditions, caused by wake meandering, last for several blade rotations since the meandering motion is slower than the blade rotation (fc<1P). The effect is to a large extent not visible in the blade-force variation plots because the forces are averaged in each azimuthal bin over the entire simulation. However, wake centre position plots show that DWMDTU does not predict higher meandering levels than the other models. Still, the load spectra for DWMDTU clearly show a significant increase in energy at low frequencies (associated with meandering) for the waked turbines relative to Turbine 1. This behaviour is not seen in the other models and suggests that in DWMDTU, meandering affects the loads more strongly than in the other models, possibly because DWMDTU produces more distinct deficits with sharper radial gradients.
Consistent with findings for above-rated conditions by Hanssen-Bauer et al. (2023), we find that all DWM models tend to underestimate fatigue loading on downstream turbines, especially on the tower, if important turbulence-generation mechanisms are neglected. In the present below-rated cases, the DWMDTU model with its wake-added turbulence model is the only DWM implementation that roughly captures the increased fatigue damage on the turbines exposed to upstream wakes relative to Turbine 1 in the low-ambient-turbulence case. However, the magnitude of the increase in tower loads remains underpredicted. For higher ambient turbulence, the trend is less clear. For blade loads, LESUU shows a decrease in DELs along the turbine row, whereas DWMDTU still predicts an increase from Turbine 1 to 2. This inconsistency appears to stem from different mechanisms causing the increased DELs in DWMDTU versus LESUU for the waked turbines. In LESUU, the high-frequency content of the load spectra is elevated, likely due to the higher small-scale turbulence in the wake. This effect is most pronounced in the low-ambient-turbulence case, since the relative increase in small-scale turbulence is greatest. DWMDTU, by contrast, seems to affect the loads more indirectly via wake meandering, as described in the previous paragraph. Wake-added turbulence could also play a role, as it might cause the meandering wakes with enhanced turbulence to have a greater effect on loads when they move in and out of the rotor-swept area. At higher ambient turbulence levels, the wake-added turbulence appears to play a smaller role in the fatigue-loading development along the turbine row in LESUU, while for DWMDTU the enhanced meandering effect on loading continues to dominate.
Another important factor explaining the divergence between the DWM and LES fatigue results is the fact that the DWM models assume axisymmetric wakes that meander, whereas the instantaneous LES wakes can be highly asymmetric and only approximately axisymmetric on average. This difference is clearly illustrated by the snapshots of instantaneous velocity profiles for the low-ambient-turbulence case in Fig. A1. While for the DWM models the shapes of the instantaneous wake deficits can be recognized from the time-averaged ones in Fig. 1 for all turbines in the row, the LES wakes differ much more in shape. This asymmetry in the LESUU flow is an important driver of loads, especially in the low-ambient-turbulence case, and appears as energy at higher harmonics of the blade rotational frequency, i.e. 2P, 3P, etc. for blade loads and 3P, 6P, etc. for tower loads. This phenomenon contributes to the DWM models' underprediction of loads. It aligns with the findings of Bernard et al. (2024), who investigated loads on a turbine under low-turbulence offshore conditions. Here the traditional DWM models with axisymmetric wake deficits also failed to capture the increased higher-harmonic content in the tower-top load spectra under waked conditions compared to free-inflow conditions. However, when a wake-distortion component was added to produce a non-axisymmetric wake in the DWM model, it showed better agreement with the measured load spectra and DELs.
An interesting observation is that LESUU showed no significant change in energy below fc for the fully waked case but estimates increased energy below fc from Turbine 1 to Turbines 2–4 in the partially waked case. This was seen for the blade-root flapwise bending moment and tower-base fore–aft bending moment but not for the tower-top yaw moment. For Turbines 2–4 in the partially waked conditions, the upstream neighbours are not directly ahead but offset laterally. As a result, lateral meandering relatively often moves the wake entirely away from the downstream turbine. This causes large fluctuations in blade-root and tower fore–aft moments on the meandering timescale (f<fc).
Overall, all DWM models struggle to capture the full range and correct intensity of wake-driven loading observed in LES. A better representation of turbulence evolution and its interaction with wake dynamics is crucial for improving fatigue-load predictions in DWM frameworks.
4.4 Limitations of the present study
While the comparative analysis provides valuable insights into the performance of DWM-based wake models, several limitations of the present study must be acknowledged.
First, all simulations were conducted at a single below-rated wind speed with the turbines operating at fixed RPM and pitch. This constrains the generalizability of the findings to other operational regimes, particularly near rated or cut-out wind speeds, where aerodynamic and control responses differ significantly. At higher wind speeds, turbine control strategies, such as blade pitch and generator torque regulation, may alter wake characteristics and structural responses in ways not captured in this study.
Second, the inflow conditions in both the LES and the DWM simulations assume a neutral atmospheric boundary layer over homogeneous terrain, without thermal stratification. In reality, wind farms operate under more complex atmospheric conditions, including stable and unstable stratification, wind veer, and heterogeneous surface roughness. These factors influence turbulence intensity, wake deflection, and recovery and may lead to larger discrepancies between engineering-fidelity models and field measurements.
Third, the modelled wind farm layout consists of a single row of four identical turbines with uniform spacing. While this configuration provides a controlled environment for model comparison, it lacks the complexity of real-world wind farms, where turbines are arranged in staggered rows or irregular layouts and are subject to multi-directional wake interactions. Moreover, the only non-aligned inflow condition tested involved a modest 5° offset, which is small relative to real-world offsets caused by wind-direction variability or wake-steering control strategies. Larger inflow angles, including turbine yaw misalignments, could lead to more complex wake dynamics that challenge current DWM formulations.
Fourth, the simulation durations were finite, so some load and flow statistics may be affected by sampling limitations (Liew and Larsen, 2022).
Fifth, validation against field measurements was not part of this study. While high-fidelity LES-ALM provides a physically consistent, high-resolution reference, these simulations do not necessarily reflect one-to-one full-scale measurements (Asmuth et al., 2022; Sood et al., 2022). The actuator-line method used in the LES model – though widely accepted as a high-fidelity approach – introduces its own approximations. The method represents blades as line forces rather than resolving blade-resolved flow features, which limits its accuracy in modelling near-wake vorticity, dynamic stall, and fine-scale unsteadiness. The lack of an elastic turbine model also means that structural eigenmodes are not captured, which is particularly important for tower dynamics. Comparing model predictions against full-scale SCADA, lidar, and strain data would further strengthen the conclusions and reveal model limitations under real operational conditions.
Finally, the present comparison evaluates each DWM framework as a complete modelling system. Because several sub-models (e.g. wake-deficit formulations, wake summation methods, meandering methods, and turbulence treatments) differ between implementations, differences in results cannot be attributed to any single modelling choice. As a consequence, some interpretations of the causes behind model discrepancies remain qualitative. The present intercomparison reflects the combined effects of multiple sub-model differences. A more rigorous assessment would require controlled sensitivity studies where individual sub-models are varied or exchanged within a single framework to isolate their influence.
Future work should address these limitations by considering a broader range of operating conditions, including variable atmospheric stability and wind shear, and by evaluating model performance in more complex wind farm layouts. In addition, controlled sensitivity studies should be carried out to further disentangle the contributions of each modelling choice. Furthermore, improved turbulence modelling – both related to wake-added turbulence in individual wakes and turbulence development across a wind farm related to turbulence build-up and increased meandering levels – remains a key area for development in DWM frameworks. Asymmetries in turbine wakes, both in the instantaneous wake deficit and in a time-averaged sense due to wake deflections, also appear to be important drivers of fatigue damage that are not captured by current DWM models. Ultimately, continued benchmarking against both LES and high-quality field data is essential to advance the reliability of engineering-fidelity wake models for design and certification.
This study presents a comprehensive comparison of three DWM-based wake models (the DTU, IFE, and NREL implementations) against high-fidelity LES for a row of four wind turbines operating under below-rated wind conditions. The main findings indicate that all three engineering-fidelity models capture the general wake evolution and turbine performance with reasonable accuracy in terms of mean values. Specifically, the time-averaged turbine thrust force and aerodynamic power outputs from the DWM models generally align with the LES benchmarks (often within 5 %–10 %), suggesting that the DWM framework is broadly reliable for estimating wind farm energy yield at below-rated wind speeds across various ambient turbulence intensities.
However, the DWM models still exhibit limitations in capturing the wake shape, unsteady wake dynamics, and cumulative downstream effects observed in LES, and each implementation shows distinct strengths and weaknesses. Accurate modelling of far-wake shape is particularly important, as it influences both power output and structural loads on downstream turbines. For instance, the pronounced deficit build-up observed in the peripheral regions of the LES wake may significantly affect power estimates under partially waked conditions. In this regard, the IFE model's wake superposition approach and treatment of turbulence build-up via an eddy viscosity formulation appear to outperform the other models under low-ambient-turbulence conditions. At higher ambient turbulence levels, however, the benefit of these improvements is veiled by the IFE model's underprediction of wake-deficit strength. A more extensive calibration of the IFE model may therefore be necessary to enhance its performance under such conditions. In contrast, the DTU and NREL implementations use the maximum-deficit operator and the local root-sum-square method, respectively, for wake summation. While these produce weaker wake expansion and less variation in incoming velocity among Turbines 2–4, they show better agreement with LES in terms of wake-deficit strength and resulting power predictions for turbines operating under fully waked conditions. The NREL model also captures the upward wake deflection for turbines with rotor tilt, although not to the same extent as observed in LES.
Of critical concern are the substantial discrepancies in fatigue-load predictions between the DWM models and LES. Under low-ambient-turbulence conditions, all DWM implementations tend to underpredict fatigue damage on downstream turbines (especially in tower loads), whereas under high ambient turbulence, they tend to overpredict fatigue loads. However, the DTU implementation, which includes a wake-added turbulence model, is generally the closest to LES in predicted fatigue-load levels and best captures the load variations along the turbine row. These findings highlight the importance of accurately representing the increased turbulence in turbine wakes – both spatial variation and spectral content – as well as the downstream progression of turbulence and wake meandering across the wind farm. The current study also confirms previous findings that DWM's underprediction of fatigue damage at low ambient turbulence is partly due to the assumption of an axisymmetric wake deficit, which prevents the model from capturing important asymmetric load effects on downstream turbines.
While DWM models strike a favourable balance between accuracy and computational cost, further refinements are needed to address the shortcomings identified in this study so that these models can support all aspects of wind farm design and certification with confidence. Future work should include continued development, calibration, and validation of DWM models against high-fidelity benchmarks and field measurements under a broader range of operating conditions and more complex farm layouts. Additionally, controlled sensitivity studies are recommended to isolate the contributions of each DWM sub-modelling choice. By addressing the identified shortcomings, future DWM-based models will be able to more accurately represent complex wake interactions, thereby improving predictions of both energy yield and structural loads in large wind farms.
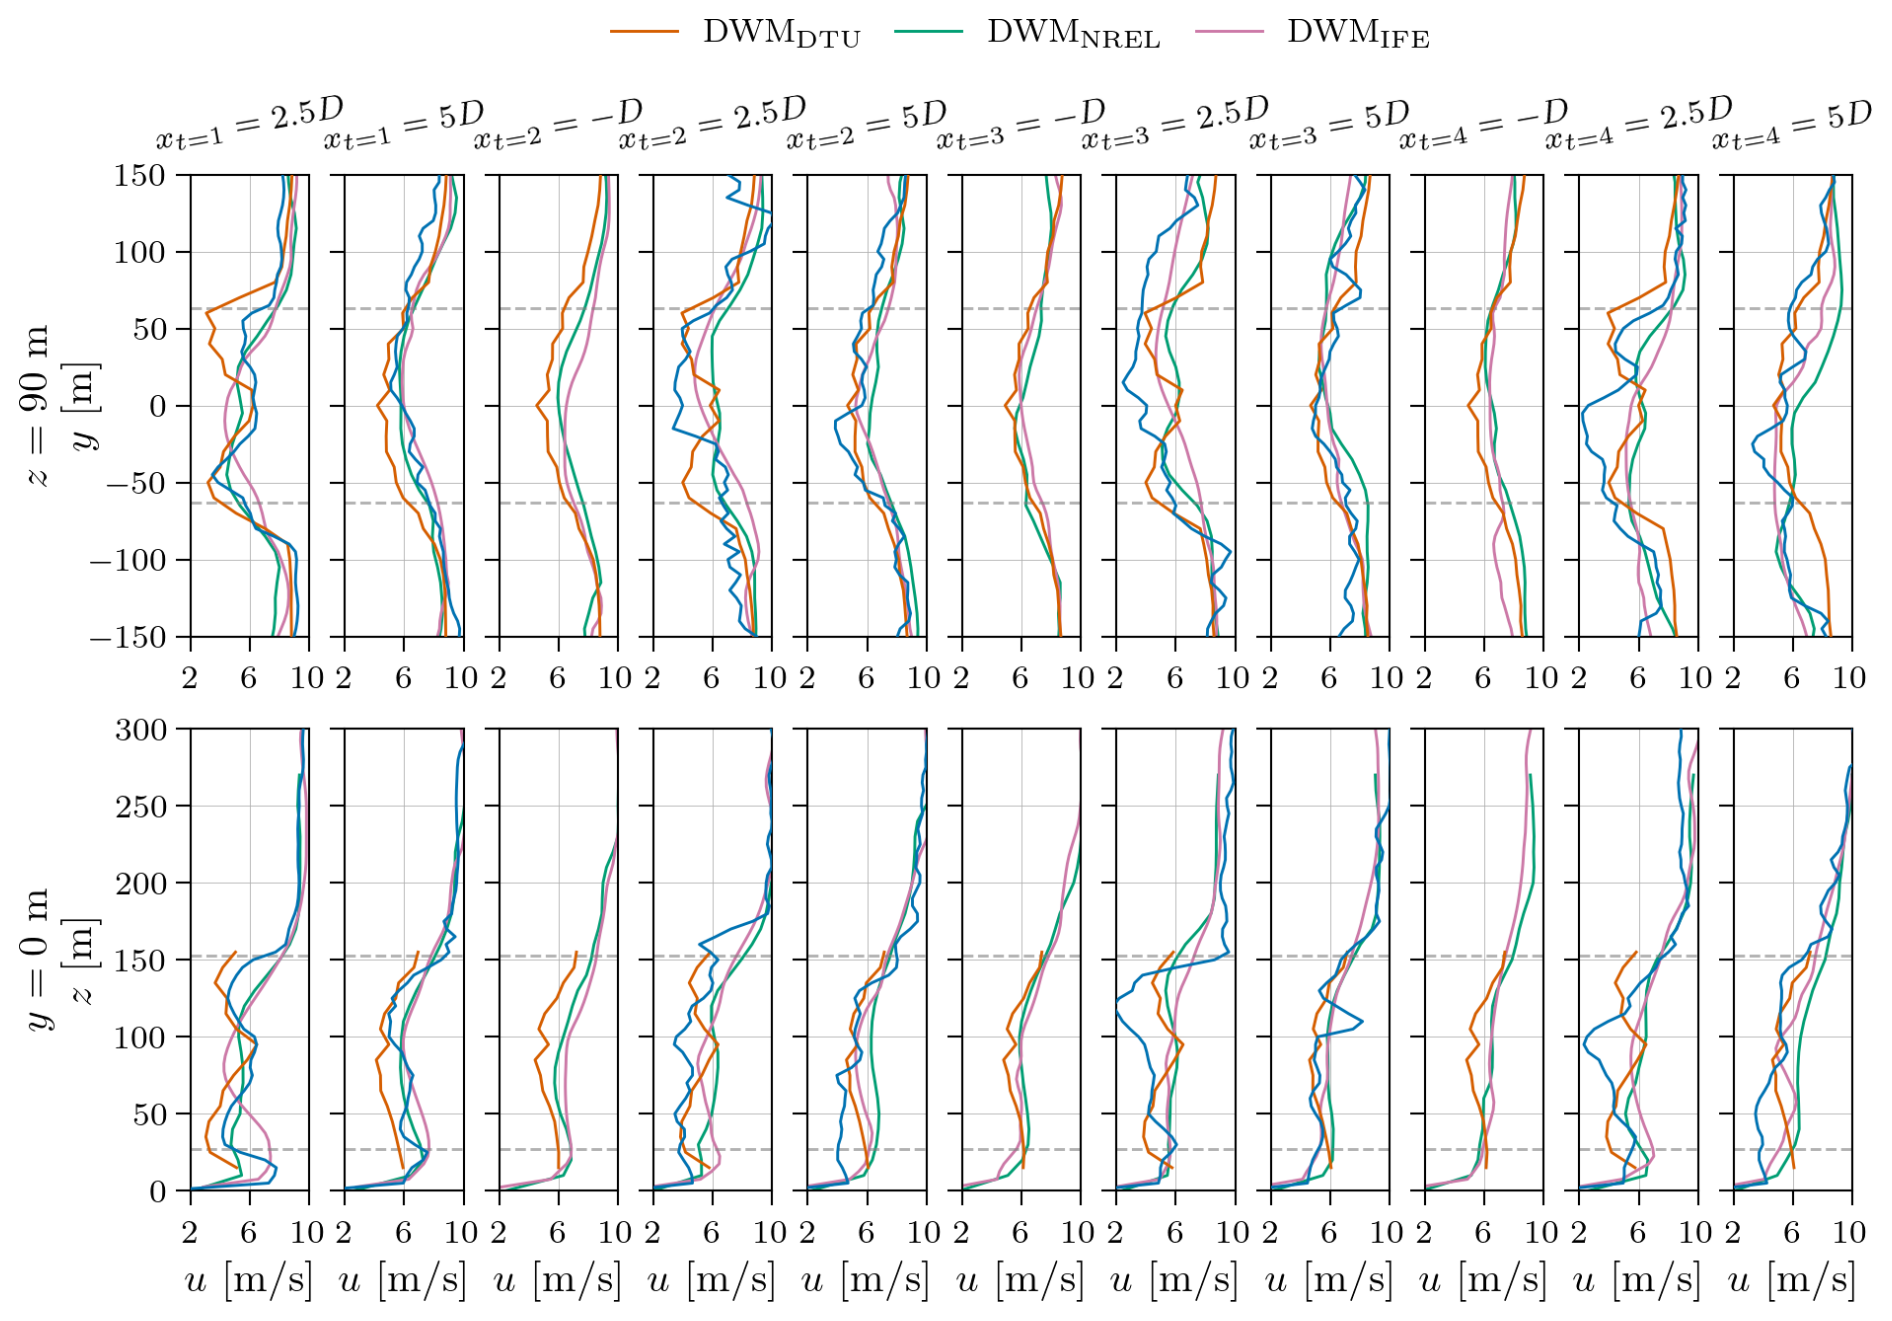
Figure A1Instantaneous velocity profiles at t = 100 s for the aligned-incoming-wind case with low ambient turbulence (TIa = 4.6 %). Horizontal dashed lines indicate the rotor-swept area. LESUU is missing at due to a lack of time-resolved data at this axial position.
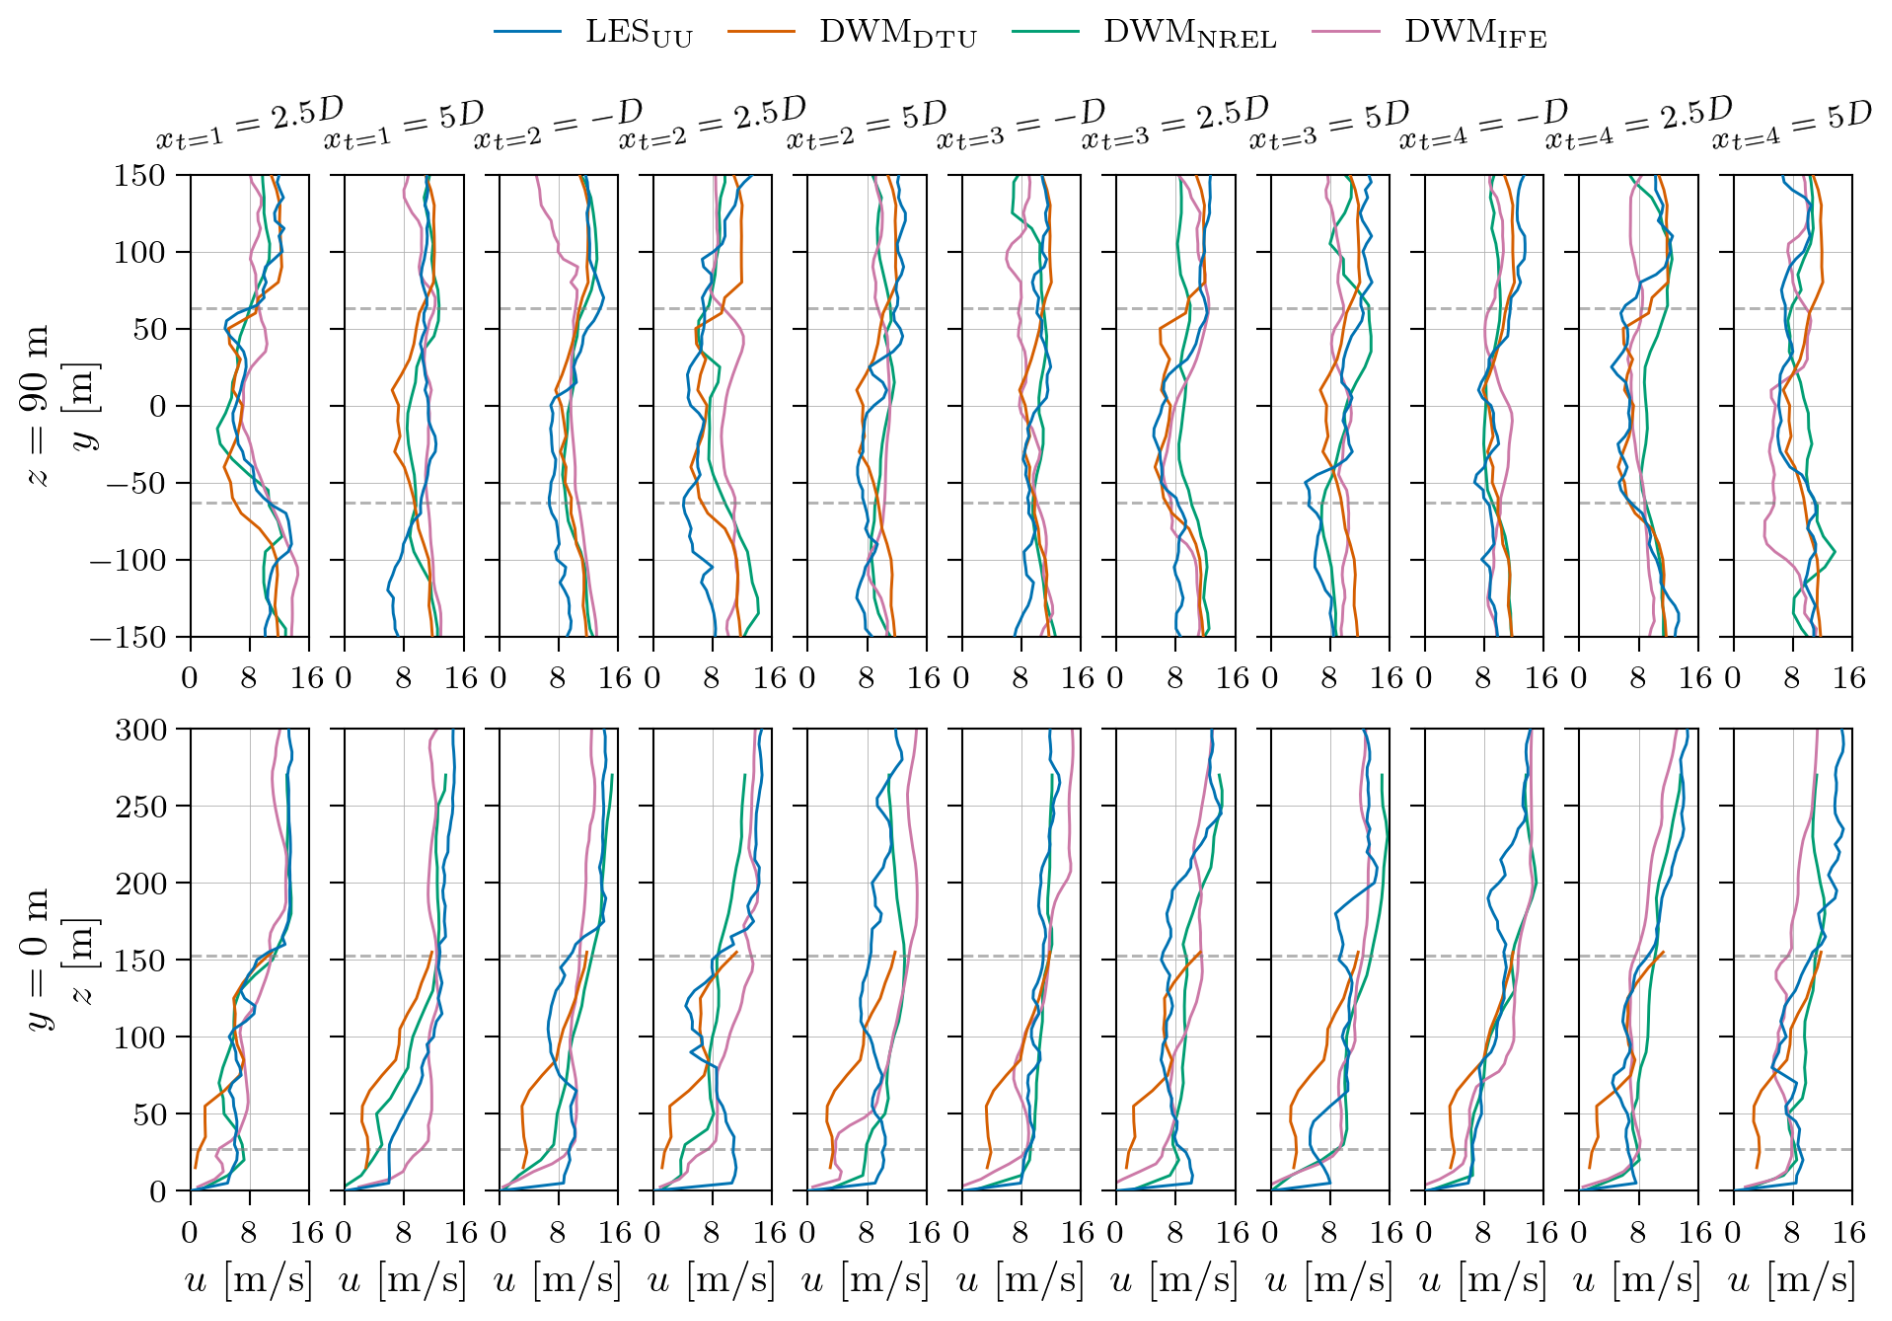
Figure A2Instantaneous velocity profiles at t = 100 s for the aligned-incoming-wind case with high ambient turbulence (TIa = 12.0 %). Horizontal dashed lines indicate the rotor-swept area.
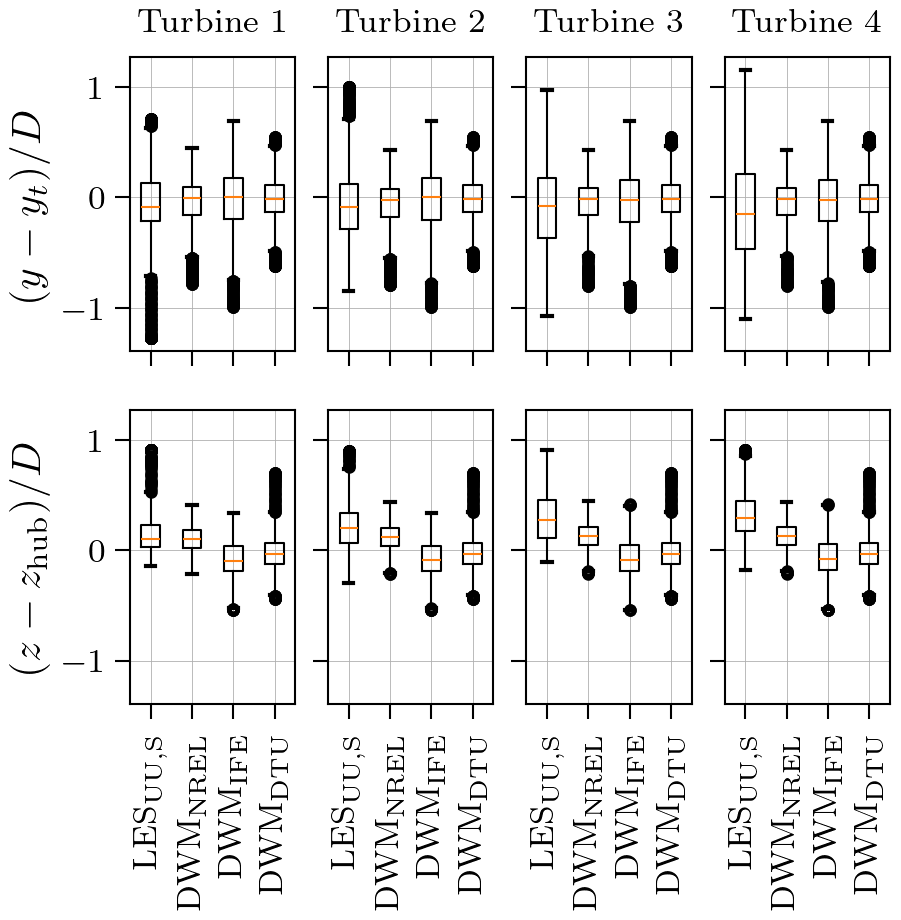
Figure A3Box plots of horizontal (upper row) and vertical (lower row) wake centre positions at x = 5 D behind the turbines for the aligned-incoming-wind case with medium ambient turbulence (TIa = 8.8 %).
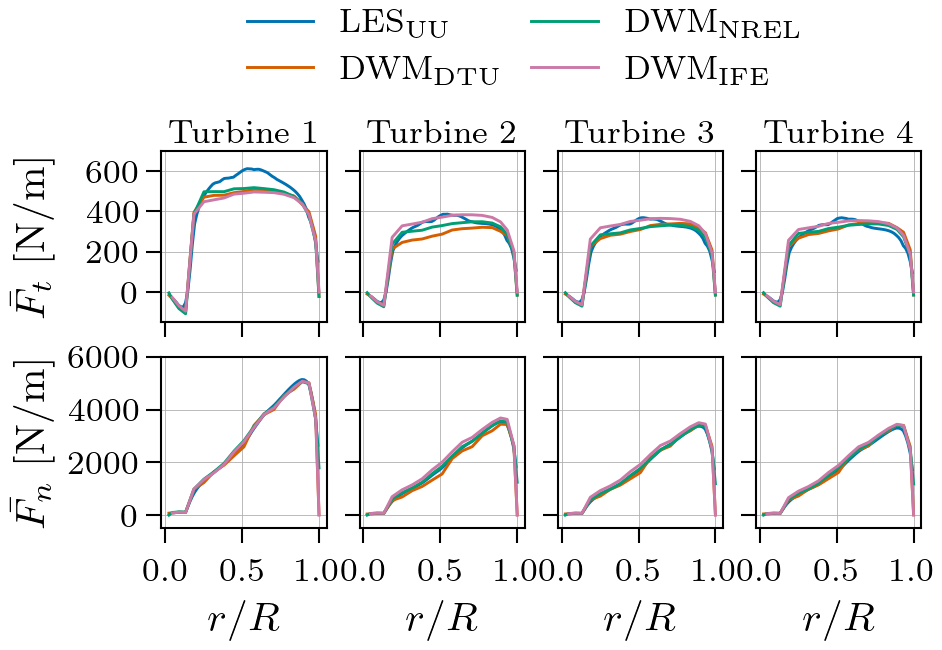
Figure A4Time-averaged blade force as a function of blade radius for the aligned-incoming-wind case with medium ambient turbulence (TIa = 8.8 %).
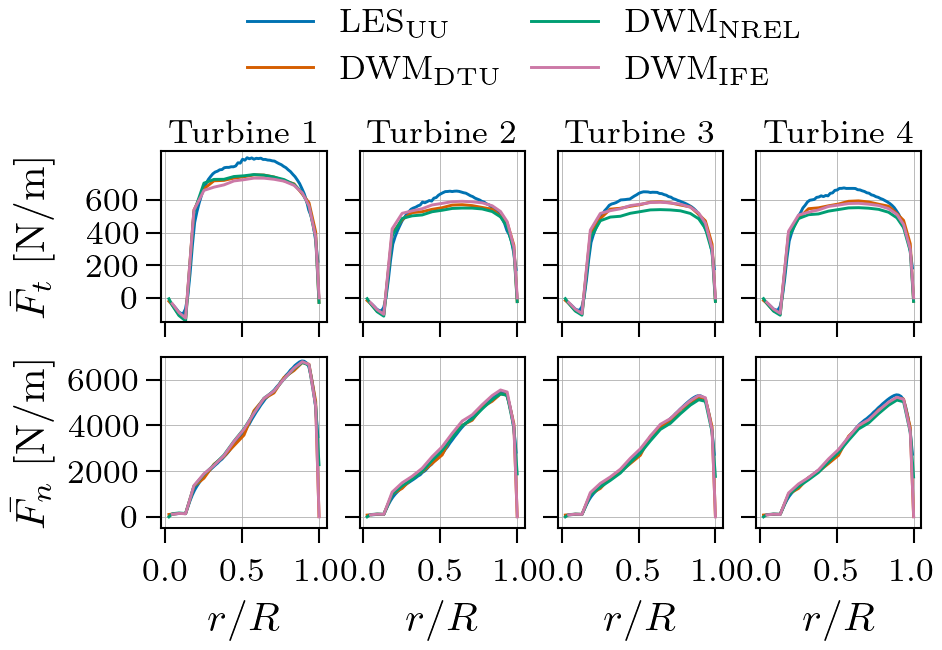
Figure A5Time-averaged blade force as a function of blade radius for the aligned-incoming-wind case with high ambient turbulence (TIa = 12 %).
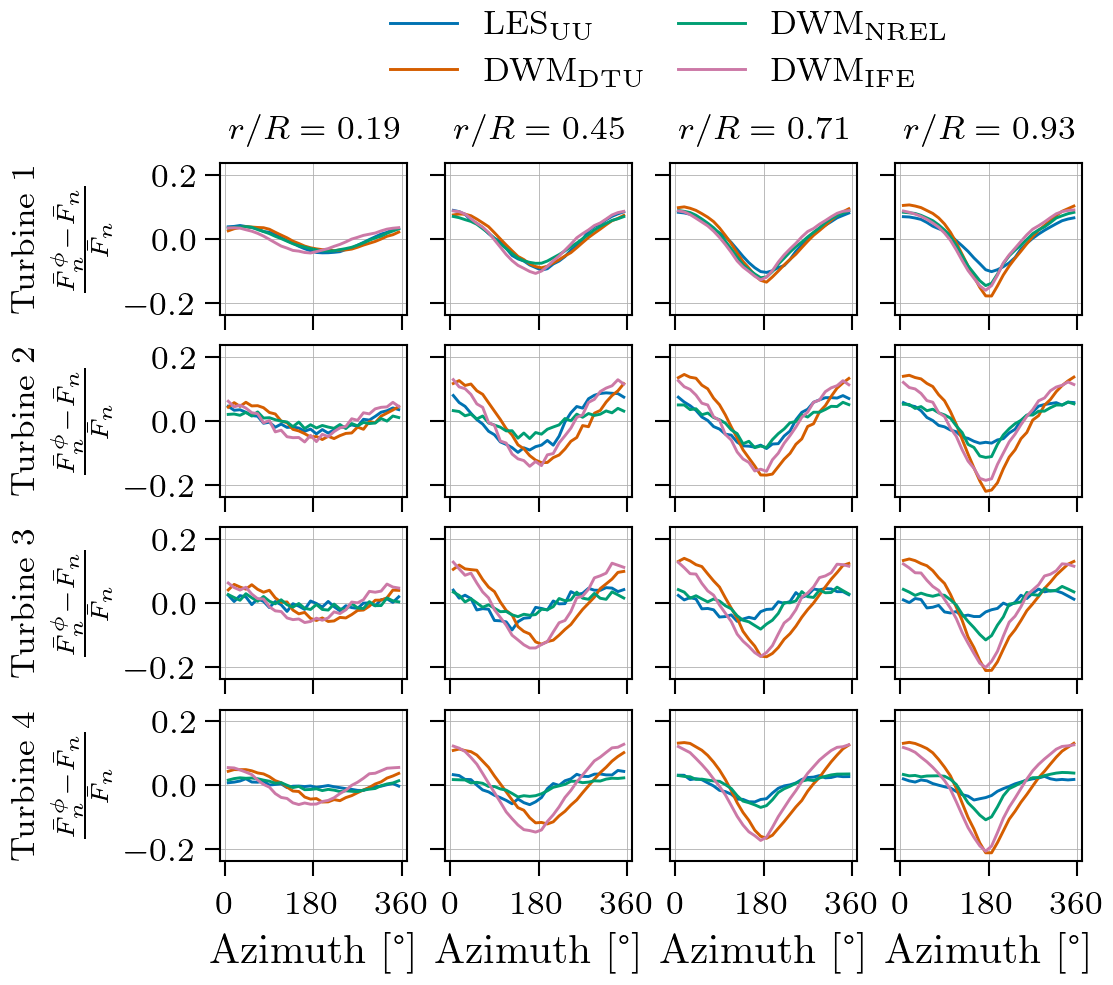
Figure A6Relative difference between mean normal blade force per azimuthal bin and total normal force for TIa = 8.8 %.
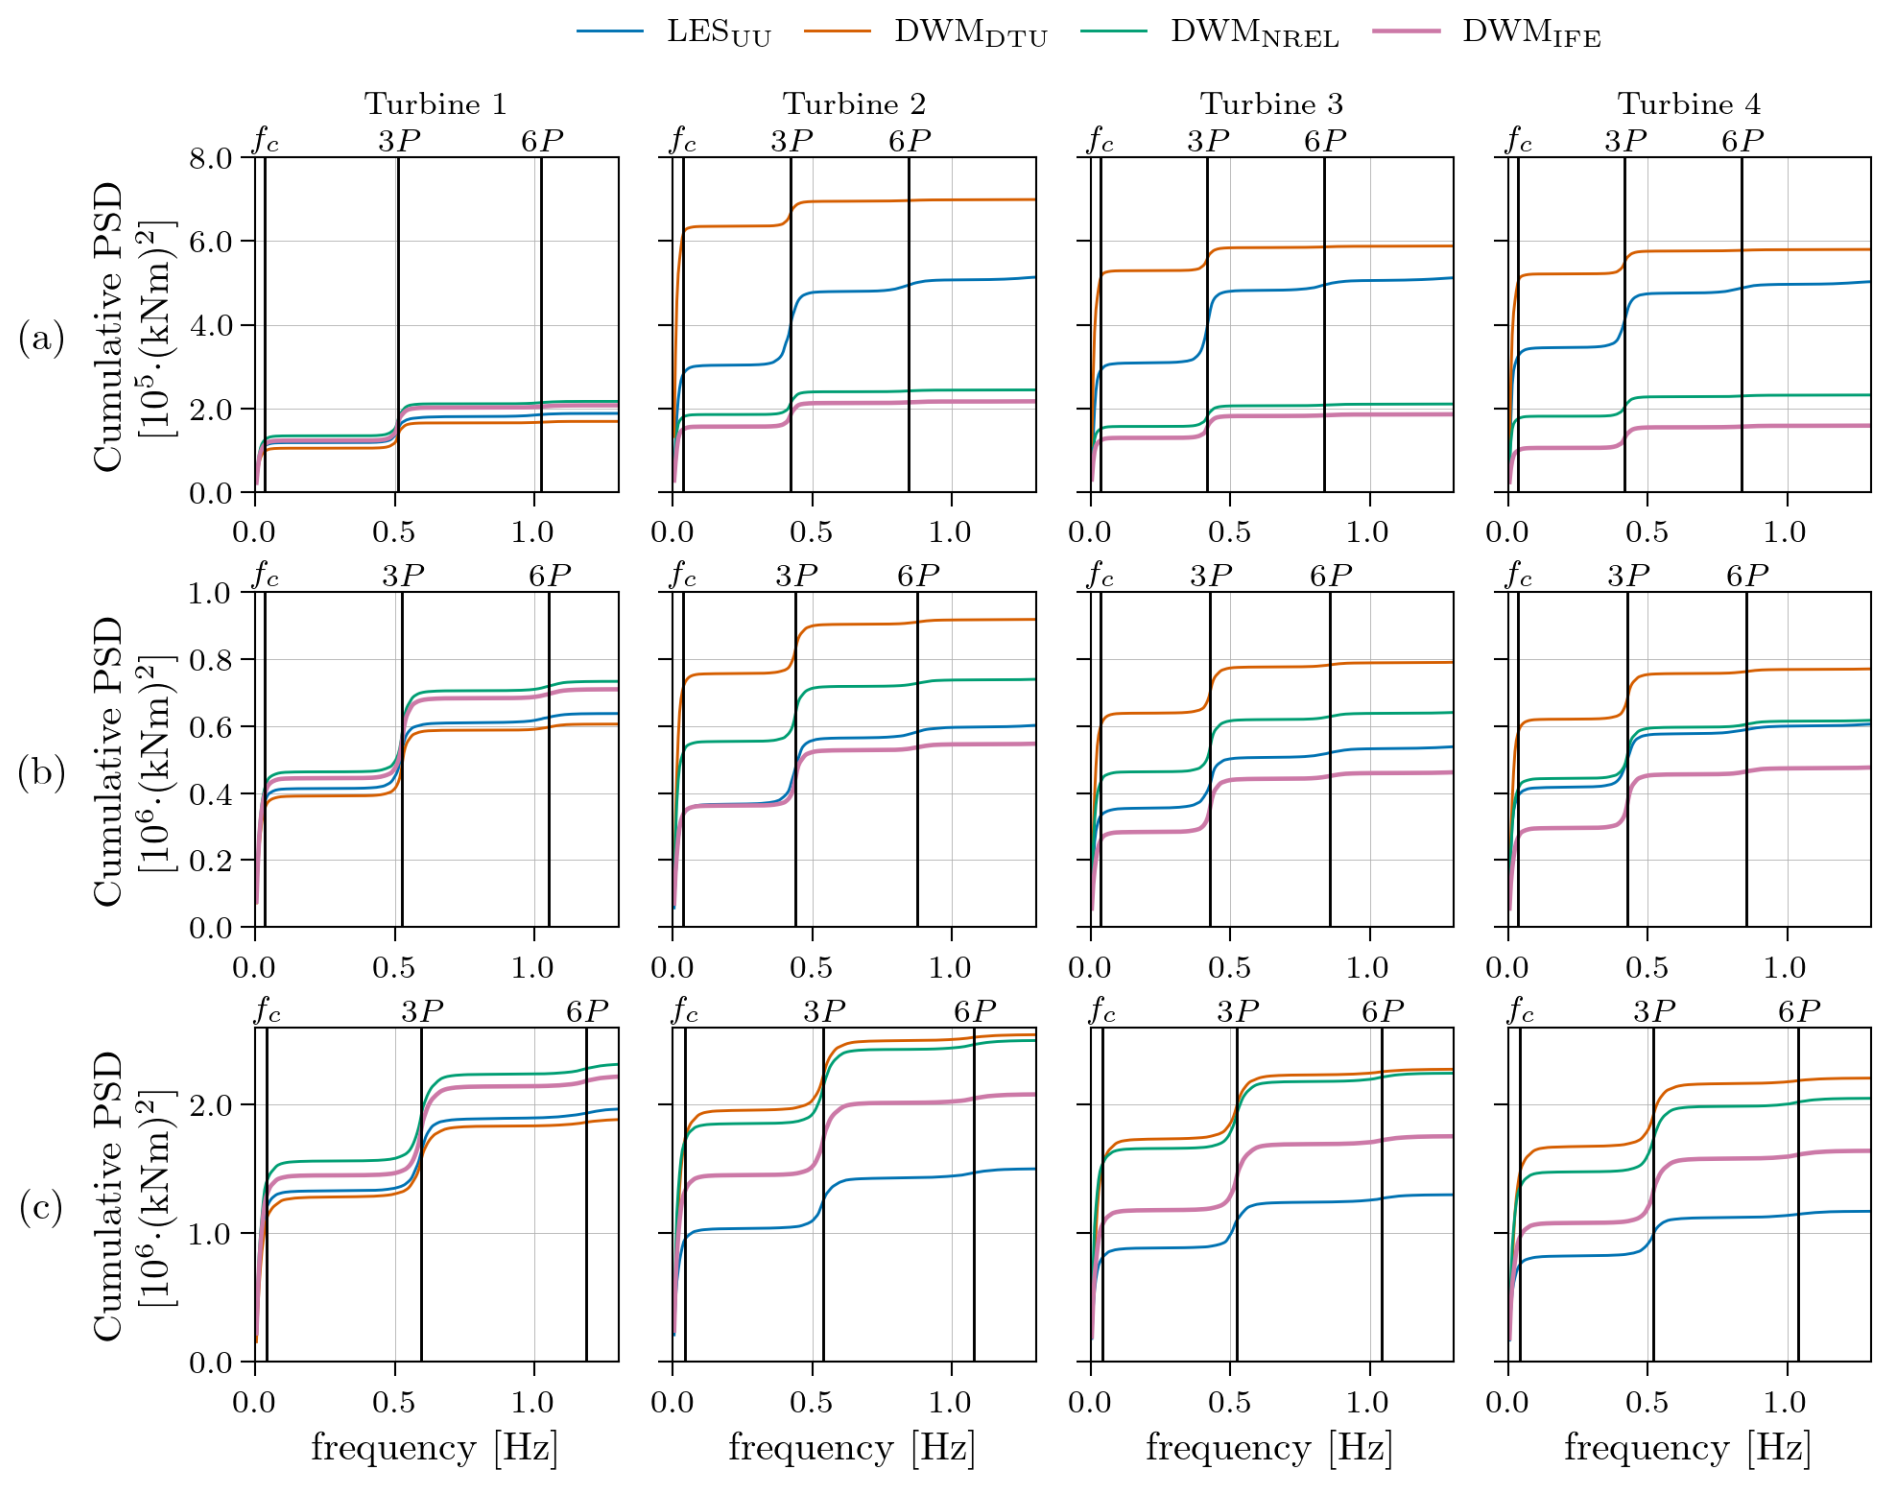
Figure A7Energy spectra of tower-top yaw moment for the aligned-incoming-wind case with ambient turbulence of (a) TIa = 4.6 %, (b) TIa = 8.8 %, and (c) TIa = 12 %.
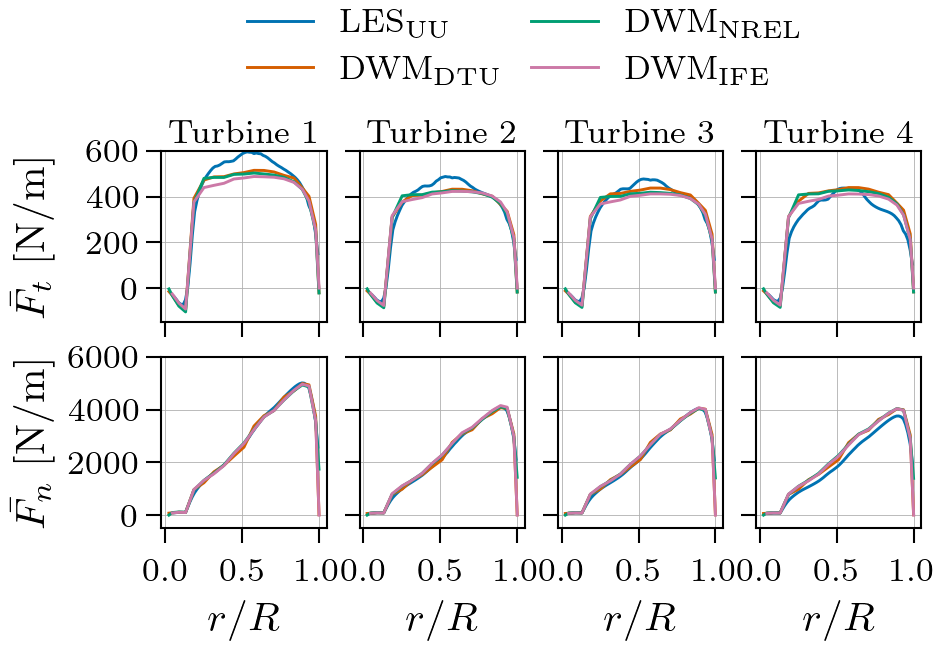
Figure A8Time-averaged blade force as a function of blade radius for the partially waked case, 5° inflow angle, and medium ambient turbulence (TIa = 8.8 %).
Since the inflow to Turbine 1 is identical across all models, any differences in response for this turbine likely originate from the aeroelastic solvers to which the different wake models are coupled, rather than from the wake models themselves – the primary focus of this study. Ideally, to isolate the impact of the wake models, all simulations should be performed using the same aeroelastic solver. However, this would require code modifications.
Alternatively, if the discrepancies between the aeroelastic solvers are consistent across wind speeds, the solver effect can be mitigated by normalizing all turbine outputs by the value of Turbine 1. To test this assumption, the flow fields from DWMNREL and DWMIFE at were converted and used as input to 3DFloat, the aeroelastic solver from IFE. The resulting mean thrust force and aerodynamic power are shown in Fig. B1 for the aligned-inflow case with medium ambient turbulence (TIa = 8.8 %). The original results from DWMNREL and DWMIFE are also included for comparison.
As expected, thrust and power outputs for Turbines 2–4 are lower in the simulations using flow fields at compared to the original simulations where the inflow has recovered for an additional distance of 1 D. However, while the original DWMNREL results were generated using NREL's aeroelastic solver OpenFAST, the three other simulations all used 3DFloat. Because the reductions in thrust and power between the simulations using the wake model by NREL and for the simulations using the wake model by IFE are similar, we can conclude that the aeroelastic solvers have a negligible effect on the results when normalized by the values of Turbine 1.
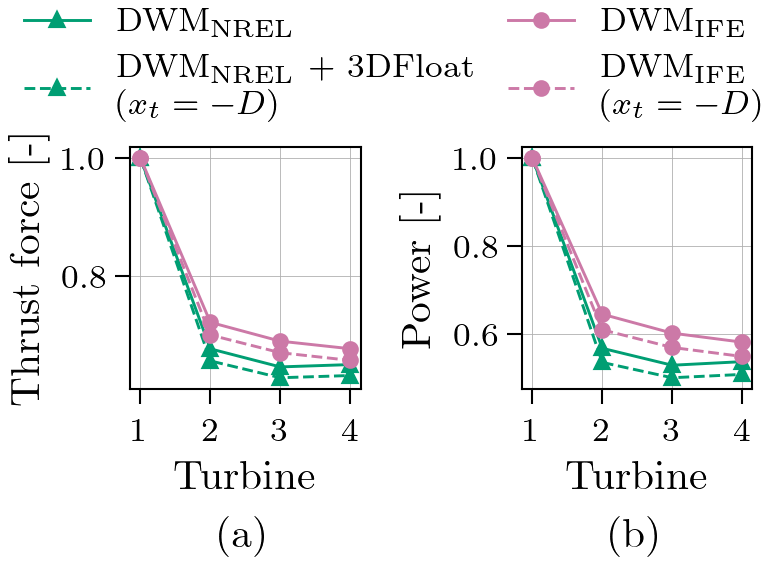
Figure B1(a) Mean thrust force and (b) mean power for the aligned-incoming-wind case with medium ambient turbulence (TIa = 8.8 %). For each model, the thrust and power outputs are normalized by the value of Turbine 1.
Similarly, the DELs of the blade-root flapwise bending moment, tower-top yaw moment, and tower-base fore–aft bending moment are shown in Fig. B2 for both the new and the original simulations. Here, the DELs for Turbines 2–4 are higher in the simulations using the flow fields at , as expected, since the inflow in the original simulations has recovered for an additional distance of 1 D and has become less turbulent. Also for the DELs, the reductions are similar for the simulations using the wake model by NREL and for the simulations using the wake model by IFE, even though some slightly larger deviations are observed than for the mean values. Nevertheless, it is reasonable to conclude that also for the fatigue damage, the choice of aeroelastic solver has a minor effect on the results when normalized by the values of Turbine 1.
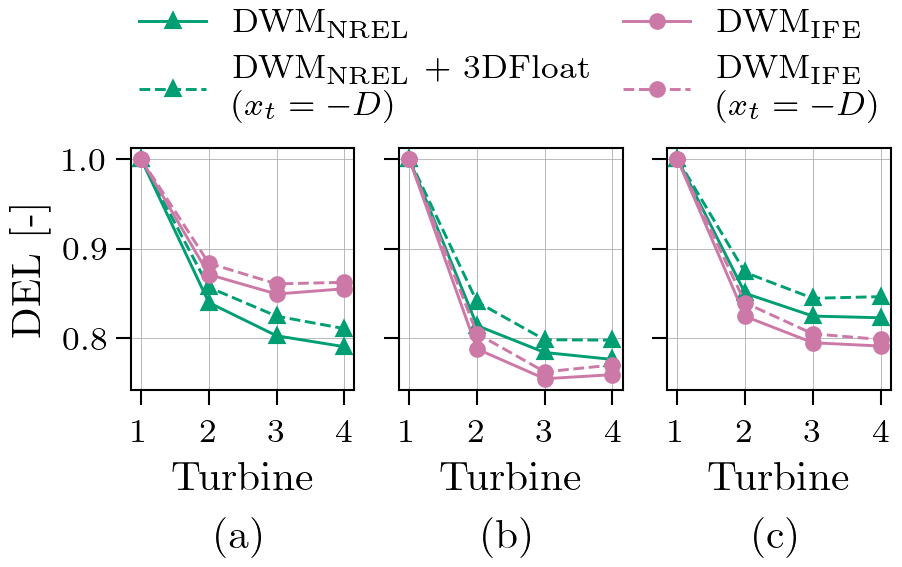
Figure B2Fatigue of (a) blade-root flapwise bending moment, (b) tower-top yaw moment, and (c) tower-base fore–aft bending moment for the aligned-incoming-wind case with medium ambient turbulence (TIa = 8.8 %). For each model, the DELs are normalized by the DEL of Turbine 1.
The numerical results in this study were generated using several modelling frameworks. The FAST.Farm tool is open source and can be accessed via its official repository at https://doi.org/10.5281/zenodo.6324288 (Jonkman et al., 2026). The other software packages used in this work are proprietary. However, the underlying data presented in this article can be provided upon request from the corresponding author.
All authors: proposed the methodology, conducted formal analysis, and carried out the investigation. ØWHB: simulated the test cases and submitted the DWMIFE results. PD: simulated the test cases and submitted the DWMNREL results. HAM: simulated the test cases and submitted the DWMDTU results. HA: produced the LES inflow wind fields, simulated the test cases, and submitted the LESUU results. ØWHB: post-processed (except for the wake centre tracking) and visualized the data from the numerical models. PD: conducted the SAMWICh wake tracking and post-processing. ØWHB: wrote the manuscript draft. All authors: reviewed and edited the paper.
The contact author has declared that none of the authors has any competing interests.
This work was authored in part by the National Renewable Energy Laboratory for the U.S. Department of Energy (DOE) under Contract No. DE-AC36-08GO28308. The U.S. Government retains and the publisher, by accepting the article for publication, acknowledges that the U.S. Government retains a nonexclusive, paid-up, irrevocable, worldwide license to publish or reproduce the published form of this work, or allow others to do so, for U.S. Government purposes. The views expressed in the article do not necessarily represent the views of the DOE or the U.S. Government.
Publisher's note: Copernicus Publications remains neutral with regard to jurisdictional claims made in the text, published maps, institutional affiliations, or any other geographical representation in this paper. The authors bear the ultimate responsibility for providing appropriate place names. Views expressed in the text are those of the authors and do not necessarily reflect the views of the publisher.
This research has been supported by the Norwegian Research Council, through the project NEXTFARM (grant no. 281020).
This paper was edited by Emmanuel Branlard and reviewed by two anonymous referees.
Asmuth, H., Diaz, G. P. N., Madsen, H. A., Branlard, E., Forsting, A. R. M., Nilsson, K., Jonkman, J., and Ivanell, S.: Wind turbine response in waked inflow: A modelling benchmark against full-scale measurements, Renew. Energ., 191, 868–887, https://doi.org/10.1016/j.renene.2022.04.047, 2022. a, b, c
Bartl, J., Mühle, F., Schottler, J., Sætran, L., Peinke, J., Adaramola, M., and Hölling, M.: Wind tunnel experiments on wind turbine wakes in yaw: effects of inflow turbulence and shear, Wind Energ. Sci., 3, 329–343, https://doi.org/10.5194/wes-3-329-2018, 2018. a
Bernard, V., Andersen, S. J., Leon, J. M., Beaudet, L., Verelst, D., and Iliopoulos, A.: Observation and modelling of asymmetric loading on large offshore wind turbines in wake conditions, J. Phys. Conf. Ser., 2767, https://doi.org/10.1088/1742-6596/2767/9/092092, The Science of Making Torque from Wind, Florence, Italy, 29–31 May 2024, 2024. a, b, c
Bossuyt, J., Scott, R., Ali, N., and Cal, R. B.: Quantification of wake shape modulation and deflection for tilt and yaw misaligned wind turbines, J. Fluid Mech., 917, A3, https://doi.org/10.1017/jfm.2021.237, 2021. a
Branlard, E., Martínez-Tossas, L. A., and Jonkman, J.: A time-varying formulation of the curled wake model within the FAST.Farm framework, Wind Energy, 26, 44–63, https://doi.org/10.1002/we.2785, 2023. a, b, c
Branlard, E., Jonkman, J., Platt, A., Thedin, R., Martínez-Tossas, L. A., and Kretschmer, M.: Development and Verification of an Improved Wake-Added Turbulence Model in FAST. Farm, J. Phys. Conf. Ser., 2767, https://doi.org/10.1088/1742-6596/2767/9/092036, The Science of Making Torque from Wind, Florence, Italy, 29–31 May 2024, 2024. a, b, c, d, e
Clayton, B. R. and Filby, P.: Measured effects of oblique flows and change in blade pitch angle on performance and wake development of model wind turbines, in: Proceedings of the fourth BWEA Wind Energy Conference, BHRA Fluid Engineering, Cranfield, Bedford, UK, 214–224, ISBN 0906085713, 1982. a
de Vaal, J. B. and Muskulus, M.: Simplified wake modelling for wind farm load prediction, J. Phys. Conf. Ser., EERA DeepWind'2021, 012012, https://doi.org/10.1088/1742-6596/2018/1/012012, Trondheim, Norway, 13–15 January 2021, 2021. a, b, c, d
Doubrawa, P., Barthelmie, R. J., Wang, H., and Churchfield, M. J.: A stochastic wind turbine wake model based on new metrics for wake characterization, Wind Energy, 20, 449–463, https://doi.org/10.1002/we.2015, 2017. a
Doubrawa, P., Annoni, J. R., and Jonkman, J. M.: Optimization-Based Calibration of FAST.Farm Parameters against SOWFA, 2018 Wind Energy Symposium, Kissimmee, Florida, USA, 8–12 January 2018, https://doi.org/10.2514/6.2018-0512, 2018. a
Doubrawa, P., Shaler, K., and Jonkman, J.: Difference in load predictions obtained with effective turbulence vs. a dynamic wake meandering modeling approach, Wind Energ. Sci., 8, 1475–1493, https://doi.org/10.5194/wes-8-1475-2023, 2023. a
Fleming, P. A., Gebraad, P. M., Lee, S., van Wingerden, J.-W., Johnson, K., Churchfield, M., Michalakes, J., Spalart, P., and Moriarty, P.: Evaluating techniques for redirecting turbine wakes using SOWFA, Renew. Energ., 70, 211–218, https://doi.org/10.1016/j.renene.2014.02.015, 2014. a
Glauert, H.: Airplane Propellers, in: Aerodynamic Theory, 1 edn., Springer, Berlin, Heidelberg, Germany, 169–360, https://doi.org/10.1007/978-3-642-91487-4_3, 1935. a
Hanssen-Bauer, Ø. W., De Vaal, J. B., Tutkun, M., Asmuth, H., Ivanell, S., and Stenbro, R.: Dependence of wind turbine loads on inlet flow field, J. Phys. Conf. Ser., 1618, https://doi.org/10.1088/1742-6596/1618/6/062065, Wind Energy Science Conference, Cork, Ireland, 17–20 June 2019, 2020. a, b
Hanssen-Bauer, Ø. W., Doubrawa, P., Madsen, H. A., Asmuth, H., Jonkman, J., Larsen, G. C., Ivanell, S., and Stenbro, R.: Comparison of three DWM-based wake models at above-rated wind speeds, J. Phys. Conf. Ser., 2505, https://doi.org/10.1088/1742-6596/2505/1/012054, Wake Conference, Visby, Sweden, 20–22 June 2023, 2023. a, b, c, d, e, f, g, h, i, j, k
International Electrotechnical Commission: Wind energy generation systems – Part 1: Design requirements, IEC 61400-1:2019, International Electrotechnical Commission, https://webstore.iec.ch/en/publication/26423 (last access: 5 February 2021), 2019. a, b
Jonkman, B., Mudafort, R. M., Platt, A., Branlard, E., Sprague, M., Jonkman, J., Hayman, G., Vijayakumar, G., Buhl, M., Ross, H., Bortolotti, P., Masciola, M., Ananthan, S., Schmidt, M. J., Rood, J., Mendoza, N., Hai, S. L., Hall, M., Sharma, A., Shaler, K., Bendl, K., Schuenemann, P., Sakievich, P., Quon, E. W., Phillips, M. R., Kusouno, N., Gonzalez Salcedo, A., Martinez, T., and Corniglion, R.: OpenFAST v3.1.0, Zenodo [code], https://doi.org/10.5281/zenodo.6324288, 2026. a
Jonkman, B., Mudafort, R. M., Platt, A., Branlard, E., Sprague, M., Jonkman, J., Hayman, G., Vijayakumar, G., Buhl, M., Ross, H., Bortolotti, P., Masciola, M., Ananthan, S., Schmidt, M. J., Rood, J., Mendoza, N., Hai, S. L., Hall, M., Sharma, A., Shaler, K., Bendl, K., Schuenemann, P., Sakievich, P., Quon, E.W., Phillips, M. R., Kusouno, N., Gonzalez Salcedo, A., Martinez, T., and Corniglion, R.: OpenFAST, National Renewable Energy Laboratory, https://www.nrel.gov/wind/nwtc/openfast (last access: 22 August 2025), 2025. a
Jonkman, J., Butterfield, S., Musial, W., and Scott, G.: Definition of a 5-MW reference wind turbine for offshore system development, Tech. Rep., National Renewable Energy Laboratory, Golden, CO, USA, 2009. a
Jonkman, J., Doubrawa, P., Hamilton, N., Annoni, J., and Fleming, P.: Validation of FAST. Farm Against Large-Eddy Simulations, J. Phys. Conf. Ser., 1037, https://doi.org/10.1088/1742-6596/1037/6/062005, The Science of Making Torque from Wind, Milan, Italy, 20–22 June 2018, 2018. a
Jonkman, J. M., Annoni, J., Hayman, G., Jonkman, B., and Purkayastha, A.: Development of FAST.Farm: a new multi-physics engineering tool for wind-farm design and analysis, 35th Wind Energy Symposium, Grapevine, Texas, USA, 9–13 January 2017, https://doi.org/10.2514/6.2017-0454, 2017. a, b, c, d
Keck, R.-E., Madsen, H. A., Larsen, G. C., Veldkamp, D., Wedel-Heinen, J. J., and Forsberg, J.: A consistent turbulence formulation for the dynamic wake meandering model in the atmospheric boundary layer, PhD thesis, Technical University of Denmark, Lyngby, Denmark, 2013. a, b
Keck, R.-E., de Maré, M., Churchfield, M. J., Lee, S., Larsen, G., and Madsen, H. A.: Two improvements to the dynamic wake meandering model: including the effects of atmospheric shear on wake turbulence and incorporating turbulence build-up in a row of wind turbines, Wind Energy, 18, 111–132, https://doi.org/10.1002/we.1686, 2015. a, b, c, d, e
Larsen, G. C. and Lio, A. W.: Low-pass filtering of meandering scales, J. Phys. Conf. Ser., 3016, https://doi.org/10.1088/1742-6596/3016/1/012020, Wake Conference, Visby, Sweden, 10–12 June 2025, 2025. a
Larsen, G. C., Madsen, H. A., Thomsen, K., and Larsen, T. J.: Wake meandering: a pragmatic approach, Wind Energy, 11, 377–395, https://doi.org/10.1002/we.267, 2008. a, b
Larsen, G. C., Ott, S., Liew, J., van der Laan, M. P., Simon, E., Thorsen, G. R., and Jacobs, P.: Yaw induced wake deflection - a full-scale validation study, J. Phys. Conf. Ser., 1618, https://doi.org/10.1088/1742-6596/1618/6/062047, The Science of Making Torque from Wind, Online, 28 September–2 October 2020, 2020. a
Larsen, T. J., Madsen, H. A., Larsen, G. C., and Hansen, K. S.: Validation of the dynamic wake meander model for loads and power production in the Egmond aan Zee wind farm, Wind Energy, 16, 605–624, https://doi.org/10.1002/we.1563, 2013. a, b, c
Larsen, T. J., Larsen, G. C., Madsen, H. A., and Petersen, S. M.: Wake effects above rated wind speed. An overlooked contributor to high loads in wind farms, in: EWEA Annual Conference and Exhibition, Paris, France, 17–20 November 2015, 95–99, 2015. a, b
Larsen, T. J., Larsen, G. C., Pedersen, M. M., Enevoldsen, K., and Madsen, H. A.: Validation of the Dynamic Wake Meander model with focus on tower loads, J. Phys. Conf. Ser., 854, https://doi.org/10.1088/1742-6596/854/1/012027, Wake Conference, Visby, Sweden, 30 May–1 June 2017, 2017. a
Liew, J. and Larsen, G. C.: How does the quantity, resolution, and scaling of turbulence boxes affect aeroelastic simulation convergence?, J. Phys. Conf. Ser., 2265, https://doi.org/10.1088/1742-6596/2265/3/032049, The Science of Making Torque from Wind, Delft, Netherlands, 1–3 June 2022, 2022. a
Liu, L., Franceschini, L., Oliveira, D. F., Galeazzo, F. C., Carmo, B. S., and Stevens, R. J. A. M.: Evaluating the accuracy of the actuator line model against blade element momentum theory in uniform inflow, Wind Energy, 25, 1046–1059, https://doi.org/10.1002/we.2714, 2022. a
Machefaux, E., Larsen, G. C., Troldborg, N., Hansen, K. S., Angelou, N., Mikkelsen, T., and Mann, J.: Investigation of wake interaction using full-scale lidar measurements and large eddy simulation, Wind Energy, 19, 1535–1551, https://doi.org/10.1002/we.1936, 2016. a
Madsen, H. A., Larsen, G. C., and Thomsen, K.: Wake flow characteristics in low ambient turbulence conditions, in: Copenhagen Offshore Wind, Copenhagen, Denmark, 26–28 October 2005, https://www.researchgate.net/publication/253732911 (last access: 27 June 2025), 2005. a, b
Madsen, H. A., Larsen, G. C., Larsen, T. J., Mikkelsen, R., and Troldborg, N.: Wake deficit-and turbulence simulated with two models compared with inflow measurements on a 2 MW turbine in wake conditions, in: European Wind Energy Conference and Exhibition, Brussels, Belgium, 31 March–3 April 2008, 48–53, https://orbit.dtu.dk/files/128949596/Madsen_et_al_2008_DWM_ewec_2008.pdf (last access: 27 June 2025), 2008. a, b, c
Madsen, H. A., Larsen, G. C., Larsen, T. J., Troldborg, N., and Mikkelsen, R.: Calibration and validation of the dynamic wake meandering model for implementation in an aeroelastic code, J. Sol. Energy Eng., 132, 041014, https://doi.org/10.1115/1.4002555, 2010. a, b, c, d, e, f, g, h
Madsen, H. A., Larsen, T. J., Larsen, G. C., and Hansen, K. S.: Wake flow characteristics at high wind speed, in: 34th Wind Energy Symposium, San Diego, California, USA, 4–8 January 2016, 1522, https://doi.org/10.2514/6.2016-1522, 2016. a
Madsen, H. A., Larsen, T. J., Pirrung, G. R., Li, A., and Zahle, F.: Implementation of the blade element momentum model on a polar grid and its aeroelastic load impact, Wind Energ. Sci., 5, 1–27, https://doi.org/10.5194/wes-5-1-2020, 2020. a
Meyer Forsting, A. R., Pirrung, G. R., and Ramos-García, N.: A vortex-based tip/smearing correction for the actuator line, Wind Energ. Sci., 4, 369–383, https://doi.org/10.5194/wes-4-369-2019, 2019. a
Michelsen, J. A.: Basis3D – a platform for development of multiblock PDE solvers, Tech. Rep., Technical University of Denmark, Lyngby, Denmark, 1994a. a
Michelsen, J. A.: Block structured multigrid solution of 2D and 3D elliptic PDE's, Tech. Rep., Technical University of Denmark, Lyngby, Denmark, 1994b. a
Monin, A. S. and Obukhov, A. M.: Basic laws of turbulent mixing in the surface layer of the atmosphere, Nauk SSSR Geophiz. Inst, 24, 163–187, 1954. a
Nygaard, T. A., De Vaal, J., Pierella, F., Oggiano, L., and Stenbro, R.: Development, verification and validation of 3DFloat; aero-servo-hydro-elastic computations of offshore structures, J. Phys. Conf. Ser., 94, 425–433, https://doi.org/10.1016/j.egypro.2016.09.210, EERA DeepWind' 2016, Trondheim, Norway, 20–22 January 2016, 2016. a, b
RCN: Engineering speed modelling of realistic fatigue for all the individual turbines in wind parks by representative pre-calculations – Prosjektbanken, Research Council of Norway, https://prosjektbanken.forskningsradet.no/project/FORISS/281020 (last access: 25 August 2025), 2025. a
Rychlik, I.: A new definition of the rainflow cycle counting method, Int. J. Fatigue, 9, 119–121, https://doi.org/10.1016/0142-1123(87)90054-5, 1987. a
Shaler, K. and Jonkman, J.: FAST.Farm development and validation of structural load prediction against large eddy simulations, Wind Energy, 24, 428–449, https://doi.org/10.1002/we.2581, 2021. a
Sood, I., Simon, E., Vitsas, A., Blockmans, B., Larsen, G. C., and Meyers, J.: Comparison of large eddy simulations against measurements from the Lillgrund offshore wind farm, Wind Energ. Sci., 7, 2469–2489, https://doi.org/10.5194/wes-7-2469-2022, 2022. a
Sørensen, J. N. and Shen, W. Z.: Numerical modeling of wind turbine wakes, J. Fluids Eng., 124, 393–399, https://doi.org/10.1115/1.1471361, 2002. a
Sørensen, N. N.: General purpose flow solver applied to flow over hills, Ph.D. thesis, Risø National Laboratory, Roskilde, Denmark, 1995. a
Trujillo, J.-J., Bingöl, F., Larsen, G. C., Mann, J., and Kühn, M.: Light detection and ranging measurements of wake dynamics. Part II: two-dimensional scanning, Wind Energy, 14, 61–75, https://doi.org/10.1002/we.402, 2011. a
Zong, H. and Porté-Agel, F.: A momentum-conserving wake superposition method for wind farm power prediction, J. Fluid Mech., 889, A8, https://doi.org/10.1017/jfm.2020.77, 2020a. a
Zong, H. and Porté-Agel, F.: A point vortex transportation model for yawed wind turbine wakes, J. Fluid Mech., 890, A8, https://doi.org/10.1017/jfm.2020.123, 2020b. a
, where L is the length scale of the spectral velocity tensor, and D is the turbine diameter, as opposed to L = 33.6 m, which is recommended for atmospheric turbulence above 60 m (International Electrotechnical Commission, 2019).
wakesreduce energy output and can affect turbines further down the row. By comparing these three models with more detailed simulations, we found they agree well on overall power but differ in how they capture turbulence and wear on machines. Our results show where the models need improvement to make wind farm computer models more accurate and reliable in the future.