
the Creative Commons Attribution 4.0 License.
the Creative Commons Attribution 4.0 License.
 | 30 Jul 2026
Slow wake recovery and low turbulence behind wind farms parameterized in mesoscale simulations
Jens H. Kasper
Richard J. A. M. Stevens
Julie K. Lundquist
Numerical weather prediction (NWP) and climate models equipped with wind-farm parameterizations (WFPs) can simulate cluster wake effects affecting downstream wind farms in both onshore and offshore environments. This study evaluates wake recovery behind a wind farm represented by the NWP-WFP approach in the Weather Research and Forecasting (WRF) model using either the Fitch et al. (2012) or Ma et al. (2022a, b) WFPs. Results are benchmarked against large-eddy simulations (LES) of an idealized offshore wind farm with aligned and staggered layouts under neutral atmospheric stability. Near-farm wake recovery is underestimated in NWP-WFP simulations due to its representation on a coarse mesoscale grid. This limitation leads to slow wake recovery through two interconnected mechanisms: (i) spatial gradients in the wind velocity field are weaker compared to LES and (ii) turbulence kinetic energy (TKE) remains low not because of excessive dissipation but due to insufficient shear production caused by these weakened gradients. For the scenario considered here, a wind-speed bias develops in the near-farm wake and persists into the far wake. Differences between the NWP-WFP simulations and LES emerge within a short distance downstream of the farm exit, where the mesoscale simulations recover too slowly. This reduced recovery contributes approximately 0.15–0.50 m s−1 to the near-farm wind-speed bias. The bias established in this region is not subsequently compensated for downstream but instead propagates into the far wake, where wind-speed differences of approximately 0.4–0.6 m s−1 remain up to 50 km downstream. Higher-resolution mesoscale simulations partially reduce this bias. Increasing turbine-added TKE or including subgrid wake effects provides additional improvement, but neither fully addresses the underlying cause. The slow wake recovery is not caused by limitations of the WFPs themselves, as it also occurs outside their region of influence, and adding subgrid wake effects does not significantly impact recovery. Rather, the slow wake recovery is a consequence of mesoscale flow representation. This behavior is not limited to regions downstream of the wind farm but is less visible within the farm, where wake recovery occurs simultaneously with turbine-induced momentum extraction. These results highlight the need for improved representations of wake recovery both within and downstream of wind farms. While enhanced subgrid modeling, shear-driven TKE production, and refined WFP formulations may improve intra-farm dynamics, accurately capturing near-farm wake recovery downstream remains challenging, as WFPs do not act in this region.
- Article
(8370 KB) - Full-text XML
- BibTeX
- EndNote


The views expressed herein do not necessarily represent the views of the U.S. DOE, the United States Government, the Massachusetts Clean Energy Center or the Maryland Energy Administration. The U.S. Government retains and the publisher, by accepting the article for publication, acknowledges that the U.S. Government retains a nonexclusive, paid-up, irrevocable, worldwide license to publish or reproduce the published form of this work, or allow others to do so, for U.S. Government purposes.
The sheer scale of offshore wind farms is attracting increasing attention from the scientific community (Barthelmie et al., 2007, 2009; Platis et al., 2018; Pryor et al., 2020; Cañadillas et al., 2020; Rosencrans et al., 2024; Ouro et al., 2025) largely due to cluster wake effects and associated power losses. Massive wind farms (∼ 1 GW) with large turbines (10–20+ MW) encounter relatively low turbulence offshore (Bodini et al., 2019). This combination leads to strong, persistent wakes that can extend tens of kilometers downstream of the wind farms (Platis et al., 2018). As a result, inter-farm wake effects pose challenges not only to operating wind farms but also to those in planning or development stages, thus mirroring concerns already observed in onshore settings (Lundquist et al., 2019). Understanding and accurately predicting the wakes that arise from atmosphere–wind-farm interactions is therefore of scientific and economic relevance (Veers et al., 2019, 2022). In this context, numerical weather prediction (NWP) models equipped with wind-farm parameterizations (WFPs) have proven to be a valuable tool (Fischereit et al., 2022a).
The representation of wind farms in NWP and climate models has evolved significantly over the past 2 decades, moving from surface-based approximations to more physically realistic parameterizations. In the early 2000s, wind farms were incorporated into NWP and climate models through enhanced surface roughness (z0) or drag (Ivanova and Nadyozhina, 2000; Malyshev et al., 2003; Keith et al., 2004; Wang and Prinn, 2010). However, this approach led to exaggerated surface fluxes, turbulence kinetic energy (TKE), and wind speed deficits (Fitch et al., 2013b). A key conceptual shift came with Baidya Roy et al. (2004), who proposed that wind farms act as an elevated momentum sink and TKE source within the rotor layer rather than at the surface. The elevated momentum sink and TKE source framework remains the conceptual foundation for most WFPs in use today, and for several subsequent advances (Fitch et al., 2012; Adams and Keith, 2013; Boettcher et al., 2015; Abkar and Porté-Agel, 2015b; Volker et al., 2015; Pan and Archer, 2018; Redfern et al., 2019; Ma et al., 2022b; Wu et al., 2023; Du et al., 2025, 2026). For a comprehensive overview of WFP developments, see the review by Fischereit et al. (2022a).
One of the key advances in WFPs was the modification of the TKE source term, initially treated as a constant (Baidya Roy et al., 2004). Blahak et al. (2010) proposed linking the added TKE to the energy extracted by the turbines via the power coefficient (CP), and Fitch et al. (2012) introduced the formulation , where CT is the thrust coefficient. Later, Archer et al. (2020) suggested scaling CTKE with a TKE factor (α) of 0.25 to avoid exaggerated TKE values. Even though some studies find better performance using α= 1.00 instead (Larsén and Fischereit, 2021), the impact of changing α varies spatially (Ali et al., 2023; Rosencrans et al., 2024; García-Santiago et al., 2024). Most recently, large-eddy simulation (LES)-based formulations have been proposed to further improve the TKE source term (Khanjari et al., 2025).
Regarding the WFPs and the representation of atmosphere–wind-farm interactions, it is useful to distinguish between grid-unresolved and grid-resolved processes. Unresolved processes include the momentum sink term, intra-grid-cell interactions between turbines (Abkar and Porté-Agel, 2015b; Pan and Archer, 2018; Ma et al., 2022b; Wu et al., 2023), local wake expansion (Volker et al., 2015), and wake recovery occurring within the same grid cell. The momentum sink term creates a wind speed deficit (wake) as a grid-unresolved process. However, momentum recovery into the generated wake is a spatial process that occurs over several grid cells and depends on spatial gradients of wind speed, wind direction, and TKE, in addition to planetary boundary layer (PBL) schemes. Wake recovery is therefore also a grid-resolved process. This grid-resolved wake recovery depends on multiple factors. Several studies have shown sensitivity to horizontal grid resolution (Mangara et al., 2019; Siedersleben et al., 2020; Tomaszewski and Lundquist, 2020; Peña et al., 2022; Sanchez Gomez et al., 2024) and vertical resolution (Vanderwende et al., 2016; Mangara et al., 2019; Tomaszewski and Lundquist, 2020; Siedersleben et al., 2020). The PBL scheme is also influential (Rybchuk et al., 2022; Agarwal et al., 2026), as is the tuning of the TKE addition factor α (Archer et al., 2020; Siedersleben et al., 2020; Tomaszewski and Lundquist, 2020; Larsén and Fischereit, 2021; Sanchez Gomez et al., 2024). In addition, atmospheric stability plays a key role in wake recovery and has been highlighted in several recent works (Vanderwende et al., 2016; Lundquist et al., 2019; Rosencrans et al., 2024; García-Santiago et al., 2024; Quint et al., 2025). Performance also varies between different WFPs. For instance, the Explicit Wake Parameterization (EWP) generally produces shorter wakes than the Fitch scheme (Shepherd et al., 2020; Pryor et al., 2020; Larsén and Fischereit, 2021; Fischereit et al., 2022b; García-Santiago et al., 2024; Pryor and Barthelmie, 2024).
The underestimation of wake recovery in NWP-WFP simulations is also governed by grid-resolved processes. A conceptual description of the generation and recovery of the wake in NWP-WFP, in comparison with LES, is provided in Fig. 1. Two downstream cells are used because the added TKE in the LES usually reaches its maximum in the first downstream cell (Fig. 1e), whereas the added TKE maximum occurs at the turbine grid cell for the NWP-WFP (Fig. 1d). Thus, wake recovery and TKE decrease are assessed here as streamwise changes between two consecutive downstream cells (Fig. 1b, c, e, f). The NWP-WFP ΔWS barely changes between the two panels (Fig. 1b and c), whereas the LES displays recovery. On the other hand, the ΔTKE decreases too fast for the NWP-WFP compared with the LES between panels (Fig. 1e and f). The slow wake recovery and the abrupt TKE decrease in NWP-WFP simulations occur in downstream cells without turbines and may therefore not be caused by the WFP. A slow wake recovery may also exist within the wind farm; however, because it occurs simultaneously with turbine momentum extraction, it is less discernible there.
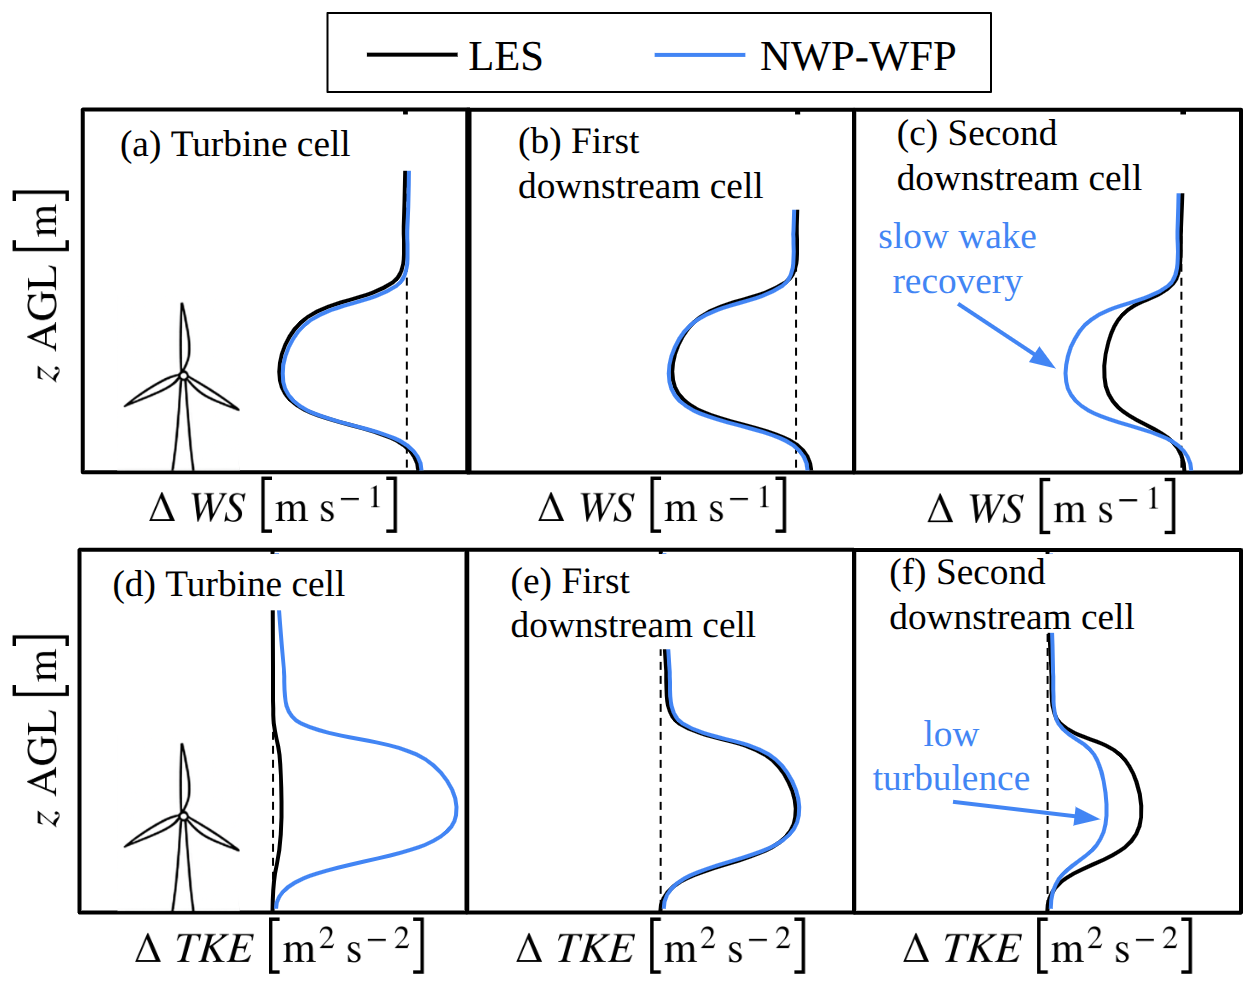
Figure 1Conceptual description of wind turbine wake generation and recovery in a NWP-WFP simulation provided as a summary of the literature (Abkar and Porté-Agel, 2015b; Vanderwende et al., 2016; Peña et al., 2022; García-Santiago et al., 2024). Time-averaged vertical profiles of wind speed deficit (ΔWS, a–c) and turbine-added TKE (ΔTKE, d–f) within the turbine grid cell (a, d), for the first (b, e) and second (c, f) downstream cells in the NWP without turbines. The wind speed deficit is defined as the difference between simulations with and without turbines (), respectively, yielding negative values in most of the wake. The turbine-added TKE () is similarly defined but typically yields positive values.
Multiple NWP-WFP studies report good agreement of the wind speed deficit with LES within turbine or farm grid cells (Abkar and Porté-Agel, 2015b; Vanderwende et al., 2016; Peña et al., 2022; García-Santiago et al., 2024; Du et al., 2026), suggesting that the momentum sink term (i.e., the grid-unresolved component) creates a wind speed deficit consistent with the LES (Fig. 1a). However, after the generation of the wind speed deficit, the downstream wind speed profiles often remain unchanged in the NWP compared to the LES (Fig. 1b and c). This discrepancy in wake recovery between NWP-WFP and LES persists across neutral, convective, and stable atmospheric stability regimes (García-Santiago et al., 2024). Ultimately, this slow recovery in NWP-WFP simulations likely contributes to the overestimation of power losses often reported when using WFPs (Lee and Lundquist, 2017; Montavon et al., 2024). In Montavon et al. (2024), additional factors affecting turbine power estimates are identified, including the absence of a turbine induction correction in the standard Fitch WFP, which was subsequently addressed by Vollmer et al. (2024). Thus, the evidence of a well-functioning momentum sink term combined with the insufficient wake recovery downstream of turbine grid cells suggests the problem could be in the grid-resolved wake recovery process.
However, several studies using NWP-WFP simulations driven by realistic synoptic conditions have reported reasonable agreement between simulated and observed wind speed deficits in wind-farm wakes. Such agreement has been demonstrated using aircraft measurements (Siedersleben et al., 2018a, b, 2020; Larsén and Fischereit, 2021; van Stratum et al., 2022; Ali et al., 2023) as well as SCADA data (Sanchez Gomez et al., 2024) in offshore wind farms. The contrast between idealized NWP-WFP simulations evaluated against LES, which can exhibit slower wake recovery, and realistic NWP-WFP simulations validated against observations motivates further investigation. It remains unclear whether the slower wake recovery in idealized configurations arises from limitations of the WFP itself or from deficiencies in the representation of wake recovery on a mesoscale grid. Clarifying this distinction is essential for assessing when NWP-WFP simulations can reliably represent wake evolution and associated power losses, and it constitutes the central motivation of this study.
Another issue, less frequently discussed, is the rapid decrease in farm-induced TKE in NWP-WFP simulations. While less obvious, this problem is evident when closely examining the spatial evolution of TKE profiles downstream of turbine grid cells. In NWP-WFP simulations, TKE decreases more rapidly than in LES, as conceptually illustrated in Fig. 1e and f, and supported by evidence from the literature (Fig. 5a–d in Vanderwende et al. (2016); Figs. 11–13 in Peña et al. (2022); Figs. 4 and 9 in García-Santiago et al. (2024)). As more studies focus on wake recovery in large farms, this issue is becoming more visible. For example, Rosencrans et al. (2024) found that the quantity of TKE added by the farm influences near-farm wake deficits but not the overall wake length. Similarly, Sanchez Gomez et al. (2024) noted that wake losses at an offshore wind farm located approximately 15 km downstream of an upstream wind farm were largely unaffected by the TKE factor. However, omitting the TKE factor (α=0) resulted in the largest biases when compared with SCADA data. Furthermore, aircraft observations have shown that TKE is overestimated in the first half of the farm by NWP-WFP, while in reality, TKE peaks further downstream (Siedersleben et al., 2020).
These two interrelated issues (the underestimated wake recovery and the fast decrease in the farm-added TKE) need a closer examination. While introduced here as two separate problems, turbulent mixing is a key driver for wake recovery (Vermeer et al., 2003; Abkar and Porté-Agel, 2015a; van der Laan et al., 2023; Kasper and Stevens, 2026). Unrealistic rapid decrease in the TKE can slow down wake recovery in NWP-WFP simulations. Therefore, these two issues raise a few important questions. For instance, why does the farm-added TKE decrease more quickly in NWP-WFP simulations than in the LES? How much does this rapid decrease contribute to the underestimated wake recovery? What other physical or numerical factors are involved? To address these questions, we evaluate the representation of wind-farm wake recovery in the NWP-WFP approach. Specifically, we aim to quantify the magnitude and spatial variability of the recovery process behind a wind farm. This analysis requires a large-domain LES to evaluate wake recovery within, immediately downstream, and in the far wake of the wind farm. To our knowledge, there are no NWP-WFP vs. LES comparisons over downstream distances of ∼ 40 km.
The remainder of this article is structured as follows. Section 2 describes the numerical setups, including the WRF simulations with the Fitch et al. (2012) and MAV (Ma et al., 2022a, b) wind-farm parameterizations (NWP-WFP), and the reference LES with actuator disks (Kasper et al., 2024). The idealized simulations consider a 600 MW offshore wind farm with aligned and staggered layouts under westerly flow and near-neutral atmospheric conditions. Section 3 first compares the undisturbed inflow conditions across models, followed by an assessment of wind-farm performance and wake recovery in the streamwise direction. Section 4 examines two key consequences of representing wind-farm wakes on a coarse mesoscale grid: (i) reduced TKE and (ii) weakened spatial gradients in wind speed. Finally, Sect. 5 summarizes the main findings and their implications for simulating wind-farm cluster wakes with NWP-WFP models.
To benchmark the NWP simulations with the WFP, we compare the results against LES by Kasper et al. (2024), who studied atmosphere–wind-farm interactions under idealized conditions. Specifically, we consider the Barotropic (BT) case of their study, which serves here as the reference case that the mesoscale NWP simulations are designed to replicate. The simulation setup for this LES is briefly covered in Sect. 2.1, while a thorough discussion on the numerical framework can be found in Kasper et al. (2024). Subsequent Sect. 2.2 details the NWP-WFP framework and the adaptations required to represent the LES conditions within a mesoscale model.
2.1 Setup for the LES
The reference simulation uses a modified version of the LES code developed by Albertson and Parlange (1999), later validated in Gadde et al. (2021). The model solves the incompressible filtered mass conservation, Navier–Stokes, and potential temperature transport equations. The subgrid-scale stresses and heat fluxes are modeled using the anisotropic minimum dissipation (AMD) scheme (Rozema et al., 2015; Abkar et al., 2016a), suitable for stratified boundary layers and wind-farm wakes.
In the horizontal directions, the code employs pseudo-spectral differentiation and periodic boundary conditions, while second-order finite differencing is used in the vertical direction. A free-slip boundary condition is imposed at the top, with a Rayleigh damping layer to minimize gravity wave reflections. At the surface, a zero heat flux condition enforces neutral stratification, and shear stresses are parameterized using Monin–Obukhov similarity theory. Time integration uses a third-order Adams–Bashforth scheme. The simulation domain spans 102.4 × 10.24 × 10 km in the streamwise, spanwise, and vertical directions, respectively. It is discretized using a rectilinear grid that consists of 2048 × 512 × 384 points, with horizontal resolutions of Δx= 50 m and Δy= 20 m. In the vertical, the resolution is uniform with Δz= 10 m up to zu= 1.5 km above ground level (a.g.l.), and stretched above using a hyperbolic tangent profile up to a maximum spacing of 62 m.
The simulated atmosphere represents an idealized offshore environment based on North Sea conditions. The geostrophic wind vector is prescribed with a magnitude 10 m s−1, and the Coriolis frequency equals fc= 1.159 × 10⁻⁴ s−1. The surface roughness is set to z0= 0.002 m, typical of open-sea conditions. The background stratification is neutral up to 1 km a.g.l., with a potential temperature of θ= 286 K. The boundary layer is capped by a 3 K inversion over 200 m, followed by a free-atmosphere lapse rate of 5 K km−1.
Two LES are considered, representing aligned and staggered wind-farm layouts. Wind turbines are represented using the actuator disk model (Jimenez et al., 2008; Calaf et al., 2010). The simulated wind farm consists of 10 rows and 6 columns of turbines arranged in an aligned layout configuration, spaced by sx= 7D and sy= 5D in the streamwise and spanwise directions, respectively. A staggered layout configuration is also considered, with an additional spanwise displacement of 2.5D between successive rows. The turbine diameter equals D= 178 m and the hub-height zh= 119 m a.g.l., corresponding to the DTU 10 MW reference turbine (Bak et al., 2013). A uniform thrust coefficient CT= 0.75 is used, and turbines yaw to face the local incoming wind.
Each LES is run for a total of 11 h and comprises two stages. First, a 7 h spin-up simulation is run on a coarser grid with a resolution of 2Δx× 2Δy×Δz. Second, once the boundary layer reaches quasi-equilibrium (the mean wind and turbulence statistics display small variations over time), it is interpolated to the full resolution and the LES proceeds as a precursor-successor simulation (Stevens et al., 2014). The precursor provides realistic turbulent inflow to the successor domain containing the wind farm, preventing contamination of the inflow by remnants of the wakes via the periodic boundary conditions. Statistics are then collected over the final 3 h of the simulation.
2.2 Setup for the NWP-WFP simulations
The NWP simulations use Advanced Research WRF model version 4.4 (Skamarock et al., 2019), which solves the compressible Euler equations in three spatial dimensions and time. The solver uses a time-split integration scheme. The low-frequency modes are integrated with a third-order Runge–Kutta scheme, whereas higher-frequency acoustic modes are integrated over smaller time steps. Advective terms are discretized using a fifth-order scheme in the horizontal and a third-order scheme in the vertical direction. The model applies Arakawa C-grid staggering in the horizontal direction, with a hydrostatic pressure-based coordinate in the vertical direction.
Idealized simulations are employed, omitting cloud microphysics, radiation, moisture, and surface heterogeneity, which are standard simplifications in studies targeting canonical boundary layers over flat terrain (Fitch et al., 2012; Volker et al., 2015; Vanderwende et al., 2016; Peña et al., 2022; García-Santiago et al., 2024). In the multiscale framework of the WRF model, turbulence is entirely parameterized by the PBL scheme for mesoscale grid spacings (ΔX∼ 1 km). Vertical turbulent mixing is represented by the MYNN PBL scheme (Nakanishi and Niino, 2009; Olson et al., 2026), while horizontal mixing is treated using a two-dimensional first-order Smagorinsky closure with constant eddy diffusivity (Skamarock et al., 2019). In MYNN, TKE is prognosed from a budget equation that includes shear production, buoyancy production or destruction, vertical turbulent transport, and dissipation (Nakanishi and Niino, 2009; Olson et al., 2026). The diagnosed TKE is then used to compute eddy diffusivities through stability-dependent mixing-length formulations, which directly control the vertical transport of momentum and scalars in the PBL. Since vertical turbulent transport dominates near-farm wake recovery (Lanzilao and Meyers, 2025; Kasper and Stevens, 2026), the discussion here primarily reflects the role of the PBL scheme and grid-resolved dynamics in governing vertical mixing and shear-driven entrainment.
A two-domain nesting configuration is adopted (Fig. 2), with one-way coupling from a parent domain to an inner nest. The outer domain generates nearly steady boundary-layer inflow characteristics, which are passed to the nested domain. Both domains use a constant horizontal resolution (ΔX=ΔY), hereafter referred to simply as ΔX, as specified in Table 1, ranging from 346 to 1246 m for the sets of simulations considered here. Simulations with the finest horizontal grid resolutions (ΔX= 2D, or 346 m, DX2D and DX2DTKE100) use a coarser resolution (ΔX= 5D, 890 m) for the outer domain, with a parent grid aspect ratio of 3. Vertically, a fine 10 m resolution is used below 400 m a.g.l. for all domains, resolving the turbine rotor layer with multiple grid points. The computational domain is larger than in the LES to further minimize the influence of lateral boundaries, as the added computational cost is relatively small for the NWP-WFP simulations. For most cases (except DX2D and DX2DTKE100) the innermost domain spans approximately 188 km streamwise and 63 km spanwise. In the finest-resolution cases (DX2D and DX2DTKE100), it spans about 100 km and 40 km in the streamwise and spanwise directions, respectively. All domains extend 5 km vertically.
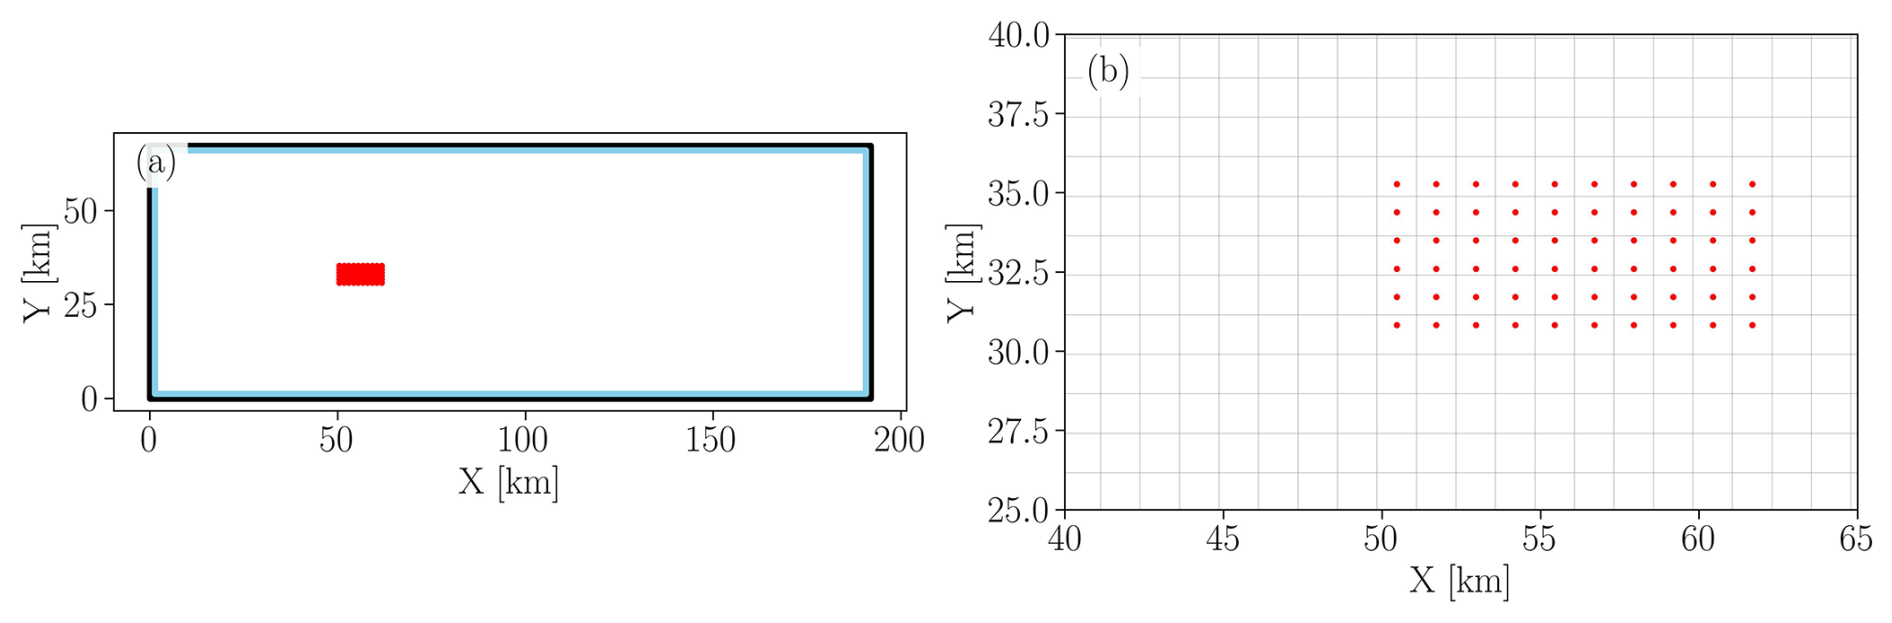
Figure 2Two computational domains are used in the WRF-WFP simulations, illustrated here for the baseline (BASE) case (a). The outer parent domain (D1, black rectangle), which uses periodic lateral boundary conditions and does not include a wind farm, provides inflow to the inner nested domain (D2, blue rectangle) via one-way nesting. The inner domain includes the wind farm, with turbines represented as red dots. In the BASE setup shown in panel (b), each grid cell contains one turbine, except for the cells between Y= 32–34 km, which contain two.
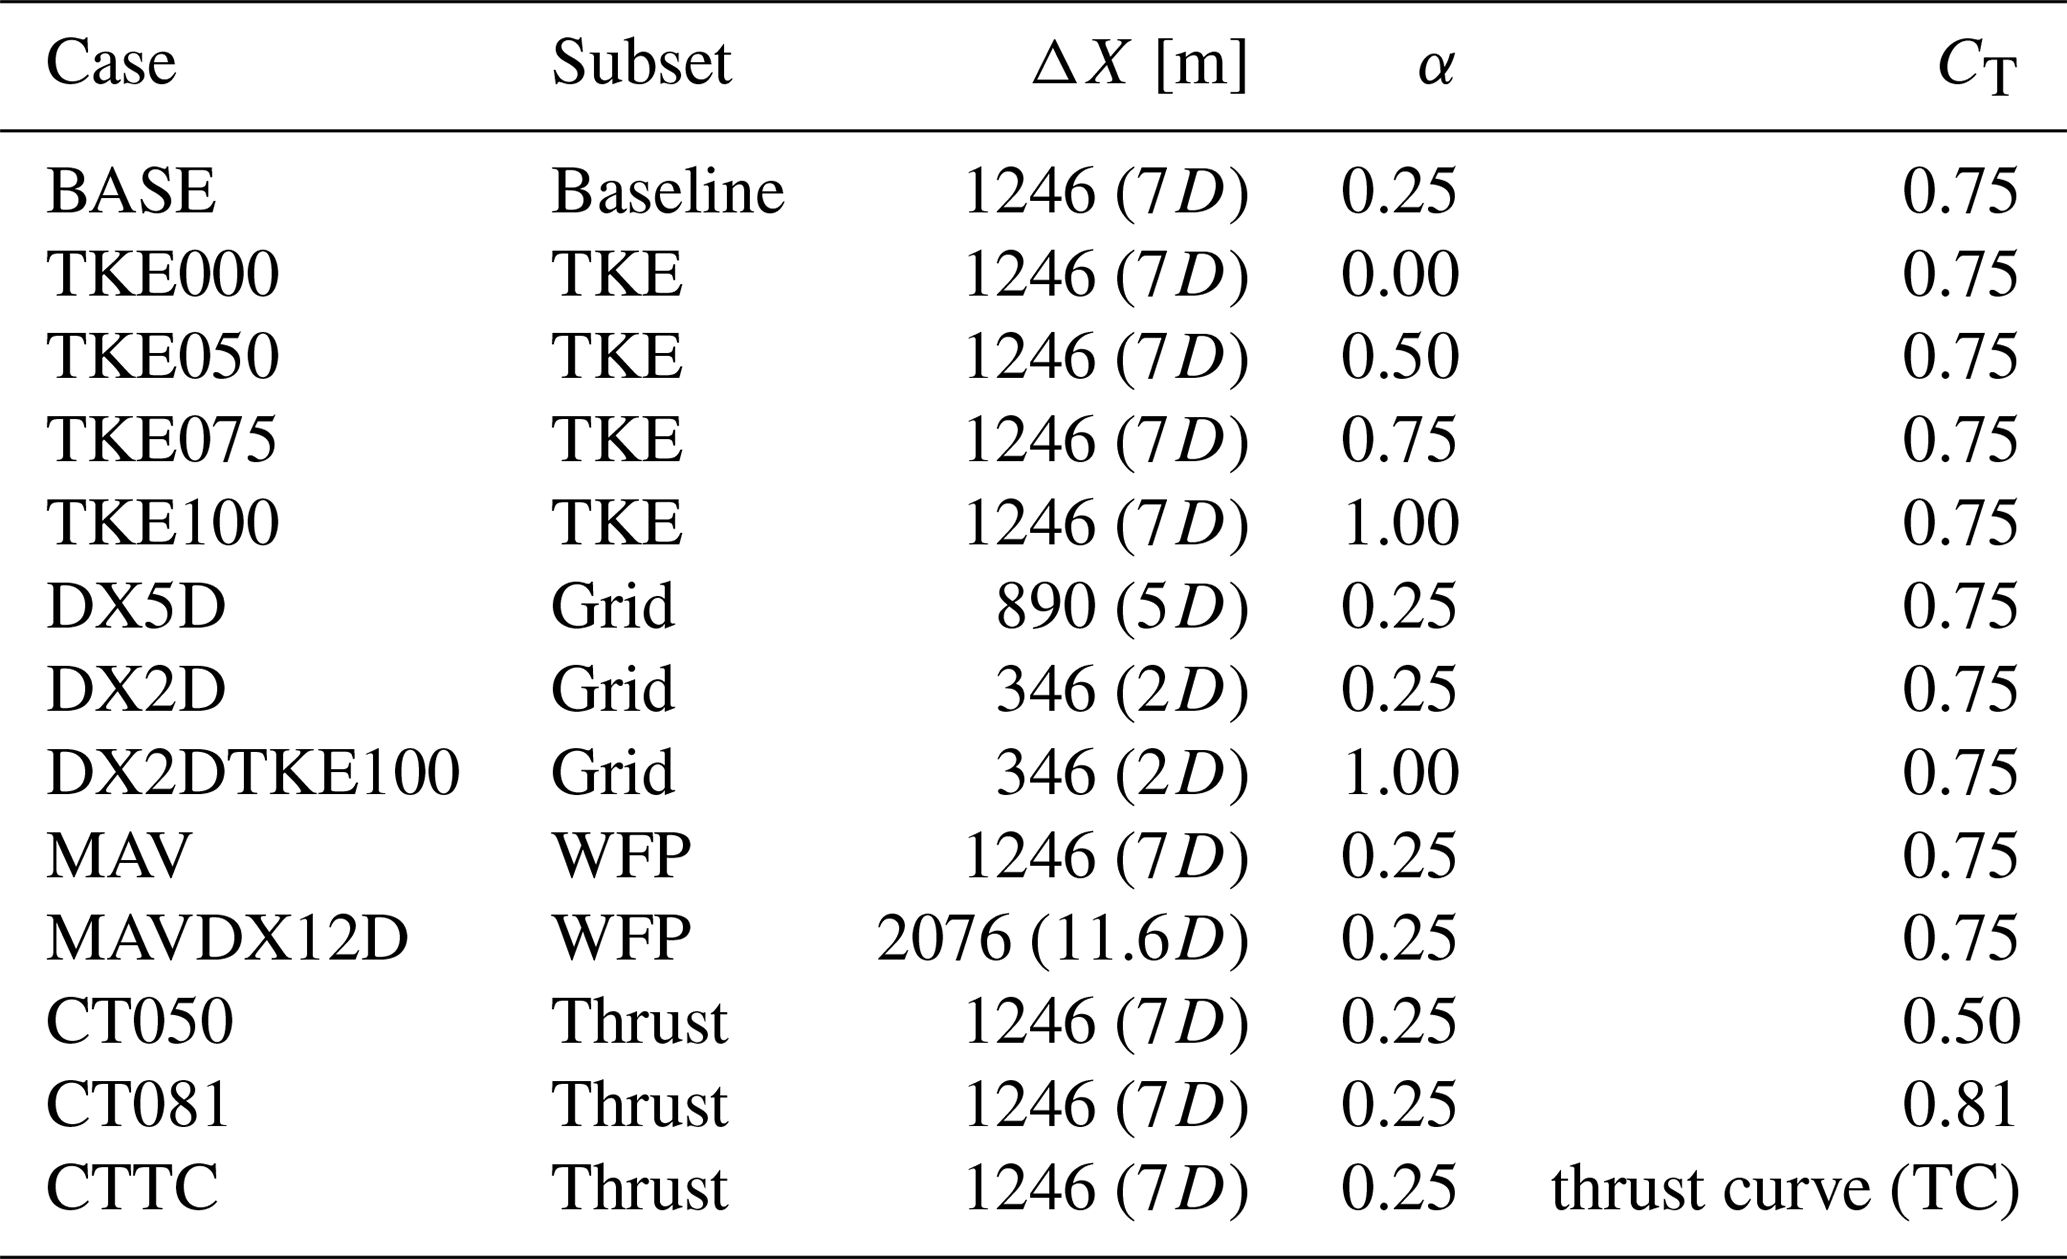
Table 1Summary of the NWP-WFP simulations, their subsets and key parameters: horizontal grid resolution (ΔX), TKE addition coefficient (α), WFP, and turbine thrust coefficient (CT).
The wind farm is represented using the Fitch et al. (2012) and MAV (Ma et al., 2022a, b) WFPs with TKE advection enabled (Archer et al., 2020). The Fitch WFP includes an axial induction modification following Vollmer et al. (2024). The wind farm consists of 60 DTU 10 MW turbines (Bak et al., 2013), configured identically to Kasper et al. (2024). Each turbine has a rotor diameter D= 178 m and a hub height zh= 119 m a.g.l. A constant thrust coefficient of CT=0.75 is used in all cases, except for those included in the CT sensitivity study. Details on the turbine model and the sensitivity analysis are provided in Appendix A. The NWP-WFP simulations consider only the aligned wind-farm layout. Because the coarser-resolution Fitch cases (BASE, TKE100) spatially over-distribute the wind speed deficit, the aligned configuration represents the worst-case scenario in terms of wake effects; accordingly, the staggered LES is also used as a reference for comparison with these coarser Fitch simulations.
The wind farm occupies a region starting around X= 50 km and Y= 30 km from the western and southern boundaries. The wind farm spans 11 km streamwise and 4.4 km spanwise, with turbine spacing of 7D (1246 m) in the streamwise and 5D (890 m) in the spanwise directions. Uniform turbine spacing in the coarse NWP-WFP grid is only achieved when grid spacing matches the physical turbine spacing. For instance, the BASE case has a horizontal spacing which ensures uniform representation of turbine spacing in the streamwise direction ( 7D) but not in the spanwise direction, where turbines are more closely spaced (ΔX= 7D but Sy= 5D).
To investigate the role of subgrid wake effects on wake recovery, we additionally implemented the “MAV” wind-farm parameterizations (Ma et al., 2022a, b), ported from the standard release of WRF v4.6. The MAV WFP is based on the analytical wake model of Xie and Archer (2015) and represents wake overlap through a superposition of hub-height wind speed deficits (Ma et al., 2022a). In contrast to the Fitch scheme, which relies on grid-cell-averaged momentum extraction, MAV explicitly accounts for subgrid wake interactions and has been shown to improve turbine power predictions when compared against offshore SCADA data (Ma et al., 2022a). Similarly to the Fitch-based simulations, the MAV-based simulations only consider the aligned layout scenario.
Surface boundary conditions assume flat, homogeneous terrain with roughness length z0= 0.002 m and zero surface heat flux (neutral stability). The surface-layer scheme applies Monin–Obukhov similarity theory (MOST)-based drag using near-surface wind speeds. The Coriolis parameter corresponds to a latitude of 52.65°. The upper boundary enforces zero vertical velocity and free-slip horizontal flow. A Rayleigh damping layer (coefficient 0.2 s−1) occupies the top 2 km of the domain to absorb gravity waves.
Initial conditions prescribe a uniform westerly flow from 282° at 10.93 m s−1. The initial potential temperature is uniform at 286 K below 1000 m a.g.l., then increases with lapse rates of 15 K km−1 (1000–1200 m a.g.l.) and 5 K km−1 (above 1200 m to the 5 km a.g.l. domain top) to match the LES. Simulations run for 27 h, with the final hour used for analysis after a 26 h spin-up. The initial forcing is fine-tuned to ensure post-spin-up conditions match target values, a standard approach in idealized WRF setups (Mirocha et al., 2018; Peña et al., 2021; Hsieh et al., 2025). Inertial oscillations driven by Coriolis effects also influence boundary-layer winds during spin-up. The chosen spin-up time ensures minimal residual oscillations in the analysis period.
Three simulation sets and a baseline case are run (Table 1). The baseline (BASE) case uses a horizontal resolution equal to the turbine streamwise spacing (7D) to avoid subgrid wake effects from multiple turbines within one cell in the streamwise direction. It applies a thrust coefficient of CT= 0.75 (as in (Kasper et al., 2024)) and a TKE addition coefficient of α= 0.25 (Archer et al., 2020). The TKE subset includes α= 0.00, 0.50, 0.75, and 1.00. The grid subset varies ΔX between 346 m (2D) and 890 m (5D). The thrust subset applies constant CT values of 0.50 and 0.81 and also includes a wind-speed-dependent thrust case (see Appendix A). This subset serves to assess the sensitivity of the wake generation and recovery relative to the choice of CT= 0.75 in the LES. The high-resolution cases DX2D and DX2DTKE100 are used to assess the impact of sharper wake gradients on power and recovery, acknowledging limitations of the application of traditional PBL schemes at sub-kilometer resolutions due to the terra incognita (Wyngaard, 2004; Rai et al., 2019; Haupt et al., 2019, 2023).
3.1 Undisturbed inflow profiles
Before delving into modeling differences and similarities between NWP-WFP and LES in terms of power production and wake recovery, it is necessary to evaluate inflow variability to ensure inflow profiles are sufficiently similar so that downstream differences are not attributed to inflow variability (Peña et al., 2022; Hsieh et al., 2025). There is excellent agreement between NWP-WFP and LES inflow profiles for all variables (Fig. 3). The differences in hub-height (WS119) and rotor-averaged (WSr) wind speed compared to the LES are approximately 0.03 and −0.01 m s−1, respectively, as shown in Table 2.
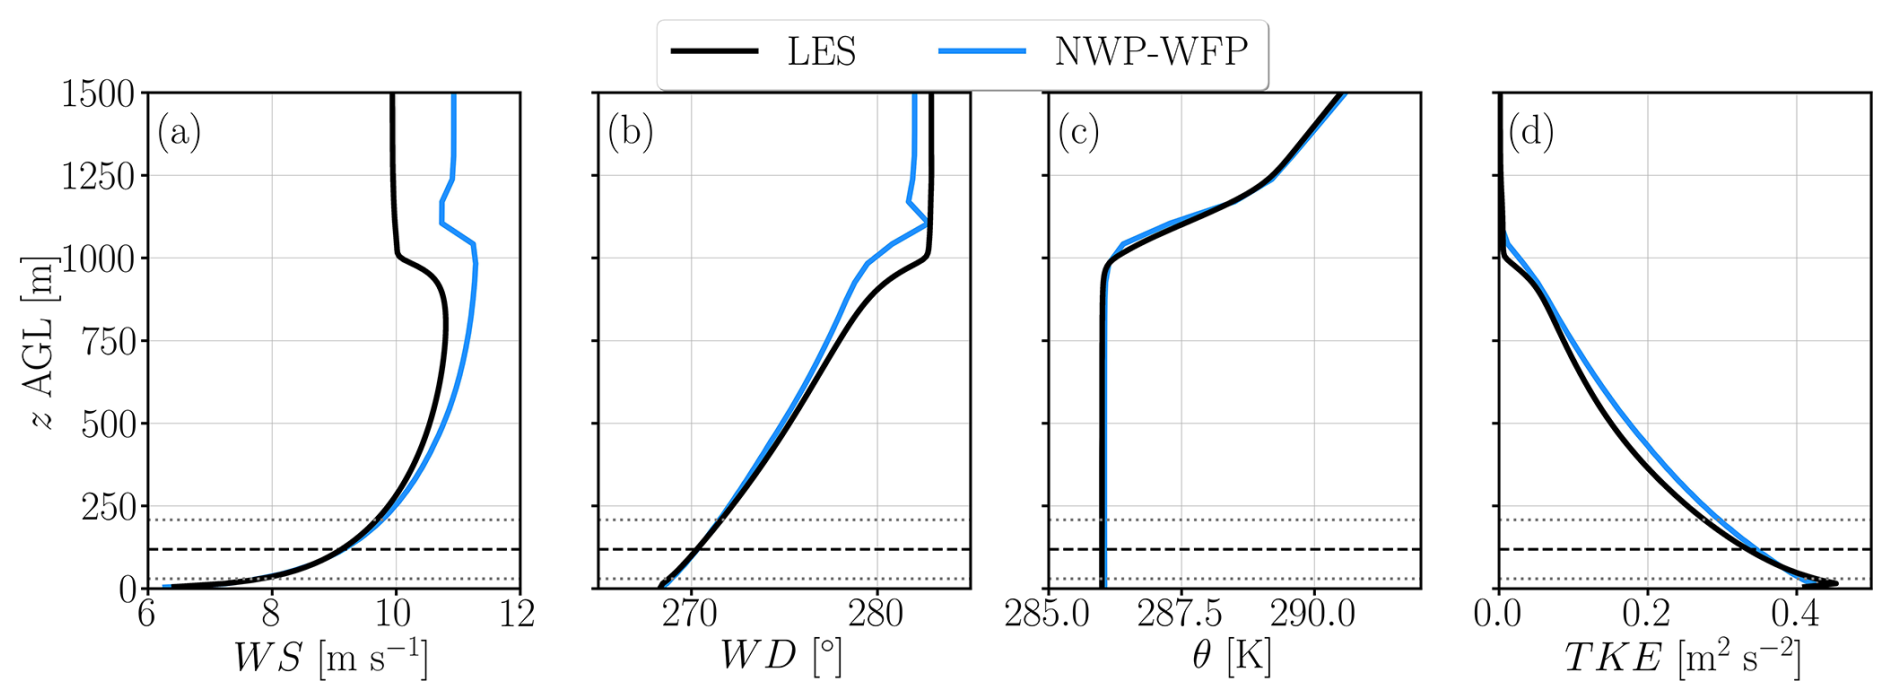
Figure 3Time- and horizontally averaged profiles of wind speed (a), wind direction (b), potential temperature (c), and TKE (d) during the analysis window for LES (black line) and NWP-WFP (blue line) in the simulation without turbines. The horizontal dashed and dotted gray lines denote rotor hub height and bottom/top tips, respectively.
Table 2Time-averaged inflow properties from the precursor simulations and their differences. Subscripts 119 and r denote hub-height (in m AGL) and rotor-averaged values, respectively. For wind shear (ΔWSr) and veer (ΔWDr), values represent the difference between the top and bottom rotor tips.

Not only do the hub-height and rotor-averaged values match well but so do the wind shear (αr) and veer (βr) across the rotor (Fig. 3a, b). This is important because under near-neutral conditions, turbulence production is governed primarily by mechanical shear, both in wind speed and direction (Stull, 1988). The fact that similar wind speed and direction profiles result in similar TKE profiles (Fig. 3d) reinforces the physical consistency between the models. The NWP-WFP wind speed profile exhibits slightly greater shear between 300 and 800 m a.g.l., which leads to marginally higher TKE values in that layer. Surface boundary conditions are also consistent, as indicated by the good agreement in friction velocity (u⋆, Table 2).
3.2 Wind-farm wake flow field and spatial average
In this section, we compare the representations of hub-height wind speed and TKE by the LES and NWP-WFP simulations. The goal is to quantify the differences in wind-farm wake structure and recovery between the aligned and staggered LES, spatially averaged to the grid of the BASE case (Fig. 4), and selected NWP-WFP cases (Fig. 5). The coarsened LES results for both aligned and staggered cases are obtained by spatially averaging the native-resolution LES data located within individual grid cells of the BASE case, enabling a direct comparison between the two (Fig. 4k–n), as in previous studies (Vanderwende et al., 2016; Peña et al., 2022; García-Santiago et al., 2024). The origin of the coordinate system is shifted to the southwest corner of the wind farm. Throughout the text, we divide the wind-farm wake into three distinct regions: the intra-farm wake (0 km 11.2 km), the near-farm wake (11.2 km 15 km), and the far wake of the farm (X> 15 km). The wind-farm exit separates the intra-farm and near-farm wake regions. The thick black rectangle shows the wind-farm perimeter as defined by the WFP. In the case DX2D (Fig. 5e, f), the finer resolution results in a smaller represented perimeter compared to the BASE case.
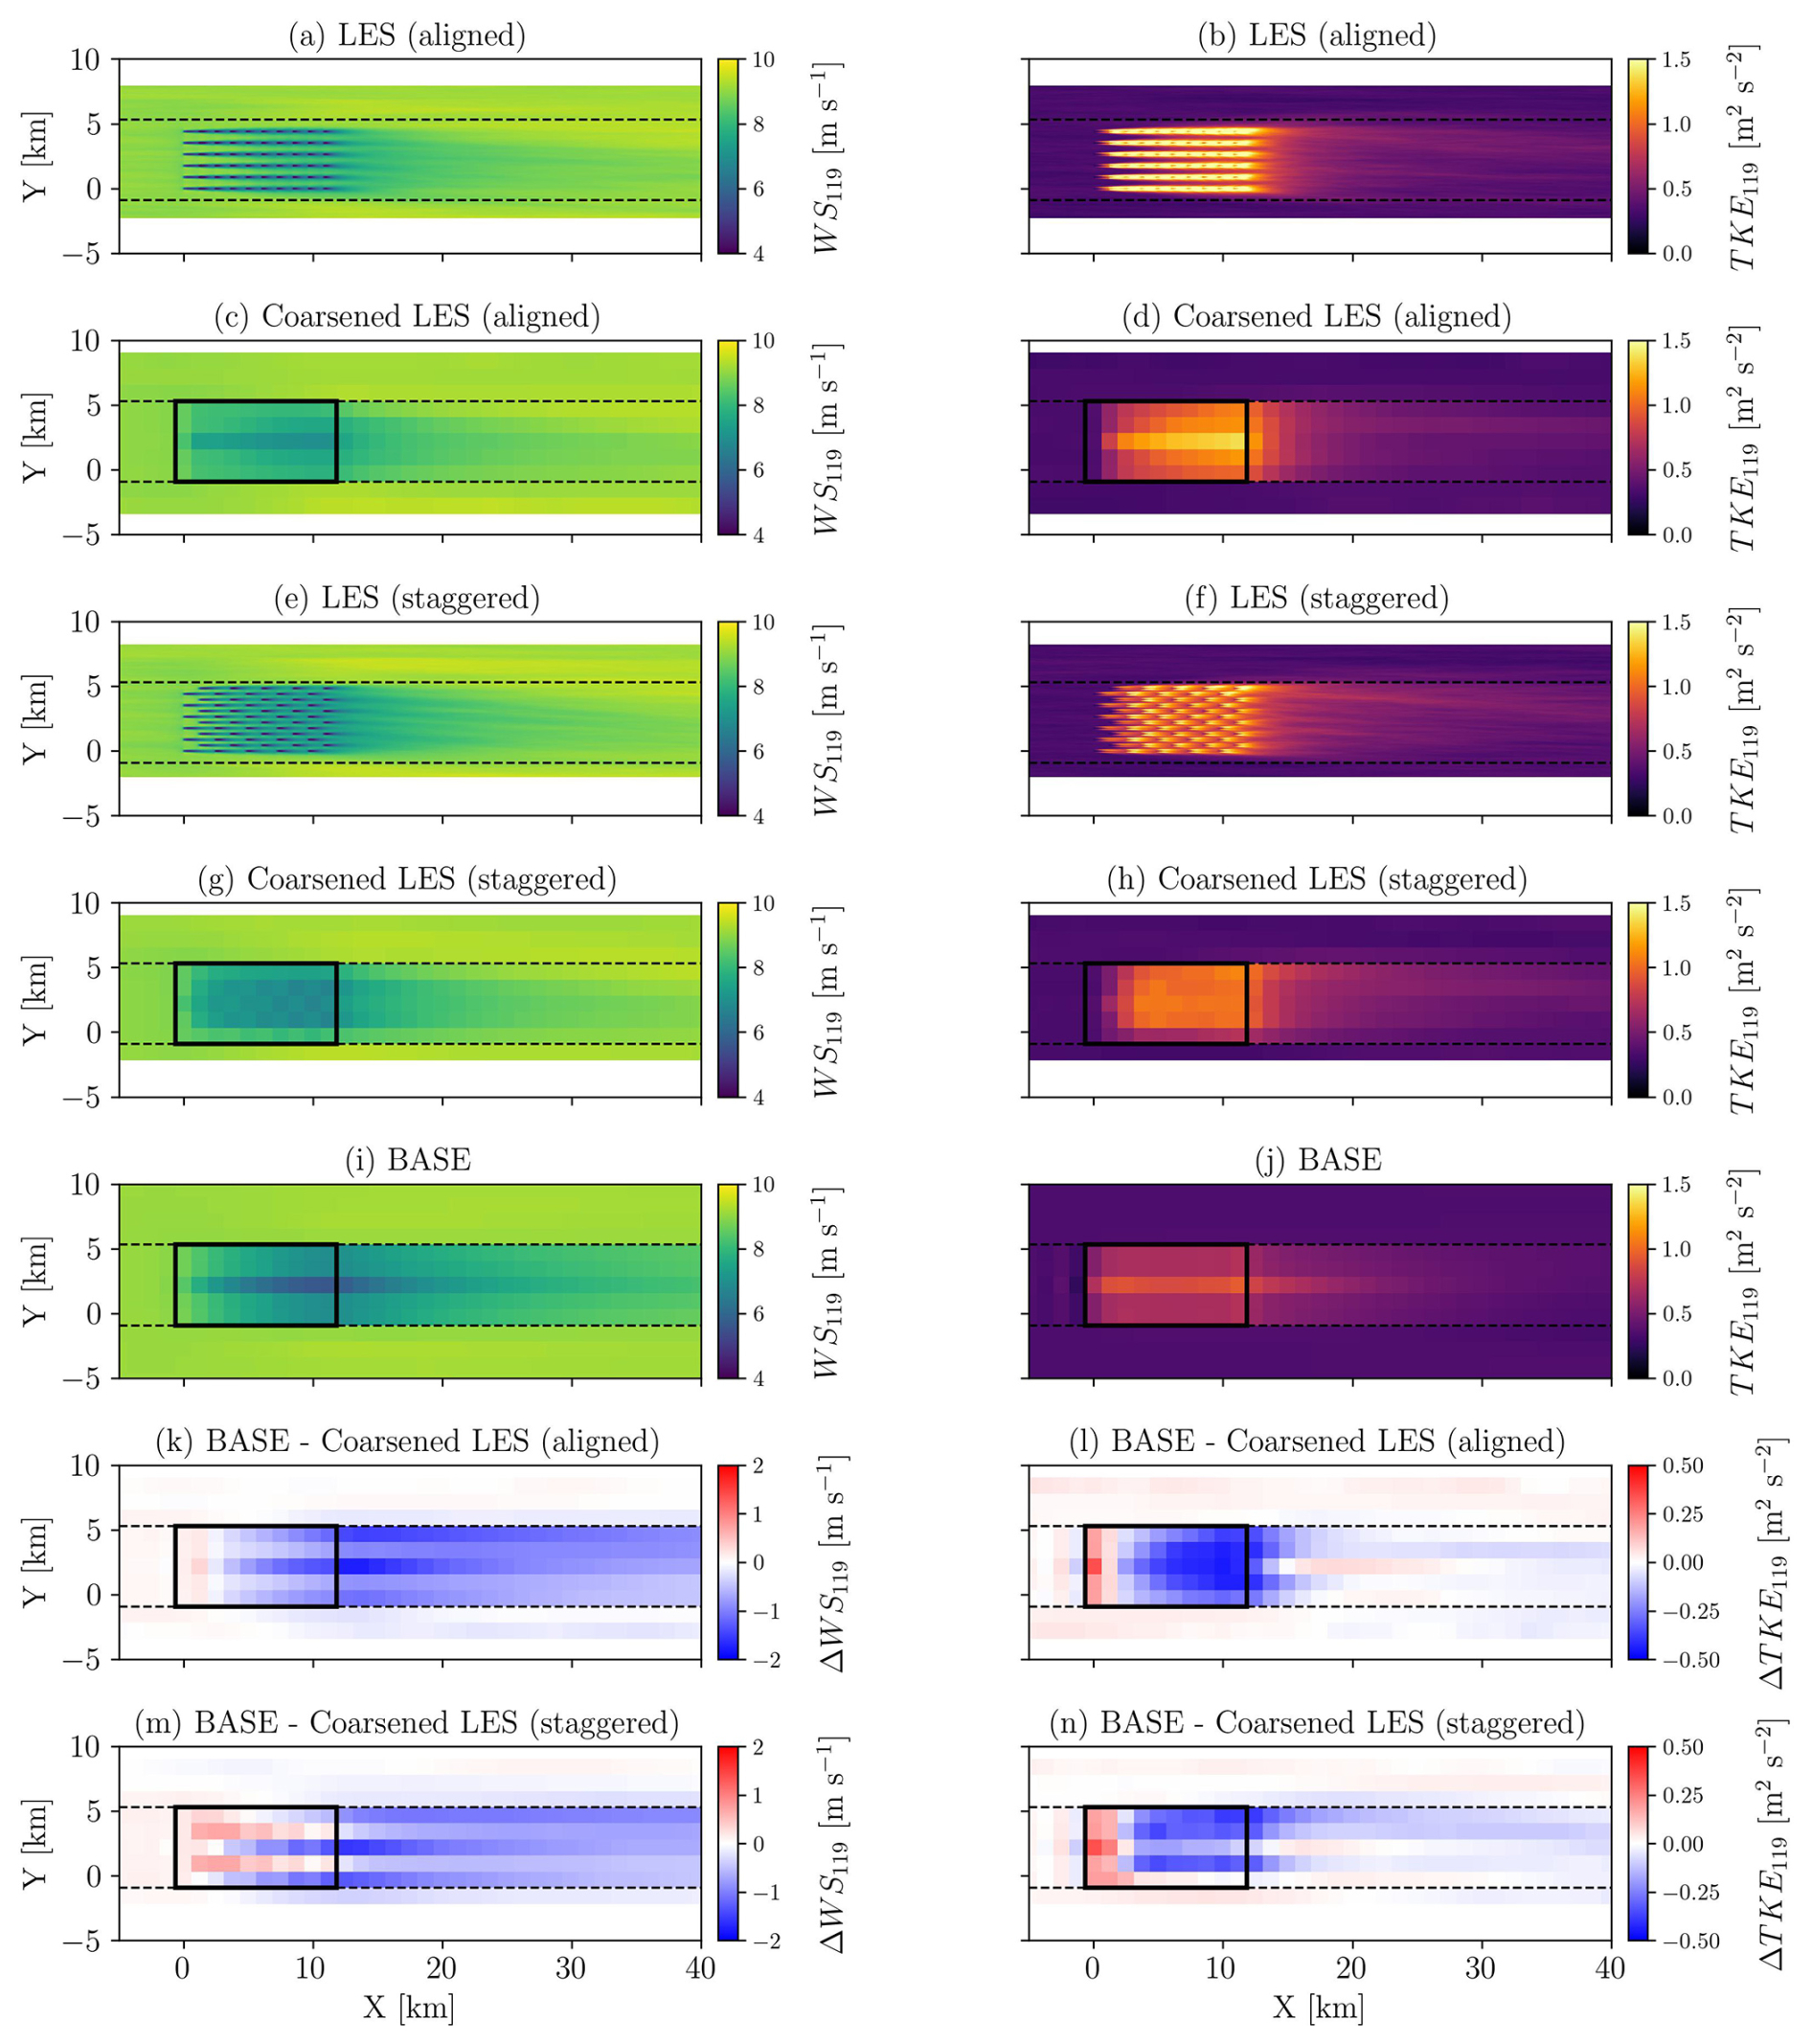
Figure 4Time-averaged wind speed (WS119) and TKE (TKE119) at hub height for the aligned LES (a, b), coarsened aligned LES (c, d), staggered LES (e, f), coarsened staggered LES (g, h), and NWP-WFP case BASE (i, j). The last two rows show the difference between the BASE case and the coarsened aligned (k, l) and staggered LES (m, n). The black rectangles indicate the wind-farm perimeter as represented in the NWP-WFP simulation. Horizontal dashed lines mark the spanwise extent of the region used for averaging.
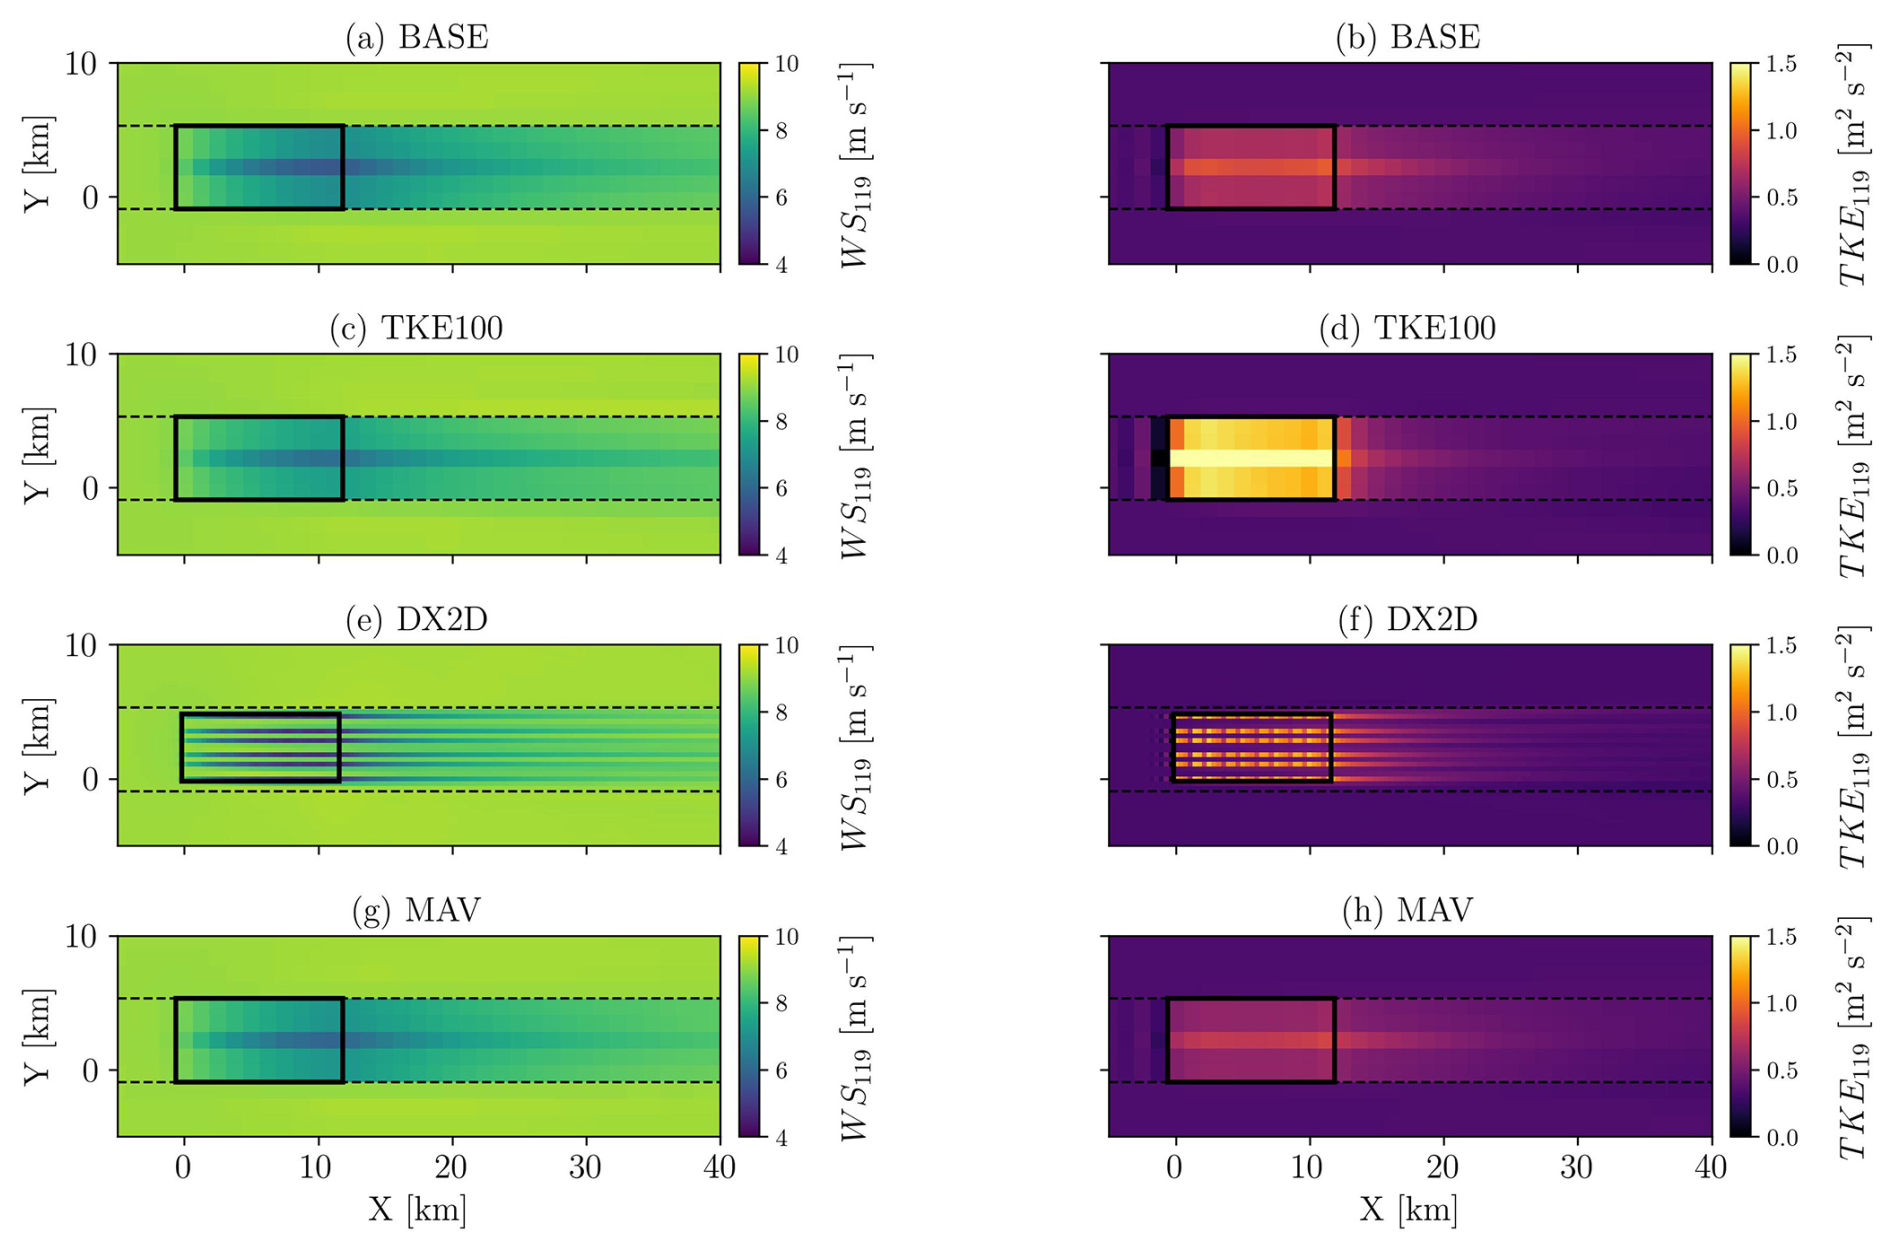
Figure 5Time-averaged wind speed (WS119) and TKE (TKE119) at hub height for the NWP-WFP cases BASE (a, b), TKE100 (c, d), DX2D (e, f), and MAV (g, h). The black rectangles indicate the wind-farm perimeter as represented in the NWP-WFP simulation. Horizontal dashed lines mark the spanwise extent of the region used for averaging.
The full-resolution aligned LES case (Fig. 4a, b) exhibits sharp streaks of alternating low and high wind speed and TKE due to the aligned turbine layout (Stieren and Stevens, 2022; Stipa et al., 2024). These streaks extend approximately 3–5 km downstream before merging into a single and broader structure (Fig. 4a). For the staggered layout (Fig. 4e), the streaks are more broadly distributed in the spanwise direction. In contrast, the coarsened LES aggregates and smooths out these microscale variabilities (Fig. 4c, g), producing more homogeneous flow and turbulence fields within the farm. In the far-wake region (X> 15 km), the LES and coarsened LES fields become similar, as turbulent mixing has reduced the spatial gradients in wind speed and TKE.
A persistent feature in the coarsened aligned LES, BASE, and TKE100 cases (Figs. 4c, i, and 5c) is a narrow band of reduced wind speed around Y= 2.5 km. This more intense wake results from the Y direction turbine spacing (sy= 5D) being finer than the grid spacing (ΔX= 7D), such that two turbine columns fall within a single grid cell. This aggregation produces a locally stronger momentum sink and TKE source (Fitch et al., 2012). Although the total momentum sink in DX2D is comparable to BASE and TKE100, the local wind speed deficits are larger due to the finer resolution, which produces more concentrated wakes (Fig. 5e). This localization of the wind speed deficits explains the improved agreement with the aligned LES regarding the second-row power losses for cases DX2D and DX2DTKE100 (Fig. 6b).
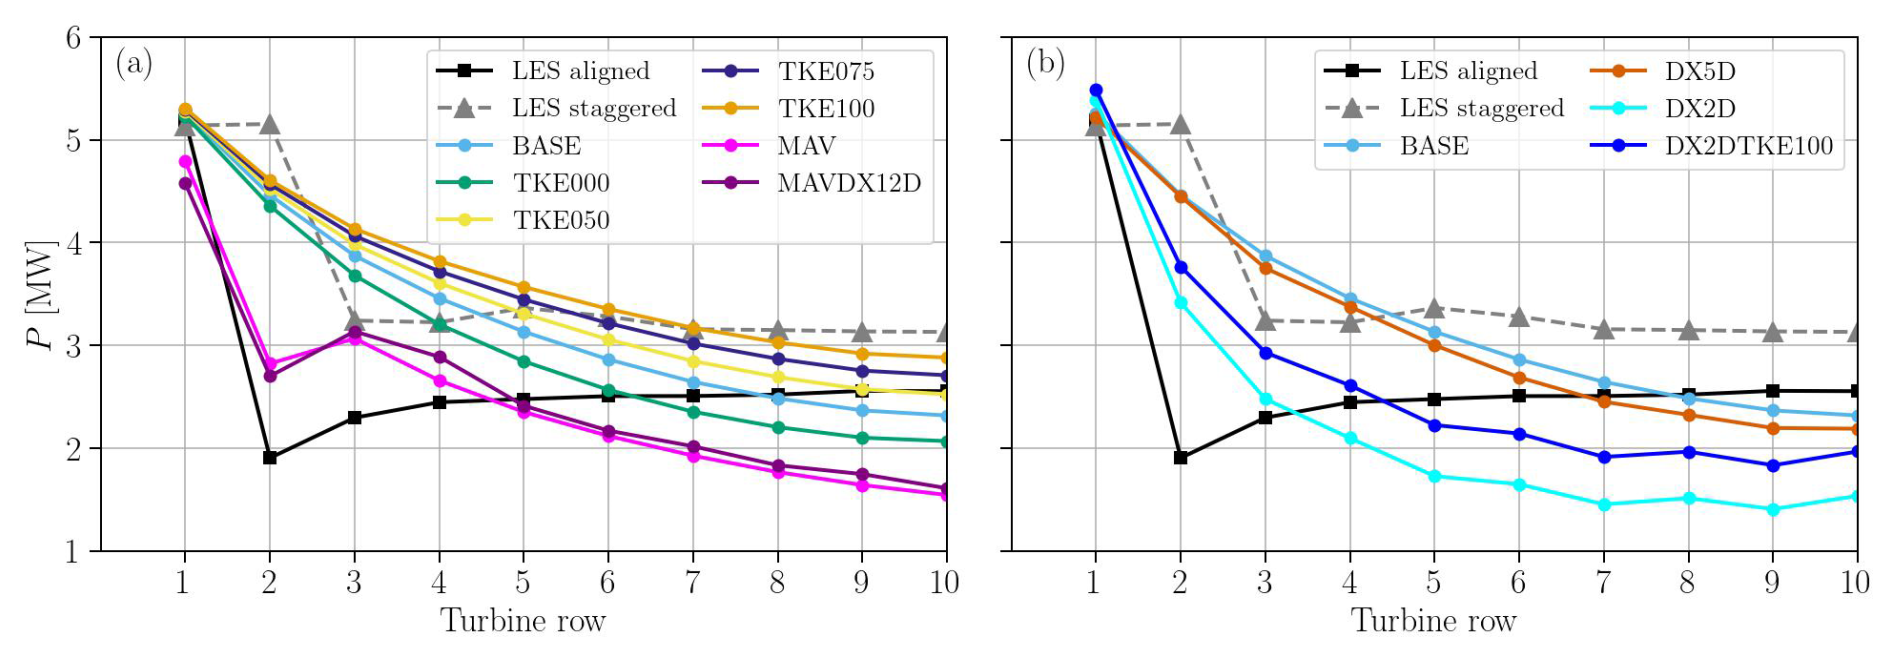
Figure 6Row-averaged power in the NWP-WFP set of simulations with different wind farm added TKE and WFP (a) and grid resolutions (b) compared with the LES.
The wind speed (ΔWS119) and TKE (ΔTKE119) differences, calculated as the BASE case minus the coarsened LES (Fig. 4k–n), are small upstream and beside the wind farm for both aligned and staggered layouts. Faint blue bands of negative ΔWS119 appear outside the spanwise averaging region, caused by stronger acceleration around the wind farm in the LES. Within the farm, ΔWS119 transitions from slightly positive in the first few rows, to near-zero at row 4, and then to negative further downstream. The strongest negative wind speed differences occur in the near-farm wake (11.2 km 15 km), followed by a modest recovery but remain between −0.5 and −1 m s−1 in the far wake of the farm (X> 20 km) for the aligned layout (Fig. 4k). The BASE case overestimates TKE compared to the aligned LES in the first turbine row and underestimates it in rows 3 and further downstream. In the near-farm wake (11.2 km 15 km), the TKE remains underestimated but recovers further downstream (X> 20 km), where the agreement with the LES is excellent. Wind speed differences are smaller for the staggered layout (Fig. 4m) owing to its stronger momentum extraction, which produces a larger wind speed deficit.
3.3 Row-averaged streamwise power patterns
This section evaluates streamwise changes in row-averaged power (i.e., averaged across turbines within the same row) for the TKE (Fig. 6a) and grid resolution (Fig. 6b) simulation subsets. These results reflect both the magnitude of wake effects owing to momentum extraction by the turbines and the ability of this waked flow to recover momentum within the wind farm.
Compared to both the aligned and staggered LES, there is excellent agreement in the first-row-averaged power output (∼ 5 MW; Fig. 6a), which stems from the matched inflow profiles (Fig. 3) and the implementation of the Fitch WFP correction (Vollmer et al., 2024). This agreement indicates that turbine power is consistently modeled across both simulation frameworks, enabling a meaningful evaluation of model-specific biases. The MAV and MAVDX12D cases exhibit lower power due to the absence of an induction correction, while the DX2D and DX2DTKE100 cases slightly overestimate first-row power (Fig. 6b) as a result of marginally stronger inflow wind. Additionally, increasing the farm-added TKE enhances row-averaged power output by promoting more efficient wake recovery via momentum transport into the farm.
In the aligned LES, the power drops sharply in the second row (to ∼ 2 MW) and is followed by a gradual power recovery downstream (Fig. 6a, b), as is often observed in LES studies of dense offshore wind farms with an aligned layout (Allaerts and Meyers, 2017; Stevens and Meneveau, 2017; Stieren and Stevens, 2022; Stipa et al., 2024). For the staggered layout, the power decrease is smaller because the effective streamwise distance between turbine rows doubles compared to the aligned layout (Stieren and Stevens, 2022). None of the NWP-WFP simulations using Fitch capture the sharp drop in power, instead displaying a more gradual pattern of power decrease. The MAV and MAVDX12D cases (Fig. 6a) show agreement with the aligned LES due to a more accurate representation of subgrid wake effects, while only the DX2D and DX2DTKE100 cases (Fig. 6b) achieve similar agreement through their finer spatial resolution (ΔX= 2D). Coarser-resolution Fitch cases, regardless of the added TKE (Fig. 6a), tend to overestimate power in the upstream half of the farm when considering the aligned LES as the reference. This power overestimation results from weaker wake losses, as the coarse NWP-WFP grid (ΔX= 1 km) dilutes wake structures spatially. This limitation has been previously documented (Archer et al., 2020; Sanchez Gomez et al., 2024).
At finer resolution (cases DX2D and DX2DTKE100), wakes become sharper and induce more realistic power deficits in turbine rows 2–4 (Fig. 6b) compared with the aligned LES. The absence of power recovery beyond the second row in the NWP-WFP simulations, compared to the LES (Fig. 6a, b), likely stems from insufficient wake recovery, an aspect discussed further in Sect. 3.4.
Variations in turbine power can be explained by the energy balance within the wind farm. The kinetic energy of the wind that is converted into turbine power (momentum extraction) is resupplied by turbulent transport towards the wind farm and its wake in the vertical and lateral directions (momentum/wake recovery) (Vermeer et al., 2003; Stieren et al., 2022). The relation between momentum extraction and wake recovery within the wind farm thus dictates how much kinetic energy is available at the wind-farm exit.
In coarser NWP-WFP simulations, the WFPs apply the turbine-induced momentum sink over the grid cell volume, which effectively smooths the wind speed deficit within the cell. This representation leads to weaker local deficits at downstream turbines and consequently to higher power production. The associated increase in turbine-induced momentum extraction influences the wind speed at the wind-farm exit. The MAV scheme mitigates overestimated momentum extraction by accounting for subgrid turbine–turbine wake interactions, resulting in more realistic power levels and wind-farm exit wind speeds. As a result, the inflow to the near-farm wake is more accurately represented when subgrid wake effects are included.
3.4 Intra-farm, near-farm, and far-wake recovery
Here, we assess how the streamwise evolution of the wind-farm wake is affected by changing the added TKE coefficient and WFP (Fig. 7) and the grid resolution (Fig. 8). The time-averaged wind speed and TKE are evaluated at hub height and averaged in the spanwise direction within the bounds (Y= −0.923 and 5.307 km) of the horizontal dashed lines represented in Fig. 4, the lateral extent of the wind farm in the reference BASE case. Furthermore, to mitigate averaging errors from the coarse mesoscale resolution near the spanwise boundaries, all results are first interpolated to a higher-resolution grid (ΔX= 50 m).
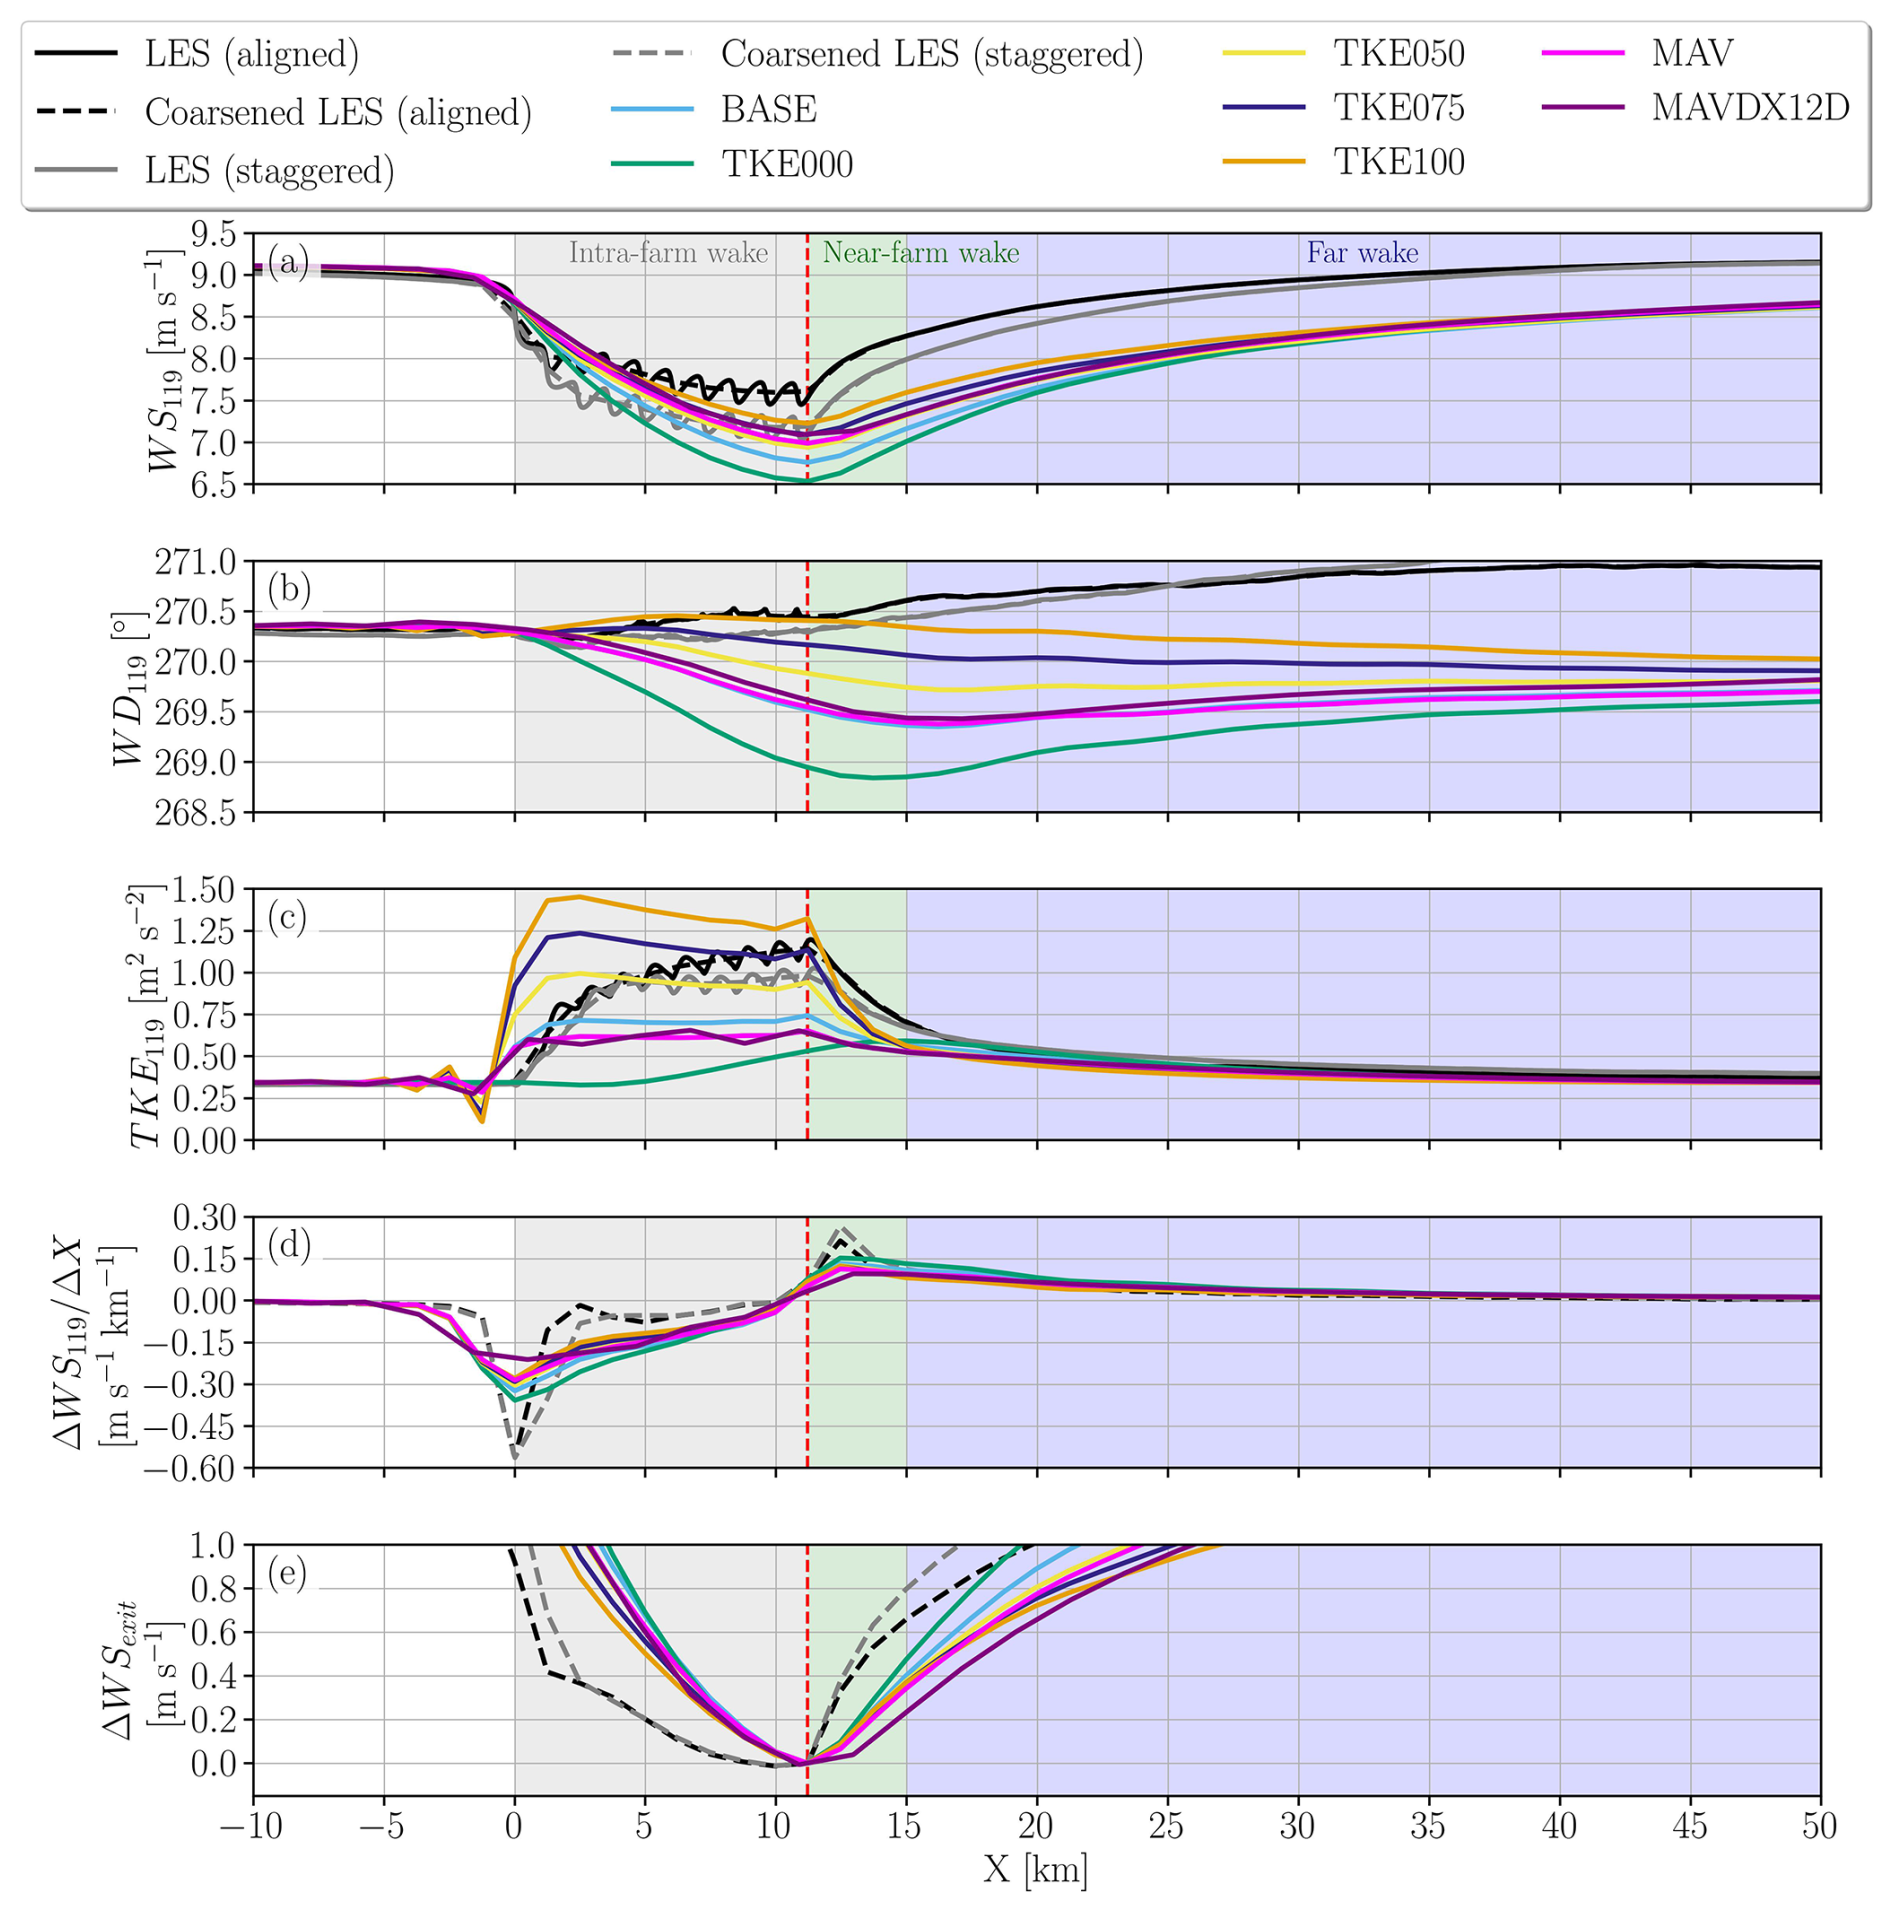
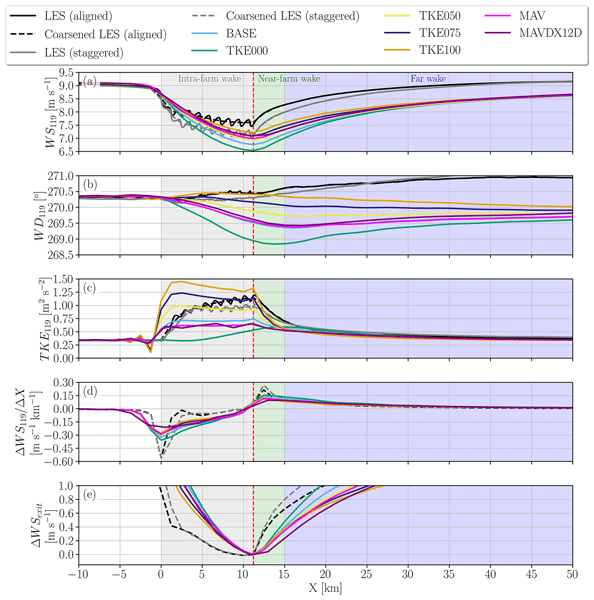
Figure 7Streamwise variation in spanwise averages over the wind-farm area of hub-height wind speed (a), wind direction (b), TKE (c), streamwise gradient of wind speed (d), and wind speed change relative to the wind-farm exit (e) for the aligned and staggered LES at full resolution, coarsened LES, and NWP-WFP cases. The colored background areas indicate the streamwise extent of the intra-farm wake (gray), near-farm wake (green), and far wake of the farm (blue). The vertical dashed red line marks the wind-farm exit.
From a control-volume perspective of the wind farm, momentum extraction and wake recovery act simultaneously within the intra-farm region, although at the turbine scale, extraction is localized at the rotor and recovery occurs downstream. The coarse Fitch simulations slightly underestimate the wind speed deficit in the first three turbine rows of the wind farm but overestimate the deficit further downstream (Fig. 7a) relative to the aligned LES. However, the staggered LES produces a stronger wind speed deficit that is closer to the NWP-WFP cases than the aligned LES. This result demonstrates that the performance of NWP-WFP simulations is sensitive to wind-farm layout and wind direction. Notably, the cases with α values of 75 % and 100 % show clear improvement at the wind-farm exit and in the near-wake region (X< 15 km) due to the enhanced momentum entrainment into the wake associated with the larger TKE.
The MAV cases are superior to the BASE Fitch case because the improved representation of subgrid wake effects leads to better turbine power and momentum extraction predictions (Ma et al., 2022a). Because of the smaller momentum extraction relative to the BASE case, the added TKE is also smaller. The similar trends in most variables (Fig. 7a–c) between the coarser MAVDX12D and the finer MAV demonstrate the consistency of this WFP across different spatial resolutions.
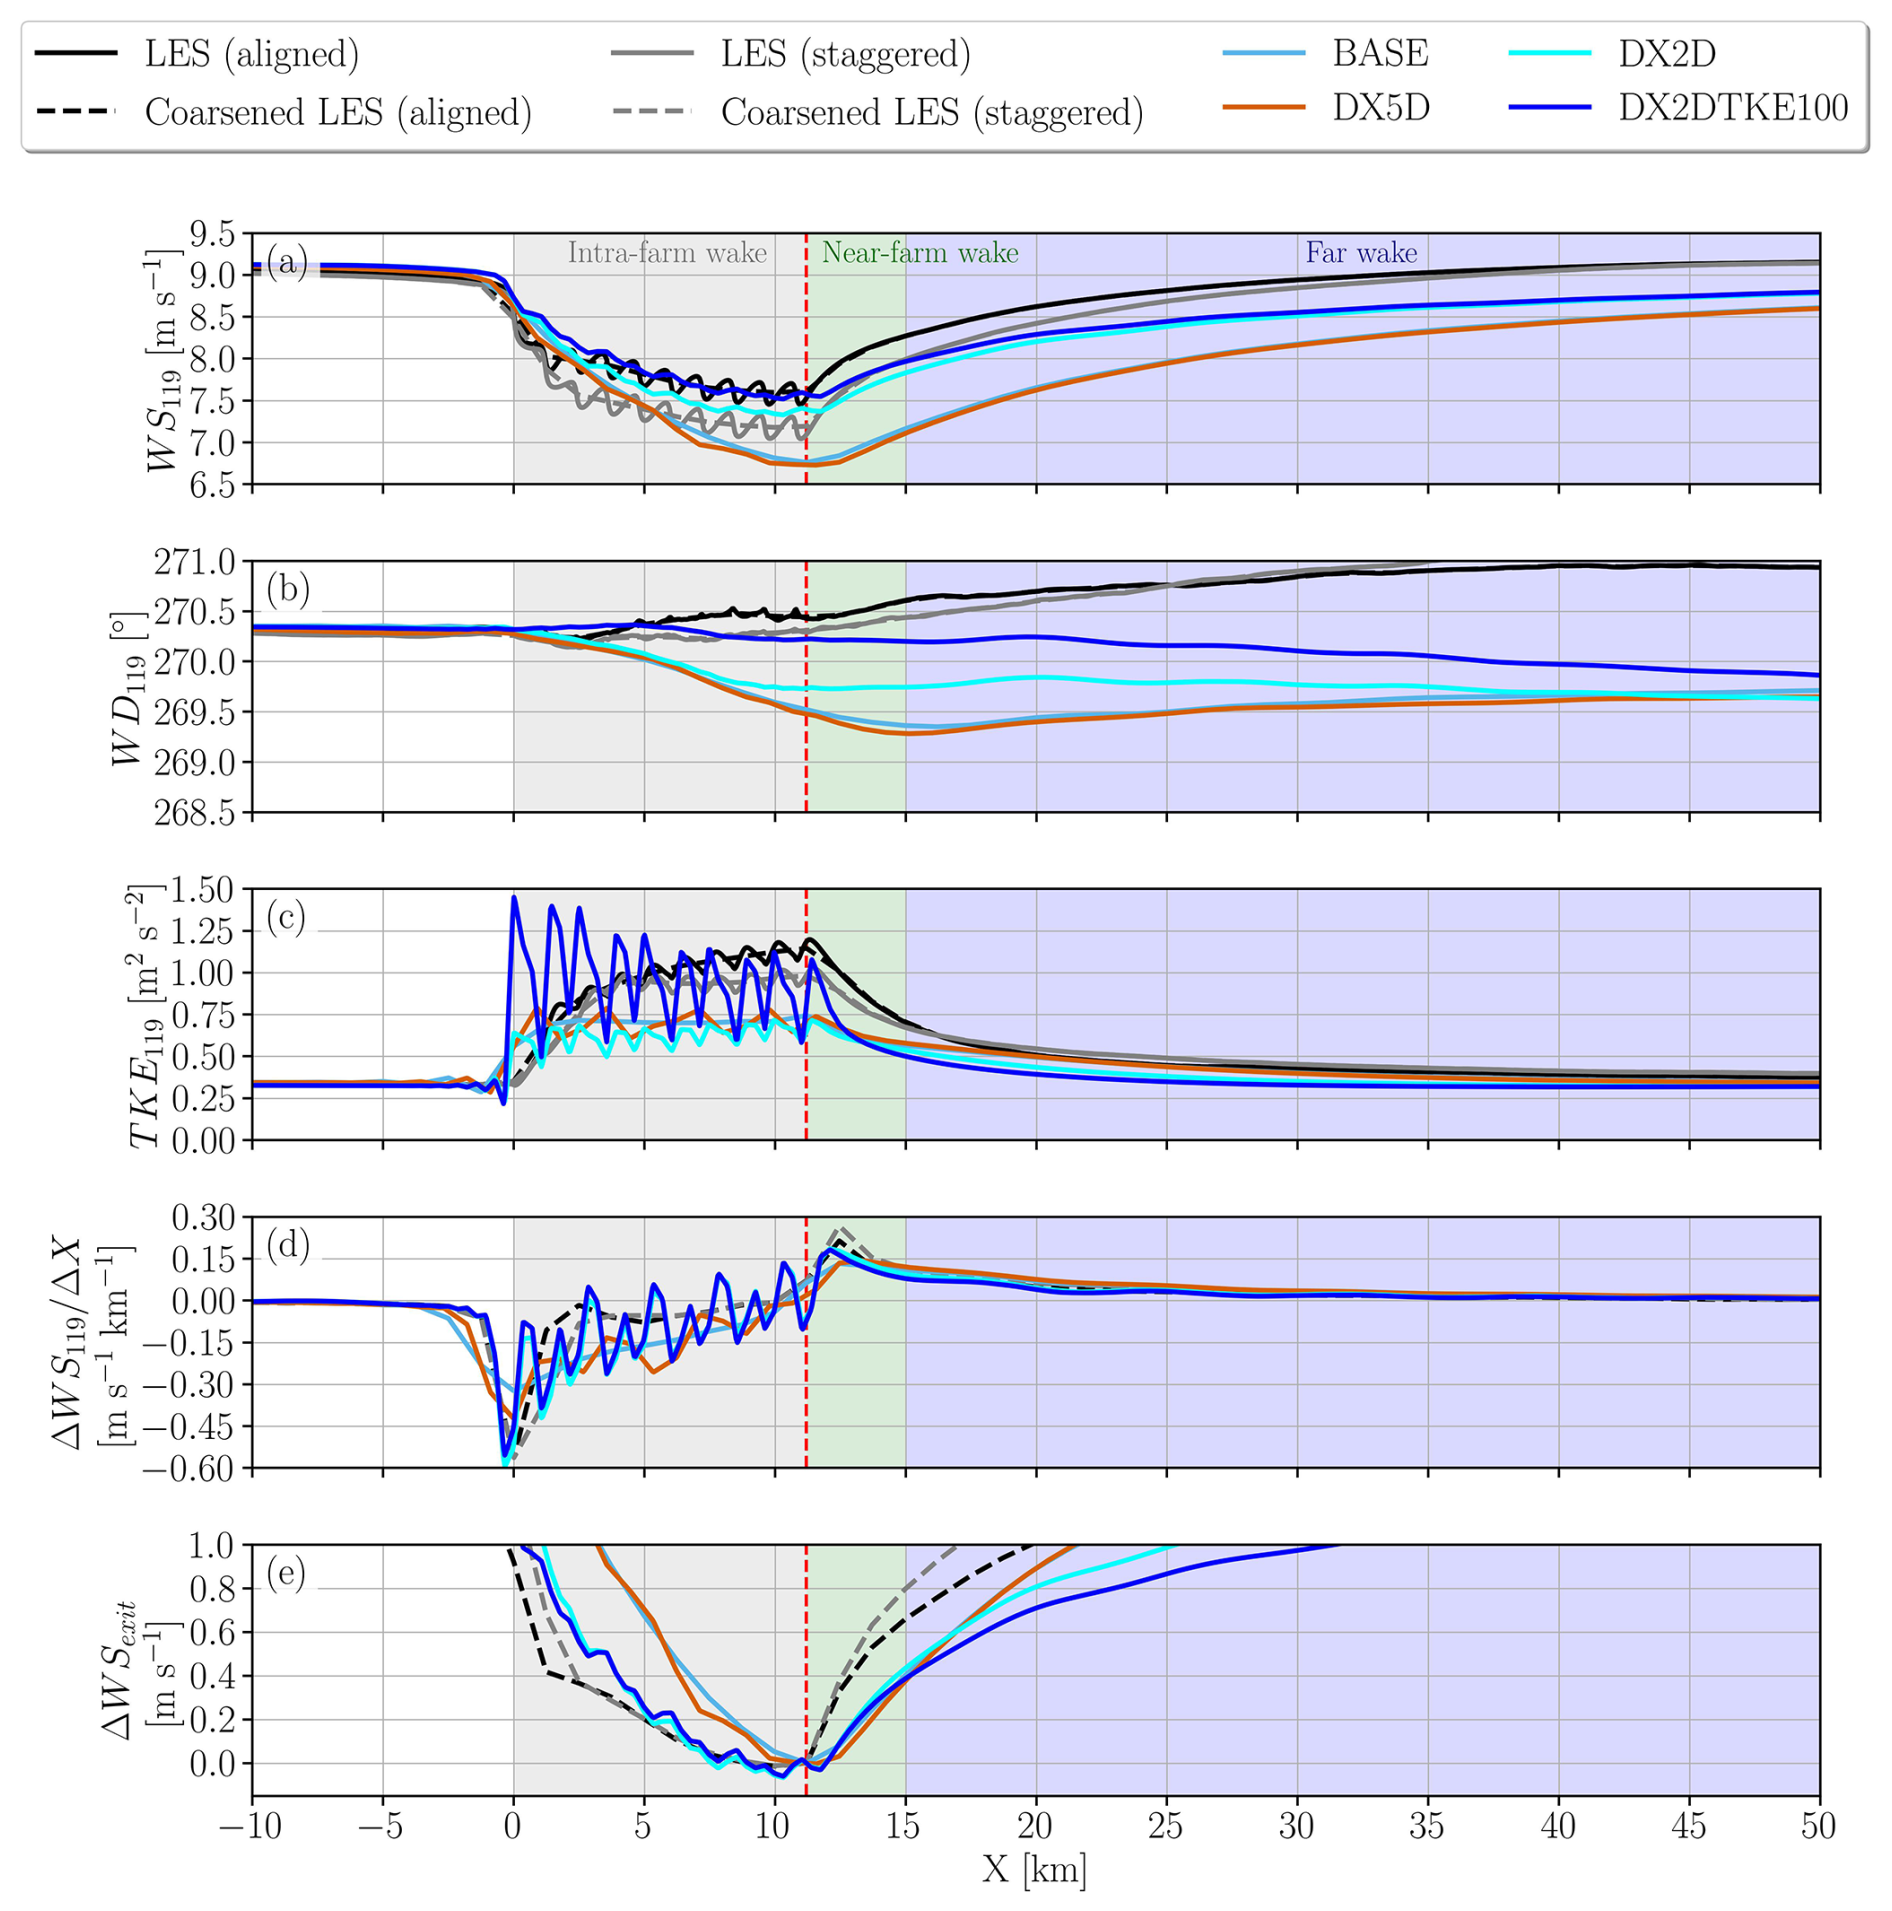
Simulations with the finest grid resolution (DX2D and DX2DTKE100) improve the representation of wind speed in the intra-farm and near-farm wake regions (Fig. 8a, d). This improvement is first attributed to the more realistic predictions of turbine power in these cases (Fig. 6b), which imply a more accurate extraction of momentum by the wind farm. As a result, the generated wake exhibits a wind speed deficit that more closely matches the aligned LES near the wind-farm exit.
The combination of momentum extraction and wake recovery inside the wind farm creates the wind speed and TKE conditions at the farm exit (the vertical dashed red line in Fig. 7). This condition at the farm exit is relevant for the subsequent recovery of the near-farm wake. Among the cases varying the TKE coefficient (Fig. 7a), TKE100 most closely approximates the aligned LES at the farm exit. The TKE000 case is the worst performing because the momentum extraction is not counterbalanced by the wake recovery within the farm. The MAV cases perform better than Fitch's BASE case and would possibly perform even better with more added TKE considering the aligned LES.
The momentum extraction by the turbines ceases in the near-farm wake region so that the wake recovery rates can be evaluated in isolation. The streamwise gradient of wind speed () and the wind speed change relative to the wind-farm exit (ΔWSexit) quantify the near-farm wake recovery (Fig. 7d, e). The greatest divergence between the NWP-WFP simulations and the LES cases occurs in the near-farm wake (11.2 15 km), where the NWP-WFP simulations all fail to capture a peak in the recovery rate (Fig. 7d). Thus, the wake recovery in the LES is faster immediately after the wind-farm exit, which is also noticeable in the shape of the streamwise wind speed curvature (Fig. 7a). Even cases TKE100 and MAV, which most closely approximate the LES wind speed in the near-farm wake, underestimates the wake recovery rate downstream. This discrepancy suggests that a key mechanism for wake recovery is not adequately captured by the NWP-WFP simulations in the near-farm wake.
The near-farm wake recovers slightly faster in finer-resolution cases, as evident in both the wind speed (Fig. 8a) and the streamwise gradients in wind speed (Fig. 8d), which now reproduce the peak displayed by the LES. Finally, adding more TKE (α= 100 %) in the high-resolution simulation mostly influences the momentum extraction within the farm but has a weak influence on wake recovery rates.
Even though the difference in near-farm wake recovery rates between the NWP-WFP simulations and the LES occurs over a relatively short distance (∼ 1–2 km), it produces a measurable bias in wind speeds. Even if some cases match the wind speed (TKE100 and aligned LES) at the farm exit (Fig. 7a), a departure between the two wind speed curves occurs downstream. Between the wind-farm exit at 11.2 and 15 km, the gain in wind speed is about 0.65 m s−1 and 0.8 m s−1 for the aligned and staggered LES (Fig. 7e), respectively. The change in wind speed is much smaller for the coarser-resolution NWP-WFP cases, in the range between 0.2 and 0.5 m s−1 (Fig. 7e). Among the NWP-WFP simulations, case TKE000 displays the fastest near-farm wake recovery rate because of the largest wind speed deficit. On the other hand, the higher resolution cases gain about 0.4 m s−1 (Fig. 8e). Subtracting the wind speed change in the aligned LES with both the coarse and fine NWP-WFP cases, a difference of 0.15–0.50 m s−1 is found. These values represent the bias in wind speed associated with the slower near-farm wake recovery in the NWP-WFP simulations.
The bias created in the near-farm wake persists far downstream. Thus, none of the NWP-WFP simulations matches the LES wind speed in the far wake (Figs. 7a and 8a), despite the similar wake recovery rates in that region (Figs. 7d and 8d). The bias in wind speed decreases in the far wake for cases with strong deficit, such as BASE and TKE000. However, the bias remains mostly unchanged for cases with weaker deficit at the farm exit, such as TKE100, DX2D, and DX2DTKE100. Overall, regardless of the TKE coefficient, all the mesoscale simulations display a consistent negative wind speed bias ranging from approximately −0.7 m s−1 (TKE000) to −1.3 m s−1 (TKE100) in the near-farm wake at X= 15 km. Despite some case-dependent reduction with downstream distance, by X= 50 km the bias converges to approximately −0.6 m s−1 across all cases, indicating that errors introduced near the farm are not recovered further downstream.
In the LES, TKE builds up gradually, row by row, whereas in the NWP-WFP cases with a TKE source (α> 0), the TKE peaks near the first few turbine rows and then decreases monotonically downstream (Fig. 7c). The TKE remains nearly constant within the farm in case BASE and is small throughout in case TKE000, which lacks an explicit TKE source. Interestingly, cases with α values of 25 % and 50 % better match the TKE levels near the first turbine rows, consistent with results from Archer et al. (2020), while those with higher α (75 %, 100 %) better match the TKE in the latter half of the farm, in line with other findings (Larsén and Fischereit, 2021; Ali et al., 2023).
A crucial insight is that turbine-added TKE does not evolve properly within the wind farm in the NWP-WFP simulations, even when its magnitude matches or exceeds that of the LES in the first few turbine rows. The underlying issue therefore lies not only in the quantity of turbine-added TKE, as a gradual reduction in intra-farm TKE persists across several cases (TKE050–TKE100). More importantly, TKE decreases more rapidly than in the LES in the near-farm wake (Fig. 7c). While this behavior in the NWP-WFP simulations could in principle be attributed to excessive dissipation, Sect. 4.1.2 provides additional evidence that insufficient shear production of TKE, rather than dissipation, plays the dominant role.
Lastly, the underestimation of the subtle anti-clockwise turning of the wake depends on turbulent mixing (Fig. 7b). For the wake turning, this behavior results from downward turbulent momentum entrainment, which transports more veered wind from aloft into the wake (van der Laan and Sørensen, 2017; Gadde and Stevens, 2019; Englberger et al., 2020; Stieren et al., 2022; Kasper et al., 2024). Accordingly, cases with weaker entrainment, such as TKE000 and BASE, show a stronger directional bias. Although the absolute differences in wind direction are small (about 1° between TKE000 and TKE100), over long distances these differences may accumulate into downstream power losses for adjacent wind farms.
3.5 Coarse-grid effects on wind-farm wake spatial gradients
In this section, we examine two aspects of the comparison between the LES and the NWP-WFP BASE and TKE100 cases. First, we evaluate how the non-averaged spatial gradients in the LES influence wake recovery and how the horizontal and vertical gradients in the non-averaged LES compare with those from the NWP-WFP simulations. Second, the coarsened (averaged) LES is used to evaluate the streamwise evolution of wind speed and TKE in the wind-farm wake and compare it with the NWP-WFP cases. The wake recovery physics observed in the coarsened LES still corresponds to the gradients and momentum fluxes in the LES at its native non-averaged resolution. The coarsened LES is only used as a diagnostic for comparison and does not represent the actual dynamics driving wake recovery.
Figures 9 and 10 intentionally focus on localized profiles at specific turbine-aligned grid cells to highlight differences in resolved gradients between the NWP-WFP simulations and the non-averaged LES. While spanwise averaging would yield different absolute TKE levels, such averaging would obscure the local shear and turbulence structures that directly control wake recovery in the near-farm region. These figures are therefore not intended to represent farm-averaged behavior but rather to diagnose the structural deficiencies of mesoscale simulations at the grid-cell scale.
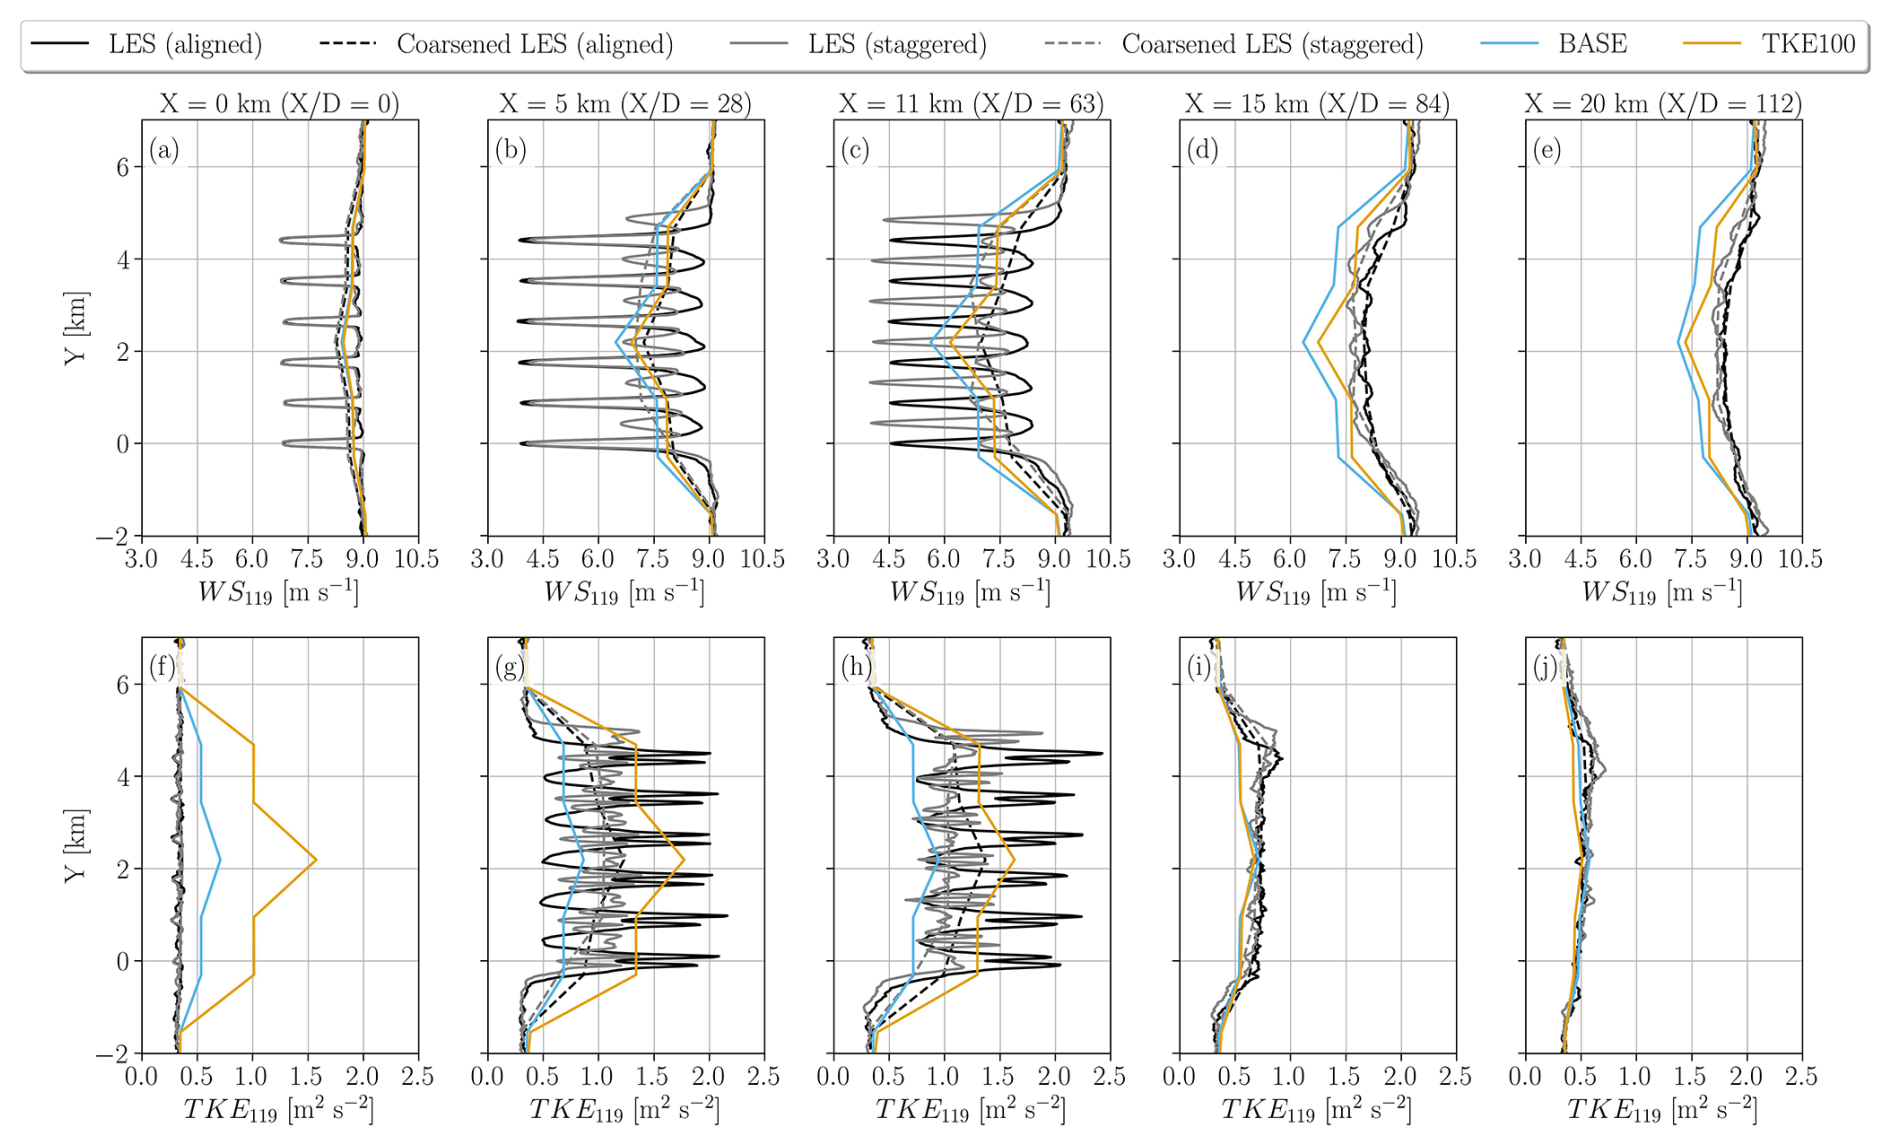
Figure 9Time-averaged wind speed (a–e) and TKE (f–j) at hub height (119 m a.g.l.) along spanwise Y lines at specific streamwise distances X (expressed as in parentheses) for the aligned and staggered layout LES, coarsened LES, and the NWP-WFP BASE and TKE100 cases.
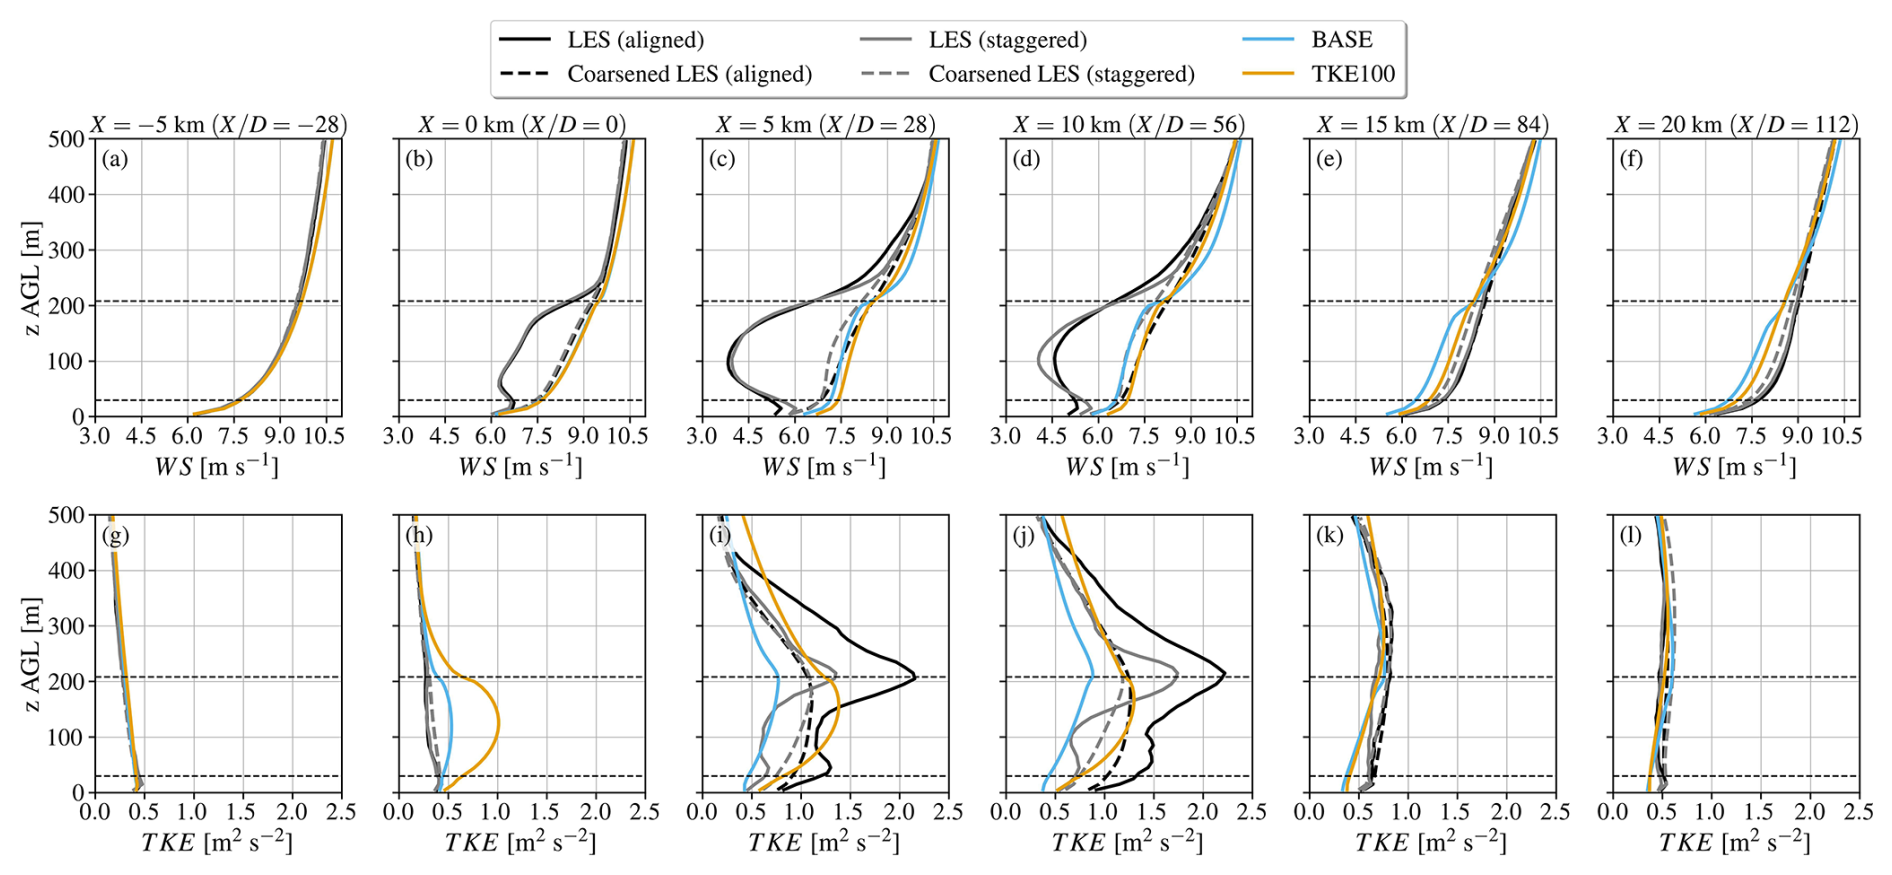
Figure 10Vertical profiles of time-averaged wind speed (a–f) and TKE (g–l) at specific streamwise distances X (expressed as in parentheses) probed over the southernmost column of turbines near Y= 0 km. The aligned and staggered layout LES and NWP-WFP cases BASE and TKE100 are shown. The dashed horizontal lines represent the rotor top and bottom tips.
The discrepancy between the coarsened aligned LES wind speed profile and those from the BASE and TKE100 cases increases with downstream distance. Stronger momentum extraction occurs in the staggered LES than in the aligned LES, highlighting the sensitivity of wake generation to wind-farm layout and wind direction. Figure 9 shows hub-height profiles of wind speed (Fig. 9a–e) and TKE (Fig. 9f–j) along the spanwise (Y) direction at selected streamwise distances: the wind-farm entrance (X= 0 km), middle (X= 5 km), exit (X= 11.2 km), and two downstream locations (X= 15 and 20 km). At the entrance (X= 0 km), the spatially averaged LES gradients in wind speed (both coarsened LES) agree reasonably well with both NWP-WFP cases (Fig. 9a). However, deviations become noticeable at X= 5 km (Fig. 9b), especially between the coarsened aligned LES and the BASE case, and grow progressively larger through X= 11.2 and 15 km (Fig. 9c and d). At X= 20 km (Fig. 9e), the discrepancy remains large. The narrow band of reduced wind speed and increased TKE near the center of the wind farm in the Y direction is created by the existence of two turbines within that grid cell (Fig. 2b), as discussed in Sect. 3.2.
From the standpoint of spatial wind speed gradients, differences between both the aligned and staggered layout LES and the NWP-WFP cases are striking. While the coarsened LES profile appears similar to those of the NWP-WFP cases within the wind farm (0 11.2 km, 0 63), this similarity hides strong localized gradients in the wakes that only appear in the non-averaged LES (Fig. 9a–c). These strong localized gradients are expected with a fine-resolution grid and facilitate faster wake recovery in the LES. Notably, model discrepancies in wind speed profiles grow with streamwise distance while these strong localized gradients persist (0 11.2 km, 0 63) but no longer increase between X= 15 and 20 km ( 84 and 112, respectively), where the LES gradients become smoother and more comparable to those in the NWP-WFP cases.
This behavior suggests the problem lies upstream, within the intra-farm and near-farm wake regions. Once the strong localized gradients in the wakes disappear in the LES, the differences between models stabilize. Therefore, the persistent lower wind speeds in NWP-WFP simulations in the far wake of the farm (Fig. 9d, e) are not caused by conditions there but rather reflect limitations in representing spatial gradients and turbulent mixing within the intra-farm and near-farm wake regions. As conceptually illustrated in the Introduction, the slow wake recovery (Fig. 1b, c) and TKE decrease (Fig. 1e, f) are evident in the results shown in Fig. 9c, d, h, i, respectively.
Vertical profiles reveal how wind-farm effects modify wind speed (Fig. 10a–f) and TKE (Fig. 10g–l) gradients in each simulation. Vertical profiles are sampled along the southernmost turbine column (near Y= 0 km) at selected streamwise locations to examine how each simulation resolves local vertical gradients. The data are not spatially averaged, allowing direct assessment of the gradients resolved by each grid. Upstream of the farm, wind speed (Fig. 10a) and TKE (Fig. 10g) profiles are nearly identical across simulations. Within and downstream of the farm, momentum extraction (Fig. 10b–d) and TKE production (Fig. 10h–j) alter these profiles. In the LES, the stronger wind speed deficit enhances vertical shear, especially near the rotor top tip, by 28 (Fig. 10b–d), leading to intense TKE generation in the same region (Fig. 10i–j). Combined, the stronger vertical wind speed gradient and enhanced TKE in the LES contribute to a faster intra-farm and near-farm wake recovery. Mesoscale simulations consistently reproduce the streamwise evolution of the wind speed and TKE profiles relative to the coarse LES for the aligned layout. The TKE100 case agrees more closely with the coarse LES than the BASE case, particularly for TKE. Nonetheless, negative biases in wind speed and TKE increase downstream.
Both LES show a much sharper local wind speed deficit (Fig. 10b–d), while in the NWP-WFP simulations the deficit is diluted due to spatial averaging over the coarser horizontal grid (ΔX∼ 1 km). This horizontal averaging dilutes the momentum sink effect, weakening both horizontal and vertical gradients. As a result, even with sufficient vertical resolution (Δz∼ 10 m), the vertical structure of the wake is poorly captured in the NWP-WFP simulations due to the coupling between horizontal and vertical gradients. Similar to the mesoscale simulations, the coarse LES exhibits weaker vertical gradients owing to horizontal averaging.
Further evidence of the critical role of the weaker spatial gradients in intra-farm and near-farm wake recovery emerges when evaluating the effect of TKE. From a turbulent mixing perspective, increased TKE accelerates wake recovery: for instance, the TKE100 case displays faster recovery than the BASE case, as also shown by Rosencrans et al. (2024). However, despite exhibiting more TKE than both the coarsened LES throughout much of the wind farm (0 11.2 km), including earlier onset of added TKE (Fig. 9f), the TKE100 wake still recovers slower than that of the LES. These findings highlight that enhancing farm-added TKE alone is insufficient to compensate for the weaker spatial gradients governing wake recovery.
4.1 Mechanisms through which mesoscale resolution affects wake recovery
Two mechanisms associated with mesoscale grid coarseness directly affect wake recovery through (i) turbulent mixing and (ii) spatial gradients in the wind velocity field.
The recovery of momentum in wind turbine and near-farm wakes occurs through lateral and vertical turbulent entrainment of momentum, expressed as divergences of and , respectively (Vermeer et al., 2003; Cal et al., 2010; Calaf et al., 2010; Abkar and Porté-Agel, 2015a; Porté-Agel et al., 2020; Stieren and Stevens, 2022; van der Laan et al., 2023). Here, u′, v′, and w′ denote fluctuations relative to the time-averaged wind velocity components U, V, and W in the streamwise, spanwise, and vertical directions, respectively. These momentum fluxes are commonly approximated using the Boussinesq hypothesis (Boussinesq, 1897; van der Laan et al., 2023) or equivalently the K theory (Stull, 1988):
Here, Km is the eddy viscosity, which depends on turbulence and atmospheric stability (Stull, 1988), and and are the spanwise and vertical gradients of wind speed (for convenience, we assume the mean flow aligns with the x direction). The eddy viscosity Km increases with TKE, and therefore wakes tend to recover more rapidly under convective conditions compared to neutral or stable conditions (Magnusson and Smedman, 1994; Iungo et al., 2013; Fitch et al., 2013a; Mirocha et al., 2015; Abkar and Porté-Agel, 2015a; Stevens and Meneveau, 2017; Bodini et al., 2017; Lundquist et al., 2019; Rosencrans et al., 2024; García-Santiago et al., 2024).
The two mechanisms identified above affect wake recovery as described by Eqs. (1) and (2). Weaker spatial gradients directly limit wake recovery through the and terms, while low turbulence indirectly reduces wake recovery by decreasing the eddy viscosity Km.
Next, we discuss these two issue in more detail. We begin with the role of the weaker wind speed gradients and their consequences for wake recovery, followed by the impact of artificially low TKE in the farm region.
4.1.1 Coarse-grid resolution weakens spatial wind speed gradients
The first and perhaps most critical problem is that NWP-WFP simulations cannot accurately represent the spatial wind speed gradients that drive intra-farm and near-farm wake recovery because of the coarse grid. Many studies have shown that WFPs can reproduce wind speed deficits at turbine grid cells that generally resemble those from LES (Vanderwende et al., 2016; Abkar and Porté-Agel, 2015b; Archer et al., 2020; Peña et al., 2022; García-Santiago et al., 2024). However, a closer look at the downstream regions reveals a slower wake recovery in NWP-WFP simulations compared to LES (e.g., Fig. 4a, c in Vanderwende et al. (2016); Fig. 7 in Archer et al. (2020); Figs. 11–13 in Peña et al. (2022); Figs. 4 and 7 in García-Santiago et al. (2024)). Here, we demonstrate that this discrepancy arises because the momentum sink term in WFPs is not resolved by the grid, and thus is not severely affected by its coarseness, whereas the wake recovery is fundamentally resolved by the grid. Specifically, the NWP-WFP simulations exhibit inherently weaker horizontal (Fig. 9a–c) and vertical (Fig. 10b–d) gradients in the wind velocity field within the intra-farm and near-farm wake regions, i.e., and , respectively. While discrete velocity differences evaluated at WRF grid resolution can locally yield gradients comparable to or even exceeding those in a coarsened LES (Fig. 9d), they do not organize into shear structures comparable to those present in the native-resolution LES. In contrast, the LES at native resolution exhibits spatially coherent and persistent shear layers that extend downstream and continuously drive turbulence production and wake recovery, a structural feature that is not maintained in the mesoscale representation.
As a result, even when farm-added TKE levels are comparable to or exceed those in the LES, the intra-farm and near-farm wake recovery (driven by the weaker gradients) remains underestimated in the NWP-WFP simulations (Sect. 3.4 and 3.5). The fact that simulations with the finest grid resolution (DX2D and DX2DTKE100), which better resolve spatial gradients, improve the representation of the near-farm wake recovery (Fig. 8a, d, e) supports this argument. Weaker spatial gradients in NWP-WFP simulations have also been noticed by others (Fischereit et al., 2022b). Relatedly, in another study using WRF and the Fitch WFP (Pryor et al., 2020), shorter wind-farm wakes result from finer grid resolutions, which could in part be explained by the impact of the spatial gradients on wake recovery.
4.1.2 Insufficient shear production causes low TKE
The second problem is the relatively fast decrease in farm-added TKE in the NWP-WFP simulations compared to the LES. This comparatively low TKE in the near-farm wake reduces turbulent mixing, effectively lowering the eddy viscosity Km, and further slowing wake recovery. Even when large quantities of turbine-added TKE are injected (e.g., α= 75 % or 100 %), the TKE fails to accumulate row-by-row as it does in the LES (Fig. 7c). Across all tested TKE enhancement levels (α= 25 %–100 %), the NWP-WFP TKE returns to near-ambient levels within 5 km downstream, almost twice as fast as in the LES.
A compelling hypothesis is that the rapid reduction in TKE is not merely a dissipation artifact but instead a consequence of weaker spatial gradients in the mesoscale simulations. This interpretation is supported by the close agreement between NWP-WFP and LES TKE levels in the inflow (Fig. 3d) and in the far wake (Fig. 7c), indicating that the mesoscale model does not inherently over-dissipate TKE. Rather, the limitation emerges in the intra- and near-farm wake, where TKE is insufficiently generated because shear production depends on spatial gradients (Mellor and Yamada, 1982; Nakanishi and Niino, 2009) that are weaker at mesoscale resolution. The coupling between TKE, shear production, and dissipation is illustrated in Appendix B. While this limitation can be partially offset within the wind farm through turbine-added TKE, it becomes evident downstream, where the WFP is inactive and TKE levels fall below those of the LES. This mechanism is therefore intrinsic to NWP-WFP frameworks and has implications for studies that focus on modifying turbine-added TKE formulations (Fitch et al., 2012; Archer et al., 2020; Khanjari et al., 2025).
4.2 Implications
Because both problems – slow wake recovery and insufficient shear production of TKE – are linked to grid resolution, they are likely to affect wake recovery not only in WRF with the Fitch or MAV WFPs but also in other NWP and climate models that use WFPs. As such, these findings underscore the need for improved representation of both spatial gradients and turbulent mixing if WFPs are to accurately simulate wind-farm wakes and their downstream impacts. Building on this, we present implications of our work for studies of real wind-farm wake effects, where environmental and observational aspects increase the complexity of the analysis. We highlight the importance of separating wake generation (momentum extraction) from its recovery when evaluating model performance.
Some NWP-WFP simulations driven by realistic synoptic conditions have demonstrated reasonable agreement with observed wind speed deficits in wind-farm wakes, based on aircraft measurements (Siedersleben et al., 2018a, b, 2020; Larsén and Fischereit, 2021; Ali et al., 2023; van Stratum et al., 2022) and SCADA data (Sanchez Gomez et al., 2024) from offshore sites. However, discrepancies in inflow conditions between simulations and observations remain a major challenge, as they can obscure the evaluation of wake recovery. Despite this, several case studies have achieved good correspondence with observed wind speed profiles along wind-farm transects. Given the inherent spatiotemporal variability and limited control over inflow in realistic configurations, such results are promising. In our idealized setup, excellent agreement is ensured in the inflow, allowing a more direct assessment of WFP performance and limitations. These controlled conditions provide valuable guidance for improving their representation in more complex operational scenarios.
Another important issue is the separation between wake generation and recovery for modeling evaluation. The wind speed bias between the NWP-WFP simulation and the LES within the wind farm in not exclusively caused by a difference in wake recovery but also by a difference in momentum extraction. For instance, in Fig. 6b, the coarser-resolution cases BASE and DX5D have larger row-averaged power (extract more momentum) than the finer-resolution cases DX2D and DX2DTKE100. As a result, in combination with differences in wake recovery between the simulations, cases BASE and DX5D have stronger wind speed deficits (Fig. 8a). Matching the wind speed deficit predicted by LES or observations does not necessarily mean the dynamics of wake recovery are well represented in NWP-WFP simulations. For instance, a seemingly faster wake recovery was attributed to the NWP-WFP simulation in comparison with the LES, when in fact the NWP-WFP simulation generated a much weaker wake in the first place (Eriksson et al., 2015). As the stronger wake of the LES recovers momentum, it eventually matches the wind speed deficit of the weaker wake of the NWP-WFP simulation downstream. Thus, wake generation and recovery are two important aspects of wind-farm flows that need to be considered simultaneously.
The degree of wake recovery underestimation is likely sensitive to inflow wind speed, direction and atmospheric stability. For instance, the weaker ambient turbulence in stable conditions promotes longer individual turbine wakes (and thus stronger spatial gradients in wind speed) in comparison with neutral or convective conditions (Abkar and Porté-Agel, 2015a; Abkar et al., 2016b). Hypothetically, these unmixed wind speed gradients could further slow wake recovery in NWP-WFP simulations, which requires more research. Evaluating wake recovery in stable conditions is important because it is exactly when wakes are most pronounced (Magnusson and Smedman, 1994; Iungo et al., 2013; Fitch et al., 2013a; Mirocha et al., 2015; Abkar and Porté-Agel, 2015a; Bodini et al., 2017; Lundquist et al., 2019; Rosencrans et al., 2024; García-Santiago et al., 2024).
Numerical weather prediction (NWP) and climate models equipped with wind-farm parameterizations (WFPs) provide a powerful framework for simulating wind-farm cluster wakes, both onshore and offshore. In this paper, we assess the strengths and limitations of the NWP-WFP approach using the Weather Research and Forecasting (WRF) model with the Fitch et al. (2012) and MAV (Ma et al., 2022a, b) WFPs, in comparison to neutrally stratified large-eddy simulations (LES). We find that near-farm wake recovery is underestimated in NWP-WFP simulations due to its representation on a coarse mesoscale grid. This limitation leads to slow wake recovery through two interconnected mechanisms: (i) weaker spatial gradients in the wind velocity field and (ii) insufficient shear production of turbulence kinetic energy (TKE), resulting in TKE levels that decay too rapidly in the near-farm wake.
The first mechanism arises because near-farm wake recovery in the LES is driven by sharp local velocity gradients and enhanced turbulent mixing that replenishes momentum. In contrast, NWP-WFP simulations underestimate horizontal and vertical gradients due to spatial smearing at mesoscale resolution, which limits wake recovery. Differences between NWP-WFP and LES emerge within a short downstream distance of ∼ 1–2 km of the farm exit, and the bias established there persists into the far wake. Between the farm exit (11.2 km) and X= 15 km, the LES recovers approximately 0.65–0.8 m s−1, whereas NWP-WFP simulations recover only 0.2–0.5 m s−1, yielding a wind-speed bias of 0.15–0.50 m s−1. This near-farm bias is not subsequently recovered: it propagates downstream largely unchanged, reaching approximately −0.6 m s−1 at X= 50 km across all cases. Higher-resolution mesoscale simulations partially reduce this bias, and increased turbine-added TKE or subgrid wake effects offer some improvement, but neither addresses the underlying cause.
The second mechanism involves insufficient shear production of TKE. While TKE in the LES increases along the wind farm and peaks near the farm exit, NWP-WFP simulations show an early maximum followed by a monotonic decrease. In the near-farm wake, TKE returns to ambient levels more rapidly than in the LES, further limiting wake recovery. This behavior is consistent with the reduced magnitude of velocity gradients, which weakens local shear production.
A key insight is that slow near-farm wake recovery, although confined to a relatively short downstream distance, has lasting impacts on the far wake. Simulations that better resolve gradients and improve near-farm recovery also exhibit reduced far-wake wind speed biases, highlighting the importance of accurately capturing this region.
These findings stem from the mesoscale representation of wake dynamics rather than deficiencies in the WFPs themselves. The near-farm wake lies outside the direct influence of the WFPs and is governed by grid-resolved dynamics and planetary boundary layer (PBL) schemes. Within the wind farm, wake recovery and turbine-induced momentum extraction occur simultaneously and cannot be distinguished in the current analysis.
Therefore, improving wake recovery requires advances beyond current WFP formulations. While refined subgrid wakes and TKE parameterizations may improve intra-farm dynamics, addressing slow near-farm wake recovery downstream remains challenging, as WFPs do not act in this region. Future efforts should focus on improving the representation of shear-driven TKE production and developing approaches that better capture spatial variations in wake recovery across grid cells within and behind the wind farm, as recently demonstrated by García-santiago et al. (2026). Future work should also assess wake recovery under varying atmospheric stability regimes, as smoother, more mesoscale-resolvable gradients such as in convective boundary layers may improve agreement with LES, and investigate whether the 3DPBL scheme can better represent spatial gradients and turbulent mixing at finer grid resolutions (Kosović et al., 2020; Juliano et al., 2022).
This section evaluates the sensitivity of wake recovery to the thrust coefficient (CT), as outlined in Table 1. The power and thrust coefficient curves for the DTU 10 MW wind turbine are shown in Fig. A1a, b, respectively. For an inflow wind speed of approximately 9 m s−1, the turbine produces slightly over 5 MW of power, and the corresponding CT is approximately 0.81.
The value of CT=0.75 adopted in the LES (Sect. 2.1) yields wind speed deficits similar to those obtained with a fixed CT of 0.81 or with a wind-speed-dependent CT (Fig. A2a). In contrast, using a lower CT value of 0.50 results in a weaker wake and reduced TKE generation (Fig. A2c), since the TKE source term is proportional to the difference CT−CP. Therefore, regardless of whether CT is set to 0.81, 0.75, or dynamically determined based on wind speed, the main conclusions of our investigation remain unchanged.
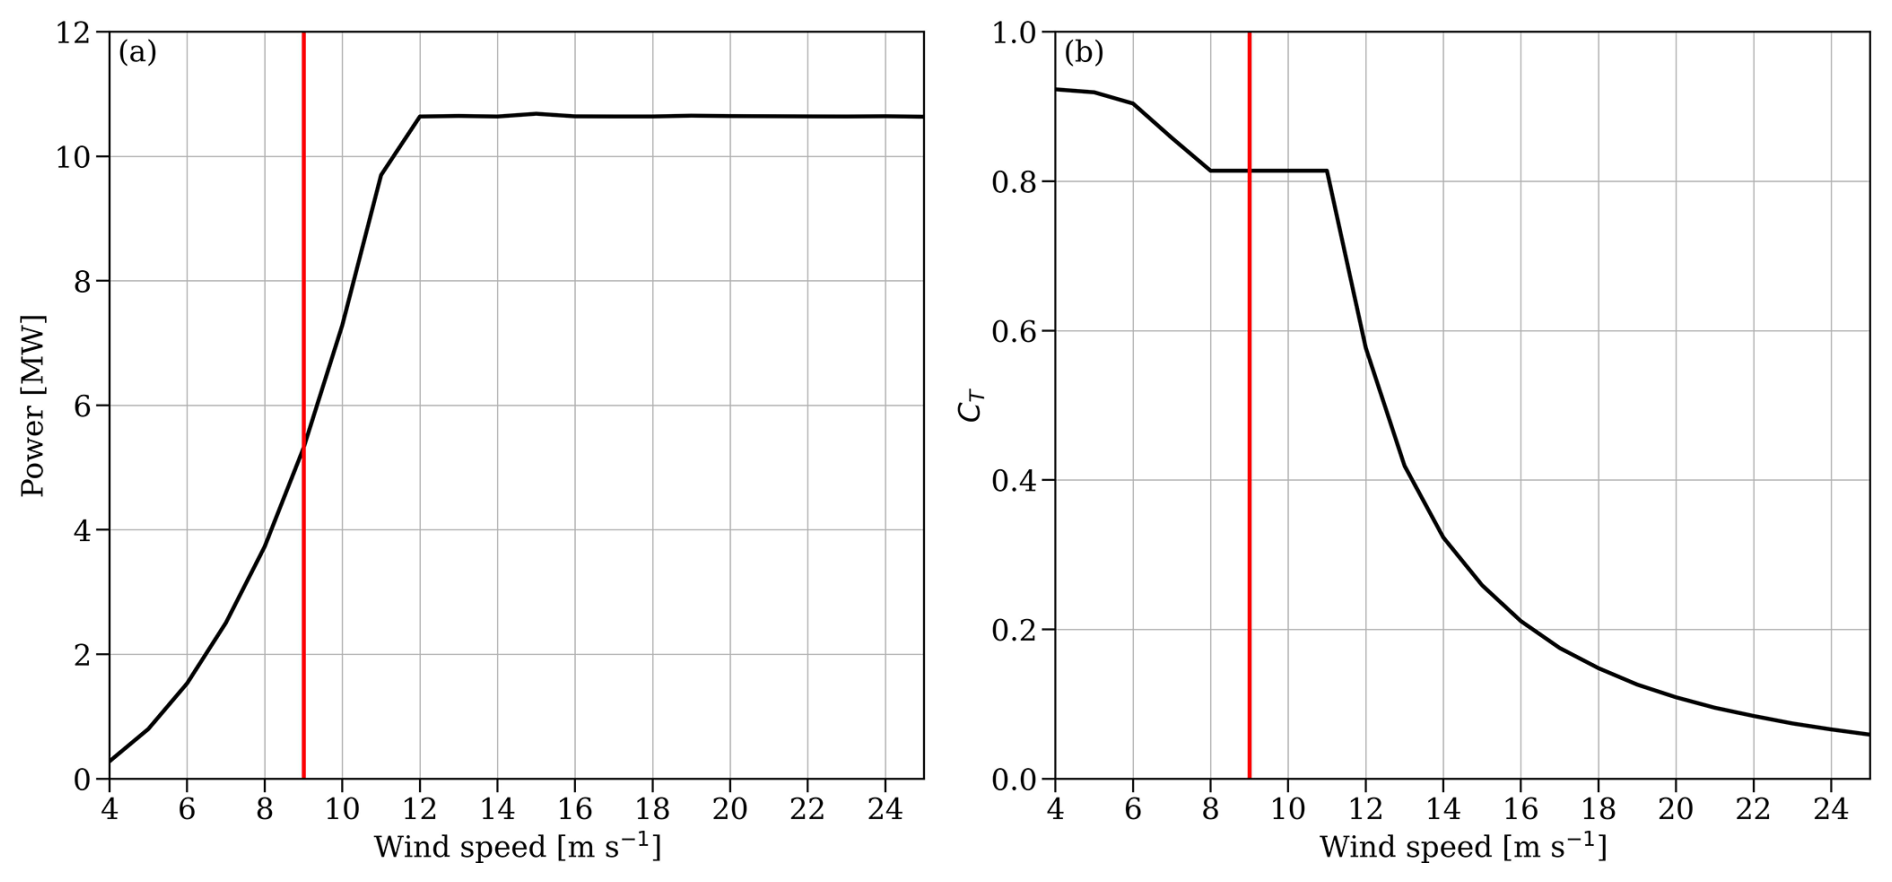
Figure A1Power (a) and thrust coefficient (b) curves as functions of wind speed for the wind turbine of the DTU 10 MW model. The vertical red line denotes the point of operation based on the hub height wind speed of approximately 9 m s−1 considered in this study.
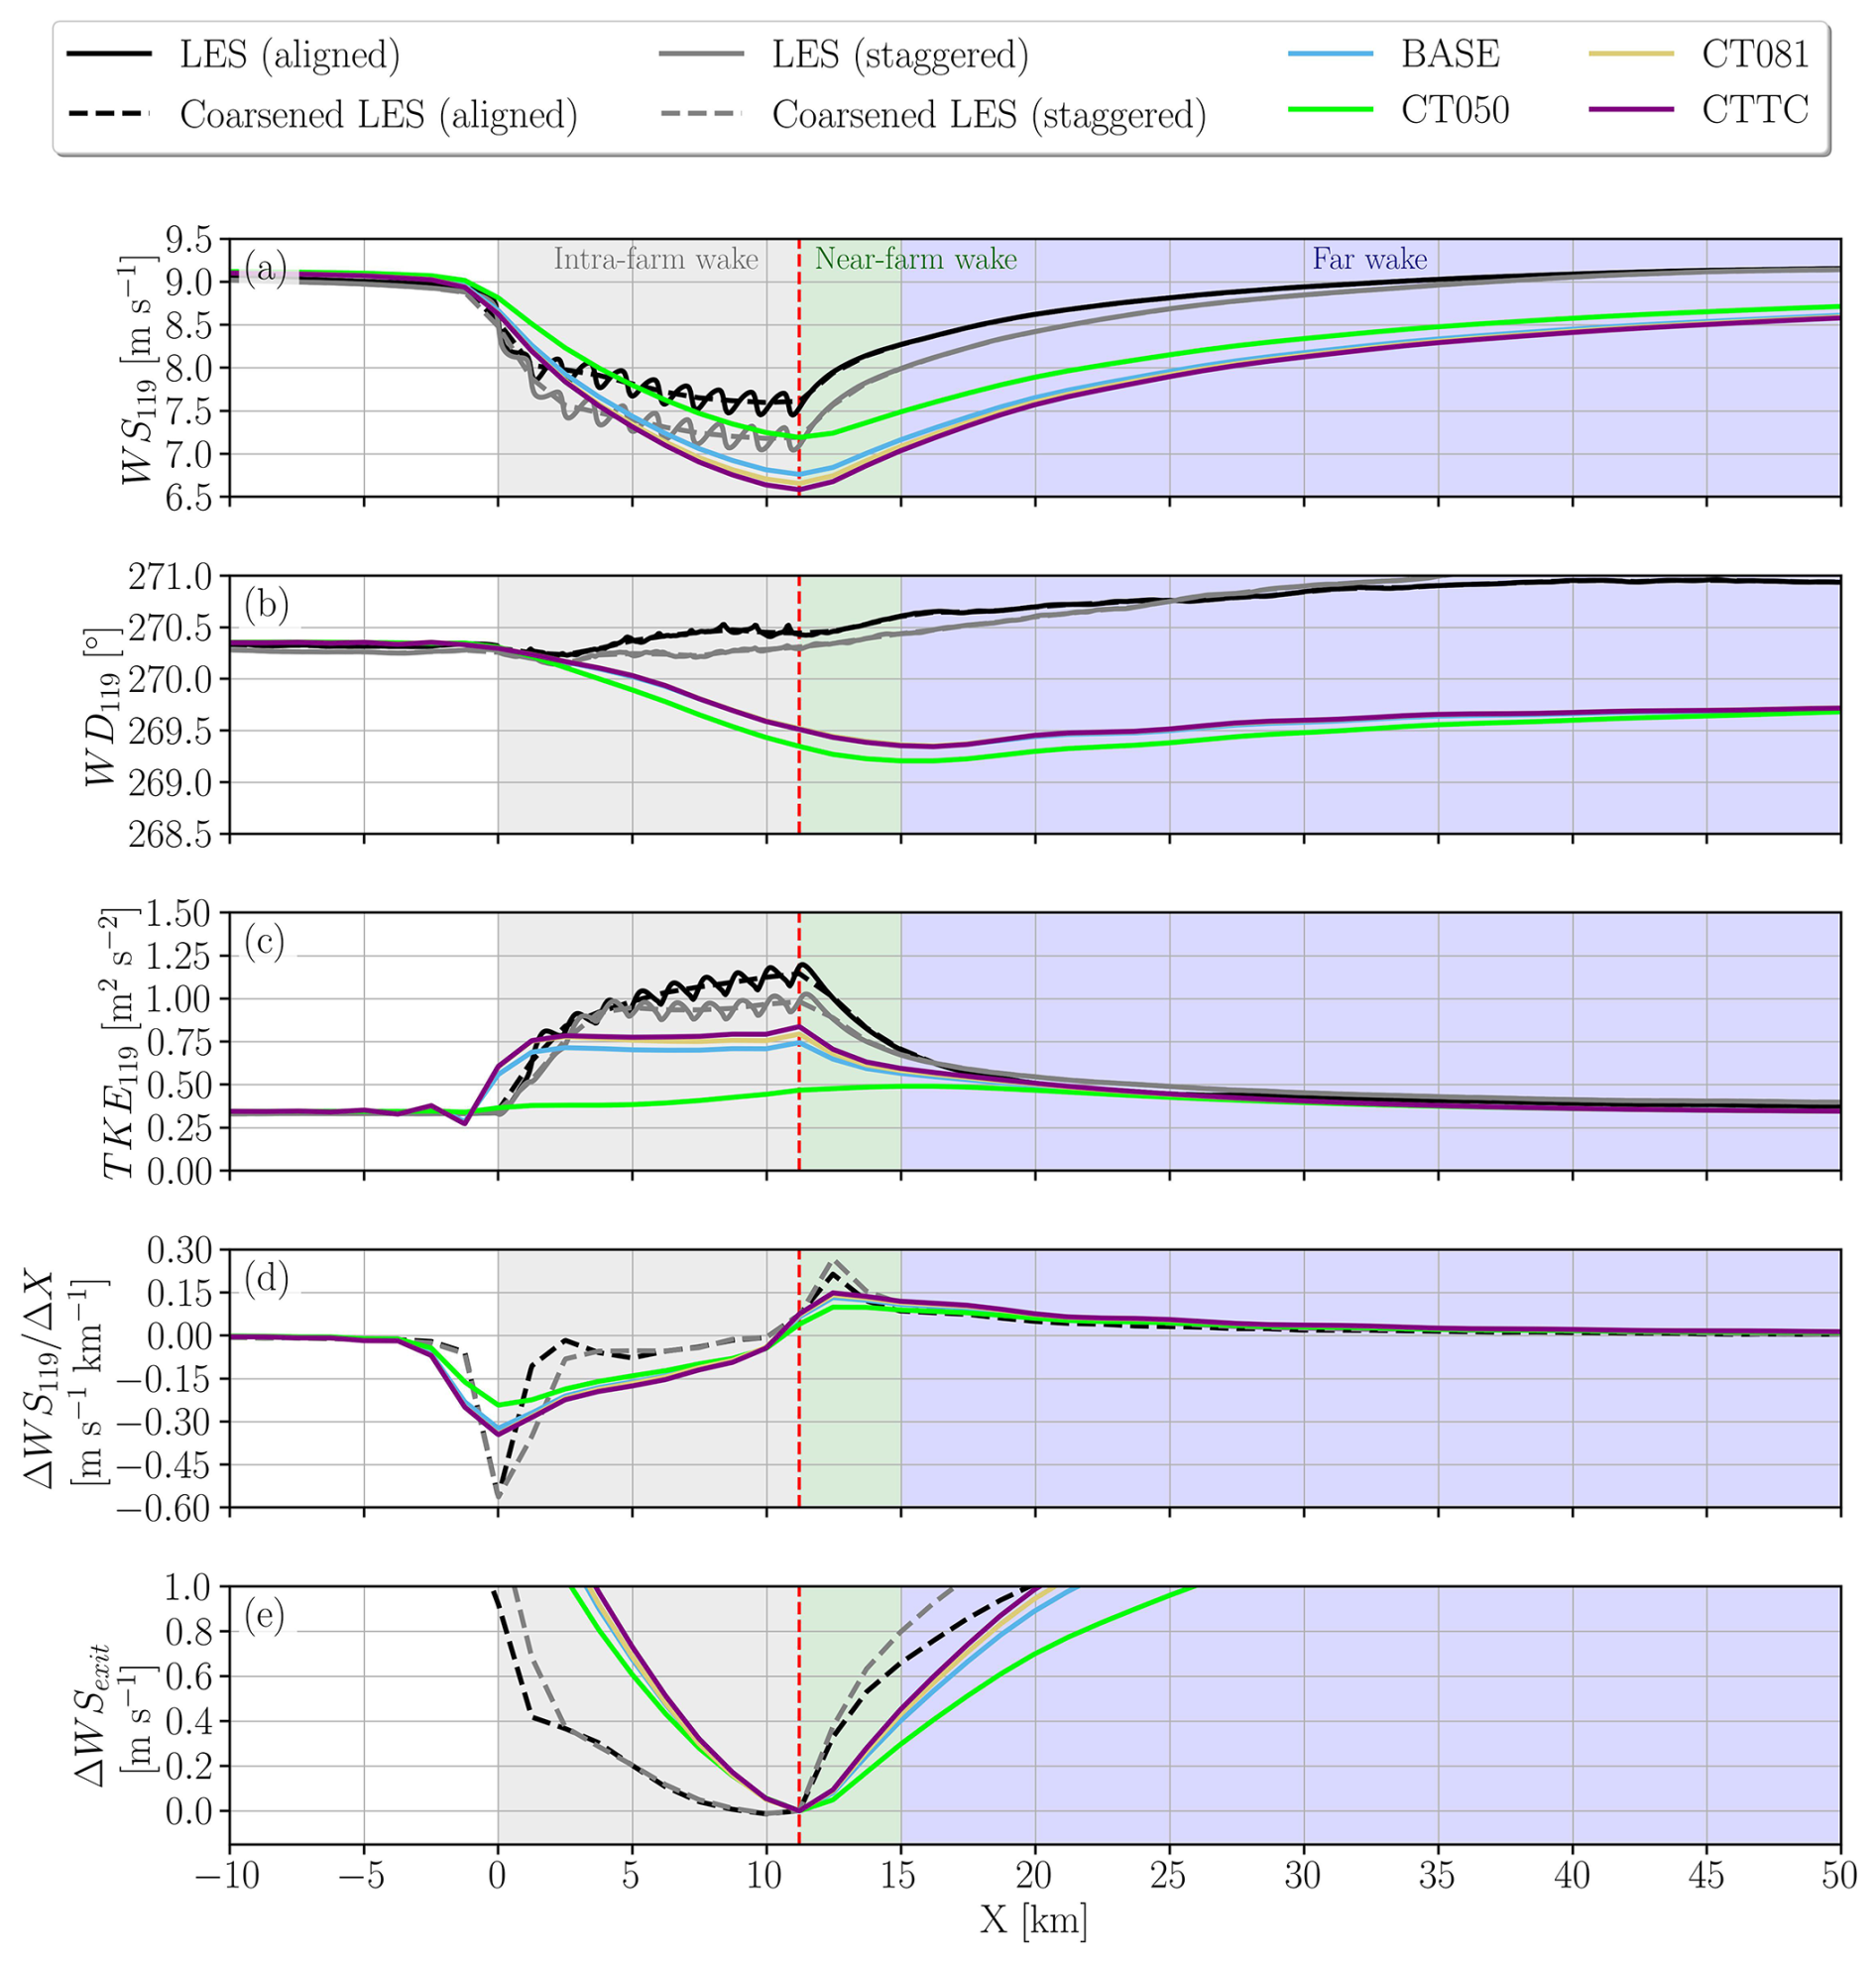
Figure A2Streamwise variation in spanwise averages over the wind-farm area of hub-height wind speed (a), wind direction (b), TKE (c), streamwise gradient of wind speed (d), and wind speed change relative to the wind-farm exit (e) for the aligned and staggered LES at full resolution, coarsened LES, and NWP-WFP cases with different CT. In the CTTC case, the thrust coefficient CT varies with wind speed according to the turbine's thrust curve. The colored background areas indicate the streamwise extent of the intra-farm wake (gray), near-farm wake (green), and far wake of the farm (blue). The vertical dashed red line marks the wind-farm exit.
To support the interpretation presented in Sect. 4.1, we examine the streamwise evolution of selected MYNN TKE budget terms at hub height for the mesoscale NWP-WFP simulations (BASE, TKE100, and MAV), shown in Fig. B1. The budget terms are computed using the same spanwise averaging applied in Figs. 7 and 8, ensuring consistency with the bulk wake diagnostics used to characterize intra-farm, near-farm, and far-wake behavior. Buoyancy production and vertical transport are omitted, as their contributions are small relative to the dominant terms and do not influence the conclusions discussed below.
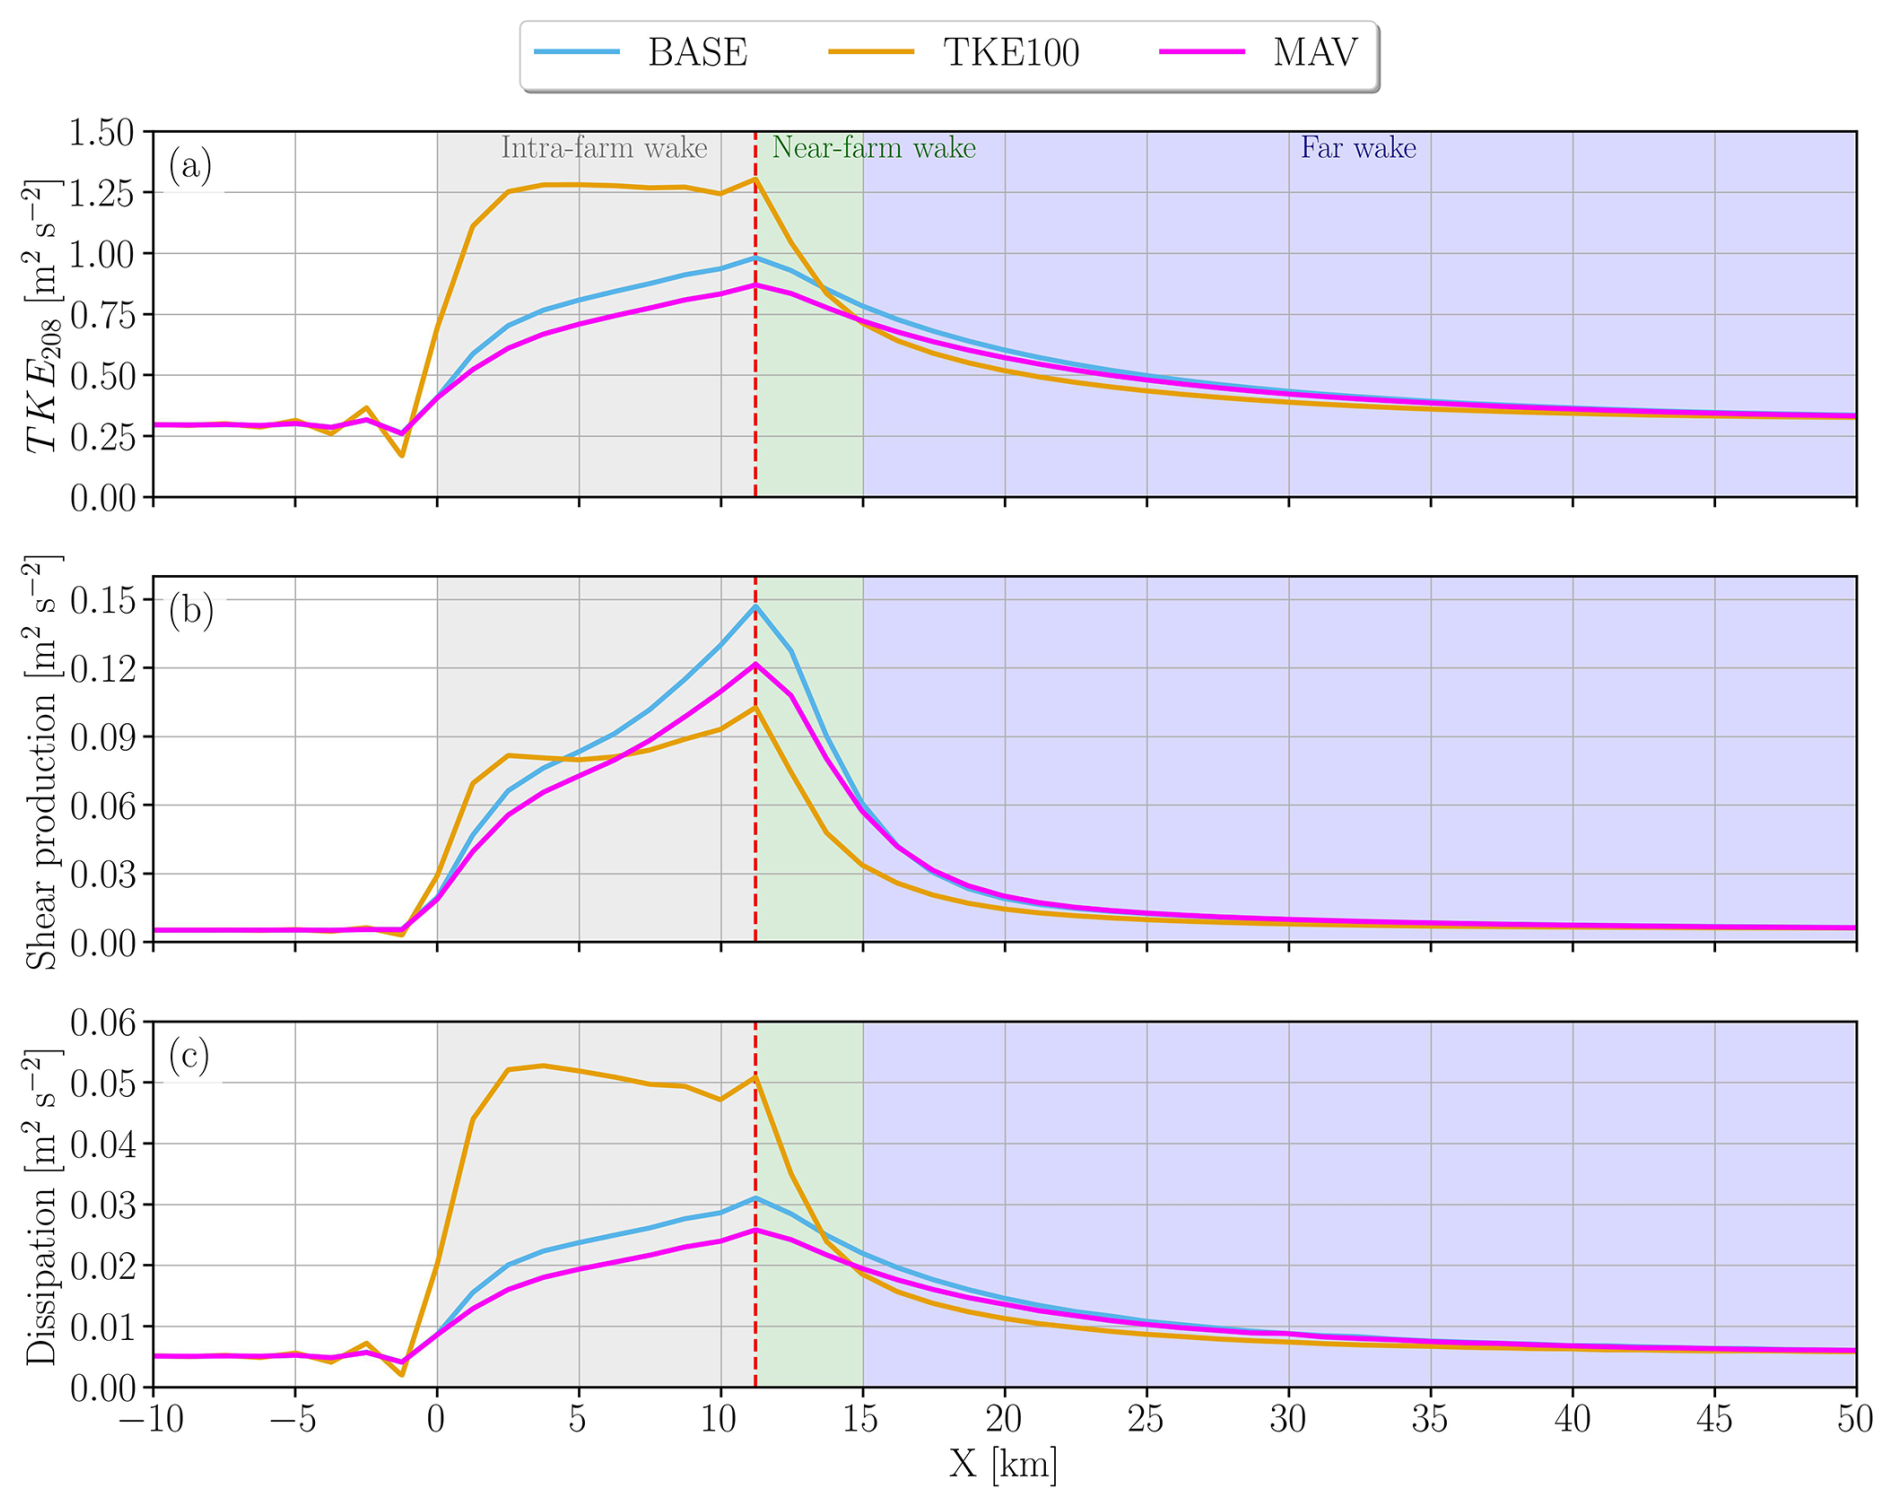
Figure B1Streamwise variation in spanwise averages over the wind-farm area of rotor top tip TKE (a), shear production (b), and dissipation (c) for the BASE, TKE100, and MAV cases. The colored background areas indicate the streamwise extent of the intra-farm wake (gray), near-farm wake (green), and far wake of the farm (blue). The vertical dashed red line marks the wind-farm exit.
Figure B1a shows that the TKE is highest within the wind farm due to direct addition by the WFPs, with dissipation (Fig. B1c) closely following the TKE magnitude. Shear production (Fig. B1b) increases through the intra-farm region as the wind speed deficit builds across successive turbine rows (Fig. 7a). In the near-farm wake, where the WFPs are inactive, shear production in the BASE and MAV cases exceeds that of the TKE100 case, despite similar TKE and dissipation levels at the wind-farm exit. This difference is critical: the reduced shear production in TKE100 leads to a reduced TKE in the near-farm wake compared to BASE and MAV. Consistently, cases with larger wind speed deficits exhibit stronger shear production, with the ordering at the farm exit being BASE, followed by MAV and TKE100. These results reinforce the conclusion from Sect. 4.1 that insufficiently sustained shear production limits TKE levels and eddy viscosity in the near-farm wake of mesoscale NWP-WFP simulations.
The WRF model version 4.4 with the axial induction correction (Vollmer et al., 2024) and the MAV WFP (Ma et al., 2022a, b) is available at https://github.com/wradunz/WRFv4.4-DRM_GAD/tree/master (last access: 22 July 2026). Results and simulation setup for the WRF mesoscale simulations can be accessed at https://doi.org/10.5281/zenodo.21628778 (Radünz, 2026). The LES data can be provided by the corresponding author of Kasper et al. (2024) upon reasonable request.
Conceptualization: WCR and JKL. Methodology: WCR. Data curation: WCR and JHK. Formal analysis: WCR. Investigation: WCR and JKL. Writing (original draft): WCR and JKL. Writing (review and editing): all authors. All authors contributed to the discussion and interpretation of results.
At least one of the (co-)authors is a member of the editorial board of Wind Energy Science. The peer-review process was guided by an independent editor, and the authors also have no other competing interests to declare.
Publisher's note: Copernicus Publications remains neutral with regard to jurisdictional claims made in the text, published maps, institutional affiliations, or any other geographical representation in this paper. The authors bear the ultimate responsibility for providing appropriate place names. Views expressed in the text are those of the authors and do not necessarily reflect the views of the publisher.
This work was partially supported by the U.S. Department of Energy, Office of Science Energy Earthshot Initiative, as part of the Addressing Challenges in Energy–Floating Wind in a Changing Climate (ACE-FWICC) Energy Earthshot Research Center. A portion of the research (WRF simulations) was performed using computational resources sponsored by the Department of Energy's Office of Critical Minerals and Energy Innovation Wind Energy Technologies Office and located at the National Laboratory of the Rockies. This work was authored in part by the National Laboratory of the Rockies operated for the U.S. Department of Energy (DOE) under Contract No. DE-AC36-08GO28308. This project has received funding from the European Research Council Horizon Europe program (grant no. 101124815).
This work was partially supported by the U.S. Department of Energy, Office of Science Energy Earthshot Initiative, as part of the Addressing Challenges in Energy–Floating Wind in a Changing Climate (ACE-FWICC) Energy Earthshot Research Center. This material is based in part by work initially supported by the U.S. Department of Energy’s Office of Energy Efficiency and Renewable Energy (EERE) under the Wind Energy Technologies Office (WETO) Award Number DE-EE0011269, and continuing support from the Massachusetts Clean Energy Center and the Maryland Energy Administration. This project has received funding from the European Research Council Horizon Europe program (grant no. 101124815).
This paper was edited by Alfredo Peña and reviewed by three anonymous referees.
Abkar, M. and Porté-Agel, F.: Influence of atmospheric stability on wind-turbine wakes: A large-eddy simulation study, Phys. Fluids, 27, https://doi.org/10.1063/1.4913695, 2015a. a, b, c, d, e
Abkar, M. and Porté-Agel, F.: A new wind-farm parameterization for large-scale atmospheric models, J. Renew. Sustain. Ener., 7, 1–13, https://doi.org/10.1063/1.4907600, 2015b. a, b, c, d, e
Abkar, M., Bae, H. J., and Moin, P.: Minimum-dissipation scalar transport model for large-eddy simulation of turbulent flows, Phys. Rev. Fluids, 1, 041701, https://doi.org/10.1103/PhysRevFluids.1.041701, 2016a. a
Abkar, M., Sharifi, A., and Porté-Agel, F.: Wake flow in a wind farm during a diurnal cycle, J. Turbul., 17, 420–441, https://doi.org/10.1080/14685248.2015.1127379, 2016b. a
Adams, A. S. and Keith, D. W.: Are global wind power resource estimates overstated?, Environ. Res. Lett., 8, https://doi.org/10.1088/1748-9326/8/1/015021, 2013. a
Agarwal, N. J., Lundquist, J. K., Juliano, T. W., and Rybchuk, A.: A North Sea in situ evaluation of the Fitch wind farm parameterization within the Mellor–Yamada–Nakanishi–Niino and 3D planetary boundary layer schemes, Wind Energ. Sci., 11, 2369–2403, https://doi.org/10.5194/wes-11-2369-2026, 2026. a
Albertson, J. D. and Parlange, M. B.: Surface length scales and shear stress: Implications for land‐atmosphere interaction over complex terrain, Water Resour. Res., 35, 2121–2132, https://doi.org/10.1029/1999WR900094, 1999. a
Ali, K., Schultz, D. M., Revell, A., Stallard, T., and Ouro, P.: Assessment of Five Wind-Farm Parameterizations in the Weather Research and Forecasting Model: A Case Study of Wind Farms in the North Sea, Mon. Weather Rev., 151, 2333–2359, https://doi.org/10.1175/MWR-D-23-0006.1, 2023. a, b, c, d
Allaerts, D. and Meyers, J.: Boundary-layer development and gravity waves in conventionally neutral wind farms, J. Fluid Mech., 814, 95–130, https://doi.org/10.1017/jfm.2017.11, 2017. a
Archer, C. L., Wu, S., Ma, Y., and Jiménez, P. A.: Two corrections for turbulent kinetic energy generated by wind farms in the WRF model, Mon. Weather Rev., 148, 4823–4835, https://doi.org/10.1175/MWR-D-20-0097.1, 2020. a, b, c, d, e, f, g, h, i
Baidya Roy, S., Pacala, S. W., and Walko, R. L.: Can large wind farms affect local meteorology?, J. Geophys. Res.-Atmos., 109, D19101, https://doi.org/10.1029/2004JD004763, 2004. a, b
Bak, C., Zahle, F., Bitsche, R., Kim, T., Yde, A., Henriksen, L. C., Hansen, M. H., Blasques, J. P. A. A., Gaunaa, M., and Natarajan, A.: The DTU 10-MW Reference Wind Turbine, in: Danish Wind Power Research, Roskilde, Denmark, https://backend.orbit.dtu.dk/ws/fi les/55645274/The_DTU_10MW_Reference_Turbine_Christian_Bak.pdf (last access: 23 July 2026), 2013. a, b
Barthelmie, R. J., Frandsen, S. T., Nielsen, M. N., Pryor, S. C., Rethore, P. E., and Jørgensen, H. E.: Modelling and measurements of power losses and turbulence intensity in wind turbine wakes at Middelgrunden offshore wind farm, Wind Energy, 10, 517–528, https://doi.org/10.1002/we.238, 2007. a
Barthelmie, R. J., Hansen, K., Frandsen, S. T., Rathmann, O., Schepers, J. G., Schlez, W., Phillips, J., Rados, K., Zervos, A., Politis, E. S., and Chaviaropoulos, P. K.: Modelling and Measuring Flow and Wind Turbine Wakes in Large Wind Farms Offshore, Wind Energy, 12, 431–444, https://doi.org/10.1002/we.348, 2009. a
Blahak, U., Goretzki, B., and Meis, J.: A simple parameterization of drag forces induced by large wind farms for numerical weather prediction models, in: Proceedings of European wind energy conference and exhibition, 1, 4577–4585, http://proceedings.ewea.org/ewec2010/allfi les2/757_EWEC2010presentation.pdf (last access: 23 July 2026), 2010. a
Bodini, N., Zardi, D., and Lundquist, J. K.: Three-dimensional structure of wind turbine wakes as measured by scanning lidar, Atmos. Meas. Tech., 10, 2881–2896, https://doi.org/10.5194/amt-10-2881-2017, 2017. a, b
Bodini, N., Lundquist, J. K., and Kirincich, A.: U.S. East coast LiDAR measurements show offshore wind turbines will encounter very low atmospheric turbulence, Geophys. Res. Lett., 46, 5582–5591, https://doi.org/10.1029/2019GL082636, 2019. a
Boettcher, M., Hoffmann, P., Lenhart, H. J., Schlünzen, K. H., and Schoetter, R.: Influence of large offshore wind farms on North German climate, Meteorol. Z., 24, 465–480, https://doi.org/10.1127/metz/2015/0652, 2015. a
Boussinesq, M. J.: Théorie de l'écoulement tourbillonnant et tumultueux des liquides, Gauthier-Villars et fils, Paris, France, https://archive.org/details/thbeoriedelbeco01bousrich/page/1/ (last access: 23 July 2026), 1897. a
Cal, R. B., Lebrón, J., Castillo, L., Kang, H. S., and Meneveau, C.: Experimental study of the horizontally averaged flow structure in a model wind-turbine array boundary layer, J. Renew. Sustain. Ener., 2, 0–25, https://doi.org/10.1063/1.3289735, 2010. a
Calaf, M., Meneveau, C., and Meyers, J.: Large eddy simulations of fully developed wind-turbine array boundary layers, Phys. Fluids, 22, 015110, https://doi.org/10.1063/1.3291077, 2010. a, b
Cañadillas, B., Foreman, R., Barth, V., Siedersleben, S., Lampert, A., Platis, A., Djath, B., Schulz-Stellenfleth, J., Bange, J., Emeis, S., and Neumann, T.: Offshore wind farm wake recovery: Airborne measurements and its representation in engineering models, Wind Energy, 23, 1249–1265, https://doi.org/10.1002/we.2484, 2020. a
Du, B., Ge, M., Li, X., and Liu, Y.: A Meso-Microscale Coupled Wind Farm Parameterization, Bound.-Lay. Meteorol., 191, 35, https://doi.org/10.1007/s10546-025-00928-7, 2025. a
Du, B., Li, Q., Ge, M., Li, X., and Liu, Y.: Gaussian-based multicolumn spatial distribution method for wind farm parameterizations, Physical Review Fluids, 11, 023801, https://doi.org/10.1103/5lsj-m746, 2026. a, b
Englberger, A., Lundquist, J. K., and Dörnbrack, A.: Changing the rotational direction of a wind turbine under veering inflow: a parameter study, Wind Energ. Sci., 5, 1623–1644, https://doi.org/10.5194/wes-5-1623-2020, 2020. a
Eriksson, O., Lindvall, J., Breton, S. P., and Ivanell, S.: Wake downstream of the Lillgrund wind farm – A comparison between LES using the actuator disc method and a wind farm parametrization in WRF, J. Phys. Conf. Ser., 625, https://doi.org/10.1088/1742-6596/625/1/012028, 2015. a
Fischereit, J., Brown, R., Larsén, X. G., Badger, J., and Hawkes, G.: Review of mesoscale Wind-Farm Parametrizations and their applications, Bound.-Lay. Meteorol., 182, 175–224, https://doi.org/10.1007/s10546-021-00652-y, 2022a. a, b
Fischereit, J., Schaldemose Hansen, K., Larsén, X. G., van der Laan, M. P., Réthoré, P.-E., and Murcia Leon, J. P.: Comparing and validating intra-farm and farm-to-farm wakes across different mesoscale and high-resolution wake models, Wind Energ. Sci., 7, 1069–1091, https://doi.org/10.5194/wes-7-1069-2022, 2022b. a, b
Fitch, A. C., Olson, J. B., Lundquist, J. K., Dudhia, J., Gupta, A. K., Michalakes, J., and Barstad, I.: Local and mesoscale impacts of wind farms as parameterized in a mesoscale NWP model, Mon. Weather Rev., 140, 3017–3038, https://doi.org/10.1175/MWR-D-11-00352.1, 2012. a, b, c, d, e, f, g, h, i
Fitch, A. C., Lundquist, J. K., and Olson, J. B.: Mesoscale influences of wind farms throughout a diurnal cycle, Mon. Weather Rev., 141, 2173–2198, https://doi.org/10.1175/MWR-D-12-00185.1, 2013a. a, b
Fitch, A. C., Olson, J. B., and Lundquist, J. K.: Parameterization of Wind Farms in Climate Models, J. Climate, 26, 6439–6458, https://doi.org/10.1175/JCLI-D-12-00376.1, 2013b. a
Gadde, S. N. and Stevens, R. J. A. M.: Effect of Coriolis force on a wind farm wake, J. Phys. Conf. Ser., 1256, 012026, https://doi.org/10.1088/1742-6596/1256/1/012026, 2019. a
Gadde, S. N., Stieren, A., and Stevens, R. J. A. M.: Large-Eddy Simulations of Stratified Atmospheric Boundary Layers: Comparison of Different Subgrid Models, Bound.-Lay. Meteorol., 178, 363–382, https://doi.org/10.1007/s10546-020-00570-5, 2021. a
García-Santiago, O., Badger, J., Hahmann, A. N., Volker, P. J. H., Ott, S., van der Laan, M. P., and Kelly, M.: A wind-farm wake-turbulence parameterization for the WRF model (EWP v2.0), EGUsphere [preprint], https://doi.org/10.5194/egusphere-2026-2144, 2026. a
García-Santiago, O., Hahmann, A. N., Badger, J., and Peña, A.: Evaluation of wind farm parameterizations in the WRF model under different atmospheric stability conditions with high-resolution wake simulations, Wind Energ. Sci., 9, 963–979, https://doi.org/10.5194/wes-9-963-2024, 2024. a, b, c, d, e, f, g, h, i, j, k, l, m
Haupt, S. E., Kosovic, B., Shaw, W., Berg, L. K., Churchfield, M., Cline, J., Draxl, C., Ennis, B., Koo, E., Kotamarthi, R., Mazzaro, L., Mirocha, J., Moriarty, P., Muñóz-Esparza, D., Quon, E., Rai, R. K., Robinson, M., and Sever, G.: On bridging a modeling scale gap: mesoscale to microscale coupling for wind energy, B. Am. Meteorol. Soc., 100, 2533–2550, https://doi.org/10.1175/bams-d-18-0033.1, 2019. a
Haupt, S. E., Kosović, B., Berg, L. K., Kaul, C. M., Churchfield, M., Mirocha, J., Allaerts, D., Brummet, T., Davis, S., DeCastro, A., Dettling, S., Draxl, C., Gagne, D. J., Hawbecker, P., Jha, P., Juliano, T., Lassman, W., Quon, E., Rai, R. K., Robinson, M., Shaw, W., and Thedin, R.: Lessons learned in coupling atmospheric models across scales for onshore and offshore wind energy, Wind Energ. Sci., 8, 1251–1275, https://doi.org/10.5194/wes-8-1251-2023, 2023. a
Hsieh, A. S., Cheung, L. C., Blaylock, M. L., Brown, K. A., Houck, D. R., Herges, T. G., DeVelder, N. B., Maniaci, D. C., Yalla, G. R., Sakievich, P. J., Radunz, W. C., and Carmo, B. S.: Model intercomparison of the ABL, turbines, and wakes within the AWAKEN wind farms under neutral stability conditions, J. Renew. Sustain. Ener., 17, https://doi.org/10.1063/5.0211729, 2025. a, b
Iungo, G. V., Wu, Y. T., and Porté-Agel, F.: Field measurements of wind turbine wakes with LiDARs, J. Atmos. Ocean. Tech., 30, 274–287, https://doi.org/10.1175/JTECH-D-12-00051.1, 2013. a, b
Ivanova, L. A. and Nadyozhina, E. D.: Numerical simulation of wind farm influence on wind flow, Wind Eng., 24, 257–269, https://doi.org/10.1260/0309524001495620, 2000. a
Jimenez, A., Crespo, A., Migoya, E., and Garcia, J.: Large-eddy simulation of spectral coherence in a wind turbine wake, Environ. Res. Lett., 3, 015004, https://doi.org/10.1088/1748-9326/3/1/015004, 2008. a
Juliano, T. W., Kosović, B., Jiménez, P. A., Eghdami, M., Haupt, S. E., and Martilli, A.: “Gray Zone” simulations using a three-dimensional planetary boundary layer parameterization in the Weather Research and Forecasting model, Mon. Weather Rev., 150, 1585–1619, https://doi.org/10.1175/MWR-D-21-0164.1, 2022. a
Kasper, J. H. and Stevens, R. J. A. M.: From turbine-scale to wind farm-scale wake recovery: Understanding the transition, J. Renew. Sustain. Ener., 18, 1–21, https://doi.org/10.1063/5.0285347, 2026. a, b
Kasper, J. H., Stieren, A., and Stevens, R. J. A. M.: Simulation and modeling of wind farms in baroclinic atmospheric boundary layers, J. Renew. Sustain. Ener., 16, 1–15, https://doi.org/10.1063/5.0220322, 2024. a, b, c, d, e, f
Keith, D. W., DeCarolis, J. F., Denkenberger, D. C., Lenschow, D. H., Malyshev, S. L., Pacala, S., and Rasch, P. J.: The influence of large-scale wind power on global climate, P. Natl. Acad. Sci. USA, 101, 16115–16120, https://doi.org/10.1073/pnas.0406930101, 2004. a
Khanjari, A., Feroz, A., and Archer, C. L.: An analytical formulation for turbulence kinetic energy added by wind turbines based on large-eddy simulation, Wind Energ. Sci., 10, 887–905, https://doi.org/10.5194/wes-10-887-2025, 2025. a, b
Kosović, B., Munoz, P. J., Juliano, T. W., Martilli, A., Eghdami, M., Barros, A. P., and Haupt, S. E.: Three-dimensional planetary boundary layer parameterization for high-resolution mesoscale simulations, J. Phys. Conf. Ser., 1452, 012080, https://doi.org/10.1088/1742-6596/1452/1/012080, 2020. a
Lanzilao, L. and Meyers, J.: Wind-farm wake recovery mechanisms in conventionally neutral boundary layers, J. Fluid Mech., 1015, A5, https://doi.org/10.1017/jfm.2025.10320, 2025. a
Larsén, X. G. and Fischereit, J.: A case study of wind farm effects using two wake parameterizations in the Weather Research and Forecasting (WRF) model (V3.7.1) in the presence of low-level jets, Geosci. Model Dev., 14, 3141–3158, https://doi.org/10.5194/gmd-14-3141-2021, 2021. a, b, c, d, e, f
Lee, J. C. Y. and Lundquist, J. K.: Evaluation of the wind farm parameterization in the Weather Research and Forecasting model (version 3.8.1) with meteorological and turbine power data, Geosci. Model Dev., 10, 4229–4244, https://doi.org/10.5194/gmd-10-4229-2017, 2017. a
Lundquist, J. K., DuVivier, K. K., Kaffine, D., and Tomaszewski, J. M.: Costs and consequences of wind turbine wake effects arising from uncoordinated wind energy development, Nat. Energ., 4, 26–34, https://doi.org/10.1038/s41560-018-0281-2, 2019. a, b, c, d
Ma, Y., Archer, C. L., and Vasel-Be-Hagh, A.: The Jensen wind farm parameterization, Wind Energ. Sci., 7, 2407–2431, https://doi.org/10.5194/wes-7-2407-2022, 2022a. a, b, c, d, e, f, g, h, i
Ma, Y., Archer, C. L., and Vasel‐Be‐Hagh, A.: Comparison of individual versus ensemble wind farm parameterizations inclusive of sub‐grid wakes for the WRF model, Wind Energ., 25, 1573–1595, https://doi.org/10.1002/we.2758, 2022b. a, b, c, d, e, f, g, h
Magnusson, M. and Smedman, A. S.: Influence of atmospheric stability on wind turbine wakes, Wind Eng., 18, 139–152, http://www.jstor.org/stable/43749538 (last access: 23 July 2026), 1994. a, b
Malyshev, S. L., Pacala, S. W., Keith, D. W., Denkenberger, D. C., Baidya Roy, S., and Shevliakova, E.: Climate response to large-scale wind farms, in: AGU Fall Meeting Abstracts, vol. 2003, A31E–0104, https://www.researchgate.net/publication/252851455_Climate_Response_to_Large-Scale_Wind_Farms (last access: 23 July 2026), 2003. a
Mangara, R. J., Guo, Z., and Li, S.: Performance of the wind farm parameterization scheme coupled with the weather research and forecasting model under multiple resolution regimes for simulating an onshore wind farm, Adv. Atmos. Sci., 36, 119–132, https://doi.org/10.1007/s00376-018-8028-3, 2019. a, b
Mellor, G. L. and Yamada, T.: Development of a turbulence closure model for geophysical fluid problems, Rev. Geophys., 20, 851–875, https://doi.org/10.1029/RG020i004p00851, 1982. a
Mirocha, J. D., Rajewski, D. A., Marjanovic, N., Lundquist, J. K., Kosović, B., Draxl, C., and Churchfield, M. J.: Investigating wind turbine impacts on near-wake flow using profiling LiDAR data and large-eddy simulations with an actuator disk model, J. Renew. Sustain. Energ., 7, https://doi.org/10.1063/1.4928873, 2015. a, b
Mirocha, J. D., Churchfield, M. J., Muñoz-Esparza, D., Rai, R. K., Feng, Y., Kosović, B., Haupt, S. E., Brown, B., Ennis, B. L., Draxl, C., Sanz Rodrigo, J., Shaw, W. J., Berg, L. K., Moriarty, P. J., Linn, R. R., Kotamarthi, V. R., Balakrishnan, R., Cline, J. W., Robinson, M. C., and Ananthan, S.: Large-eddy simulation sensitivities to variations of configuration and forcing parameters in canonical boundary-layer flows for wind energy applications, Wind Energ. Sci., 3, 589–613, https://doi.org/10.5194/wes-3-589-2018, 2018. a
Montavon, C., Rodaway, C., Gunn, K., Smith, G., Dunsmore, D., Hoyo, M. D., and Sinclair, K.: Cluster wakes and their effect on a wind farm annual energy production, Tech. Rep. 1, DNV-RWE, Whitepaper, https://doi.org/10.13140/RG.2.2.35980.73605, 2024. a, b
Nakanishi, M. and Niino, H.: Development of an Improved Turbulence Closure Model for the Atmospheric Boundary Layer, J. Meteorol. Soc. Jpn., 87, 895–912, https://doi.org/10.2151/jmsj.87.895, 2009. a, b, c
Olson, J. B., Angevine, W. M., Turner, D. D., Sun, X., Simonson, J. M., Evans, C., Kenyon, J. S., Li, H., Schnell, J., Puhales, F. S., Cherubini, T., Li, W., and Zhang, M.: A Description of the MYNN-EDMF Turbulence Scheme, Tech. Rep. NOAA Technical Memorandum OAR GSL-77, NOAA Global Systems Laboratory, https://doi.org/10.25923/rahr-sj70, 2026. a, b
Ouro, P., Ghobrial, M., Ali, K., and Stallard, T.: Numerical modelling of offshore wind farm cluster wakes, Renew. Sust. Energ. Rev., 215, 115526, https://doi.org/10.1016/j.rser.2025.115526, 2025. a
Pan, Y. and Archer, C. L.: A hybrid wind-farm parametrization for mesoscale and climate models, Bound.-Lay. Meteorol., 168, 469–495, https://doi.org/10.1007/s10546-018-0351-9, 2018. a, b
Peña, A., Mirocha, J. D., and van der Laan, M. P.: Evaluation of the Fitch Wind-Farm Wake Parameterization with Large-Eddy Simulations of Wakes Using the Weather Research and Forecasting Model, Mon. Weather Rev., 150, 3051–3064, https://doi.org/10.1175/MWR-D-22-0118.1, 2022. a, b, c, d, e, f, g, h, i
Peña, A., Kosović, B., and Mirocha, J. D.: Evaluation of idealized large-eddy simulations performed with the Weather Research and Forecasting model using turbulence measurements from a 250 m meteorological mast, Wind Energ. Sci., 6, 645–661, https://doi.org/10.5194/wes-6-645-2021, 2021. a
Platis, A., Siedersleben, S. K., Bange, J., Lampert, A., Bärfuss, K., Hankers, R., Cañadillas, B., Foreman, R., Schulz-Stellenfleth, J., Djath, B., Neumann, T., and Emeis, S.: First in situ evidence of wakes in the far field behind offshore wind farms, Sci. Rep., 8, 1–10, https://doi.org/10.1038/s41598-018-20389-y, 2018. a, b
Porté-Agel, F., Bastankhah, M., and Shamsoddin, S.: Wind-Turbine and Wind-Farm Flows: A Review, Bound.-Lay. Meteorol., 174, 1–59, https://doi.org/10.1007/s10546-019-00473-0, 2020. a
Pryor, S. C. and Barthelmie, R. J.: Power production, inter- and intra-array wake losses from the U.S. East coast offshore wind energy lease areas, Energies, 17, https://doi.org/10.3390/en17051063, 2024. a
Pryor, S. C., Shepherd, T. J., Volker, P. J., Hahmann, A. N., and Barthelmie, R. J.: ”Wind Theft” from onshore wind turbine arrays: Sensitivity to wind farm parameterization and resolution, J. Appl. Meteorol. Clim., 59, 153–174, https://doi.org/10.1175/JAMC-D-19-0235.1, 2020. a, b, c
Quint, D., Lundquist, J. K., Bodini, N., and Rosencrans, D.: Simulated meteorological impacts of offshore wind turbines and sensitivity to the amount of added turbulence kinetic energy, Wind Energ. Sci., 10, 1269–1301, https://doi.org/10.5194/wes-10-1269-2025, 2025. a
Radünz, W. C.: Supporting material for Slow wake recovery and low turbulence behind wind farms parameterized in mesoscale simulations, Zenodo [data set], https://doi.org/10.5281/zenodo.21628778, 2026. a
Rai, R. K., Berg, L. K., Kosović, B., Haupt, S. E., Mirocha, J. D., Ennis, B. L., and Draxl, C.: Evaluation of the impact of horizontal grid spacing in terra incognita on coupled mesoscale-microscale simulations using the WRF framework, Mon. Weather Rev., 147, 1007–1027, https://doi.org/10.1175/MWR-D-18-0282.1, 2019. a
Redfern, S., Olson, J. B., Lundquist, J. K., and Clack, C. T. M.: Incorporation of the rotor-equivalent wind speed into the weather research and forecasting model's wind farm parameterization, Mon. Weather Rev., 147, 1029–1046, https://doi.org/10.1175/MWR-D-18-0194.1, 2019. a
Rosencrans, D., Lundquist, J. K., Optis, M., Rybchuk, A., Bodini, N., and Rossol, M.: Seasonal variability of wake impacts on US mid-Atlantic offshore wind plant power production, Wind Energ. Sci., 9, 555–583, https://doi.org/10.5194/wes-9-555-2024, 2024. a, b, c, d, e, f, g
Rozema, W., Bae, H. J., Moin, P., and Verstappen, R.: Minimum-dissipation models for large-eddy simulation, Phys. Fluids, 27, https://doi.org/10.1063/1.4928700, 2015. a
Rybchuk, A., Juliano, T. W., Lundquist, J. K., Rosencrans, D., Bodini, N., and Optis, M.: The sensitivity of the Fitch wind farm parameterization to a three-dimensional planetary boundary layer scheme, Wind Energ. Sci., 7, 2085–2098, https://doi.org/10.5194/wes-7-2085-2022, 2022. a
Sanchez Gomez, M., Deskos, G., Lundquist, J. K., and Juliano, T. W.: Can mesoscale models capture the effect from cluster wakes offshore?, J. Phys. Conf. Ser., 2767, https://doi.org/10.1088/1742-6596/2767/6/062013, 2024. a, b, c, d, e, f
Shepherd, T. J., Barthelmie, R. J., and Pryor, S. C.: Sensitivity of wind turbine array downstream effects to the parameterization used in WRF, J. Appl. Meteorol. Clim., 59, 333–361, https://doi.org/10.1175/JAMC-D-19-0135.1, 2020. a
Siedersleben, S. K., Lundquist, J. K., Platis, A., Bange, J., Bärfuss, K., Lampert, A., Cañadillas, B., Neumann, T., and Emeis, S.: Micrometeorological impacts of offshore wind farms as seen in observations and simulations, Environ. Res. Lett., 13, https://doi.org/10.1088/1748-9326/aaea0b, 2018a. a, b
Siedersleben, S. K., Platis, A., Lundquist, J. K., Lampert, A., Bärfuss, K., Cañadillas, B., Djath, B., Schulz-Stellenfleth, J., Bange, J., Neumann, T., and Emeis, S.: Evaluation of a Wind Farm Parametrization for Mesoscale Atmospheric Flow Models with Aircraft Measurements, Meteorol. Z., 27, 401–415, https://doi.org/10.1127/metz/2018/0900, 2018b. a, b
Siedersleben, S. K., Platis, A., Lundquist, J. K., Djath, B., Lampert, A., Bärfuss, K., Cañadillas, B., Schulz-Stellenfleth, J., Bange, J., Neumann, T., and Emeis, S.: Turbulent kinetic energy over large offshore wind farms observed and simulated by the mesoscale model WRF (3.8.1), Geosci. Model Dev., 13, 249–268, https://doi.org/10.5194/gmd-13-249-2020, 2020. a, b, c, d, e, f
Skamarock, W. C., Klemp, J. B., Dudhia, J., Gill, D. O., Barker, D. M., Duda, M. G., Huang, X.-Y., Wang, W., and Powers, J. G.: A Description of the Advanced Research WRF Version 4. Tech. Note NCAR TN-475+STR, Tech. rep., University Corporation for Atmospheric Research, ISBN NCAR/TN-468+STR, https://doi.org/10.5065/D6DZ069T, 2019. a, b
Stevens, R. J. A. M. and Meneveau, C.: Flow structure and turbulence in wind farms, Annu. Rev. Fluid Mech., 49, 311–339, https://doi.org/10.1146/annurev-fluid-010816-060206, 2017. a, b
Stevens, R. J. A. M., Graham, J., and Meneveau, C.: A concurrent precursor inflow method for Large Eddy Simulations and applications to finite length wind farms, Renew. Energ., 68, 46–50, https://doi.org/10.1016/j.renene.2014.01.024, 2014. a
Stieren, A. and Stevens, R. J. A. M.: Impact of wind farm wakes on flow structures in and around downstream wind farms, Flow, 2, https://doi.org/10.1017/flo.2022.15, 2022. a, b, c, d
Stieren, A., Kasper, J. H., Gadde, S. N., and Stevens, R. J. A. M.: Impact of negative geostrophic wind shear on wind farm performance, PRX Energy, 1, 1, https://doi.org/10.1103/prxenergy.1.023007, 2022. a, b
Stipa, S., Ajay, A., and Brinkerhoff, J.: The actuator farm model for large eddy simulation (LES) of wind-farm-induced atmospheric gravity waves and farm–farm interaction, Wind Energ. Sci., 9, 2301–2332, https://doi.org/10.5194/wes-9-2301-2024, 2024. a, b
Stull, R. B.: An introduction to boundary layer meteorology, Kluwer Academic Publishers, the Netherlands, ISBN 9027727694, 1988. a, b, c
Tomaszewski, J. M. and Lundquist, J. K.: Simulated wind farm wake sensitivity to configuration choices in the Weather Research and Forecasting model version 3.8.1, Geosci. Model Dev., 13, 2645–2662, https://doi.org/10.5194/gmd-13-2645-2020, 2020. a, b, c
van der Laan, M. P. and Sørensen, N. N.: Why the Coriolis force turns a wind farm wake clockwise in the Northern Hemisphere, Wind Energ. Sci., 2, 285–294, https://doi.org/10.5194/wes-2-285-2017, 2017. a
van der Laan, M. P., Baungaard, M., and Kelly, M.: Brief communication: A clarification of wake recovery mechanisms, Wind Energ. Sci., 8, 247–254, https://doi.org/10.5194/wes-8-247-2023, 2023. a, b, c
van Stratum, B., Theeuwes, N., Barkmeijer, J., van Ulft, B., and Wijnant, I.: A One‐Year‐Long Evaluation of a Wind‐Farm Parameterization in HARMONIE‐AROME, J. Adv. Model. Earth Sy., 14, https://doi.org/10.1029/2021MS002947, 2022. a, b
Vanderwende, B. J., Kosović, B., Lundquist, J. K., and Mirocha, J. D.: Simulating effects of a wind‐turbine array using LES and RANS, J. Adv. Model. Earth Sy., 8, 1376–1390, https://doi.org/10.1002/2016MS000652, 2016. a, b, c, d, e, f, g, h, i
Veers, P., Dykes, K., Lantz, E., Barth, S., Bottasso, C. L., Carlson, O., Clifton, A., Green, J., Green, P., Holttinen, H., Laird, D., Lehtomäki, V., Lundquist, J. K., Manwell, J., Marquis, M., Meneveau, C., Moriarty, P., Munduate, X., Muskulus, M., Naughton, J., Pao, L., Paquette, J., Peinke, J., Robertson, A., Rodrigo, J. S., Sempreviva, A. M., Smith, J. C., Tuohy, A., and Wiser, R.: Grand challenges in the science of wind energy, Science, 366, https://doi.org/10.1126/science.aau2027, 2019. a
Veers, P., Dykes, K., Basu, S., Bianchini, A., Clifton, A., Green, P., Holttinen, H., Kitzing, L., Kosovic, B., Lundquist, J. K., Meyers, J., O'Malley, M., Shaw, W. J., and Straw, B.: Grand Challenges: wind energy research needs for a global energy transition, Wind Energ. Sci., 7, 2491–2496, https://doi.org/10.5194/wes-7-2491-2022, 2022. a
Vermeer, L. J., Sørensen, J. N., and Crespo, A.: Wind turbine wake aerodynamics, Prog. Aerosp. Sci., 39, 467–510, https://doi.org/10.1016/S0376-0421(03)00078-2, 2003. a, b, c
Volker, P. J. H., Badger, J., Hahmann, A. N., and Ott, S.: The Explicit Wake Parametrisation V1.0: a wind farm parametrisation in the mesoscale model WRF, Geosci. Model Dev., 8, 3715–3731, https://doi.org/10.5194/gmd-8-3715-2015, 2015. a, b, c
Vollmer, L., Sengers, B. A. M., and Dörenkämper, M.: Brief communication: A simple axial induction modification to the Weather Research and Forecasting Fitch wind farm parameterization, Wind Energ. Sci., 9, 1689–1693, https://doi.org/10.5194/wes-9-1689-2024, 2024. a, b, c, d
Wang, C. and Prinn, R. G.: Potential climatic impacts and reliability of very large-scale wind farms, Atmos. Chem. Phys., 10, 2053–2061, https://doi.org/10.5194/acp-10-2053-2010, 2010. a
Wu, C., Wang, Q., Luo, K., and Fan, J.: A coupled turbine-interaction wind farm parameterization in the Weather Research and Forecasting model, Energ. Convers. Manage., 283, 116919, https://doi.org/10.1016/j.enconman.2023.116919, 2023. a, b
Wyngaard, J. C.: Toward numerical modeling in the “Terra Incognita”, J. Atmos. Sci., 61, 1816–1826, https://doi.org/10.1175/1520-0469(2004)061<1816:TNMITT>2.0.CO;2, 2004. a
Xie, S. and Archer, C.: Self‐similarity and turbulence characteristics of wind turbine wakes via large‐eddy simulation, Wind Energy, 18, 1815–1838, https://doi.org/10.1002/we.1792, 2015. a
- Abstract
- Copyright statement
- Introduction
- Methods
- Results
- Discussion
- Conclusions
- Appendix A: DTU 10 MW turbine power and thrust curves
- Appendix B: Streamwise TKE budget in NWP-WFP simulations
- Code and data availability
- Author contributions
- Competing interests
- Disclaimer
- Acknowledgements
- Financial support
- Review statement
- References
- Abstract
- Copyright statement
- Introduction
- Methods
- Results
- Discussion
- Conclusions
- Appendix A: DTU 10 MW turbine power and thrust curves
- Appendix B: Streamwise TKE budget in NWP-WFP simulations
- Code and data availability
- Author contributions
- Competing interests
- Disclaimer
- Acknowledgements
- Financial support
- Review statement
- References