
the Creative Commons Attribution 4.0 License.
the Creative Commons Attribution 4.0 License.
 | 23 Sep 2026
Wind tunnel study of yawed porous discs subjected to veered inflow

Haoyuan Sun
Andrea Sciacchitano
Atmospheric boundary layer flow during stably stratified conditions often exhibits wind veering – the change in wind direction with height – which significantly influences wind turbine wake dynamics and its downstream recovery. This study investigates the impact of veered inflows on turbine wakes through wind tunnel experiments using high-resolution stereoscopic particle image velocimetry (SPIV). A porous disc of uniform porosity is employed as a surrogate for wind turbines to systematically examine wake characteristics under both non-yawed and yawed conditions. The results reveal that veered inflow induces an ellipsoidal-shaped wake for a non-yawed porous disc. Under yawed conditions, however, the interaction between yaw and veer leads to a complex wake shape, where the curled shape due to yaw is superimposed on the wake stretching due to veer. Furthermore, the strength of the two counter-rotating vortex pairs formed around yawed discs is reduced due to wind veering. A budget analysis of the streamwise momentum equation and turbulent kinetic energy is performed to shed light on the mechanism of wake recovery and energy redistribution. The results demonstrate that wind veering leads to faster wake recovery and more available power for downstream wind turbines. These findings imply that, under conditions of extreme wind veer, yawing the turbine may offer limited additional energy recovery, as wind veering alone facilitates significant wake re-energization.
- Article
(18644 KB) - Full-text XML
- BibTeX
- EndNote


Wind turbines (WTs) operate within the lowest levels of the atmospheric boundary layer, where atmospheric conditions vary significantly during the diurnal cycle. During the morning hours, when the sun warms the surface, buoyancy dominates shear in driving turbulence, leading to strong vertical mixing and convective updrafts (Wurps et al., 2020). In contrast, during nighttime, radiative cooling at the surface suppresses buoyancy, and turbulence is primarily generated by wind shear. The resulting stable boundary layer (SBL) is characterized by weak turbulence and limited vertical mixing, leading to stratification of the flow. A characteristic feature of the nighttime SBL is the Coriolis-force-induced wind veer, which refers to the change in wind direction with height. Wind veer tends to be more pronounced under stable stratification compared to unstable conditions due to the suppression of vertical mixing in stable layers (Churchfield and Sirnivas, 2018). As wind turbines continue to grow in size, the impact of wind veer on their performance becomes increasingly critical. The largest commercially deployed wind turbine to date – the SG 14-222 DD at Moray West offshore wind farm in Scotland – features a rotor diameter of 222 m and a power capacity of 14.7 MW (Siemens Gamesa, 2024). With a hub height of approximately 140 m, the rotor swept area extends from roughly 30 to 250 m above mean sea level. Prototypes of even higher-rated turbines, exceeding 20 MW, are currently in various stages of development, which will result in even taller structures. As the rotor spans of modern WTs are reaching 200–300 m, turbines operating across such vertical extents can experience a substantial level of wind veer. Observations at Cabauw observatory indicate wind veering up to 40° over the lowest 200 m of the atmosphere, i.e., veer change of 0.22 ° m−1 (Van Ulden and Holtslag, 1985). Furthermore, wind veer was observed to occur more than 70 % of the time over the course of a year in offshore environments with an average veer of 0.07° m−1 (Bodini et al., 2019). For a modern turbine of 200 m rotor diameter, this results in wind veer of ∼18° across the rotor, thus highlighting the need to account for its effect on WT wake structure and evolution.
Wind veer has been shown to significantly influence the wake characteristics and power performance of WTs in many numerical studies and field experiments. Using lidar and turbine data, Sanchez Gomez and Lundquist (2020) reported turbine underperformance at high wind veer, while analysis of a 5-year field dataset by Gao et al. (2021) also found a loss in power production of up to 6.5 % in veering wind conditions. Large-eddy simulation (LES) is a widely adopted high-fidelity approach due to its faithful prediction of unsteady dynamics and its ability to resolve dominant large-scale turbulent structures that govern wake evolution (Xie and Archer, 2017). Several numerical studies have demonstrated a skewed wake profile as a result of veered inflow for non-yawed turbines (Lu and Porté-Agel, 2011; Abkar and Porté-Agel, 2016; Vollmer et al., 2016; Bromm et al., 2017; Xie and Archer, 2017; Churchfield and Sirnivas, 2018; Wu et al., 2024; Klemmer and Howland, 2024). Churchfield and Sirnivas (2018) hypothesized that under veer conditions, the wake adopts an ellipsoidal shape, whereby high-momentum flow can reach the wake core more quickly due to the shorter lateral distance along the minor axis of the ellipsoid, thereby enhancing wake recovery. Abkar and Porté-Agel (2016) attributed faster wake recovery under veered conditions to increased shear production and enhanced turbulent kinetic energy resulting from the combined effects of vertical and lateral shear, in contrast to that of a turbine operating under unidirectional inflow. The stretching of the turbine wake due to ambient wind veer was also observed in lidar measurements-based field studies (Bodini et al., 2017).
As wind turbine wake interactions are one of the leading causes of reduced power production (Barthelmie et al., 2009) and mechanical and fatigue loading on downstream wind turbines (Sathe et al., 2013), wake steering has emerged as an effective way to mitigate wake losses (Gebraad et al., 2016). The physics of wake steering and its benefits as a yaw control strategy have been extensively investigated in numerical simulations (Fleming et al., 2014; Vollmer et al., 2016; Archer and Vasel-Be-Hagh, 2019) and both laboratory (Bastankhah and Porté-Agel, 2016; Bartl et al., 2018; Schottler et al., 2018; Hulsman et al., 2022) and field experiments (Fleming et al., 2017, 2019, 2020; Howland et al., 2019, 2022). Usually, the effect of ambient wind veer on the efficacy of wake steering as a yaw control strategy is not considered. Several numerical studies have begun to explore yawed turbine wakes under veered inflow. For instance, Narasimhan et al. (2022) showed that wind veer distorted the structure of the two counter-rotating vortices and introduced an asymmetry in the curled shape of the wake. In a conventionally neutral boundary layer (CNBL), they found that the influence of veer could be superimposed on the yaw-induced wake behavior. Including wind veer effects and turbine yaw in analytical wake models has started to receive traction recently. For instance, Mohammadi et al. (2022) extended the vortex-sheet curled wake model of Bastankhah et al. (2022) by incorporating veer effects through a height-dependent effective yaw angle term. The modified model showed good agreement with the LES results. More recently, Narasimhan et al. (2025) proposed a new analytical wake model for turbines (both yawed and non-yawed) operating in CNBL and SBL conditions, also showing strong agreements with the LES data. Wake steering via yaw misalignment is generally most effective under low-turbulence conditions (Fleming et al., 2019; Simley et al., 2020), which are typically found at night and are associated with a stable boundary layer. Notably, wind veer is also prevalent in nighttime stable conditions, making it essential to investigate the combined effects of wind veer and yaw on wake behavior for more effective deployment of yaw control strategies in real-world scenarios.
Complementary to these modeling efforts, wind tunnel experiments offer valuable insights into the flow physics of yawed wind turbines under controlled inflow conditions. Numerous studies have explored yawed turbines, driven by the potential of yaw misalignment as a strategy for wake control. A brief review of experimental works on yawed wind turbines is presented here. The aerodynamics of yawed wind turbines were first studied experimentally by Grant et al. (1997) and Grant and Parkin (2000). In the former study, the authors visualized the motion of vortex shedding for a wind turbine in yaw and found the power coefficient to be dependent on yaw angles, in alignment with the earlier theoretical works (Clayton and Filby, 1982). In the latter study, by contrast, the authors used digital PIV to measure velocity fields and tip vorticity of a turbine in yaw and found that the initial formation of the tip vortex depends on the rotor yaw angle and blade orientation. The tip vortex of the yawed wind turbine was investigated in the open-jet facility at TU Delft by Haans et al. (2005), who found the expansion of the skewed wake to be strongly correlated with CT and to play a key role in governing the wake skew angle. Later, an analytical expression of wake skew angle dependence on CT and turbine yaw angle was given by Jiménez et al. (2010). In a seminal experimental work by Medici and Alfredsson (2006), the authors first noted the asymmetric wake shape owing to turbine yaw as a result of the lateral force exerted by the turbine on the flow, as well as the importance of wake rotation on wake development. In a wind tunnel study of wake interference between two wind turbines, Adaramola and Krogstad (2011) recommended yawing the upstream turbine in order to increase the overall power production in wind farms.
The asymmetric and curled shape of the wake of yawed turbines was first observed by Howland et al. (2016), where they used hot wire anemometry and Pitot-static probes for wake measurements of a porous disc. They ascribed the curled shape of the wake to the two counter-rotating vortices shed by the yawed porous disc. Concurrently, in the seminal work of Bastankhah and Porté-Agel (2016), the authors studied the wake of yawed WTs experimentally using SPIV and investigated the formation mechanism of counter-rotating vortex pairs that lead to the curled shape of the wake, which they attributed to the strong spanwise velocity in the wake. Moreover, they also proposed an analytical model for wake deflection and velocity distribution in the far wake. To investigate the impact of inflow turbulence and inflow shear on yawed wind turbines, Bartl et al. (2018) used laser Doppler anemometry (LDA) to measure wake flow. Their results indicate the dependence of wake shape on turbulence level in the inflow, as the asymmetry in the yawed turbine wake reduces as a result of enhanced mixing for increased levels of inflow turbulence. However, as the inflow shear they considered was only moderate, not much impact of shear on the wake was observed. In another work, Schottler et al. (2018) performed wind tunnel experiments on two different turbines under both non-yawed and yawed conditions, characterizing the wake width using a turbulence intermittency parameter. They identified a region of velocity increment surrounding the mean deficit and high-TKE regions, which makes the effective wake considerably wider than the deficit alone suggests – an important consideration for wake steering-based control strategies. More recently, Hulsman et al. (2022) studied the effect of boundary layer and turbulence intensity on the curled shape of yawed wind turbines in a wind tunnel experiment. The authors found that boundary layer inflow accelerates the formation of the curled shape sooner compared to the uniform inflow case due to shear in the wind, wake rotation, and the formation of counter-rotating vortex pairs as a result of yaw.
As highlighted in the preceding literature review, most wind tunnel studies of yawed wind turbines have employed idealized inflow conditions. Atmospheric stability induces two important indirect forcings: vertical wind shear and wind veer (Klemmer and Howland, 2024). While the impact of vertical wind shear on wind turbine wake characteristics is often studied in wind tunnel experiments, wind veer has not been experimentally investigated. Furthermore, understanding wake behavior under veered inflow is essential, as the effectiveness of wake redirection strategies, such as wake steering, depends on the interaction between yaw misalignment and realistic atmospheric conditions (Vollmer et al., 2016).
This study aims to experimentally assess the wake behavior of a statically yawed porous disc subjected to veered inflows. The choice of a non-rotating porous disc is motivated by its simplicity and ease of implementation in wind tunnel experiments, as well as the ability to readily adjust the disc porosity (β), defined as the ratio of open area to the total disc area, to match the thrust coefficient of an operating wind turbine. Steiros and Hultmark (2018) derived a simple relation between the drag coefficient (CD) and β using potential flow theory and momentum conservation and experimentally validated it against a range of disc porosity values. Since the seminal work of Castro (1971), who investigated flow through perforated discs, porous discs have been widely researched as analogs for wind turbines. For example, Sforza et al. (1979) employed perforated discs to emulate wind turbine wakes. Since then, several studies have utilized porous discs for a faithful representation of wake characteristics. Primarily, two types of discs have been employed in wind tunnel studies: a uniform porous disc, in which the spacing in the mesh is uniform throughout (Aubrun et al., 2013; Lignarolo et al., 2016), and a non-uniform porous disc with porosity varying radially to reproduce the realistic loading distribution (Howland et al., 2016; Camp and Cal, 2016, 2019; Aubrun et al., 2019; Neunaber et al., 2021; de Jong Helvig et al., 2021; Vinnes et al., 2022, 2023; Öztürk et al., 2023; Bourhis and Buxton, 2024). These studies have demonstrated that porous discs can reproduce the key features of turbine wakes, particularly in the far wake. In particular, Aubrun et al. (2013) found that for , the wakes of a rotating turbine and a porous disc exhibit similar characteristics. Likewise, Lignarolo et al. (2016) reported comparable wake expansion and energy extraction between a wire mesh disc and a wind turbine under low turbulence when matched in diameter and thrust coefficient. Studies have also shown that higher-order two-point statistics of wind turbine models can be replicated by porous discs (Neunaber et al., 2021; Vinnes et al., 2022). The most critical parameter in the porous disc is the disc porosity that essentially determines the flow resistance, and hence CD. It was shown by Bourhis and Buxton (2024) experimentally that wake evolution is different for discs with varying porosity and thrust coefficients and strongly depends on the freestream turbulence and integral length scale in the ambient flow. With increasing disc porosity, the wake shifts from the periodic von Kármán vortex shedding pattern to the regime where this is absent (Cicolin et al., 2024). Apart from the disc porosity, Theunissen and Worboys (2019) found that even for the same porosity, the hole topology can significantly affect the near-wake characteristics and drag coefficient, thus highlighting the need to properly choose the design of the porous disc. In summary, porous discs – when carefully designed to match the thrust coefficient of an operating wind turbine – have been shown to faithfully reproduce key wake characteristics, making them a practical and well-validated tool for parametric wind tunnel investigations.
While these studies have extensively characterized porous disc wakes under uniform and turbulent inflows, the influence of wind veer has not been investigated in a controlled laboratory setting. To the best of the authors' knowledge, this experimental study is the first of its kind to examine the impact of wind veer on wind turbine wakes in a wind tunnel, where the turbine is represented by a non-rotating porous disc and stereoscopic particle image velocimetry (SPIV) is used as a flow measurement technique. The current wind tunnel experiments for yawed discs and veered inflow in controlled conditions can provide validation data for high-fidelity numerical modeling codes. Moreover, this work can serve as a foundation for improving engineering wake models for yawed turbines proposed in many studies in the past to incorporate veer effects. In addition to demonstrating the feasibility of reproducing wind veer in a wind tunnel, we aim to address the following research questions.
-
How do wind veer-induced wake stretching and yaw-induced wake curl enhance wake recovery?
-
What is the impact of wind veering on the effectiveness of wake steering-based control strategies?
The rest of the paper is organized as follows: in Sect. 2, the experimental setup and methodology are outlined, followed by discussions of results in Sect. 3. The limitations of the current experimental setup and future work are highlighted in Sect. 4. The implications of the results on wake steering and final conclusions are presented in Sect. 5.
This section outlines the experimental setup and methodology used to investigate the effects of veer on porous disc wakes. Section 2.1 introduces the schematic and description of the wind tunnel setup, followed by the design of the porous disc and wind veer model in Sect. 2.2. The test matrix and experimental conditions are summarized in Sect. 2.3, while details of the SPIV measurement system are provided in Sect. 2.4. The associated flow measurement uncertainty is discussed in Sect. 2.5. Finally, Sect. 2.6 presents the flow characterization in the absence of the porous disc.
2.1 Wind tunnel
The experiments are performed in the W-tunnel at TU Delft Aerospace Engineering Laboratories. The W-tunnel is an open-jet wind tunnel with an adjustable test section at the outlet. In this experiment, the test section at the exit has dimensions 0.6 m×0.6 m, which is large enough for deflected flow as a result of yaw and wind veer to remain within the streamtube. The measurements are carried out at the free-stream velocity Uref=10.3 m s−1. At this flow velocity, the Reynolds number based on disc diameter is approximately 68 000, and the turbulence in the undisturbed flow is of the order of 0.5 %. A rough schematic sketch in Fig. 1 shows the top view of the experimental setup employed in the current study to measure wake cross-section (Fig. 1a) and wake propagation in streamwise planes (Fig. 1b). Figure 2 shows a photograph of the experimental setup for cross-stream plane measurements, with key components labeled. It should be noted that in the laboratory setup, the disc is yawed with respect to the y axis of the coordinate system shown in Fig. 2, resulting in a physical wake deflection in the z direction. To measure streamwise wake evolution, the laser measurements are therefore performed in the xz plane of the laboratory coordinate system. For data analysis and presentation, the coordinate system is rotated in post-processing to follow the standard convention in the literature, where yaw occurs about the z axis and the wake deflects laterally in the y direction.
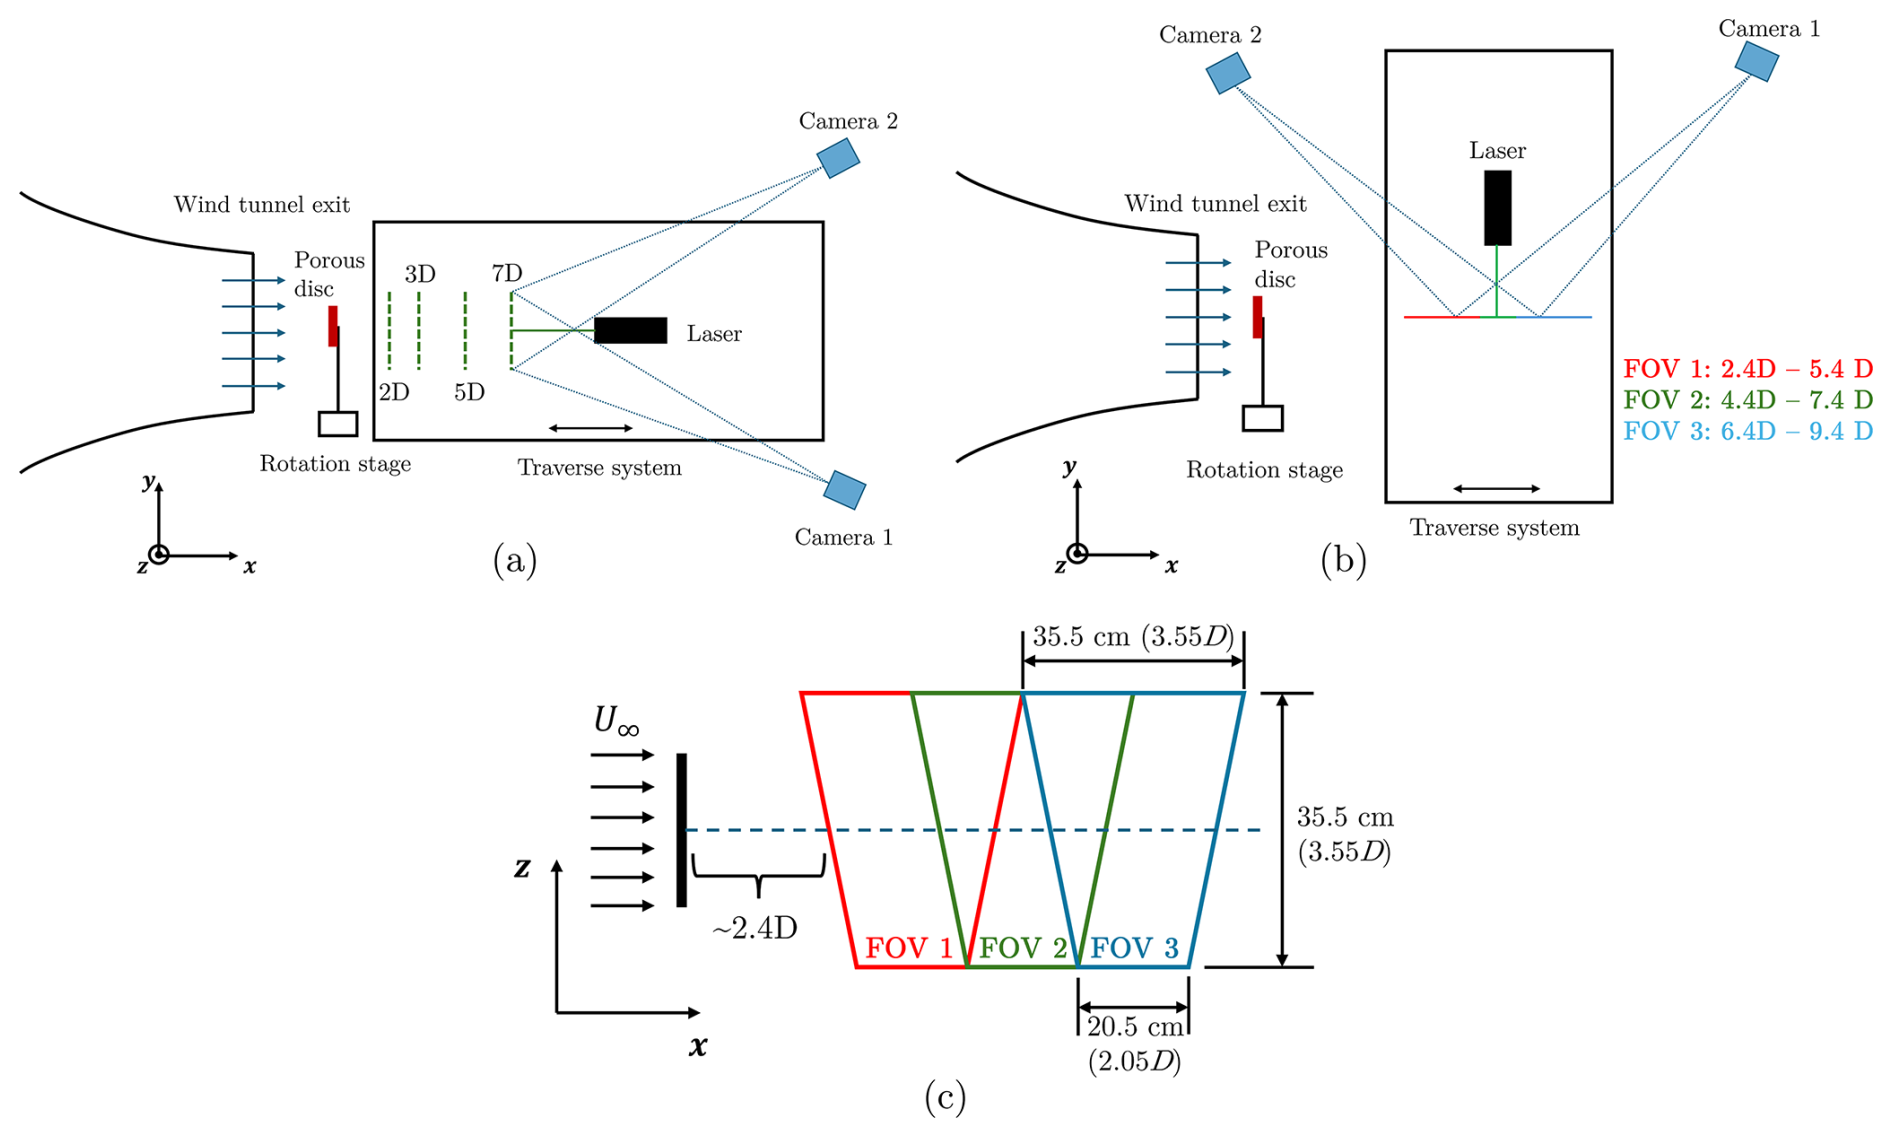
Figure 1Top view of the SPIV experimental setup for imaging (a) cross-stream planes (yz) and (b) streamwise planes (xz). The cross-stream positions where measurements are taken are indicated by dashed green lines in Fig. 1a. In total, measurements were performed at four cross-stream planes (, 3, 5, and 7). Streamwise measurements were also performed in the xz plane to capture wake evolution, and the imaging planes are indicated by the red, green, and blue lines, with some overlap between consecutive lines (Fig. 1b). The laser sheet is coming out of the plane in both figures. (c) The dimensions of the field of view (FOV) are indicated here. For streamwise FOVs, an overlap of 1D is applied at the center of the trapezoid. A Gaussian function is applied to stitch the streamwise FOVs. It should be noted that the dimensions of the FOV remain the same for both cross-stream and streamwise measurements.
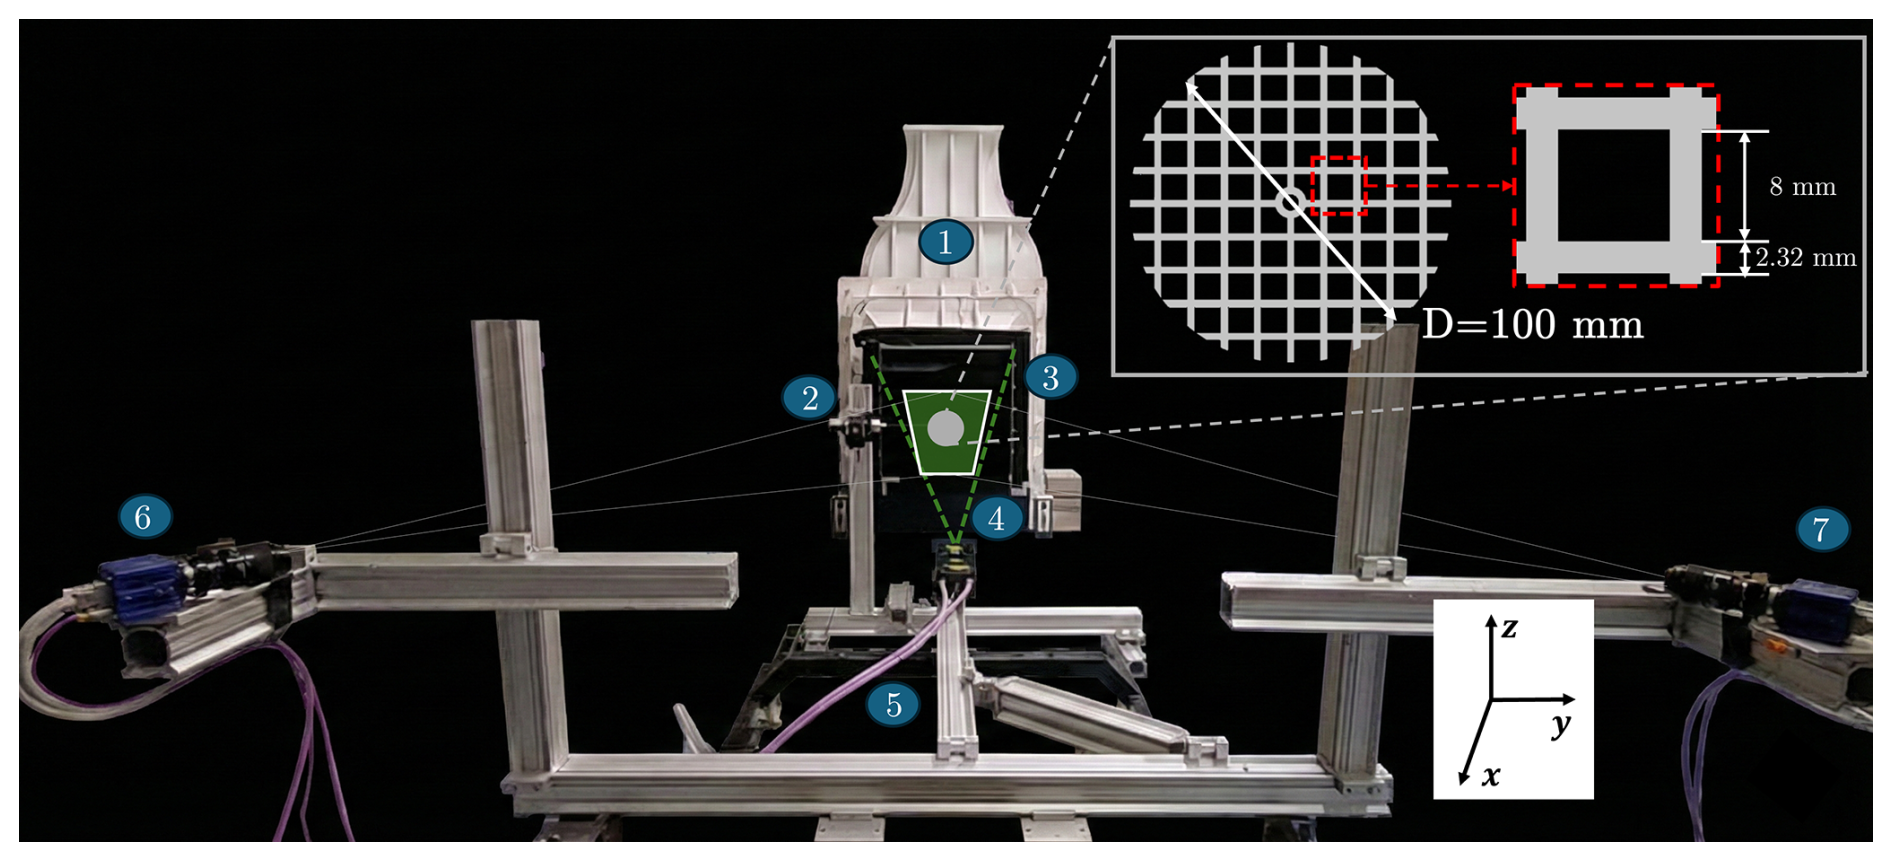
Figure 2Photograph of the experimental setup in the W-tunnel for measuring cross-stream wake planes. The key labeled components are as follows: (1) exit of the W-tunnel; (2) rotation stage on which a porous disc is mounted; (3) wind veer model installed at the exit of the wind tunnel; (4) laser sheet emanating from the laser (span of the sheet marked by dashed green lines); (5) traverse system; (6) camera 1; (7) camera 2. The field of view (FOV) is denoted by a filled green trapezoid. The porous disc is shown as a solid gray circle. The inset figure shows the dimensions of the porous disc along with the void dimensions. The coordinate system is shown on the bottom right. The origin of the coordinate system is at the porous disc center, with x being the streamwise direction, and y and z denoting the spanwise and vertical directions, respectively.
2.2 Porous disc and wind veer model
A uniform porous disc of diameter 10 cm and porosity 0.6 was 3D printed to replicate the effects of a wind turbine. Load measurements were performed to determine the thrust coefficient of the porous disc for the no-veer case and non-yawed conditions using a KD24S 2N (ME-Meßsysteme GmbH) force sensor with an accuracy of 0.1 % of the full-scale value (2N). Based on the load measurements, the thrust coefficient (CT) of the porous disc is approximately 0.69, which also aligns well with the general trend of the porosity vs. CT curve given in the literature (Lignarolo et al., 2016; Huang et al., 2022).
The airfoil shape used in wind veering vanes is a NACA 0014 with a chord (c) of 0.2 m. This airfoil was selected based on its symmetric shape and relatively high angle of attack at which stall occurs (i.e., α ∼ 14°). Two wind veering vanes are employed in this study: one producing a wind veer of ∼10° and the other a veer of ∼20° across the porous disc. The variation in the angle of attack with height is shown in the left of Fig. 3. The vanes are designed so that at the center of the porous disc, the angle of attack is zero and increases symmetrically in positive and negative directions above and below the disc center. This is achieved by twisting the airfoil in opposite directions from the center outward, extending to the edges of the wind tunnel exit. For instance, in the 10° veer configuration, the vane twist varied linearly with a gradient of 1° cm−1 until the edges of the wind tunnel, resulting in a total wind veer of 10° across the porous disc (+5° at one edge of the disc and −5° at the opposite edge of the disc). This design approach reflects common assumptions in stable boundary layer simulations, where the wind veer angle is set to zero at hub height and varies in the opposite direction above and below the hub height. The porous disc is positioned ≈20 cm downstream of the exit of the wind veering vanes. The disc was placed relatively close to the tunnel exit because the facility operates in an open-jet configuration, which limits the maximum downstream distance at which stable wake measurements can be obtained before flow quality deteriorates.
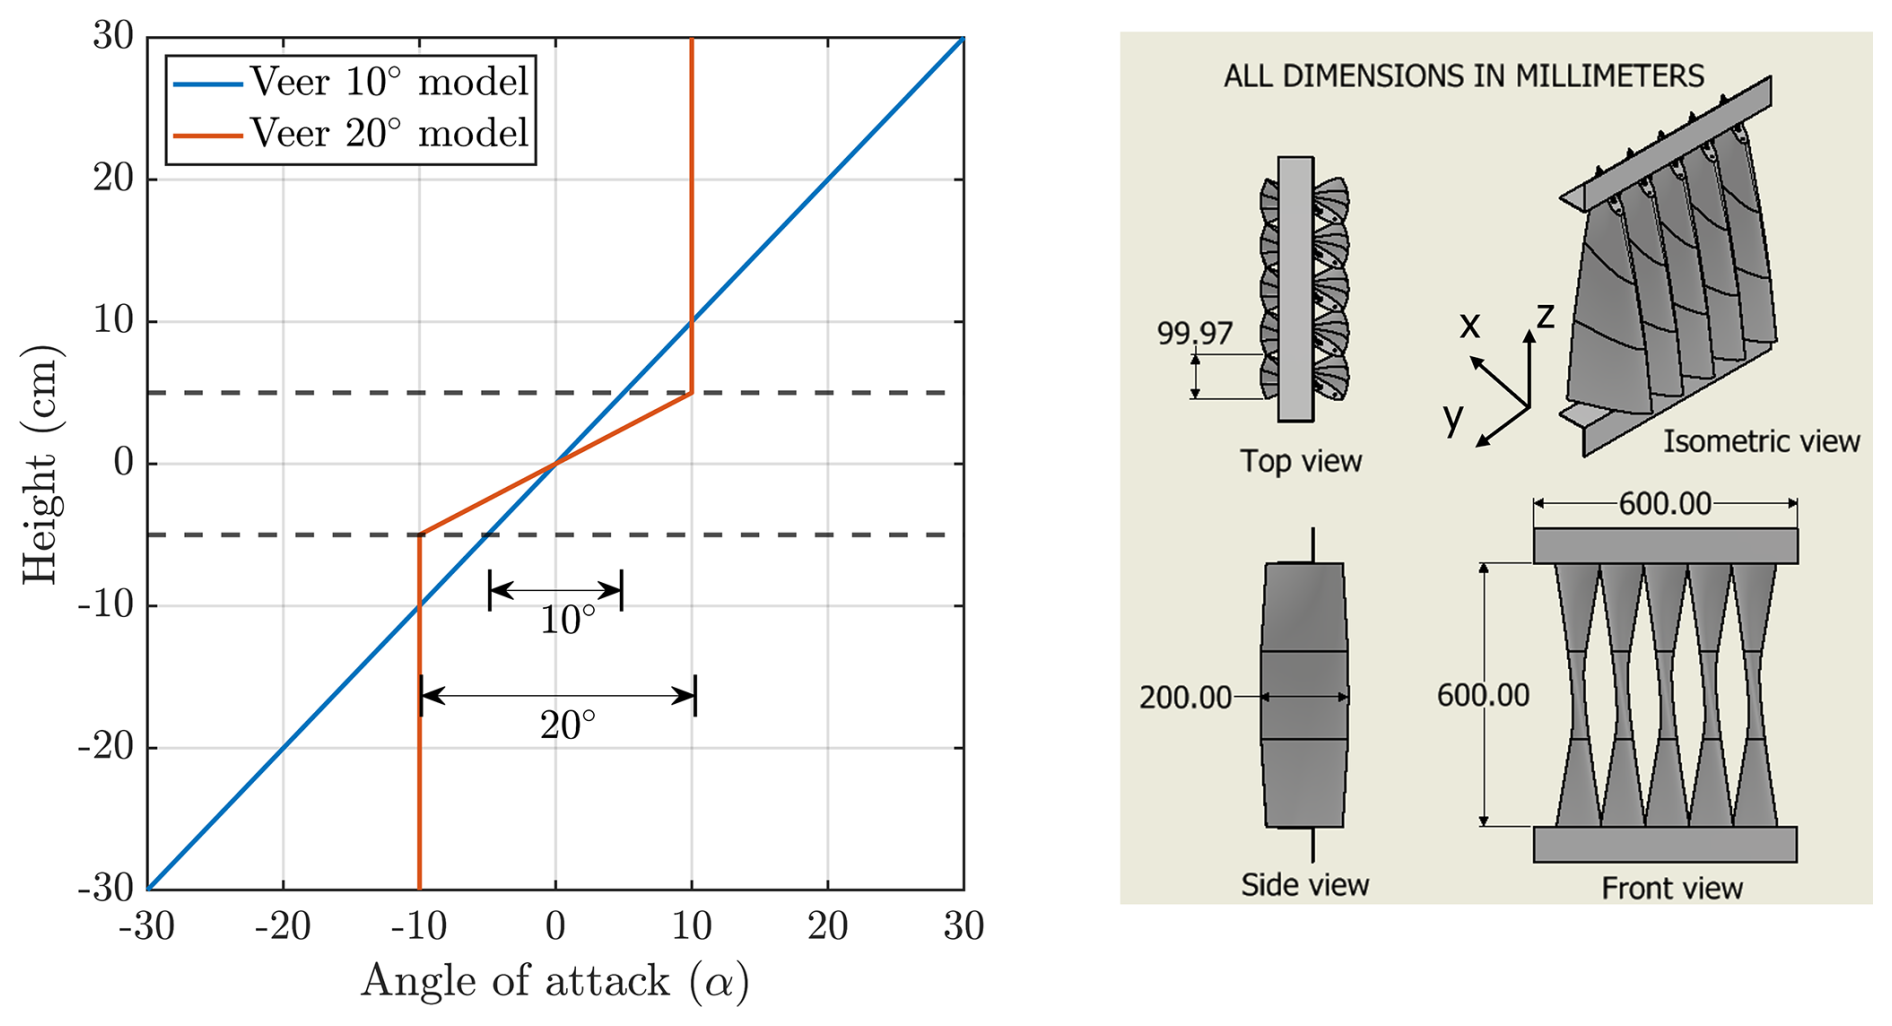
Figure 3Left figure: variation in angle of attack of the NACA airfoil for wind veer model of 10° (blue line) and 20° (orange line). The dashed horizontal line represents the top and bottom extent of the disc, such that a total of 10 and 20° veer is generated from the two models, respectively. Right figure: different views of the wind veer model for generating a veer of 10° installed at the exit of the wind tunnel. The leading-edge portion of the model is located inside the wind tunnel, while the trailing-edge portion extends outside. A similar model that generates a wind veer of 20° (not shown here) is also tested.
However, such a continuous transition in angles from the disc center to the edges of the wind tunnel exit for the wind veer model of 20° would result in excessively high angles of attack, which are undesirable. To address this, the vane is twisted smoothly from 0° at the center of the disc to ±10° at 5 cm away from the center. Beyond this point, the twist does not increase further – instead, the vane keeps a constant angle of ±10° all the way out to the edges of the wind tunnel exit (see orange line in the left Fig. 3). This configuration ensures a smooth gradient of angle across the span of the guiding vane, as shown in Fig. 3 (left); the corresponding model installed at the tunnel exit is shown in Fig. 3 (right).
In the present study, stationary vanes were designed to produce wind veer; however, active grids represent another promising avenue for generating veered inflows (Neuhaus et al., 2021). While these grids are commonly used for generating shear flows, gusts, and homogeneous and isotropic turbulence, they theoretically possess the capability to generate wind veer. By switching from standard counter-rotating shaft protocols – which are designed to neutralize deflection – to co-rotating adjacent shafts, the system could effectively steer the flow. Alternatively, Multi-fan wind tunnels (MFWTs) offer a state-of-the-art solution that overcomes the mechanical constraints of physical grids. MFWTs can achieve directional flow by employing multi-directional driving models, which selectively activate fan pairs oriented toward the desired flow angle (Rajasekara Babu et al., 2025).
2.3 Case overview
The test matrix of the measured cases is summarized in Table 1. As it is of interest to investigate varying degrees of wind veer and its impact on wake recovery, two veered inflows are examined in addition to the reference uniform inflow (no-veer) for comparison. Initially, flow characterization is conducted in the absence of the porous disc for all three inflows (uniform flow, 10° veer, and 20° veer). Subsequently, wake measurements are performed in the presence of the disc at four cross-stream planes and three streamwise planes, as illustrated in Fig. 1, for different yaw angles of the disc. In this study, yaw misalignment is applied only in the direction of the inflow veer (positive yaw). This is motivated by the fact that spanwise velocity induced by negative yaw angles counteracts the direction of veer that can restrict the wake to rotor frontal projection (Narasimhan et al., 2025), whereas positive yaw acts constructively with veer to enhance wake deflection (Vollmer et al., 2016). Other LES-based wind farm studies also show that negative yaw results in overall power losses in the Northern Hemisphere (Archer and Vasel-Be-Hagh, 2019).
Table 1Test matrix used in the experiment. n/a: not applicable.

2.4 Flow measurement system
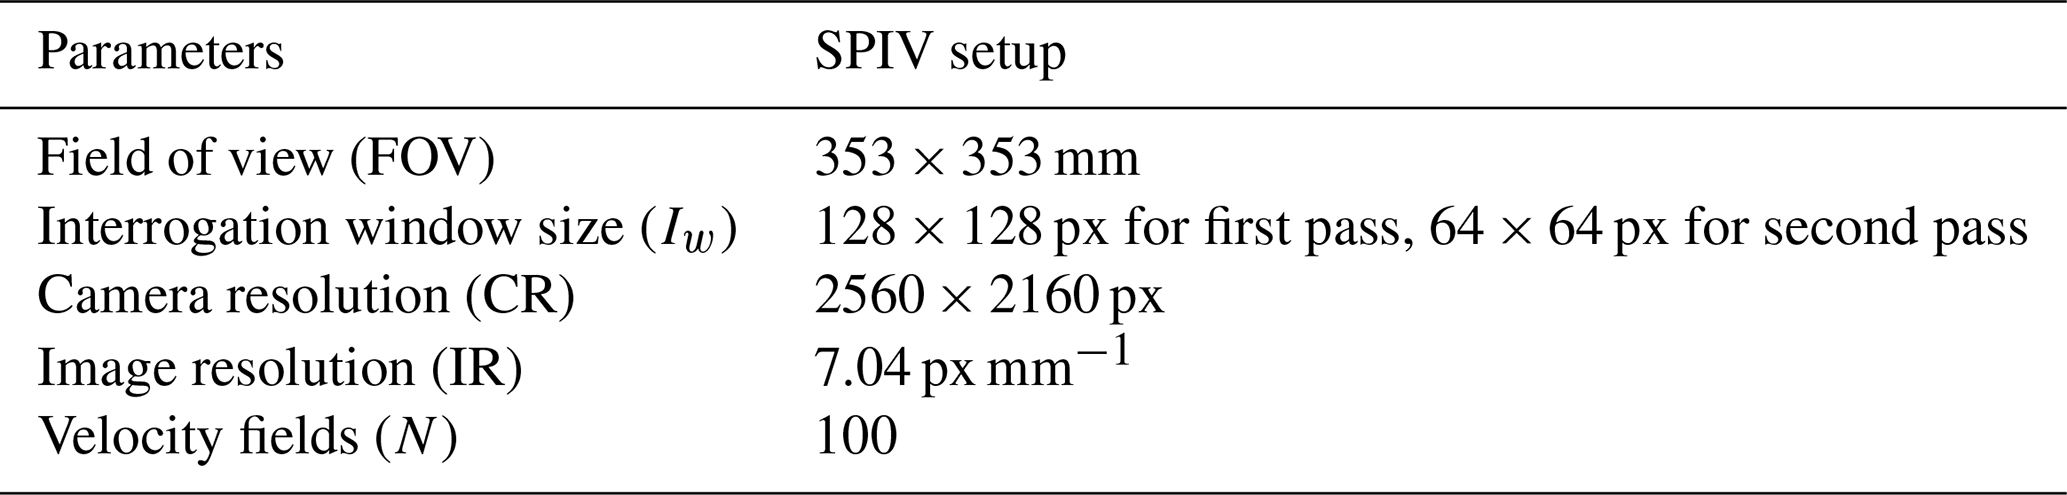
Due to the combined effect of turbine yaw and wind veer, all three velocity components of the flow become relevant. Consequently, stereoscopic particle image velocimetry (SPIV) was employed in the present study for wake flow measurements in the cross-stream and streamwise directions. In the past, SPIV has been commonly used for wake measurements of yawed HAWTs (Bastankhah and Porté-Agel, 2016) and also for VAWTs (Rolin and Porté-Agel, 2018; Bensason et al., 2024). In the present experiment, the seeding is done via a SAFEX smoke generator, which releases smoke in the form of water-glycol fluid particles of average diameter of 1 µm and a particle density of 103 kg m−3. The field of view (FOV) is illuminated by the Quantel Evergreen double-pulsed laser operating at a wavelength of 532 nm and delivering 200 mJ of energy per pulse. The thickness of the illuminated laser sheet is approximately 4 mm. Finally, images are captured using two LaVision sCMOS cameras (2560 × 2160 px, pixel pitch of 6.5 µm px−1) at a frequency of 15 Hz positioned on the opposite side of the laser sheet, as depicted in Fig. 2. A Scheimpflug adapter was used to adjust the focus of the camera plane to the measurement plane.
SPIV works on the principle of stereoscopic imaging, where two cameras simultaneously record the same image plane at different angles over two very closely spaced time intervals. The two views allow the extraction of out-of-plane motion of particles, along with the in-plane displacement of the tracer particles. Once the images are captured, they are divided into small interrogation windows, and cross-correlation techniques determine particle displacement within each window (Prasad, 2000). The resulting FOV is trapezoidal in shape, with a width and height of approximately 35.5 cm at a camera angle of 78.84°, using AF Micro-Nikkor lenses of 105 mm focal length set at an aperture of f#=8. Time steps of 45 and 225 µs between consecutive images are used for cross-stream and streamwise measurements, respectively. Table 2 summarizes the main parameters of SPIV employed in this study. A total of 100 vector fields were captured for each measurement plane and averaged. Vector calculation was performed using a multi-pass stereo cross-correlation approach with decreasing interrogation window sizes. The first pass employed a 128 × 128 px (18 × 18 mm) window size, followed by a second pass using 64 × 64 px window size (9 × 9 mm) with an overlap factor of 50 %, resulting in a final vector grid resolution of 32 pixels (4.5 mm).
The two cameras and laser are rigidly mounted on the traverse system with a spatial accuracy of 0.001 mm. The traverse system is capable of translational motion in both streamwise and spanwise directions. The spanwise measurements (i.e., wake cross-sections) at multiple downstream locations ranging from to are captured by moving the traverse system in the streamwise direction (shown in Fig. 1a). Meanwhile, streamwise wake measurements are taken across three different FOVs, with overlapping regions between consecutive imaging planes to ensure a smooth transition in wake propagation downstream, as illustrated in Fig. 1c. The streamwise FOVs are stitched together during the postprocessing of results by applying a Gaussian function in the overlapping region to ensure the gradients are smoothed out. It should be noted that the rotation stage that holds the porous disc is fixed at its location and is not mounted on the traverse system. Additionally, a new calibration was performed after the experimental setup was rotated by 90° to measure streamwise velocity fields.
2.5 Flow measurement uncertainty
Following the work of Sciacchitano and Wieneke (2016), the uncertainty in velocity components, along with the derived quantities, is discussed in this section. Uncertainty quantification is crucial in PIV, particularly for an experiment as complex as this. It provides an estimation of the range that likely contains the true value of the variable of interest, thereby enhancing the reliability and interpretability of the results. The uncertainty in the time-averaged streamwise velocity can be expressed as
where σu is the standard deviation of the streamwise velocity, k is the 95 % confidence interval, i.e., 1.96, and N is the total number of instantaneous images (N=100). Similarly, uncertainties are calculated for in-plane velocity components ( and ). Moreover, the uncertainty in derived quantities, such as vorticity, can be expressed as follows:
where is the uncertainty in mean in-plane velocity components, d is the grid spacing between the consecutive interrogation windows (here, d=4.54 mm), and the cross-correlation factor ρ(2D) is approximated to be 0.45 (Sciacchitano and Wieneke, 2016). In addition to the uncertainties in velocity components and vorticity, uncertainty in Reynolds normal stress and turbulent kinetic energy (TKE) is also computed as follows:
where σu is the standard deviation of streamwise velocity and TKE = .
Table 3Uncertainty quantification of different variables of time-averaged data for three inflow cases. The percentages shown in the uncertainty quantification of velocity components are normalized with respect to the respective free-stream velocities averaged over the disc area. The values presented in this table represent the maximum observed values for each variable.

Table 3 summarizes the maximum uncertainty values for various variables across the three inflow conditions. As expected, the uncertainty in the veer inflow cases is slightly higher compared to the no-veer case, due to additional complexity in the flow introduced by vane-induced veer. We also estimated the standard uncertainty associated with the turbulent kinetic energy Uk as described in Sciacchitano and Wieneke (2016):
Therefore, the error in TKE computation is of the order of . For N=100, the error in TKE is around 7 %. Please note that the uncertainty values reported correspond to the shear region of the wake (at ), where the flow is heavily separated.
2.6 Flow characterization
For a complex system used to generate wind veer, such as the one employed in this study, it is essential to perform flow characterization in the absence of the porous disc. Ensuring a stable flow across all measurement planes is essential for obtaining reliable and consistent results in a wind tunnel experiment. Figure 4 shows the mean streamwise, spanwise, and vertical velocities, along with turbulence intensity and wind veer variation for all three inflow conditions. The reference velocity (Uref) used to normalize the velocity components is defined as the average velocity over the disc area located at . For the uniform inflow case, Uref= 10.3 m s−1. It is important to note that the placement of veering vanes at the tunnel exit induces a slight flow acceleration downstream of the vanes. As a result, for the veered inflow of 10°, Uref=11.43 m s−1, while for the veered inflow of 20°, Uref=10.85 m s−1. Uref is defined as the area-averaged velocity magnitude () over the disc projection area in the absence of the porous disc.
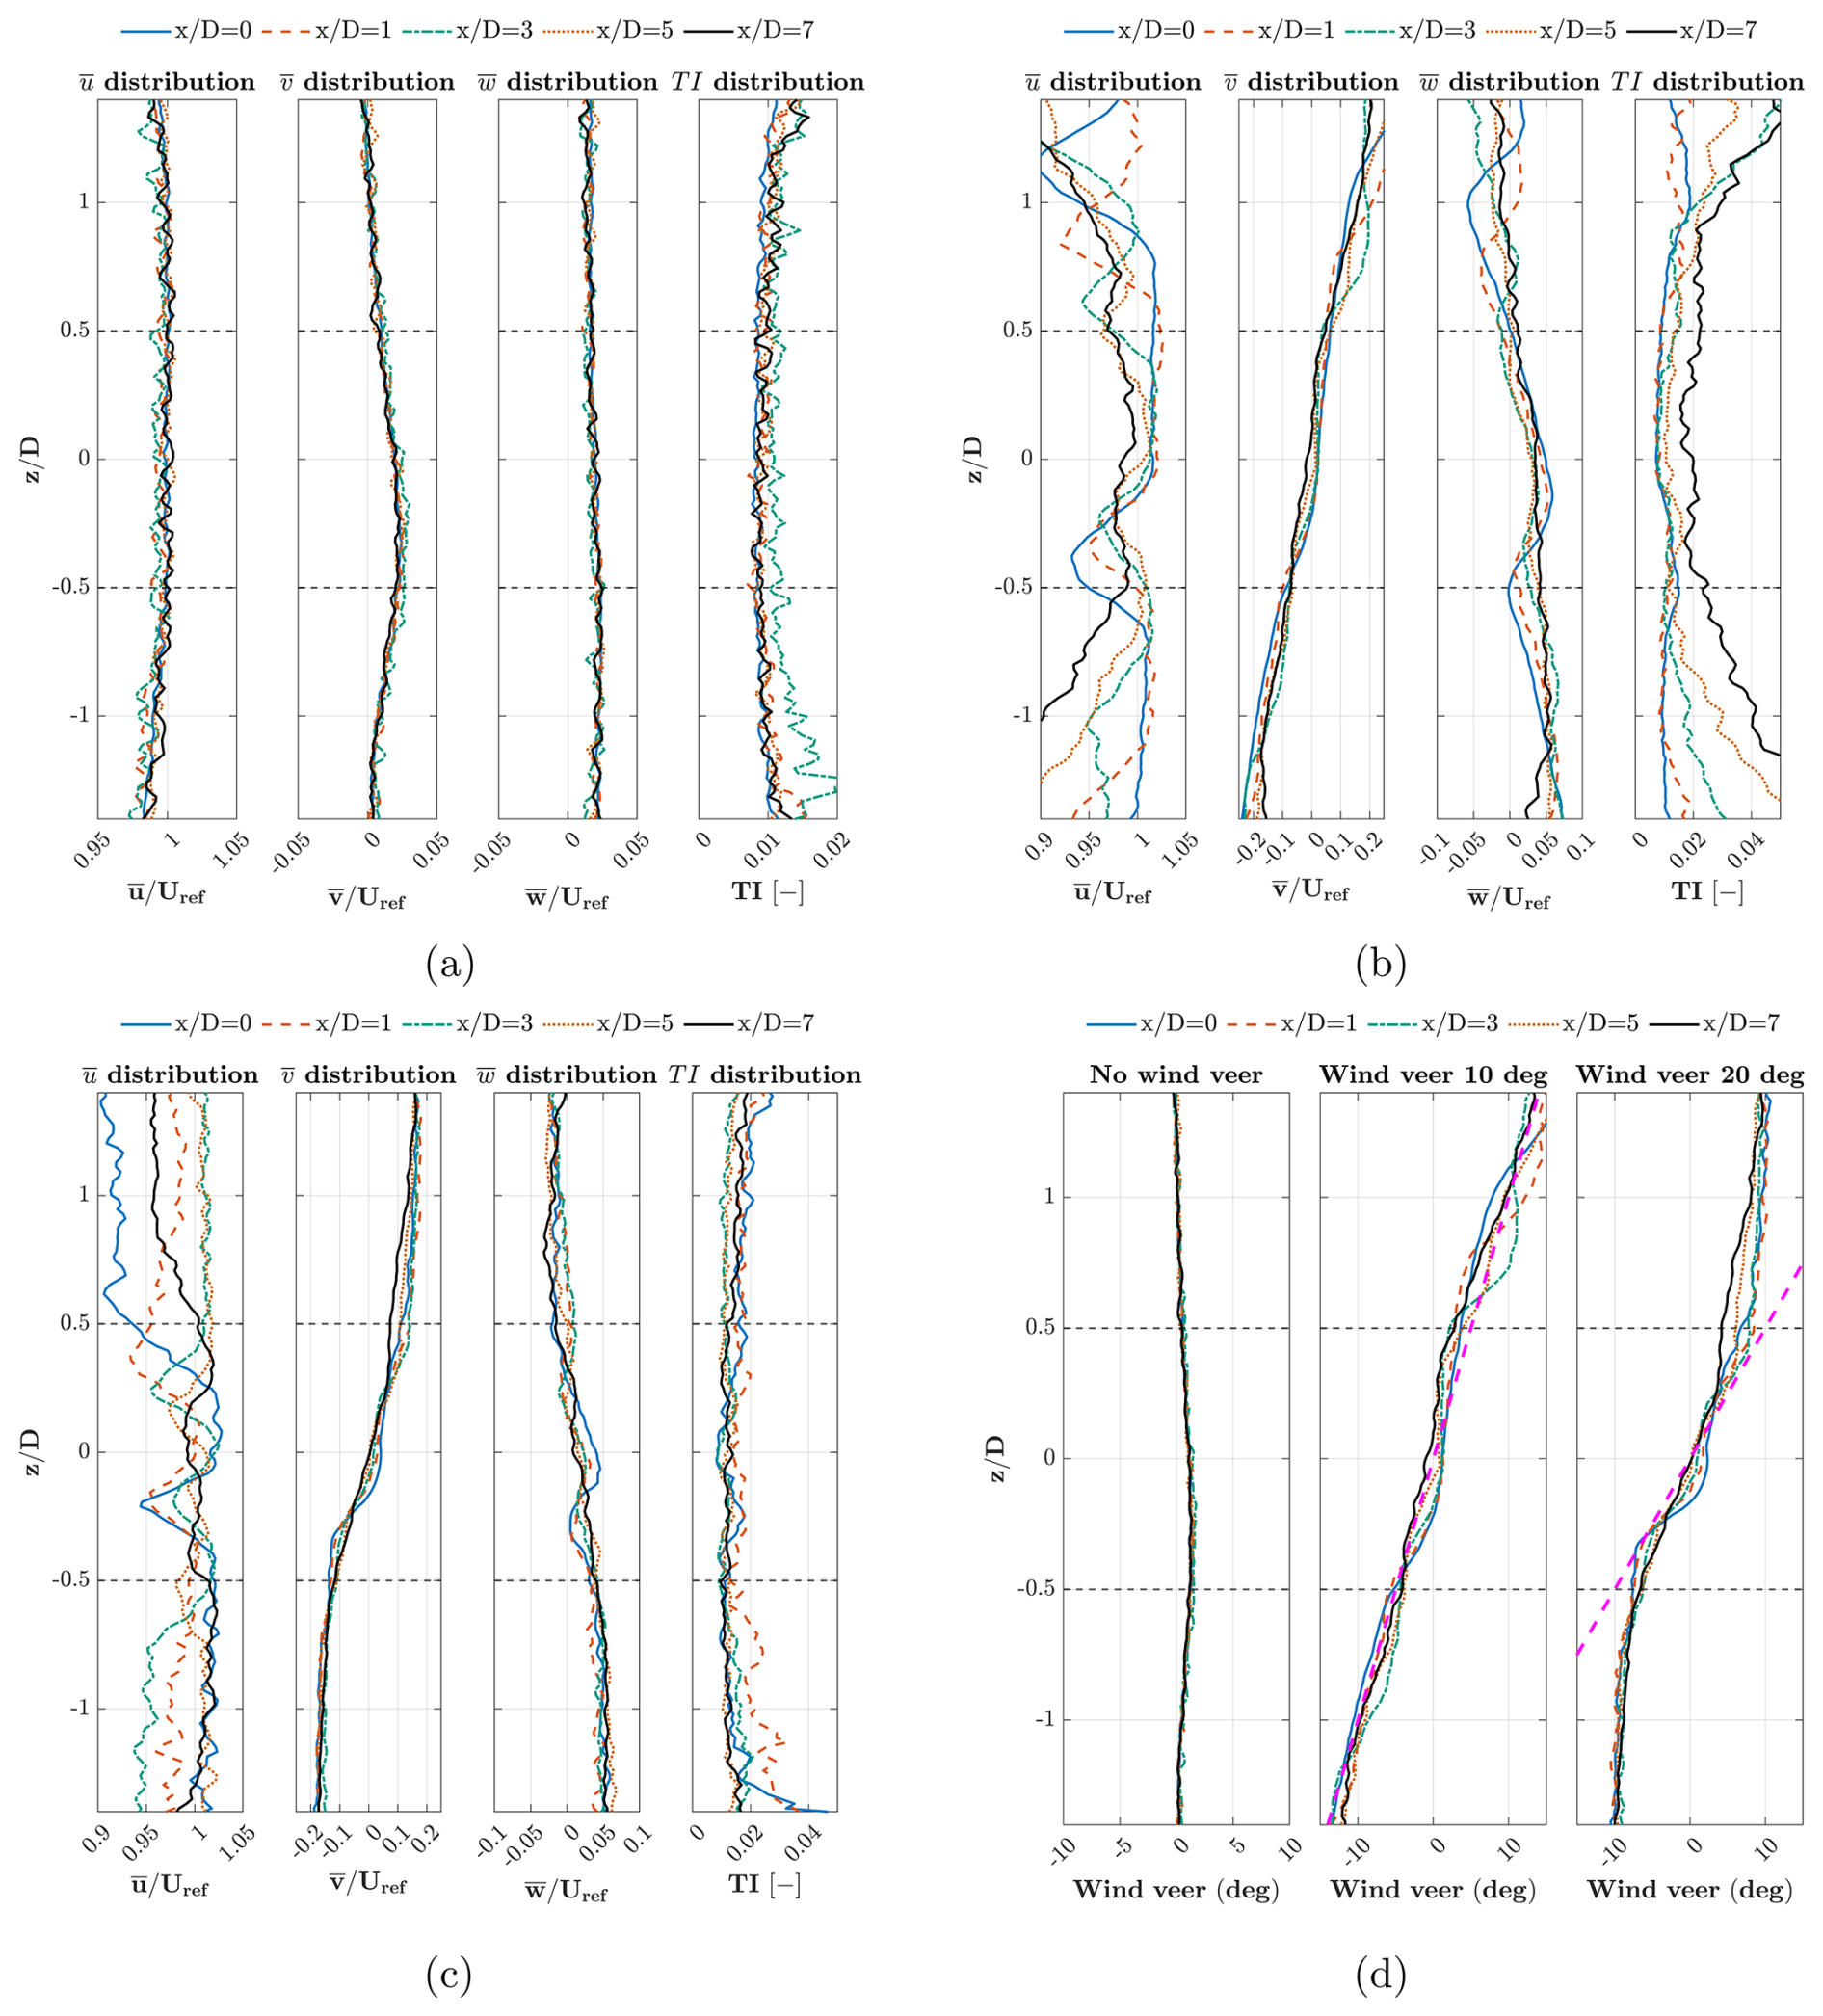
Figure 4Flow characterization at different downstream locations without the porous disc, extracted along the line y=0. Panels (a)–(c) show the streamwise, spanwise, and vertical velocities and the turbulence intensity for the clean case, the 10° wind veer case, and the 20° wind veer case, respectively; panel (d) shows the wind veer variation for all three cases, where the dashed magenta line denotes the idealized linear veer profile. The horizontal dashed lines at mark the vertical extent of the porous disc location.
The streamwise velocity profile for the clean (uniform inflow) case remains consistent across all downstream locations (see Fig. 4a). A minor spanwise velocity component of approximately 2 % is observed, which is attributed to the inhomogeneities within the wind tunnel. Additionally, the uniform inflow also has a persistent nonzero vertical velocity (see Appendix A for and velocity contours in the yz plane). The turbulence intensity within the disc region remains below 1 % at all streamwise planes, indicating highly stable flow conditions in the measurement domain.
For the case of the 10° wind veer model (Fig. 4b), the presence of vanes, however, results in a non-uniform streamwise velocity distribution across the disc due to wakes of the vanes. The minimum streamwise velocity typically deviates by less than 8 % from the mean reference velocity across all downstream locations. The veering vanes induce spanwise velocity in the flow that varies across the porous disc: generally positive above the centerline and negative below. The presence of vanes also results in nonzero vertical velocity, which can be attributed to the pressure difference induced by the vanes in the wake. The actual total veer across the porous disc location () is 8.91°. This value drops down to 6.97° at . The veer configuration, however, increases turbulence intensity due to partial flow blockage induced by the vanes. Despite this, the turbulence intensity across the disc area remains below 2.5 % at all measured streamwise locations for both veered cases, indicating relatively low levels of added turbulence by the veering vanes. The effect of turbulence on wake recovery is isolated in the momentum budget analysis discussed in Sect. 3.3.
Lastly, for the 20° wind veer configuration, the actual veer across the porous disc is 14.3° at , reducing to around 10.81° at . The dashed magenta line in Fig. 4d shows the ideal wind veer profile. It is calculated based on the fact that wind veer is a linear function of the vertical coordinate, i.e., , where A represents the maximum veer amplitude at the domain boundaries . The root mean square error (RMSE) between the target and measured veer profiles lies within the range of 1.23 to 1.53° for both veer cases, within the vertical range of . Although the reduction in wind veer downstream does not perfectly replicate real conditions, this deviation does not substantially affect the qualitative behavior of the wake evolution. As a result of producing wind veer using vanes, a localized deviation in the velocity profile is observed in the region for both 10 and 20° wind veer cases (see 20° veer inflow in Fig. 4d). This non-uniformity stems from the wakes of the veer-generating vanes; the resulting local low-pressure regions induce a slight migration of the freestream flow, causing a localized distortion of the intended veer profile. An additional discussion of flow characterization in the cross-stream yz plane and the horizontal xy plane is given in Appendix A.
3.1 Streamwise velocity fields
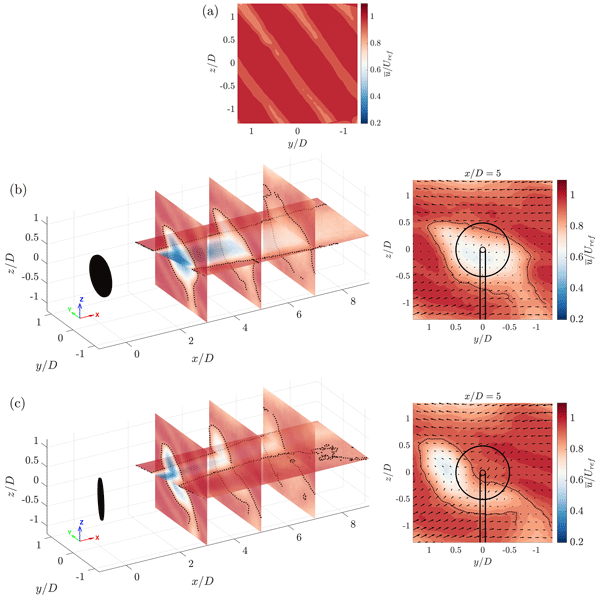
The normalized streamwise velocity contours corresponding to all three inflows – no-veer, veer 10°, and veer 20° – under two different yaw angles of 0 and 30° are presented in Figs. 5, 6, and 7, respectively. Each figure presents the inflow velocity field to the disc and a three-dimensional representation of wake evolution, where cross-stream planes at , and 7 are overlaid on the streamwise plane, for yaw angles of 0 and 30°. The figures also include planar views of streamwise velocity contours with in-plane velocity vectors at for both yaw angles. As the wakes are not axisymmetric for veered inflow, it is of interest to find the location of the wake center and how it moves downstream for both non-yawed and yawed cases. Here, the wake center is computed at each cross-stream plane (, 5, and 7) using the center of mass method (Howland et al., 2016), given by the following equations:
In Eq. (6), yc(x) and zc(x) are the wake centers in the spanwise and vertical directions, and the streamwise velocity deficit is defined as . The integration is performed at each cross-sectional plane. The wake center for different inflows and yaw angles of 0 and 30° is shown in Fig. 8.
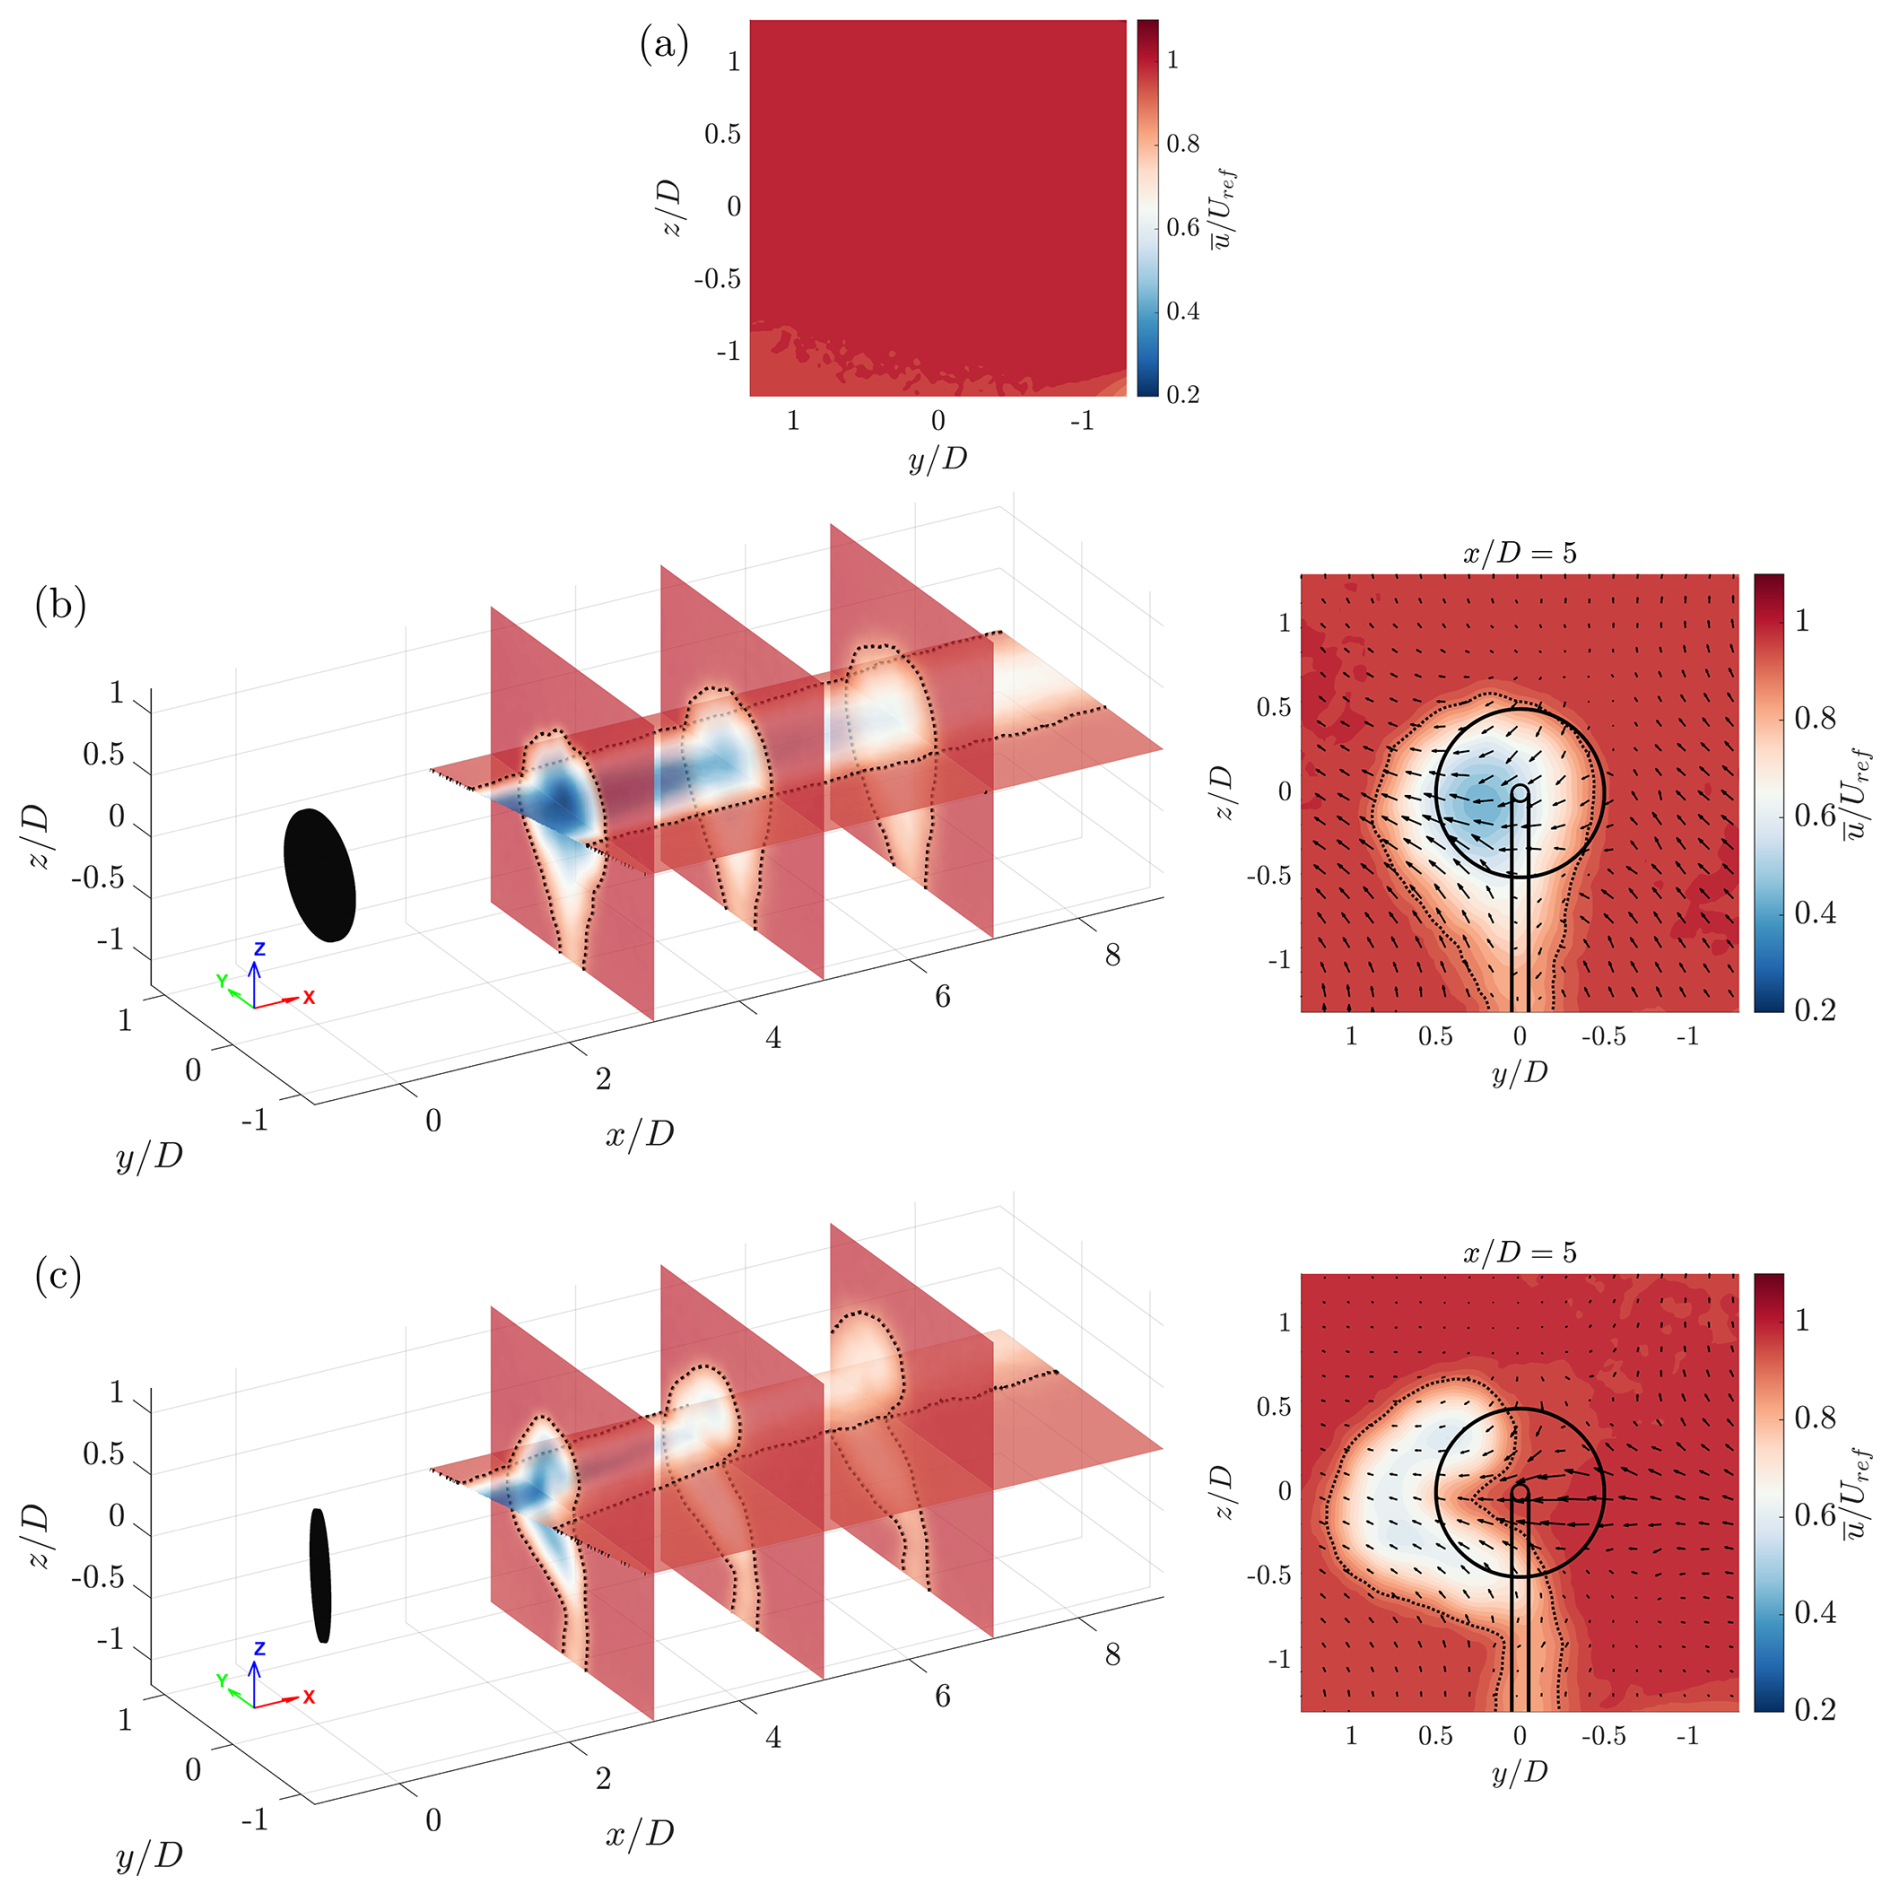
Figure 5Normalized streamwise velocity wake contours for the uniform inflow case for yaw angles of 0 and 30°. (a) Inflow at the disc location (), shown for reference. (b, c) Combined cross-sectional planes overlaid on the streamwise plane for the yaw angles of 0 and 30°, respectively. The streamwise velocity contour at the cross-stream location is also included, with quivers indicating the in-plane velocity vectors. The solid circle represents the disc span. The dotted black line depicts the wake boundary, defined as the contour where .
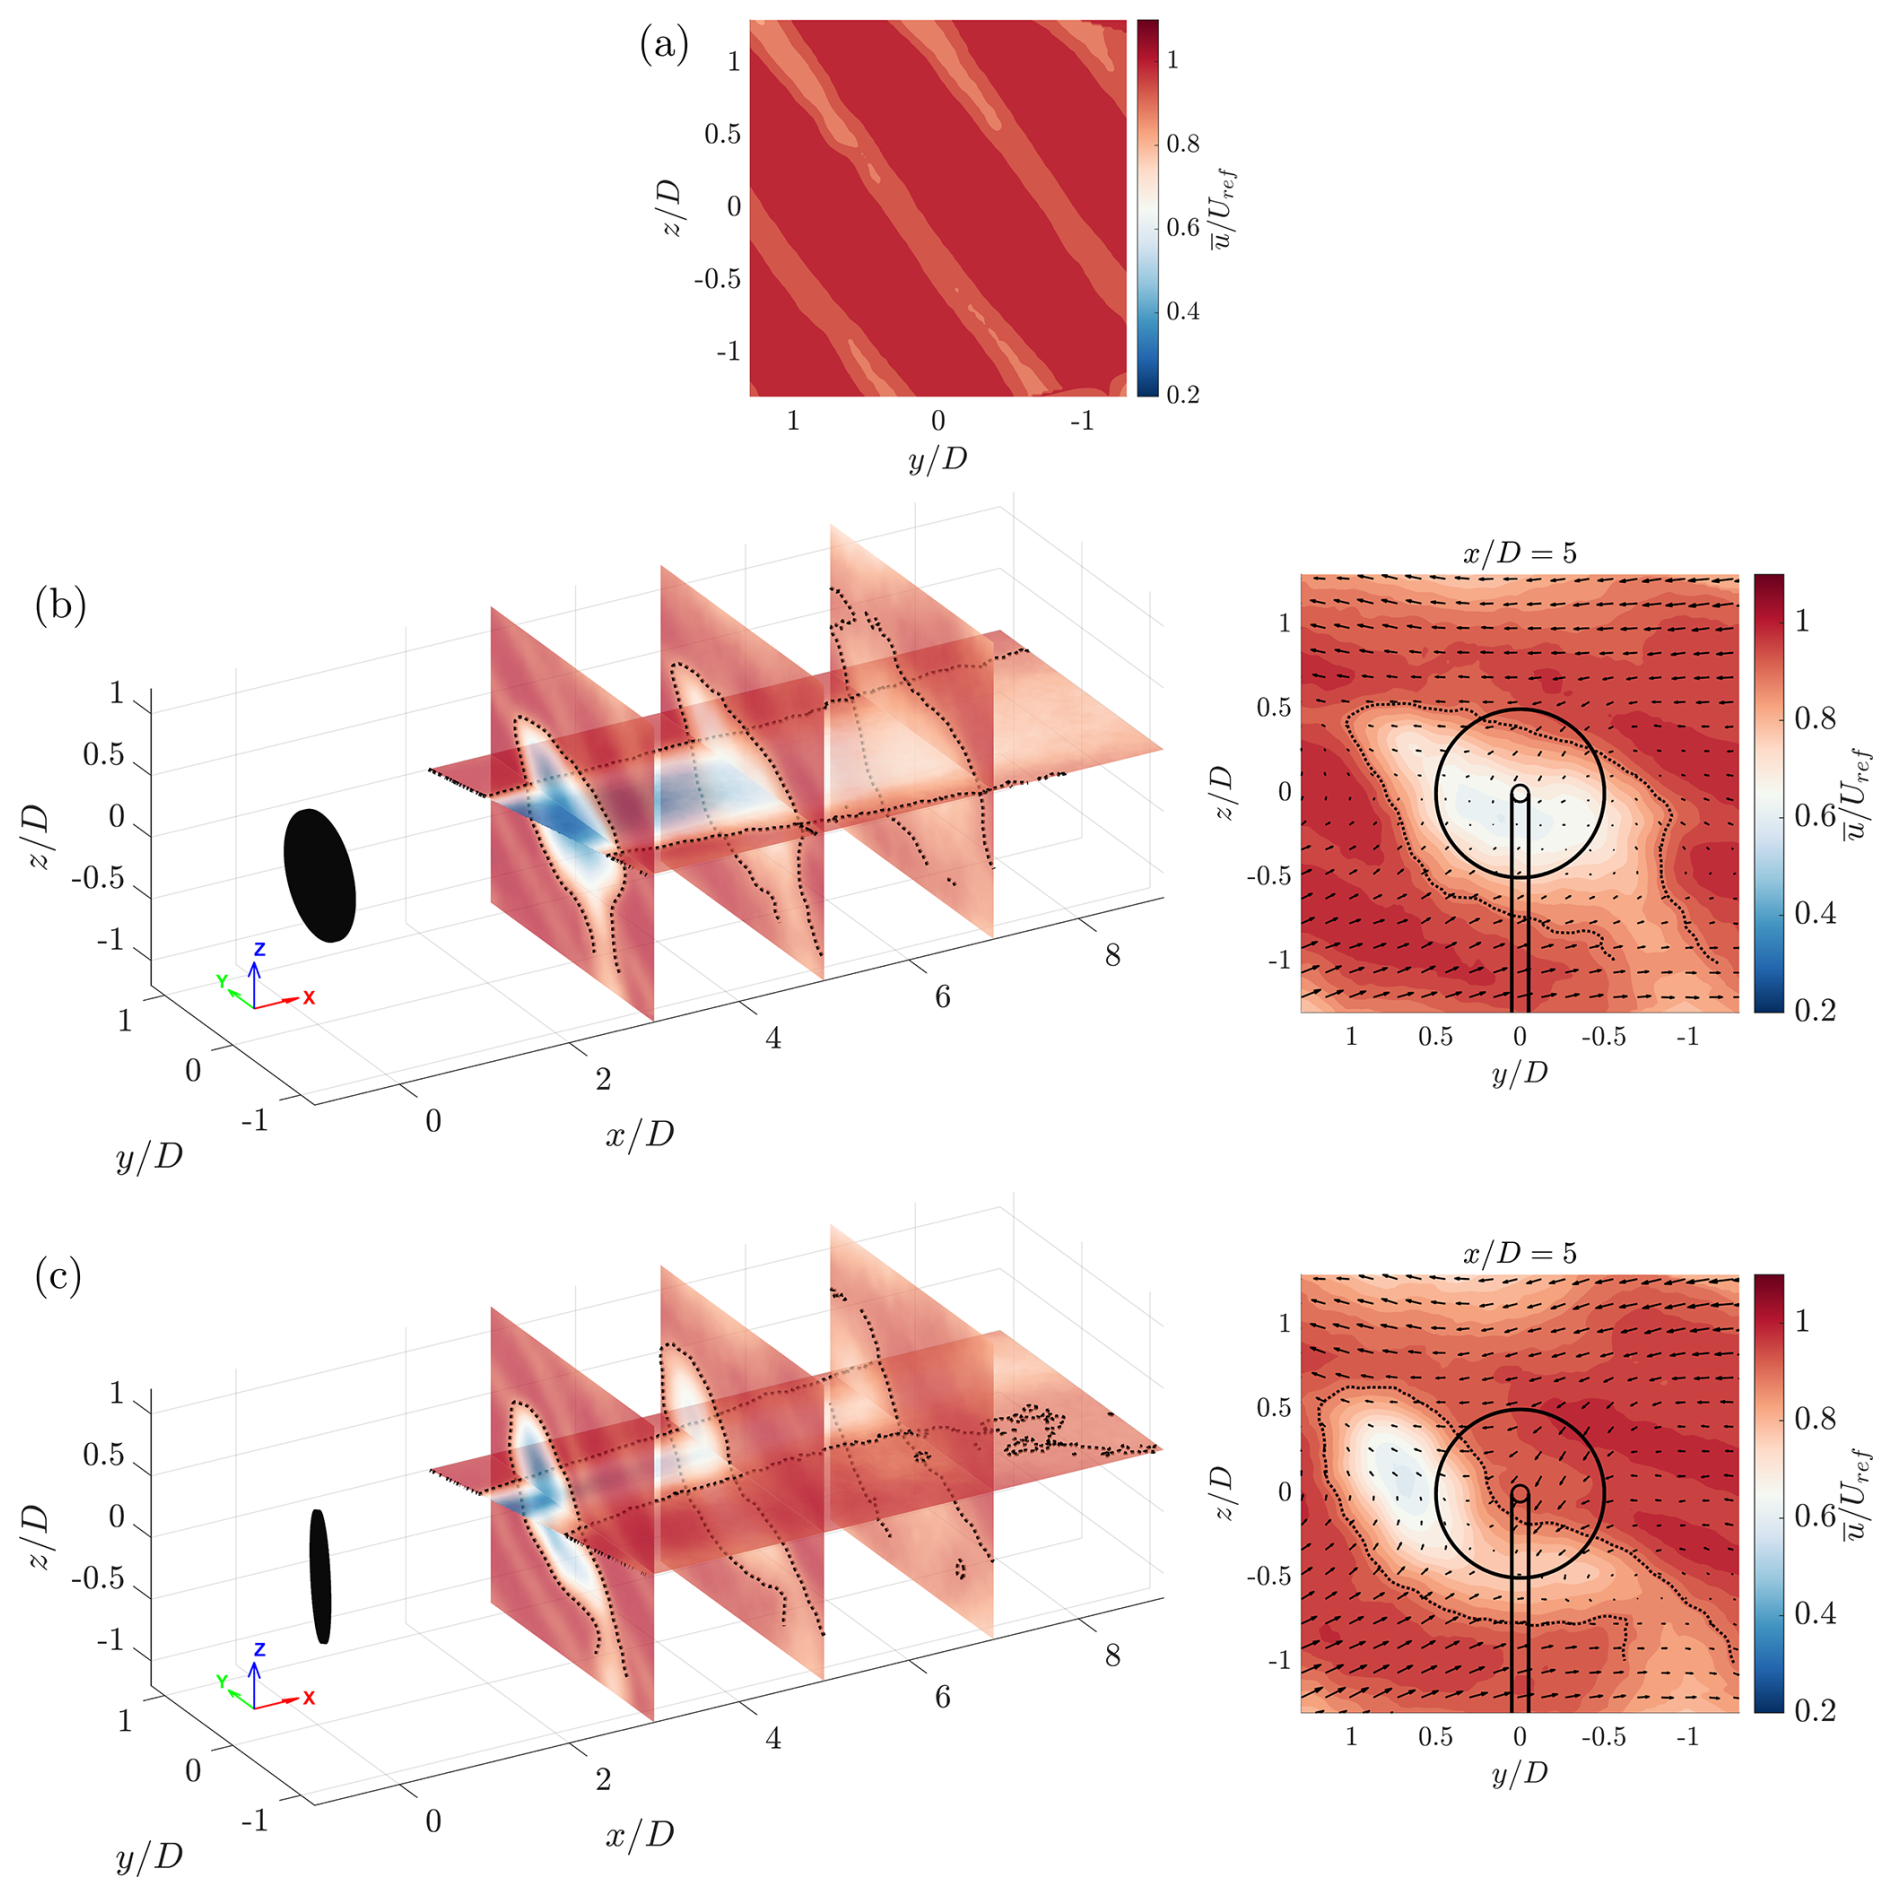
Figure 6Normalized streamwise velocity wake contours for the veered inflow case with a 10° veer. The rest of the caption is the same as Fig. 5.
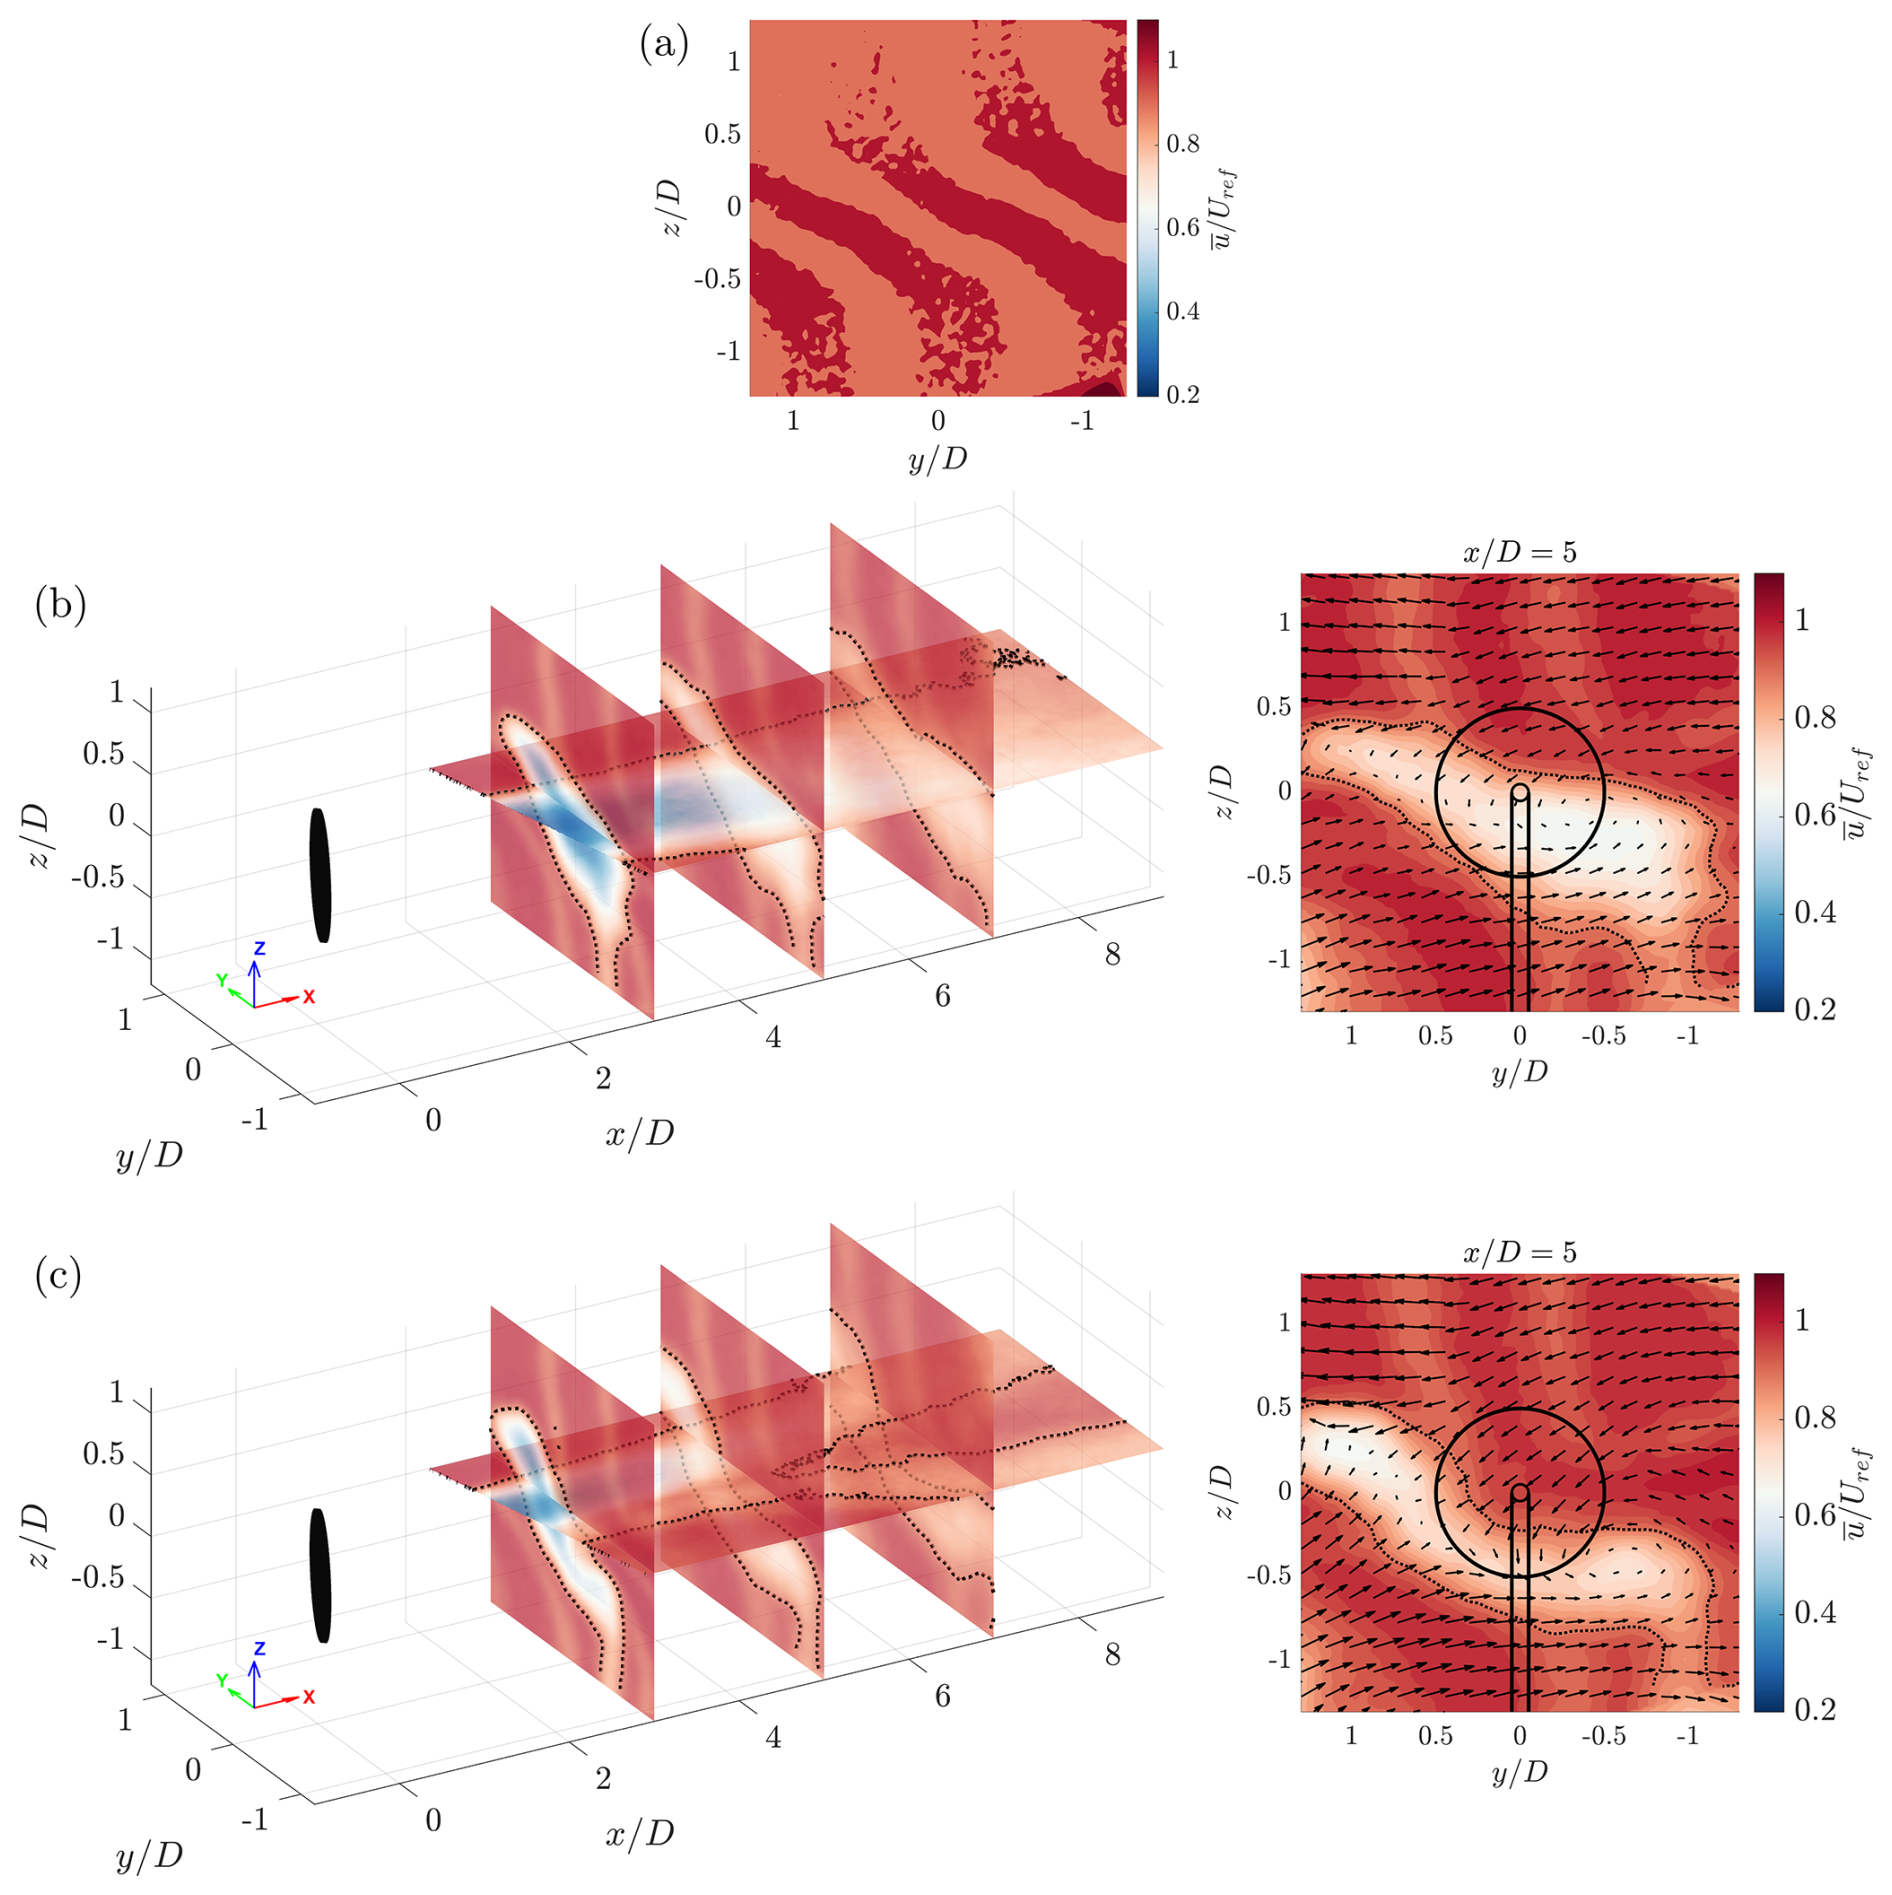
Figure 7Normalized streamwise velocity wake contours for the veered inflow case with a 20° veer. The rest of the caption is the same as Fig. 5.
For the no-veer and non-yawed disc case, the wake exhibits a nearly circular and symmetric profile in the region not influenced by the tower. Given the relatively large diameter of the tower in proportion to the disc diameter (with a disc-to-tower diameter ratio of 10), it induces a small vertical transport of momentum pointing downwards (also evident from the in-plane vectors in Fig. 5b behind the tower, where arrows point downwards), which makes the wake asymmetric and shifts the wake center downward toward the lower half of the disc (also see Fig. 8a). This was also observed in some other wind tunnel studies (Pierella and Sætran, 2017; Schottler et al., 2018). As the wake advects downstream, it expands in both lateral and vertical directions due to flow entrainment from the free-stream. Notably, across all cross-stream planes in the non-yawed case under uniform inflow (see Fig. 5b), the wake consistently exhibits a lateral displacement toward the left, as further illustrated by the wake center trajectory in Fig. 8a. This is attributed to the inhomogeneity in wind tunnel inflow, which results in a systematic lateral deflection, particularly in the central region of the tunnel (see Appendix A for flow characterization contours). Supporting evidence for this is found in flow characterization measurements conducted without the porous disc (see Fig. 4a for reference), which also reveal a small spanwise velocity component of approximately 2 % of the free-stream velocity in the disc region. Furthermore, the relatively thick tower may contribute to this shift by acting as a bluff body that sheds vortices, thereby introducing asymmetries through complex interactions between the tower and disc wakes. As this lateral shift is systematic and consistent across all cases, it does not qualitatively or quantitatively impact the comparative analysis and conclusions presented in this study.
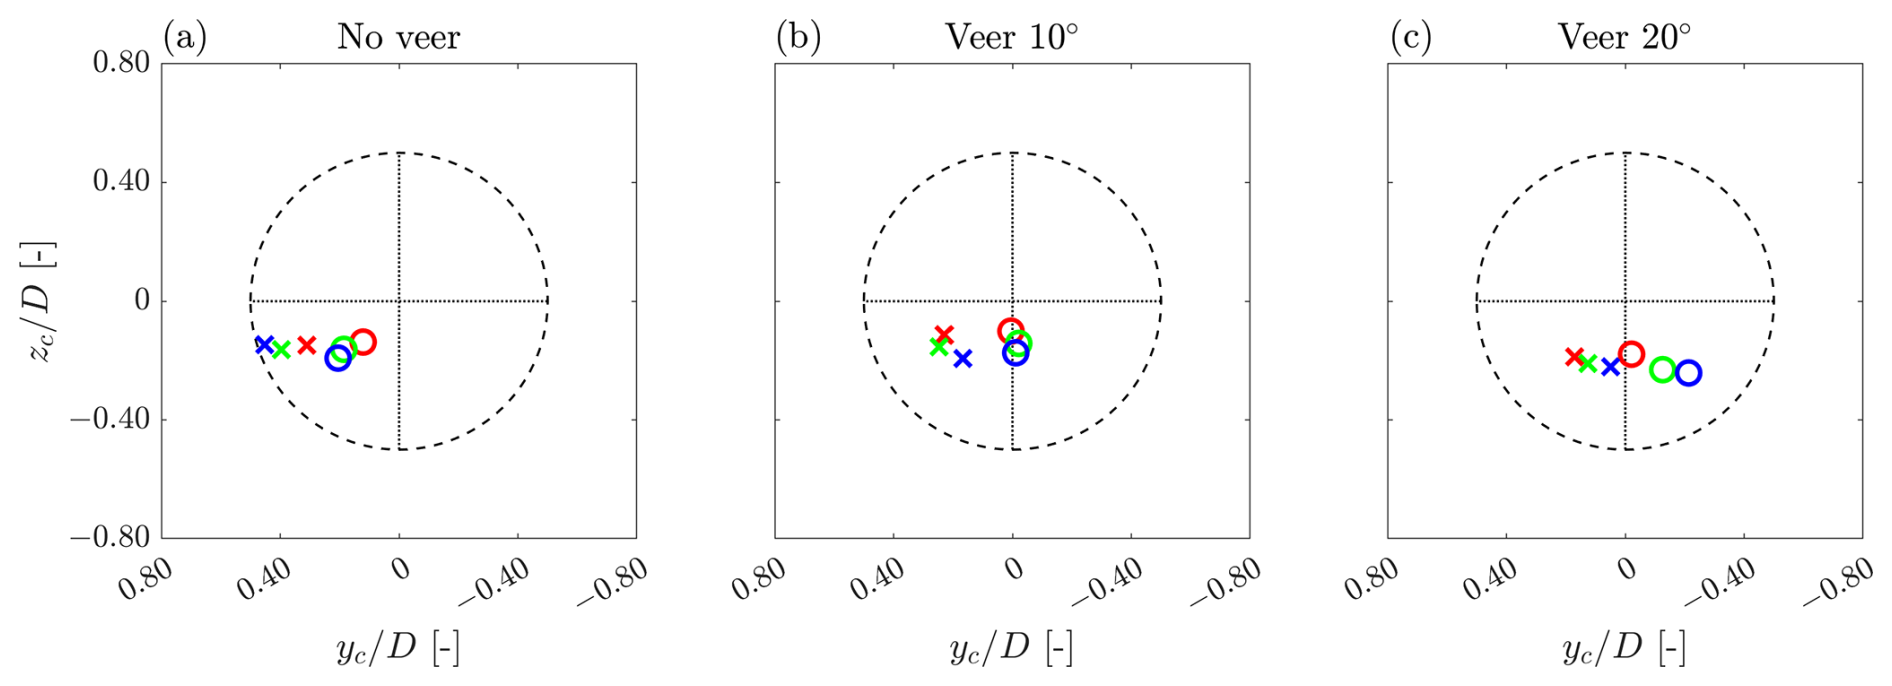
Figure 8Wake centers for three inflow cases: (a) no veer, (b) 10° veer, and (c) 20° veer, each at yaw angles of 0° (circles) and 30° (crosses). Red, green, and blue denote the streamwise location of the cross-stream plane at 3, 5, and 7, respectively. The dashed circle indicates the projection of the porous disc, and the dotted lines mark the hub height and disc axis. Coordinates are normalized by the disc diameter D.
In the yawed case under no-veer inflow (Fig. 5c), the characteristic curled (or kidney-bean-shaped) wake was observed. This shape arises from the lateral force exerted by the disc on the incoming flow, which induces a significant spanwise velocity in the wake and displaces the wake laterally in the direction opposite to the yaw angle. As a result, two counter-rotating vortices form, originating from the top and bottom edges of the disc. Consequently, the yawed configuration breaks the wake's symmetry in both the spanwise and vertical planes. These findings are consistent with previous experimental works (Howland et al., 2016; Bastankhah and Porté-Agel, 2016; Hulsman et al., 2022), where turbines or discs were immersed in uniform boundary-layer inflow. As is evident from the streamwise plane velocity contours, the wake deflects sideways and recovers faster when the turbine is yawed. This is primarily due to the reduced thrust coefficient of the porous disc under yaw, which results in a higher mean streamwise velocity in the wake (or smaller wake deficit). The wake width in the horizontal xy plane also appears thinner for the yawed disc because the mean spanwise velocity induced by yaw deflects and pushes the wake core sideways – a result that is also consistent with prior studies (see, for instance, Bastankhah and Porté-Agel, 2016, and Schulz et al., 2017). Quantitatively, Fig. 8a demonstrates that this lateral displacement increases monotonically with downstream distance. By the farthest measurement location (), the wake center deflects by approximately 0.45D in the yawed case, significantly exceeding the 0.2D deflection observed in the no-yaw case.
The wake topology in veered inflow cases is distinctly different from the uniform inflow, as seen by comparing the contours in Figs. 5 and 6. As a result of the veer in the inflow, the wake shape appears skewed in the lateral direction that extends moving along in the streamwise direction. This can be attributed to the variation in spanwise velocity with height – positive above the disc and negative below – as also illustrated by the spanwise velocity components in Fig. 4b, c. Consequently, the wake stretches in the +y direction above the disc and −y direction below it. The elliptical wake shape for the veered inflow qualitatively agrees well with the existing numerical simulation studies on stably stratified flows (Abkar and Porté-Agel, 2016; Vollmer et al., 2016; Churchfield and Sirnivas, 2018; Klemmer and Howland, 2024; Narasimhan et al., 2022, 2025). When the disc is yawed, the curled shape due to yaw is superimposed on the elliptical wake shape due to veer, resulting in a complex wake structure that helps direct the flow away from the disc area, thereby exposing the downwind turbine to a higher free-stream velocity. Under veered inflow conditions, the tower wake in Fig. 6b shows that the velocity deficit caused by tower blockage can be displaced by up to 1D distance to the right, due to the lower-half veer pointing in that direction. At farther downstream locations, it merges with the wind turbine wake due to turbulent mixing. As pointed out in earlier studies (Santoni et al., 2017; Abraham et al., 2019), the tower wake is important as it influences wake dynamics and interacts with surface fluxes. It should be noted that the periodic structures shed by the upstream veering vanes have a slight influence on the wake characteristics locally. A quantitative analysis confirms that their effect is secondary to the dominant forcing of the porous disc. For instance, the maximum velocity deficit due to the porous disc (Δuwake) at for the WV0Y0 case is 0.65⋅Uref, whereas the deficit due to the vane (Δuvane) at the same location in the absence of the porous disc is only 0.05⋅Uref. Since the disc-induced deficit is over an order of magnitude larger than the wake of the vanes, these periodic structures act as a passive background turbulence source rather than a driver of the mean wake shape.
As the magnitude of wind veer in the inflow increases (see Fig. 7), the wake skews even further due to higher spanwise velocity, characterized by an extended major axis and a reduced minor axis. This means that the velocity deficit is concentrated more in a narrow band along the minor axis direction. As hypothesized in Churchfield and Sirnivas (2018), this effect can accelerate wake recovery as the free-stream flow now has to travel a shorter distance to reach the wake core. A higher veer in the inflow results in wake thinning, which leaves more undisturbed free-stream wind speed for downwind turbines, potentially leading to more power available for them. An interesting observation from these results is that as the magnitude of wind veer increases, it exerts dominant control on the wake shape, reducing the relative influence of yaw, which is also consistent with the findings of Narasimhan et al. (2025). Figure 8b and c show the wake center evolution for no-yaw and yawed cases under veer 10° and 20° inflows, respectively. It is evident that as the inflow veer magnitude increases, the wake center progressively moves toward the −y direction relative to the reference uniform inflow case. It should be noted that there is a vertical bias in wake centers (i.e., ), which is attributable to the tower wake. An additional discussion on the effect of yaw and veer on spanwise and vertical velocity fields in the streamwise xy plane is presented in Appendix B.
To better quantify wake recovery under veered inflow, we adopt an integral analysis approach where we integrate the quantity of interest within the wake region defined as the boundary where . Figure 9 shows the integrated wake deficit quantity within the wake region () as a function of streamwise position, normalized by the reference velocity of the inflow (Uref) and wake area Aw. A lower value of this term indicates that the wake has recovered more. It can be observed that the wake recovery is slowest in the reference uniform inflow case (WV0Y0) and is progressively accelerated under veered inflow. Quantitatively, at , the wake deficit reduces by approximately 22 % when transitioning from the reference uniform inflow case and no yaw (WV0Y0) to the 10° veer inflow case (WV10Y0). This accelerated decay confirms that wind veer enhances wake recovery by entraining fresh momentum from the freestream into the wake, effectively re-energizing the wake core more rapidly than in the uniform inflow case. Notably, veer does not merely displace the wake laterally but actively promotes wake recovery (see Appendix C, where we compare a simple advection model with the measurements). Furthermore, increasing the yaw angle also has a positive effect in reducing wake deficit, as is evident by the dashed lines for yaw cases, which consistently lie below their solid counterparts (non-yawed cases), indicating that the combination of veer and yaw further enhances wake recovery. However, the benefit diminishes with downstream distance, as the curves of no-yaw and yaw converge.
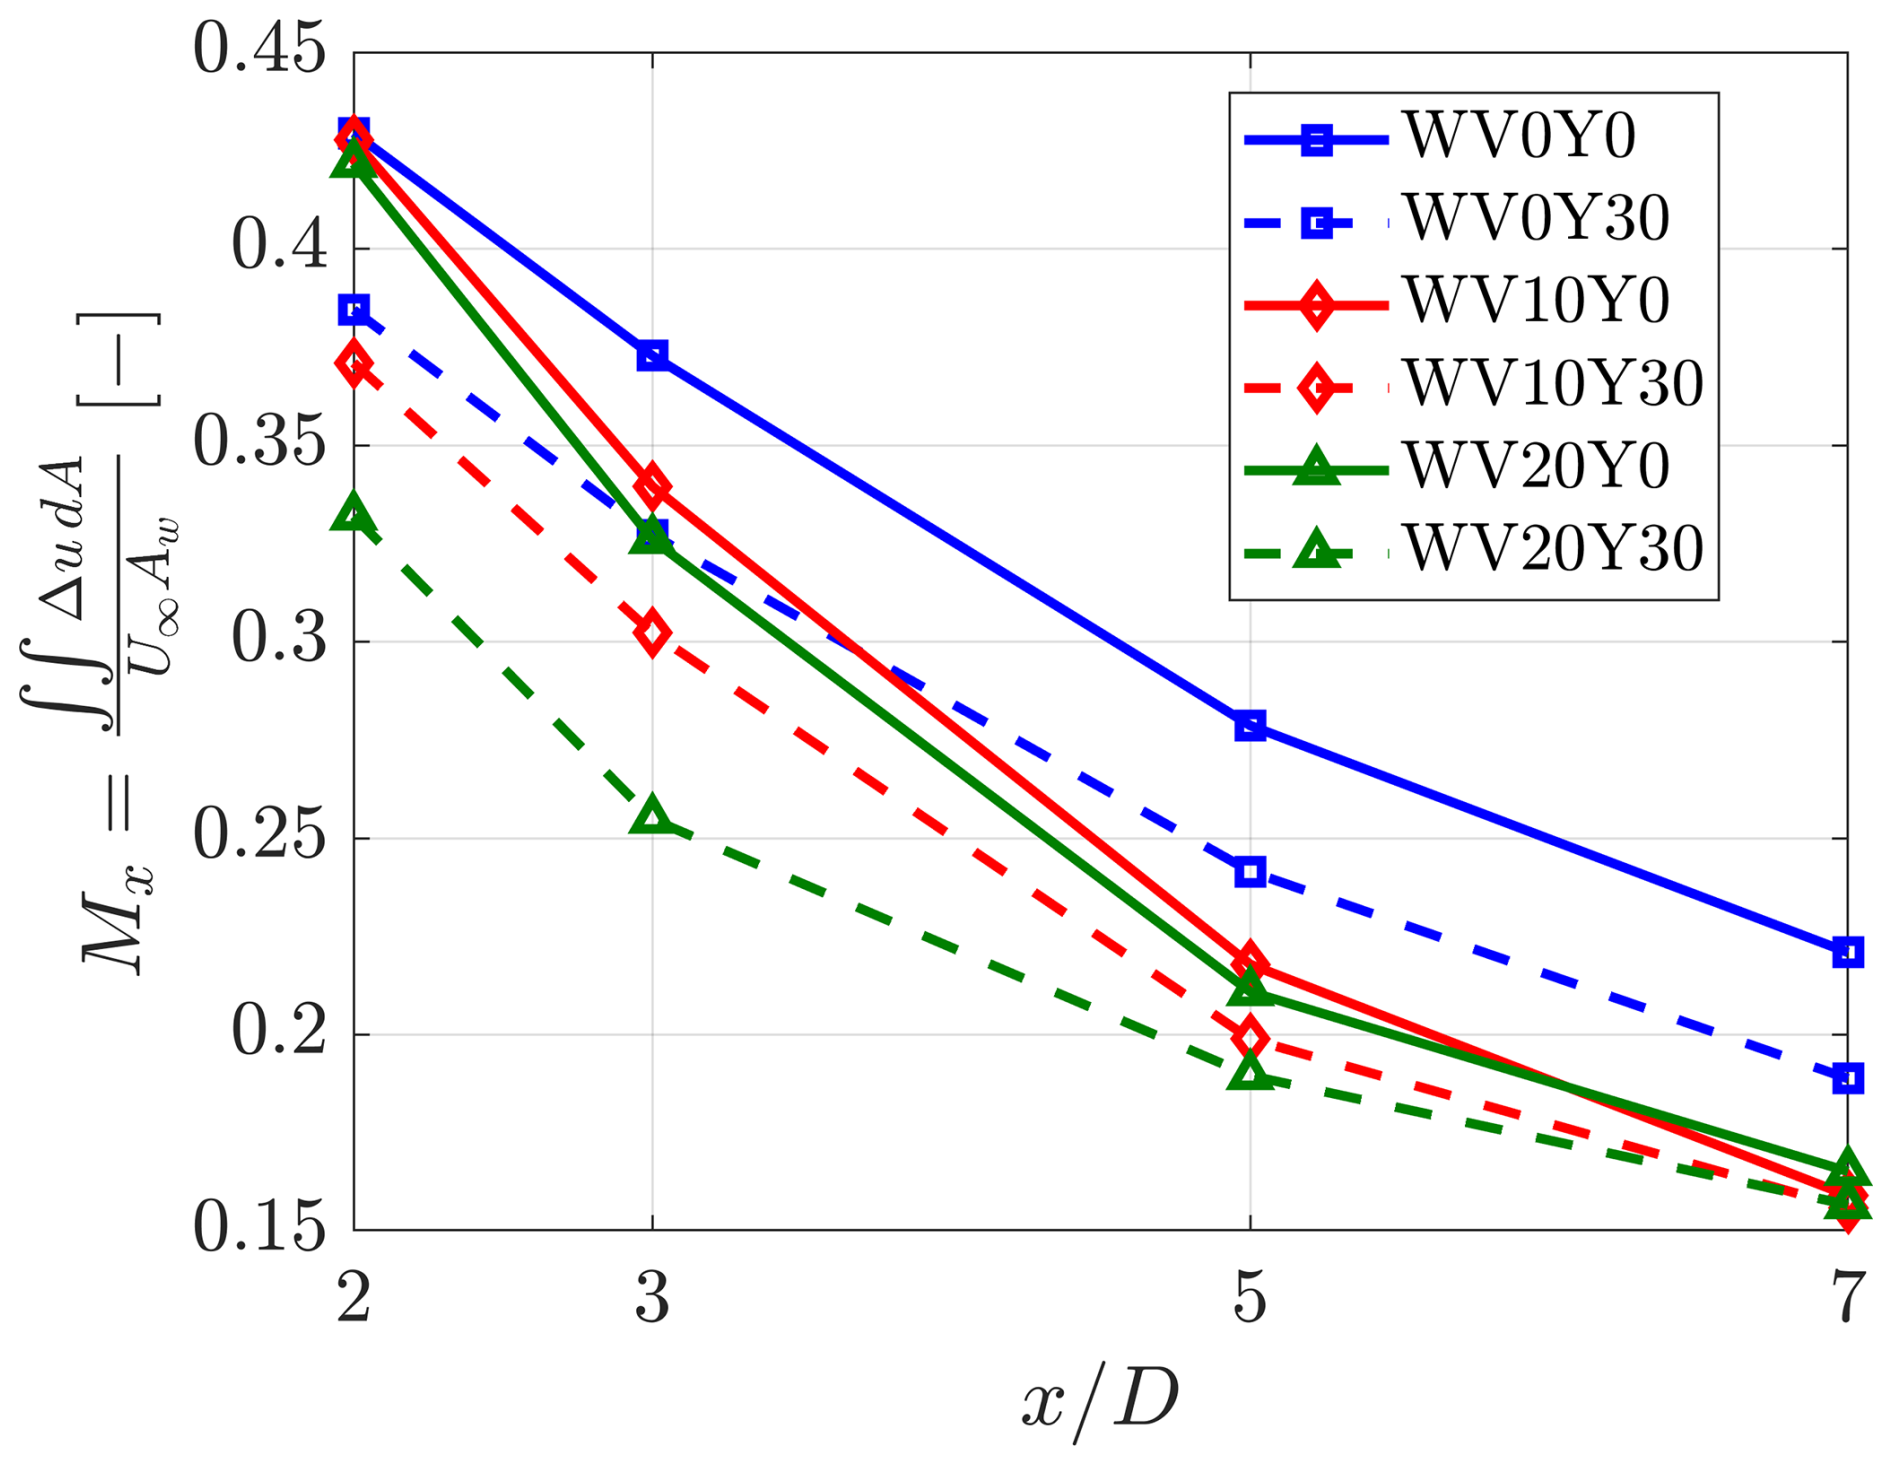
Figure 9Integral analysis of wake deficit in the wake area for all three inflow conditions and yaw angles of 0 and 30°. The legend notation is WVϕYθ, where ϕ denotes the wind veer angle (in degrees) and θ denotes the yaw angle (in degrees). For example, WV10Y30 corresponds to a 10° wind veer inflow and a 30° yaw misalignment of the disc.
For all the measured cases in this study, Fig. 10 presents the heat map of the integrated wake deficit in the wake region across various cross-sectional planes for different yaw angles and all inflow cases. In the no-veer reference case, the effect of yaw misalignment is negligible at low yaw angles (≈10°). This is expected because the thrust reduction scales as CT(γ)∝cos2(γ), yielding a 3 % reduction at γ=10°; the corresponding power penalty, governed by the cosine law , with p=2, is equally marginal (see works of Liew et al., 2020, and Heck et al., 2023). The gains of yaw misalignment become appreciable only at higher yaw angles (γ≥20°), where the peak deficit decreases notably, indicating accelerated wake recovery under yawed conditions. Under veered inflows, several interesting insights can be gathered. The presence of wind veer results in lower values of integrated wake deficit compared to the no-veer reference case at all measurement planes. At with no yaw, introducing 10° of veer reduces the deficit from 0.37 to 0.34 (∼8 %), whereas 20° of yaw with no veer only reduces it to 0.35. Therefore, veer is a stronger driver of wake recovery than yaw alone. When yaw is coupled with veer, the recovery is enhanced further. At 0° veer, increasing the yaw angle from 0 to 30° reduces the deficit by 11 % at . At the same location, on the other hand, a veer of 20° results in a reduction of around 24 %. This is because wake stretching due to veer and yaw-induced lateral deflection exposes more of the wake boundary to the freestream, which increases the entrainment. Comparing increasing yaw angles for the veer inflow of 10 and 20° at , there appears to be a synergistic interaction between yaw and veer: the benefits of veer are amplified when combined with yaw. At far downstream distances, yaw provides essentially no additional benefits under veered inflows, as evidenced by the same value of integrated wake deficit at for the veer 10° case; the range is only 0.16−0.17 for the veer 20° case. This implies that the wake has already recovered to a level where yaw only adds marginal benefits. This highlights a key finding: if wind veer is high in the atmosphere under stable conditions, as is typically the case and also reported in multiple field experiments (for instance, see Walter et al. (2009) and Debnath et al. (2023)), yawing the upstream wind turbine may not be advantageous for wake steering purposes. Since wake recovery is already enhanced by wind veer, there appears to be limited value in applying yaw control solely for the purpose of maximizing downstream wind turbine power production. This will be further discussed in Sect. 3.5.
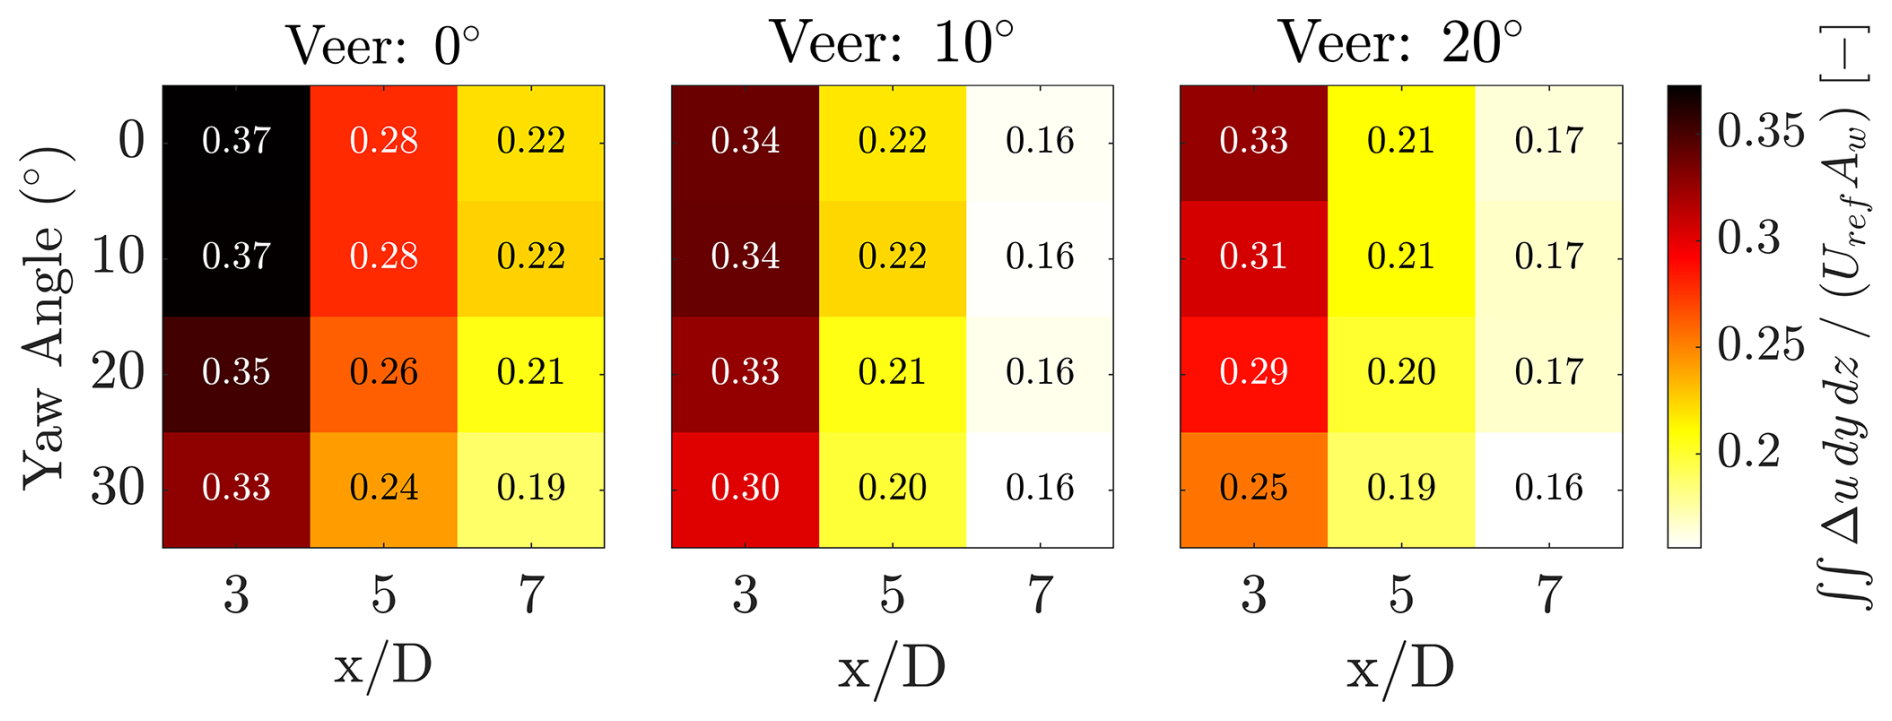
Figure 10Integrated velocity deficit heat map under yaw angles of 0, 10, 20, and 30° under all three inflow conditions at different downstream cross-sectional planes of , 5, and 7.
3.2 Vorticity fields
The measured time-averaged streamwise vorticity contours for the three inflow cases at cross-stream location for the yaw angle of 30° are shown in Fig. 11a. For the reference uniform inflow case, the curled wake shape observed in velocity contours in Fig. 5c is directly attributable to the formation of a counter-rotating vortex pair (CVP) that results in spanwise induction of flow and is responsible for the lateral displacement of the wake. A slight asymmetry in the vorticity distribution of top and bottom vortices for this case can be attributed to the relatively thicker tower that sheds its own vortex, which is not negligible. This tower-induced vortex merges with the bottom vortex of the disc as the wake propagates downstream.
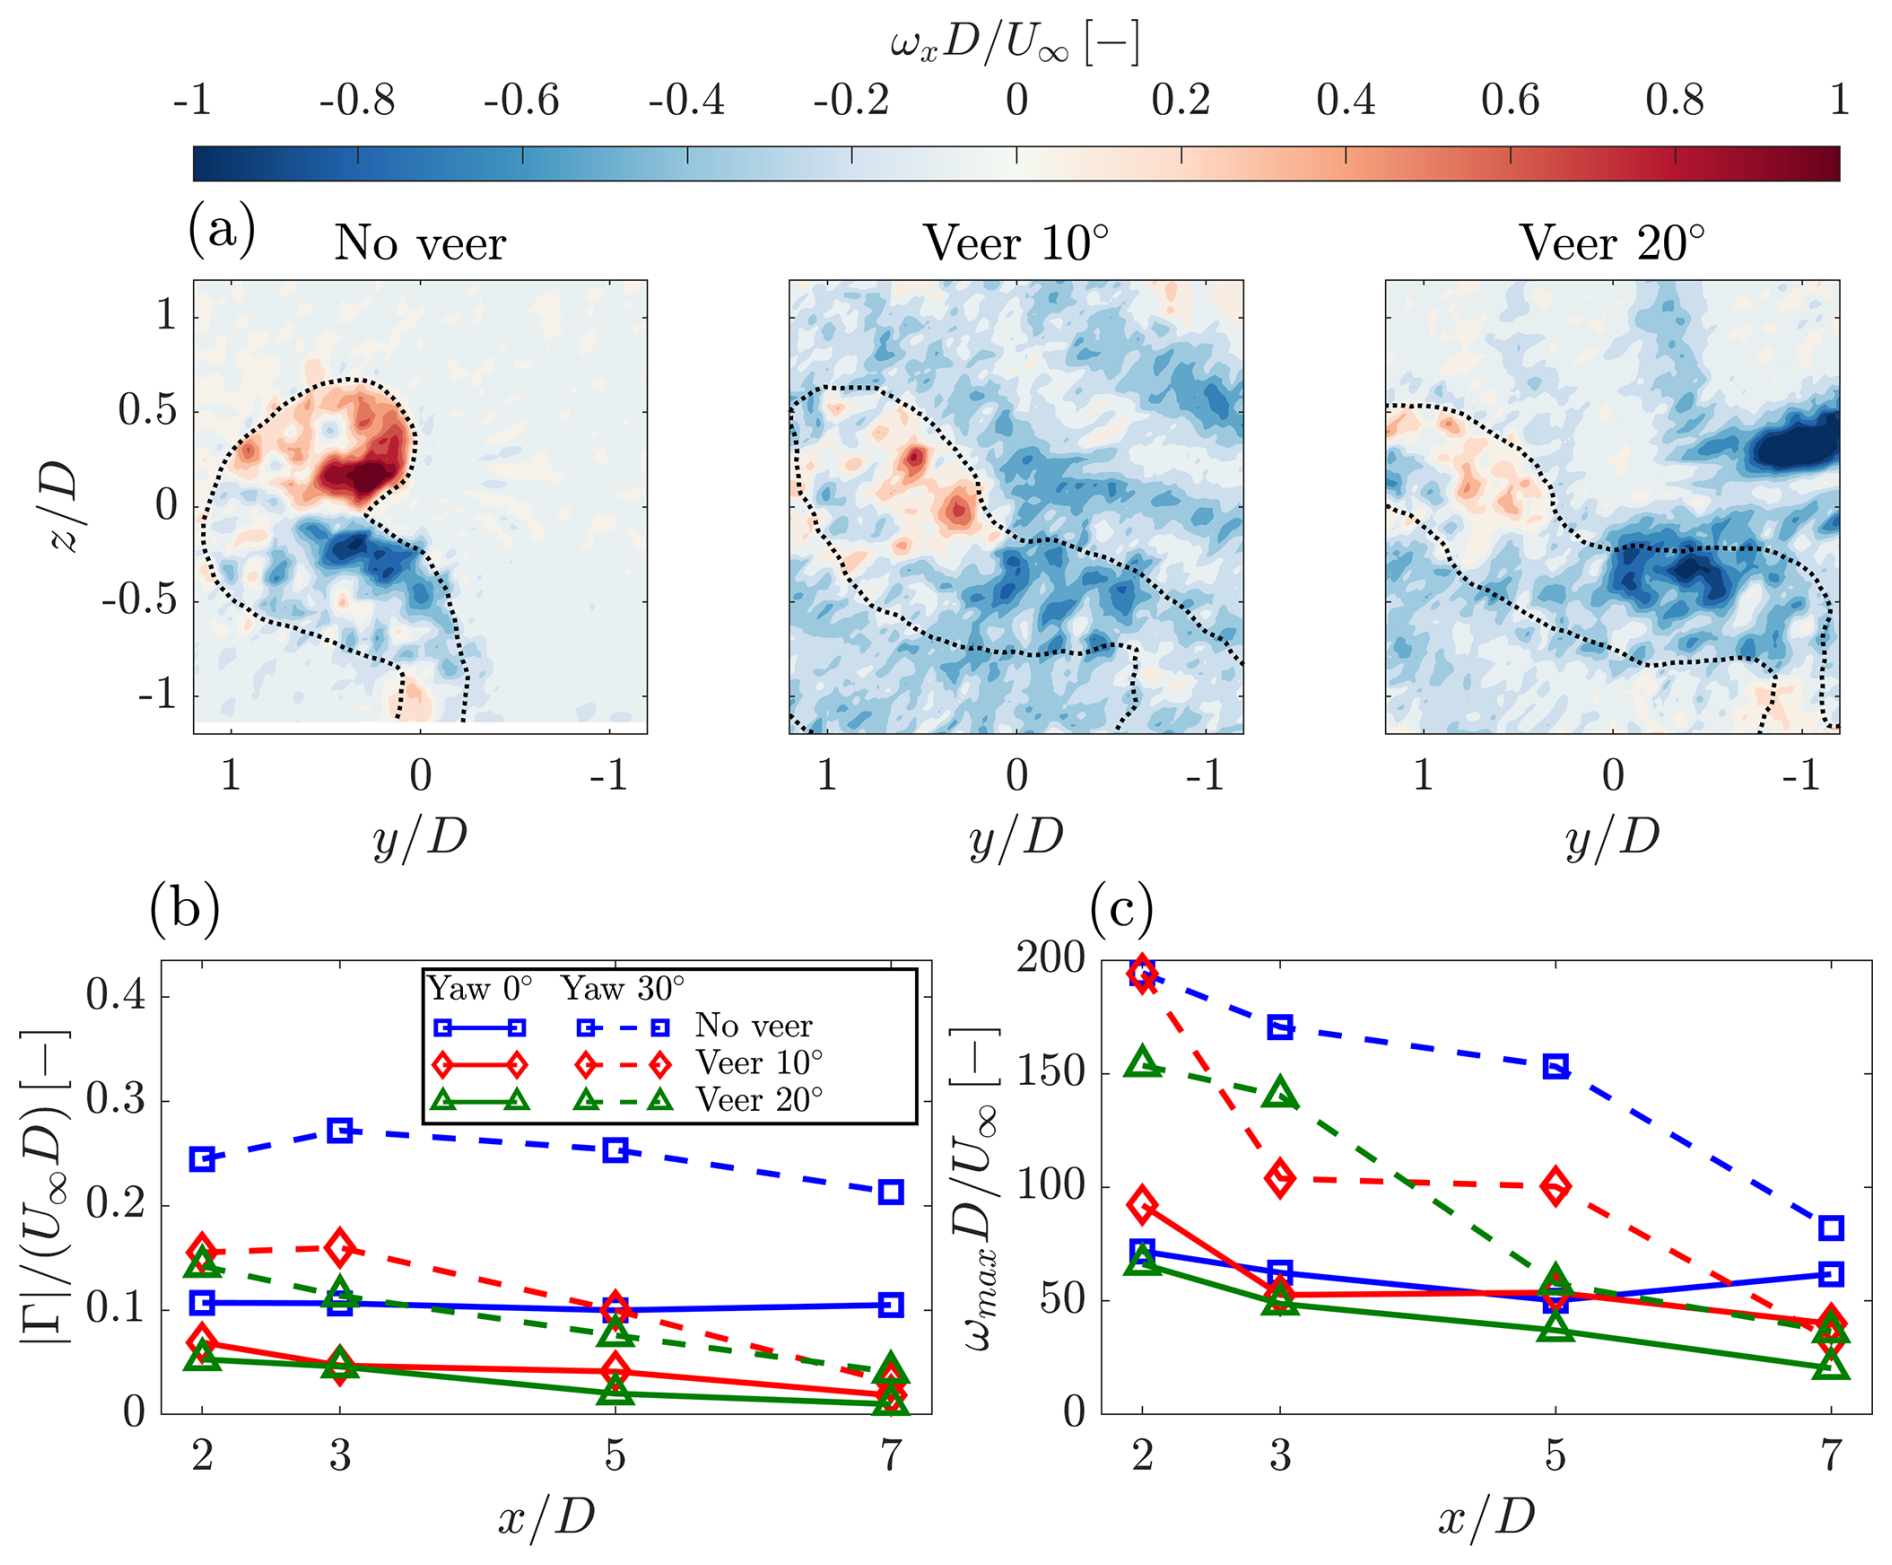
Figure 11(a) Time-averaged streamwise vorticity contours for three different inflows for 30° yawed disc at ; (b) Streamwise evolution of the normalized circulation and (c) of the maximum streamwise vorticity , both evaluated for the upper vortex (rotating CCW) for the three inflows and yaw angles of 0° (solid lines) and 30° (dashed lines).
In contrast, veered inflow leads to increased stretching and distortion of streamwise vorticity contours, with the effect intensifying under stronger wind veer. It can also be noticed from Fig. 11a that the vorticity strength in veered inflow is significantly affected by background veer vorticity: the strength of the top vortex decreases compared to the corresponding top vortex in the uniform inflow case with no-veer. These observations are consistent with the numerical results of Narasimhan et al. (2022) and further supported by the variations in maximum streamwise vorticity and the circulation of the top vortex as shown in Fig. 11c and b. Circulation in the top vortex was computed by spatially integrating the positive vorticity field over that region () following the approach highlighted in Xu et al. (2025). In general, with increasing downstream distance, the peak vorticity strength for the yawed cases under veered inflow is lower than that observed under uniform inflow. This can be explained as follows: because the inflow already contains nonzero streamwise vorticity with opposite orientation to the upper vortex, the background veer reduces its strength. Consequently, higher veer cases accelerate the decay of circulation in the CVP (Fig. 11b), with lower values than the yaw case under uniform inflow. As expected, due to the symmetric pressure distribution, circulation remains relatively constant downstream for the non-yawed disc under uniform inflow.
Conversely, lateral shear induced by veer in the inflow results in a non-symmetric pressure distribution around the disc, leading to a decrease in circulation with downstream distance. Interestingly, when the disc is yawed in the reference uniform inflow case, circulation slightly increases from to , before continuing its downward descent, as also seen in Shapiro et al. (2020). In contrast, the circulation for the veer inflow of 10° and yawed disc is nearly constant from to 3, before decaying further downstream, whereas the circulation in the veer inflow of 20° decreases monotonically. This again highlights the dominant role of background veer in reducing circulation strength, which increasingly overshadows yaw effects as veer magnitude grows.
Additionally, the vertical vorticity contours shown in Fig. 12 indicate that veered inflow accelerates vortex sheet breakdown compared to the no-veer case. This is evident from the golden contour lines marking regions where . For the no-veer case, the peak vorticity persists beyond a downstream distance of 6D, whereas in the veered inflow it disappears within 5D. This faster decay is attributed to stronger lateral (cross-flow) velocity components in the wake introduced by veer. The decay of vorticity is slightly faster when yaw is superimposed on veer, which results in additional spanwise velocity in the wake. For the yawed disc immersed in the wind veer of 20°, the counterclockwise (CCW) vortex bifurcates into two, visually consistent with the wake topology discussed in Sect. 3.1. Overall, these results suggest that increasing veer intensity leads to faster CVP decay and enhances turbulent mixing in the wake, thereby promoting faster wake recovery.
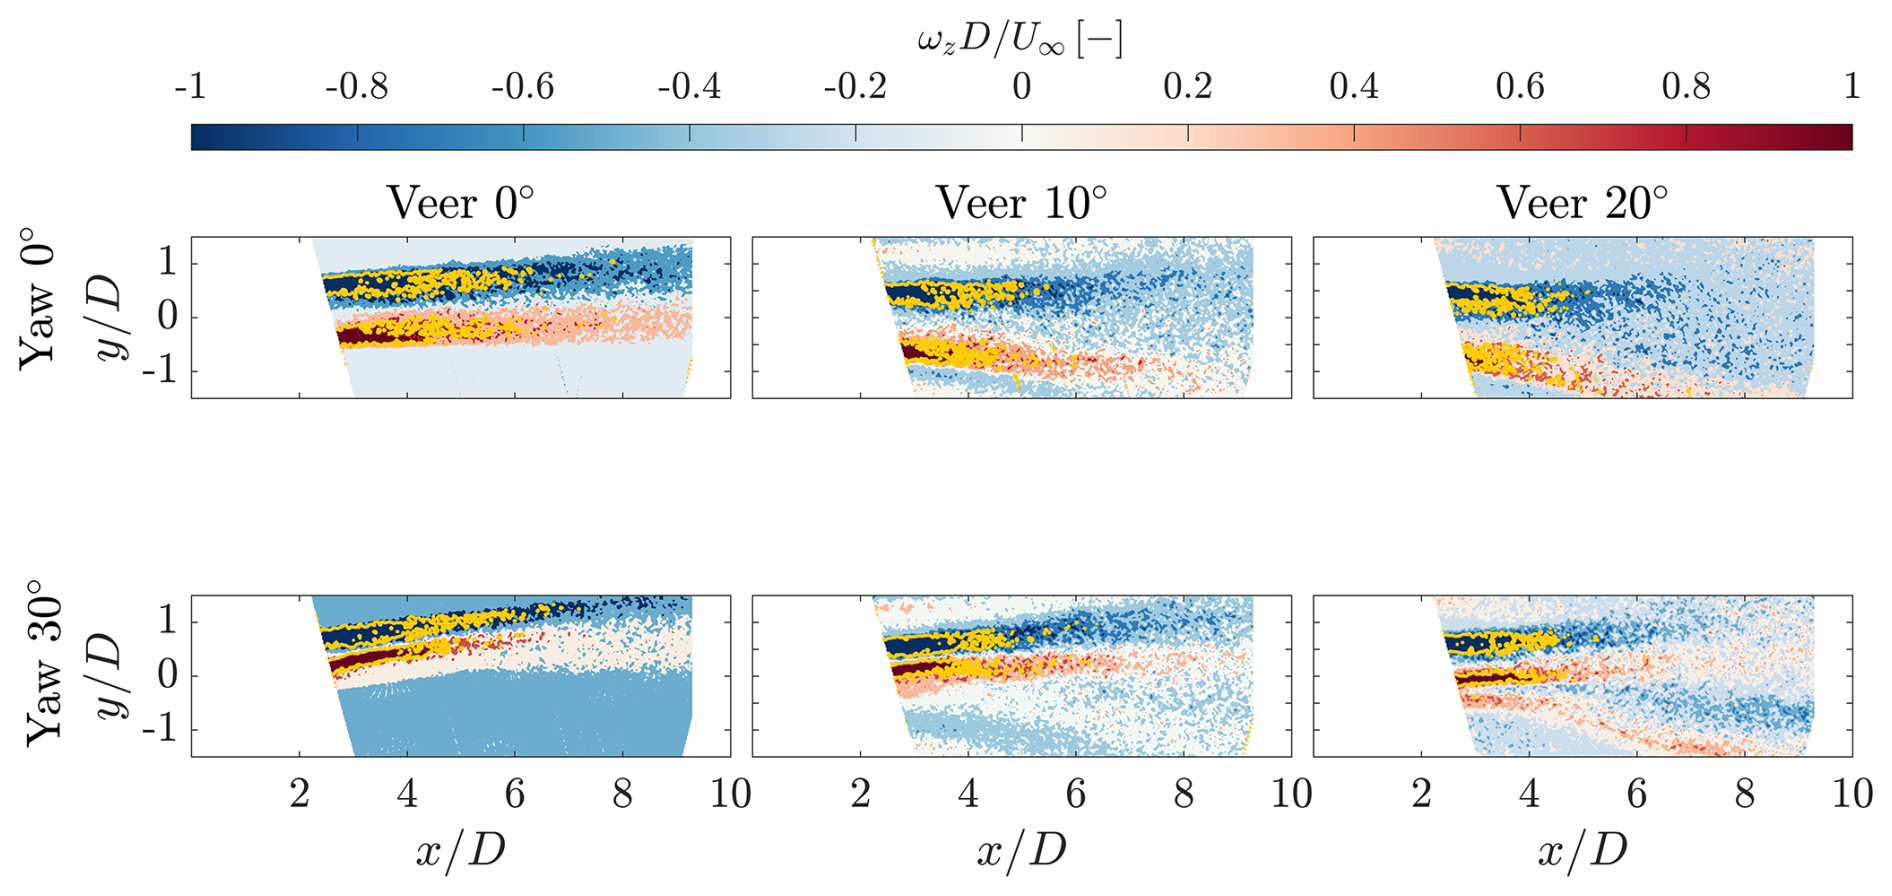
Figure 12Time-averaged vertical vorticity (ωz) contours on the horizontal plane. Figures on the top are for the non-yawed disc, whereas figures on the bottom are for the yawed disc of 30°. The golden lines on the contour represent regions where .
3.3 Momentum budget analysis
In this section, dominant mechanisms driving wind turbine wake recovery as a result of yaw and veered inflow conditions are analyzed via the momentum budget analysis of the Reynolds-averaged Navier–Stokes (RANS) equation in the streamwise direction. This analysis helps to explain how momentum is redistributed in the wake. The time-averaged RANS equation in the streamwise direction can be written as
In the above equation, , , and denote the mean streamwise, spanwise, and vertical velocity components, respectively. The overbar indicates the time-averaged values of these components, while the primes represent instantaneous velocity fluctuations. Term I in Eq. (7) denotes cross-stream advection that represents the transport of streamwise momentum by the mean spanwise velocity (). Term II represents the transport of streamwise momentum in the vertical direction by the mean vertical velocity (). Lastly, terms III and IV are the divergence of the cross-stream Reynolds stress () and the vertical Reynolds stress (), which represent turbulent mixing of momentum laterally and vertically, respectively. It should be noted that the variation in streamwise Reynolds stress gradient on the RHS is not computed because of the relatively large spacing between the spanwise planes. Similarly, the pressure gradient term is also neglected as it is not measured in the experiments. Viscous terms are also neglected due to the high Reynolds number of the flow. Figure 13 represents the contributions of the remaining terms in Eq. (7) at for six different cases. The wake edge is represented by a dotted line. The positive (red) region indicates favorable contributions to wake recovery, and vice versa.
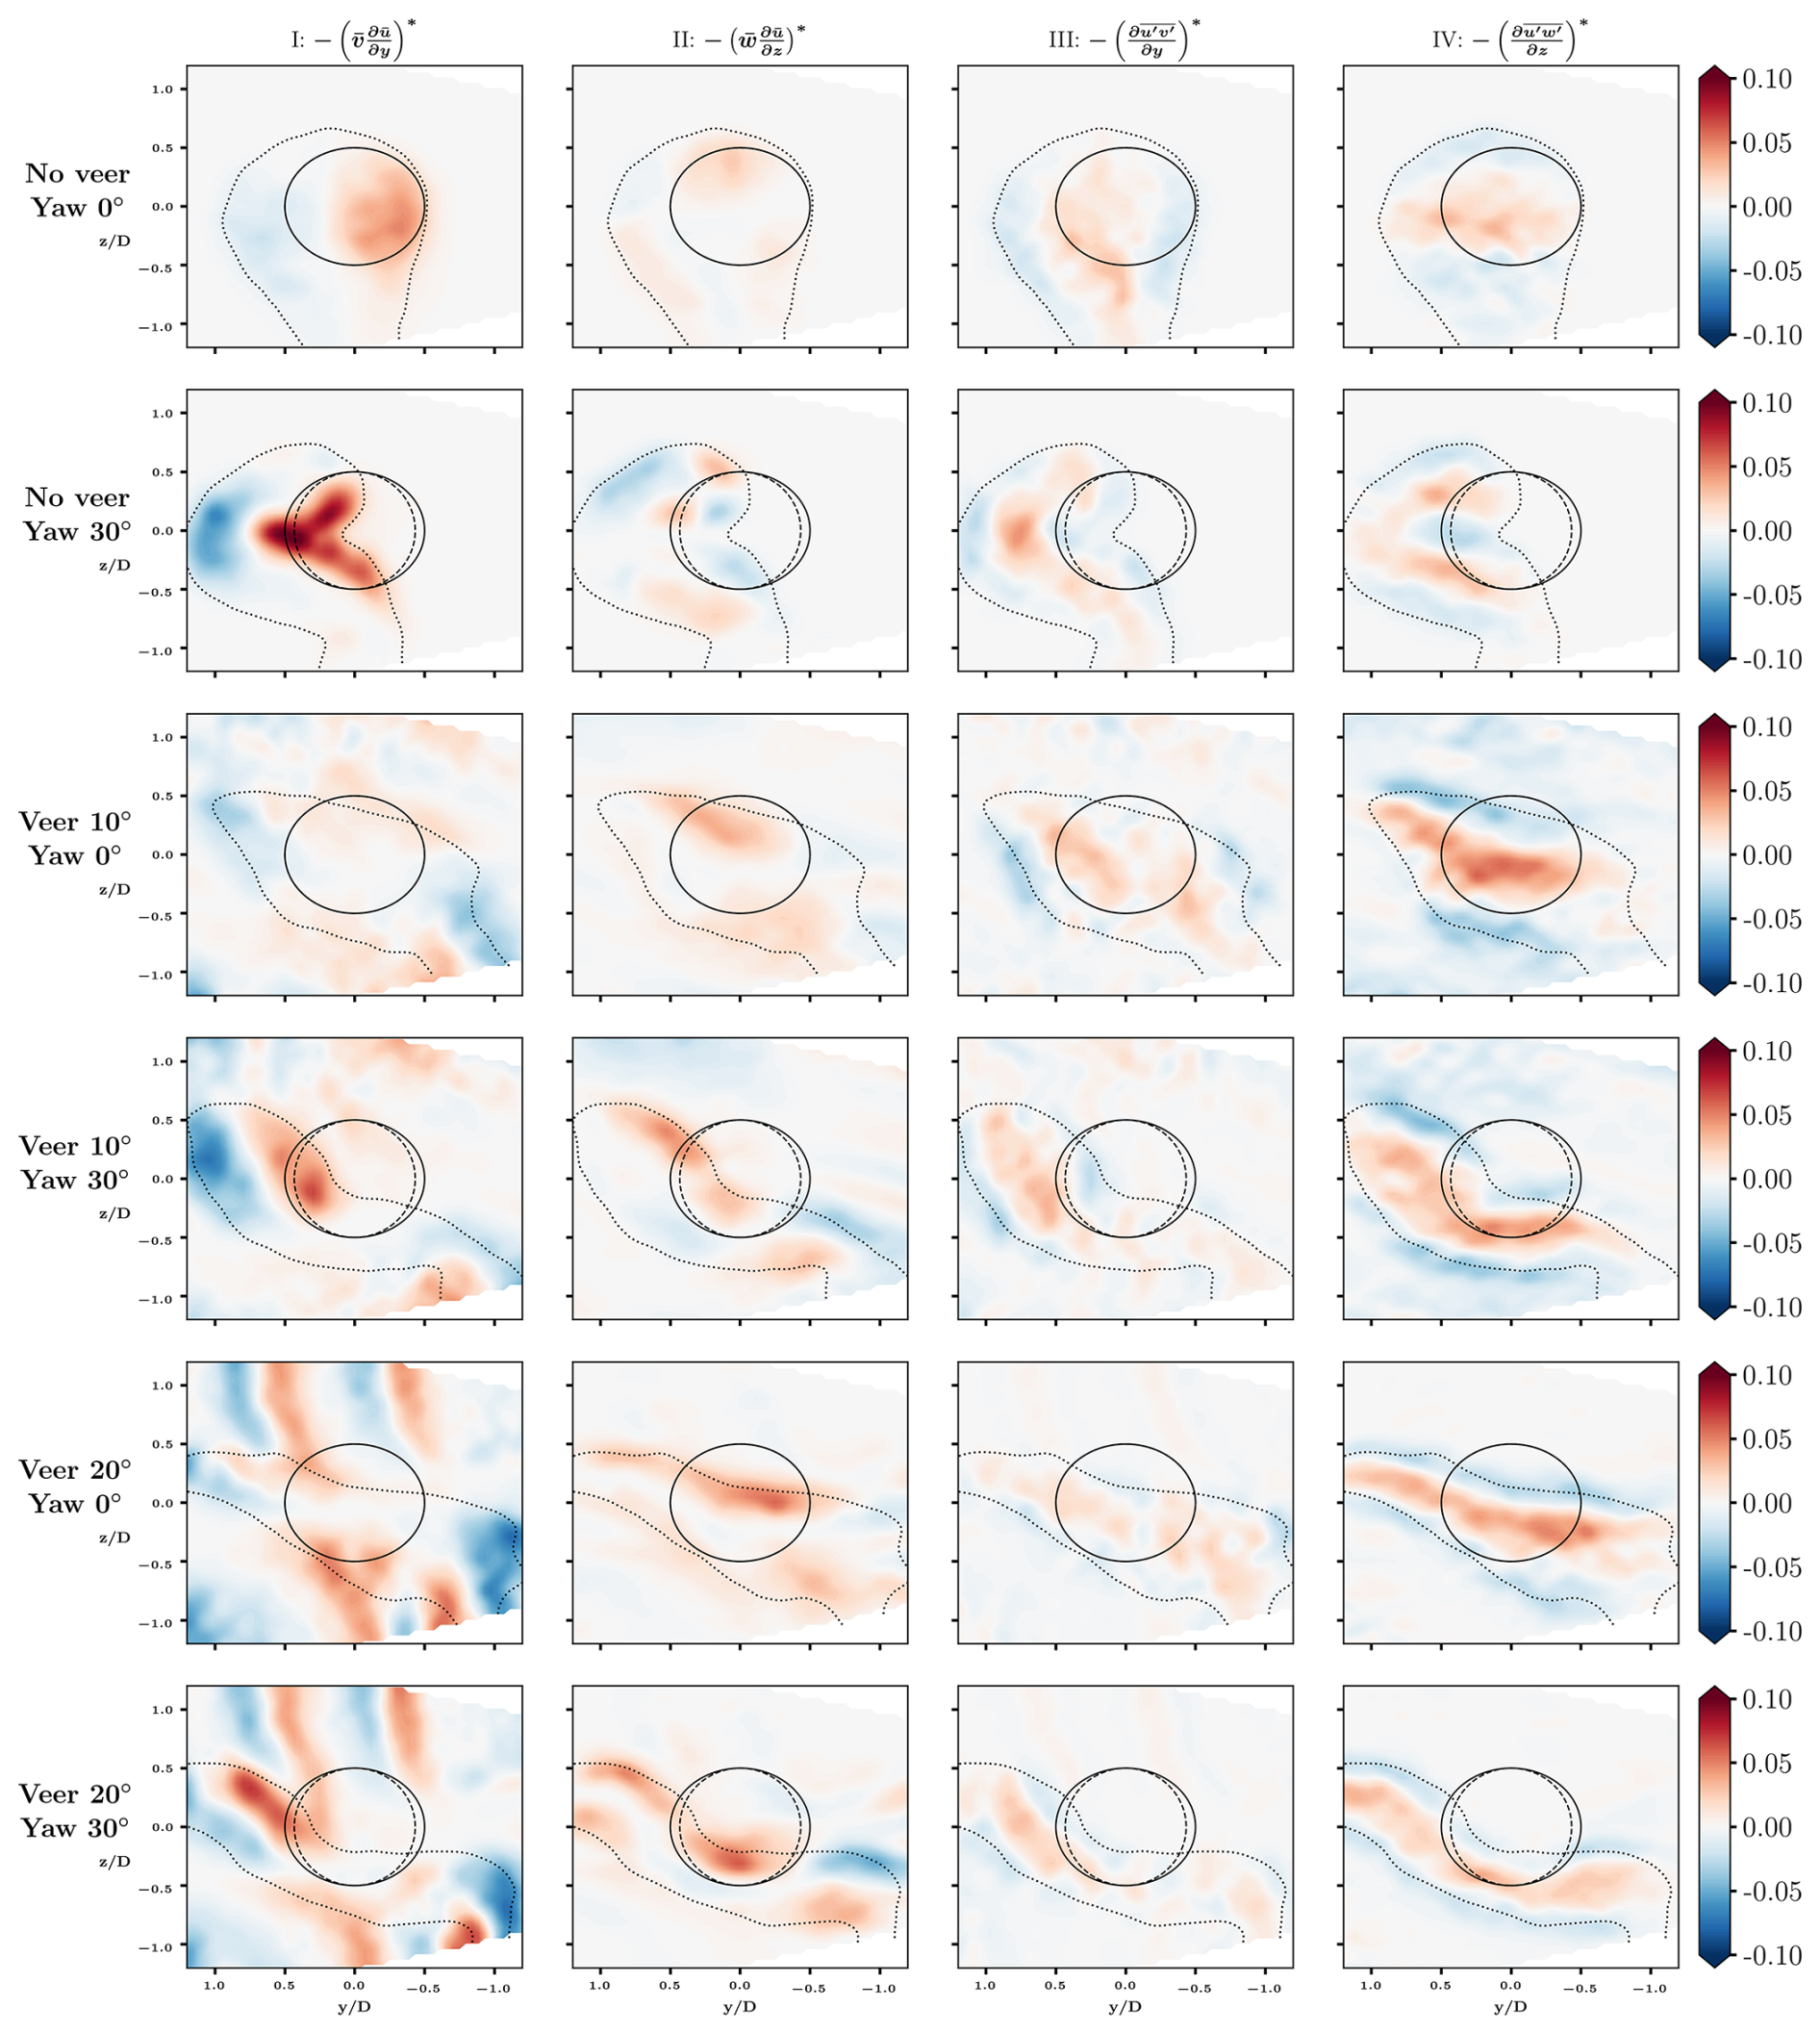
Figure 13Measured terms of Eq. (7) at . The disc projection is represented by a solid circle, whereas the projection of the yawed disc is shown as a dashed line. The wake contour is shown as a dotted line where . The asterisk indicates that each term is normalized by the factor .
The contours in the first vertical column in Fig. 13 show the mean lateral advection of streamwise momentum. It can be seen that for the no-veer inflow, the positive values are concentrated along the right edge of the wake, and vice versa. For the yawed disc in the no-veer case, due to significant spanwise velocity induction into the wake, the positive values are much higher than in the non-yawed cases. Interestingly, it can be seen visually that the positive values for the yawed disc are slightly lower for the veered cases compared to the uniform inflow case. This could be attributed to the spanwise component of background veer counteracting the spanwise flow induced by yaw. In the no-veer case, the low-momentum wake is ejected out laterally from the center to the left side of the wake edges (blue region). In contrast, for the veered cases, this ejection takes place from both the left and right edges of the wake due to the varying spanwise velocity with height, whose sign also changes. Moreover, comparing the relative contributions of all terms in the second row of Fig. 13, it is obvious that the advective terms play a key role in redistributing momentum for the yawed case compared to the divergence of shear stress terms.
The contours in the second column show the mean vertical advection of streamwise momentum. The contribution of term II to wake recovery is small for the uniform inflow case relative to the veered inflow case. In the latter, a large red region is present along the upper edges of the wake. This can be attributed to the fact that, due to the skewed wake shape, the gradients in the shear layer are sharper, making the injection of free-stream flow into the wake easier.
The contours in the third column show the Reynolds stress term distribution in the lateral direction. A visual comparison of contours of term III for all cases reveals that its contribution remains similar across all cases.
Lastly, the contours in the fourth column show the Reynolds stress term distribution in the vertical direction. It can be seen visually that, compared to the reference uniform inflow case, the contribution of the streamwise-vertical Reynolds stress term to the overall budget is higher in the veered case compared to the uniform inflow case, where both its magnitude and area are relatively small. The positive and negative values are concentrated in the wake core and wake edges, respectively, which means more momentum is entrained from the top and bottom in the veered inflow scenario. This can be attributed to the fact that velocity gradients are sharper due to the elliptical shape of the wake.
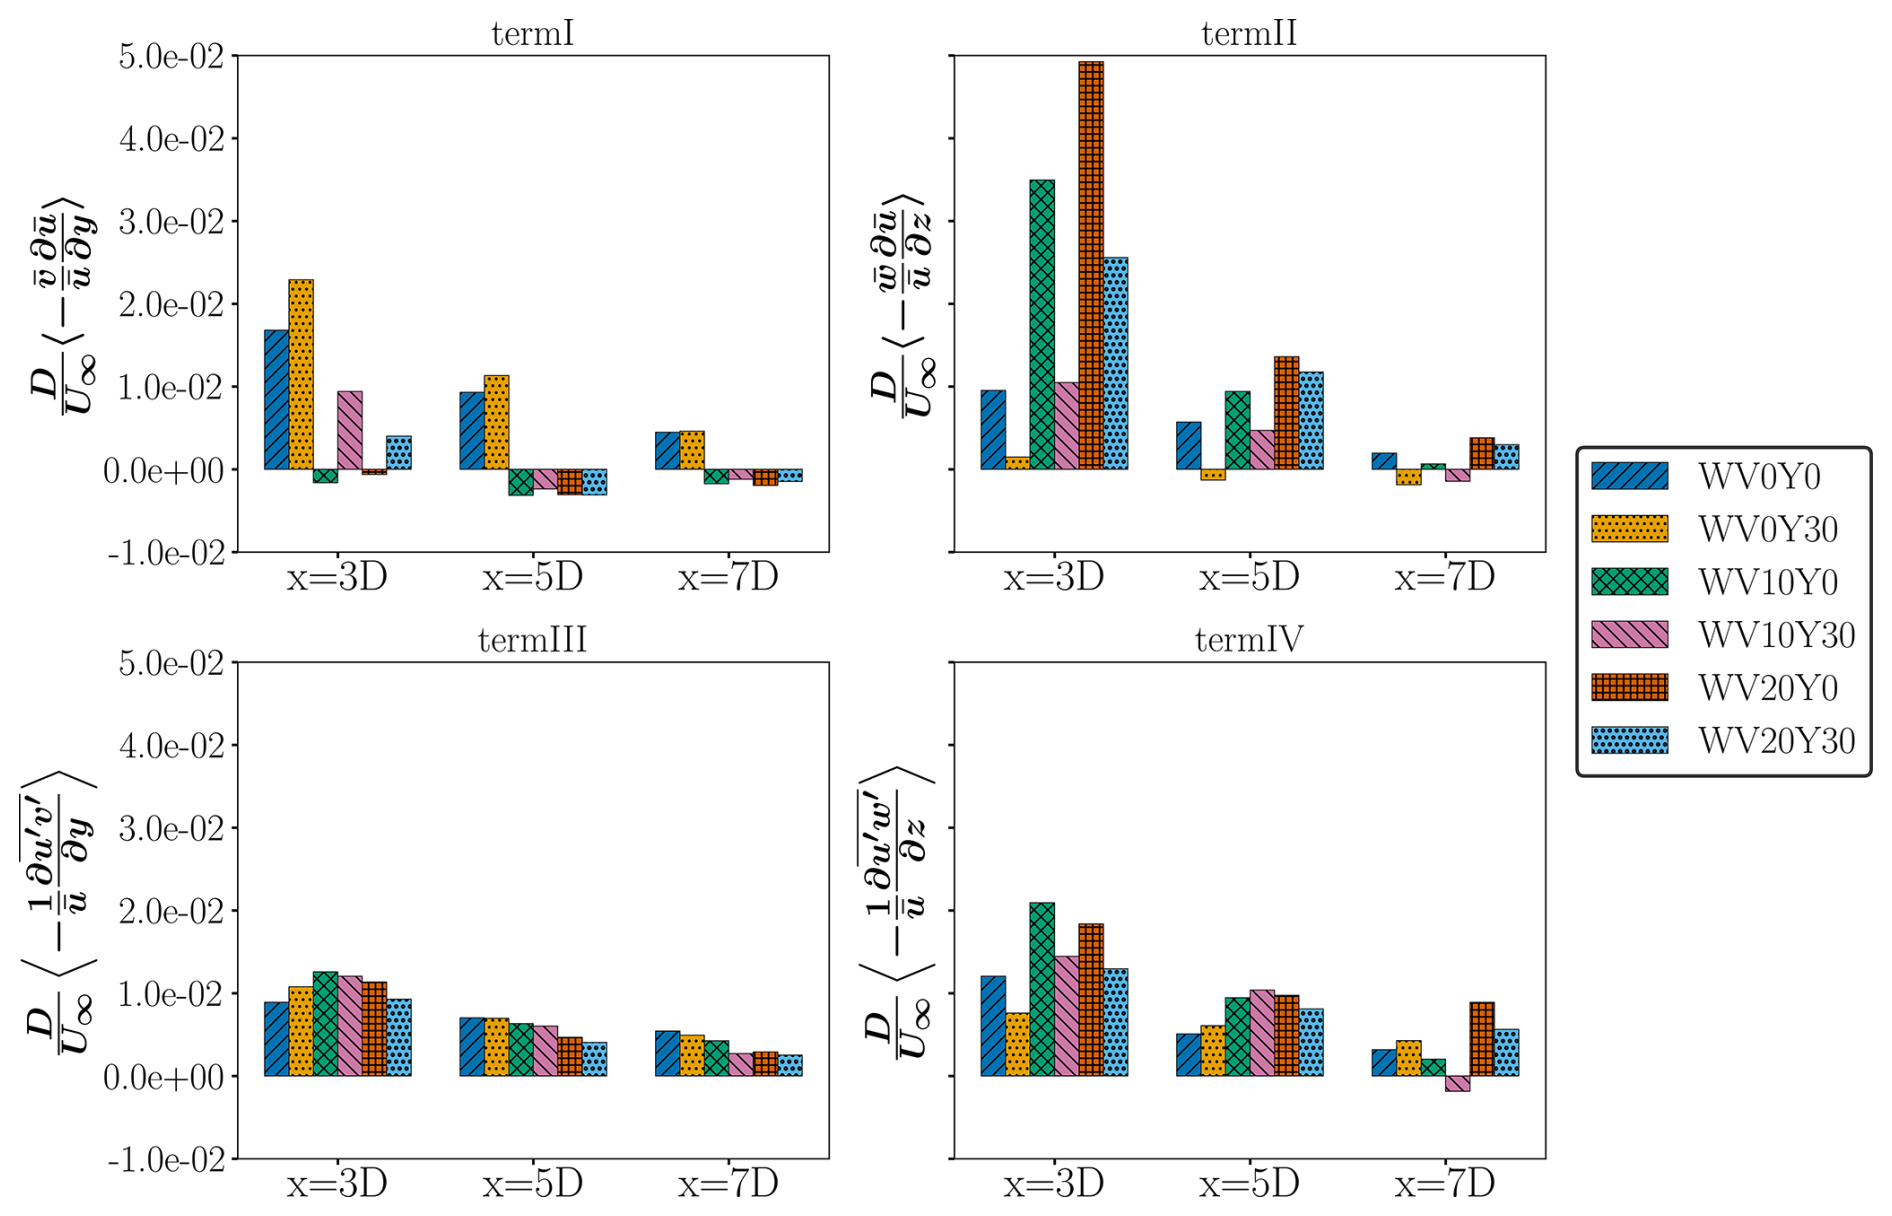
To evaluate the overall impact of the momentum budget terms on wake recovery across different cross-stream planes, we present their individual contributions to the recovery process at each plane. Equation (7) can be rewritten as
where is also called the streamwise wake recovery rate. Figure 14 shows the bar plot of each term's net contribution to wake recovery, which is integrated within the wake region at three different downstream locations of , 5, and 7 for three different inflows and two yaw angles of 0 and 30°. At for the no-veer case, the lateral advection of streamwise momentum (term I) helps in wake recovery more than the other terms. This term is slightly higher for the yawed cases because of the induction of spanwise flow in the wake, which contributes positively to the wake recovery. At further downstream locations, the contribution of this term reduces in the overall wake recovery. For the veered inflow and no-yaw case, the vertical advection of streamwise momentum (term II) plays a dominant role in redistributing momentum in the wake, as is evident from the sharp peaks of term II at . Term II for the 20° wind veer case is approximately 5 times higher than the corresponding term in the reference uniform inflow case. However, when the turbine is yawed, term II decreases with a corresponding increase in term I. This means that more entrainment of fluid occurs into the wake from the vertical direction than from the spanwise direction. Term IV is generally higher than term III for all cases, indicating greater turbulent transport of streamwise momentum in the z direction via (i.e., more turbulent mixing vertically). Generally, veered cases exhibit higher values of term IV compared to the uniform inflow case.
3.4 Turbulent kinetic energy
Turbulence kinetic energy (TKE) reflects the energy content of turbulence in the wake and how it is spatially distributed. It is an important parameter influencing wind turbine performance and blade fatigue loads. The wake-added TKE is computed as follows:
where TKE . In this equation, is the fluctuating velocity component in the ith direction (where corresponds to ) and is the time-averaged Reynolds stress tensor components.
Figure 15 shows the streamwise and cross-section planes of wake-added TKE for non-yawed and yawed discs for the three inflows. In the near-wake () for the non-yawed cases, the TKE appears enhanced in the lower half of the disc region due to the strong influence of vortices shed by the tower and their interaction with the porous disc wake. TKE distribution is ring-shaped in the near-wake, becoming more uniform at farther downstream distances due to flow entrainment and wake mixing. The wake-added TKE is highest for the veered inflow cases compared to the uniform inflow (no-veer) case, which is also consistent with the findings of Abkar and Porté-Agel (2016). Yaw introduces asymmetry in the TKE field, with more TKE addition from one side of the wake, as is evident from the streamwise plane of TKE in the bottom panels in Fig. 15. Similar to the velocity wake contours, the wind veer has an effect of stretching the TKE laterally. A larger TKE in the wake also implies a higher degree of wake mixing, thus aiding in wake recovery. The TKE distribution in the horizontal xy plane under veered inflow and non-yawed conditions is markedly different from that in the reference uniform inflow case, with the TKE expanding more in the lateral direction for the veered inflow.
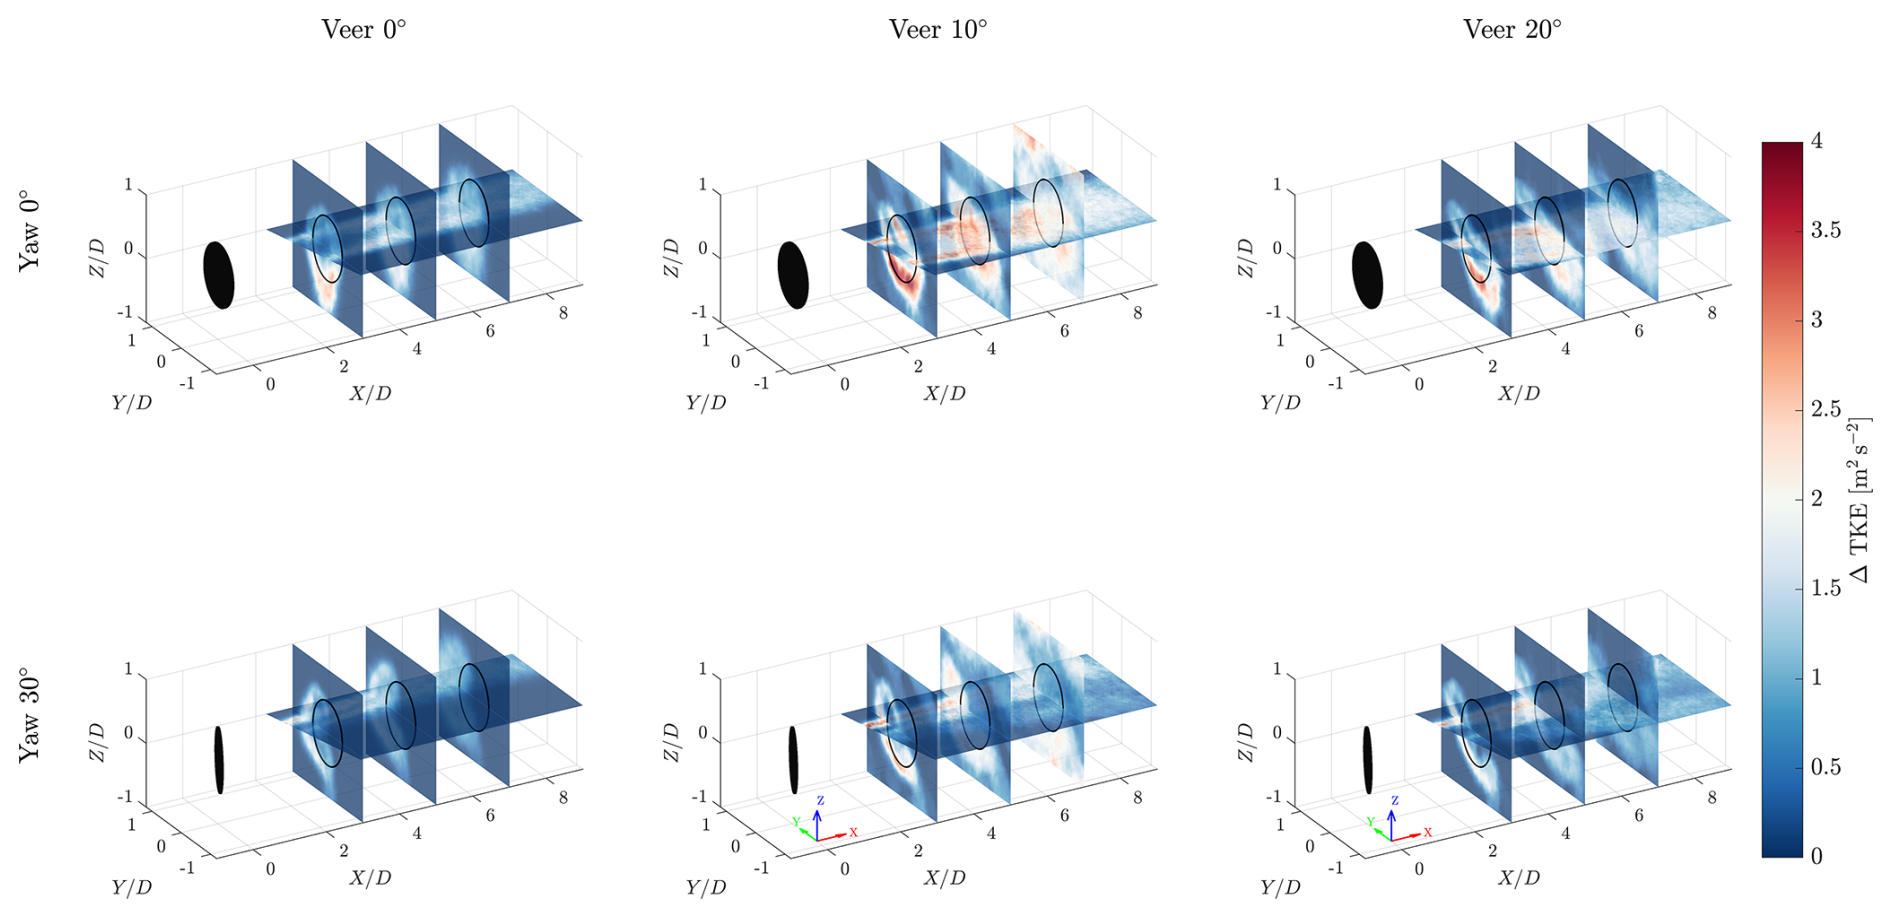
Figure 15Distribution of wake-added turbulent kinetic energy for the three different inflows. The figures on the left correspond to the no-veer inflow, the middle figures to the 10° veer inflow, and the right figures to the 20° veer inflow. The figures in the top panel are for the yaw angle of 0°, whereas the figures in the bottom panel are for the yaw angle of 30°. The solid circle on the cross-stream plane represents the projection of the non-yawed disc.
To better understand the TKE distribution within the wake, a budget analysis of the TKE transport equation is performed in the yz plane. The time-averaged TKE budget equation can be written as (Pope, 2000):
We evaluate the terms of Eq. (10) on yz planes at . Given the sufficiently high Reynolds number, the viscous diffusion term (𝒱k) is omitted, whereas the dissipation term (εk) cannot be measured by PIV and is also omitted in our analysis. Therefore, we only consider the in-plane contributions from advection (𝒜k), production (𝒫k), and turbulent transport (𝒯k) terms. Figure 16 shows the distributions of Ak, Pk, and Tk at for different yaw and veer cases. The red and blue regions in the Pk term indicate the source and sink of TKE, while the red/blue regions in Ak and Tk indicate gain/loss of TKE. The advective term (Ak) represents the transport of TKE by the mean flow. Comparing no-veer cases at yaw 0 and 30°, the yawed case shows stronger TKE advection along the lateral wake edges, driven by the induction of spanwise velocity due to yaw misalignment. In the presence of veer and no-yaw conditions, TKE is advected into the wake predominantly along the top and bottom edges of the wake boundary (red regions), while it is carried away from the lateral sides.
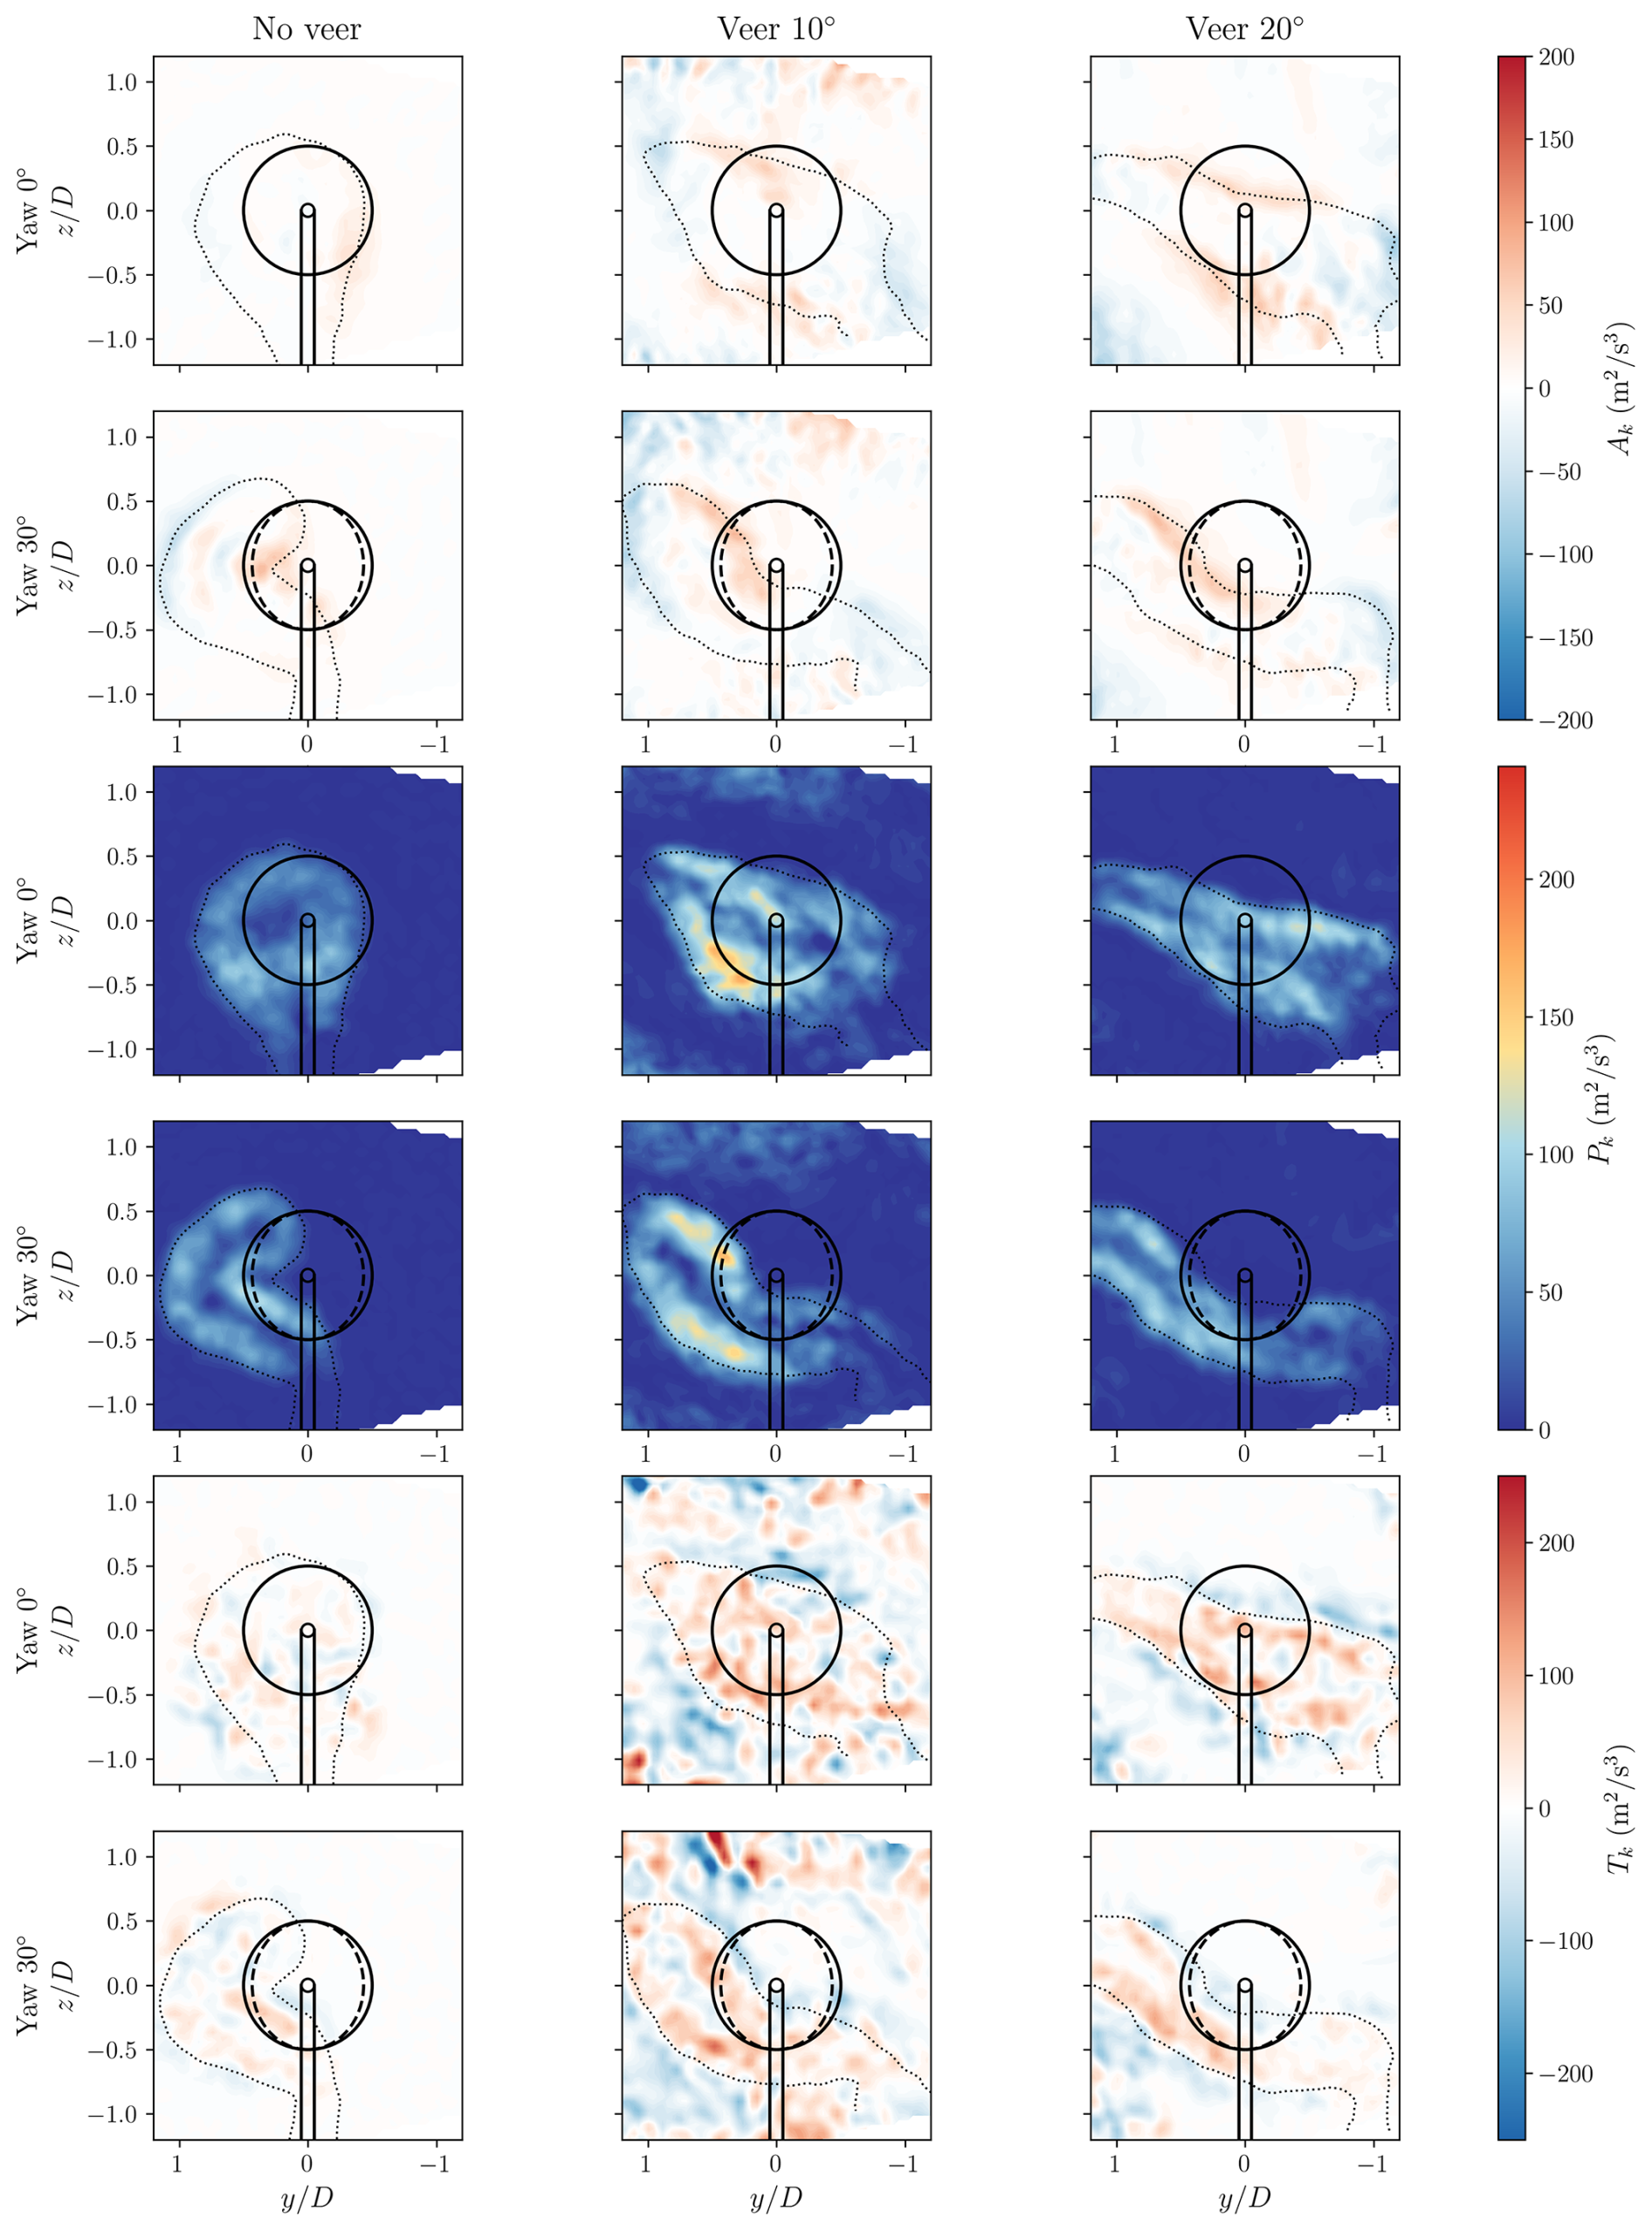
Figure 16Spatial distribution of terms in Eq. (10) at . The solid circle represents the frontal projection of the non-yawed porous disc, whereas the dashed circle represents the yawed disc of 30°. The dotted line indicates the wake boundary where .
The production term (Pk) represents the transfer of kinetic energy from the mean flow to turbulence. The enhanced wake-added TKE for the veered cases in Fig. 15 is attributed to the enhanced production term, which is much higher compared to the no-veer cases. The high Pk region is concentrated along the wake edges. This is due to higher lateral and vertical shear in the former case than in the latter. Comparing the top and bottom panels in Pk, yaw primarily alters the spatial distribution, whereas wind veer is the stronger driver of increased production magnitude. It should be noted that in the wake core, the TKE production is almost negligible, primarily because the mean velocity gradients vanish in this region.
Lastly, the turbulent transport term (Tk) represents the redistribution of TKE by the turbulent fluctuations. In the veered cases, TKE generated by the shear production along the wake edges is transported into the wake core by turbulent fluctuations, as indicated by the red regions within the wake core and blue regions along the outer wake edges where production is the highest. This redistribution is notably stronger in the veered cases compared to their no-veer counterparts, consistent with the stronger production observed in these cases.
3.5 Available power
The analysis so far has focused on the mean wake deficit and turbulence quantities of porous disc wake under uniform and veered inflows, and the dominant terms in the wake recovery mechanism. To further highlight the role of wind veer inflow in replenishing kinetic energy in the wake, an analysis of available power (AP) is performed at selected downstream locations. Rather than comparing velocities at a single point, the AP metric integrates the cube of the streamwise velocity over the frontal projection of a hypothetical downstream rotor and then slides this integration window laterally across the wake. This area-integrated, sliding-window approach captures the combined effects of wake shape, lateral displacement, and any spatial inhomogeneity in the inflow. Figure 17 shows the resulting lateral variation in available power for different cases at two downstream locations and 7. The AP is calculated using the relation given in Vollmer et al. (2016) and Zong and Porté-Agel (2020):
where is the normalized available power at the downstream turbine location, is the wind speed in the wake, and Uin(z) is the inflow wind speed. The integration is performed over the region G, defined as
which represents a circular area of radius R centered at hub height zT and lateral position yT. In this study, the disc center is positioned at the origin of the (y,z) coordinate system, such that . The window is then traversed in the lateral direction by varying yT, yielding the profiles shown in Fig. 17.
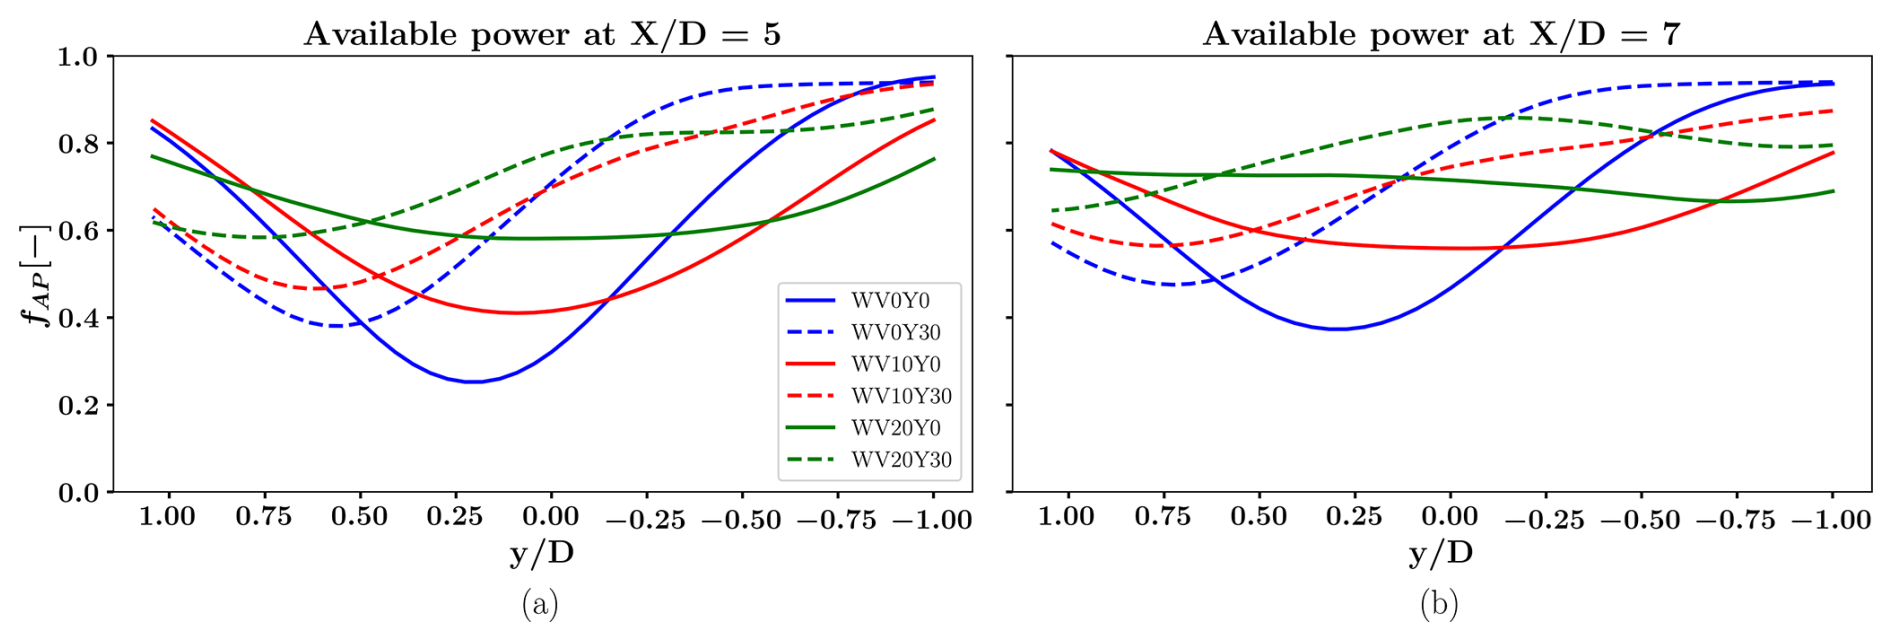
Figure 17Coefficient of available power as calculated using Eq. (11) at two downstream locations: (a) and (b) for different yaw and veering cases.
For the no-veer inflow and non-yawed disc condition (solid blue line in Fig. 17), fAP is lowest among all other cases, increasing from 32 % at to 47 % at for an inline configuration with the downstream turbine positioned at . When the disc is yawed (dashed blue line), the wake center shifts to the left, and the overall available power increases. The lowest value of fAP for the yawed case is 33 % higher than that for the non-yawed case. In the presence of veer in the inflow and a non-yawed disc (solid red and green lines), a stronger veer (20°) results in more available power than a weaker veer (10°). This is expected, as veer results in a stretched and elongated wake structure, exposing the downstream turbine to higher free-stream velocity inflow and thus leading to higher AP. To quantify this, if a hypothetical turbine is placed at , the AP for it under veered inflow of 20° is 45 % more than when the turbine is operating in no-veer inflow. When yaw is introduced in the presence of veered inflow (dashed red and green lines), wake recovery is enhanced even further because yaw deflects the wake farther away in the positive y direction and fAP increases to 77 %. Similar trends are also observed at the downstream location of . At this location, the highest gains in available power up to 85 % can be observed for the veered inflow of 20° and a positive yaw steering of 30°.
To investigate optimal downwind turbine placements with lateral offsets, Fig. 18 presents contour maps of the available power coefficient for all cases, computed using a sliding integration window across the spanwise plane. The dashed and solid lines on the contours denote locations where the coefficient of available power, fAP, is 0.50 and 0.75, respectively. A similar analysis for vertical-axis wind turbines has been conducted by Bensason et al. (2025).
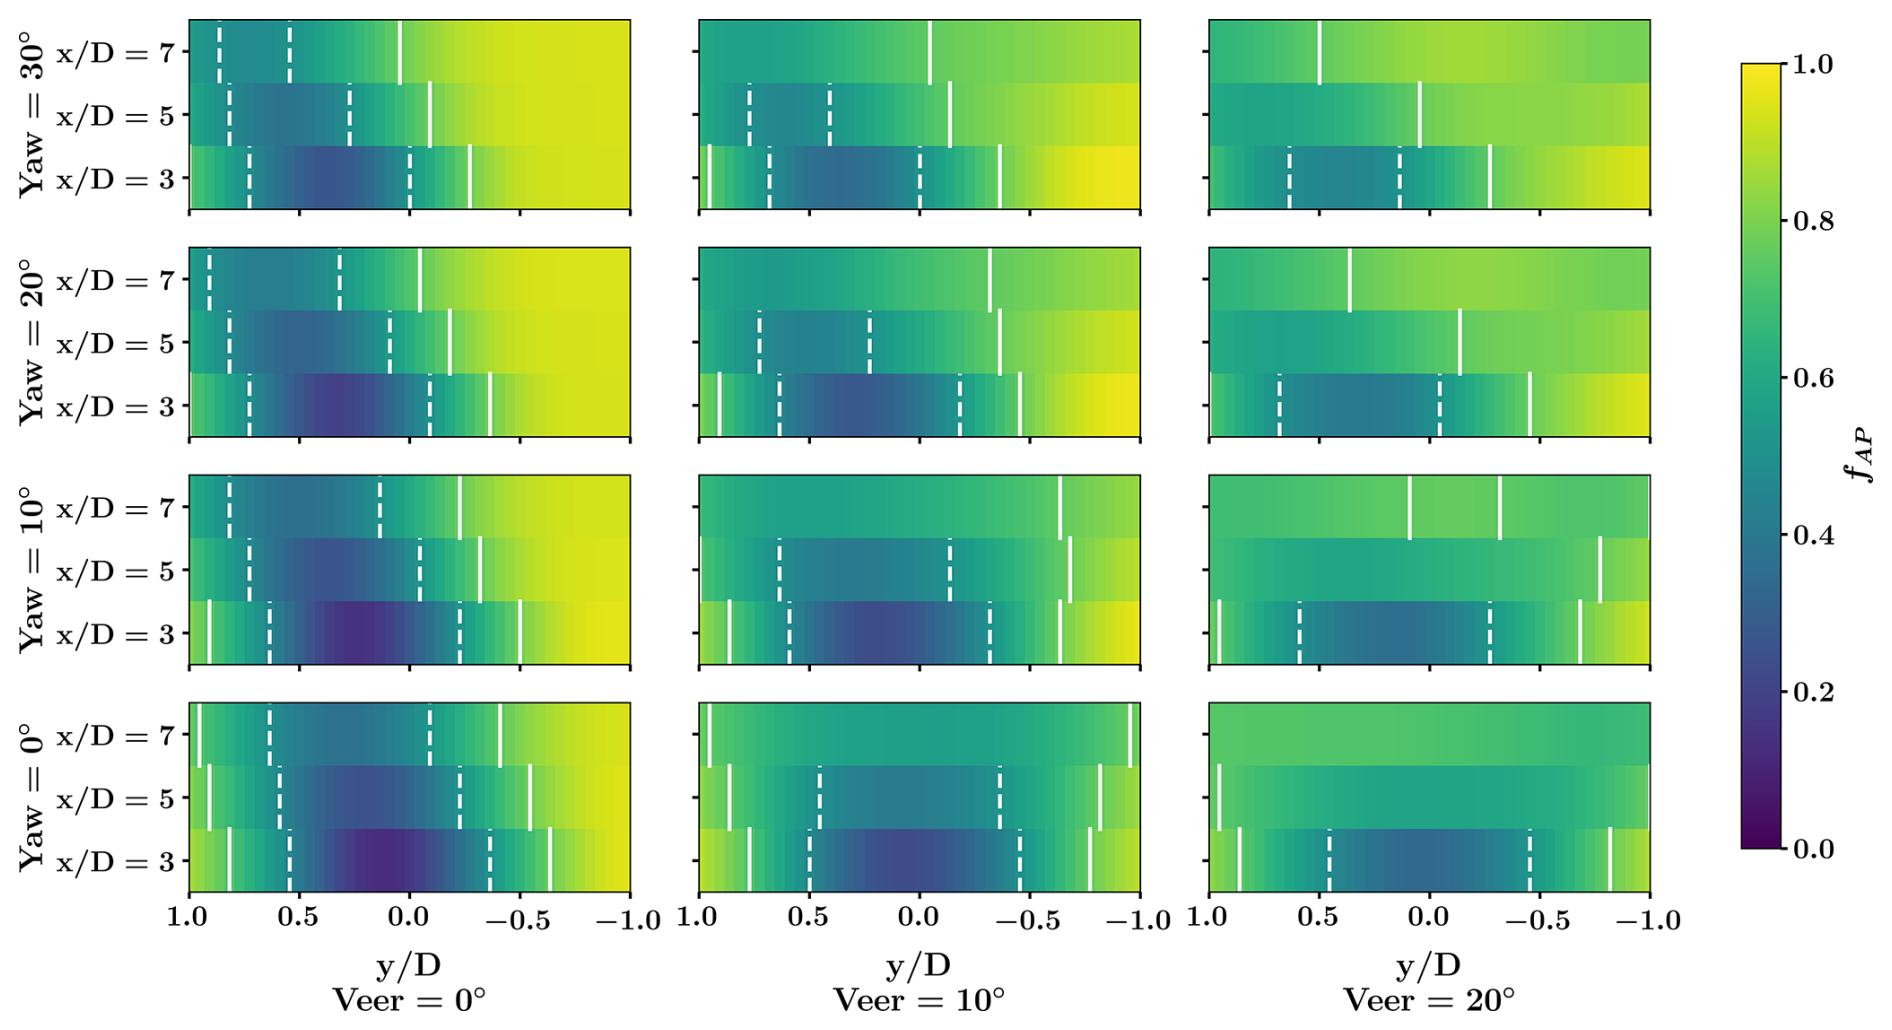
Figure 18Filled contour of available power distribution (Eq. 11) for all cases at three downstream locations. fAP is computed by integrating U3 over the frontal projection area of the porous disc centered at and normalizing by the corresponding integral of the inflow over the same area. The disc projection is then traversed laterally across the wake to produce the distributions shown. The solid vertical line represents the locations where fAP is 0.75 and the dashed vertical line represents locations where fAP is 0.5.
In the uniform inflow case with no-veer, the available power deficit exhibits a lateral shift to the left with increasing yaw angle. As discussed previously, yawed turbines generate reduced CT, resulting in greater fAP values further downstream. However, a downwind turbine positioned directly inline – even at from the upstream turbine – would still experience a partial wake, potentially exacerbating structural loading. In such scenarios, a more favorable placement would involve a slight negative lateral offset to avoid the lower wake regions of the upstream turbine.
In contrast, veer in the inflow leads to a more laterally uniform distribution of the available power deficit, particularly at and . This is evident from the absence of the fAP=0.5 contours (dashed lines) at , indicating that fAP exceeds 0.5 across the entire span. A stronger veer of 20° further enhances this uniformity, with the dashed lines disappearing even at . Under this condition, the fAP contours for yaw angles of 0° and 30° appear nearly identical.
This observation is particularly noteworthy as wake steering strategies typically perform best under low-turbulence conditions, which are characteristic of stable atmospheric boundary layers. Wind veering is more prevalent under such stratified conditions. Therefore, even without active yaw control, the wake may have sufficiently recovered by the time it reaches a downwind turbine located at . This recovery could be beneficial for dense wind farm configurations, where turbine spacing often falls within the range of .
To the authors' knowledge, this study presents one of the first attempts to reproduce atmospheric wind veer in a controlled wind tunnel environment using wind veering vanes. While this experimental approach successfully generates wind veer and captures complex wake topologies of both non-yawed and yawed wind turbines – showing good qualitative agreement with numerical simulations reported in the literature – it also introduces additional flow complexities that need to be discussed critically to guide future improvements in experimental design using this method. A primary limitation of this method is the periodic wake structures generated by wind veering vanes, clearly visible in the inflow streamwise velocity contours in Figs. 6a and 7a. Since the wakes shed by these vanes lie within the disc projected area, they introduce local non-homogeneity in the oncoming flow. In the near-wake, these “periodic structures” act as local momentum sinks that distort the wake shape locally.
A second limitation is the spanwise heterogeneity of the generated veer profiles, as shown in Fig. 19. While the Ekman spiral leads to a non-linear variation in wind direction with height, the veer is typically close to linear between the surface layer and the capping inversion and remains approximately uniform in the spanwise direction at a given height. This behavior is also commonly observed in precursor simulations of stable atmospheric boundary layers. In our setup, however, the discrete nature of vanes results in a “wavy” variation in veer angle in the y direction. This implies that the effective veer experienced by the porous disc slightly oscillates across its width. In future work, optimization of vane spacing and solidity should be investigated. Particularly, reducing the inter-vane spacing and increasing the number of vanes could better homogenize the flow field. Additionally, increasing the downstream fetch distance between the vanes and the turbine would allow the individual vane wakes to diffuse through turbulent mixing; however, in the present study, this was constrained by the available downstream distance of the wind tunnel. The use of fine mesh gauze screens downstream of the vanes could also be explored as a means to attenuate lateral velocity non-uniformities without significantly diminishing the imposed veer gradient (Mehta and Bradshaw, 1979). Lastly, as these periodic structures arise because of premature boundary layer separation, the use of zigzag tapes could also be investigated in the future so that the airflow remains attached to the steepest parts of the airfoil.
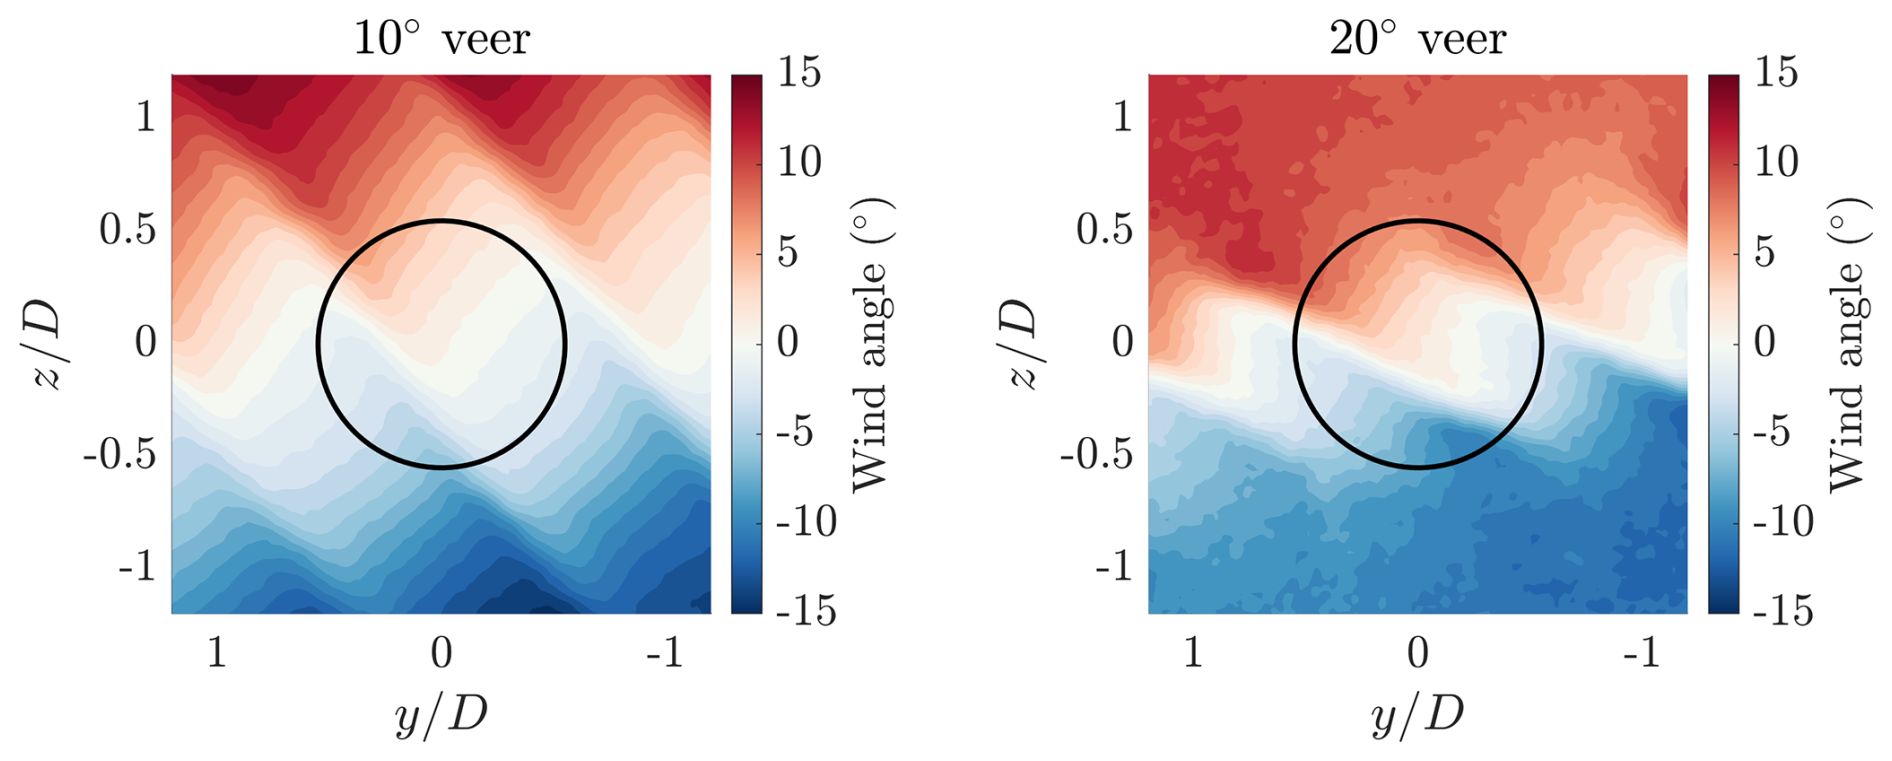
Figure 19Flow characterization contours of variation in wind veer in the yz plane at for the 10° (left) and 20° (right) veer cases. The solid circle represents the frontal projection of the porous disc.
Apart from improving the experimental setup, future work should also experimentally examine the interaction between turbine rotation and veered inflows. In particular, the direction of rotation (clockwise or counterclockwise) could have a significant impact on wake deflection and wake recovery, as shown in the numerical studies of Englberger et al. (2020a, b). Additionally, the impact of ground effects on wake characteristics should also be investigated.
This study presents the first experimental investigation into the effect of wind veer on wakes behind a porous disc. Three different inflow conditions were examined: no-veer, a veer of 10°, and a veer of 20°, each tested across a range of disc yaw angles. Stereoscopic PIV was adopted to study the velocity fields in the wake. The flow characterization without the porous disc demonstrates that our experimental setup can effectively generate wind veer and sustain it reasonably well, even at far downstream distances up to in the wind tunnel. Contours of streamwise velocity and vorticity reveal that, in the absence of wind veer, the wake of a yawed disc exhibits a distinct curled shape. This structure is attributed to the formation of counter-rotating vortex pairs (CVPs) shed from the edges of the disc. Wind veer results in a skewed wake shape that resembles an ellipse, which stretches even further for a higher wind veer of 20°. The combined action of veer and yaw results in a complex wake shape, with veer effects dominating yaw in determining wake shape as veer in the inflow increases. Background wind veer significantly distorts streamwise vorticity and makes the vortices asymmetric. Both the peak vorticity and circulation for veered inflow are lower than in the no-veer inflow case. The vertical vorticity contour reveals that the vortex sheet dissipates faster under veered inflow due to significant cross-flow and enhanced turbulent mixing. This is also observed in the turbulent kinetic energy (TKE) contours, which show higher wake-added TKE for the disc immersed in veered inflows. This is related to the higher shear production of turbulence in the wake as a result of lateral wind shear under veered inflow, which further enhances wake recovery. The analysis of the terms of the RANS budget equation reveals the differences in the dominant wake recovery mechanisms for the uniform inflow and veered inflow. The mean lateral advection of momentum is dominant in uniform inflow for wake recovery, whereas the mean vertical advection of momentum is the main driving mechanism in redistributing momentum for turbines in veered inflow. Furthermore, for the veered inflow, the contribution of the divergence of the vertical shear stress term is higher than that of the lateral shear stress term, revealing that sharper velocity gradients, as a result of the skewed wake shape, entrain more free-stream momentum into the wake.
The analysis of available power in the wake for different inflows and yaw angles provides interesting insights regarding the turbine control strategies, such as wake steering. It was observed that veered inflow exhibits more uniform available power coefficients in the wake compared to the no-veer case, even when the disc is not yawed. This means that a hypothetical turbine operating in the wake of the upwind turbine experiences higher available power throughout the spanwise distance, reducing the probability of the downwind turbine operating in a partial wake scenario, thereby reducing the fatigue and fluctuating loads on the turbine. In fact, for a rotor positioned inline of the upwind turbine at , the available power coefficient is 45 % greater for a 20° veered inflow than for the reference case with uniform inflow under non-yawed conditions. Under the combined action of wind veer and yaw, as expected, wake recovery is accelerated even further. Although the available power increases compared to the no-yaw case for an inline downwind turbine when the upstream rotor is yawed, the relative improvement is modest. For instance, fAP for a second turbine is only 9 % more for the veered inflow of 20° compared to the no-veer inflow for a yaw angle of 30°. These results highlight that under moderate wind veer conditions, such as those tested in this experiment, yawing a turbine may not result in significantly larger benefits for power production.
The presented results highlight the importance of considering the effect of wind veer for designing wake-steering-based control strategies. Ignoring wind veer in look-up tables for turbine yaw angles for wake steering could result in sub-optimal overall wind farm performance and also increase structural loading on downstream wind turbines.
The mean spanwise and vertical velocity contours for the empty wind tunnel under uniform inflow conditions are shown in Fig. A1. These contours reveal a systematic lateral and vertical “drift” in the inflow, which accounts for the lateral deflection in the wake for the case of WV0Y0, as seen in Fig. 5b. Specifically, a mean cross-flow velocity component of approximately 0.23 m s−1 is present in the disc region, alongside a persistent mean vertical velocity of 0.20 m s−1.
Figure A2 displays the mean spanwise and vertical velocity contours on the horizontal xy plane in the absence of the porous disc. For the no-veer inflow, there is a slight positive spanwise velocity in the horizontal plane. Due to veer in the inflow, the direction of the spanwise velocity points in the negative y direction, with magnitude increasing as wind veer increases. On the other hand, the vertical velocity component for the no-veer inflow is almost negligible. However, due to veer, there is a vertical velocity component in the wind, with its direction positive on one side (i.e., coming out of the plane) and negative on the other side (i.e., going into the plane). This is mostly due to enhanced turbulence in the veered inflow and the slight induction of vertical motions resulting from the veer generation method employed in this study.
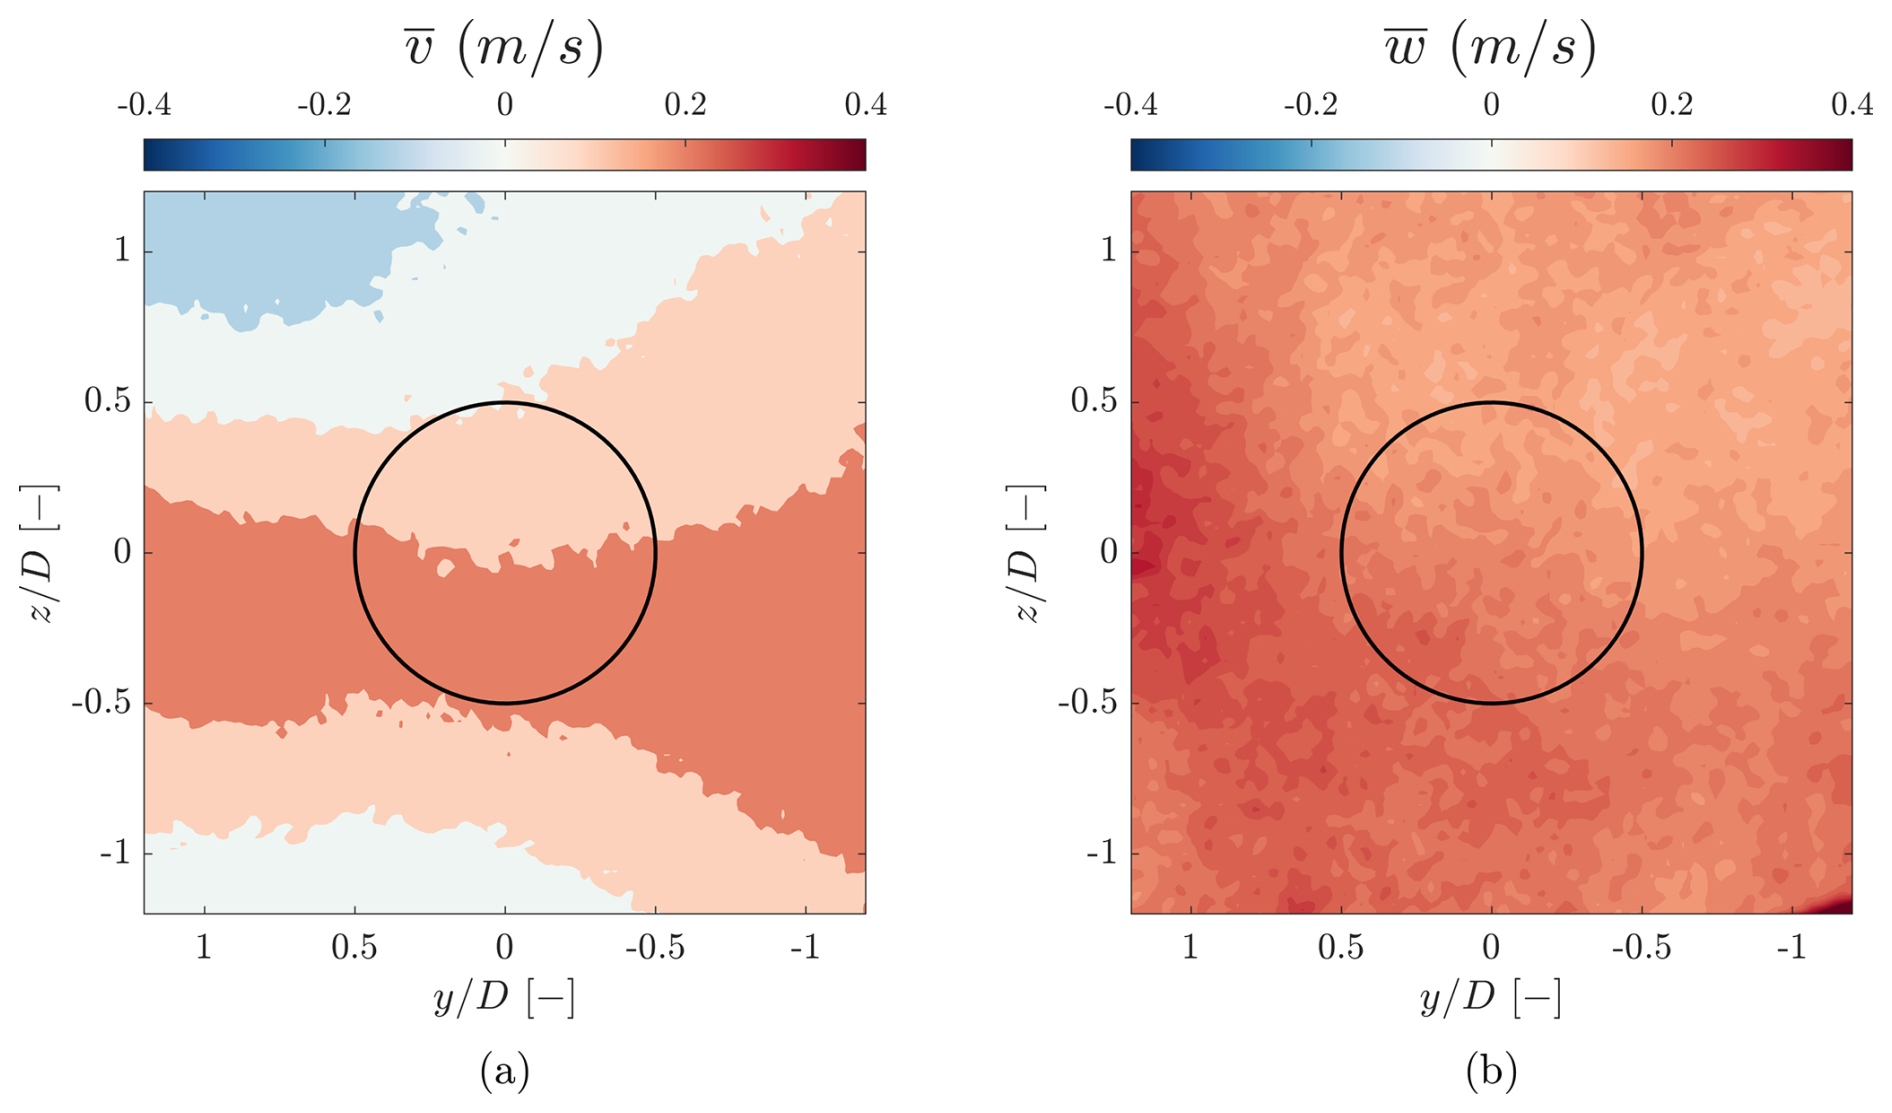
Figure A1Flow characterization contours in the yz plane for the clean case in the absence of the porous disc at : (a) spanwise velocity; (b) vertical velocity. The solid circle represents the frontal projection of the disc.
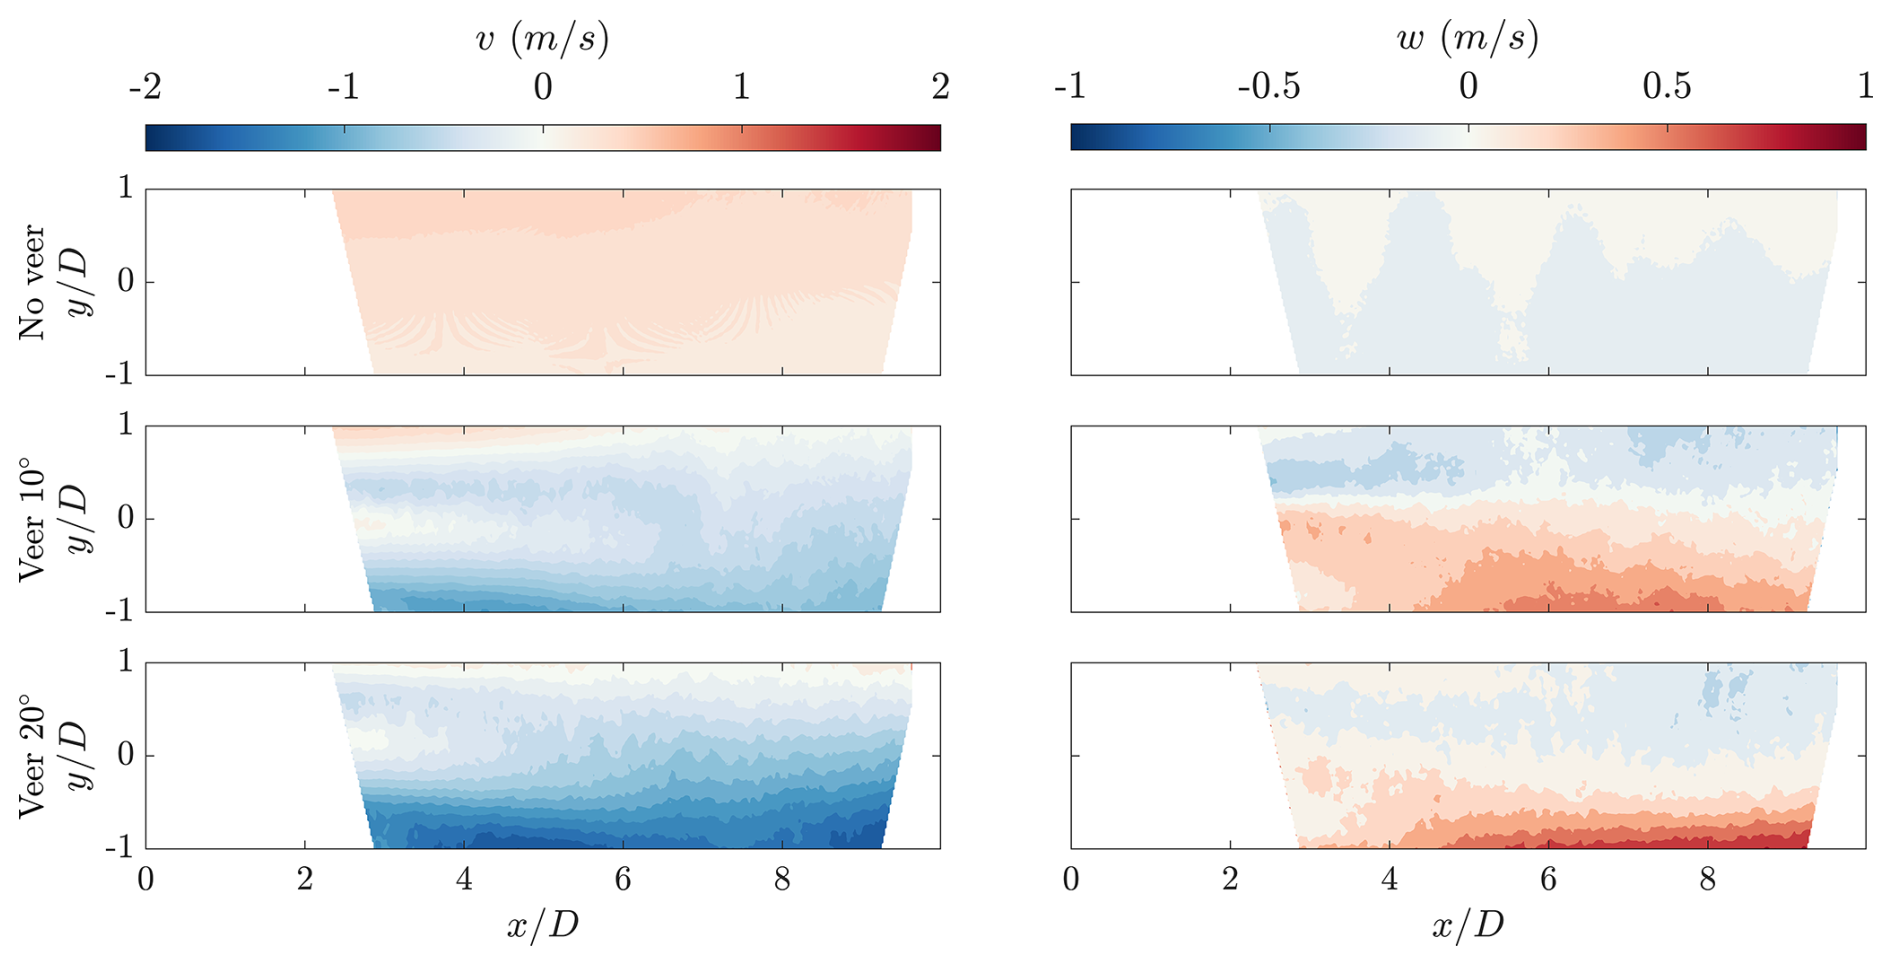
Figure A2Flow characterization contours in the absence of the porous disc, showing the spanwise (left) and vertical (right) velocity components for the three inflows.
To complement the discussion in Sect. 3.1, it is useful to examine how wind veer inflow influences mean spanwise and vertical velocity in the wake. Figure B1 presents the spanwise and vertical velocity fields in the horizontal plane for the non-yawed disc (top panel) and the disc yawed at 30° (bottom panel). For the non-yawed case, the spanwise velocity field resembles the distribution observed in the flow characterization results shown in Fig. A2.
This indicates that, under veered but non-yawed conditions, the presence of the porous disc does not induce any significant spanwise flow into the wake, and the spanwise velocity is predominantly determined by the incoming veered inflow.
In contrast, the vertical velocity component shows pronounced differences. For veered inflow under non-yawed conditions, wake rotation is visible, whereas, as expected, no rotation is observed for uniform inflow without yaw. Following Bastankhah and Porté-Agel (2015), wake rotation can be identified when vertical velocity components of opposite sign appear in the horizontal plane. Under yawed conditions, the vertical velocity contours reveal further notable features: compared to clean inflow, veered inflow induces a net downward transport of momentum from above, enhancing wake recovery. This behavior is consistent with the momentum budget analysis in Sect. 3.3.
The spanwise velocity distribution for the yawed disc also shows pronounced differences. As seen in the discussion of Sect. 3.1, a yawed disc exerts a lateral force on the flow, which in turn induces spanwise velocity in the wake (for our case, in the positive y direction), which is clearly visible for the no-veer case. Interestingly, as the veer acts in the opposite direction to the spanwise velocity, it counteracts and diffuses the spanwise velocity induced by turbine yaw. As the degree of veer across the disc increases, the yaw-induced spanwise velocity decreases further, as is evident in Fig. B1. At higher veer magnitudes, the influence of veer clearly dominates the yaw effect. This underscores the importance of accounting for wind veer in wake steering control strategies.
Moreover, an unintended benefit of yaw misalignment of the first turbine is the secondary wake steering effects (King et al., 2021), where its wake can deflect the wake of the downstream aligned turbine, potentially increasing the power output in wind farms (Fleming et al., 2018). Since secondary wake steering is strongly dependent on the spanwise velocity in the wake – and background wind veer can substantially alter this velocity component – these findings have direct implications for the design and optimization of wake steering strategies in wind farms.
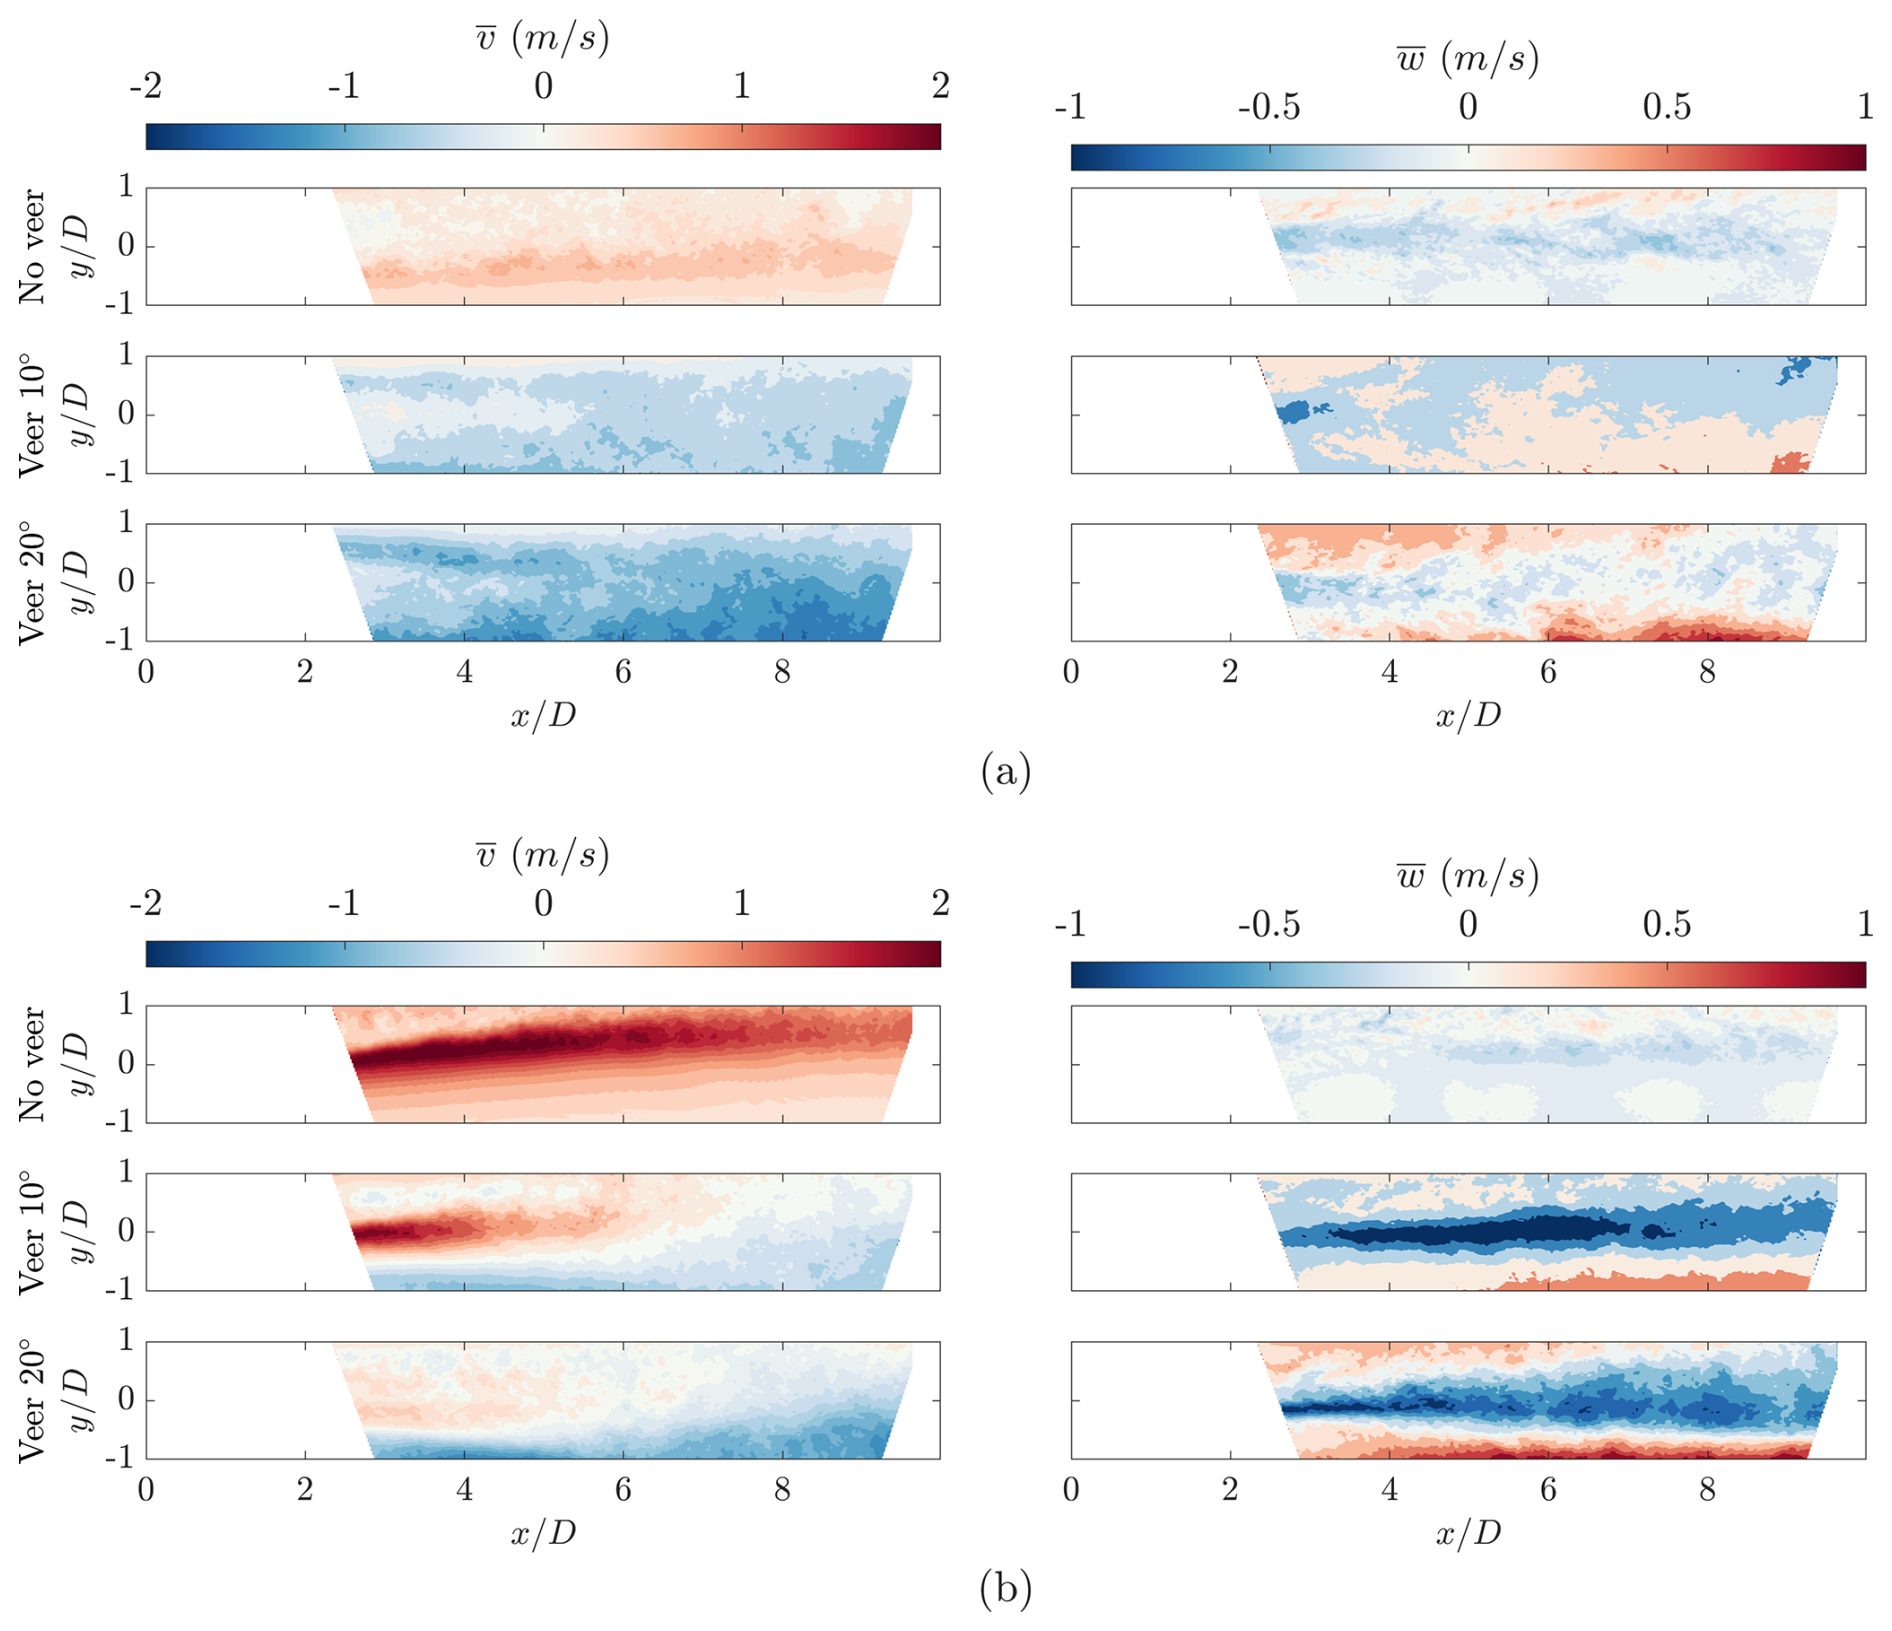
Figure B1Spanwise and vertical velocity components in horizontal xy plane for (a) no-yaw and (b) yaw conditions.
To show that wind veer does not merely advect the wake laterally but also actively enhances wake recovery, we constructed a simple advection model to isolate the geometric effect of veer from any enhanced recovery mechanisms. Essentially, we laterally displaced the velocity field at for the non-veered case WV0Y0, using the inflow veer profile of the 10° case, following the relation , where α(z) is the local veer angle. This produced a predicted wake shape under the assumption that veer acts purely as passive advection. We then compared this reconstructed field against the experimentally measured wake under veered inflow.
The color of streamwise velocity contours presented in Fig. C1 indicates that wind veer not only displaces the wake laterally but also contributes to faster wake recovery. A similar approach was also adopted by Churchfield and Sirnivas (2018), where the authors advected a vertical line of points using the inflow profile and measured the angle of the resulting tilted line (“expected skew”). Then they identified the lateral position of the wake deficit minimum at each height and measured that angle (“actual skew”) and compared the two angles.
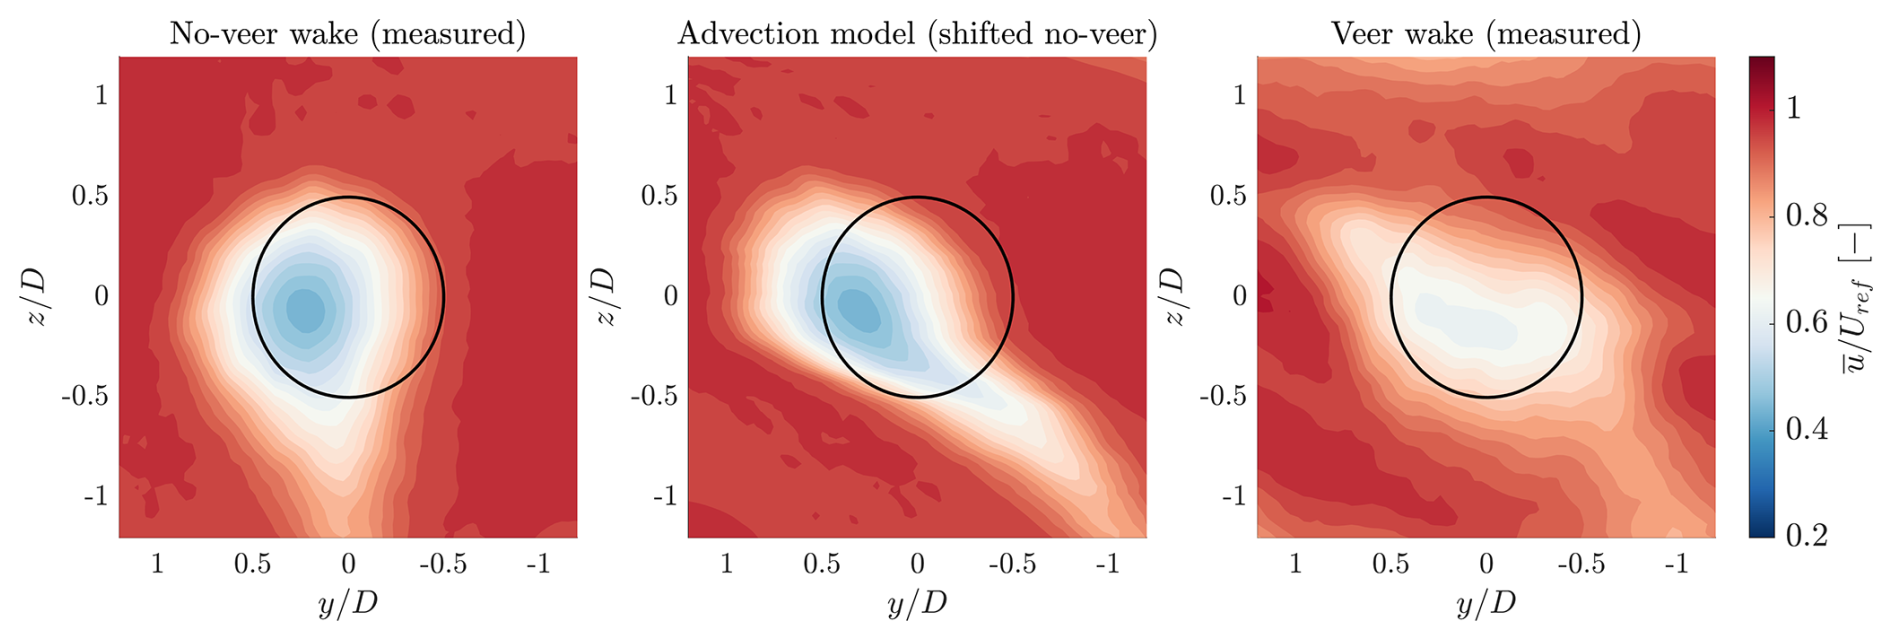
Figure C1Comparison of a simple advection model with the experimental results of veer wake at . The leftmost plot corresponds to the case of WV0Y0, the middle plot is obtained from the simple advection model, and the rightmost plot is the measured case of WV10Y0.
The code, data, and the CAD files of the wind veer vanes are publicly available through 4TU Research Data at https://doi.org/10.4121/e38ae0af-860a-46f0-85af-f384f3cd7d34 (Purohit et al., 2025).
SP developed the methodology, carried out the experiments, performed data analysis, and wrote the article. HS helped the first author in carrying out the experiments. AS shared his expertise in setting up the SPIV setup, provided scientific supervision throughout the analysis phase, and revised the article. WY contributed towards funding acquisition, scientific supervision throughout the analysis phase, and revising the article.
The contact author has declared that none of the authors has any competing interests.
Publisher's note: Copernicus Publications remains neutral with regard to jurisdictional claims made in the text, published maps, institutional affiliations, or any other geographical representation in this paper. The authors bear the ultimate responsibility for providing appropriate place names. Views expressed in the text are those of the authors and do not necessarily reflect the views of the publisher.
The authors would like to thank the amazing technicians in the aerodynamics lab – Frits Donker Duyvis, Peter Duyndam, Stefan Bernardy, and Dennis Bruikman – without whom the experiemnts would not have been possible. The authors would also like to thank YuanTso Li, David Bensason, Brian D'Souza, Kiran Sripathy, Nirav Dangi, and Adhyanth Giri Ajay for their assistance with the experimental setup and valuable scientific discussions. The authors also acknowledge using generative AI models, such as Google Gemini, to improve the language and clarity of the article. The authors reviewed and edited the content appropriately.
This research has been supported by the DIAMOND (DynamIc yAw Models fOr wiND turbine/farm design) project funded by the Dutch Research Council (NWO), Netherlands, through the Open Technology Program (OTP) under grant agreement no. 20052.
This paper was edited by Raúl Bayoán Cal and reviewed by three anonymous referees.
Abkar, M. and Porté-Agel, F.: Influence of the Coriolis force on the structure and evolution of wind turbine wakes, Physical Review Fluids, 1, 063701, https://doi.org/10.1103/physrevfluids.1.063701, 2016. a, b, c, d
Abraham, A., Dasari, T., and Hong, J.: Effect of turbine nacelle and tower on the near wake of a utility-scale wind turbine, J. Wind Eng. Ind. Aerod., 193, 103981, https://doi.org/10.1016/j.jweia.2019.103981, 2019. a
Adaramola, M. and Krogstad, P.-Å.: Experimental investigation of wake effects on wind turbine performance, Renew. Energ., 36, 2078–2086, https://doi.org/10.1016/j.renene.2011.01.024, 2011. a
Archer, C. L. and Vasel-Be-Hagh, A.: Wake steering via yaw control in multi-turbine wind farms: Recommendations based on large-eddy simulation, Sustainable Energy Technologies and Assessments, 33, 34–43, https://doi.org/10.1016/j.seta.2019.03.002, 2019. a, b
Aubrun, S., Loyer, S., Hancock, P. E., and Hayden, P.: Wind turbine wake properties: Comparison between a non-rotating simplified wind turbine model and a rotating model, J. Wind Eng. Ind. Aerod., 120, 1–8, https://doi.org/10.1016/j.jweia.2013.06.007, 2013. a, b
Aubrun, S., Bastankhah, M., Cal, R. B., Conan, B., Hearst, R. J., Hoek, D., Hölling, M., Huang, M., Hur, C., Karlsen, B., Neunaber, I., Obligado, M., Peinke, J., Percin, M., Saetran, L., Schito, P., Schliffke, B., Sims-Williams, D., Uzol, O., Vinnes, M., and Zasso, A.: Round-robin tests of porous disc models, J. Phys. Conf. Ser., 1256, 012004, https://doi.org/10.1088/1742-6596/1256/1/012004, 2019. a
Barthelmie, R. J., Hansen, K., Frandsen, S. T., Rathmann, O., Schepers, J., Schlez, W., Phillips, J., Rados, K., Zervos, A., Politis, E., and Chaviaropoulos, P.: Modelling and measuring flow and wind turbine wakes in large wind farms offshore, Wind Energy, 12, 431–444, https://doi.org/10.1002/we.348, 2009. a
Bartl, J., Mühle, F., Schottler, J., Sætran, L., Peinke, J., Adaramola, M., and Hölling, M.: Wind tunnel experiments on wind turbine wakes in yaw: effects of inflow turbulence and shear, Wind Energ. Sci., 3, 329–343, https://doi.org/10.5194/wes-3-329-2018, 2018. a, b
Bastankhah, M. and Porté-Agel, F.: A wind-tunnel investigation of wind-turbine wakes in yawed conditions, J. Phys. Conf. Ser., 625, 012014, https://doi.org/10.1088/1742-6596/625/1/012014, 2015. a
Bastankhah, M. and Porté-Agel, F.: Experimental and theoretical study of wind turbine wakes in yawed conditions, J. Fluid Mech., 806, 506–541, https://doi.org/10.1017/jfm.2016.595, 2016. a, b, c, d, e
Bastankhah, M., Shapiro, C. R., Shamsoddin, S., Gayme, D. F., and Meneveau, C.: A vortex sheet based analytical model of the curled wake behind yawed wind turbines, J. Fluid Mech., 933, A2, https://doi.org/10.1017/jfm.2021.1010, 2022. a
Bensason, D., Sciacchitano, A., Giri Ajay, A., and Simao Ferreira, C.: A Study of the Near Wake Deformation of the X-Rotor Vertical-Axis Wind Turbine With Pitched Blades, Wind Energy, 27, 1388–1411, https://doi.org/10.1002/we.2944, 2024. a
Bensason, D., Sciacchitano, A., and Ferreira, C.: On the wake re-energization of the X-Rotor vertical-axis wind turbine via the vortex-generator strategy, Wind Energ. Sci., 10, 2137–2159, https://doi.org/10.5194/wes-10-2137-2025, 2025. a
Bodini, N., Zardi, D., and Lundquist, J. K.: Three-dimensional structure of wind turbine wakes as measured by scanning lidar, Atmos. Meas. Tech., 10, 2881–2896, https://doi.org/10.5194/amt-10-2881-2017, 2017. a
Bodini, N., Lundquist, J. K., and Kirincich, A.: US East Coast lidar measurements show offshore wind turbines will encounter very low atmospheric turbulence, Geophys. Res. Lett., 46, 5582–5591, https://doi.org/10.1029/2019gl082636, 2019. a
Bourhis, M. and Buxton, O.: Influence of freestream turbulence and porosity on porous disk-generated wakes, Physical Review Fluids, 9, 124501, https://doi.org/10.1103/physrevfluids.9.124501, 2024. a, b
Bromm, M., Vollmer, L., and Kühn, M.: Numerical investigation of wind turbine wake development in directionally sheared inflow, Wind Energy, 20, 381–395, https://doi.org/10.1002/we.2010, 2017. a
Camp, E. H. and Cal, R. B.: Mean kinetic energy transport and event classification in a model wind turbine array versus an array of porous disks: Energy budget and octant analysis, Physical Review Fluids, 1, 044404, https://doi.org/10.1103/physrevfluids.1.044404, 2016. a
Camp, E. H. and Cal, R. B.: Low-dimensional representations and anisotropy of model rotor versus porous disk wind turbine arrays, Physical Review Fluids, 4, 024610, https://doi.org/10.1103/physrevfluids.4.024610, 2019. a
Castro, I.: Wake characteristics of two-dimensional perforated plates normal to an air-stream, J. Fluid Mech., 46, 599–609, https://doi.org/10.1017/s0022112071000727, 1971. a
Churchfield, M. J. and Sirnivas, S.: On the effects of wind turbine wake skew caused by wind veer, in: 2018 Wind Energy Symposium, p. 0755, https://doi.org/10.2514/6.2018-0755, 2018. a, b, c, d, e, f
Cicolin, M., Chellini, S., Usherwood, B., Ganapathisubramani, B., and Castro, I. P.: Vortex shedding behind porous flat plates normal to the flow, J. Fluid Mech., 985, A40, https://doi.org/10.1017/jfm.2024.300, 2024. a
Clayton, B. and Filby, P.: Measured effects of oblique flows and change in blade pitch angle on performance and wake development of model wind turbines, in: Proceedings of the fourth BWEA Wind Energy Conference, BHRA Fluid Engineering, Cranfield, Bedford, UK, 214–224, ISBN 0906085713, 1982. a
Debnath, M., Moriarty, P., Krishnamurthy, R., Bodini, N., Newsom, R., Quon, E., Lundquist, J. K., Letizia, S., Iungo, G. V., and Klein, P.: Characterization of wind speed and directional shear at the AWAKEN field campaign site, J. Renew. Sustain. Ener., 15, https://doi.org/10.1063/5.0139737, 2023. a
de Jong Helvig, S., Vinnes, M. K., Segalini, A., Worth, N. A., and Hearst, R. J.: A comparison of lab-scale free rotating wind turbines and actuator disks, J. Wind Eng. Ind. Aerod., 209, 104485, https://doi.org/10.1016/j.jweia.2020.104485, 2021. a
Englberger, A., Dörnbrack, A., and Lundquist, J. K.: Does the rotational direction of a wind turbine impact the wake in a stably stratified atmospheric boundary layer?, Wind Energ. Sci., 5, 1359–1374, https://doi.org/10.5194/wes-5-1359-2020, 2020a. a
Englberger, A., Lundquist, J. K., and Dörnbrack, A.: Changing the rotational direction of a wind turbine under veering inflow: a parameter study, Wind Energ. Sci., 5, 1623–1644, https://doi.org/10.5194/wes-5-1623-2020, 2020b. a
Fleming, P., Annoni, J., Shah, J. J., Wang, L., Ananthan, S., Zhang, Z., Hutchings, K., Wang, P., Chen, W., and Chen, L.: Field test of wake steering at an offshore wind farm, Wind Energ. Sci., 2, 229–239, https://doi.org/10.5194/wes-2-229-2017, 2017. a
Fleming, P., Annoni, J., Churchfield, M., Martinez-Tossas, L. A., Gruchalla, K., Lawson, M., and Moriarty, P.: A simulation study demonstrating the importance of large-scale trailing vortices in wake steering, Wind Energ. Sci., 3, 243–255, https://doi.org/10.5194/wes-3-243-2018, 2018. a
Fleming, P., King, J., Dykes, K., Simley, E., Roadman, J., Scholbrock, A., Murphy, P., Lundquist, J. K., Moriarty, P., Fleming, K., van Dam, J., Bay, C., Mudafort, R., Lopez, H., Skopek, J., Scott, M., Ryan, B., Guernsey, C., and Brake, D.: Initial results from a field campaign of wake steering applied at a commercial wind farm – Part 1, Wind Energ. Sci., 4, 273–285, https://doi.org/10.5194/wes-4-273-2019, 2019. a, b
Fleming, P., King, J., Simley, E., Roadman, J., Scholbrock, A., Murphy, P., Lundquist, J. K., Moriarty, P., Fleming, K., van Dam, J., Bay, C., Mudafort, R., Jager, D., Skopek, J., Scott, M., Ryan, B., Guernsey, C., and Brake, D.: Continued results from a field campaign of wake steering applied at a commercial wind farm – Part 2, Wind Energ. Sci., 5, 945–958, https://doi.org/10.5194/wes-5-945-2020, 2020. a
Fleming, P. A., Gebraad, P. M., Lee, S., van Wingerden, J.-W., Johnson, K., Churchfield, M., Michalakes, J., Spalart, P., and Moriarty, P.: Evaluating techniques for redirecting turbine wakes using SOWFA, Renew. Energ., 70, 211–218, https://doi.org/10.1016/j.renene.2014.02.015, 2014. a
Gao, L., Li, B., and Hong, J.: Effect of wind veer on wind turbine power generation, Phys. Fluids, 33, https://doi.org/10.1063/5.0033826, 2021. a
Gebraad, P. M., Teeuwisse, F. W., Van Wingerden, J., Fleming, P. A., Ruben, S. D., Marden, J. R., and Pao, L. Y.: Wind plant power optimization through yaw control using a parametric model for wake effects – a CFD simulation study, Wind Energy, 19, 95–114, https://doi.org/10.1002/we.1822, 2016. a
Grant, I. and Parkin, P.: A DPIV study of the trailing vortex elements from the blades of a horizontal axis wind turbine in yaw, Exp. Fluids, 28, 368–376, https://doi.org/10.1007/s003480050396, 2000. a
Grant, I., Parkin, P., and Wang, X.: Optical vortex tracking studies of a horizontal axis wind turbine in yaw using laser-sheet, flow visualisation, Exp. Fluids, 23, 513–519, https://doi.org/10.1007/s003480050142, 1997. a
Haans, W., Sant, T., Van Kuik, G., and van Bussel, G.: Measurement of tip vortex paths in the wake of a HAWT under yawed flow conditions, J. Sol. Energ., https://doi.org/10.1115/1.2037092, 2005. a
Heck, K. S., Johlas, H. M., and Howland, M. F.: Modelling the induction, thrust and power of a yaw-misaligned actuator disk, J. Fluid Mech., 959, A9, https://doi.org/10.1017/jfm.2023.129, 2023. a
Howland, M. F., Bossuyt, J., Martínez-Tossas, L. A., Meyers, J., and Meneveau, C.: Wake structure in actuator disk models of wind turbines in yaw under uniform inflow conditions, J. Renew. Sustain. Ener., 8, https://doi.org/10.1063/1.4955091, 2016. a, b, c, d
Howland, M. F., Lele, S. K., and Dabiri, J. O.: Wind farm power optimization through wake steering, P. Natl. Acad. Sci. USA, 116, 14495–14500, https://doi.org/10.1073/pnas.1903680116, 2019. a
Howland, M. F., Quesada, J. B., Martínez, J. J. P., Larrañaga, F. P., Yadav, N., Chawla, J. S., Sivaram, V., and Dabiri, J. O.: Collective wind farm operation based on a predictive model increases utility-scale energy production, Nature Energy, 7, 818–827, https://doi.org/10.1038/s41560-022-01085-8, 2022. a
Huang, M., Ferreira, C., Sciacchitano, A., and Scarano, F.: Wake scaling of actuator discs in different aspect ratios, Renewable Energy, 183, 866–876, https://doi.org/10.1016/j.renene.2021.11.045, 2022. a
Hulsman, P., Wosnik, M., Petrović, V., Hölling, M., and Kühn, M.: Development of a curled wake of a yawed wind turbine under turbulent and sheared inflow, Wind Energ. Sci., 7, 237–257, https://doi.org/10.5194/wes-7-237-2022, 2022. a, b, c
Jiménez, Á., Crespo, A., and Migoya, E.: Application of a LES technique to characterize the wake deflection of a wind turbine in yaw, Wind Energy, 13, 559–572, https://doi.org/10.1002/we.380, 2010. a
King, J., Fleming, P., King, R., Martínez-Tossas, L. A., Bay, C. J., Mudafort, R., and Simley, E.: Control-oriented model for secondary effects of wake steering, Wind Energ. Sci., 6, 701–714, https://doi.org/10.5194/wes-6-701-2021, 2021. a
Klemmer, K. S. and Howland, M. F.: Momentum deficit and wake-added turbulence kinetic energy budgets in the stratified atmospheric boundary layer, Physical Review Fluids, 9, 114607, https://doi.org/10.1103/physrevfluids.9.114607, 2024. a, b, c
Liew, J., Urbán, A. M., and Andersen, S. J.: Analytical model for the power–yaw sensitivity of wind turbines operating in full wake, Wind Energ. Sci., 5, 427–437, https://doi.org/10.5194/wes-5-427-2020, 2020. a
Lignarolo, L. E., Ragni, D., Ferreira, C. J., and van Bussel, G. J.: Experimental comparison of a wind-turbine and of an actuator-disc near wake, J. Renew. Sustain. Ener., 8, https://doi.org/10.1063/1.4941926, 2016. a, b, c
Lu, H. and Porté-Agel, F.: Large-eddy simulation of a very large wind farm in a stable atmospheric boundary layer, Phys. Fluids, 23, https://doi.org/10.1063/1.3589857, 2011. a
Medici, D. and Alfredsson, P.: Measurements on a wind turbine wake: 3D effects and bluff body vortex shedding, Wind Energy, 9, 219–236, https://doi.org/10.1002/we.156, 2006. a
Mehta, R. D. and Bradshaw, P.: Design rules for small low speed wind tunnels, Aeronaut. J., 83, 443–453, https://doi.org/10.1017/s0001924000031985, 1979. a
Mohammadi, M., Bastankhah, M., Fleming, P., Churchfield, M., Bossanyi, E., Landberg, L., and Ruisi, R.: Curled-skewed wakes behind yawed wind turbines subject to veered inflow, Energies, 15, 9135, https://doi.org/10.3390/en15239135, 2022. a
Narasimhan, G., Gayme, D. F., and Meneveau, C.: Effects of wind veer on a yawed wind turbine wake in atmospheric boundary layer flow, Physical Review Fluids, 7, 114609, https://doi.org/10.1103/physrevfluids.7.114609, 2022. a, b, c
Narasimhan, G., Gayme, D. F., and Meneveau, C.: An extended analytical wake model and applications to yawed wind turbines in atmospheric boundary layers with different levels of stratification and veer, J. Renew. Sustain. Ener., 17, https://doi.org/10.1063/5.0251305, 2025. a, b, c, d
Neuhaus, L., Berger, F., Peinke, J., and Hölling, M.: Exploring the capabilities of active grids, Exp. Fluids, 62, 130, https://doi.org/10.1007/s00348-021-03224-5, 2021. a
Neunaber, I., Hölling, M., Whale, J., and Peinke, J.: Comparison of the turbulence in the wakes of an actuator disc and a model wind turbine by higher order statistics: A wind tunnel study, Renew. Energ., 179, 1650–1662, https://doi.org/10.1016/j.renene.2021.08.002, 2021. a, b
Öztürk, B., Hassanein, A., Akpolat, M. T., Abdulrahim, A., Perçin, M., and Uzol, O.: On the wake characteristics of a model wind turbine and a porous disc: Effects of freestream turbulence intensity, Renew. Energ., 212, 238–250, https://doi.org/10.1016/j.renene.2023.05.002, 2023. a
Pierella, F. and Sætran, L.: Wind tunnel investigation on the effect of the turbine tower on wind turbines wake symmetry, Wind Energy, 20, 1753–1769, https://doi.org/10.1002/we.2120, 2017. a
Pope, S. B.: Turbulent flows, vol. 20, Cambridge University Press Cambridge, https://doi.org/10.1017/cbo9780511840531, 2000. a
Prasad, A. K.: Stereoscopic particle image velocimetry, Exp. Fluids, 29, 103–116, https://doi.org/10.1007/s003480000143, 2000. a
Purohit, S., Sun, H., Sciacchitano, A., and Yu, W.: Supporting data belonging to publication “Wind tunnel study of porous discs subjected to veered inflow”, 4TU Research Data [data set] and [code], https://doi.org/10.4121/e38ae0af-860a-46f0-85af-f384f3cd7d34, 2025. a
Rajasekara Babu, K., Hu, G., Noack, B. R., and Kwok, K.: From active grids to fan-array wind generators: A review of turbulence generation, control, and artificial intelligence integration in wind tunnels, Phys. Fluids, 37, https://doi.org/10.1063/5.0279910, 2025. a
Rolin, V. F. and Porté-Agel, F.: Experimental investigation of vertical-axis wind-turbine wakes in boundary layer flow, Renew. Energ., 118, 1–13, https://doi.org/10.1016/j.renene.2017.10.105, 2018. a
Sanchez Gomez, M. and Lundquist, J. K.: The effect of wind direction shear on turbine performance in a wind farm in central Iowa, Wind Energ. Sci., 5, 125–139, https://doi.org/10.5194/wes-5-125-2020, 2020. a
Santoni, C., Carrasquillo, K., Arenas-Navarro, I., and Leonardi, S.: Effect of tower and nacelle on the flow past a wind turbine, Wind Energy, 20, 1927–1939, https://doi.org/10.1002/we.2130, 2017. a
Sathe, A., Mann, J., Barlas, T., Bierbooms, W., and Van Bussel, G.: Influence of atmospheric stability on wind turbine loads, Wind Energy, 16, 1013–1032, https://doi.org/10.1002/we.1528, 2013. a
Schottler, J., Bartl, J., Mühle, F., Sætran, L., Peinke, J., and Hölling, M.: Wind tunnel experiments on wind turbine wakes in yaw: redefining the wake width, Wind Energ. Sci., 3, 257–273, https://doi.org/10.5194/wes-3-257-2018, 2018. a, b, c
Schulz, C., Letzgus, P., Lutz, T., and Krämer, E.: CFD study on the impact of yawed inflow on loads, power and near wake of a generic wind turbine, Wind Energy, 20, 253–268, https://doi.org/10.1002/we.2004, 2017. a
Sciacchitano, A. and Wieneke, B.: PIV uncertainty propagation, Meas. Sci. Technol., 27, 084006, https://doi.org/10.1088/0957-0233/27/8/084006, 2016. a, b, c
Sforza, P., Stasi, W., Smorto, M., and Sheerin, P.: Wind turbine generator wakes, in: 17th Aerospace Sciences Meeting, AIAA, 1979–113, https://doi.org/10.2514/6.1979-113, 1979. a
Shapiro, C. R., Gayme, D. F., and Meneveau, C.: Generation and decay of counter-rotating vortices downstream of yawed wind turbines in the atmospheric boundary layer, J. Fluid Mech., 903, R2, https://doi.org/10.1017/jfm.2020.717, 2020. a
Siemens Gamesa: First Siemens-Gamesa 14.7 MW turbine stands at Moray West offshore wind farm, OffshoreWind.biz, https://www.offshorewind.biz/2024/04/22/first-siemens-gamesa-14-7-mw-turbine-stands-at-moray-west-offshore-wind-farm/ (last access: 6 August 2025), 2024. a
Simley, E., Fleming, P., and King, J.: Design and analysis of a wake steering controller with wind direction variability, Wind Energ. Sci., 5, 451–468, https://doi.org/10.5194/wes-5-451-2020, 2020. a
Steiros, K. and Hultmark, M.: Drag on flat plates of arbitrary porosity, J. Fluid Mech., 853, R3, https://doi.org/10.1017/jfm.2018.621, 2018. a
Theunissen, R. and Worboys, R.: Near-wake observations behind azimuthally perforated disks with varying hole layout and porosity in smooth airstreams at high Reynolds numbers, J. Fluid. Eng., 141, 051108, https://doi.org/10.1115/1.4041614, 2019. a
Van Ulden, A. P. and Holtslag, A. A.: Estimation of atmospheric boundary layer parameters for diffusion applications, J. Appl. Meteorol. Clim., 24, 1196–1207, https://doi.org/10.1175/1520-0450(1985)024<1196:eoablp>2.0.co;2, 1985. a
Vinnes, M. K., Gambuzza, S., Ganapathisubramani, B., and Hearst, R. J.: The far wake of porous disks and a model wind turbine: Similarities and differences assessed by hot-wire anemometry, J. Renew. Sustain. Ener., 14, https://doi.org/10.1063/5.0074218, 2022. a, b
Vinnes, M. K., Neunaber, I., Lykke, H.-M. H., and Hearst, R. J.: Characterizing porous disk wakes in different turbulent inflow conditions with higher-order statistics, Exp. Fluids, 64, 25, https://doi.org/10.1007/s00348-022-03565-9, 2023. a
Vollmer, L., Steinfeld, G., Heinemann, D., and Kühn, M.: Estimating the wake deflection downstream of a wind turbine in different atmospheric stabilities: an LES study, Wind Energ. Sci., 1, 129–141, https://doi.org/10.5194/wes-1-129-2016, 2016. a, b, c, d, e, f
Walter, K., Weiss, C. C., Swift, A. H., Chapman, J., and Kelley, N. D.: Speed and direction shear in the stable nocturnal boundary layer, J. Sol. Energ., 131, https://doi.org/10.1115/1.3035818, 2009. a
Wu, S., Archer, C. L., and Mirocha, J. D.: New insights on wind turbine wakes from large-eddy simulation: Wake contraction, dual nature, and temperature effects, Wind Energy, 27, 1130–1151, https://doi.org/10.1002/we.2827, 2024. a
Wurps, H., Steinfeld, G., and Heinz, S.: Grid-resolution requirements for large-eddy simulations of the atmospheric boundary layer, Bound.-Lay. Meteorol., 175, 179–201, https://doi.org/10.1007/s10546-020-00504-1, 2020. a
Xie, S. and Archer, C. L.: A numerical study of wind-turbine wakes for three atmospheric stability conditions, Bound.-Lay. Meteorol., 165, 87–112, https://doi.org/10.1007/s10546-017-0259-9, 2017. a, b
Xu, G., Sciacchitano, A., Ferreira, C., and Yu, W.: On the unsteady aerodynamics of a surging airfoil at 90° incidence, Exp. Fluids, 66, 1–22, https://doi.org/10.1007/s00348-025-04011-2, 2025. a
Zong, H. and Porté-Agel, F.: A point vortex transportation model for yawed wind turbine wakes, J. Fluid Mech., 890, A8, https://doi.org/10.1017/jfm.2020.123, 2020. a
- Abstract
- Introduction
- Experimental method
- Results and discussion
- Limitations of the experimental setup and future work
- Conclusions
- Appendix A: Flow characterization in lateral and horizontal planes
- Appendix B: Spanwise and vertical velocity fields
- Appendix C: Comparison of a simple advection model with the measurements
- Code and data availability
- Author contributions
- Competing interests
- Disclaimer
- Acknowledgements
- Financial support
- Review statement
- References
- Abstract
- Introduction
- Experimental method
- Results and discussion
- Limitations of the experimental setup and future work
- Conclusions
- Appendix A: Flow characterization in lateral and horizontal planes
- Appendix B: Spanwise and vertical velocity fields
- Appendix C: Comparison of a simple advection model with the measurements
- Code and data availability
- Author contributions
- Competing interests
- Disclaimer
- Acknowledgements
- Financial support
- Review statement
- References