
the Creative Commons Attribution 4.0 License.
the Creative Commons Attribution 4.0 License.
 | 24 Sep 2026
Economic and design optimization of a 15 MW floating offshore wind platform using time series forecasting

Victor Benifla
José Cândido
Luís M. C. Gato
A structural and economic optimization framework applicable to floating semi-submersible platforms, demonstrated here for a 15 MW offshore wind design, is presented. A genetic algorithm was developed that can seek a multi-objective solution to minimize mass whilst respecting the constraints of loads acting upon the system. Statistical and machine learning methods are then employed to forecast short- and long-term costs of the platform under a range of exogenous data scenarios, selected to support and boost forecasting accuracy alongside a hybrid forecasting method. Steel mass was reduced from 3916 to 3273 t whilst respecting platform response constraints. The uncertainty in steel prices has the most significant impact on CAPEX, approximately EUR 150–200 million at the 1 GW level. Levelized cost of energy (LCoE) is calculated to gauge the technical and economic viability, with EUR 3–5 MW h−1 variation across forecasts.
- Article
(3564 KB) - Full-text XML
-
Supplement
(1633 KB) - BibTeX
- EndNote


The deployment of floating wind turbines (FOWTs) into deeper waters can harness improved wind resources with reduced marine competition and visual impacts. Floating technology has grown rapidly since the first full-scale prototype in 2009 (Skaare et al., 2015), with pre-commercial status achieved in 2017 (Jacobsen and Godvik, 2021), 50 MW in 2021 (Risch et al., 2023) and 88 MW in 2023 (Musial et al., 2023), but growth has since stagnated. Costs have increased in the recent macroeconomic context and must decrease to achieve commercial gigawatt-level capacities (DNV, 2023). Areas of cost reduction potential should be prioritized, including the floating substructure (Barter et al., 2020). Floating offshore wind (FOW) levelized cost of energy (LCoE) must reduce to compete in auctions against other renewable energy technologies.
This cost problem offers space for innovative solutions across three main platform areas: dimensions, cost and type of materials, and matching the design to site conditions. There are currently four main designs of support structure which are yet to standardize like fixed offshore wind monopiles and jacket foundations. Barges allow concrete construction and can dampen wave action and heave floater motions (Beyer et al., 2015). Tension-leg platforms (TLPs) transfer loads to the taut mooring and anchoring system, lowering platform mass. Spars are ballast-stabilized and have a simplified cylindrical design and higher draft. Semi-submersibles are buoyancy-stabilized with a wider platform which can operate in shallower waters. High volumes of steel allow for geometry reductions to the structural steel components, namely the inner column, outer columns, pontoons, and upper supports. This is true for reference platforms that offer valuable standardized designs for research and technology progression and provide a conservative layout, akin to prototype projects to ensure reliability.
Market prices for key raw materials like steel have witnessed high volatility in recent years, impacting CAPEX and project viability. Methods to accurately predict future prices would reduce risk and improve strategic planning for developers, especially for forecasts' accurate initial feasibility to final investment decision (FID) and procurement. Among these, time series forecasting (TSF) models using statistical and machine-learning methods offer solutions by looking at historical data to make future predictions.
This work implements TSF models to achieve a mass-minimized platform design by predicting commodity prices for the primary steel mass for strategic planning. A structural optimization will iterate within the design space and defined boundary constraints. The platform structural dynamic response in six degrees of freedom is examined using RAFT (Hall et al., 2022) to maintain stability under a range of environmental load conditions. Price forecasts will be obtained using TSF models to achieve a mass-optimized platform CAPEX under a range of cost scenarios. The reference IEA 15 MW wind turbine (Gaertner et al., 2020) and UMaine reference Volturn-US-S (V-US) platform (Allen et al., 2020) are used.
2.1 Floating platform: design, frequency response, and optimization
2.1.1 Support structure design
The main engineering challenge for FOW is maintaining stability in the marine environment whilst generating electricity. Nacelle motion, wave sensitivity, and the mooring system footprint are outlined by Butterfield et al. (2007) and highlight how these challenges have already been overcome in the oil and gas industry. These challenges necessitated the development of frequency-domain codes that enabled rapid structural assessment across multiple design iterations. They condensed designs into ballast, buoyancy, and tension stabilization, noting that in practice designs are hybrid, and an optimal point may lie between each type. Serial production in high volumes and onshore assembly were also found to offer economic benefit. Concept and deployed semi-submersibles alongside numerical simulation tools were reviewed by Liu et al. (2016) and confirmed the same design classifications, and its design simplicity and maturity justify its selection in this study.
Due to the complexity and cost of sea testing, numerical modelling such as the frequency-domain codes utilized in this research are preferable for dynamic response studies. The 15 MW wind turbine follows other reference designs (Bak et al., 2013; Jonkman et al., 2009) and encompasses a three-bladed rotor, Class IB direct-drive generator, variable-speed and collective pitch controller, a rotor diameter of 240 m, and a hub height of 150 m. The turbine is designed for a fixed monopile foundation but has considerations and applicability for FOW and follows the trend of using fixed offshore wind turbines with thicker towers. The V-US floater (Allen et al., 2020) is aligned for larger 15 MW turbines. A steel platform connects three outer columns and pontoons to a central column that interfaces with the tower. All significant geometric values and coordinates allow design integration within numerical models for analysis, such as those employed in this study.
As turbines increase in size offshore, scaling laws are important to model the impact of larger generators on platform size, with a smaller increase in platform size supporting larger generators, improving LCoE. The study by Papi and Bianchini (2022) found ballasted mass increased by a factor of 1.3 for a tripling of power rating from 5–15 MW. The generic upscaling methodology to transfer a FOW turbine geometry from 5–15+ MW was proposed by Wu and Kim (2021), analysing the effects of changes to the column radius and floating base, which are also used in this research. Results showed that upscaling the column radius increased the overall mass and natural heave period, whilst upscaling the column distance raised the centre of gravity and metacentric height of the system, with a slight lowering of the natural heave period that is important for semi-submersible designs. These issues can be minimized through added ballast mass to lower the centre of gravity and increased added mass to raise the natural heave period. Ballast was maintained constant within this study to focus on the impact of structural steel changes.
2.1.2 Numerical models
All structural, aerodynamic, and hydrodynamic loads should be considered when modelling the response behaviour of a floating turbine. A study by Wayman et al. (2006) investigated joining the structural and aerodynamics of the time-domain FAST with the numerical code of WAMIT for FOW systems in depths ranging from 10–200 m. Coupled loads include the gyroscopic motion of the rotor on the system and forces from wave excitation. Modelled motions were found to be acceptable with changing water depth and wind speed.
The FAST model developed by the National Renewable Energy Laboratory (NREL) models the coupled response of floating wind turbines under realistic ocean conditions, validated with the Statoil-Hywind 2.3 MW demonstrator FOWT (Driscoll et al., 2016). With metocean measurements' main input variables, the overall response of the platform and loads agreed well with measured data and validated the model's performance for the spar structure. For computationally efficient design optimization in FOW, the Response Amplitude of Floating Turbines (RAFT) code looks to the full integrated system (Hall et al., 2022). Co-design of the support structure, turbine, and controller are modelled in the frequency domain for added computational efficiency and design improvements. Three reference FOW designs were modelled and were compared with OpenFAST simulations. The dynamic response spectra and statistics performed well and within an acceptable range that verified the model's application to FOW studies. A review of modelling techniques for floating offshore wind turbines (Otter et al., 2021) reiterated the challenge of strong coupling of the turbine aerodynamics and platform hydrodynamics. It highlights the move towards high-fidelity modelling due to the cost and complexity of physical testing, although not necessarily with computational fluid dynamics (CFD) due to long simulation times. The paper concludes that numerical modelling is a trade-off between accuracy and computational efficiency and that many numerical models require improvement, with CFD an option towards the end of the design phase. Physical testing can validate and calibrate numerical models and can be classed into full physical and hybrid testing, with the choice often down to phase, facilities, budget, and test uncertainties. A 3D finite-element analysis (FEM) model for FOW support structures (Campos et al., 2017) argued that common tools ignore the structural stiffness of the elements constituting the floating platform and are normally treated as rigid bodies. Flexibility was found to be crucial in structural lifetime analysis, and this paper proposes a model to integrate the deformation of the structure within a fully coupled hydro-aero-servo-elastic time-domain model. In the study presented here, computational efficiency is critical, and a flexible-body finite-element model is not the main focus. Multiple design variants and load cases that impact the overall platform dynamics and system response would make a detailed structural assessment unfeasible at this stage.
2.1.3 Design optimization
The design optimization solves for an objective function such as platform mass by adjusting geometrical parameters whilst adhering to specified constraints. A complex reliability-based framework of a spar-type FOW support structure (Leimeister and Kolios, 2021) coupled economic efficiency with design uncertainties. Environmental conditions, limits, and uncertainties were specified and a reliability assessment defined which generated a response surface for various system geometries. The method met all constraints including the reliability criteria and reduced platform and ballast mass. A software framework for a 22 MW semi-submersible FOW platform (Zalkind and Bortolotti, 2024) was developed for the matching reference wind turbine. Various fidelity levels and load cases were evaluated for controller adjustment, plus the difference between sequential and simultaneous co-design. A pre-optimization algorithm is proposed to explore the design space, demonstrating that solving smaller problems sequentially is more effective than using a large, simultaneous co-design approach. Notwithstanding a more robust and reliable outcome, the simultaneous solution was found to produce a platform with 2 % lower mass, and therefore a trade-off between advantageous results and reliability is required. The current research also features a sequential optimization for design, system load response, and economic analysis and similar system mass reduction results. An efficient optimization tool for floating offshore wind support structures (Faraggiana et al., 2022) highlights the need for economic competitiveness through a reduction in the platform weight and therefore structural cost, matching the objectives of this paper with the same optimization method, albeit for a different platform. An optimization tool applicable to any floating turbine is proposed that adjusts the geometry, in this case the OC3 spar-type design. The stability and dynamic performance were evaluated and optimized using a genetic algorithm (GA) coupled with a surrogate model to both minimize cost and maximize performance. Cost reductions across the best and worst cases of a factor of 2–3 were found, with a 25 % cost decrease between the most and least restrictive optimal cases. Hydrostatic constraints were found to be more significant than dynamic ones due to influencing the design area.
The genetic algorithm is a useful tool which simulates natural reproduction and the fitness of certain populations to combine attributes and produce better offspring which help to achieve the objective function, allowing multi-objective analysis and design space visualization. This makes GAs ideal for optimizing complex systems, such as FOW substructure designs, where optimization involves different design variables, complex numerical models, and non-linear constraints and reinforces the choice of optimization method in this study, involving multiple designs and load cases within a constrained optimization.
A global optimization tool identified and evaluated the configuration of support structures for FOW (Hall et al., 2012). The rationale highlighted the nascent stage of FOW optimization and the complex nature of FOW system interactions in multiple mediums that inhibit the convergence of designs. Also, geometrical optimization has previously omitted key design parameters, which drives the need for a flexible GA approach. Results show designs similar in nature to established spar and semi-submersible configurations, with others less conventional, and lead to the selection of the RAFT tool used within this work. A GA framework was developed (Hall et al., 2013) to optimize the support structure for FOW using a nine-variable parameterization, which is equal to the method employed in the current research. This broadened the design space beyond the state of the art, which relied on a frequency-domain dynamics model with linearized forces that captured the physical effects acting on the turbine and support structure while remaining computationally efficient. The choice of GA allowed a visualization of the design space and Pareto front that showed optimal design choices, through minimization of both the support structure cost and the root mean square error (RMSE) of nacelle acceleration.
2.2 Economic analysis: costs, LCoE, and forecasting methods
2.2.1 Costs and LCoE
Feasibility of FOW (Musial et al., 2004) showed a technical description of several floating platforms classed by mooring system, especially between contrasting catenary and taut vertical systems. A cost comparison was made between a semi-submersible and an NREL TLP, both supporting a 5 MW turbine. Production costs for the semi-submersible reduced by 40 % under structural optimization. Such reductions build the case for structural optimization and its impact on LCoE. Lifecycle LCoE perspective by Myhr et al. (2014) provided a detailed cost assessment of the main discussed structures. Mass-based calculations utilized in this research were derived alongside the cost of mooring and anchoring systems, with depth and distance to shore found to drive LCoE. High economic variability was found of designs, as well as the potential for cost reduction. Further work recommends progression of cost calculations to include scale effects for mass-produced components and tailoring components and system design to site conditions, reflected in this research through varying load conditions.
A systems engineering vision for FOW optimization (Barter et al., 2020) identified gaps to reduce the LCoE, mainly through a system-integrated approach to capture complex interactions and physics across the lifecycle of a FOW farm. A range of cost-reduction research areas were outlined, including new hybrid substructures, anchoring methods, two-bladed and/or downwind rotors, alternative materials, and FOW-specific controls. These cost reductions are realized through a combination of economy of scale (EoS) effects, improved learning rates, and design optimization through research. FOW high-potential areas were defined by James and Ros (2015), with the floating platform highest, with a 16 % reduction in CAPEX from prototype to commercial scale, again reinforcing the focus on platform optimization.
2.2.2 Time series forecasting
Forecasting of time series data, observations made sequentially though time, is crucial in the areas of science, industry, commerce, and economics (Chatfield, 2000). It can consist of forecasting just one time series or a group of either separate forecasts or grouped data which support one forecast, as presented here. A variety of predictive regressive models can perform this task, with machine learning models able to capture complex patterns and statistical models capturing seasonal and longer-term trends. A seasonal autoregressive model with exogenous variables (SARIMAX) forecasted short-term electricity load in Tarsitano and Amerise (2017) and managed accurate predictions through dynamic regression for a shorter time frame of multiple days. Residuals de-trend the data and were supported by external (exog) hourly loads and calendar effects. An eXtreme Gradient Boosting algorithm (XGB) used by Zhang et al. (2023) predicted energy and peak power for 1–3 years. Multi-step forecasting, which includes recursive and sequential training, was employed to measure accuracy and stability. Hybrid combinations of these models capture the benefits of each to produce accurate future predictions, as utilized in this work.
The platform's steel shell costs are susceptible to market prices of primary and secondary steel, which have been highly variable in recent years (Albulescu, 2021), especially after a global pandemic. Forecasts must be statistically sound and predicted with the highest possible confidence. For specific commodity price forecasts, there is already research within statistics, machine learning, deep learning, and neural networks that has been applied to the platform materials studied in this work, namely steel. A method by Wang et al. (2020) into neural networks used a long short-term memory with exog features with success in predicting trends over recurrent neural networks. The one-dimensional time series was restacked to enable period correction of seasonal features by calculating and grouping data residuals as employed in the SARIMAX forecasts in this work.
Steel prices were forecasted by Jin and Xu (2024) using Gaussian process regressions. The model was trained using cross-validation and Bayesian optimizations, resulting in a low root mean square error (RMSE) of 0.54 % between 2019 and 2021. Due to the structured data of most time series, machine learning and statistical models usually outperform more complex methods over longer time frames, with both methods used within this research. Accurate time series forecasting could help inform procurement strategies and auction bids as well as aid investor confidence with lower risk. But care must be taken in model accuracy to ensure they are robust and to prevent access to actual data in the predictions during testing. This research has not been thoroughly applied within the context of steel for floating wind and presents a promising study area to explore.
This work can be divided into two main areas: first, the platform mass minimization that is a combination of RAFT and a GA, which delivers a minimized mass that satisfies the overall constraints of the simulation. Second, an economic assessment of the floating platform was conducted using predictive models of future steel prices. Generalized project costs and power generation are then used to calculate the final LCoE over a range of future years to help strategize future floating offshore wind procurement.
3.1 Model for platform response and design optimization
The design of the V-US platform is composed of one central and three outer columns linked through pontoons and upper supports. Here, the design variables are continuous real values and defined as the main platform diameter (D); the centre and outer columns diameters (dcc, doc); and the height, width, and thickness of the pontoon (hpo, wpo, tpo). Parametrization is highlighted in Fig. 4b. Any other design parameters for the substructure, mooring system, or turbine remain fixed with values from the base model.
The objective of this design optimization problem is to minimize the total mass while ensuring its dynamic performance. The FOWT system is evaluated in terms of dynamic responses under a reduced set of load cases. While the environmental conditions in this study are not site-specific, they were selected based on experience values and previous design optimization studies (Dou et al., 2020) to represent typical conditions that need to be assessed for the development of FOWT substructures according to standards. Typically, these must include the rated wind speed of the rotor and harsh sea states to represent worst-case scenarios. Additionally, the three representative environmental conditions are chosen to reflect typical values for rated mean wind speed and sea state encountered in Europe, as seen in Messmer et al. (2023). It is also worth noting that there is no wind–wave misalignment and that the mean wind force is normal to the rotor plane.

In this design optimization study, the dynamic performance of the FOWT system is evaluated with constraints on specific aspects of the platform response and turbine behaviour. The maximum platform offset, the platform pitch, and the nacelle acceleration at the top of the tower in the wind direction are constrained, ensuring these values remain within acceptable limits. Finally, the fore–aft bending moment at the tower base and the static stress at the location at the interface between the central column and the pontoons are also considered and limited as they represent the stress that can be transferred to the substructure and is commonly limited in design. The values of each of these constraints are computed for each defined load case, and the maximum result across all cases is selected to be checked against the constraint limits of the optimization problem. Defining these constraint limits to accurately represent real-world conditions can be challenging, so they are often set to general values based on experience. This approach is also applied here, supported by insights from previous optimization and simulation studies and other publicly available models of the V-US.
The main inputs for the design optimization study presented here are gathered and summarized in Table 1. Due to the inherent randomness of GAs, the design optimization problem is run 10 times to collect statistical results from multiple optimization runs and properly assess the results and efficiency. For each run, the population starts at 100 individuals, and the maximum number of generations is capped at 1000 for a reasonable amount of evaluation for this large design space.
3.1.1 Platform response
The main objective is the mass minimization of a 15 MW semi-submersible platform. The design optimization framework presented in Benifla and Adam (2023) was applied to the V-US substructure mounted with the IEA 15 MW reference offshore wind turbine (Gaertner et al., 2020). In this study, the Response Amplitude of Floating Turbines (RAFT) open-source code is used to model the FOWT system in the frequency domain and evaluate its static properties and dynamic response. The code has been validated against higher-fidelity tools such as OpenFAST and has shown good agreement while also being computationally efficient. This makes it an ideal choice for quickly evaluating various substructure designs under different environmental conditions (Hall et al., 2022).
In RAFT, the FOWT system is modelled as a rigid body with the common six degrees of freedom: surge, sway, heave, roll, pitch, and yaw. The dynamics are represented in the frequency domain, allowing the FOWT system to respond linearly to each excitation frequency. The complex amplitude of the system's response, X, at a given frequency ω is obtained by solving the generic equation of motion for the FOWT system:
where M, B, and K represent the FOWT system's total mass, damping, and stiffness matrices, respectively; Fext the external excitation forces; and ω the frequency. The frequency-domain dynamics of the FOWT are assumed to operate around a specific position, , which represents the mean steady state of the system. This position is obtained by solving iteratively the static equilibrium equation derived from the previous equation:
where represents the mean external forces applied to the system, is the nonlinear reaction force of the mooring system (the effective mooring stiffness), and Kh is the total hydrostatic stiffness.
In RAFT, the system can be evaluated under given environmental conditions defined by steady winds and stochastic sea states, characterized by a mean wind speed Ws and a JONSWAP wave spectrum with significant wave height Hs and peak period Tp. The rotor–nacelle assembly is modelled as a rigid body with three identical blades and specific dimensions (chord, twist angle, and prebend) and distributed aerodynamic properties (lift and drag coefficients). The tower is defined as a cylindrical member and the floating substructure as a combination of interconnected members of different shapes, with mass, inertia, buoyancy, and hydrostatic stiffness obtained by summing individual contributions. Mean aerodynamic loads are computed using a steady-state blade-element momentum solver, while mooring forces are determined with a quasi-static solver. Stochastic events including turbulent wind fields, gusts, and extreme waves are of importance to aerodynamic and hydrodynamic loads acting on the system but are time-domain phenomena, incompatible with the frequency-domain RAFT tool employed and the large number of design iterations and integration with the GA. The system's fast frequency response is obtained by linearizing the dynamic equations, accounting for rotor aerodynamics and hydrodynamic damping based on Morison's equation applied to discretized substructure strips. Finally, RAFT computes the FOWT's mean offset and frequency-domain response, with maximum values estimated by combining the mean values and the complex response spectra. The maximum platform offset and other key quantities of interest – such as the tower-top nacelle acceleration and the tower-base bending moment in the fore–aft – can be obtained. Different load cases can be defined to represent a range of wind and wave conditions based on the International Electrotechnical Commission (IEC) design load cases (DLCs), enabling a comprehensive evaluation of the system's dynamic response under various environmental scenarios.
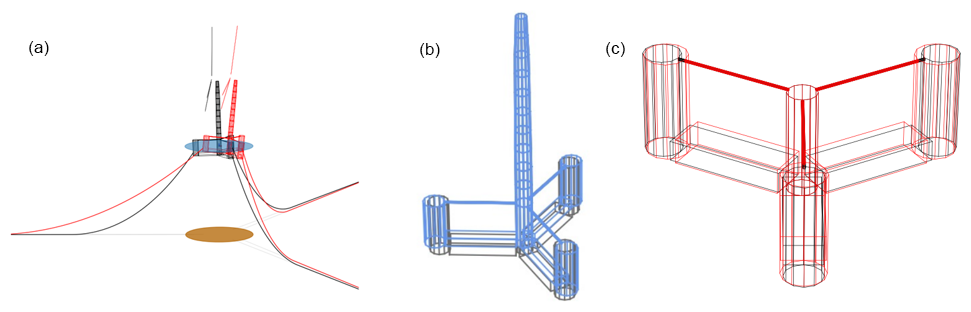
Figure 1(a) RAFT model of the floating wind turbine in a static position and maximum offset. (b) Optimal system including tower. (c) Optimized semi-submersible platform design.
A static stress analysis is performed to assess the structural integrity of potential designs. In this analysis the focus is at the interface between the central column and pontoon. To estimate the loads, a free-body approach is followed, where the contributions of both the outer column and the pontoon itself are considered. Only structure weight and the buoyancy loads inducing moments on the structure interface are considered here. The stress σ on the pontoon base is
where M is the total bending moment, and hpo and Ipo are the height and second moment of area of the pontoon section.
3.1.2 Design optimization
The main objective is to reduce the steel mass of the V-US platform under several constraints to account for the dynamic of the system. For a given design solution, represented by x, the constrained single-objective optimization problem can be as follows.
Minimize
then subject to
where m is the steel mass, XLi and XUi denote the lower and upper limits of the design space, and gj is an inequality constraint with its associated limit gjlim. These constraints are typically the output of the numerical analysis previously described that is monitored and constrained.
To solve, an efficient GA is implemented and inspired by Hall (2012). This was applied to FOWT substructure design and addresses limitations of traditional evolutionary algorithms by identifying local optima and avoiding unnecessary problem evaluations. A distance-weighted scaling operation is performed to ensure that each local optimum identified within the population is treated equally. Throughout the optimization, the fitness of the entire population is scaled, leading to the total scaled population fitness as described in Hall (2012). This is combined with a constraint-handling technique used by Deb (2000) allowing infeasible solutions to be compared solely based on their total constraint violation. This form of the penalty enables a clear comparison between feasible and infeasible solutions, allowing the GA to handle constraints effectively.
The initial population is generated and evolves by using simulated binary crossover (SBX) and a polynomial mutation operation, originally introduced in Deb and Agrawal (1995). These efficient operators are widely used to address real-valued optimization problems. After new offspring are generated, they are assessed before being added to the current population. This ensures that they are not overly similar to existing individuals while remaining close to high-performing ones. The check avoids the computational cost of evaluating the problem for individuals not added. This approach is particularly beneficial here, as evaluating the objective and constraint functions requires significant computational resources to run the numerical models described. It also ensures that the population evolves toward fitter regions of the design space, resulting in lower population density in less fit areas. The structure of the framework is shown in Fig. 2 and illustrates the interaction between the GA and the RAFT dynamic model.
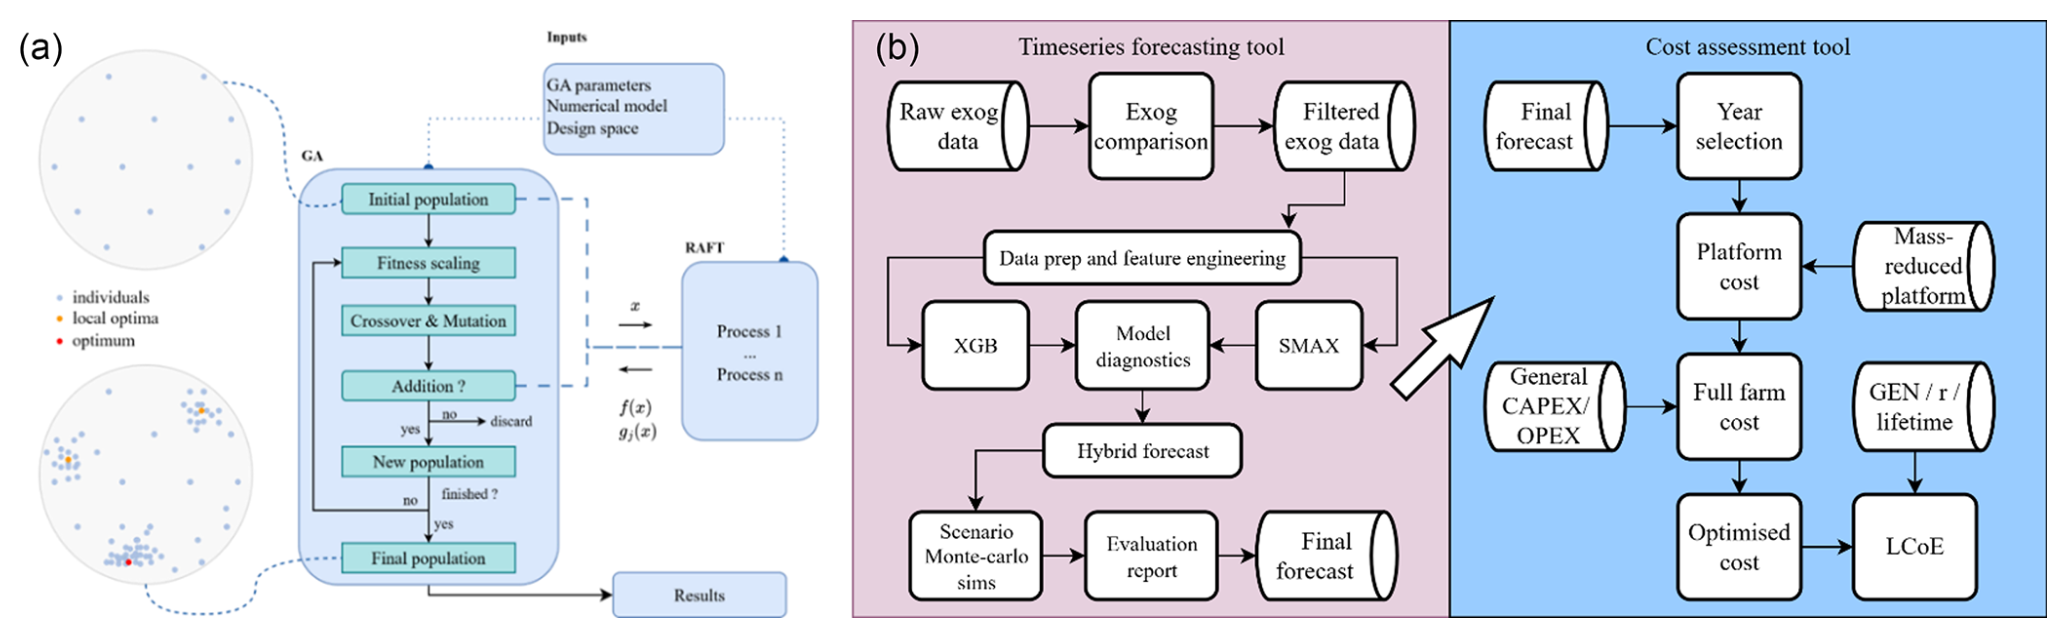
Figure 2Process flow of (a) design optimization. (b) Time series forecasting and cost assessment tool.
3.2 Time series forecasting and economic assessment
After the design optimization of the platform, an economic assessment is applied to the optimal platform and reference design. A range of future costs up to 7 years ahead are forecasted using a combination of forecasting methods. Second, these costs are applied to the final structure to derive a cost at platform and farm level, alongside an LCoE assessment.
3.2.1 Time series forecasting
The price forecasting tool incorporates a combination of models: a short-term XGB which captures stochastics and fluctuation well and a statistical SARIMAX model better at capturing seasonality and long-term trends. The best-performing singular or hybrid version was selected based on rolling hindcast testing windows. Both models rely on exog data that are provided in the form of monthly prices, indices, and other economic metrics. These supporting data are monthly time series of equal shape and granularity to the target predictor (HRC steel prices). They are external to the steel prices themselves but are linked (such as metals with impact on steel, metal indexes, and energy prices, among others), which allows the predictor to build confidence. For the equation, the XGB total objective function Lϕ is
where is the loss function between measured and predicted values, Ω(fk) the regularization term which controls model complexity to reduce overfitting, fk the kth weakest decision tree learner in the group, and k the total number of decision trees.
For the SARIMAX model, finding the future steel price yt when applied to a differenced stationary dataset is
with μ the mean level of series, B the backshift operator defining the lags for non-seasonal (1−B)d and seasonal differencing, ϕ(B) the nonseasonal and Φ(BS) the seasonal autoregressive terms, θ(B) the non-seasonal and Θ(BS) the seasonal moving average, ϵt the error term, and βXt the exog variables. The SARIMAX model simultaneously models the temporal behaviour of the steel prices and the influence of the selected external (exog) economic variables, allowing the prediction to be influenced by external market conditions and not just the past influence of steel prices.

Candidate exogs xt, with the top-ranking group shown in Fig. 3, are compared to the target steel prices yt and filtered using statistical comparison metrics r (Eq. 7), with monthly lag testing b (Eq. 8) and rolling stability (Eq. 9):
The best-performing exog datasets which pass multiple checks, including stability, sign, mean strength, and lags, are collected to create an optimum set of suitable supporting data for the forecasts. These are shown in Fig. 3. The x axis shows the publication delay applied to the variable (months) and the y axis the memory length (how many observations retained in the model). Red and blue bars show positive and negative trends, and thicker bars represent better performance. Multiple transformations (level, first difference, log-difference), lags, and lengths are tested. Each exog receives a score based on the predictive strength, stability magnitude, and sign consistency. Only those that pass all thresholds and that are ranked the highest are stored in the final data group to boost prediction accuracy. Examples of the exog data passing the cross-correlation analysis with the target steel price are rebar and copper acting as leading indicators, coal, and London Metal Exchange (LME). Such indicators are robust for inclusion into future steel forecasting.
The next phase transforms the exog data into xt, logxt, and Δlogxt, then detrends with residuals where required and ranks for usefulness, stability, and non-redundancy. Features including Δlog(yt−1), Δlog(yt−12), xt−b, and are then added, with b and k the best delay and memory terms, respectively, for the target Δlog(yt). The hybrid forecast combines the XGB and SARIMAX forecasts with two formulations: a weighted linear combination (Eq. 10), with w the weight assigned to XGB, and a horizon-based regime switching method (Eq. 11), with H the threshold horizon separating long and short term (3, 6, … months) and h the forecast horizon in months:
or
The final model is evaluated based on RMSE, mean absolute percentage error (MAPE), and symmetric mean absolute percentage error (sMAPE).
3.2.2 Economic assessment
The forecast monthly steel prices are first aggregated into yearly values and converted to marine-grade steel for platform cost analysis, found from BVG Associates (2025). Only the primary steel mass is impacted by the price forecasts in this study, forming almost the entire cost. Steel is assumed to be purchased in a given year where contracts with the fabricator are agreed, and it is not assumed that all units are purchased in that year.
with the monthly predicted values, ny the number of monthly observations, and s the forecast scenario. Other platform components including secondary steel items, ballast, and controls are costed from the literature as other CAPEX, as they are not the main subject of this study, and primary steel contributes around 83 % of the total platform (BVG Associates, 2025). The platform cost CAPEXplat can be found by
with the price of marine-grade steel, Md the mass of platform design, and Np the number of platforms, omitted for one platform. Total CAPEX is the summation of the platform CAPEX and all other CAPEX. Other wind farm costs are generalized from BVG Associates (2025) to remove site-specific and project bias, with primary steel mass of the platform removed to allow space for the optimized platform. A net capacity factor of 0.4925 that considers all losses including electrical is used for a floating offshore 1 GW wind farm (Beiter et al., 2020), validated with a gross CF of 0.5024 (Martini et al., 2016) to arrive at an LCoE value per year of the forecast. The LCoE result is then incorporated into the modelling framework to evaluate how economic and structural design optimization influence platform cost and the resulting LCoE.
with the total CAPEX for year y, and PVOPEX, PVDECEX, and PVE the present value of OPEX, DECEX, and energy generation, respectively, discounted to present.

Figure 4(a) Evolution of platform mass for multiple runs. (b) Cross-section of substructure and design parameters.
4.1 Platform design
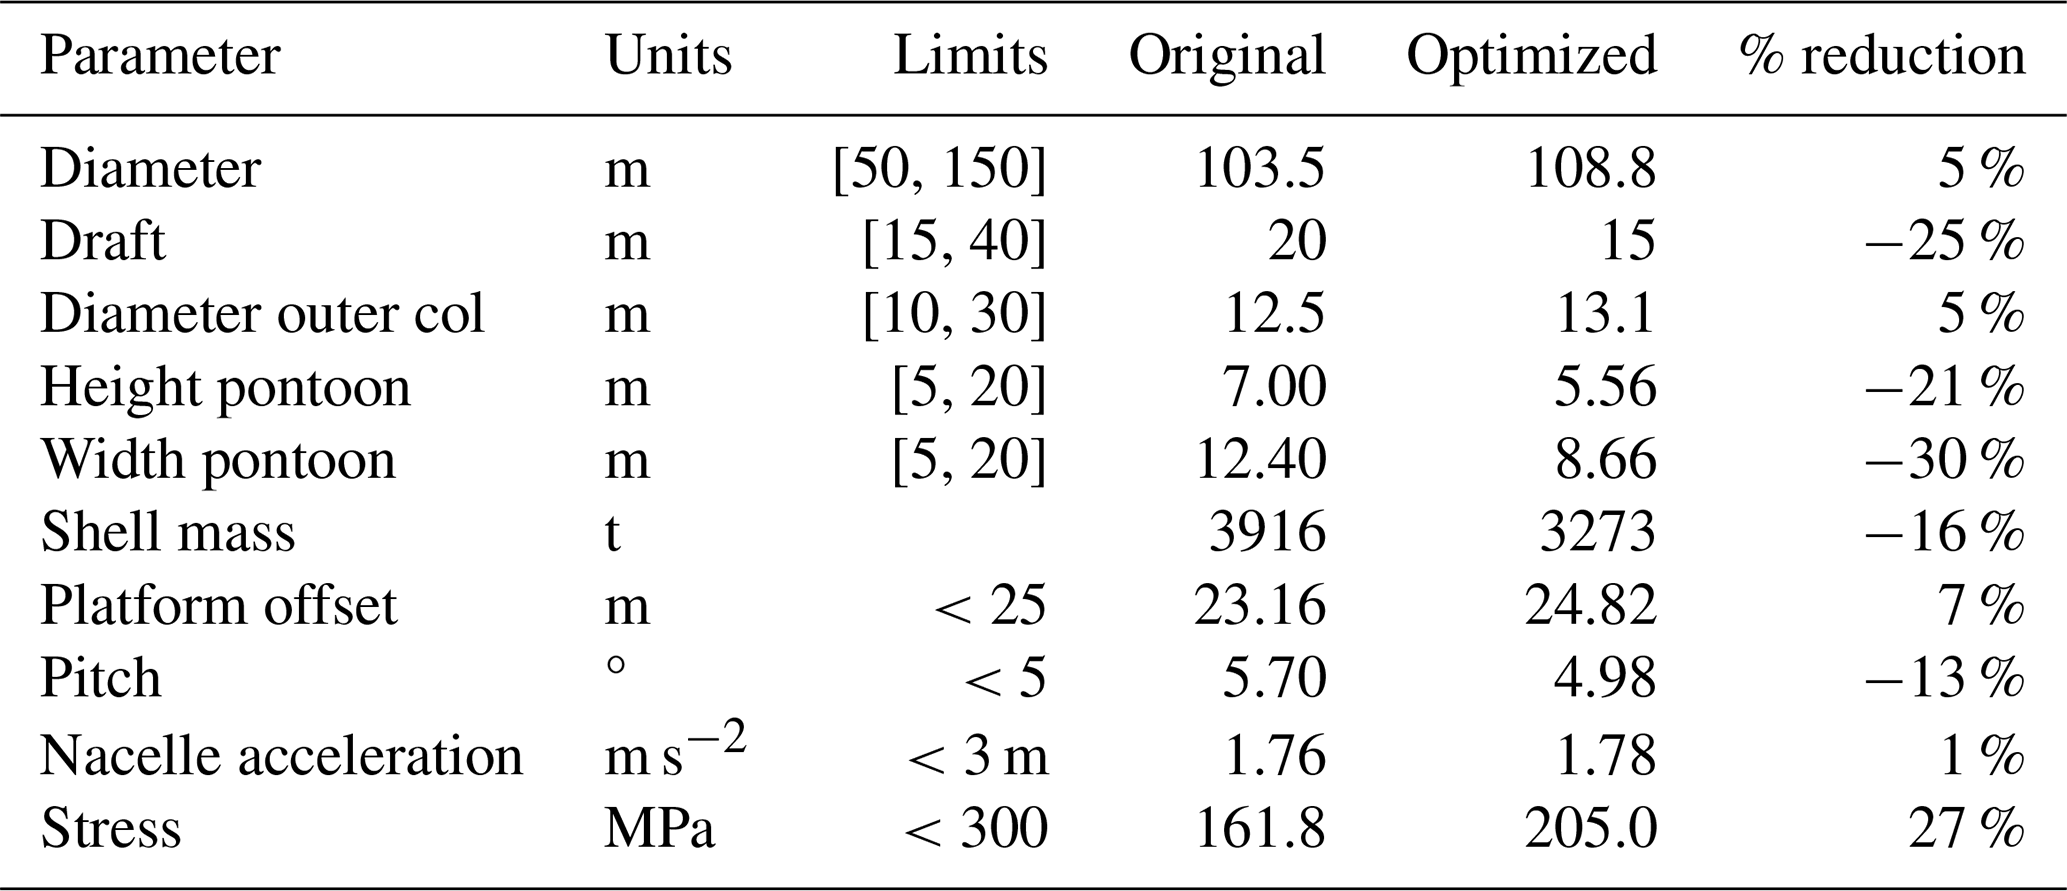
The steel mass evolution of the best individual in the population through its evolution for all the runs is presented in Fig. 4. This shows the algorithm's performance in minimizing the objective while reaching feasible regions of the design space where constraints are respected. The statistical results collected from the 10 optimization runs showed consistent performance, with small standard deviations and some small variation between run outputs. These results also show that the algorithm led to near-optimal solutions in some runs, highlighting the importance of repeated optimization. Out of all the runs, the chosen optimized design is gathered and compared with the base model shown in Fig. 1 (black base, optimized red and blue) and the following Table 2. The least successful design is chosen for the rest of this work so that it constitutes a safety margin that encapsulates some of the aspects neglected here. As expected, the mass is minimized while keeping the dynamic behaviour of the system as well as its structural integrity. The optimized mass obtained can be considered quite low when compared to the original, but this is anticipated as the structural check of potential designs is relatively simple here and lacks more in-depth analysis of the structure behaviour in terms of dynamic stress analysis. Mainly the optimized design exhibits slightly larger outer columns and pontoon dimensions but with a smaller platform diameter. Indeed, the design optimization work presented here allows for a first optimized design that can be considered in the subsequent economic analysis. For further detailed analysis, one could consider other environmental analysis design space and enhance structural analysis to reach more confidence in the final optimized design.
4.2 Time series forecasting
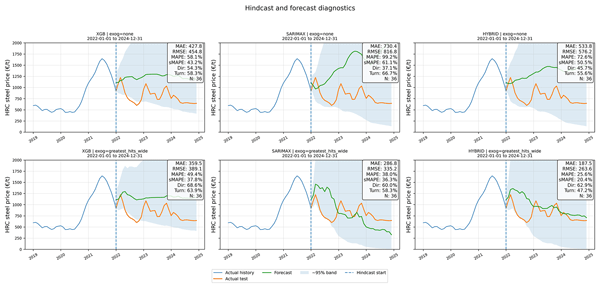
The XGB, SARIMAX, and hybrid forecasts are shown in Fig. 5 for the model tested on hindcast data, running sequentially for 3-year phases. Model performance over the testing period 2022–2024, a period of high market fluctuation, improves with both hybrid forecasts and with the addition of exog data. Without supporting exog data to boost the prediction accuracy, the predicted values remain above actual prices and do not revert to the mean, with the price floor now raised due to the observed price spike in 2020, and cannot be considered a reliable baseline forecast. With exog supporting data, the SARIMAX forecast shows continual decay in response to the 2022 price drop, showing a negative systematic price prediction bias. The hybrid model, selecting the best option for each predictor step, also adds accuracy to the model. The best-performing exog supporting data (including other metals, indexes, and indicators, collected into the greatest hits collection of supporting data) produce the best testing results, with a mean absolute error (MAE) of 187.5, show the model's improvements when adding support and blended forecasting, and present a suitable candidate for future baseline scenarios.
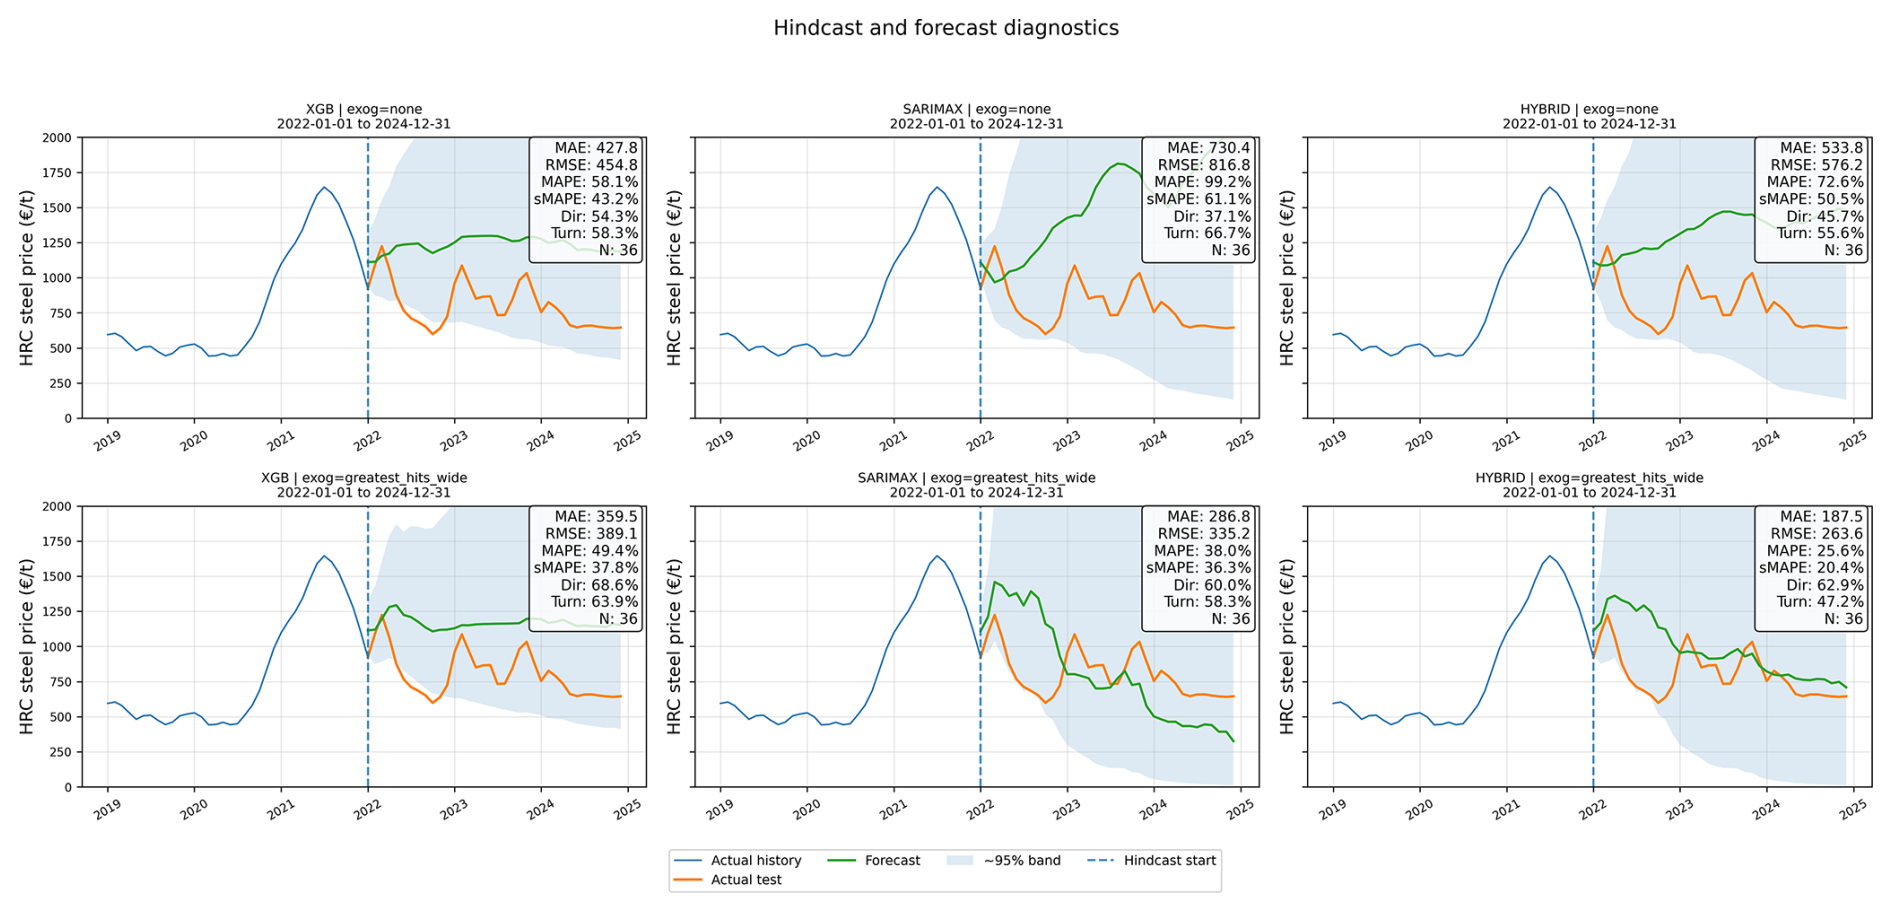
Figure 5Hindcast diagnostics of real and forecasted data for varying models and exogenous supporting data.
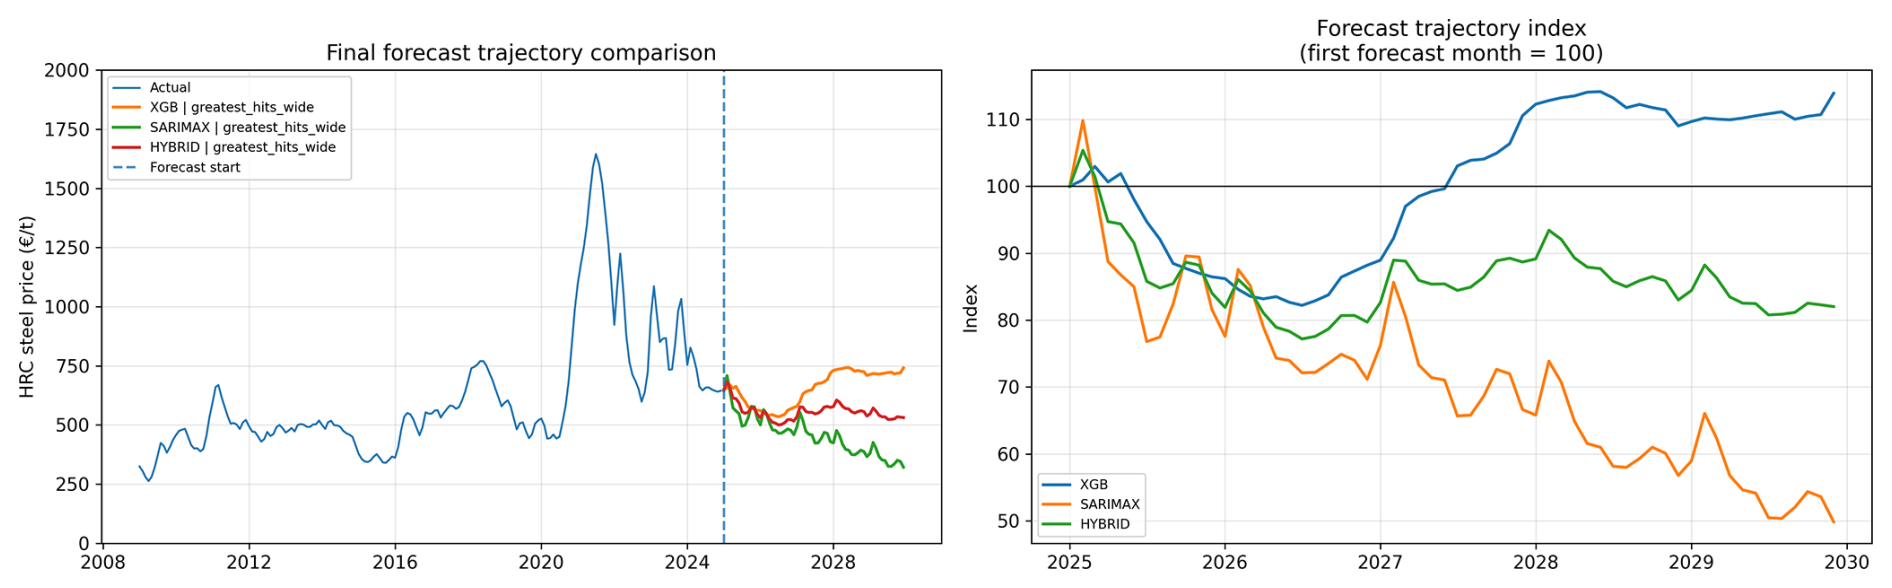
Figure 6Short- to long-term forecasts of HRC steel prices using XGB, SARIMAX, and hybrid forecasts.
The future predictions ahead of current data after hindcast testing are presented in Fig. 6. The XGB forecast recovers prices after an initial drop and can be considered a market recovery scenario, with a rebound of 10 %–15 % showing no continual drift. The SARIMAX forecast up until the end of 2029 shows continual downward drift, which could be due to a lack of data transformation before forecasting. The hybrid forecast, alongside the best exog collection, provides a balanced path and a moderate forecast which would be suitable for baseline projections, with the other two models providing upper and lower bounds.
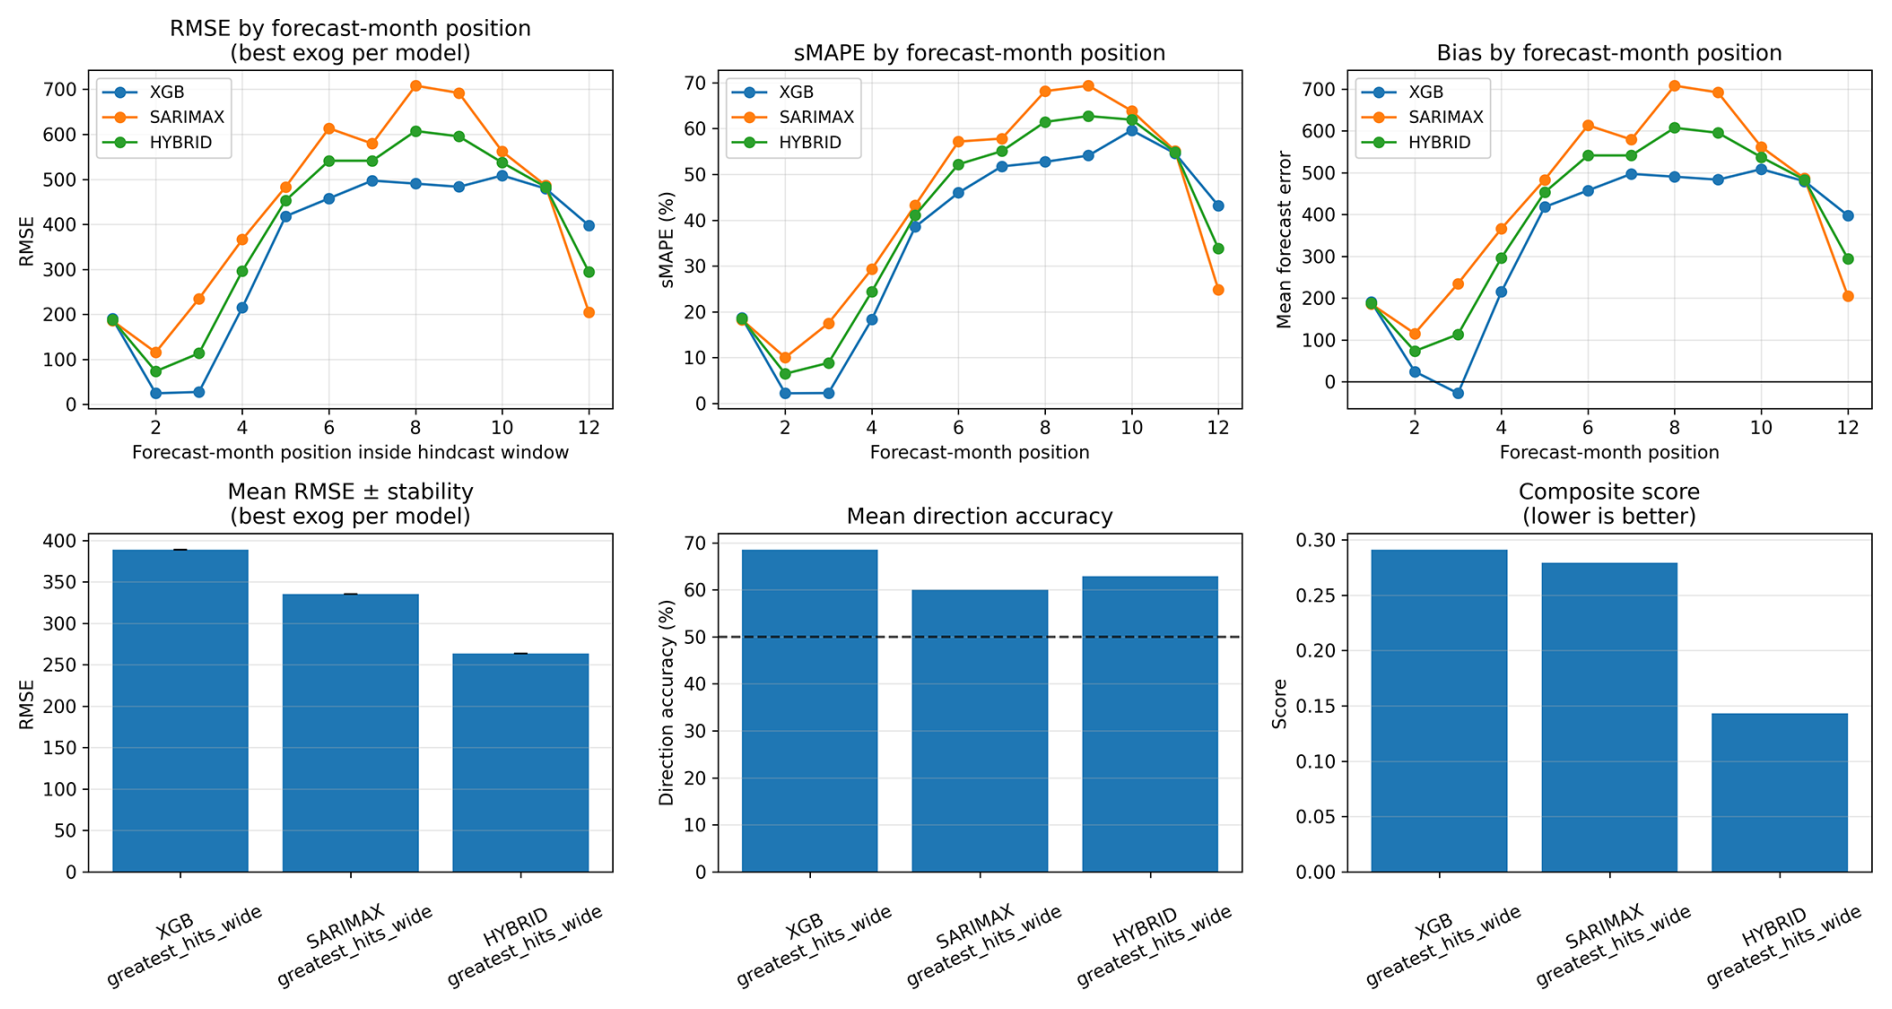
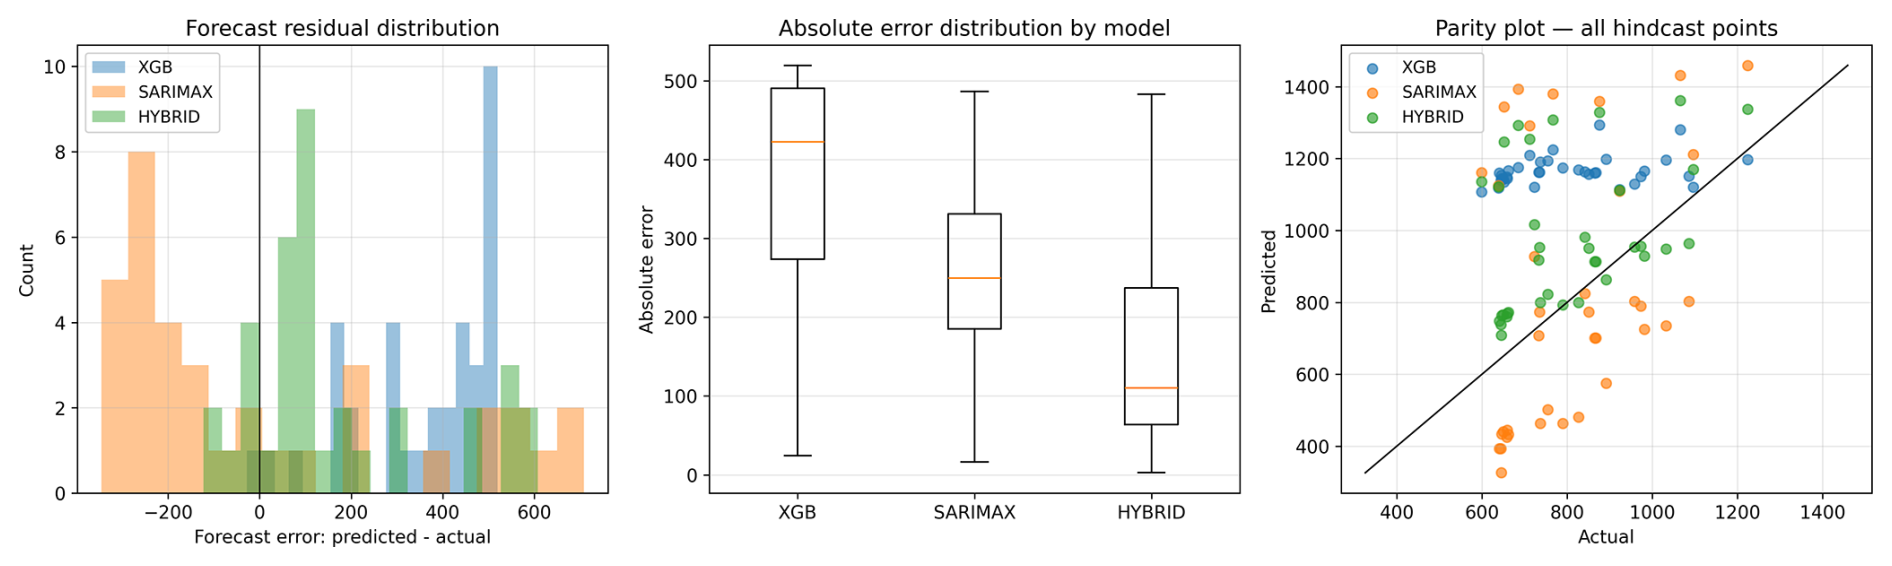
The error structure by month position is shown in Fig. 7 and shows that all models worsen with horizon, as expected, especially the SARIMAX forecast with a large spike in RMSE, symmetrical mean absolute percentage error (sMAPE), and mean forecast error. sMAPE measures the average relative difference between observed and forecasting values, treating over- and underprediction equally. The XGB has higher overall stability but still performs worse than the hybrid forecast, which produces the lowest MAE during the hindcast test period and held relatively low root mean square error (RMSE) and sMAPE, with a mean bias (or average forecast error) close to zero. It provided the most consistent performance across the defined metrics. Interestingly and unexpectedly, SARIMAX performs best in the short term, and it seems errors rise with the negative forecast bias. However, this could be due to more data preparation or transformation. An evaluation of the XGB, SARIMAX, and hybrid models against the actual hindcast data can be seen in Fig. 8. In support of the hindcast testing results, the hybrid model again demonstrates superior performance, exhibiting lower forecasting errors, a tighter clustering of predictions around the observed values, and residuals that are centred near zero. The XGB model exhibits a positive bias, tending to overestimate values during the hindcast testing, whereas the SARIMAX model displays the opposite behaviour, with a tendency to underpredict.
4.3 Economic assessment
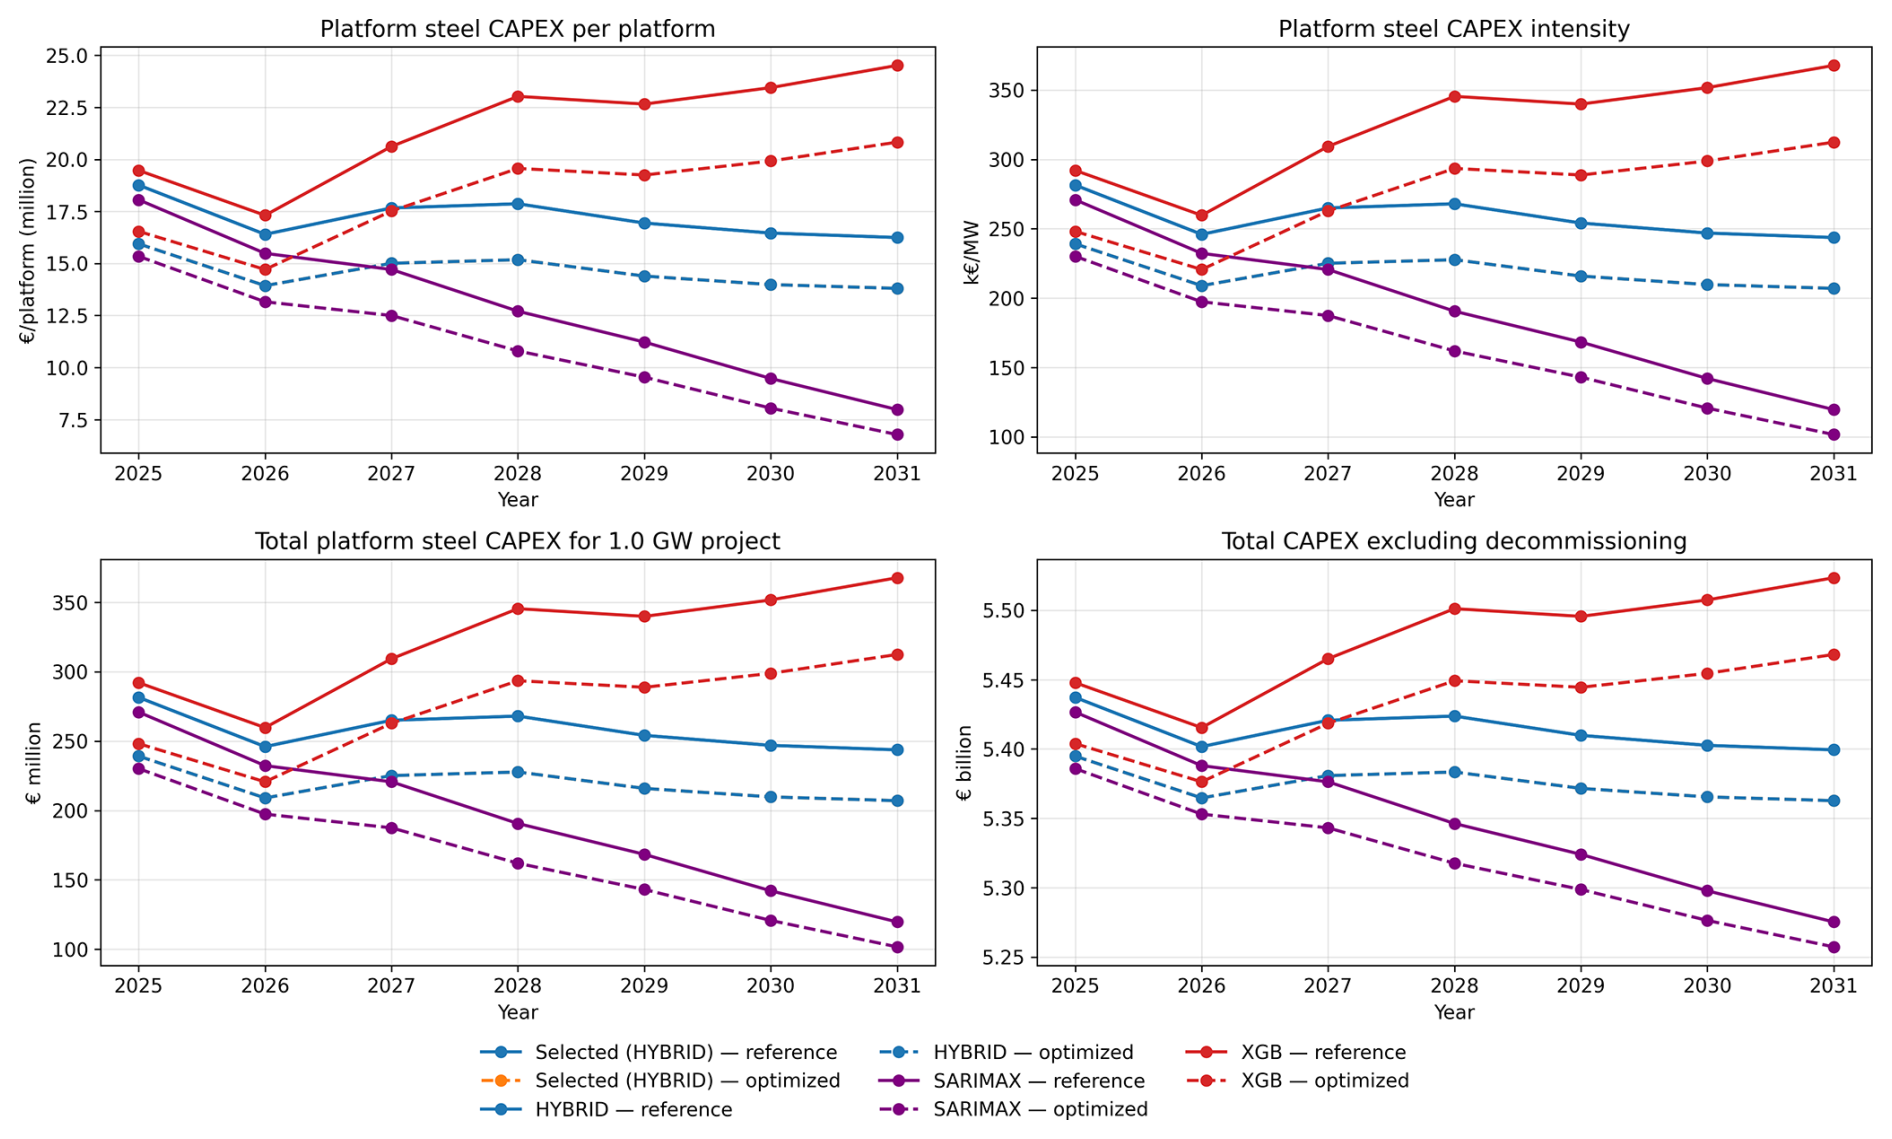
The steel price and corresponding LCoE for different forecast years are shown in Fig. 9 for the three scenarios and both platform designs: the initial platform mass of 3916 t and the optimized platform mass of 3273 t. The optimized design achieves cost savings of approximately 10-15 % across all scenarios, representing the most favourable and consistent outcome obtained from the GA optimization. With the predictions affecting only steel prices, the CAPEX trends follow the same path as in the forecasting results, with XGB and SARIMAX the high- and low-bound forecasts and hybrid the baseline scenario. The uncertainty in steel prices has a significant impact on CAPEX, approximately EUR 150–200 million at the 1 GW level, or by up to 40 %–50 % variation across the range of forecasts. Based on these results, market factors are a primary driver of economic uncertainties, with engineering optimization offering significant yet partial mitigation.
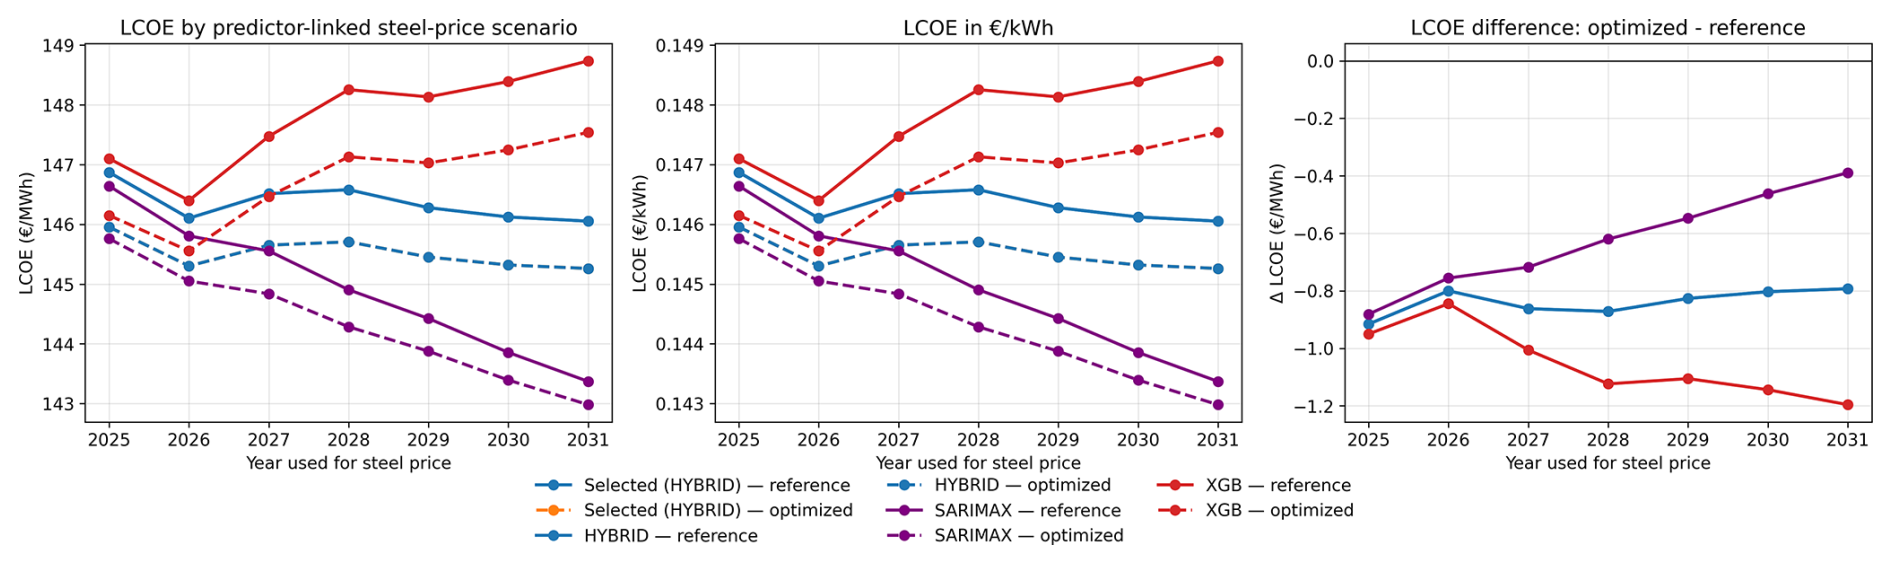
For LCoE, Fig. 10 shows a more moderate impact, around EUR 3–5 MW h−1, with effects lessened through a long project lifetime of 30 years and higher discount rates of 8 % to reflect early commercial FOW projects, with structural optimization reducing LCoE by around EUR 1 MW h−1 or more in the high-price scenarios. LCoE values also encompass other CAPEX items, energy generation, and OPEX, which are all generalized in this work.
This work presents the combination of a platform design optimization whilst respecting design constraints and a techno-economic assessment that calculated the platform and project CAPEX using a combination of forecasting methods. The LCoE was estimated using general costs and energy generation from the wider literature, which placed the system within both a 1 GW farm scale and the current LCoE framework. Results show that design improvements are possible for the reference platform whilst still respecting the constraints of expected loads acting on the floating turbine in the offshore environment, with savings of 10 %–15 % in steel shell mass.
For cost forecasting, it is possible to blend forecasts to take advantage of the benefits of short-term models that can capture stochastic fluctuation and longer-term statistical models that can capture deeper trends in time series data. In this research the hybrid model outperformed the XGB and SARIMAX models by capturing the benefits of both, and combined they form three scenario forecasts. As SARIMAX conversely performed best in early forecast months, more calibration is required to build confidence in future predictions. This work highlights the promising nature of predictive models, especially with the selection of supporting data through filtering and wider economic analysis. Overall, the market fluctuations are strong drivers of platform CAPEX, with EUR 150–200 million at the 1 GW level, or 40 %–50 % fluctuation across all scenarios, and EUR 3–5 MW h−1 LCoE. This shows economic forces are strong drivers of CAPEX and LCoE for a high-priority cost reduction area for floating offshore wind. These, alongside the benefits of design optimization measures, must reduce for commercial potential to be realized.
The RAFT code used in this study is openly available from https://github.com/NLRWindSystems/RAFT (NLR Wind Systems, 2026). The RAFT methodology and implementation are described by Hall et al. (2022).
The genetic algorithm used for the design optimization is available at https://doi.org/10.5281/zenodo.22309288 (Benifla, 2026). Code for the time series forecaster is available at https://doi.org/10.5281/zenodo.21631992 (White, 2026).
The supplement related to this article is available online at https://doi.org/10.5194/wes-11-3703-2026-supplement.
Economic analysis and time series forecasting code development and writing by CW. Platform design optimization, simulations, development of genetic algorithm, and writing by VB. Results and manuscript review by JC. Assistance with submission and support by LMCG.
The contact author has declared that none of the authors has any competing interests.
Publisher's note: Copernicus Publications remains neutral with regard to jurisdictional claims made in the text, published maps, institutional affiliations, or any other geographical representation in this paper. The authors bear the ultimate responsibility for providing appropriate place names. Views expressed in the text are those of the authors and do not necessarily reflect the views of the publisher.
This article is part of the special issue “Wind energy economics and markets with high shares of renewables”. It is not associated with a conference.
The authors would like to acknowledge the FLOAting Wind Energy network (FLOAWER) which provided interdisciplinary training.
This work was funded by Portugal's Recovery and Resilience Plan (PRR) and the European Union – NextGenerationEU, through the 2022–2026 multiannual funding awarded to WavEC as a Portuguese Technology and Innovation Centre (CTI), recognized by the National Innovation Agency (ANI).
This paper was edited by Yuka Kikuchi and reviewed by two anonymous referees.
Albulescu, C. T.: COVID-19 and the United States financial markets' volatility, Finance Res. Lett., 38, 101699, https://doi.org/10.1016/j.frl.2020.101699, 2021.
Allen, C., Viselli, A., Dagher, H., Goupee, A., Gaertner, E., Abbas, N., Hall, M., and Barter, G.: Definition of the UMaine VolturnUS-S reference platform developed for the IEA Wind 15-megawatt offshore reference wind turbine, National Renewable Energy Laboratory, Golden, CO, USA, NREL/TP-5000-76773, https://doi.org/10.2172/1660012, 2020.
Bak, C., Zahle, F., Bitsche, R., Kim, T., Yde, A., Henriksen, L. C., Natarajan, A., and Hansen, M. H.: Description of the DTU 10 MW Reference Wind Turbine, DTU Wind Energy Report-I-0092, DTU Wind Energy, Roskilde, Denmark, https://gitlab.windenergy.dtu.dk/rwts/dtu-10mw-rwt (last access: 27 July 2026), 2013.
Barter, G. E., Robertson, A., and Musial, W.: A systems engineering vision for floating offshore wind cost optimization, Renew. Energy Focus, 34, 1–16, https://doi.org/10.1016/j.ref.2020.03.002, 2020.
Beiter, P., Musial, W., Duffy, P., Cooperman, A., Shields, M., Heimiller, D., and Optis, M.: The cost of floating offshore wind energy in California between 2019 and 2032, National Renewable Energy Laboratory, Golden, CO, USA, NREL/TP-5000-77384, https://doi.org/10.2172/1710181, 2020.
Benifla, V.: vbenifla/Vikopti: v9.2 (Version v9.2), Zenodo [software], https://doi.org/10.5281/zenodo.22309288, 2026.
Benifla, V. and Adam, F.: Design optimization of floating offshore wind turbine substructure using frequency domain modelling and genetic algorithm, J. Phys. Conf. Ser., 2626, 012047, https://doi.org/10.1088/1742-6596/2626/1/012047, 2023.
Beyer, F., Choisnet, T., Kretschmer, M., and Cheng, P. W.: Coupled MBS-CFD simulation of the IDEOL floating offshore wind turbine foundation compared to wave tank model test data, in: Proceedings of the 25th International Ocean and Polar Engineering Conference, Kona, Hawaii, USA, 21–26 June 2015, International Society of Offshore and Polar Engineers, 367–374, https://doi.org/10.18419/opus-3973, 2015.
Butterfield, S., Musial, W., Jonkman, J., and Sclavounos, P.: Engineering challenges for floating offshore wind turbines, in: Proceedings of the Copenhagen Offshore Wind Conference, Copenhagen, Denmark, 26–28 October 2005, National Renewable Energy Laboratory, NREL/CP-500-38776, https://www.osti.gov/biblio/917212 (last access: 27 July 2026), 2007.
BVG Associates: Guide to a floating offshore wind farm, BVG Associates, Swindon, UK, https://guidetofloatingoffshorewind.com/ (last access: 27 July 2026), 2025.
Campos, A., Molins, C., Trubat, P., and Alarcón, D.: A 3D FEM model for floating wind turbines support structures, Energ. Proced., 137, 177–185, https://doi.org/10.1016/j.egypro.2017.10.344, 2017.
Chatfield, C.: Time-Series Forecasting, Chapman and Hall/CRC, https://doi.org/10.1201/9781420036206, 2000.
Deb, K.: An efficient constraint handling method for genetic algorithms, Comput. Method. Appl. M., 186, 311–338, https://doi.org/10.1016/S0045-7825(99)00389-8, 2000.
Deb, K. and Agrawal, R. B.: Simulated binary crossover for continuous search space, Complex Syst., 9, 115–148, 1995.
DNV: Energy Transition Outlook 2023, DNV, Høvik, Norway, https://www.dnv.com/energy-transition-outlook/ (last access: 27 July 2026), 2023.
Dou, S., Pegalajar-Jurado, A., Wang, S., Bredmose, H., and Stolpe, M.: Optimization of floating wind turbine support structures using frequency-domain analysis and analytical gradients, J. Phys. Conf. Ser., 1618, 042028, https://doi.org/10.1088/1742-6596/1618/4/042028, 2020.
Driscoll, F., Jonkman, J., Robertson, A., Sirnivas, S., Skaare, B., and Nielsen, F. G.: Validation of a FAST model of the Statoil-Hywind Demo floating wind turbine, Energ. Proced., 94, 3–19, https://doi.org/10.1016/j.egypro.2016.09.181, 2016.
Faraggiana, E., Sirigu, M., Ghigo, A., Bracco, G., and Mattiazzo, G.: An efficient optimisation tool for floating offshore wind support structures, Energy Rep., 8, 9104–9118, https://doi.org/10.1016/j.egyr.2022.07.036, 2022.
Gaertner, E., Rinker, J., Sethuraman, L., Zahle, F., Anderson, B., Barter, G., Abbas, N., Meng, F., Bortolotti, P., Skrzypinski, W., Scott, G., Feil, R., Bredmose, H., Dykes, K., Shields, M., Allen, C., and Viselli, A.: Definition of the IEA Wind 15-megawatt offshore reference wind turbine, National Renewable Energy Laboratory, Golden, CO, USA, NREL/TP-5000-75698, https://doi.org/10.2172/1603478, 2020.
Hall, M.: A cumulative multi-niching genetic algorithm for multimodal function optimization, International Journal of Advanced Research in Artificial Intelligence, 1, 6–13, https://doi.org/10.14569/IJARAI.2012.010902, 2012.
Hall, M., Buckham, B., and Crawford, C.: A genetic algorithm-based platform optimization framework for floating offshore 75 wind turbines, in: Proceedings of the 11th International Conference on Sustainable Energy Technologies (SET-2012), https://matt-hall.ca/docs/hall_2012_set.pdf (last access: 27 July 2026), 2012.
Hall, M., Buckham, B., and Crawford, C.: Evolving offshore wind: A genetic algorithm-based support structure optimization framework for floating wind turbines, in: OCEANS 2013 MTS/IEEE Bergen, Bergen, Norway, 10–14 June 2013, 1–10, https://doi.org/10.1109/OCEANS-Bergen.2013.6608173, 2013.
Hall, M., Housner, S., Zalkind, D., Bortolotti, P., Ogden, D., and Barter, G.: An open-source frequency-domain model for floating wind turbine design optimization, J. Phys. Conf. Ser., 2265, 042020, https://doi.org/10.1088/1742-6596/2265/4/042020, 2022.
Jacobsen, A. and Godvik, M.: Influence of wakes and atmospheric stability on the floater responses of the Hywind Scotland wind turbines, Wind Energy, 24, 149–161, https://doi.org/10.1002/we.2563, 2021.
James, R. and Costa Ros, M.: Floating offshore wind: Market and technology review, The Carbon Trust, London, UK, https://www.carbontrust.com/our-work-and-impact/guides-reports-and-tools/floating-offshore-wind-market-technology-review (last access: 27 July 2026), 2015.
Jin, B. and Xu, X.: Predictions of steel price indices through machine learning for the regional northeast Chinese market, Neural Comput. Appl., 36, 20863–20882, https://doi.org/10.1007/s00521-024-10270-7, 2024.
Jonkman, J., Butterfield, S., Musial, W., and Scott, G.: Definition of a 5-MW reference wind turbine for offshore system development, National Renewable Energy Laboratory, Golden, CO, USA, NREL/TP-500-38060, https://doi.org/10.2172/947422, 2009.
Leimeister, M. and Kolios, A.: Reliability-based design optimization of a spar-type floating offshore wind turbine support structure, Reliab. Eng. Syst. Saf., 213, 107666, https://doi.org/10.1016/j.ress.2021.107666, 2021.
Liu, Y., Li, S., Yi, Q., and Chen, D.: Developments in semi-submersible floating foundations supporting wind turbines: A comprehensive review, Renew. Sust. Energ. Rev., 60, 433–449, https://doi.org/10.1016/j.rser.2016.01.109, 2016.
Martini, M., Guanche, R., Armesto, J. A., Losada, I. J., and Vidal, C.: Met-ocean conditions influence on floating offshore wind farms power production, Wind Energy, 19, 399–420, https://doi.org/10.1002/we.1840, 2016.
Messmer, T., Ran, X., Benifla, V., Lutz, M., Adam, F., Bachynski-Polić, E. E., and Hölling, M.: Overview of the potential of floating wind in Europe based on met-ocean data derived from the ERA5-dataset, J. Phys. Conf. Ser., 2626, 012021, https://doi.org/10.1088/1742-6596/2626/1/012021, 2023.
Musial, W., Butterfield, S., and Boone, A.: Feasibility of floating platform systems for wind turbines, in: Proceedings of the 42nd AIAA Aerospace Sciences Meeting and Exhibit, Reno, Nevada, USA, 5–8 January 2004, https://doi.org/10.2514/6.2004-1007, 2004.
Musial, W., Spitsen, P., Duffy, P., Beiter, P., Shields, M., Mulas Hernando, D., Hammond, R., Marquis, M., King, J., and Sathish, S.: Offshore Wind Market Report: 2023 Edition, National Renewable Energy Laboratory, Golden, CO, USA, NREL/TP-5000-87232, DOE/GO-102023-6059, https://doi.org/10.2172/2001112, 2023.
Myhr, A., Bjerkseter, C., Ågotnes, A., and Nygaard, T. A.: Levelized cost of energy for offshore floating wind turbines in a life cycle perspective, Renew. Energy, 66, 714–728, https://doi.org/10.1016/j.renene.2014.01.017, 2014.
NLR Wind Systems: RAFT – Response Amplitudes of Floating Turbines, GitHub [code], https://github.com/NLRWindSystems/RAFT, last access: 27 July 2026, 2026.
Otter, A., Murphy, J., Pakrashi, V., Robertson, A., and Desmond, C.: A review of modelling techniques for floating offshore wind turbines, Wind Energy, 25, 831–857, https://doi.org/10.1002/we.2701, 2021.
Papi, F. and Bianchini, A.: Technical challenges in floating offshore wind turbine upscaling: A critical analysis based on the NREL 5 MW and IEA 15 MW reference turbines, Renew. Sust. Energ. Rev., 162, 112489, https://doi.org/10.1016/j.rser.2022.112489, 2022.
Risch, D., Favill, G., Marmo, B., van Geel, N., Benjamins, S., Thompson, P., Wittich, A., and Wilson, B.: Characterisation of underwater operational noise of two types of floating offshore wind turbines, Scottish Association for Marine Science, Oban, UK, https://www.carbontrust.com/our-work-and-impact/guides-reports-and-tools/floating-offshore-wind-market-technology-review (last access: 27 July 2026), 2023.
Skaare, B., Hanson, T. D., Nielsen, F. G., Yttervik, R., Hansen, A. M., Thomsen, K., and Larsen, T. J.: Analysis of measurements and simulations from the Hywind Demo floating wind turbine, Wind Energy, 18, 1105–1122, https://doi.org/10.1002/we.1750, 2015.
Tarsitano, A. and Amerise, I. L.: Short-term load forecasting using a two-stage SARIMAX model, Energy, 133, 108–114, https://doi.org/10.1016/j.energy.2017.05.126, 2017.
Wang, T., Leung, H., Zhao, J., and Wang, W.: Multiseries featural LSTM for partial periodic time-series prediction: A case study for steel industry, IEEE T. Instrum. Meas., 69, 5994–6003, https://doi.org/10.1109/TIM.2020.2967247, 2020.
Wayman, E. N., Sclavounos, P. D., Butterfield, S., Jonkman, J., and Musial, W.: Coupled dynamic modeling of floating wind turbine systems, in: Proceedings of the Offshore Technology Conference, Houston, Texas, USA, 1–4 May 2006, OTC-18287-MS, https://doi.org/10.4043/18287-MS, 2006.
White, C.: CraigW1/TSF: Release for WES (Version V1.0.3), Zenodo [software], https://doi.org/10.5281/zenodo.21631992, 2026.
Wu, J. and Kim, M.-H.: Generic upscaling methodology of a floating offshore wind turbine, Energies, 14, 8490, https://doi.org/10.3390/en14248490, 2021.
Zalkind, D. and Bortolotti, P.: Control co-design studies for a 22 MW semisubmersible floating wind turbine platform, J. Phys. Conf. Ser., 2767, 082020, https://doi.org/10.1088/1742-6596/2767/8/082020, 2024.
Zhang, T., Zhang, X., Rubasinghe, O., Liu, Y., Chow, Y., Iu, H. H.-C., and Fernando, T.: Long-term energy and peak power demand forecasting based on Sequential-XGBoost, IEEE T. Power Syst., 39, 3088–3104, https://doi.org/10.1109/TPWRS.2023.3289400, 2023.