
the Creative Commons Attribution 4.0 License.
the Creative Commons Attribution 4.0 License.
 | 09 Oct 2026
Identification of optimal ERA5 model level for wind resource assessments in mountainous terrain
Juan Contreras

Nicole van Lipzig
Esteban Samaniego
Daniela Ballari
The accurate estimation of hub-height wind speed is crucial for wind resource assessment at prospective sites. Traditionally, long-term wind speed series are derived from short-term site observations combined with reanalysis products, most commonly the ERA5 single-level data at 10 and 100 m heights. However, the coarse spatial resolution of ERA5 limits their reliability in complex mountainous regions, leading to weak correlations with local wind measurements due inadequately resolved near-surface flow. This study investigates whether the use of wind speed estimates from upper atmospheric levels (i.e. model levels) of the ERA5 model-level dataset can improve wind speed representation in complex terrain. We compared ERA5 with hourly wind speed observations at 80 m from four meteorological masts located at high elevations (2829–3796 ) in the tropical Andes of southern Ecuador and developed site-specific random forest (RF) models to calibrate ERA5 wind speeds. Our findings reveal that wind speeds from upper model levels (∼ 600–1600 m) exhibit substantially stronger correlations with mast observations than the theoretical hub height. Compared with single-level inputs, model-level-driven RF estimates achieved average improvements of 59 % in the Perkins skill score (PSS), 40 % in R2, and 23 % in mean absolute error (MAE) and root mean square error (RMSE). Importantly, the bias in annual energy production (AEP) decreased to less than 7 %, in contrast with 22 % when using ERA5 single-level data. These improvements were greater for sites located on exposed peaks, which are often preferred locations for wind farms, where the local flow is better captured by upper model levels. In addition, a comparison with linear regression with residuals as a benchmark model shows that RF outperformed this method, especially at lower-elevation and sheltered sites, where local wind flow effects are more influential. Overall, our results demonstrate that selecting appropriate upper ERA5 model levels offers a cost-effective strategy to generate accurate, site-specific hub-height wind speed time series in complex terrain. We encourage the wind energy community to exploit these upper atmospheric levels of ERA5 to enhance wind resource assessments in mountainous regions.
- Article
(8072 KB) - Full-text XML
- BibTeX
- EndNote


Understanding long-term wind speed at turbine height is essential for the wind energy industry, particularly for site assessment and energy yield estimation (Watson, 2023). Direct in situ measurements from meteorological masts remain the gold standard for assessing wind resources at onshore locations (McKenna et al., 2022; Watson, 2023). However, due to the high costs associated with deploying this infrastructure and the urgent demand for wind energy development, these measurement campaigns typically span only 1–2 years. Such short-term datasets are insufficient in capturing the long-term wind conditions needed for accurate wind resource assessment over a project's lifetime (Basse et al., 2021). To overcome this limitation, the Measure–Correlate–Predict (MCP) methodology is widely used to extrapolate short-term wind speed records. MCP involves correlating measurements at the candidate site with long-term data from nearby reference sites, typically using linear regression techniques (Carta et al., 2013; Houndekindo and Ouarda, 2025). In recent years, MCP methods have evolved to incorporate machine learning approaches for building transfer functions and have increasingly relied on wind data from numerical weather prediction (NWP) models as reference sources, especially in areas lacking in situ measurements (e.g. meteorological masts or weather stations) (Houndekindo and Ouarda, 2025).
Data from NWP models – particularly mesoscale simulations, and global and regional reanalysis datasets – have become increasingly common as reference sources in MCP applications (Houndekindo and Ouarda, 2025). Although mesoscale models and regional reanalysis offer higher spatial and temporal resolution than global reanalyses, they are available only for limited areas worldwide and typically cover less than 20 years (Borgers et al., 2024). This constrain is primarily due to the substantial computational resources required to run these models, limiting their utility for most parts of the world (McKenna et al., 2022). In contrast, global reanalysis, although with a coarser spatial and temporal resolution than mesoscale models (and regional reanalysis), it provides a global coverage, which makes it useful in remote areas (i.e. non-historical monitoring sites). Moreover, they often span multiple decades (e.g. 40 to 100 years), making them suitable for long-term resource assessments. Among these, the fifth-generation European Centre for Medium-Range Weather Forecasts atmospheric reanalysis system (ERA5) has been widely evaluated and applied in wind energy studies (Olauson, 2018). Studies by Ramon et al. (2019) and Gualtieri (2022) highlight its superior accuracy, reduced uncertainty and greater reliability compared to other global reanalysis datasets.
Although ERA5 wind speed data are sufficiently reliable on offshore and flat areas, significant discrepancies are observed in mountainous regions. It is well known that ERA5 tends to underestimate wind speeds – and thus wind power potential – in these complex terrains (Gualtieri, 2022). In addition, the temporal variability of wind is reproduced less accurately compared to flat or offshore locations. These inaccuracies are largely attributed to ERA5's coarse spatial resolution, which fails to capture the intricate topography and surface roughness of mountainous areas. Grid-averaged winds in such regions often overlook speed-up effects induced by terrain features (Gualtieri, 2022). In offshore and flat locations, several studies have attempted to improve the MCP estimates incorporating physically-based covariates from ERA5 and data from mesoscale models using machine learning methods, particularly random forest (e.g. Bodini et al., 2023; Hallgren et al., 2024; Liu et al., 2023; Rouholahnejad and Gottschall, 2025; Schwegmann et al., 2023). Conversely, in mountainous areas, research in this regard is extremely limited. One notable exception is the study by Cavaiola et al. (2023), who developed a random forest model using physics-based ERA5 variables related to wind speed to estimate long-term wind power in the Alpine region. Furthermore, all the above-mentioned studies incorporating additional meteorological or physical variables have pointed out wind speed as the most critical predictor. Therefore, efforts to obtain accurate wind speed are of significant relevance.
Expanding wind energy capacity, besides being strategic worldwide, is especially relevant in regions with a low diversified energy matrix. This is the case in Ecuador, which, although having considerable wind resource potential in the Andes mountains, wind power currently accounts for only 0.6 % of national electricity production (Godoy et al., 2025), revealing a largely untapped opportunity for renewable energy diversification. In addition, the severe droughts experienced in 2023 and 2024 further exposed the vulnerability of Ecuador's electricity sector, which remains highly dependent on hydropower (Tapia et al., 2026). Expanding wind energy capacity is therefore strategic not only for diversifying the national energy matrix and increasing resilience during drought events but also for supporting carbon-neutrality goals. In light of these challenges, there is an urgent need for robust wind resource assessment studies to guide future development. However, most potential wind farm locations in the region are situated in complex mountainous terrain, where reanalysis-based wind resource estimates remain highly uncertain.
Martinez et al. (2024) highlighted the fact that global and regional reanalysis tend to underestimate actual site elevations due to the smoothed representation of orography in the Andes. It is known that NWP models (which form the basis of reanalysis datasets) are highly sensitive to lower boundary conditions (Hahmann et al., 2020). The degree of topographic smoothing negatively affects their ability to simulate terrain-induced wind phenomena such as anabatic and katabatic flows, mountain waves and valley channelling, which are often lost in coarse-resolution models (Kumar et al., 2025). Recent findings by Pauscher et al. (2024) indicate that reanalysis products tend to underestimate wind speeds at sites located above the grid-cell mean elevation and overestimate them at sites below it in complex terrain. This raises the question of whether wind speed estimates from reanalysis at elevations higher than the traditionally used levels (i.e. 10 and 100 m) could provide a better match with observations in mountainous areas.
Our hypothesis is that, in mountainous regions, wind speeds from the upper model level in ERA5 are more representative of conditions at wind farm sites, as these locations are often exposed to free atmospheric flow rather than surface-level wind dynamics. It is important to highlight the fact that ERA5 single-level dataset (10 and 100 m wind components above the ground) has been established as a standard dataset in this field. Thus, wind speed from ERA5 single-level data has been commonly used as input data for MCP studies, both offshore and onshore. However, ERA5 model-level dataset also provides more detailed vertical resolution data in the atmosphere (i.e. 137 model-level heights) which may be more relevant for a detailed wind energy assessment. Note that this dataset has only been used in a few studies, particularly at offshore locations due the higher height of wind turbines in comparison to onshore sites (e.g. Brune et al., 2021; Cheynet et al., 2025; Hahmann et al., 2022; Hallgren et al., 2024; Soares et al., 2020). Given the mismatch between the orography represented in reanalysis data and the actual terrain of mountainous sites, utilising higher-altitude wind speed data from ERA5 may be crucial for improving wind speed estimations in these areas. However, it remains unclear whether higher ERA5 model levels can provide a better representation of hub-height wind speeds than the commonly used 10 and 100 m single-level data or which model level is most representative across sites with different terrain characteristics. To our knowledge, such an analysis has not been systematically conducted using hub-height mast observations.
Therefore, the aim of this study is to evaluate whether the use of higher atmospheric levels from ERA5 model-level dataset can improve wind speed estimates and provide a more reliable time series for wind resource assessment in the mountainous regions. Our study area is located in the tropical Andes of southern Ecuador, between 2829 and 3796 . This provides an interesting and extreme setting for studying complex terrain, with altitudes exceeding 3000 To this end, we first analysed the relationship between observed wind speed time series at hub-height (80 m) and ERA5 wind speed estimates across various model levels, ranging from 10 m to approximately 3200 m above ground level, in order to identify the model level that best represents wind conditions at the study sites. Next, we developed a random forest model to calibrate ERA5 and predict wind speed estimates, using the optimal model height of wind speed from the model-level dataset and comparing against a reference model composed with the single-level wind speed dataset. Similarly, this comparison was also performed using linear regression with residuals as a benchmark model. Finally, we assessed the impact of these calibrated wind speed estimates on annual energy production (AEP), applying power curves from existing wind farms in Ecuador. The findings of this study provide valuable insights for improving wind speed estimation for wind resource assessment in complex terrains using reanalysis datasets.
The structure of the paper is as follows: Sect. 2 describes the datasets and methodology; Sect. 3 presents the results; Sect. 4 discusses the findings; and Sect. 5 concludes the study with a summary and final remarks.
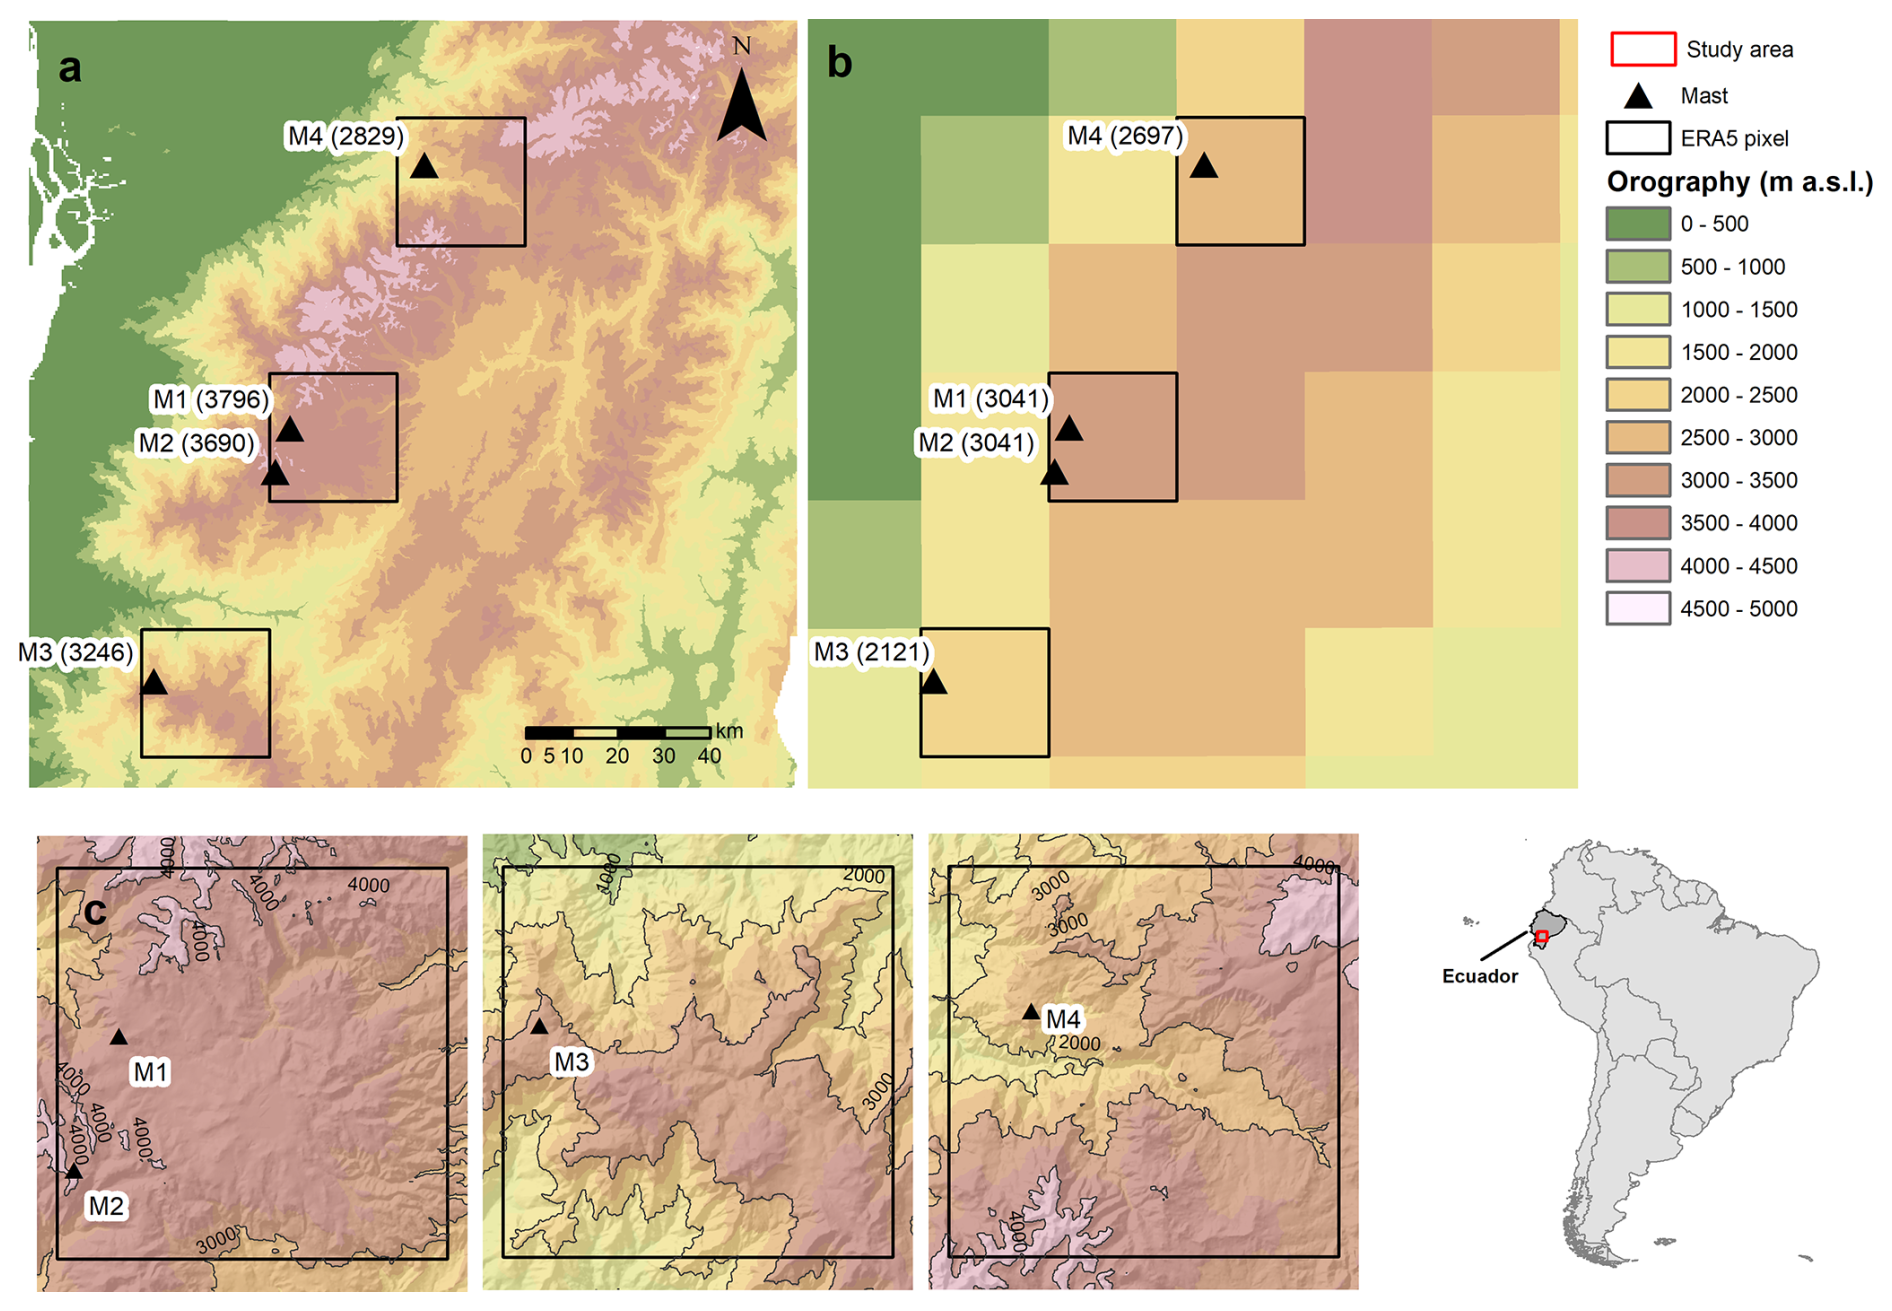
Figure 1Map of the study area and location of meteorological masts. The orography of the study region according to the Shuttle Radar Topography Mission (SRTM) digital elevation model (30 m) and the ERA5 (∼ 31 km) is shown in (a) and (b), respectively. In parenthesis are the in situ and ERA5 elevation of sites in The variability of orography, along with the topographic contour lines within the ERA5 pixel for each site, is shown in (c). Grid coordinates were omitted from all maps for confidential proposes.
2.1 Study area and in situ masts
Our study area is located in the Andes of southern Ecuador, spanning the provinces of Cañar, Azuay and El Oro (Fig. 1). The region is characterised by complex topography and heterogeneous land cover. High wind power potential has been identified in areas situated above 2000 m above sea level (), primarily along the ridges of the Andean Cordillera, near the Continental Divide of the Americas. This wind potential has led to the planning of several wind farm projects in the region, including the construction of Ecuador's largest operating wind farm, Minas de Huascachaca (57 MW).
The spatio-temporal variability of wind in the study area, and more broadly in the Andean region of Ecuador, is influenced by both synoptic and valley-scale circulation patterns. At the seasonal scale, wind patterns are primarily driven by the migration of the Intertropical Convergence Zone (ITCZ). The windy season, which extends from June to September, corresponds to the northward migration of the ITCZ during the boreal summer, strengthening the southern trade winds. Conversely, the calm season, from October to May, is associated with the southward shift of the ITCZ over Ecuador (López et al., 2023). Throughout the year, winds predominantly flow from the east and southeast, whereas westerly winds are more common during the calm season, particularly at sites located closer to the lower western flanks of the Andes. At the daily scale, thermally induced winds contribute to variability: anabatic winds occur during the day as heated air rises along mountain slopes, whereas katabatic winds prevail at night as cooler air descends.
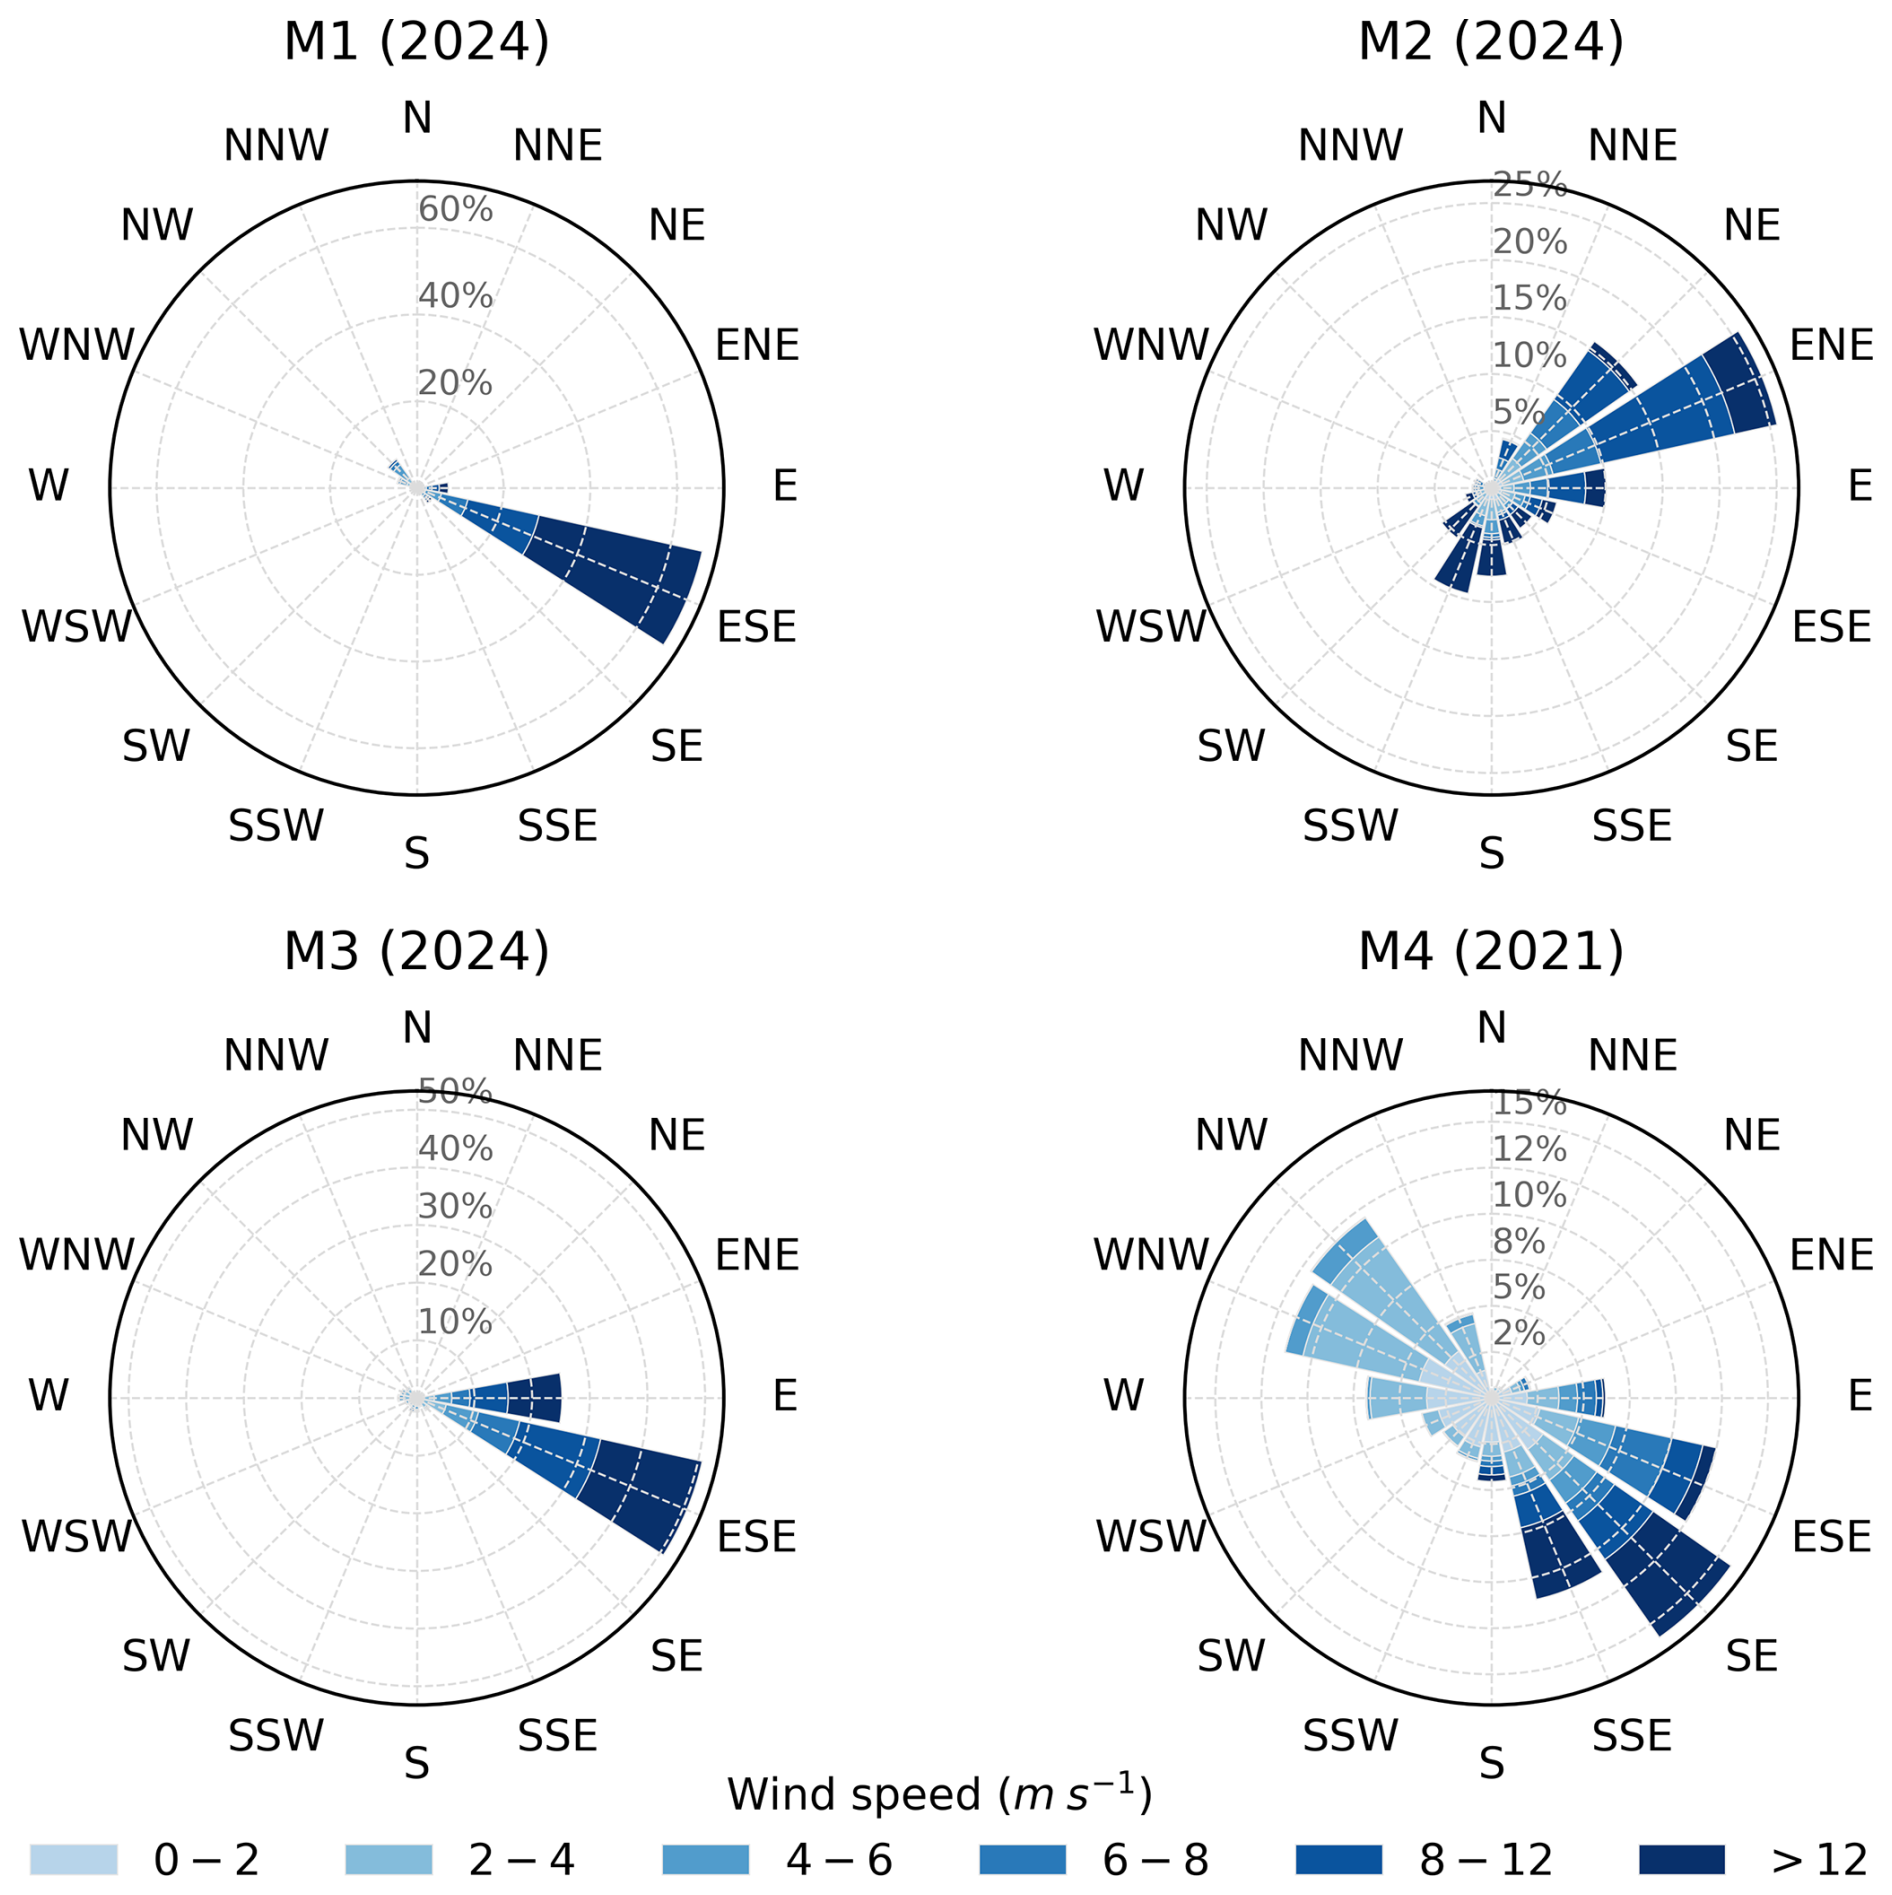
Figure 2Wind roses showing the observed wind speed and wind direction distributions at the four mast sites. The plots correspond to 2024 for M1, M2 and M3, and to 2021 for M4 (selected based on wind direction data availability). Bar length represents the frequency of wind occurrence from each direction, and colours indicate wind speed classes in m s−1. Note that the frequency range differs among plots to improve visualisation.
Wind observations were collected from four operational meteorological masts managed by the Electric Corporation of Ecuador (CELEC EP): M1, M2, M3 and M4 (Fig. 1). M4, located in the northern part of the study area, is predominantly surrounded by cattle-grazing lands and croplands. M1 and M2, situated centrally within the region, are representative of highland environments characterised by alpine grasslands locally known as páramo. M3, in the southwest of the study area, is surrounded by páramo and pine forest. M1 and M3 are located on ridge tops, with no nearby obstacles (Fig. 1c), and show a clearly dominant wind direction from the east-southeast direction (Fig. 2). These sites also present the highest wind speeds, particularly for winds from the east-southeast to southeast sector, indicating well-exposed conditions to the prevailing flow. In contrast, M2 is located at the foothill of a ridge and is surrounded by higher hills (Fig. 1c), which likely influence the local wind direction and result in prevailing winds mainly from the east-northeast to northeast sector (Fig. 2). Compared with M1 and M3, M2 shows a broader directional distribution and lower frequencies of the highest wind speed classes, suggesting a stronger influence of local topographic effects. Finally, M4 is located in the western foothills of the Andes, at a lower elevation than the other sites, and is situated on a hilltop surrounded by higher mountain ridges, resulting in a more sheltered site (Fig. 1c). The wind rose for M4 shows the most heterogeneous wind distribution, with prevailing directions from east-southeast to south-southeast and west-northwest to northwest, and a lower frequency of high wind speeds compared with the ridge-top sites (Fig. 2).
The masts measure various meteorological variables; however, for this study, only wind speed data were used. Each mast is equipped with four first-class cup anemometers (Thies CLIMA 4.331.10.000) measuring wind speed at heights of 40, 60, 78 and 80 m above ground level, with readings recorded every 10 min. For our analysis, wind speed measurements at the highest level (80 m) were used. To ensure consistency between the temporal resolution of the ERA5 data and the mast observations, hourly wind speed averages were computed from the 10 min measurements. Only complete hours, defined as those with at least six valid 10 min measurements, were included to avoid uncertainties in the hourly calculations. The wind speed observations cover the period from 1 January 2021 to 31 December 2024.
Table 1Details of the study sites and data availability at 80 m during the study period. The terrain category was calculated using the standard deviation (SD) of elevation within a 10 km radius around each site using the SRTM digital elevation model based on the criteria of Borowski et al. (2026).

Wind speed data at 80 m underwent quality control through detailed visual inspection and correlation analysis with wind speed measurements at the other heights. This was done following MEASNET guidelines (MEASNET, 2022). Data from 20 July 2022 to 8 September 2022 at M2 were excluded due to sensor failure. Additional data gaps were identified, mainly related to maintenance campaigns and intermittent power outages caused by persistent cloudy conditions at the sites. Further details on data gaps and site characteristics are provided in Table 1.
2.2 ERA5 data
ERA5 is the fifth-generation reanalysis product developed by the European Centre for Medium-Range Weather Forecasts (ECMWF). It combines numerical weather prediction models with historical observational data using the Integrated Forecasting System (IFS) Cycle 41r2 assimilation model to provide hourly atmospheric variables dating back to 1940 (Hersbach et al., 2020). The spatial resolution of the ERA5 reanalysis dataset is approximately 31 km, with global coverage.
Two ERA5 datasets were used in this study: (1) ERA5 data on single levels, which provide wind components at 10 and 100 m above ground level; and (2) ERA5 data on model levels, which provide wind components from the surface up to approximately 80 km altitude across 137 vertical levels. The first dataset has been widely used for wind resource assessment and is considered a standard reference in the wind energy industry, whereas ERA5 model-level data have been less commonly applied in the literature.
A total of 33 model levels, ranging from 10 m (level 137 – L137) to approximately 3000 m (level 105 – L105), were selected from the ERA5 model-level dataset to evaluate their relationship with wind observations. The wind components from both ERA5 datasets were downloaded using the Climate Data Store API in Python. For each of the four mast locations, ERA5 data were extracted from the nearest grid points without interpolation (see Fig. 1). This was done to avoid introducing uncertainties in subsequent analysis steps. This means that the M1 and M2 masts have the same time series. Finally, wind speed was calculated from the u and v wind components for both datasets.
2.3 Selection of optimal heights and wind speed prediction
Measure–Correlate–Predict (MCP) methods traditionally require a high degree of correlation between wind speed observations and reference data (e.g. reanalysis datasets) to be considered suitable for wind speed prediction. This is commonly assessed using the correlation coefficient (Carta et al., 2013; Houndekindo and Ouarda, 2025). We used the Pearson correlation coefficient to evaluate the relationship between wind speed measurements from the meteorological masts and wind speeds from various ERA5 model levels (ranging from 10 to 3000 m). The model-level height with the strongest correlation was then selected to estimate wind speed.
Wind speed predictions were obtained using the random forest (RF) algorithm (Breiman, 2001), along with a more conventional method – linear regression (LR) with residuals (Weekes and Tomlin, 2014) – for comparison purposes. The RF method has been widely used in recent studies to estimate wind speed and wind energy production due to its high flexibility and robustness. RF has demonstrated comparable results to other sophisticated machine learning models (Abdelsattar et al., 2025) and is considered one of the most popular methods for wind speed prediction (Houndekindo and Ouarda, 2025). In addition, a recent study found that RF most effectively mitigates the influence of interannual wind variations in long-term referencing compared with classical linear regression and that RF outperformed conventional models, especially in complex mountainous terrain (Borowski et al., 2026).
The RF algorithm builds an ensemble of individual decision trees. Each tree is constructed using a random subset of the training data, which minimises overfitting and ensures independent predictions. The final prediction is computed as the average of the individual tree outputs. Additional details on the RF algorithm can be found in Breiman (2001) and Gentleman and Poggi (2020). Accordingly, the RF was applied to estimate wind speed at 80 m for each site, using observed wind speed at this height as reference data and ERA5 wind speed as predictors. Specifically, we trained two RF models: (1) a model using hourly wind speed at 10 and 100 m from the ERA5 single-level dataset, and (2) a model using hourly wind speed at the height with the strongest correlation to mast measurements from the ERA5 model-level dataset identified in the previous step. The first model serves as a benchmark to compare the differences and potential improvements achieved by using the optimal model-level height. It is important to note that, although most studies commonly use either 10 or 100 m ERA5 wind speed variables to estimate near-surface wind speeds, we used both variables, as this combination explained a greater portion of variance in the RF models than using a single variable alone (see Table A1).
For each site, models were trained using observed hourly wind speed data from the first 3 years of the monitoring campaign (i.e. January 2021 to December 2023), and model performance was evaluated using data from the last year (i.e. January 2024 to December 2024). Although 1 year of data is commonly used in MCP applications, 3 years of hourly observations were used to reduce interannual variability and calibrate the models under a broader range of wind conditions. The year 2024 was then reserved for independent model evaluation. Figure 3 compares the probability density functions (PDFs) of observed wind speed during the training and testing periods for the four mast sites. Overall, the PDFs show that the main wind speed ranges observed during the testing period are also present in the training period, suggesting that the training data broadly capture the wind regimes later used for validation. Further details on the number of samples used for training and testing for each site are provided in Table 2.
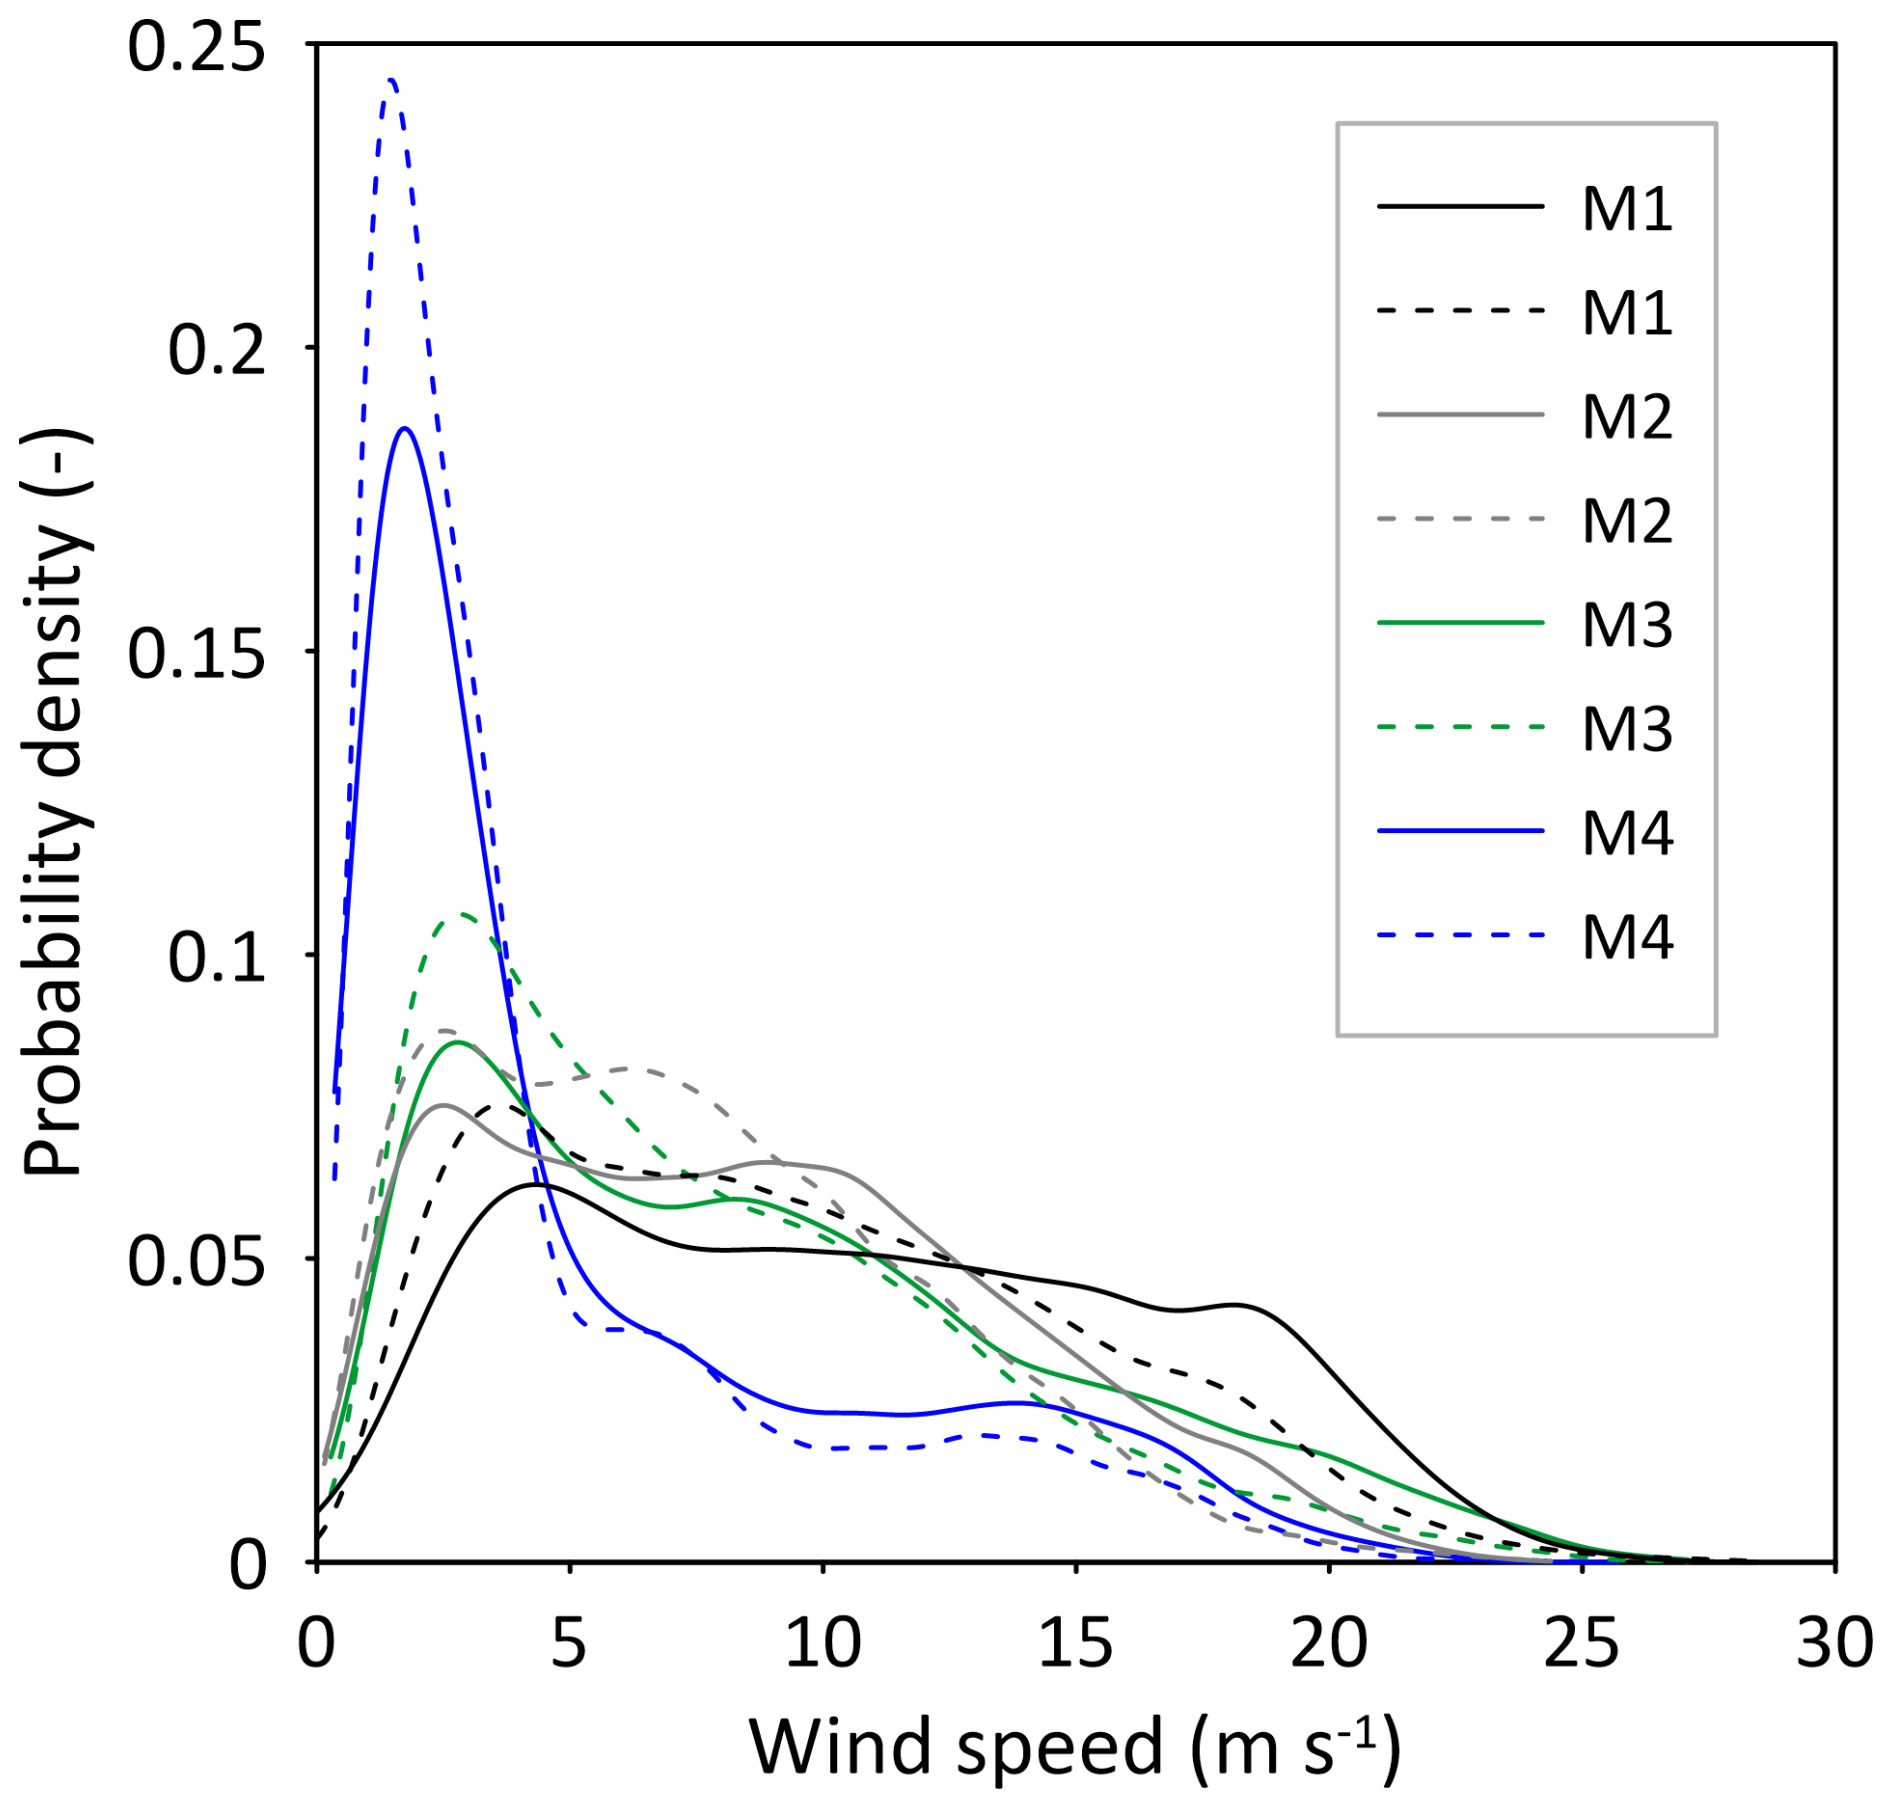
Figure 3Probability density functions (PDFs) of observed wind speed data at 80 m for the training period (solid lines) and testing period (dashed lines) across all mast sites.
Table 2Number of samples used for training period (2021–2023) and testing period (2024) for the random forest models. Percentage of data available relative to each period is shown in parentheses.
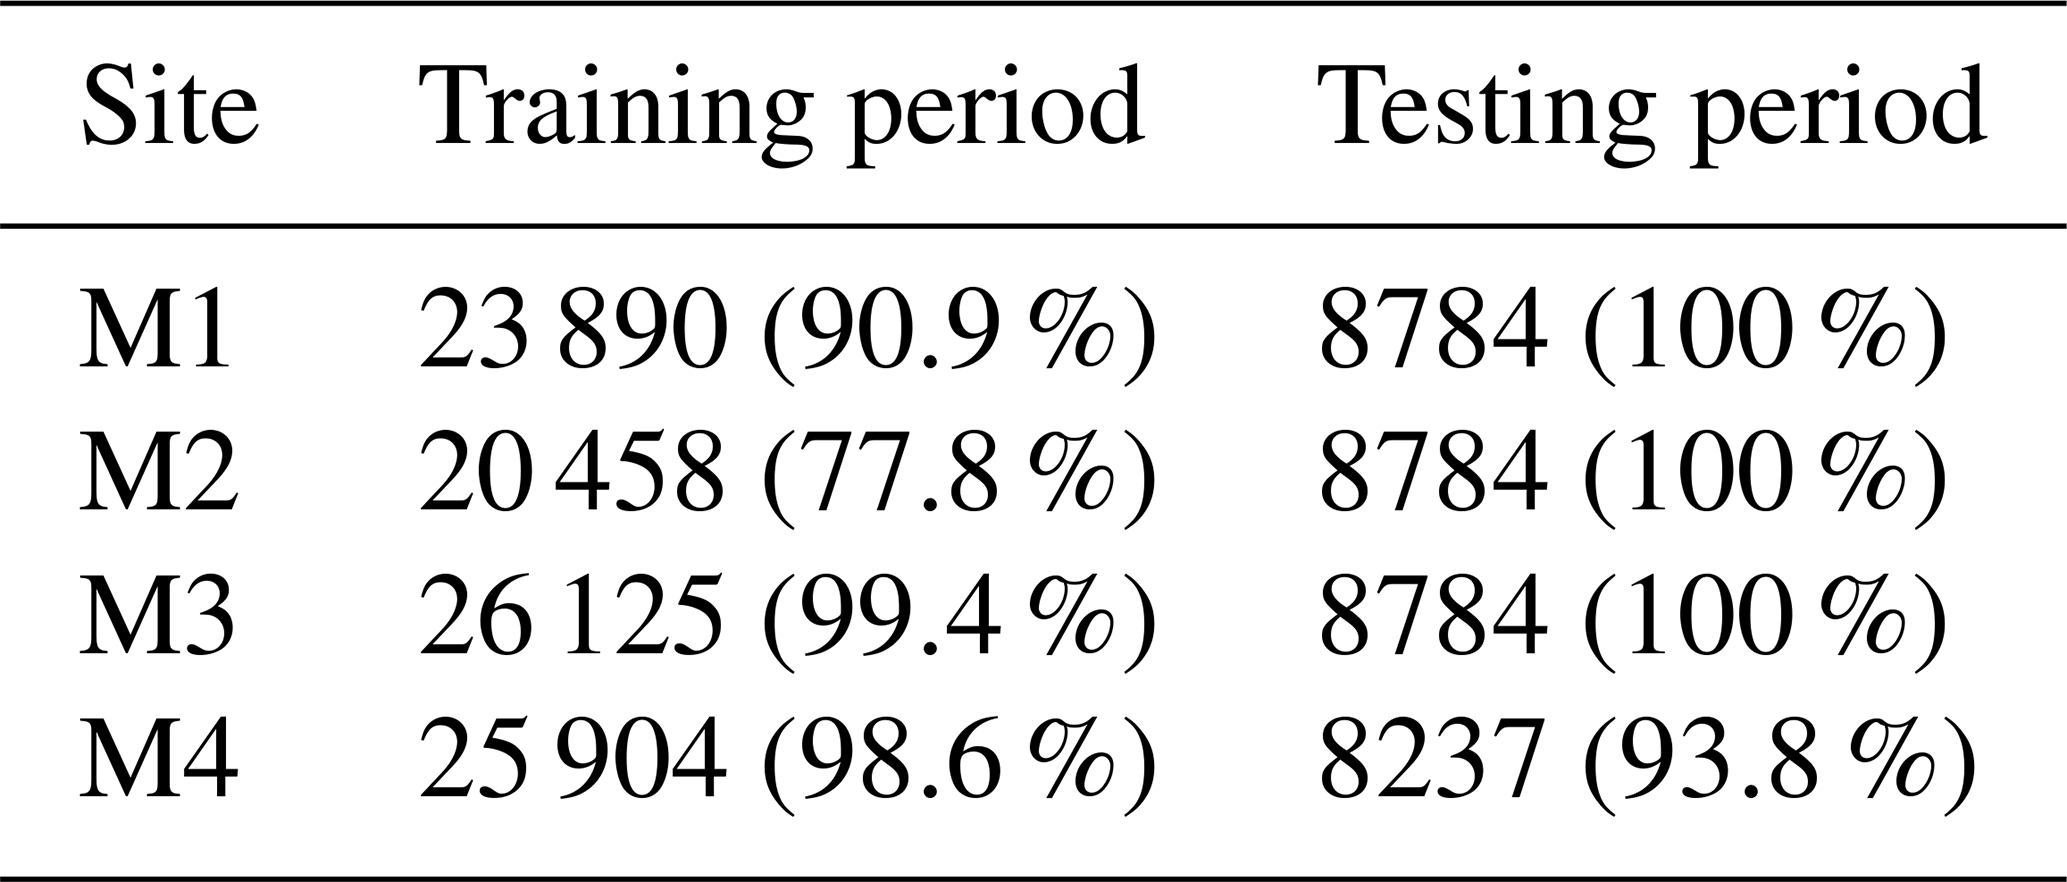

The number of trees and the minimum leaf size, which are the most important parameters of the RF model, were set to 500 and 5, respectively. These values correspond to the recommended default settings of the randomForest function in R (Breiman et al., 2025). As the main objective of this study is to highlight the improvements achieved by incorporating appropriate ERA5 wind speed heights, we did not conduct a hyperparameter optimisation for each site. This decision is further supported by the fact that some studies have reported similar values for their optimal parameter settings (Hallgren et al., 2024; Liu et al., 2024).
Similar to the RF models, two LR models were trained: one using the 10 and 100 m ERA5 wind speed variables and another using ERA5 wind speed data at the height of the highest correlation from the ERA5 model-level dataset. The LR method was implemented following Basse et al. (2021).
2.4 Performance evaluation metrics
In order to quantify the discrepancies between the wind speeds estimated by the RF (and LR) models and the mast wind speed data, three commonly used metrics were employed: root mean square error (RMSE), mean absolute error (MAE) and the coefficient of determination (R2). The RMSE quantifies the average magnitude of the errors and indicates how much the predictions deviate from the reference data. A higher RMSE reflects larger deviations, as this metric gives greater weight to larger errors due to the quadratic term. The MAE calculates the mean of the absolute differences between the reference values and the predictions, treating larger and smaller errors equally without applying additional weighting. The R2 coefficient measures the strength of the linear correlation between the observed and predicted wind speeds. These metrics are defined as follows (Eqs. 1–3):
where yi and are the ith measured and the corresponding predicted values of wind speed. The average of the measured wind speed values is denoted by . The total sample size in the test set is N.
In addition, the Perkins skill score (PSS) test was employed to quantify the discrepancies in the frequency distribution between estimated and observed wind speed using Eq. (4):
where H1 and H2 represent the first and second histogram, and Fb represents the normalised frequency for bin b. The PSS represents the fraction of overlap between the two histograms, so that a PSS of 1 represents complete overlap, whereas a value of 0 indicates a complete mismatch. The PSS was calculated considering a detailed bin width of 1 m s−1, similar to Borgers et al. (2024).
2.5 Wind energy estimation and evaluation
This subsection outlines the methodology used to evaluate how wind speed data from different RF models (i.e. using ERA5 single-level or model-level data) influence the estimated annual energy production (AEP) at the four study sites. Two power curves were considered in the analysis, based on the turbines installed in existing wind farms in continental Ecuador (Villonaco: 2700 and Minas de Huascachaca: 1100 ): the Goldwind GW70/1500 and the Vestas V112/3450. Although Minas de Huascachaca operates with Dongfang Electric Corporation wind turbines, the corresponding power curves were not publicly available. Therefore, we used the Vestas V112/3450 power curve, which has similar characteristics to the turbines installed at that site. Details on the turbine operational ranges, hub heights and power curves used in this study are provided in Table 3 and Fig. A1 in the appendix.
The AEP was calculated using wind speed estimates from the RF models at a hub height of 80 m. The percentage error (PE) was used to quantify the differences in wind energy estimates based on the different wind speed predictions. This evaluation was carried out for the year 2024 which was not part of the RF training dataset. The PE was calculated using Eq. (5):
where AEPRF is the annual energy production modelled from wind speed estimated by the RF models, and AEPSYN is the synthetic annual energy production modelled from observed wind speed data.
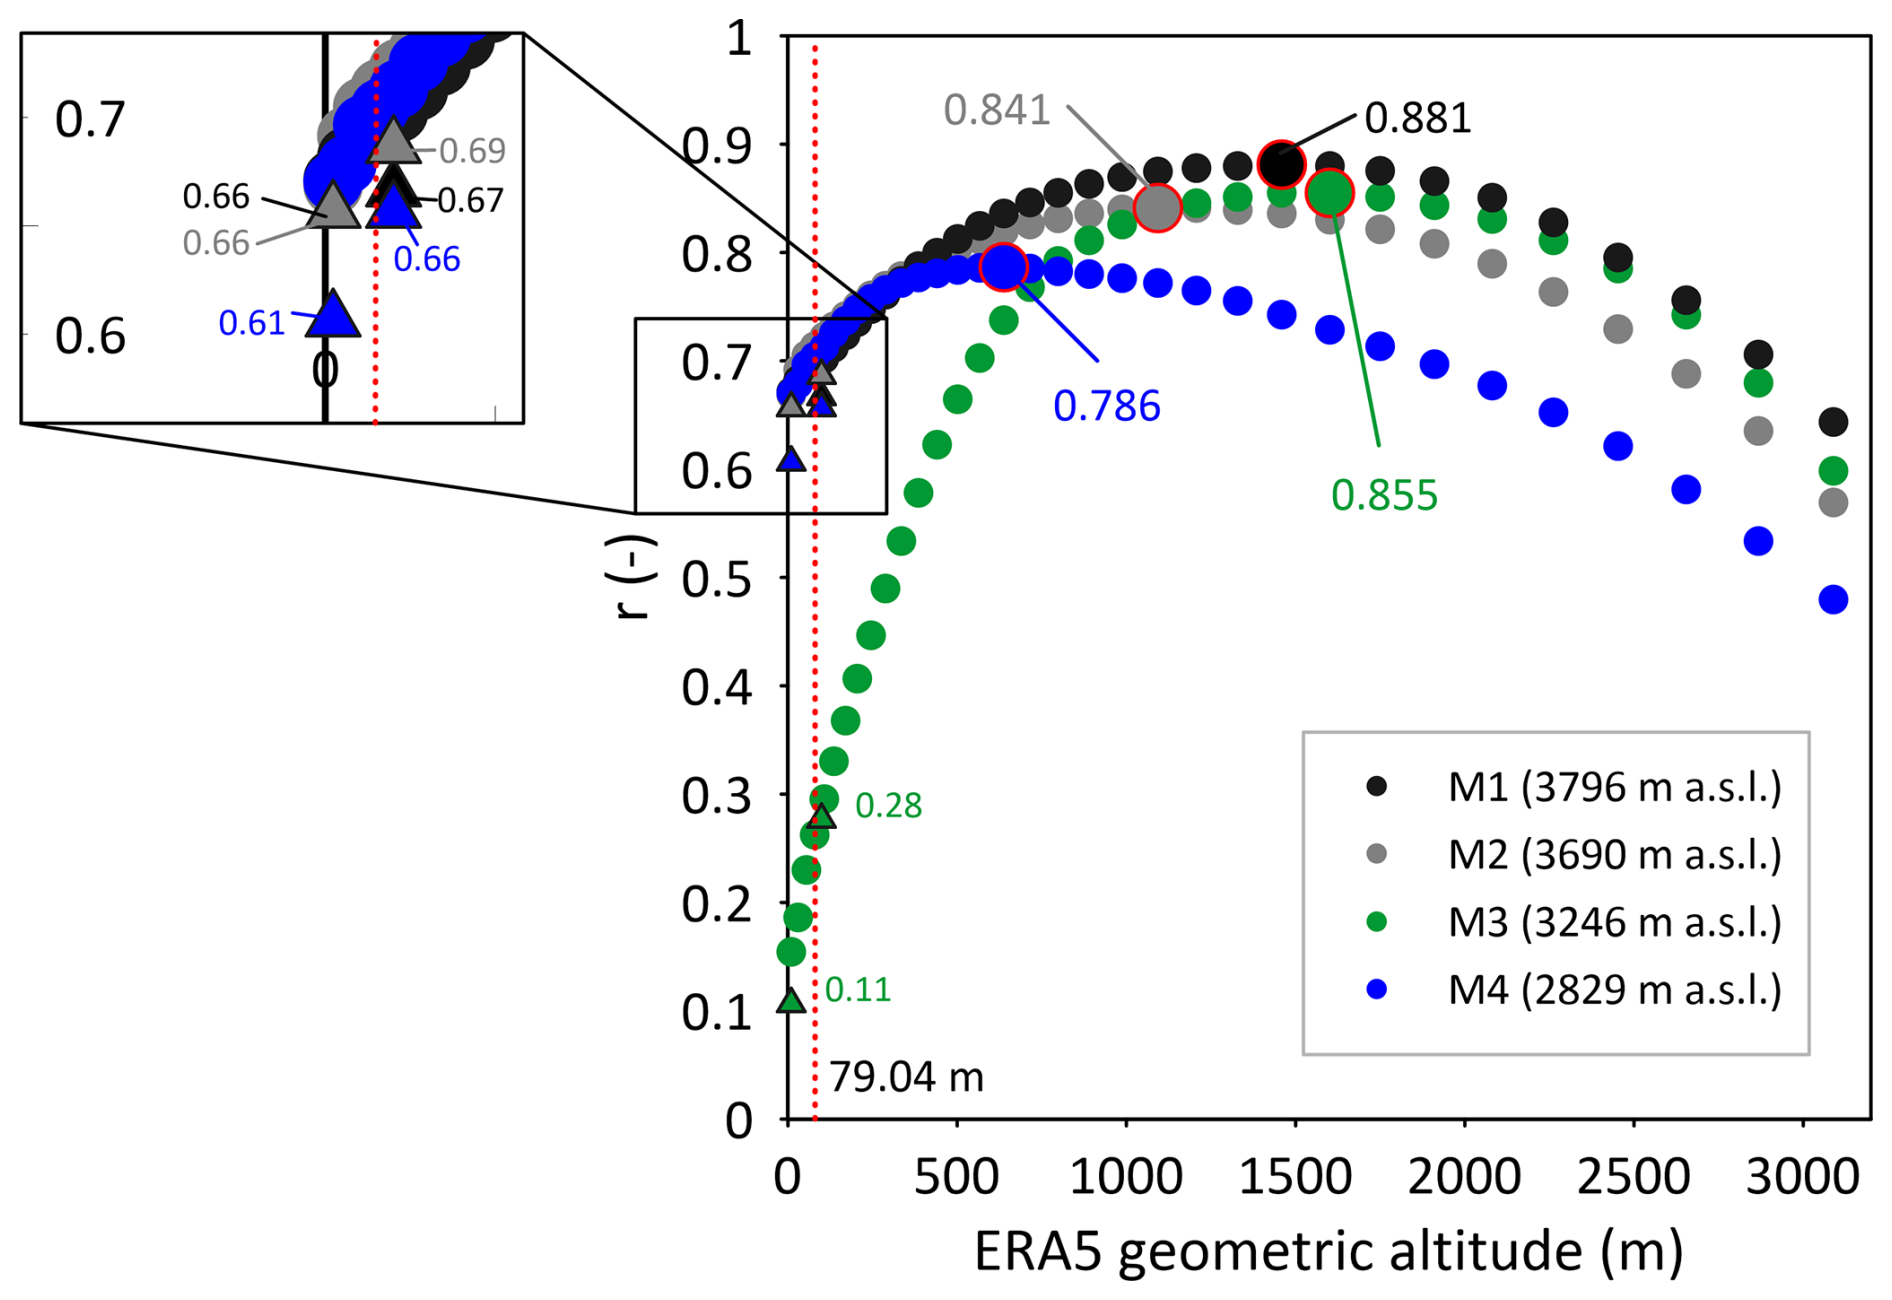
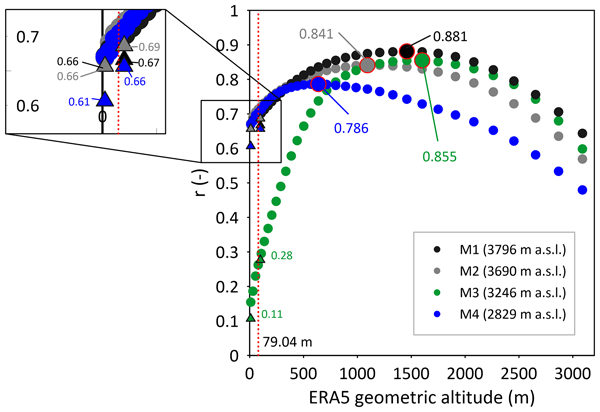
Figure 4Correlation between observed wind speed at 80 m height at four sites and ERA5 data at different geometric altitudes for the period from January 2021 to December 2023. The 10 and 100 m wind speeds from the ERA5 single-level dataset are indicated by triangles, with their corresponding correlation magnitudes included. For each site, the highest correlation value is indicated by larger circles. The dashed red line indicates the model height closest to the observations. Site elevation is indicated in parenthesis in the legend.
3.1 Evaluation and selection of optimal heights from ERA5 model-level data
The correlation between wind speed observations and ERA5 model-level data at different heights above ground level (i.e. geometric altitude) is shown in Fig. 4. An inverted parabolic relationship is observed between correlation magnitude and height: correlation values increase steadily from ∼ 0.27–0.74 at hub height (79.04 m; the closest ERA5 model-level height) until reaching a maximum of ∼ 0.79–0.88, after which the correlation begins to decrease. The maximum correlation between observations and ERA5 data was consistently achieved at heights substantially higher (∼ 600–1600 m) than the measurement height (80 m) across all mast locations. To corroborate our findings, we performed the same analysis at three sites with flat topography in the coast region of Ecuador (two located at the coastline and one at an inner location; see Fig. A1 in the appendix). The results showed that, at the coastal and flat locations, the strongest correlations with observed wind speeds occurred near the actual hub height (at 287.52 m/L128 for all sites), with little differences in the correlation values between the closest level to the observations and the height of highest correlation (r < 0.03). In addition, higher correlations between observations and ERA5 were observed for the inner site than for the coastal sites. These results indicate that wind speeds of ERA5 model-level data over flat terrain are representative of hub-height conditions at the coastal and inner flat sites but are not representative in mountainous areas.
Notably, at M3, the correlation increased from approximately 0.27 at the measurement hub height (79.04 m) to 0.855 at the height of maximum correlation, underscoring the potential for improving wind speed estimates by identifying optimal model heights. This pronounced difference, compared to the other sites, may be attributed to the larger discrepancy between the actual site elevation and the ERA5 model elevation (e.g. ΔM1 = −755 , ΔM2 = −649 , ΔM3 = −1125 , ΔM4 = −132 ; see Fig. 1). The height of maximum correlation was similar for M1, M3 and M2, whereas for M4 it occurred at a lower elevation. Interestingly, the magnitude of the maximum correlation was comparable for M1 (0.881), M2 (0.841) and M3 (0.855) – all of which are located on well-exposed areas. However, it was lower for M4 (0.786), which is situated around hills probably influencing local wind speed behaviour (see Fig. 1c).
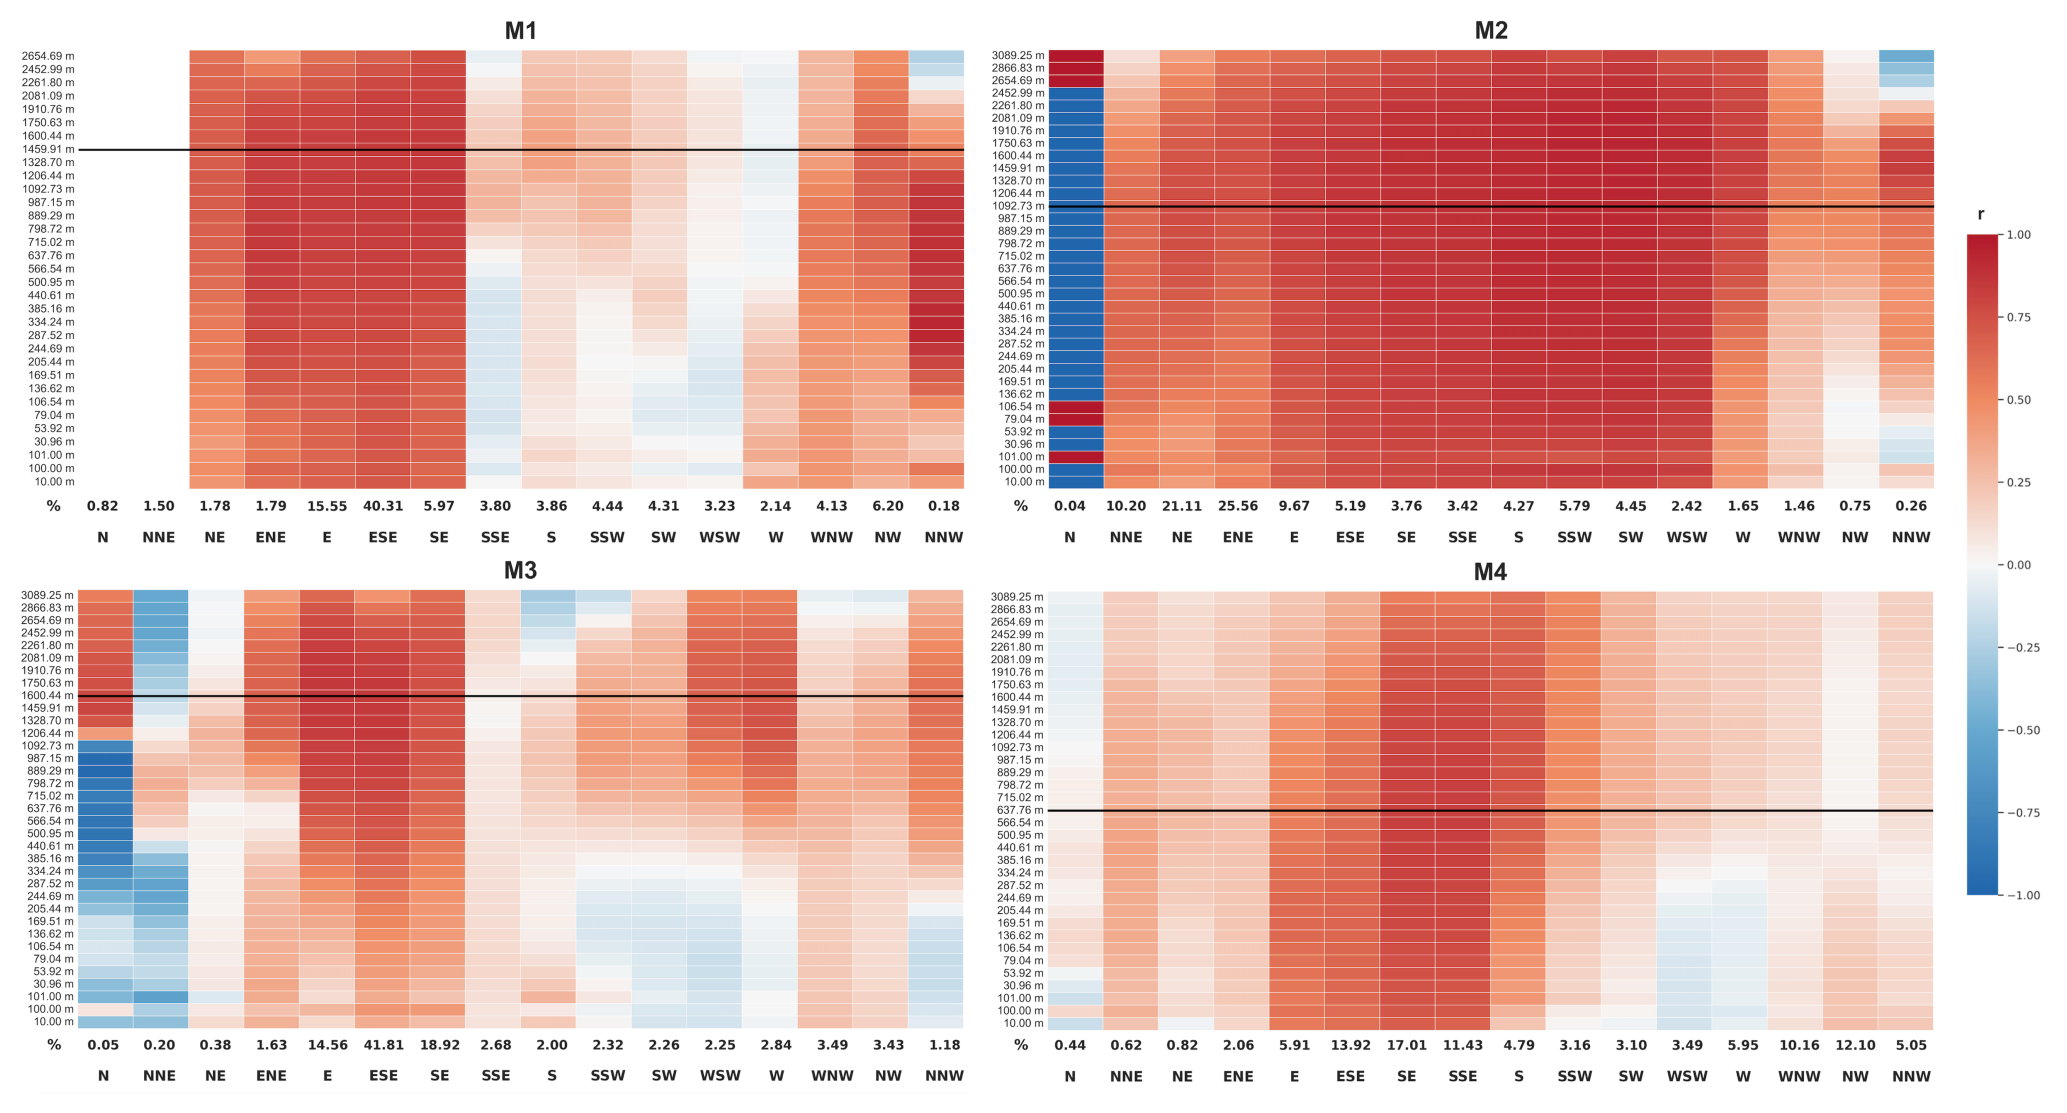
Figure 5Correlation magnitude between observed wind speed at 80 m and ERA5 wind speeds at different model-level heights, stratified by wind direction for each mast site. The colour scale represents the Pearson correlation coefficient (r). The percentage of recorded data for each direction is shown below the direction labels. The horizontal black line indicates the optimal ERA5 model level selected for each site according to Fig. 4.
The model height selection was done based on the analysis of 3 years (2021 to 2023). This means that the year 2024, which is later used as a testing dataset, was excluded from the analysis in order to avoid artificially increasing model performance. In addition, a sensitivity analysis was performed to assess whether the selected height remained the same across different years. The results indicate that the identified heights were broadly consistent over time, with only minor year-to-year variations (± 1 height level from the optimum identified in Fig. 4), thereby supporting the robustness of the selection (see Fig. A3).
To further explore whether the improved agreement between ERA5 upper model levels and hub-height observations is related to terrain-induced directional effects, we analysed the correlation patterns as a function of wind direction and model-level height. Figure 5 shows that the relationship between observed wind speed at 80 m and ERA5 model-level winds is strongly dependent on wind direction. In general, the highest correlations occurred within the dominant wind sectors at each mast site, particularly for easterly to southeasterly flows. The selected optimal ERA5 model level generally intersects these high-correlation bands, indicating that upper ERA5 model levels better represent hub-height winds when the large-scale flow is aligned with the prevailing local wind regimes. Conversely, weaker or negative correlations in less-frequent sectors suggest a stronger influence of local terrain effects and direction-dependent flow modification.
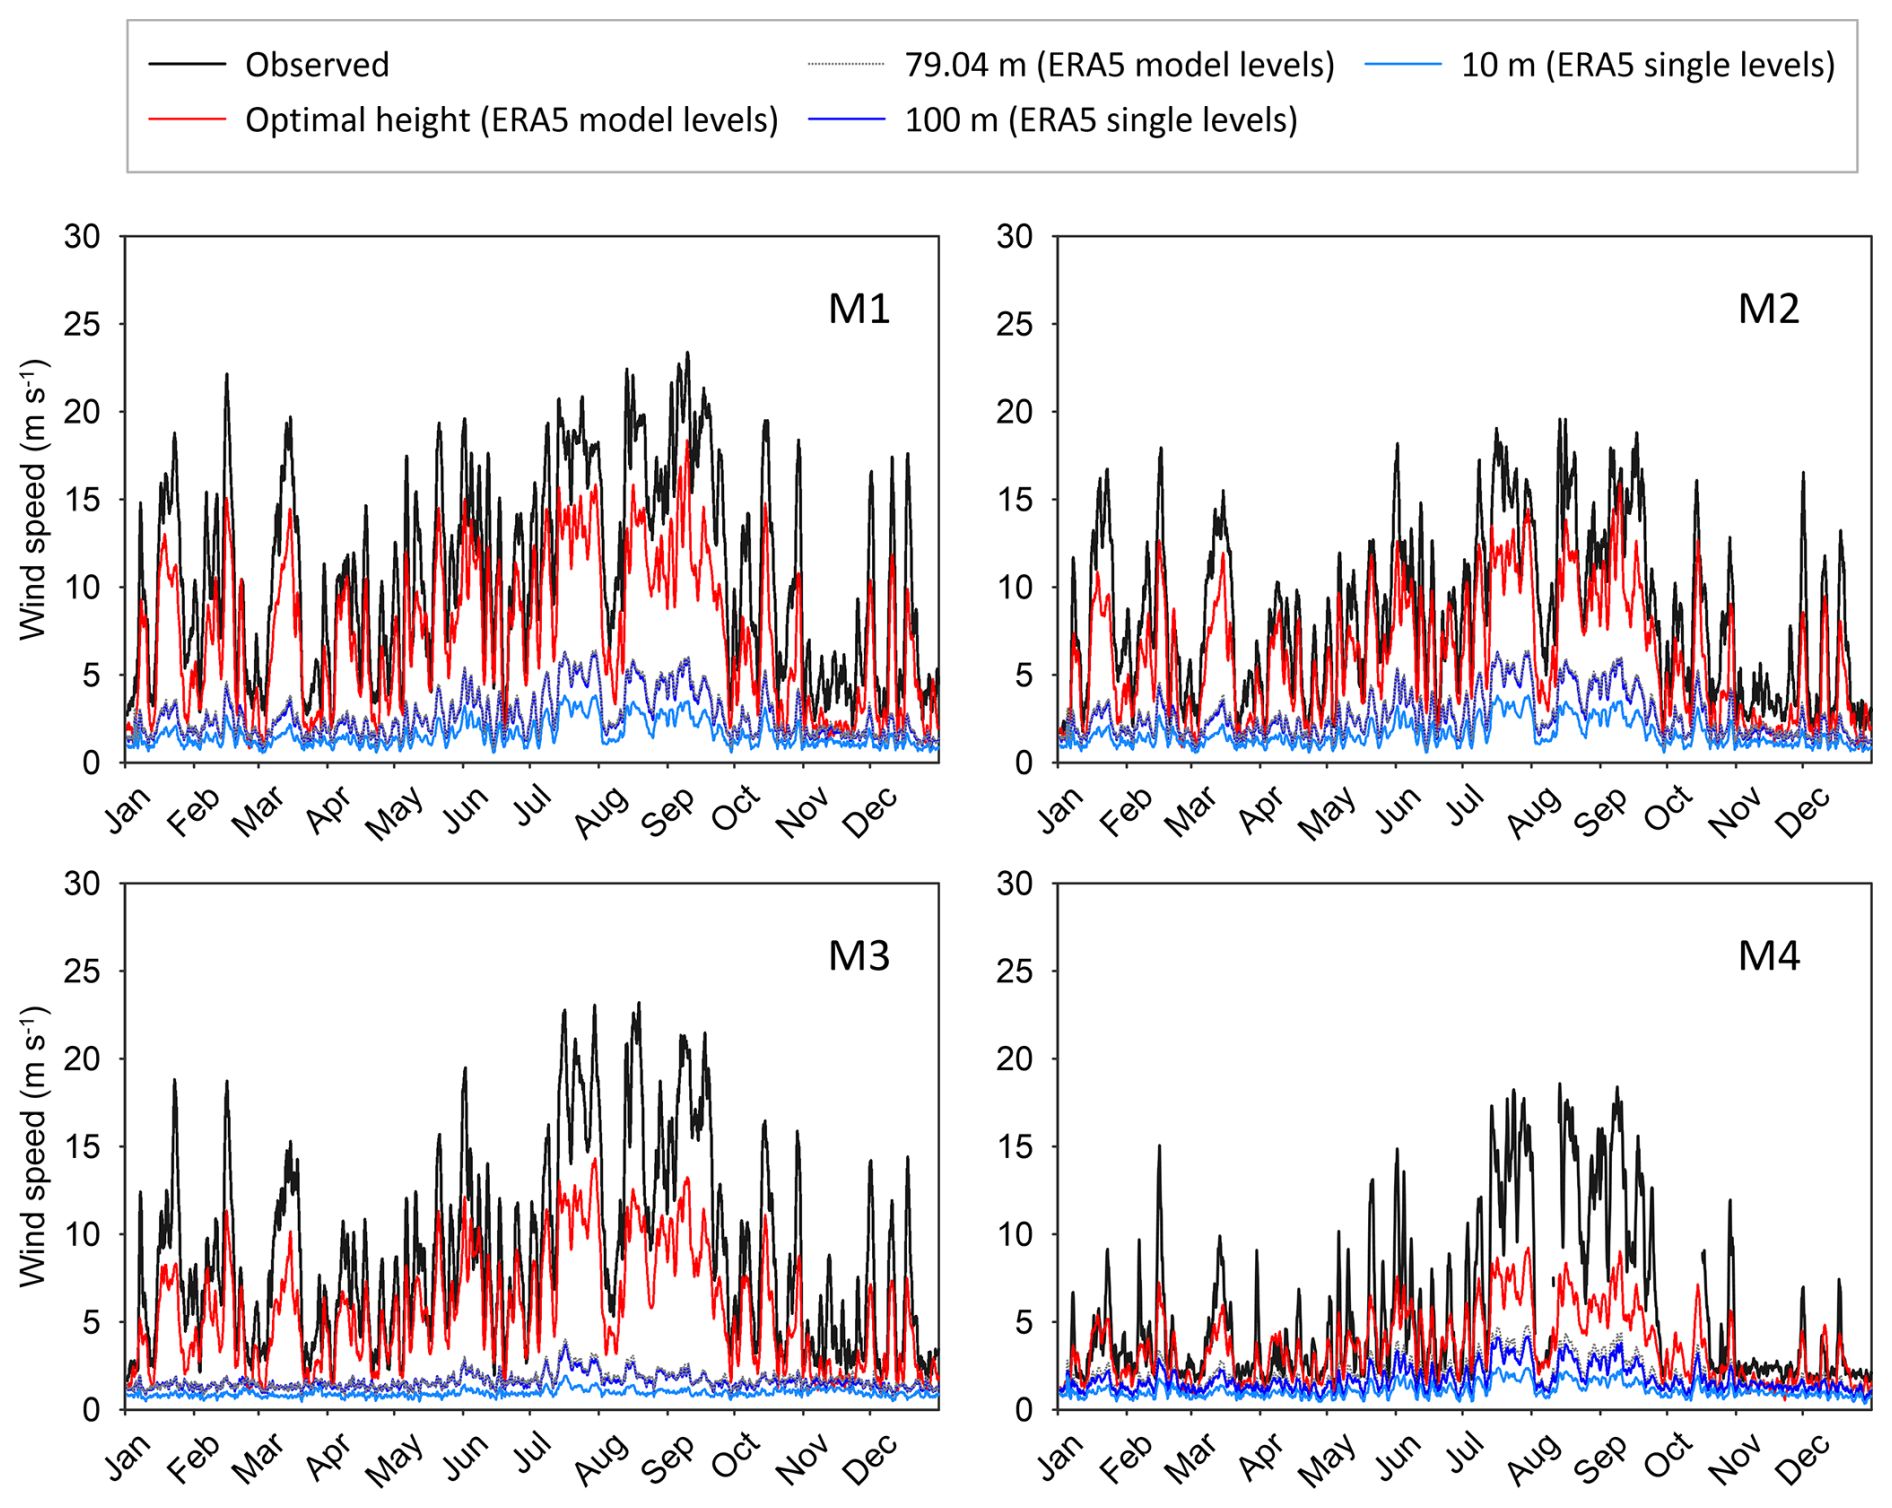
Figure 6Wind speed time series for the observations and ERA5 data in 2024. The time series shows the 24 h running average instead of the hourly time series for visualisation proposes. Note that at M1, M2 and M3, the wind speed series at 100 m (ERA5 single level) and 79.04 m (ERA5 model level) overlap.
Figure 6 shows the comparison between hourly wind speed time series for the year 2024 for all ERA5 datasets and the observations. The ERA5 datasets include wind speeds at 10 and 100 m, as well as wind speeds at the closest height to the observations (79.04 m) and at the optimal correlation heights identified in Fig. 4, both extracted from the ERA5 single-level and model-level dataset, respectively. Figure 6 shows substantial discrepancies between observed wind speeds and those estimated using ERA5 single-level data (at 10 and 100 m). The wind speed from the model-level data at the height closest to the observations shows similar variability and magnitude to the ERA5 single-level data at 100 m, showing a systematic underestimation throughout the year.
In contrast, the wind speed time series retrieved using the optimal correlation heights demonstrated substantial improvements in representing wind speed variability across all study sites, although wind speeds were still underestimated, particularly during high wind periods. The dynamics of wind speed were better captured at the M1 and M2 sites compared to the others. This analysis clearly suggests the potential for improving wind speed estimates by using higher model-level heights from ERA5 as reference data for MCP modelling.
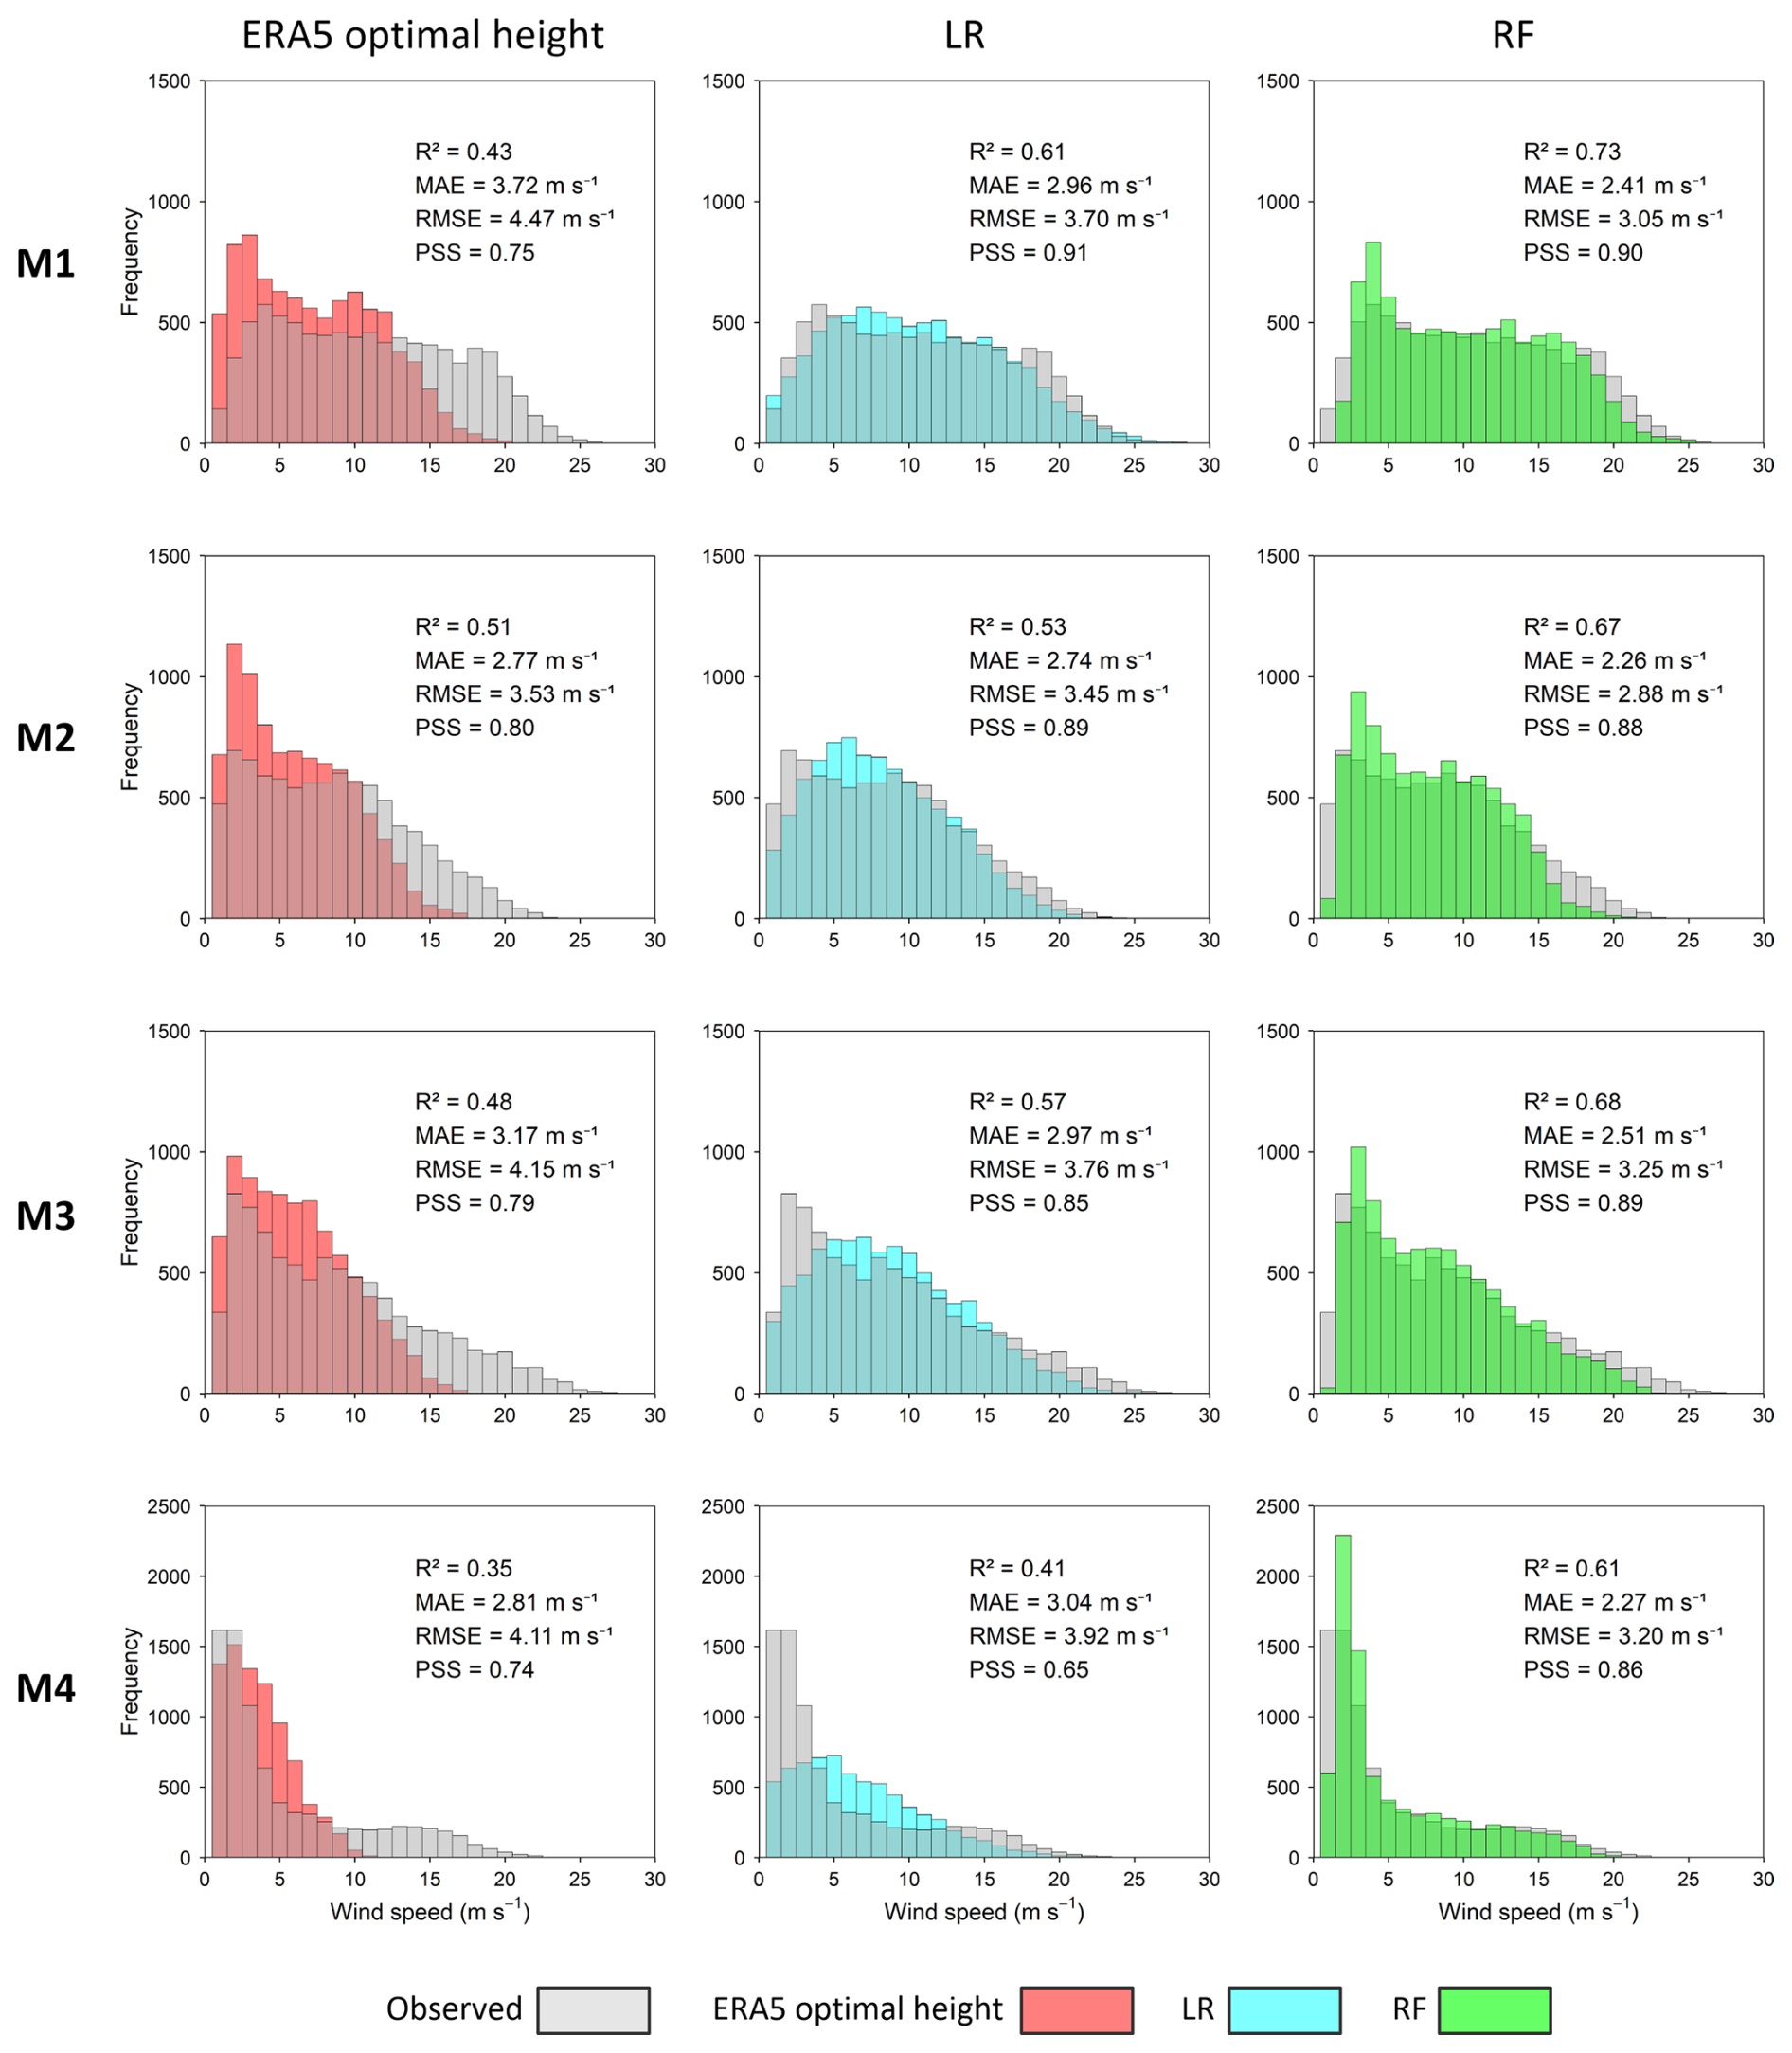
Figure 7Comparison of wind speed frequency distributions between observed wind speeds, ERA5 wind speeds at the optimal levels and wind speed estimates obtained using LR and RF, with ERA5 optimal-level data as input across the four study sites for 2024. For each site, the figure also displays the performance metrics.
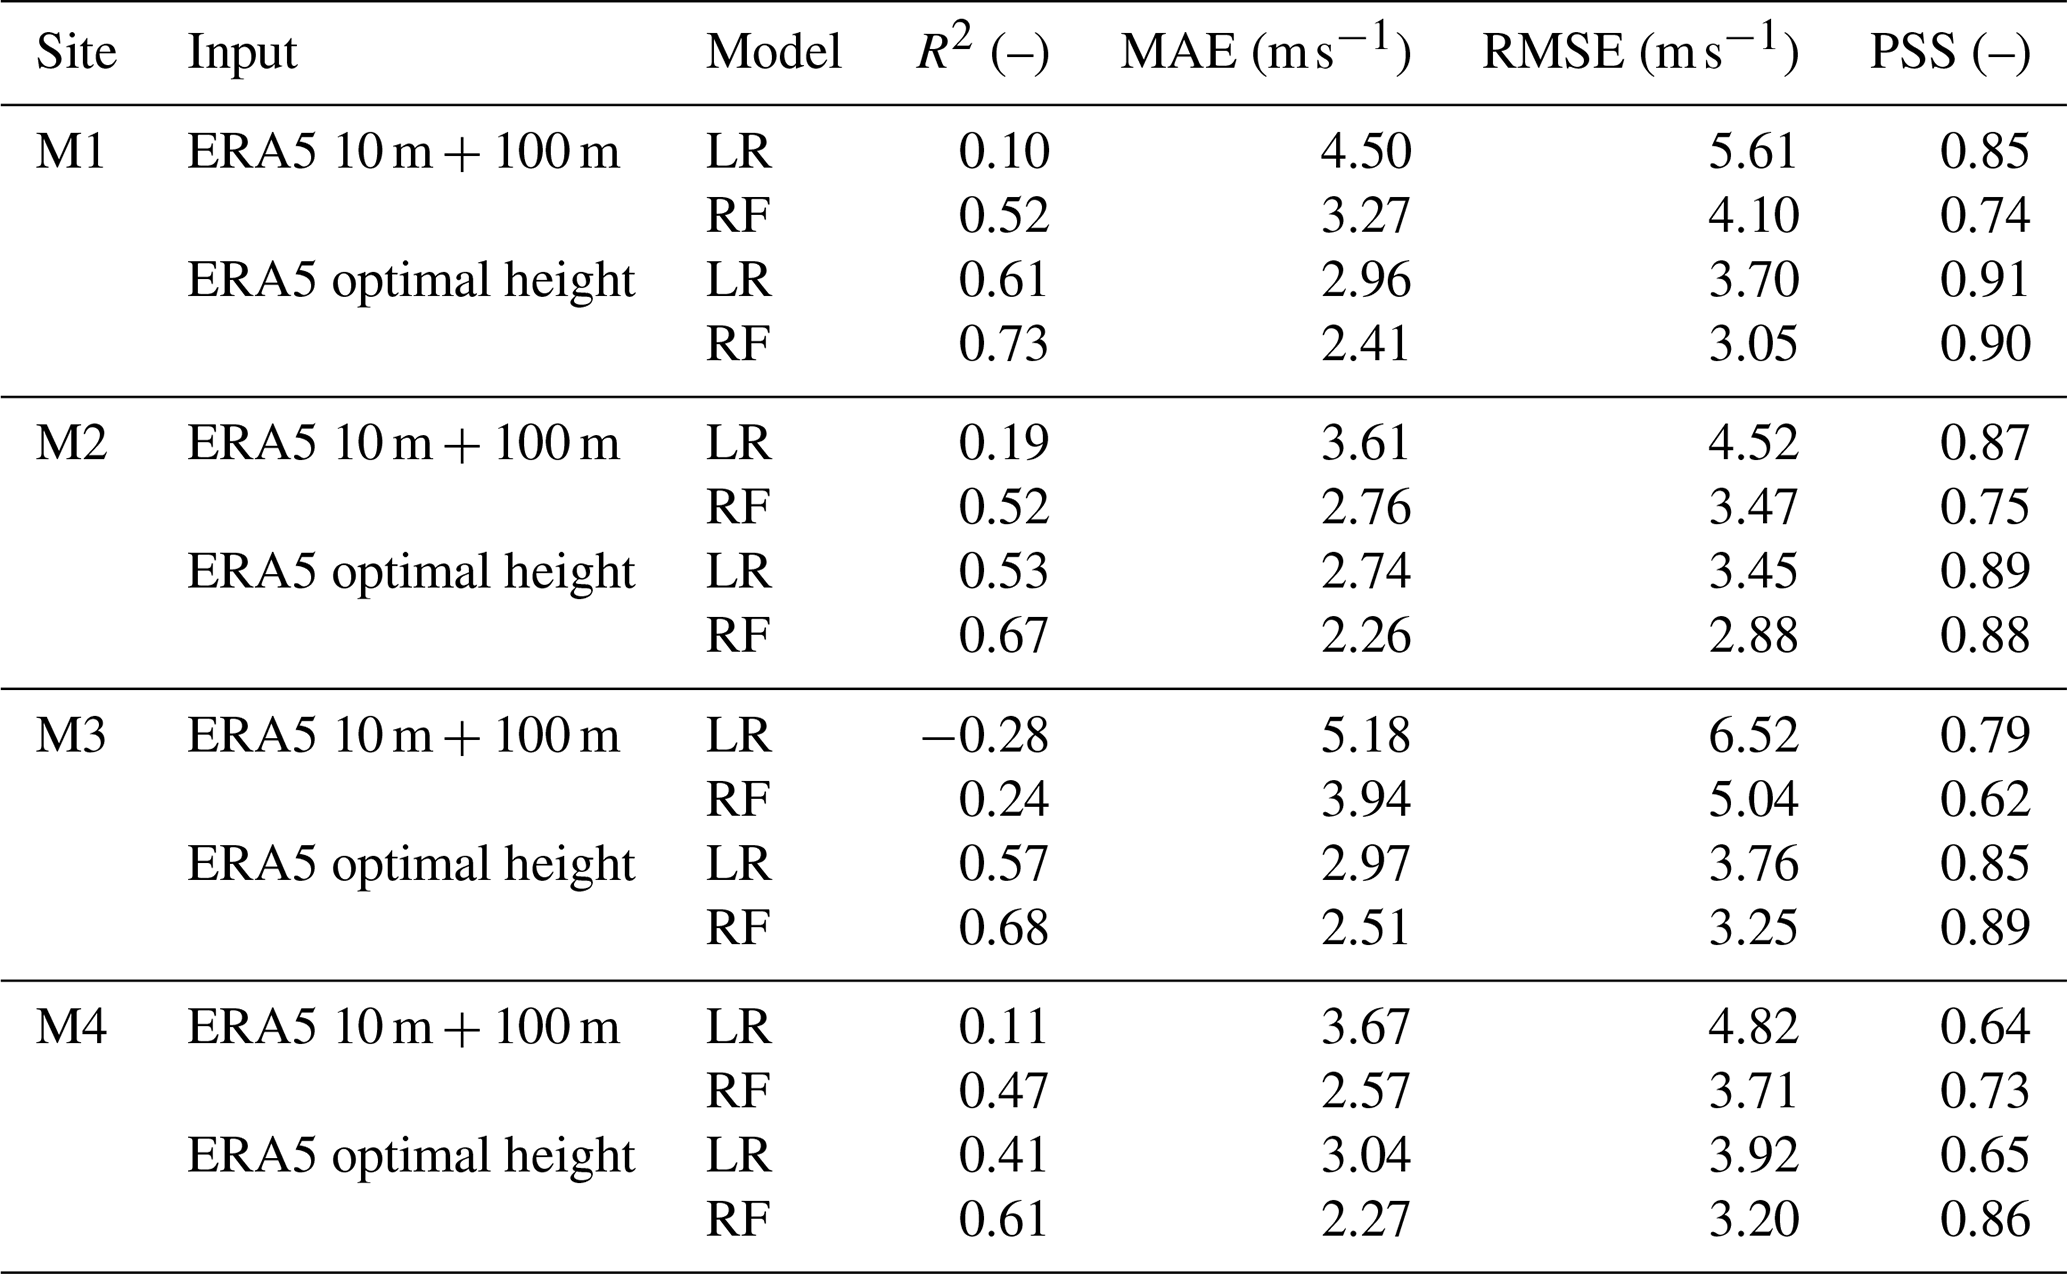
Table 4Performance of wind speed estimates using ERA5 single-level dataset (10 and 100 m) and ERA5 optimal heights as inputs in LR and RF models.
3.2 Evaluation of wind speed predictions
A full comparison of the performance of wind speed estimates using the ERA5 single-level dataset (10 and 100 m) and ERA5 optimal height with LR and RF is provided in Table 4. The frequency distribution of observed and predicted wind speed for both models using the ERA5 optimal height as input is shown in Fig. 7, along with their evaluation metrics for the validation period (year 2024). To quantify the contribution of the RF model to wind speed predictions, a direct comparison between ERA5 wind speeds at the optimal level and the observations was also included in Fig. 7. This comparison shows that ERA5 optimal-height data generally exhibited wind speed distributions skewed towards lower values, with a marked underestimation of frequencies above 10 m s−1 at all sites in comparison to the observations and estimations of LR and RF.
Table 5Coefficient of variation (CV) calculated for wind speed observations at 80 m, ERA5 wind speed at the optimal height and wind speed estimates obtained using LR and RF with ERA5 optimal height as input.
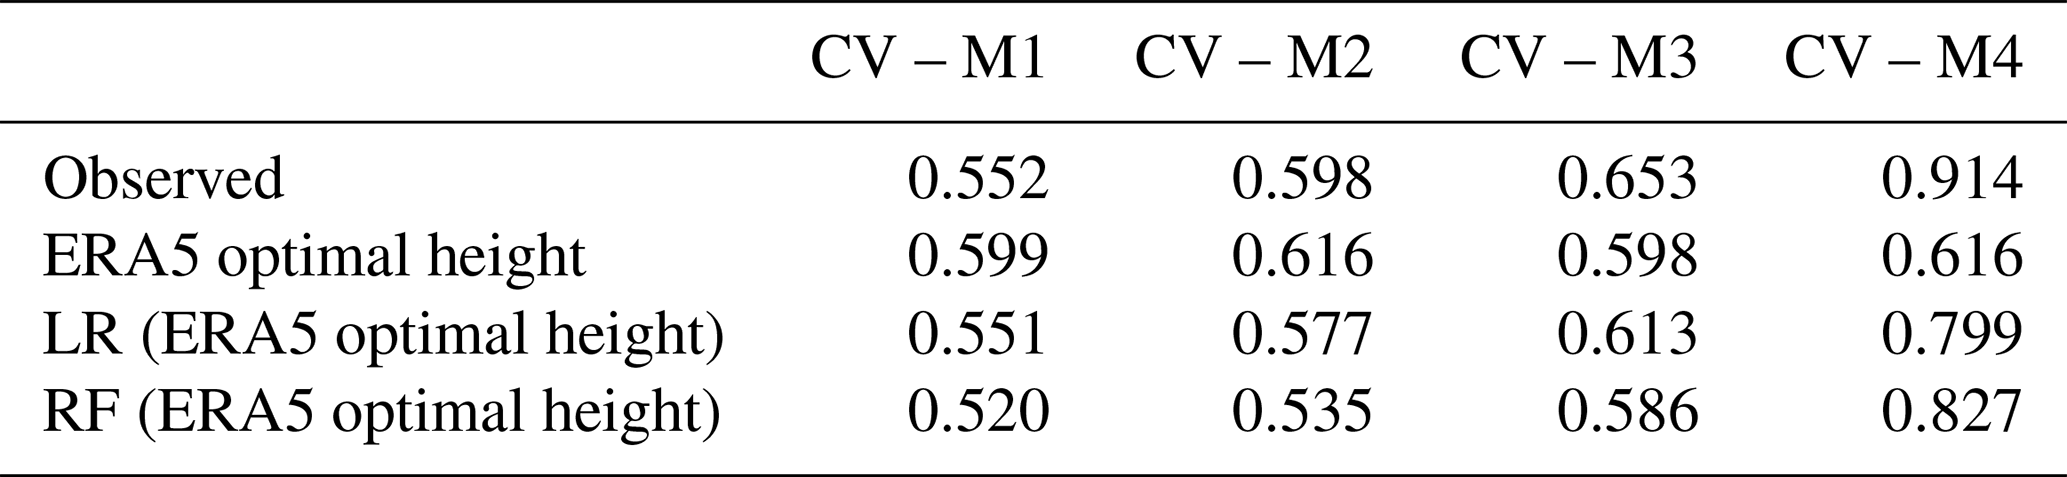
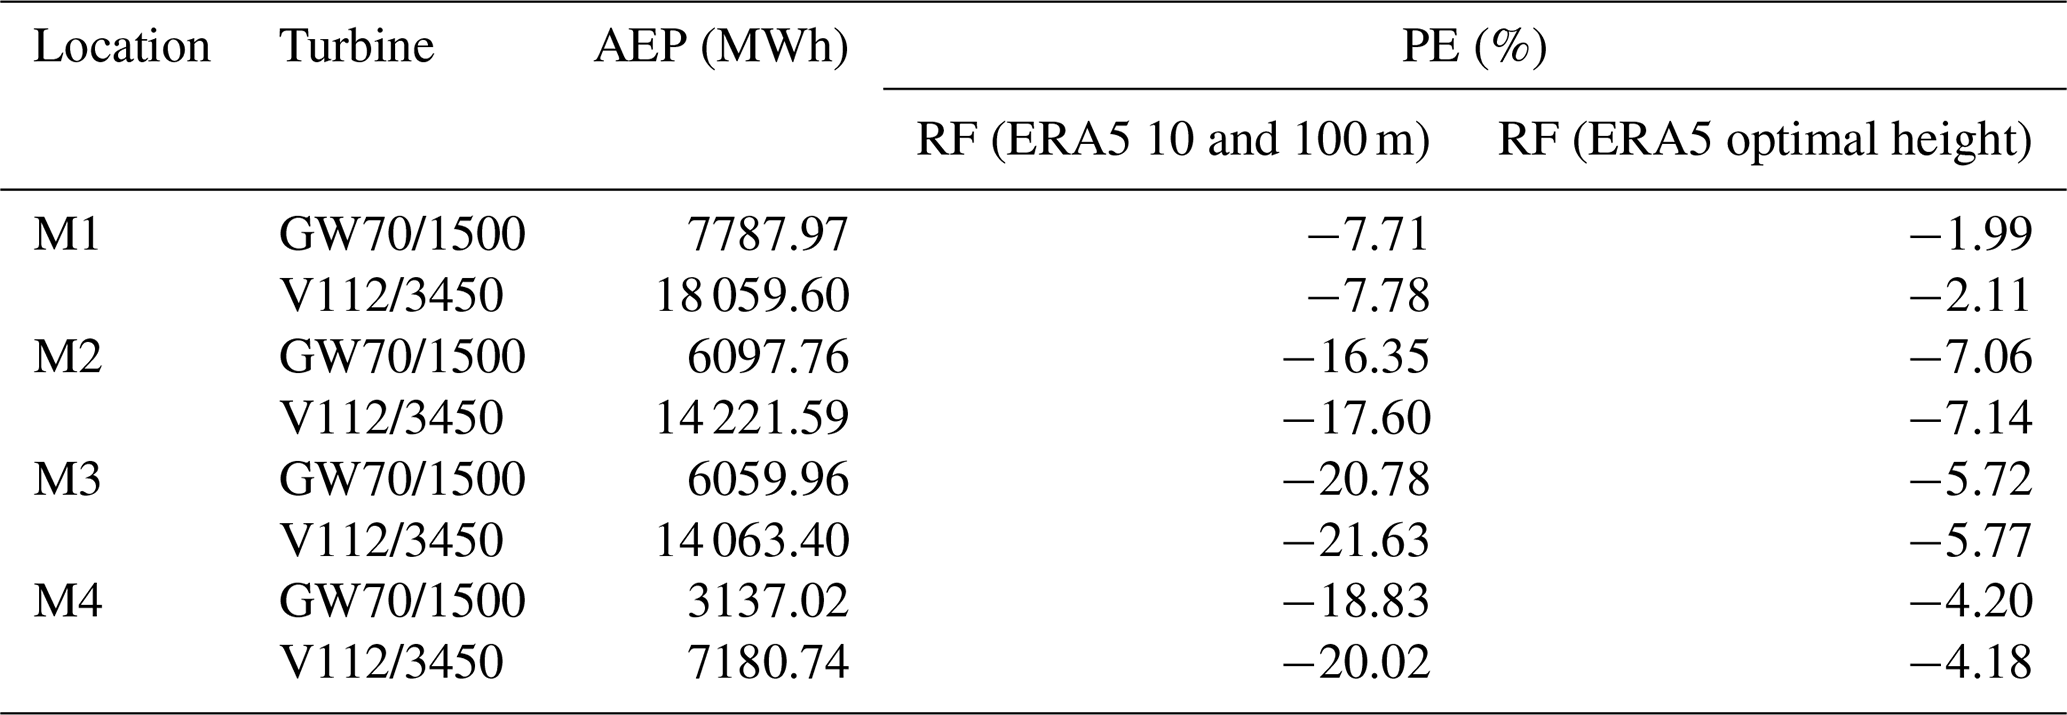
Table 6Annual energy production (AEP) estimates from wind speed RF models compared with observed data.
The optimal-model height as input for wind speed prediction provided the best match with the observed data for all sites, leading to higher R2 and PSS performances, and lower MAE and RMSE values than the predictions that used ERA5 single-level data using both LR and RF (see Table 4). In general, RF outperformed LR, especially when comparing estimates with ERA5 optimal height as input. For the RF model, the average values of the four sites show an improvement of 40 % in R2 values, whereas for MAE and RMSE, this led to an improvement of 23 % in both metrics. For PSS, the predictions reached an improvement of 59 % with respect to the reference model (ERA5 single-level dataset). These results indicate a higher improvement in the predictions to simulate the wind speed dynamics and distribution than the magnitude of wind speed.
Despite the improved performance with the RF model, systematic discrepancies remain. In general, the modelled distributions tended to underestimate the frequency of very low wind speeds (i.e. < 1 m s−1) and overestimated the frequency of moderate wind speeds, particularly at M2 and M3. In addition, the frequency of high wind speeds (> 15 m s−1) was underestimated for all sites, especially at M1, M2 and M3. These ranges, however, varied slightly by site (Fig. 7). These biases suggest challenges in capturing the full variability of wind speeds, particularly at the distribution extremes, which is a well-known problem with the RF algorithm and other machine learning methods. In this regard, the LR method seems to better fit extreme values, as shown in Fig. 7. Based on the coefficient of variation, we confirmed a greater reduction in the dispersion of the distribution when using RF compared with LR (Table 5).
3.3 Annual wind energy estimation
The results presented in Table 6 show the annual energy production (AEP) estimates obtained using the RF models compared to the observed AEP values for different turbine types at the four study sites. We focus on the RF models because they provided the most reliable wind speed estimates. Overall, predictions using the optimal wind speed height consistently outperformed the estimates based on ERA5 single-level data, providing lower percentage errors across all locations and turbine types.
The percentage error (PE) was reduced by approximately a factor of 3 compared to the reference input dataset for both turbines, indicating substantial improvements in AEP estimation accuracy. The similar PE values obtained using the two different power curves suggest that the choice of power curve had little influence on the relative accuracy of the AEP estimates in our study.
The RF estimates achieved the smallest discrepancies at the highest elevation site (M1), with PE values of −1.99 % for the GW70/1500 turbine and −2.11 % for the V112/3450 turbine. In contrast, the largest deviation was observed at M2, where the PE reached approximately 7 %. This higher underestimation is mainly related to the underestimation of the frequency of wind speeds above 16 m s−1 compared with the other sites (Fig. 7). It should be noted that the M1 and M2 sites are located within the same ERA5 pixel. Thus, the larger error at M2 may be attributed to the limited representativeness of the ERA5 pixel in capturing the local flow conditions at this site. As shown in Fig. 1c, M1 appears to be more representative of the dominant topographic characteristics within the ERA5 pixel, whereas M2 is surrounded by higher mountains, which likely influence the local flow conditions.
These findings highlight the importance of using appropriate ERA5 model-level heights for improving wind energy production estimates in complex mountainous environments.
Our study evaluated the hypothesis that, in the Andean mountainous region, wind speed from higher model levels in ERA5 are more representative of conditions at wind farm sites that the traditionally used 10 or 100 m single-level ERA5. The reason was that these locations are often exposed to free atmospheric flow rather than surface-level wind dynamics. Even if the topographic issue in mountain areas was previously identified in the literature (Gualtieri, 2022), this is the first time that higher model-level heights were explored, identifying its suitability.
The results presented above confirm that ERA5 consistently underestimates wind speed variability in the tropical Andes (Figs. 6 and 7) in line with other studies in complex terrain (e.g. Draeger et al., 2024; Hu et al., 2023; Jourdier, 2020; Khadka et al., 2022). A central result, in line with our hypothesis, is that higher atmospheric levels of ERA5 (i.e. from model-level dataset) above the hub height are stronger correlated to observed wind speed than lower levels at the hub heights. This is not the case for coastal masts where higher correlations between ERA5 and observed wind speed were very close to the hub heights (Fig. A2). Although in both Pacific coast and Andean regions, the highest correlation is above the hub height of 80 m, these differences are significantly amplified for Andean sites. Therefore, these results support our hypothesis that observed wind speed in the Andes is more closely tied to upper atmospheric levels of ERA5 than to surface-level data.
Interestingly, optimal heights in the Andes were higher when differences between in situ measured and ERA5 topography were larger too. This pattern may be explained by the coarse spatial terrain representation of ERA5, which smooths the actual terrain features within each grid cell, simulating lower wind speeds. For instance, the highest improvement in the level of correlation between hub height and the optimal-level height was achieved particularly in M3 where differences in topography were strong. In this particular case, M3 is located at a peak compared to most of the surrounding landscape area within the ERA5 grid (Fig. 1c). These results highlight the possibility of estimating wind speed for a particular site by selecting higher model-level heights of ERA5 wind speed.
A substantial improvement in the prediction of wind speed was obtained using optimal-height information of ERA5 model levels in comparison with the commonly used 10 and 100 m wind speed heights of ERA5 single levels, corroborating the suitability of using this specific dataset for mountain areas. Wind speed estimation showed similar performance for all sites using the optimal heights of ERA5 model levels compared to the ERA5 single-level datasets; however, relatively small differences were noticed at M4. The lower performance at M4 is mainly due to the difficulty of the RF model in estimating low wind speeds, particularly within the 0–3 m s−1 range. The models showed a marked underestimation of frequencies between 0 and 1 m s−1, and an overestimation of wind speed values between 2 and 3 m s−1. As this site has a higher frequency of wind speeds within these ranges, the overall model performance is compromised in this case.
A strictly fair comparison between our findings and previous studies is challenging because most studies used additional reanalysis-derived covariates, included surface-level wind speed observations as input variables or reported different performance metrics. Borowski et al. (2026) assessed the performance of different MCP methods using ERA5 reanalysis data in Europe and the United States. They found better estimates with RF than the liner regression model, especially in complex mountain terrain. Although these results may be influenced by the inclusion of additional atmospheric variables rather than only 100 m wind speed used in linear regression, our results confirm the better performance of RF than LR when considering the same input variables. Cavaiola et al. (2023) used ERA5 10 m wind speed, along with other ERA5 atmospheric variables, and quantile RF (a method similar to RF) to calibrate wind energy estimates at mountainous sites in Italy. Their results showed biases of approximately −20 % to 40 % in the 20-year accumulated wind energy estimates across the study sites. Although our results are based on annual energy production rather than accumulated long-term production, we manage to provide accurate estimates using only the optimal height, with errors below 7 % at all sites.
Compared with studies conducted in simple terrain, our wind speed estimates using RF and LR with ERA5 data at the optimal height still showed lower performance than those reported for flat terrain using ERA5 wind speeds at 100 m. For instance, Schwegmann et al. (2023) reported an R2 of approximately 0.81 and 0.75 in north-eastern France when using RF and LR, respectively. These values are significantly higher than the R2 values found in this study, which ranged from 0.61 to 0.73 for RF and from 0.41 to 0.61 for LR. Nevertheless, we emphasise that our results are obtained for a highly complex terrain.
The study of the impact of wind estimates on energy production is not commonly assessed in previous studies. The higher improvement in the reduction of underestimation of AEP estimates is promising for the evaluation of annual production. The best AEP estimates in M1 in comparison to the other sites are related to the lower occurrence of low wind speed which was poorly estimated all the sites as was indicated previously. The impact of standard power curves used in this study showed negligible influence on the AEP estimation in our study area. This is because the cut-in wind speed of turbines considered in the study are above 2–4 m s−1, being discarded values below this threshold in the calculation of AEP. This result indicates that wind speed estimates obtained by our approach could be reliable for the estimation of AEP using different turbine models. However, higher underestimations would be expected for sites with high frequencies of low wind speed.
It should be noted that as our main objective was to highlight the suitability of an optimal model-level height to estimate wind speed, no other heights were included in the RF model. Although the application of RF with one input variable (i.e. ERA5 optimal-level height) may be considered unconventional, further studies could consider additional closest level heights to the optimal level as input features to improve the wind speed estimates. We expect that the inclusion of these levels might improve the representation of interactions between atmospheric heights as they emulate wind shear effects, as was evidenced using 10 and 100 m ERA5 wind speed in the reference model (see Table A1). In addition, due to the highly complex topography interactions in the Andes, sub-grid scale variables from ERA5 representing surface–atmosphere interactions could be tested to improve wind speed estimates. In particular, gravity waves have been identified as a relevant variable to estimate wind speed in mountainous areas (e.g. Hu et al., 2023). We are also aware that optimal heights were obtained after a detailed search of candidate heights, which may require researchers to analyse a relatively large amount of information. Thus, future studies are necessary to include more masts sites to identify relationships between the performance of ERA5 and differences in topographical features as a practical model for the search of optimal levels for sites.
This study examined whether the use of higher atmospheric levels from the ERA5 model-level dataset can improve wind speed predictions compared to the conventional use of ERA5 single-level data in the complex mountainous terrain of the tropical Andes. Site-specific random forest (RF) models were trained using 3 years of hourly wind speed observations at 80 m from four high-altitude masts located in southern Ecuador. In addition, linear regression with residuals (LR) was implemented as a reference method for the comparison of wind speed estimates. The predictions were validated against an independent year of observations and further tested for energy applications through the estimation of annual energy production (AEP) using two representative power curves.
The results demonstrate that wind speeds from higher ERA5 model levels (i.e. levels between ∼ 600 and 1600 m) showed stronger correlations with observed wind speeds than the conventional single-level data at 10 and 100 m in mountainous terrain. This finding indicates that although near-surface and hub-height wind speeds over flat terrain are representative of observed hub-height conditions at coastal and inner flat sites, they are not representative in mountainous areas. In particular, better correlations between ERA5 optimal level and observed wind speed were obtained at well-exposed locations (e.g. ridge-top sites) than at sites strongly affected by local flow behaviour (e.g. sheltered hillslopes or valleys). Consequently, the ERA5 model level with the highest correlation proved to be more suitable for wind speed prediction using both LR and RF, with RF providing the best estimates regarding statistical metrics and distribution-based evaluation. RF predictions captured wind speed variability and distribution more effectively than absolute magnitudes (i.e. RMSE). Improvements were most pronounced at well-exposed sites located on peaks, whereas localised sites with surrounding obstacles (e.g. M4) showed smaller gains. In the latter site, higher underestimations would be expected due high frequencies of low wind speed and the challenges of the RF models in predicting extreme values (0–1 m s−1); however, these values showed no major impact in AEP estimates as wind turbines considered here operate at higher wind speeds (> 2.4–4 m s−1). For energy applications, the percentage error in AEP was significantly reduced to ∼ 2 %–7 % compared with ∼ 8 %–22 % when using ERA5 single-level data.
Despite these promising results, some limitations are acknowledged for interpreting and generalising the findings. The analysis was based on a limited number of masts located in a specific region of the tropical Andes, and most sites correspond to well-exposed locations with relatively high wind potential. Therefore, additional observations from other complex-terrain regions, including more sheltered hillslope or valley sites, would be needed to assess the broader applicability of the results. Moreover, the representativeness of individual masts may vary according to their local exposure and surrounding terrain characteristics. These results may also depend on the selected ERA5 grid point, particularly where the reanalysis topography differs from the real terrain. Alternatively, future studies could employ the weighted-pixel extraction approach proposed by Gualtieri (2021), which considers neighbouring pixels to improve the spatial representativeness of the sites. Finally, although the sensitivity analysis showed no major interannual changes in the selected optimal-height levels, the relatively short analysis period considered here (2021–2024) may not fully capture longer-term climate variability or periods with anomalously high or low wind speeds. Extending the analysis to longer periods and additional sites would help to better evaluate the robustness and transferability of the proposed approach.
These findings highlight the potential of combining higher ERA5 model-level data with random forest models as a powerful and cost-effective approach for wind resource assessment in mountainous areas. As this method relies on freely available reanalysis data and requires a relatively low computational cost, it provides a practical alternative to mesoscale climate models for estimating long-term site-specific wind speed and energy production in complex terrain.
Table A1Percentage of explained variance of random forest models trained using various combinations of ERA5 single-level wind speed inputs. In bold are the best model for each site.
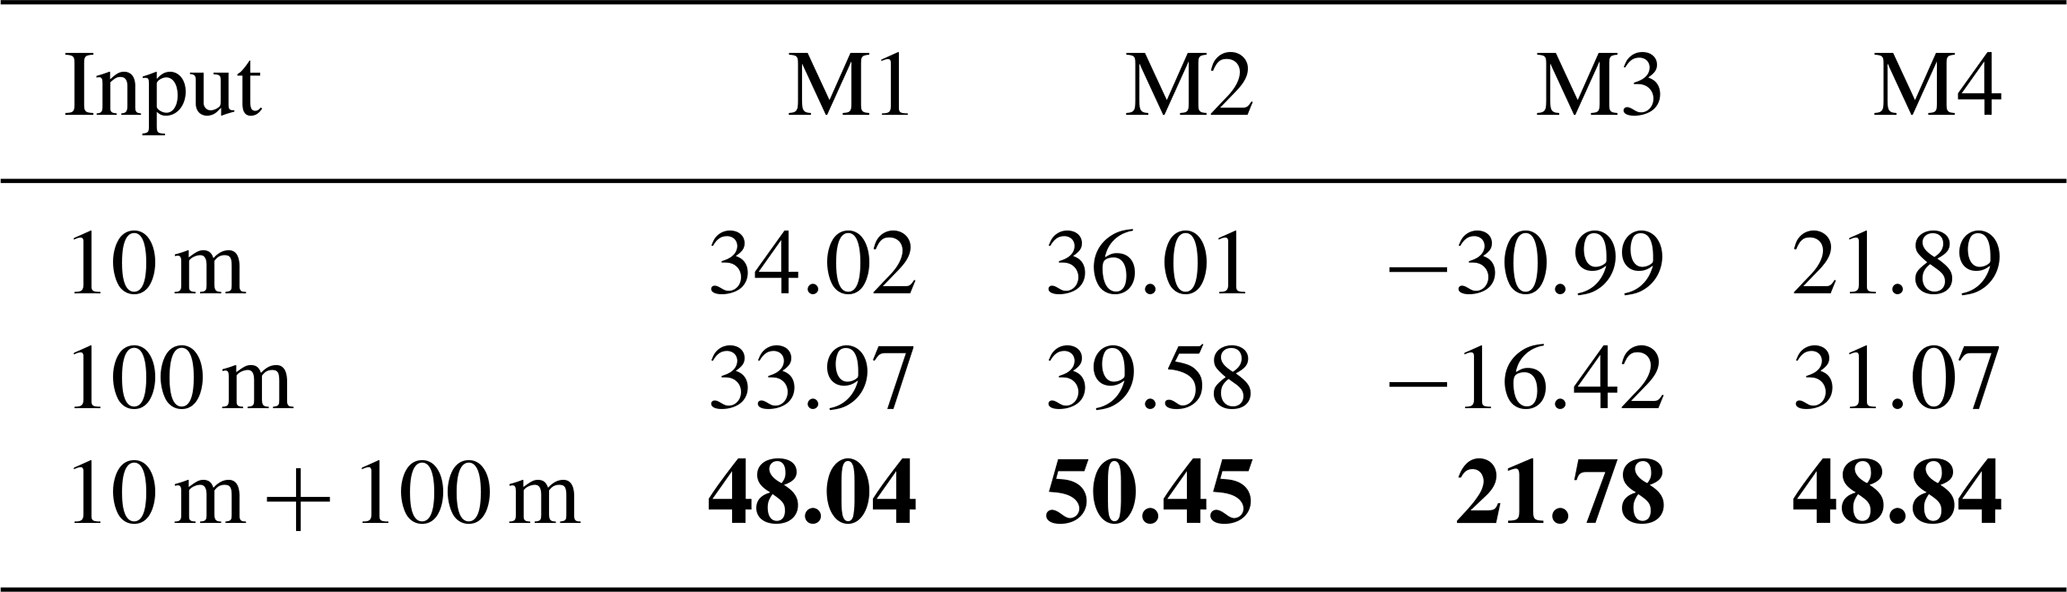
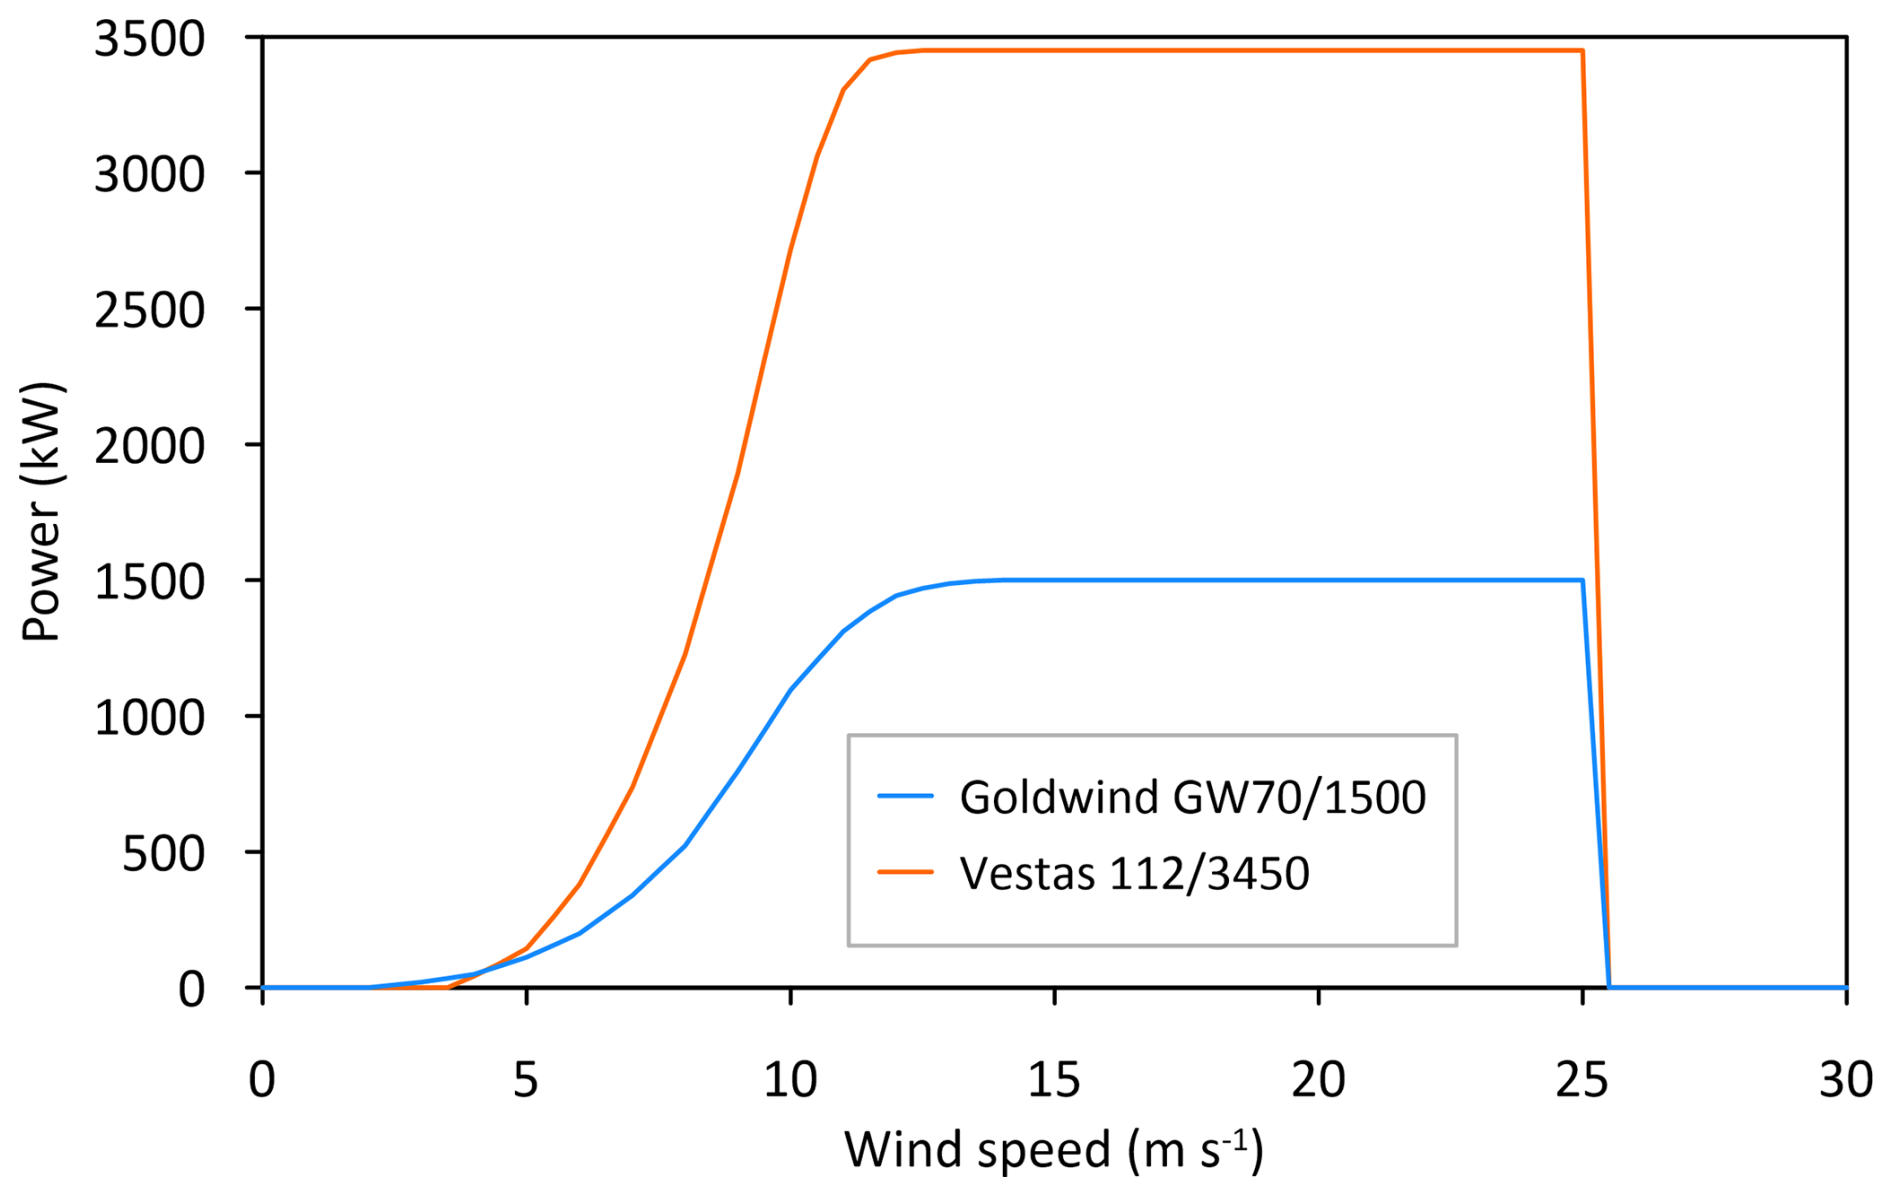
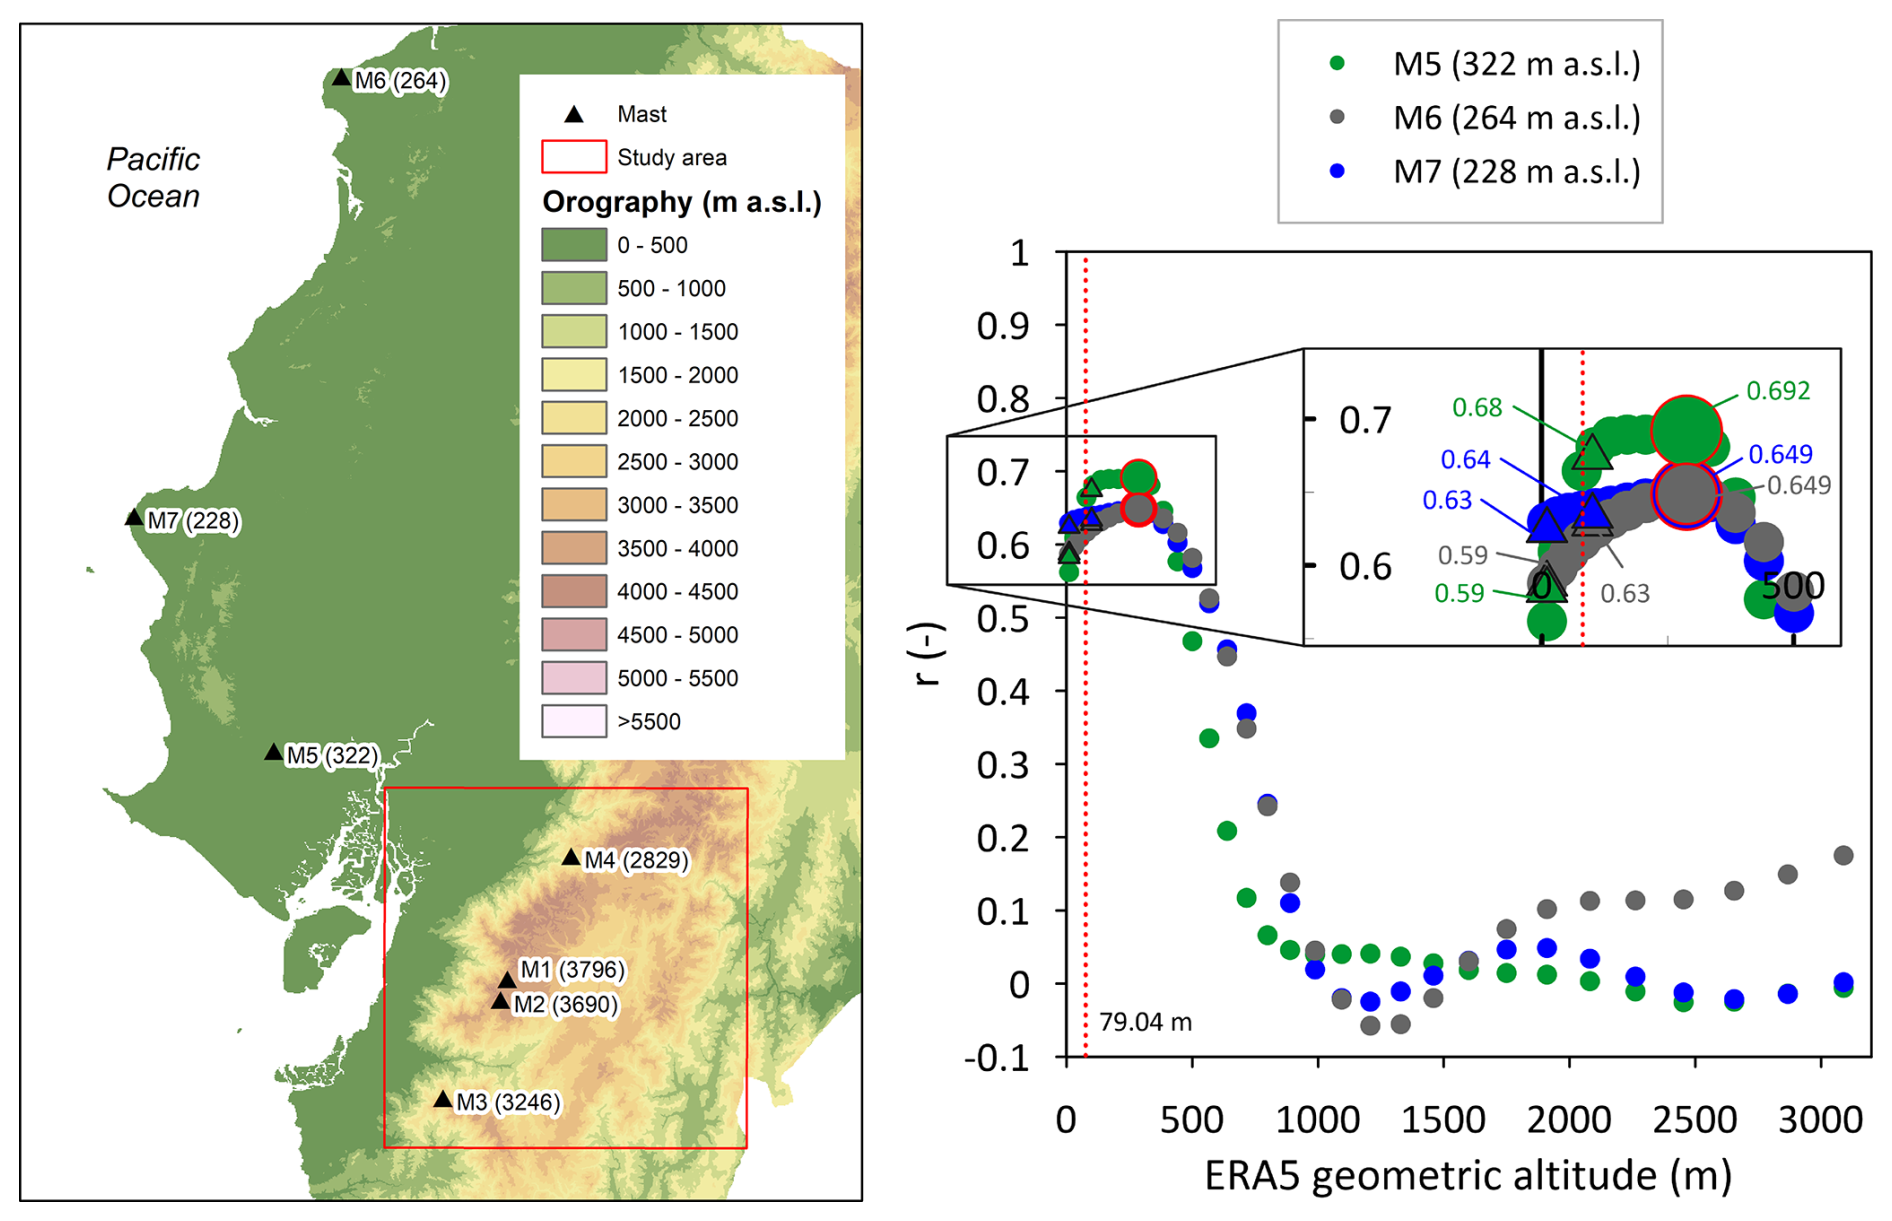
Figure A2Correlation between observed wind speed at 80 m height at three coast sites and ERA5 data at different geometric altitudes for the period from January 2021 to December 2022 (different analysis period compared with the mountain sites due to data availability constraints). On the left, the map shows the location of the sites, with the actual elevation of each site indicated in parentheses (). On the right, the highest correlation value for each site is indicated by larger circles. The 10 and 100 m wind speeds from the ERA5 single-level dataset are indicated by triangles, with their corresponding correlation magnitudes. The dashed red line indicates the model height closest to the observations. Site elevation is indicated in parenthesis in the legend.
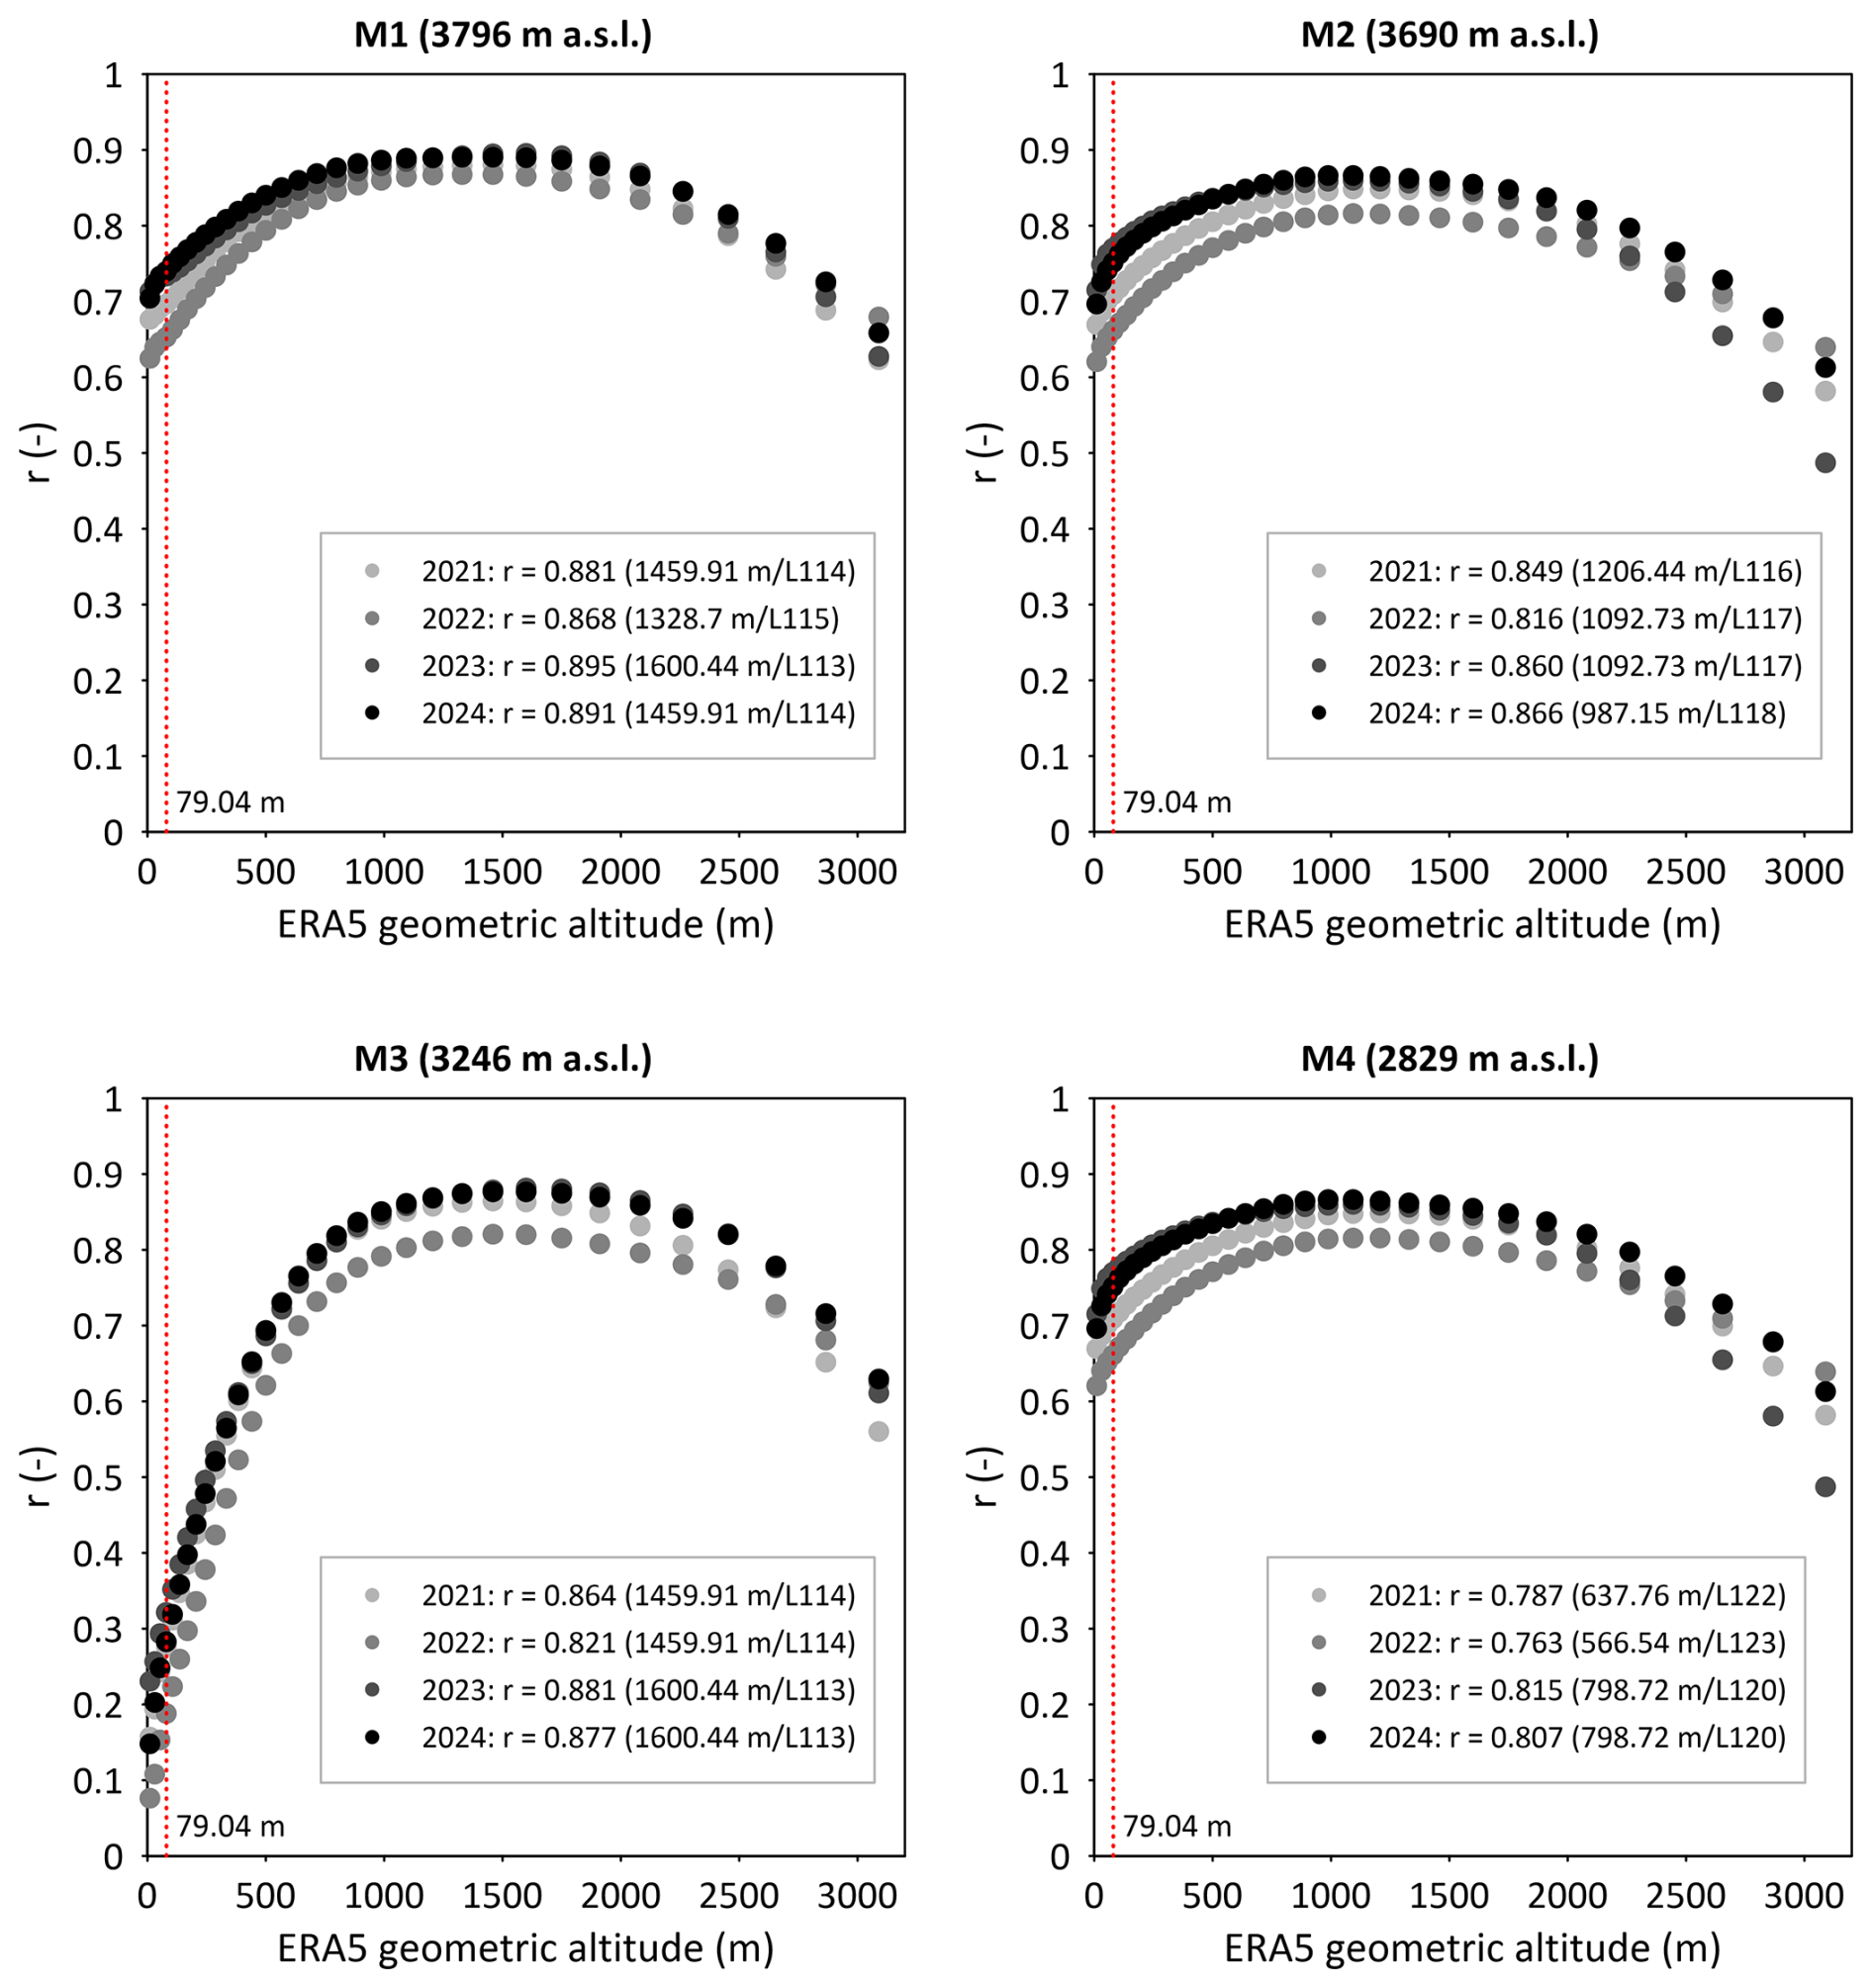
Figure A3Correlation between observed wind speed at four sites at 80 m height and ERA5 data at different geometric altitudes for each year of the study period. The dashed red line indicates the model height closest to the observations. The highest correlation value and their respective altitude and model level (in parenthesis) are indicated for each year and site.
The codes used for download data and analyses presented in this study are available upon request to the main author.
Data from meteorological masts used in this research is not publicly accessible due to proprietary restrictions and confidentiality agreements.
JC: conceptualisation, data curation, formal analysis, investigation, methodology, software, visualisation, writing (original draft preparation, and review and editing). NvL: conceptualisation, methodology, writing (review and editing) and supervision. ES: writing (review and editing) and supervision. DB: methodology, writing (review and editing), supervision, resources and funding acquisition.
The contact author has declared that none of the authors has any competing interests.
Publisher's note: Copernicus Publications remains neutral with regard to jurisdictional claims made in the text, published maps, institutional affiliations, or any other geographical representation in this paper. The authors bear the ultimate responsibility for providing appropriate place names. Views expressed in the text are those of the authors and do not necessarily reflect the views of the publisher.
This manuscript is an outcome of the joint PhD agreement between the Doctoral Programme in Renewable Natural Resources, offered by Universidad de Cuenca and Universidad del Azuay, and the Doctoral Programme in Science, offered by KU Leuven. Juan Contreras gratefully acknowledges Universidad del Azuay for funding his PhD scholarship. The authors are especially grateful to CELEC for providing wind observations from meteorological masts through the interinstitutional agreement “Spatio-temporal applications supporting decision-making for renewable energy and climate change – CSR-CON-0058-23”.
This research has been supported by the Universidad del Azuay under the project “Wind energy resources in a context of change: spatio-temporal dynamics and future projections for renewable energies in areas of high topographic complexity” (grant no. 2023-0178).
This paper was edited by Johan Arnqvist and reviewed by three anonymous referees.
Abdelsattar, M., Ismeil, M. A., Menoufi, K., Moety, A. A., and Emad-Eldeen, A.: Evaluating Machine Learning and Deep Learning models for predicting Wind Turbine power output from environmental factors, PLOS One, 20, https://doi.org/10.1371/journal.pone.0317619, 2025.
Basse, A., Callies, D., Grötzner, A., and Pauscher, L.: Seasonal effects in the long-term correction of short-term wind measurements using reanalysis data, Wind Energ. Sci., 6, 1473–1490, https://doi.org/10.5194/wes-6-1473-2021, 2021.
Bodini, N., Castagneri, S., and Optis, M.: Long-term uncertainty quantification in WRF-modeled offshore wind resource off the US Atlantic coast, Wind Energ. Sci., 8, 607–620, https://doi.org/10.5194/wes-8-607-2023, 2023.
Borgers, R., Dirksen, M., Wijnant, I. L., Stepek, A., Stoffelen, A., Akhtar, N., Neirynck, J., Van de Walle, J., Meyers, J., and van Lipzig, N. P. M.: Mesoscale modelling of North Sea wind resources with COSMO-CLM: model evaluation and impact assessment of future wind farm characteristics on cluster-scale wake losses, Wind Energ. Sci., 9, 697–719, https://doi.org/10.5194/wes-9-697-2024, 2024.
Borowski, J., Schwegmann, S., Avila, K., and Dörenkämper, M.: Evaluating the impact of inter-annual variability on long-term wind speed predictions, Wind Energ. Sci., 11, 661–677, https://doi.org/10.5194/wes-11-661-2026, 2026.
Breiman, L.: Random Forests, Mach. Learn., 45, 5–32, 2001.
Breiman, L., Cutler, A., Liaw, A., and Wiener, M.: Package “randomForest”, Mach. Learn., 5–32, https://doi.org/10.1023/A:1010933404324, 2025.
Brune, S., Keller, J. D., and Wahl, S.: Evaluation of wind speed estimates in reanalyses for wind energy applications, Adv. Sci. Res., 18, 115–126, https://doi.org/10.5194/asr-18-115-2021, 2021.
Carta, J. A., Velázquez, S., and Cabrera, P.: A review of measure-correlate-predict (MCP) methods used to estimate long-term wind characteristics at a target site, Renew. Sust. Energ. Rev., 27, 362–400, https://doi.org/10.1016/j.rser.2013.07.004, 2013.
Cavaiola, M., Tuju, P. E., Ferrari, F., Casciaro, G., and Mazzino, A.: Ensemble Machine Learning greatly improves ERA5 skills for wind energy applications, Energy and AI, 13, https://doi.org/10.1016/j.egyai.2023.100269, 2023.
Cheynet, E., Diezel, J. M., Haakenstad, H., Breivik, Ø., Peña, A., and Reuder, J.: Tall wind profile validation of ERA5, NORA3, and NEWA datasets using lidar observations, Wind Energ. Sci., 10, 733–754, https://doi.org/10.5194/wes-10-733-2025, 2025.
Draeger, C., Radić, V., White, R. H., and Tessema, M. A.: Evaluation of reanalysis data and dynamical downscaling for surface energy balance modeling at mountain glaciers in western Canada, The Cryosphere, 18, 17–42, https://doi.org/10.5194/tc-18-17-2024, 2024.
Gentleman, R. and Poggi, J.-M.: Random Forests with R, Springer, 33–55, https://doi.org/10.1007/978-3-030-56485-8_3, 2020.
Godoy, J. C., Cajo, R., Mesa Estrada, L., and Hamacher, T.: Multi-criteria analysis for energy planning in Ecuador: Enhancing decision-making through comprehensive evaluation, Renew. Energ., 241, https://doi.org/10.1016/j.renene.2024.122278, 2025.
Gualtieri, G.: Reliability of ERA5 Reanalysis Data for Wind Resource Assessment: A Comparison against Tall Towers, Energies (Basel), 14, https://doi.org/10.3390/en14144169, 2021.
Gualtieri, G.: Analysing the uncertainties of reanalysis data used for wind resource assessment: A critical review, Renew. Sust. Energ. Rev., 167, https://doi.org/10.1016/j.rser.2022.112741, 2022.
Hahmann, A. N., Sīle, T., Witha, B., Davis, N. N., Dörenkämper, M., Ezber, Y., García-Bustamante, E., González-Rouco, J. F., Navarro, J., Olsen, B. T., and Söderberg, S.: The making of the New European Wind Atlas – Part 1: Model sensitivity, Geosci. Model Dev., 13, 5053–5078, https://doi.org/10.5194/gmd-13-5053-2020, 2020.
Hahmann, A. N., García-Santiago, O., and Peña, A.: Current and future wind energy resources in the North Sea according to CMIP6, Wind Energ. Sci., 7, 2373–2391, https://doi.org/10.5194/wes-7-2373-2022, 2022.
Hallgren, C., Aird, J. A., Ivanell, S., Körnich, H., Vakkari, V., Barthelmie, R. J., Pryor, S. C., and Sahlée, E.: Machine learning methods to improve spatial predictions of coastal wind speed profiles and low-level jets using single-level ERA5 data, Wind Energ. Sci., 9, 821–840, https://doi.org/10.5194/wes-9-821-2024, 2024.
Hersbach, H., Bell, B., Berrisford, P., Hirahara, S., Horányi, A., Muñoz-Sabater, J., Nicolas, J., Peubey, C., Radu, R., Schepers, D., Simmons, A., Soci, C., Abdalla, S., Abellan, X., Balsamo, G., Bechtold, P., Biavati, G., Bidlot, J., Bonavita, M., De Chiara, G., Dahlgren, P., Dee, D., Diamantakis, M., Dragani, R., Flemming, J., Forbes, R., Fuentes, M., Geer, A., Haimberger, L., Healy, S., Hogan, R. J., Hólm, E., Janisková, M., Keeley, S., Laloyaux, P., Lopez, P., Lupu, C., Radnoti, G., de Rosnay, P., Rozum, I., Vamborg, F., Villaume, S., and Thépaut, J. N.: The ERA5 global reanalysis, Q. J. Roy. Meteor. Soc., 146, 1999–2049, https://doi.org/10.1002/qj.3803, 2020.
Houndekindo, F. and Ouarda, T. B. M. J.: Machine learning and statistical approaches for wind speed estimation at partially sampled and unsampled locations; review and open questions, Energy Convers. Manag., 327, https://doi.org/10.1016/j.enconman.2025.119555, 2025.
Hu, W., Scholz, Y., Yeligeti, M., Bremen, L. von, and Deng, Y.: Downscaling ERA5 wind speed data: a machine learning approach considering topographic influences, Environ. Res. Lett., 18, https://doi.org/10.1088/1748-9326/aceb0a, 2023.
Jourdier, B.: Evaluation of ERA5, MERRA-2, COSMO-REA6, NEWA and AROME to simulate wind power production over France, Adv. Sci. Res., 17, 63–77, https://doi.org/10.5194/asr-17-63-2020, 2020.
Khadka, A., Wagnon, P., Brun, F., Shrestha, D., Lejeune, Y., and Arnaud, Y.: Evaluation of ERA5-Land and HARv2 Reanalysis Data at High Elevation in the Upper Dudh Koshi Basin (Everest Region, Nepal), J. Appl. Meteorol. Clim., 61, 931–954, https://doi.org/10.1175/JAMC-D-21-0091.1, 2022.
Kumar, R., Rutgersson, A., Asim, M., and Routray, A.: Understanding Wind Characteristics Over Different Terrains for Wind Turbine Deployment, Meteorol. Appl., 32, https://doi.org/10.1002/met.70079, 2025.
Liu, B., Ma, X., Guo, J., Li, H., Jin, S., Ma, Y., and Gong, W.: Estimating hub-height wind speed based on a machine learning algorithm: implications for wind energy assessment, Atmos. Chem. Phys., 23, 3181–3193, https://doi.org/10.5194/acp-23-3181-2023, 2023.
Liu, B., Ma, X., Guo, J., Wen, R., Li, H., Jin, S., Ma, Y., Guo, X., and Gong, W.: Extending the wind profile beyond the surface layer by combining physical and machine learning approaches, Atmos. Chem. Phys., 24, 4047–4063, https://doi.org/10.5194/acp-24-4047-2024, 2024.
López, G., Arboleya, P., Núñez, D., Freire, A., and López, D.: Wind resource assessment and influence of atmospheric stability on wind farm design using Computational Fluid Dynamics in the Andes Mountains, Ecuador, Energy Convers. Manag., 284, https://doi.org/10.1016/j.enconman.2023.116972, 2023.
Martinez, J. A., Junquas, C., Bozkurt, D., Viale, M., Fita, L., Trachte, K., Campozano, L., Arias, P. A., Boisier, J. P., Condom, T., Goubanova, K., Pabón-Caicedo, J. D., Poveda, G., Solman, S. A., Sörensson, A. A., and Espinoza, J. C.: Recent progress in atmospheric modeling over the Andes – part I: review of atmospheric processes, Front. Earth Sci. (Lausanne), 12, https://doi.org/10.3389/feart.2024.1427783, 2024.
McKenna, R., Pfenninger, S., Heinrichs, H., Schmidt, J., Staffell, I., Bauer, C., Gruber, K., Hahmann, A. N., Jansen, M., Klingler, M., Landwehr, N., Larsén, X. G., Lilliestam, J., Pickering, B., Robinius, M., Tröndle, T., Turkovska, O., Wehrle, S., Weinand, J. M., and Wohland, J.: High-resolution large-scale onshore wind energy assessments: A review of potential definitions, methodologies and future research needs, Renew. Energ., 182, 659–684, https://doi.org/10.1016/j.renene.2021.10.027, 2022.
MEASNET: Evaluation of Site-Specific Wind Conditions, MEASNET Organisation, 2022.
Olauson, J.: ERA5: The new champion of wind power modelling?, Renew. Energ., 126, 322–331, https://doi.org/10.1016/j.renene.2018.03.056, 2018.
Pauscher, L., Geiger, D., Yuan, D., Bär, F., Good, G., Spangehl, T., Kaspar, F., Weber, H., and Callies, D.: An evaluation and comparison of wind speeds from different reanalysis models in the context of wind energy – the influence of topography, in: EMS Annual Meeting 2024, https://doi.org/10.5194/ems2024-957, 2024.
Ramon, J., Lledó, L., Torralba, V., Soret, A., and Doblas-Reyes, F. J.: What global reanalysis best represents near-surface winds?, Q. J. Roy. Meteor. Soc., 145, 3236–3251, https://doi.org/10.1002/qj.3616, 2019.
Rouholahnejad, F. and Gottschall, J.: Characterization of local wind profiles: a random forest approach for enhanced wind profile extrapolation, Wind Energ. Sci., 10, 143–159, https://doi.org/10.5194/wes-10-143-2025, 2025.
Schwegmann, S., Faulhaber, J., Pfaffel, S., Yu, Z., Dörenkämper, M., Kersting, K., and Gottschall, J.: Enabling Virtual Met Masts for wind energy applications through machine learning-methods, Energy and AI, 11, https://doi.org/10.1016/j.egyai.2022.100209, 2023.
Soares, P. M. M., Lima, D. C. A., and Nogueira, M.: Global offshore wind energy resources using the new ERA-5 reanalysis, Environ. Res. Lett., 15, https://doi.org/10.1088/1748-9326/abb10d, 2020.
Tapia, M., Heinemann, D., and Zondervan, E.: Too many eggs in one basket: On the vulnerability of the Ecuadorian power system and the need for a more sustainable and resilient strategy, Energ. Policy, 209, https://doi.org/10.1016/j.enpol.2025.114951, 2026.
Watson, S.: Handbook of Wind Resource Assessment, John Wiley & Sons Inc., https://doi.org/10.1002/9781119055402, 2023.
Weekes, S. M. and Tomlin, A. S.: Data efficient measure-correlate-predict approaches to wind resource assessment for small-scale wind energy, Renew. Energ., 63, 162–171, https://doi.org/10.1016/j.renene.2013.08.033, 2014.