
the Creative Commons Attribution 4.0 License.
the Creative Commons Attribution 4.0 License.
 | 12 Nov 2026
Economic viability of floating offshore wind in Portugal with varying market conditions and financial support mechanisms

José Cândido
Ciaran Frost
This study assesses the economic viability of commercial-scale floating offshore wind farms in Portugal under a range of contract for difference (CfD) mechanisms. A techno-economic model simulated financial revenues using synthetic time wind and spot price data, under varying CfD mechanisms and metocean conditions for 36 sites off the Portuguese coastline. Results are split into levelized cost of energy, net present value, and internal rate of return and are influenced by a range of sensitivity analyses that help define the financial setting for successful floating offshore wind projects, including CfD mechanisms varying in type, value, and duration. Results indicate that floating offshore wind shows potential in Portugal, but only with strong financial support, with outcomes heavily influenced by site characteristics, wind regime, and economic conditions.
- Article
(3025 KB) - Full-text XML
- BibTeX
- EndNote


Strong and consistent winds that played their role in the age of exploration now present an opportunity for the development of marine renewable energy in the deep waters off the coast of Portugal. Offshore wind offers mature and proven technology but is generally limited to shallower marine areas with activity within Iberia. The deployment of floating wind (FOW) into deeper waters offers access to greater wind resources with less marine competition, boosting low-carbon energy generation whilst reducing the visual impact in coastal regions. Floating technology has grown and improved since the first full-scale prototype in 2009 (Skaare et al., 2015), with early commercial farms commissioned in 2017 (Hywind Scotland, 30 MW) (Jacobsen and Godvik, 2021), 2021 (Kincardine, 50 MW) (Risch et al., 2023), and 2023 (Hywind Tampen, 88 MW) (Musial et al., 2023).
Geopolitical events have caused costs to rise in recent years, and reductions are necessary to achieve commercial deployment and global installed capacity in the hundreds of gigawatts (GW) (DNV, 2023). FOW must realize levelized cost of energy (LCoE) reductions to become economically viable, meaning positive investor returns and competitive LCoE alongside other energy generation technologies. This can be achieved through lower component costs, technical innovations, and improved site selection to boost energy generation and reduce maintenance expenditure. Financial support mechanisms are also essential to enhance and stabilize revenues, including feed-in tariffs, power purchase agreements, and contracts for difference (CfDs). These can reduce project risk and encourage investment in this promising sector, which can add value to the Portuguese economy through job creation and port and supply chain development as well as add environmental benefits through nature-inclusive design, aquaculture, and marine protection zones.
In 2020, as recorded by Gomes et al. (2020) 30 % of Portugal's electricity generation was provided by coal and was responsible for 25 % of Portugal's total CO2 emissions. Energy policy was changed in 2018 to align with climate targets, and coal was phased out of the system in 2022, as part of the “National Renewable Energy Action Plan” that established an emissions reduction pathway aiming for a 47 % renewable energy mix by 2030. Such increases in variable renewable energy (VRE) require grid balancing capacities such as hydropower, says Ramos et al. (2014), which have increased from ∼ 5 GW (28 % generation share) in 2010 to ∼ 9.5 GW (36 % share) in 2020. Of this, almost 3 GW is defined in the (Clean Energy Technology Observatory (CETO), 2022) as pumped hydro-storage that can utilize Portugal's favourable high terrain and react quickly to balance demand with supply. This storage will play an important role, as argued in Bilbao-Terol and Gónzalez-Pérez (2025), as a balancing mechanism for future higher capacities of floating wind generation, supplemented with large-scale hydro-battery storage. Other changes to the energy system will also impact the potential ceiling for FOW deployment. Data centre deployment is increasing rapidly (Van Fan et al., 2026), and geopolitics could define energy imports and exports through HVDC interconnectors within Europe. Without this, large VRE penetration could cause low or negative pricing, curtailed wind farms, and lower balancing to prevent blackouts like those seen in April 2025 (Çetinkaya et al., 2025).
Notwithstanding the lower costs, Silva and Sareen (2021) argue that public attitudes towards renewable energy can vary, especially at the local level, with community opinions and engagement often overlooked or bypassed, even though land-based renewables are seen as favourable in Portugal, with 96 % favouring considering renewable energy targets important in 2019. This presents an opportunity for floating wind development, with generating areas removed from other industries, affected parties, and land-use conflicts, in turn reducing costs through faster societal acceptance.
The Portuguese energy system is interconnected with Spain, helping to stabilize the grid and energy pricing, and with fluctuating supply and demand. This connection broadens the generation, load, and storage mix, with Spain contributing more solar and northern Portugal hosting a large capacity of pumped-hydro plants. The national system has just over 20 GW of installed power (REN, 2024a), with average generation in 2023 exceeding 9 GW, of which 85 % was from renewable sources. On the demand side, peak consumption across all sectors was 8 GW, with a 13.5 GW future consumption pipeline expected to consist of hydrogen and extra domestic demand through electrification (Laboratório Nacional de Energia e Geologia (LNEG), 2023). The aim is to decarbonize the gas network through hydrogen and boost Portuguese energy security by reducing gas imports. Market spot price per megawatt-hour of generation was EUR 93 on average in 2023, EUR 230 in 2022, EUR 73 in 2021, and EUR 31 in 2020 (REN, 2024b), highlighting volatility in the market.
This paper analyses the economic viability of commercial-scale floating offshore wind in Portugal for three different CfD types: traditional, financial, and capability based. Projects deemed viable will have positive financial metrics under the base case. A successful project will recoup the lifetime costs, including the large capital expenditure at the start of the project, through revenues generated throughout the project time frame, often only possible through price support mechanisms. This revenue aims to not be impacted negatively by high maintenance costs, which for floating wind can involve further distances from shore and longer cable routes. A sensitivity analysis was conducted to determine the main drivers of potential future trends and areas with greater impact on results across significant financial assessment metrics. The geospatial assessment is carried out at a range of locations and distances from shore across the entire coastline. Costs consider current macrotrends (i.e. increased cost of materials as seen since the COVID-19 pandemic). The financial metrics are used to assess projects with variation in location, wind resource, and distance to shore/port. A sensitivity analysis is presented with adjustments to discount rate, capital expenditure (CAPEX), operational expenditure (OPEX), generation, CfD duration and strike price level, and spot price.
1.1 Economic support structure design
CfDs provide financial support to renewable energy systems by guaranteeing a price of energy (strike price), usually supported through public funds and a competitive auction and fixed (often inflation-indexed) for the length of the contract, often 15 years. The aim is to establish a long-term revenue stream for the generator which minimizes risk (Beiter et al., 2024). Current CfDs do guarantee price but are still at risk of changes in volume of energy produced by a farm. Future CfD methods have been proposed that aim to maintain price security and limit oversupply, especially during low-demand hours. They can either be formed of payments based on a reference generator (a proxy wind turbine or farm that serves as a baseline, not an actual physical project) or based on typical output of the farm over a number of years.
CfDs of this nature are generation-based and provide a stable price per unit of energy generated but are still at risk of volume changes, as discussed in WindEurope (2025). A guarantee of payment for energy is not always best for a power system with significant variable renewable energy share, which can cost a power system through balancing costs, grid instability, and price cannibalization through overgeneration. CfDs can be either one-sided, where the market price above the strike price is kept and which can be more costly to sponsor, or two-sided, where underpayments are topped up, and overpayments are returned, which maintains price consistency. Mitigation is possible for generation-based schemes, including using monthly average prices or wind-weighted averages, but still is at risk during low-wind periods, with revenues dependent on production.
For the financial CfD method, as proposed by Schlecht et al. (2024), the generator receives fixed payments based on the size of the generator plant irrespective of generation whilst repaying the revenues based on a reference generator and the market spot price (hourly fluctuating wholesale or day-ahead price). With fixed payments, the risk profile is reduced and revenues consistent and predictable, even in low-wind-speed months. A downside is that there is less exposure to windfall events, where the farm or turbine enjoys high-price events and revenue, reducing the ability of generators to respond to high-price and/or high-wind periods.
Capability-based CfD is another generation-independent method outlined by Kitzing et al. (2024) by establishing a reference generation capability against which payments are calculated. The goal is to accurately model the generation profile of the farm through the accurate modelling of the power curve, losses, and wind profile. This creates a fair assessment of the farm's potential and rewards efficient operation and high availability whilst creating forecastable revenues and again lowering the risk of the asset from an investor's perspective.
1.2 Techno-economic modelling
Evaluation methods, from a techno-economic perspective, utilize consistent and useful techniques to quantify the expected technical and financial performance of a prospective floating offshore wind farm. Three such methods are widely used as indicators for VRE project assessment: levelized cost of energy (LCoE), net present value (NPV), and internal rate of return (IRR).
LCoE is as an evaluation metric for energy generation and is improved through cost reductions and energy generation increases. Benefits lie in its simplicity, wide industrial acceptance and understanding, quick assessment, easy modification, and flexibility to assess all energy generation technologies. The LCoE calculation is the lifetime costs of the project (CAPEX, OPEX, and DECEX) divided by the lifetime energy generation. Both terms are discounted to account for the time value of money, recognizing that the CAPEX investment has a higher present value today and that energy generated now is more valuable than the same energy sold in the future.
CAPEXt is the capital expenditure in year t, OPEXt the operational expenditure in year t, DECEXt the decommissioning costs in year t, Et the energy generation (usually in megawatt-hours) in year t, r the discount rate, and n the project lifetime.
A large benefit of LCoE analysis is that it is applicable to all forms of energy generation. The metric can lack a theoretical foundation, which Aldersey-Williams and Rubert (2019) explored via comparison with other cost-of-energy metrics. It was still found to be the preferred method, but weaknesses were identified in the discount rate, inflation, and uncertainties in future commodities. Another critical review of the LCoE metric by Shen et al. (2020) found a lack of clarity leads to large fluctuations in results. A method for increasing the accuracy of the metric, namely higher inclusivity of costs even if transferred from another source, was suggested. Studies have also shown that the highest drivers of LCoE are typically financing, system costs, lifetime, and loan term length (Branker et al., 2011). A common argument made here by Ueckerdt et al. (2013) is that LCoE is not well adapted to the inconsistency of VRE generation, which is often misaligned with demand, disrupting the value of energy. Integration and balancing costs are often not included and have real-life significance for the results that is often ignored, resulting in higher costs when projects are grid-connected. These can also add carbon to the energy mix, often from dispatchable gas generators. At higher wind shares, these integration costs can be of the same order of magnitude as the generation costs of wind and conventional power plants. The study presented a more accurate metric based on economic theory that included these costs. This was also found by Sklar-Chik et al. (2016) and factors omitted inflation, although future inflation is hard to predict, and the discount rate does account for lower future cash flows.
FOW-specific studies give important insights into the key drivers and sensitivities, for example the balance between higher CAPEX and stronger wind resources. A comprehensive LCoE study by Myhr et al. (2014) investigated the main FOW concepts of spar (cylindrical, ballast-stabilized), tension-leg platform (TLP – reduced mass, tension-stabilized), and semi-submersible designs (larger mass, buoyancy-stabilized), amongst other hybrid designs. The results for a 500 MW wind farm are compared to a similar system using jacket and monopile foundations. The results confirm that LCoE is highly sensitive to both water depth and distances to shore, with load factor and availability also driving change and of relevance to the cases presented in this study. Moderate depths of 50–150 m and deployment at scale allows FOW LCoE to become comparable with fixed offshore wind, although fixed monopile results are lower, and bottom-fixed is not considered technically possible after 50 m, which is not the case now. LCoE increases are also slower with increasing depth compared to fixed. LCoE results for a single site range from EUR 82.0–236.7 MWh−1, reflecting site-specific designs and lack of standardization. Viability is only shown for LCoE, and project assessment using other indicators that assess a project's bankability and economic viability is not discussed. Since the study in 2014, platform designs have generally converged at commercial scale across the three main platforms, showing signs of industry standardization; however site selection and design optimization are crucial for competitive costs and LCoE.
Regarding previous work in the field of floating offshore wind techno-economics, LCoE mapping in Portugal by Martinez and Iglesias (2022) examined all the European coastline, and as such the detail in the Portuguese area was less granular, finding areas with the most wind and shortest shore distance to have the lowest LCoE. Portugal ranked median in terms of performance (∼ EUR 125 MWh−1), with bathymetric impact minimal in this study compared to fixed-bottom. The economic feasibility by Castro-Santos et al. (2020) examined LCoE in broad bands rather than specific development areas, with influence from wind and bathymetries. Also, tariffs were based on two fixed feed-in tariffs and did not consider the range of CfD support mechanisms analysed here, which are more suitable for commercial-scale floating offshore wind. A hybrid techno-economic approach was taken by Lucas et al. (2022), which took a similar 15 MW turbine technical layout and dynamic power curve approach. Hydrogen production feasibility was investigated and found larger capacities; higher capacity factors where the turbine is operating with higher availability; and higher prices boosted the economic potential, with government support needed at smaller scales.
NPV is the difference between the present value of cash inflows and outflows of a project, discounted to present value using a discount rate. Negative NPV would indicate a project that is not currently viable, due to high CAPEX or OPEX or reduced cash flow when combined with low wind speeds, low energy prices, or both. A positive NPV indicates a profitable project, where lifetime revenues exceed the lifetime costs, including initial CAPEX spend and ongoing maintenance of the farm within the project lifetime. Results of profitable commercial-scale farms in the Mediterranean by Maienza et al. (2022) ranged from EUR 209–407 million. As NPV discounts cash flows to present, the chosen discount rate of the project, which can be thought of as the financing cost that an investor would expect to receive as a return on investment, has a large impact on the NPV value.
with NPV as the sum of all cash flows CFt from year 0 to year n, assuming r as the discount rate for the project.
IRR is a similar metric to NPV in that it also compares revenues to costs, but it can also be a straightforward decision maker for a project as it does not require an initial assumption on the discount rate. The IRR equals the discount rate where the project NPV is zero, and IRRs above the discount rate define a project that yields positive returns for investors over the lifetime of the project, with one below the discount rate indicating unprofitability. Target IRR is anything over the discount rate of a project that represents the cost of financing, often set at 8 %–10 % for floating offshore wind. A suitable range of discount rate values is 8 %–12 % (Noothout et al., 2016), which matches the sensitivity range in this work.
In the above R1 and R2 are initial guesses for the IRR, and NPV1 and NPV2 represent higher and lower values of NPV, respectively. If the NPV is close to zero, then the IRR is equal to the R1, and if NPV has not converged close to zero then new rate guesses must be input into the equation.
An economic viability assessment of FOW by Castro-Santos et al. (2020) used three platform technologies in Portugal with another multi-phased site selection method with geographical, economic, and bathymetric criteria. Two electricity tariffs affected net present value and IRR, with LCoE derived from platform-specific CAPEX, wind resource, and a generic O&M calculation. Results again show large variation across different platforms, with EUR 289.49 MWh−1, EUR 303.97 MWh−1, and EUR 325.64 MWh−1 for spar, semi-sub, and TLP platforms, respectively. Tariffs of EUR 200 MWh−1 do not yield positive results for NPV and IRR, with EUR 300 MWh−1 leading to positive results. This emphasizes the necessity of policy support for FOW deployment which, in turn, will enable economies of scale and supply chain maturity.
2.1 Techno-economic modelling
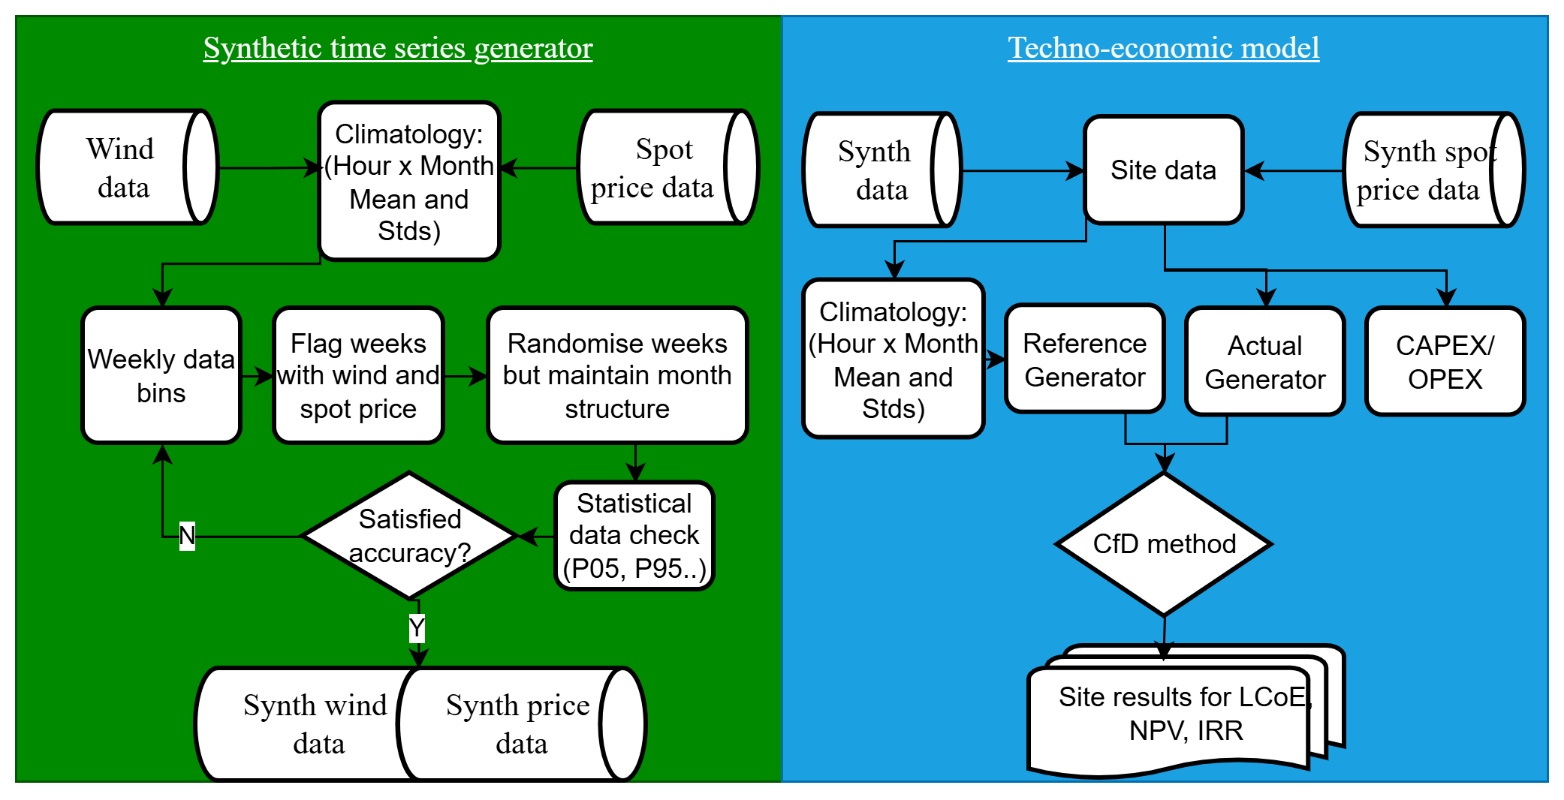
A techno-economic model (TEM) was developed to provide a detailed cost-generation assessment of floating wind farms at a range of offshore sites in Portugal, with results expressed in terms of LCoE, NPV and, IRR. Process flow of the time series data feeding the model and the model itself can be seen in Fig. 1. The TEM takes hourly wind speed data and converts to generation and revenue. OPEX, CAPEX, and DECEX were calculated based on farm capacity and affected the three financial metric calculations to assess each location's economic and technical potential. This method was applied to 12 regions, each at 3 distances to shore, for a total of 36 areas to provide a comprehensive feasibility study of Portugal. The model considers the distance to shore and its impact on distance-sensitive CAPEX and OPEX change to reflect varying site metocean severity.
The main technical and site data across the three broad site distances are shown in Table 1. For consistency, each location was maintained at 1005 MW (∼ 1 GW) installed capacity, using 67 × 15 MW turbines at a 150 m hub height. The power curve is a reference model for academic purposes (Gaertner et al., 2020). A 1 GW farm size was chosen to reflect the commercial scale of floating offshore wind, as current active leasing areas are generally of this scale or larger, with the initial three leasing zones of 0.5, 1, and 2 GW (Buljan, 2023). The platform and mooring system match the technical description from the CAPEX source (BVG Associates, 2025), catenary-chain-mooring system, and steel semi-submersible platforms. A technical assumption is the same technical design of catenary moorings and semi-submersible platforms as the reference source, which is currently the case in Portugal (Duarte et al., 2022). A catenary-mooring-system configuration was maintained for all depths, including the very shallow and deep sites, for consistency, though other methods such as tension-leg platforms and taut-mooring systems, as well as fixed monopiles for the shallow cases, are potentially better suited. To avoid research complexity, the platform and mooring system components and their subsequent costs were all kept constant irrespective of site severity, which only affected OPEX.
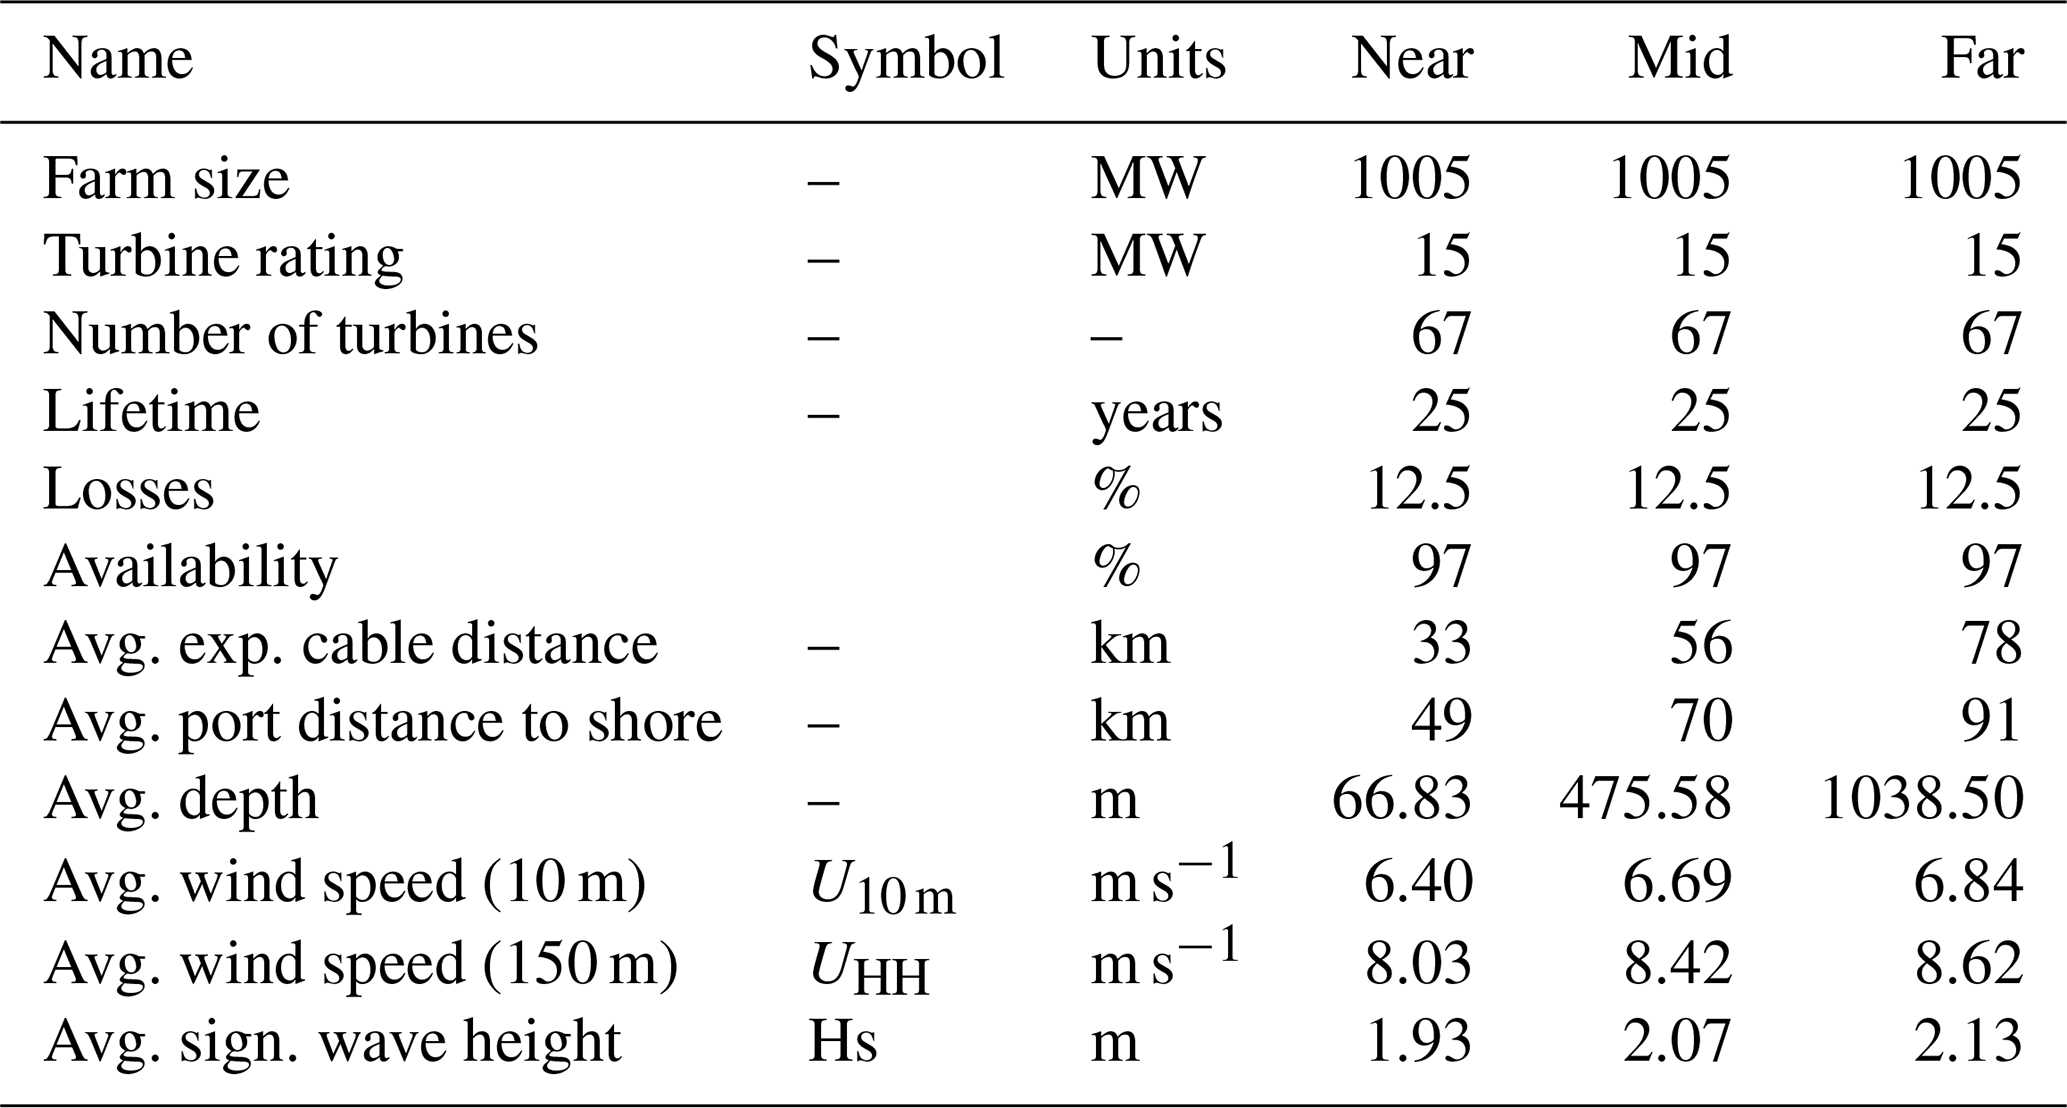
The 36 locations were chosen to represent the full coastline of Portugal and were not selected based on existing leasing zones or designated offshore development areas, but rather on sites that demonstrate sufficient potential and practicality to support suitable installation and O&M bases for the FOW farms.
2.1.1 Capital expenditure
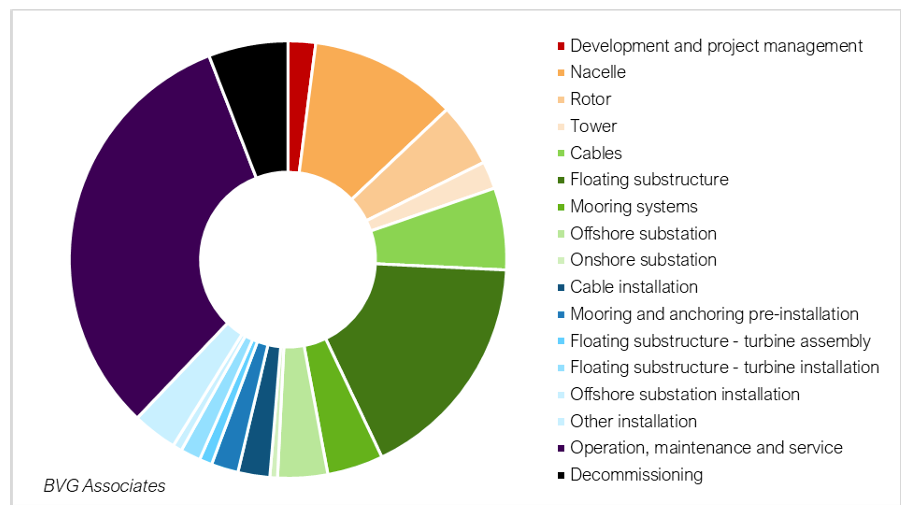
Figure 2Cost contribution from main components and lifecycle phases (BVG Associates, 2025).
Capital expenditure (CAPEX) is based on data from a reference report: Guide to a Floating Offshore Wind Farm (BVG Associates, 2025). A comprehensive set of per-kilowatt cost functions is provided for system-, sub-system-, and component-level costs and considers recent price events, giving a realistic assessment of FOW expenditure. Costs affected by distance, mainly mooring lines and export cables, were split into per-unit-of-distance values and then recalculated to reflect the water depth and distance to shore for all sites. The installation expenditure of these components was maintained constant with the reference report values due to the added complexity of soil profile considerations and mooring line challenges and presents interesting further work. In this study, CAPEX is spread across the years leading up to the project (6 % in year −3, 10 % in year −2, 34 % in year −1, and 50 % in year 0) and so is negatively discounted, which raises costs. This represents a more realistic approach to FOW purchasing, as consolidating all procurement in the year before generation is unfeasible, and is explained in InnoEnergy (2017). CAPEX distribution is applied evenly to all indicators used in this study (LCoE, IRR, NPV). A conversion of 3.98 on average was applied to depth to reflect the catenary configuration of the mooring lines. Costs are assumed fully mature, with the reference capacity being 1 GW, matching those in this study. All costs were adjusted to real 2024 euros, and the breakdown of major cost items and lifecycle phases can be seen in Fig. 2.
2.1.2 Operational expenditure
OPEX calculations apply a cost function that takes two arguments: distance to shore and site severity (Beiter et al., 2016). Site severity is classified as a mild site with yearly mean significant wave height (Hs) under 1.14 m Hs, a moderate site between 1.15 and 1.95 m Hs, and a severe site above 1.95 m Hs, with the average Hs for sites shown in Table 1. These scenarios establish an OPEX of installed capacity per kilometre per year, then multiplied by site distance to shore to consider the complexities of distances OPEX. These are represented as a set of natural logarithm equations defined by Beiter et al. (2016):
with Hs being the average significant wave height, measured over 30 years of hindcast data; dTP being the distance from the site to the O&M port in kilometres; convUSD EUR being the conversion rate from US dollars to euros in the year of reference publication; CPIFID the consumer price index at the desired project financial investment decision (FID) for this study; and CPIorig the CPI at the time of the reference publication with 125.95 in 2023 and 99.86 in 2015, the year of study. A limitation is the reference farm size of 600 MW being scaled up to the project capacity of 1005 MW in this research, which is mitigated as both are of commercial scale. Another is the broad severity grouping which has a significant impact on OPEX, with a cost increase from a mild to severe site of EUR 81–124 kW−1 yr−1. This grouping is suitable and differentiates sites well, with vessel limits in the original Californian study equal to those in Portugal. A further detailed O&M study is considered an interesting separate piece of research. Once classified, OPEX is inflation-adjusted over the same period to achieve a realistic value for project FID.
2.1.3 Spot prices and CfD support mechanisms
For the market day-ahead spot price data, a dataset was created that is representative of Portugal as a whole, the process for which can be seen in Fig. 1. The week-to-week price shape is maintained by using sampled weeks from the original wind data. Price climatology and anomalies are established as before. A quantile map aligns the synthetic price distribution to history, with 200 quantile levels of the current synthetic base prices and the original historic price data. A linear interpolation then preserves the shape and rank per hour and matches to the statistical distribution of historical price data.
Synthetic spot prices form the base layer of cost revenues for each project and provide income to each farm when a CfD mechanism is not in place, which in most cases is after 15 years of operation. No inflation or adjustments are made to the synthetic data, except under sensitivity analysis.
Table 2Key costs, financial parameters, and sensitivity ranges.
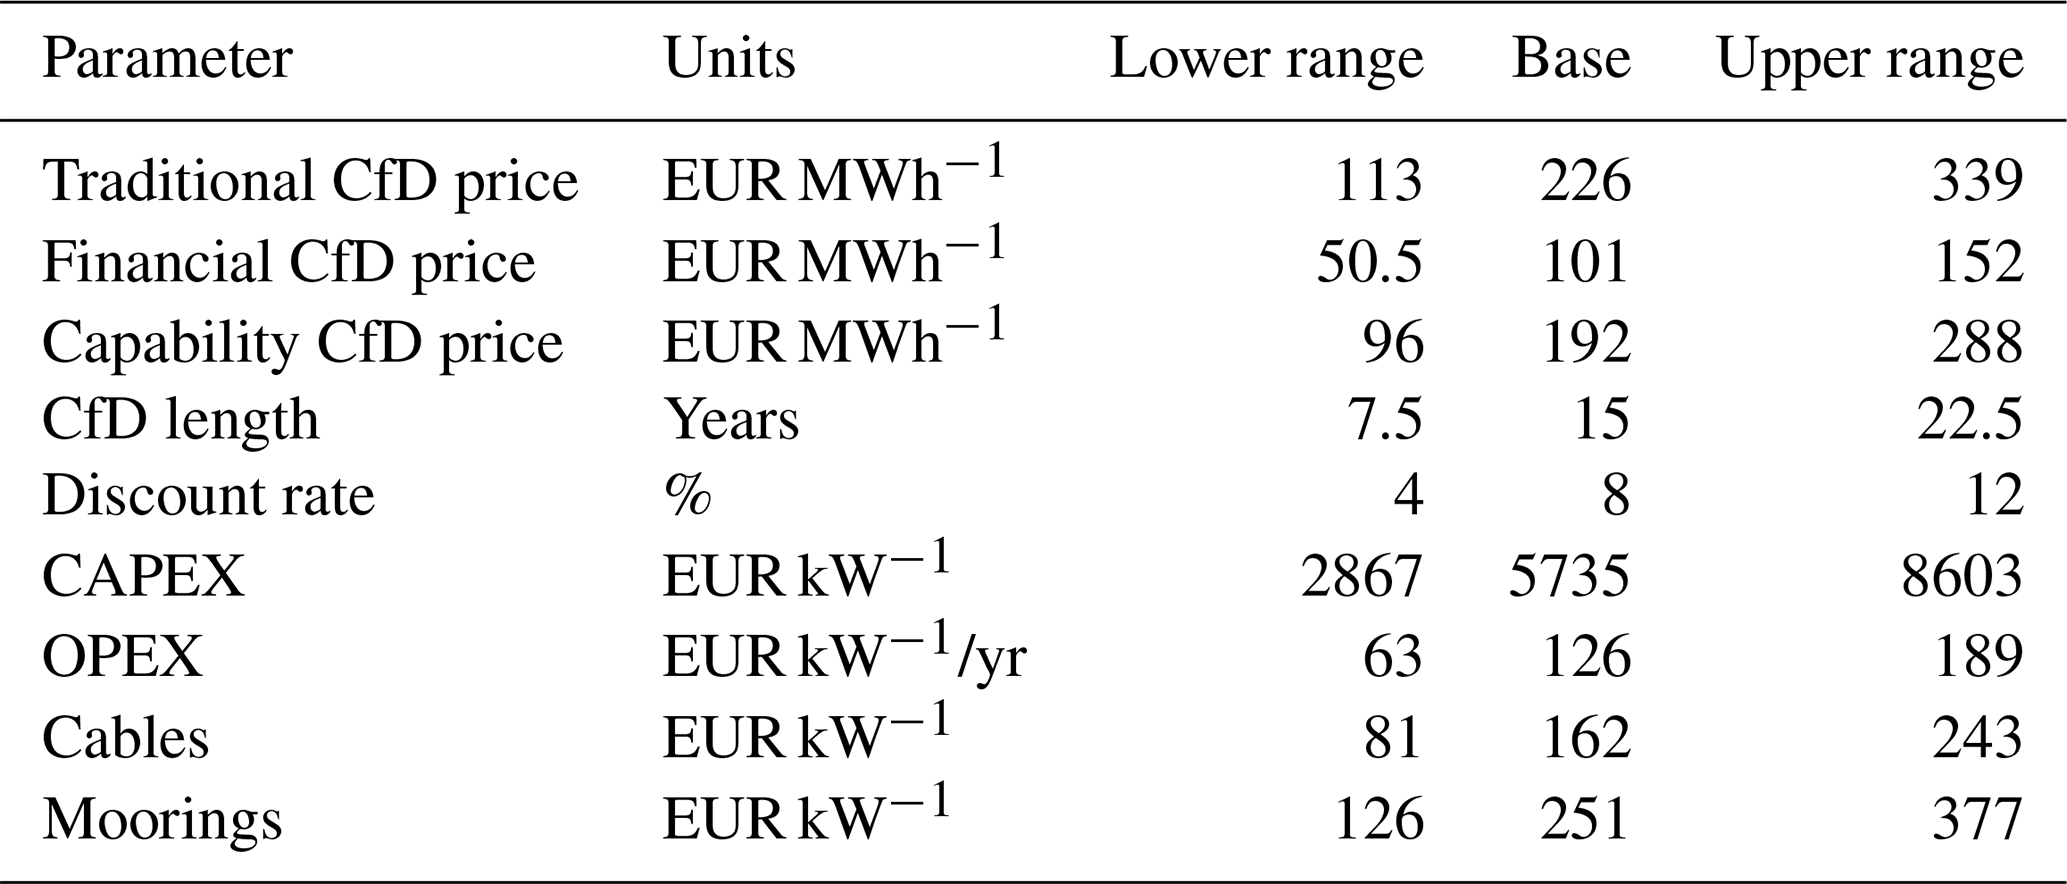
Alongside spot prices, a traditional generation-based CfD was added, which provides a stable price for the wind farm but is still dependent on generation where, during low-wind-speed hours, revenue suffers. The total hourly revenue for a two-way settlement (support and payback) is
with S the strike price, Pt the reference electricity price, and Gt the actual metered generation at hour t.
For the generation-independent CfDs, the financial version gives stable revenues that separate payments from actual farm generation. Revenues depend on deviations between actual and reference generation profiles, with the net hourly reference revenue being
with Qt the reference volume and MWfarm the rated capacity of the wind farm in megawatts.
The capability CfD rewards available generation capability instead of delivered energy. Compensations are made to the generator based on availability-adjusted potential generation, with hourly payments:
with the capability generation, based on expected capacity from a fleet and actual capacity of the wind farm in question. For the default CfD price calculation for all three support systems, the PAER zones marked for initial offshore development were adjusted for price using a numerical solver so that the average NPV of the four sites, which are visible in Fig. 4, equals zero, with the CfD prices shown in Table 2. From here, the relative advantages and disadvantages of the other Portuguese sites can be found.
2.1.4 Time series synthesis
A synthetic time series generator creates new wind and price data which avoid repetition whilst maintaining the statistical properties of the actual data. A method was suggested by Wan et al. (2014) which utilizes climatology and the statistical nature of actual time series data to reliably produce a synthetic future set. Seasonality is maintained alongside diurnal patterns. Mean, median, and P10 and P90 heads and tails are kept as close to the original data as possible. The data are split into weekly blocks where wind and price data overlap, where the shape of the week is intact whilst randomizing the weekly order to create new data for analysis.
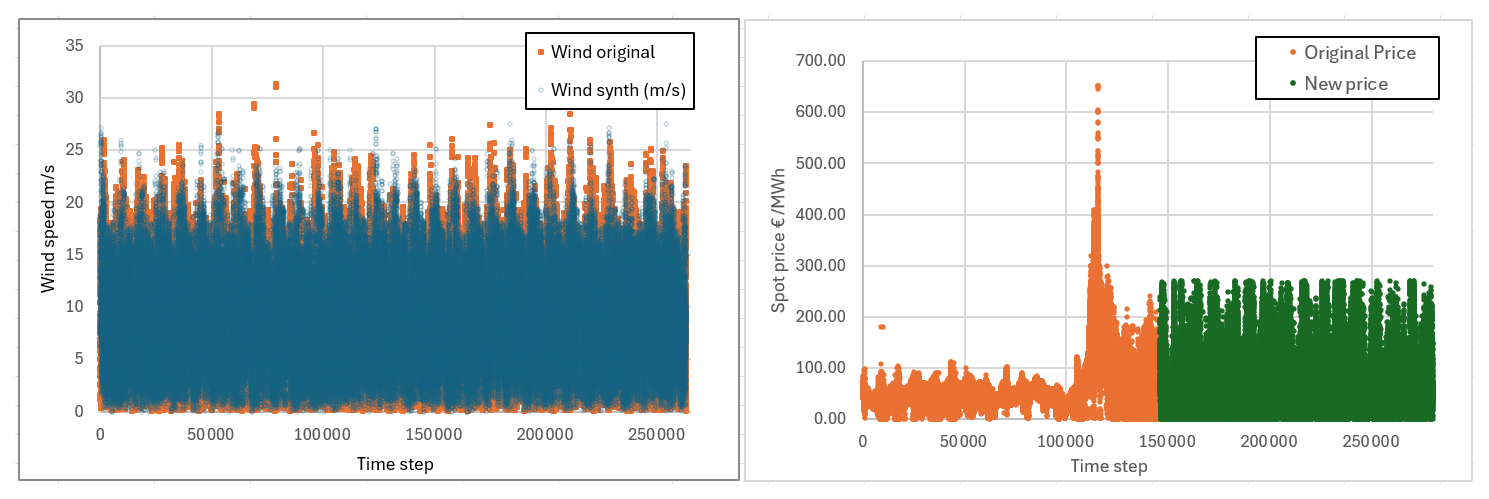
Figure 3Synthetic time series generator of actual historical data and future synthetic values.
2.2 Case study
The model was applied to a case study, considering the extent of the Portuguese coastline split into 36 zones. The sites considered are shown in Fig. 4, along with wind speed data from the Global Wind Atlas,1 depth contours from the GEBCO database,2 and the most recent lease areas identified by the Portuguese Government.3
2.2.1 Wind data
A 30-year hourly hindcast dataset was generated from Lautec (2024) which accesses the European Centre for Medium-Range Weather Forecasts (ECMWF) ERA5 dataset, as has been used for similar studies, including Molina et al. (2021). Generation and OPEX run for a base length of 25 years, with room for lifetime extension, confirmed with recent leasing rounds in the UK now allowing 60 years of operation (two cycle) (The Crown Estate, 2024). Data points provide wind speed data at 10 and 100 m, plus significant wave height and wave period, and are selected from a latitude–longitude gridded dataset at a 0.25° resolution, with the first marine data point selected as the near site, moving west or south depending on the coast. Figure 4 shows the three data points for each site at increasing distances from shore. Of interest are the higher wind speeds to the north and close to the capes of Roca (north of Lisbon) and São Vicente (Sagres), creating higher wind speeds due to the wind gradient and topographic funnelling effects of inland winds reaching the lower-friction surface at sea. To reflect higher wind speeds experienced at the turbine nacelle, measurements 10 m above sea level were extrapolated to a hub height of 150 m using the power law equation:
Here Uz is the wind speed in metres per second at height z; Uref the reference wind speed from the dataset; zref the reference height in metres; and α the exponent factor that relates to the atmospheric stability (Touma, 1977), with a value of 0.11 used to reflect deep-water offshore locations as recommended in the IEC standard for fixed offshore wind turbines (IEC 61400-3) and consistent with the findings of (Yang et al., 2024.).
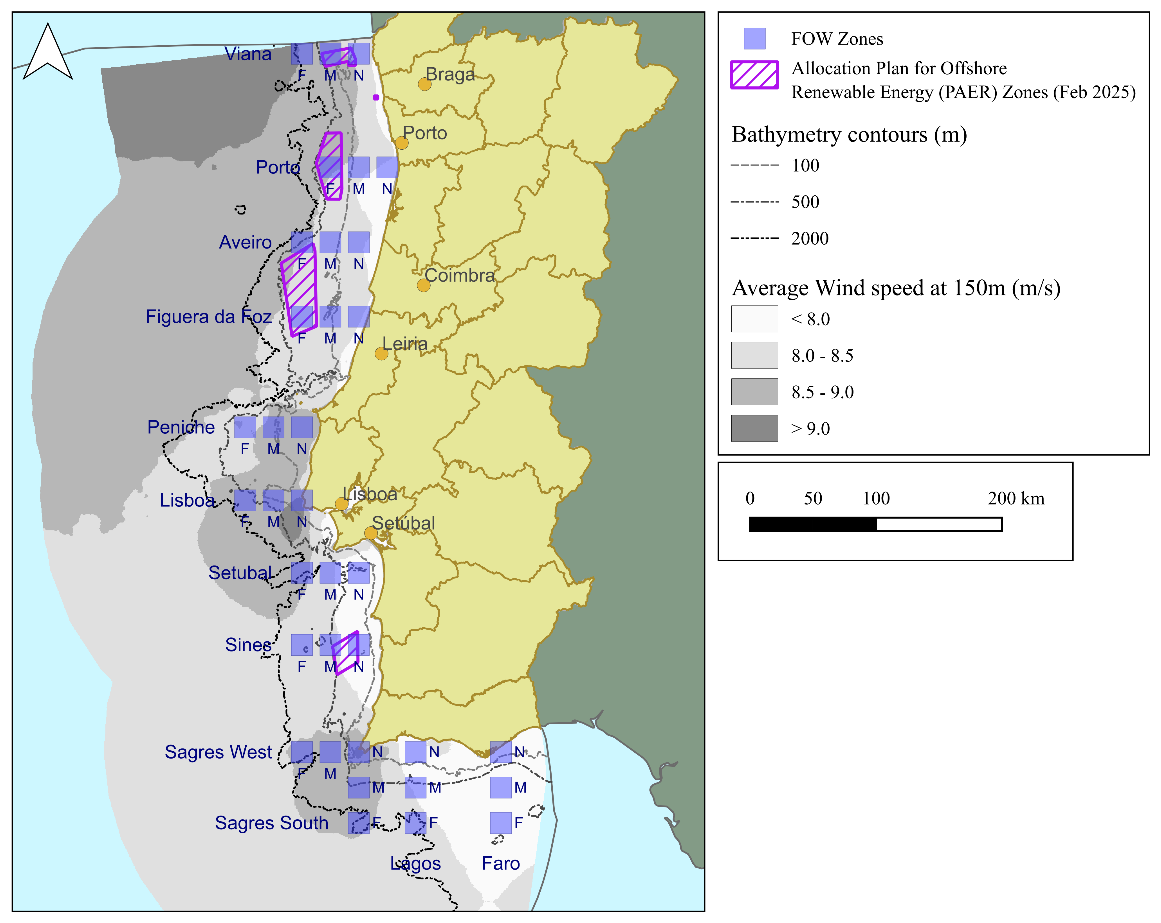
Figure 4Map of Portugal showing the chosen sites, leasing rounds, bathymetry, and average 150 m annual wind speeds (DTU, 2025).
For the data synthesis, an hourly climatology of average and standard deviation across 30 years per site was created. Anomalies are then established as the difference per hour between the site wind speed measurement and mean climatology value over 30 years. Anomalies are then re-added to the synthetic time series to preserve the temporal correlation and wind price alignment, alongside monthly and diurnal cycles.
2.2.2 Generation
Once the wind resource is defined at hub height, the kinetic energy contained in the wind is transformed into electrical power through the turbine's aerodynamic and electromechanical processes. This is done by creating a power curve using the exponential parameters of a curve fitted to the 15 MW wind turbine generator (WTG) parameters and wind speed:
with PU the power at wind speed U, A the WTG rated power in kilowatts, and k and n fitting constants that are adjusted and optimized in the model to reduce the sum squared errors (SSEs) between the actual power curve and the modelled power curve produced with Eq. (10). This equation allows the hourly averaged wind speed data to be converted at a higher temporal resolution with regards to distributional probability methods with mean annual values. Constraints can also then be applied to produce no power at wind speeds below cut-in and above cut-out speeds (set at 3 and 25 m s−1, respectively).
Farm generation is the individual energy production from one WTG scaled to the farm level, with reductions applied for wake effects and electrical losses and with availability applied last. The scope of this study is not the optimization of farms using detailed wake models and layouts, and therefore a simple grid was used for layouts and turbine spacing. However, this aspect serves as a potential avenue for future work.
Efarm is the total energy output of the wind farm in kilowatt-hours for 1 h, nWTGs the total number of WTGs in the farm, ηwake the wake losses, ηelec the electrical and ηsys system losses (10 %, 1.5 %, and 1 %, respectively), and avail the total farm availability (grouped in Table 1). This is then summed over the lifetime to obtain total energy.
3.1 LCoE
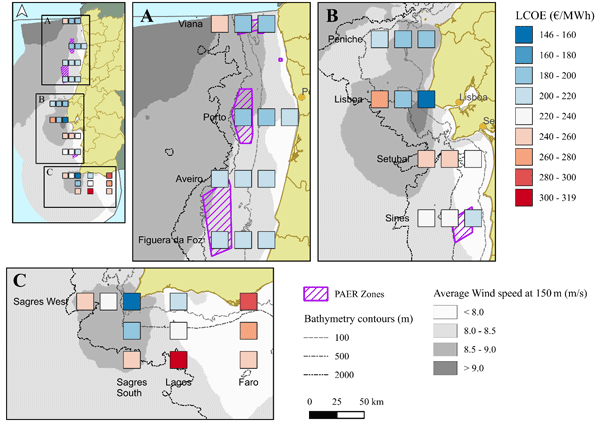
LCoE results were mapped according to coordinates of each prospective wind farm location. Figure 5 presents these findings alongside the mean speed winds at hub height of the wind turbine (150 m) and the depth contours, alongside the Offshore Renewable Energy Zoning Plan (PAER) leasing areas. LCoE values range from EUR 146–319 MWh−1, with topographical higher nearshore wind speeds giving the lowest value and extremely deep waters away from high wind speeds offering the worst. Due to the impacts of longer cable routes and sea depths, sites closest to shore tend to be the most desirable from an LCoE perspective. This is true for sites to the south-west, where higher nearshore wind speeds further reduce the benefit of far sites in very deep waters. In the north, LCoE is more evenly spread, with a wider continental shelf and wind speeds averaging above 8.5 m s−1 in most areas, with some far sites above 9.0 m s−1. Also shown are the current leasing zones associated with Portugal's floating offshore wind auctions to contextualize the results within the present development landscape. Wind speeds are influenced by topographic factors including the mountainous Sintra area west of Lisbon and the Sagres promontory zone, benefitting from higher local wind speeds visible in darker-grey areas. Also, larger continental-shelf areas (within the darker dashed line) see consistent LCoE and a shallower shelf, especially zone A and B in Fig. 5.
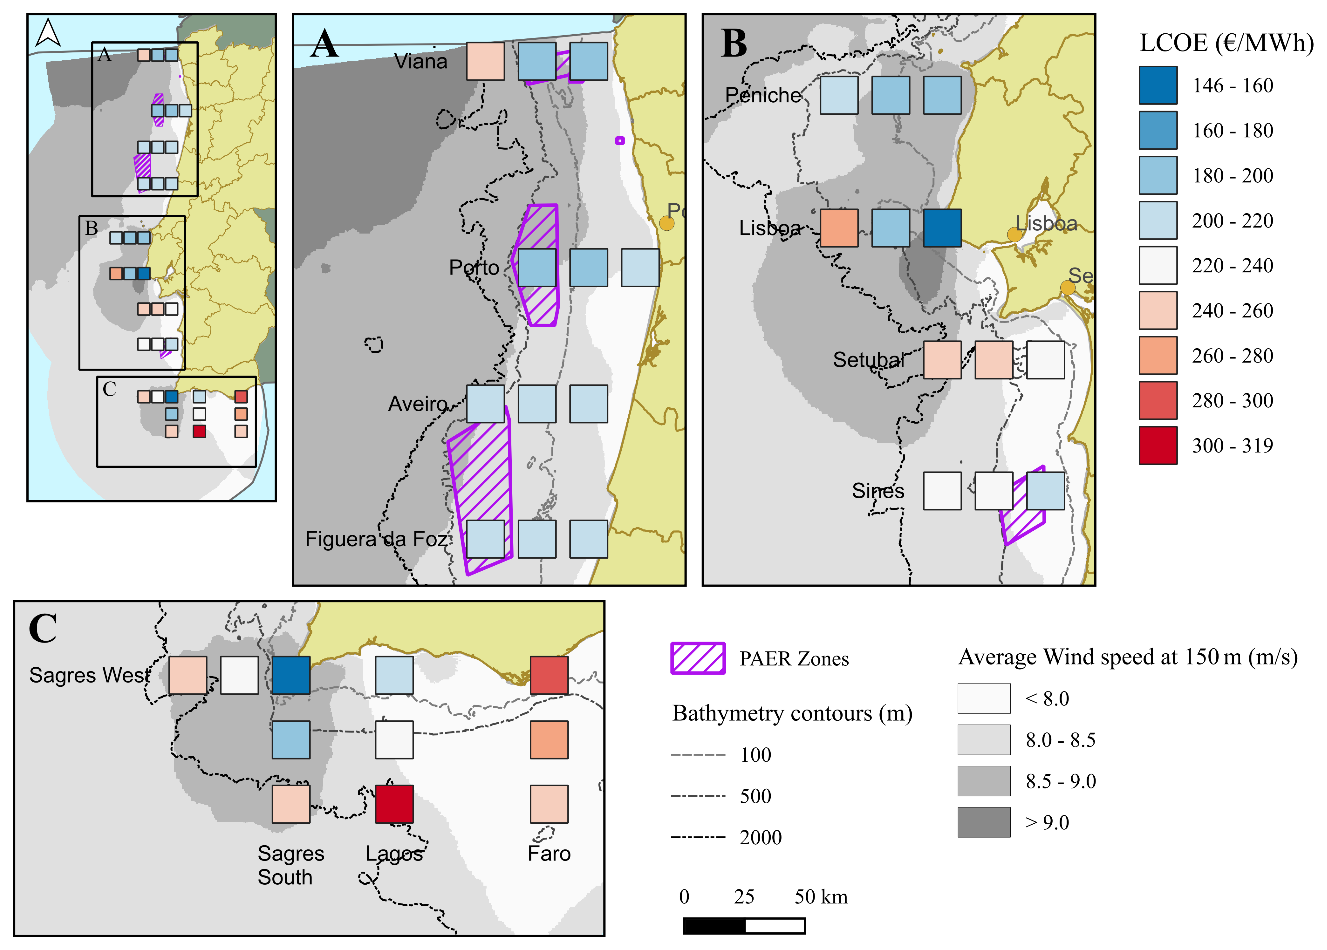
Figure 5Mapped LCoE results, with mean wind speed and depth layers.
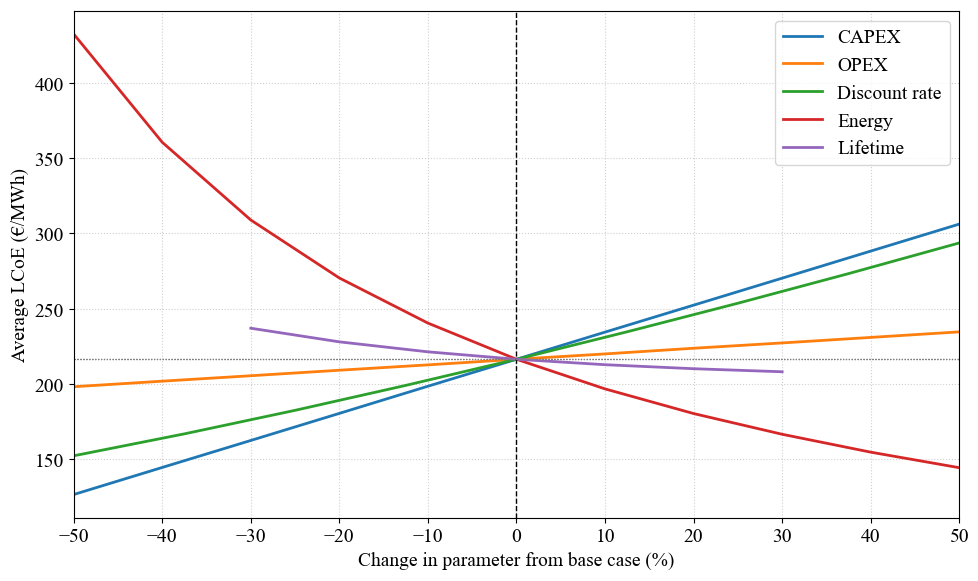
Figure 6 presents sensitivity analysis for the key parameters with influence over LCoE, presented on a common ±50 % axis and averaged across all sites. Steeper gradients represent larger effects on LCoE, which is highest for changes in energy generation, followed by CAPEX and discount rate. Energy change is significant as there is on average a 7 % rise in wind speed moving from near to far sites, but this must be tempered by the longer export cable routes and steep increases in water depths, which affect mooring costs.
CAPEX adjustment from 50 %–150 % of total expenditure, alongside energy generation, has the greatest impact on LCoE: 50 % of total CAPEX would require dramatic cost reductions, especially to the heaviest and most material-intensive components such as platforms and mooring systems in deeper waters (Barter et al., 2020), and 150 % CAPEX is also a potential risk, considering changes to commodity markets that have in some cases doubled in recent years. CAPEX has the strongest cost-side influence on LCoE. A 50 % reduction in CAPEX decreases the average LCoE from approximately EUR 217 MWh−1 to EUR 128 MWh−1, while a 50 % increase raises it to approximately EUR 307 MWh−1. The effect of distance-related costs also becomes less pronounced as overall capital costs decrease. This broad sensitivity reflects the range of maturity and potential within the FOW energy sector, from cost levels approaching those of established offshore renewable projects to those characteristic of early demonstrators and pre-commercial arrays. The results therefore highlight the importance of reducing component fabrication costs – especially for those with high innovation potential, including the foundation and mooring system – and improving project development, design, and procurement prior to FID. Energy yield is most impactful, with a halving of energy generation resulting in approximately double the LCoE, which could be the case for low-wind sites or those with heavy curtailment or availability loss. Improvements leading to a 50 % increase only result in a one-third decrease in LCoE, highlighting the strong penalties associated with underperformance.
The discount rate also has a high impact on results and project feasibility, and therefore a realistic value and sensitivity range should be set, owing to the larger impact on generating, O&M, and any CAPEX incurred before year 0. The base value of 8 % represents riskier technology in a challenging environment and 2 % above normal fixed offshore wind, which is currently the rate for most wind farms built and operated in mature markets (Malleret et al., 2024).
For OPEX, around one-third of total project expenditure is attributed to the operating and maintenance of the FOW farm. As OPEX is discounted over time, this results in ever reducing costs over the project life. The opposite is true for lifetime extension; again impacts are suppressed by extending years where the generation is discounted heavily. This does not necessarily mean it is unimportant, only that its effect is diluted with the formulation of the LCoE equation. Most sites are classed “severe” due to wave heights and the classification method explained in Sect. 2.1.2. OPEX adjustments maintain a relatively low impact on LCoE. It is impacted by increasing distance, but most sites fall into the 25–100 km (severe) or 25–150 km (moderate) bands that define a medium-distance strategy and therefore moderate cost impact.
3.2 NPV
Sensitivity analysis for NPV is shown in Fig. 7 with changes to key parameters, including energy production, CAPEX, OPEX, and CfD price and length. Changes to energy production have a large impact on the traditional CfD type, which is the only truly generation-dependent method. CfD price has a greater impact than the length of contract and is impactful across all CfD types. CAPEX and financing costs are also high drivers, which highlight the need for de-risking and cost reductions in FOW for commercialization to become a reality.
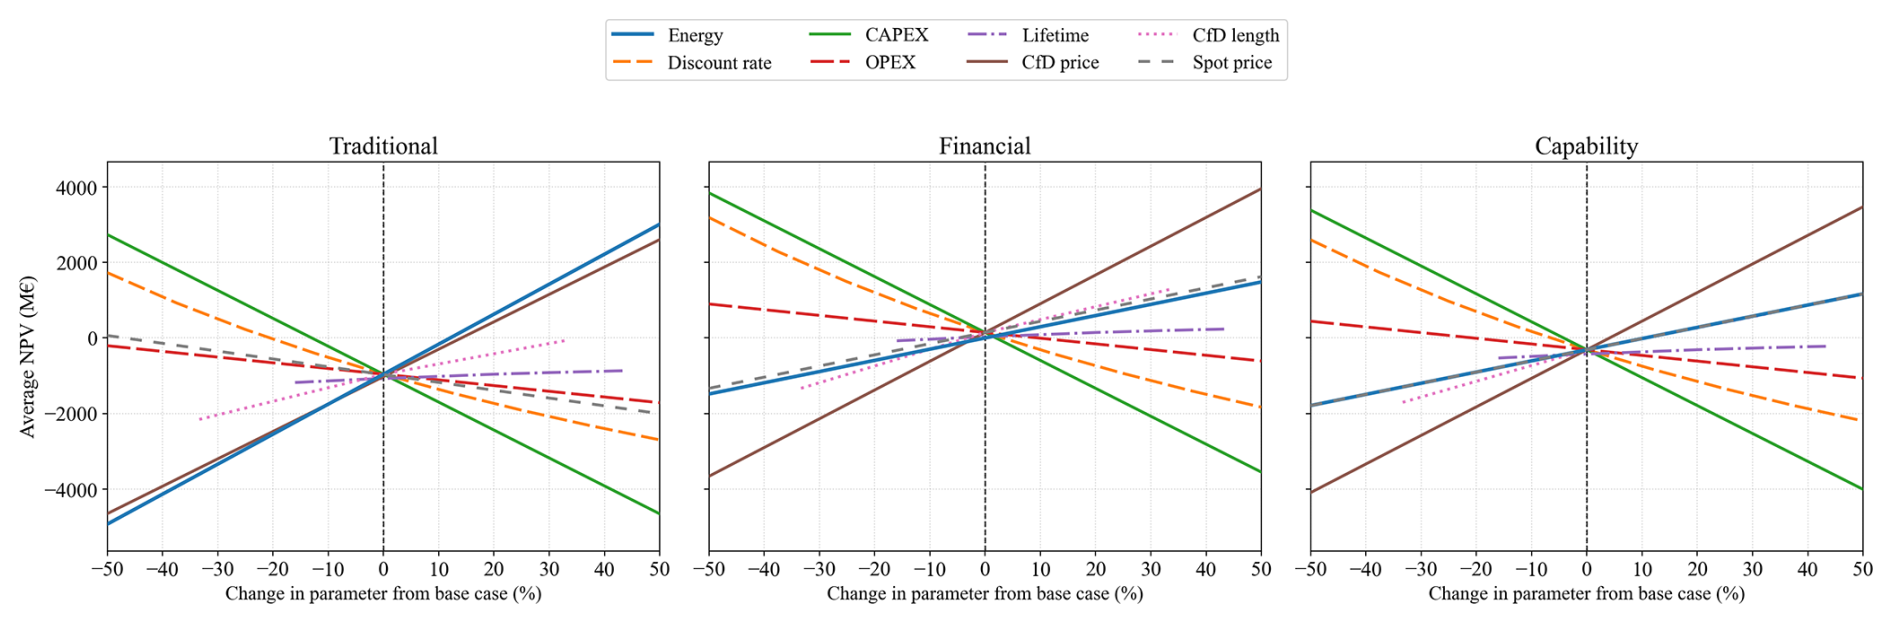
Figure 7Sensitivity analysis results for NPV for the traditional, financial, and capability CfD.
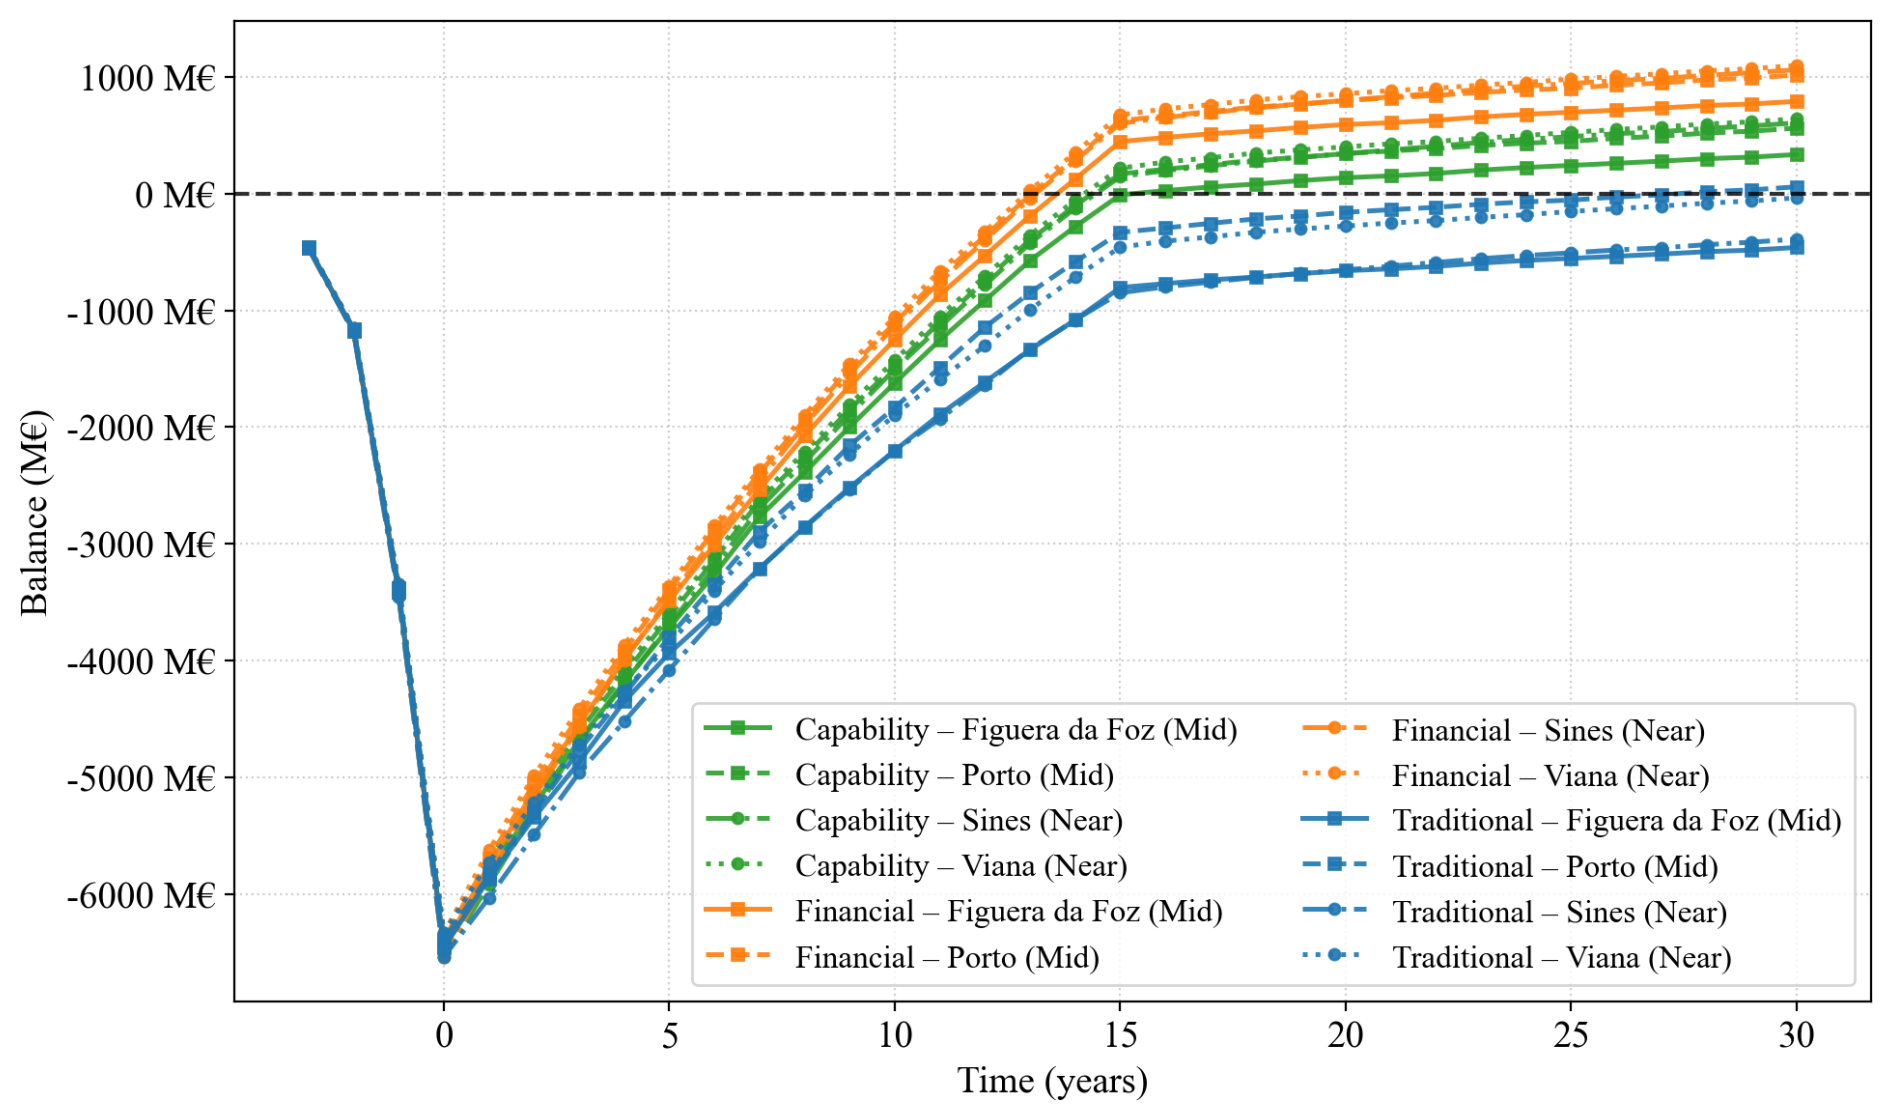
Project balance for a range of wind farm locations, closely linked to the prospective leasing areas, is shown in Fig. 8. Almost all traditional CfD methods with a EUR 226 MWh−1 price do not achieve profitability within 30 years of base-case operation. The steeper part of the upward curve after the CAPEX debt represents the CfD, and the financial and capability methods almost all result in wind farm profitability before the regular spot prices come into effect from year 15 onwards.
3.3 IRR
Mapped IRR results under a traditional CfD are presented in Fig. 10. This defines a commercial farm but with added risk compared to fixed offshore wind; any IRR value under 8 % represents a currently unprofitable wind farm area, with all light-blue to dark-blue squares offering profitable sites. Wind speeds at hub height and significant depth contours are also shown. A traditional CfD method rewards higher generation, and so higher-wind-speed sites benefit from this CfD method, and for lower-generation sites away from windy areas the opposite is true. The sensitivity for IRR in Fig. 9 shows the main drivers of IRR change. Similar to the NPV sensitivity study, CfD price and CAPEX reductions impact IRR, with the metric impacted with initial negative cash flows (CAPEX spend) and future positive cash flows associated with the larger revenues from higher CfD prices. Energy generation again impacts the traditional CfD, with a smaller effect under the financial and capability CfDs, where revenues are less directly linked to actual farm generation.
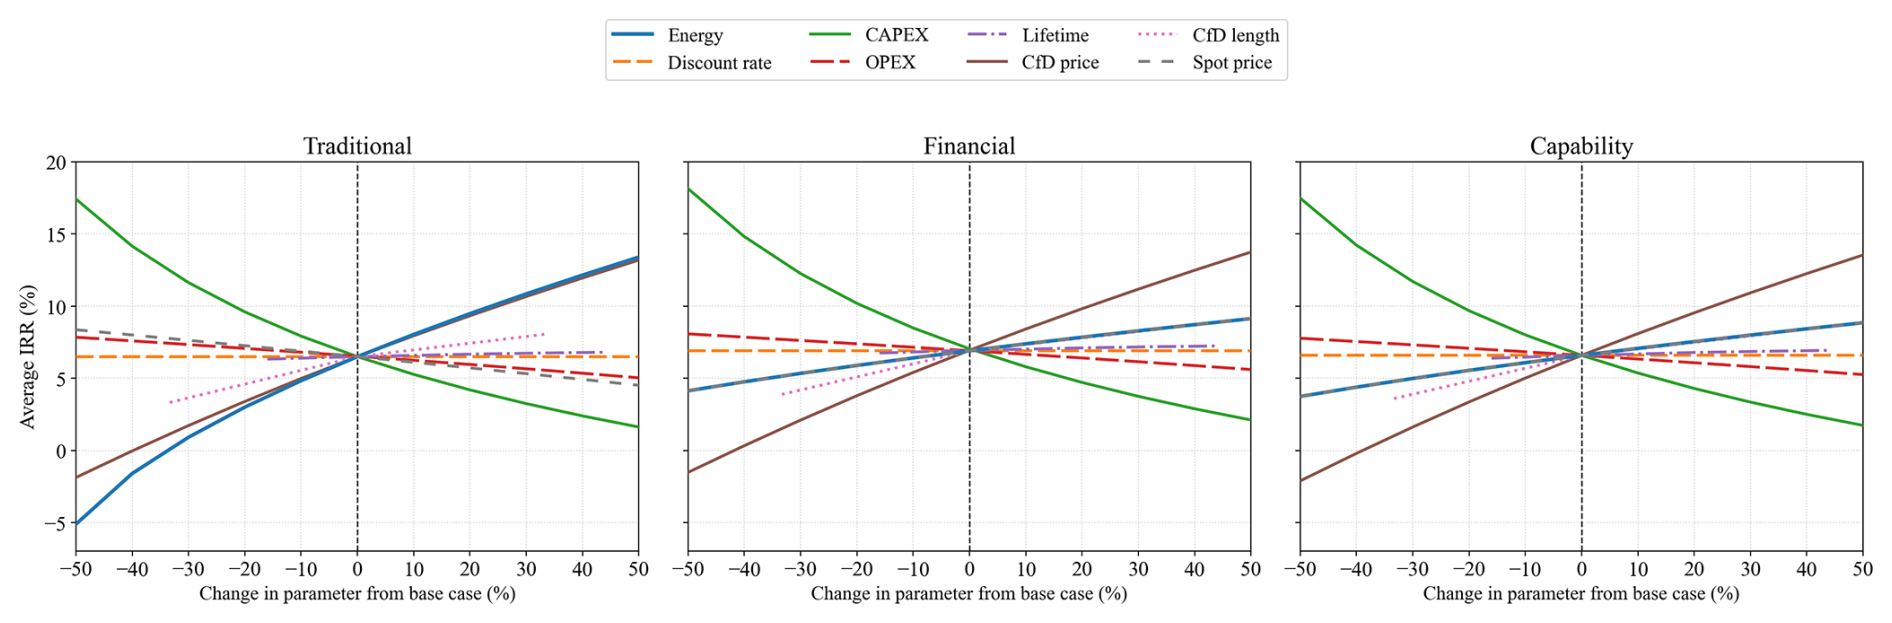
Figure 9Sensitivity analysis results for IRR for the traditional, financial, and capability CfD.
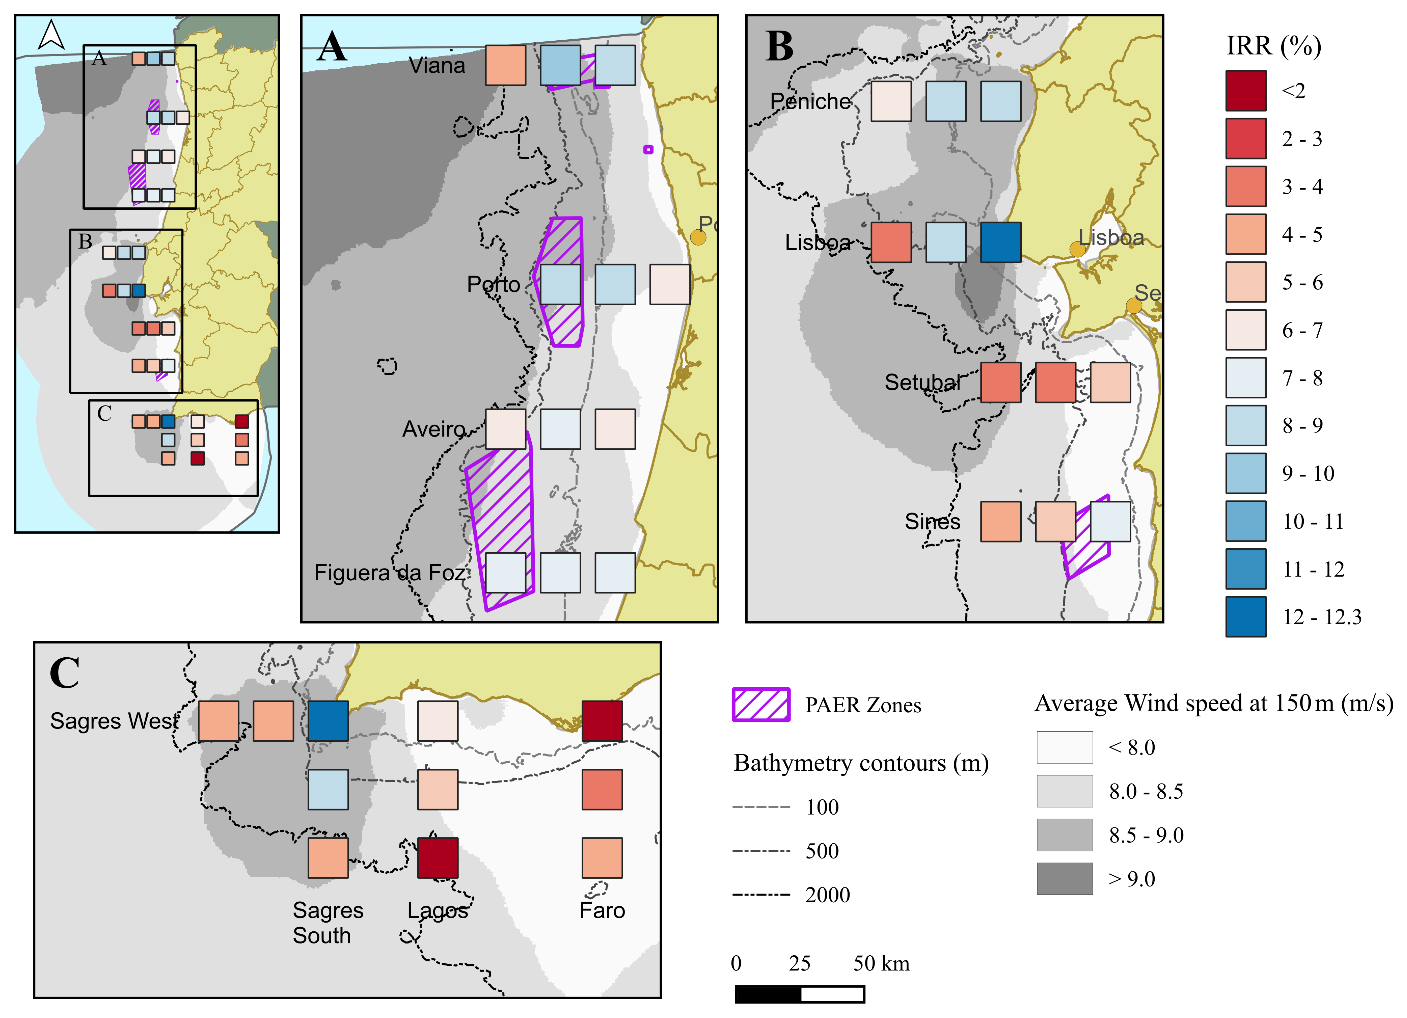
Figure 10Mapped IRR results for traditional CfD, with mean wind speed, leasing zones, and depth layers.

Figure 11Mapped IRR results for generation-independent financial and capability CfDs.
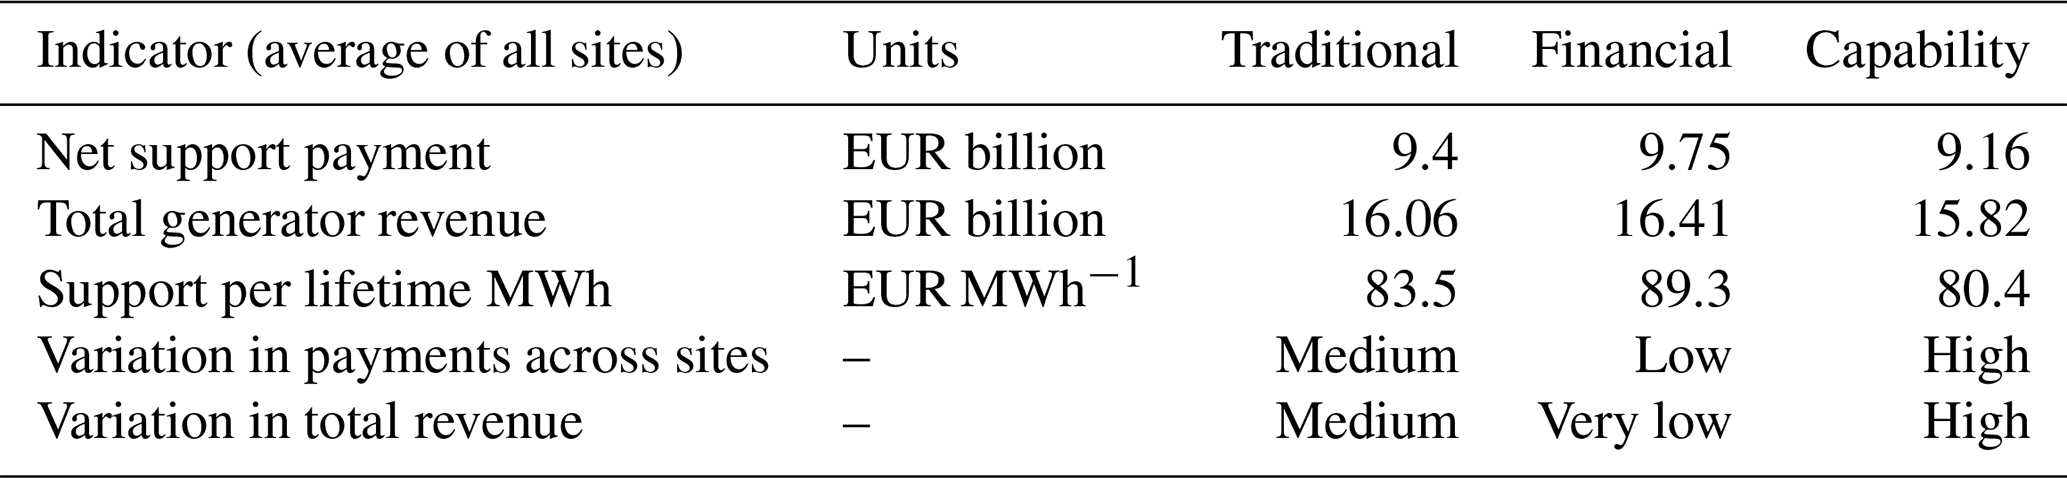
The generation-independent revenue support schemes are presented in Fig. 11, along with the IRR delta compared to the traditional generation-based CfD method. For the financial CfD, revenues are uniform due to fixed payments made to the generator, with a narrow range of lifetime revenues between EUR 16.09–EUR 16.41 billion. This CfD method greatly reduces the geographical variation between sites. Owing to the fixed capacity payments received and the returns based on a reference generator, financial support is inversely related to the reference generation. This makes this method attractive for strong sites but costly for weaker sites (such as Faro in the south).
The capability CfD method has the widest range of total support payments across all sites of EUR 3.21–EUR 12.72 billion, with payments rising with reference generation and capacity factor, directing remuneration to more potentially productive sites. This method rewards capability and avoids sending large amounts to the weaker, lower-wind-speed sites. Generators still have incentives to overperform against reference values, away from a “produce and forget” approach. Compared with the financial CfD, revenues are less stable, ranging from EUR 7.25–EUR 20.54 billion. A summary of the three methods can be seen in Table 3.
This paper presents an economic viability study for floating offshore wind in Portugal under a range of financial support mechanisms. The study assessed 12 areas at 3 distances to shore, giving 36 sites to broadly assess how the full mainland Portuguese coastline could support this deep-water technology. LCoE is strongly linked as expected with areas of high wind speeds (>8.5 m s−1) and broader areas of continental shelf to develop on, with the best sites in Lisbon and Sagres benefitting from higher nearshore wind speeds caused by local topographic effects. LCoE range is broad across the country, ranging from EUR 146–319 MWh−1. Generally, values are lowest in the north of Portugal, benefitting from the higher wind speeds and relatively broad and shallow offshore shelf. Average LCoE is best closest to shore at EUR 206 MWh−1 on average, mid-range sites are EUR 216 MWh−1, and far sites are on average EUR 241 MWh−1, showing a steady worsening offshore generally due to longer cable routes, more expensive O&M, and very deep water for development, with CAPEX increasing from EUR 5.94 billion nearshore to EUR 8.16 billion on average for far sites.
For the CfD mechanisms, the traditional method rewards the strongest actual generators, the capability method rewards the strongest theoretical reference generator, and the financial method rewards the most evenly but rewards the weakest-performing sites with large remunerations. All CfD methods have their own strengths and weaknesses across overall support, generator revenues, and variation between sites. The financial CfD operates best to level the FOW playing field in Portugal, with low variation in payments and revenues, which could lead to a better spread of projects across a wider geographical area, rather than a few gigawatts of high-performing sites in the best wind areas.
Sensitivity analysis shows that CAPEX, energy yield, and discount rate are the most potent drivers of changes in LCoE, IRR, and NPV and therefore represent the principal barriers to be addressed for floating offshore wind to progress from its current pre-commercial scale to full commercial deployment, with the associated climate and socio-economic benefits this expansion would enable. CAPEX is a large driver of LCoE sensitivity, and cost reductions in high-innovation-potential areas are of importance. Also, there is a trade-off between accessing far-shore areas of strong wind resource and the added costs associated with access, cables, and mooring systems. Energy yield changes, the strongest sensitivity driver for LCoE, penalize underperforming sites, which could be mitigated by the financial CfD mechanism, which creates a range of reference projects to spread the volume across multiple sites. The discount rate, representing project financing, is lowered through better costs of financing and is improved though de-risking projects through successful demonstration, technical innovation, and improvements to revenue generation methods that this paper discusses in detail.
Although the present analysis does not evaluate wider industrial or market-evolution effects, as global costs fall, and domestic supply chains mature, floating offshore wind has the potential to move from a challenging investment today to a major long-term economic and strategic opportunity for Portugal.
The techno-economic model data, code for data analysis, and all metocean datasets are available at https://doi.org/10.5281/zenodo.23352285 (White, 2026).
Techno-economic model, synthetic time series generator, data analysis, and manuscript writing by CW. Digital mapping and reviewing by CF. Results and manuscript review by JC.
The contact author has declared that none of the authors has any competing interests.
Publisher's note: Copernicus Publications remains neutral with regard to jurisdictional claims made in the text, published maps, institutional affiliations, or any other geographical representation in this paper. The authors bear the ultimate responsibility for providing appropriate place names. Views expressed in the text are those of the authors and do not necessarily reflect the views of the publisher.
This article is part of the special issue “Wind energy economics and markets with high shares of renewables”. It is not associated with a conference.
The authors would like to acknowledge the FLOAting Wind Energy network (FLOAWER); the TWIND project, which created the training and academic connections to enable this study; and Luís M. C. Gato at IST for PhD assistance.
This work was funded by Portugal's Recovery and Resilience Plan (PRR) and the European Union – NextGenerationEU, through the 2022–2026 multiannual funding awarded to WavEC as a Portuguese Technology and Innovation Centre (CTI), recognized by the National Innovation Agency (ANI).
This paper was edited by Anastasia Ioannou and reviewed by three anonymous referees.
Aldersey-Williams, J. and Rubert, T.: Levelised cost of energy – A theoretical justification and critical assessment, Energ. Policy, 124, 169–179, https://doi.org/10.1016/j.enpol.2018.10.004, 2019.
Barter, G. E., Robertson, A., and Musial, W.: A systems engineering vision for floating offshore wind cost optimization, Renew. Energy Focus, 34, 1–16, https://doi.org/10.1016/j.ref.2020.03.002, 2020.
Beiter, P., Musial, W., Smith, A., Kilcher, L., Damiani, R., Maness, M., Sirnivas, S., Stehly, T., Gevorgian, V., Mooney, M., and Scott, G.: A Spatial-Economic Cost-Reduction Pathway Analysis for U.S. Offshore Wind Energy Development from 2015–2030, National Renewable Energy Laboratory, Golden, CO, NREL/TP-6A20-66579, https://doi.org/10.2172/1324526, 2016.
Beiter, P., Guillet, J., Jansen, M., Wilson, E., and Kitzing, L.: The enduring role of contracts for difference in risk management and market creation for renewables, Nat. Energy, 9, 20–26, https://doi.org/10.1038/s41560-023-01401-w, 2024.
Bilbao-Terol, A., Cañal-Fernández, V., and Gónzalez-Pérez, C.: Evaluating Energy Security using Choquet Integral: analysis in the southern E.U. countries, Ann. Oper. Res., 355, 721–763, https://doi.org/10.1007/s10479-023-05748-x, 2025.
Branker, K., Pathak, M. J. M., and Pearce, J. M.: A review of solar photovoltaic levelized cost of electricity, Renew. Sust. Energ. Rev., 15, 4470–4482, https://doi.org/10.1016/j.rser.2011.07.104, 2011.
Buljan, A.: Portugal Launches Initial Stage of Offshore Wind Tendering Process, OffshoreWIND.biz, https://www.offshorewind.biz/2023/11/01/portugal-launches-initial-stage-of-offshore-wind-tendering-process/ (last access: 24 March 2025), 2023.
BVG Associates: Guide to a Floating Offshore Wind Farm, BVG Associates, https://guidetofloatingoffshorewind.com/ (last access: 5 October 2026), 2025.
Castro-Santos, L., Silva, D., Bento, A. R., Salvação, N., and Guedes Soares, C.: Economic feasibility of floating offshore wind farms in Portugal, Ocean Eng., 207, 107393, https://doi.org/10.1016/j.oceaneng.2020.107393, 2020.
Çetinkaya, Ü., Yeşil, M., Bayındır, R., and Irmak, E.: Technical analysis and strategic insights from the 2025 Spain blackout, in: 2025 13th International Conference on Smart Grid (icSmartGrid), Glasgow, UK, https://doi.org/10.1109/icSmartGrid66138.2025.11071817, 2025.
DNV: Energy Transition Outlook 2023, DNV, https://www.dnv.com/energy-transition-outlook/ (last access: 5 October 2026), 2023.
DTU: Global Wind Atlas, https://globalwindatlas.info/en/ (last access: 5 October 2026), 2025.
Duarte, T., Price, S., Peiffer, A., and Pinheiro, J. M.: WindFloat Atlantic Project: Technology Development Towards Commercial Wind Farms, in: Offshore Technology Conference, Houston, Texas, USA, 2–5 May 2022, OTC-32058-MS, https://doi.org/10.4043/32058-MS, 2022.
Gaertner, E., Rinker, J., Sethuraman, L., Zahle, F., Anderson, B., Barter, G., Abbas, N., Meng, F., Bortolotti, P., Skrzypinski, W., Scott, G., Feil, R., Bredmose, H., Dykes, K., Shields, M., Allen, C., and Viselli, A.: IEA Wind TCP Task 37: Definition of the IEA Wind 15-Megawatt Offshore Reference Wind Turbine, National Renewable Energy Laboratory, Golden, CO, NREL/TP-5000-75698, https://doi.org/10.2172/1603478, 2020.
Gomes, J. G., Medeiros Pinto, J., Xu, H., Zhao, C., and Hashim, H.: Modeling and planning of the electricity energy system with a high share of renewable supply for Portugal, Energy, 211, 118713, https://doi.org/10.1016/j.energy.2020.118713, 2020.
InnoEnergy: Future renewable energy costs: Offshore wind – 57 technology innovations that will have greater impact on reducing the cost of electricity from European offshore wind farms, InnoEnergy, ISBN 978-84-697-7560-8, 2017.
Jacobsen, A. and Godvik, M.: Influence of wakes and atmospheric stability on the floater responses of the Hywind Scotland wind turbines, Wind Energy, 24, 149–161, https://doi.org/10.1002/we.2563, 2021.
Kitzing, L., Held, A., Gephart, M., Wagner, F., Anatolitis, V., and Klessmann, C.: Contracts-for-difference to support renewable energy technologies: Considerations for design and implementation, European University Institute, Florence, Italy, Research Project Report 2024/03, https://doi.org/10.2870/379508, 2024.
Laboratório Nacional de Energia e Geologia (LNEG): Working Group for the planning and operationalization of power generation centers based on renewable energy sources of oceanic origin or location, LNEG, https://www.lneg.pt/wp-content/uploads/2023/07/20230531-GTOffshore_RelatorioFinal_vfinal.pdf (last access: 13 October 2026), 2023.
Lautec: Lautec ESOX Map, https://esox.lautec.com/ (last access: 5 October 2026), 2024.
Lucas, T. R., Ferreira, A. F., Santos Pereira, R. B., and Alves, M.: Hydrogen production from the WindFloat Atlantic offshore wind farm: A techno-economic analysis, Appl. Energy, 310, 118481, https://doi.org/10.1016/j.apenergy.2021.118481, 2022.
Maienza, C., Avossa, A. M., Picozzi, V., and Ricciardelli, F.: Feasibility analysis for floating offshore wind energy, Int. J. Life Cycle Assess., 27, 796–812, https://doi.org/10.1007/s11367-022-02055-8, 2022.
Malleret, S., Jansen, M., Laido, A. S., and Kitzing, L.: Profitability dynamics of offshore wind from auction to investment decision, Renew. Sust. Energ. Rev., 199, 114450, https://doi.org/10.1016/j.rser.2024.114450, 2024.
Martinez, A. and Iglesias, G.: Mapping of the levelised cost of energy for floating offshore wind in the European Atlantic, Renew. Sust. Energ. Rev., 154, 111889, https://doi.org/10.1016/j.rser.2021.111889, 2022.
Molina, M. O., Gutiérrez, C., and Sánchez, E.: Comparison of ERA5 surface wind speed climatologies over Europe with observations from the HadISD dataset, Int. J. Climatol., 41, 4864–4878, https://doi.org/10.1002/joc.7103, 2021.
Musial, W., Spitsen, P., Duffy, P., Beiter, P., Shields, M., Mulas Hernando, D., Hammond, R., Marquis, M., King, J., and Sathish, S.: Offshore Wind Market Report: 2023 Edition, National Renewable Energy Laboratory, Golden, CO, NREL/TP-5000-87232, https://doi.org/10.2172/2001112, 2023.
Myhr, A., Bjerkseter, C., Ågotnes, A., and Nygaard, T. A.: Levelised cost of energy for offshore floating wind turbines in a life cycle perspective, Renew. Energy, 66, 714–728, https://doi.org/10.1016/j.renene.2014.01.017, 2014.
Noothout, P., de Jager, D., Tesnière, L., van Rooijen, S., Karypidis, N., Brückmann, R., Jirouš, F., Breitschopf, B., Angelopoulos, D., and Doukas, H.: The impact of risks in renewable energy investments and the role of smart policies, DiaCore project report, European Commission, https://www.isi.fraunhofer.de/content/dam/isi/dokumente/ccx/dia-core/D3-4_diacore_2016_impact_of_risk_in_res_investments.pdf (last access: 13 October 2026), 2016.
Ramos, H. M., Amaral, M. P., and Covas, D. I. C.: Pumped-Storage Solution towards Energy Efficiency and Sustainability: Portugal Contribution and Real Case Studies, J. Water Resour. Prot., 6, 1099–1111, https://doi.org/10.4236/jwarp.2014.612103, 2014.
REN: Electricity, https://www.ren.pt/en-gb/activity/electricity (last access: 5 October 2026), 2024a.
REN: Monthly Balance, https://datahub.ren.pt/en/electricity/monthly-balance/ (last access: 5 October 2026), 2024b.
Risch, D., Favill, G., Marmo, B., van Geel, N., Benjamins, S., Thompson, P., Wittich, A., and Wilson, B.: Characterisation of underwater operational noise of two types of floating offshore wind turbines, Scottish Association for Marine Science (SAMS), report for Supergen Offshore Renewable Energy Hub, https://supergen-ore.net/uploads/resources/Fortune_Report_Final.pdf (last access: 13 October 2026), 2023.
Schlecht, I., Maurer, C., and Hirth, L.: Financial contracts for differences: The problems with conventional CfDs in electricity markets and how forward contracts can help solve them, Energ. Policy, 186, 113981, https://doi.org/10.1016/j.enpol.2024.113981, 2024.
Shen, W., Chen, X., Qiu, J., Hayward, J. A., Sayeef, S., Osman, P., and Meng, K.: A comprehensive review of variable renewable energy levelized cost of electricity, Renew. Sust. Energ. Rev., 133, 110301, https://doi.org/10.1016/j.rser.2020.110301, 2020.
Silva, L. and Sareen, S.: Solar photovoltaic energy infrastructures, land use and sociocultural context in Portugal, Local Environ., 26, 347–363, https://doi.org/10.1080/13549839.2020.1837091, 2021.
Skaare, B., Nielsen, F. G., Hanson, T. D., Yttervik, R., Havmøller, O., and Rekdal, A.: Analysis of measurements and simulations from the Hywind Demo floating wind turbine, Wind Energy, 18, 1105–1122, https://doi.org/10.1002/we.1750, 2015.
Sklar-Chik, M. D., Brent, A. C., and de Kock, I. H.: Critical review of the levelised cost of energy metric, S. Afr. J. Ind. Eng., 27, 124–133, https://doi.org/10.7166/27-4-1496, 2016.
The Crown Estate: Offshore Wind Leasing Round 4, https://www.thecrownestate.co.uk/our-business/marine/Round4 (last access: 30 January 2024), 2024.
Touma, J. S.: Dependence of the Wind Profile Power Law on Stability for Various Locations, J. Air Pollut. Control Assoc., 27, 863–866, https://doi.org/10.1080/00022470.1977.10470503, 1977.
Ueckerdt, F., Hirth, L., Luderer, G., and Edenhofer, O.: System LCOE: What are the costs of variable renewables?, Energy, 63, 61–75, https://doi.org/10.1016/j.energy.2013.10.072, 2013.
Van Fan, Y., Wilson, C., Kamiya, G., and Mastrucci, A.: Data Centre Energy Demand Projections within Shared Socioeconomic Pathways, Energy Clim. Change, 7, 100253, https://doi.org/10.1016/j.egycc.2026.100253, 2026.
Wan, C., Xu, Z., Pinson, P., Dong, Z. Y., and Wong, K. P.: Probabilistic forecasting of wind power generation using extreme learning machine, IEEE T. Power Syst., 29, 1033–1044, https://doi.org/10.1109/TPWRS.2013.2287871, 2014.
White, C.: Techno-economic Portugal study data, Zenodo [data set], https://doi.org/10.5281/zenodo.23352285, 2026.
WindEurope: Recommendation on the design of two-sided Contracts for Difference, WindEurope, https://windeurope.org/data/products/ (last access: 5 October 2026), 2025.
Yang, X., Jiang, X., Liang, S., Qin, Y., Ye, F., Ye, B., Xu, J., He, X., Wu, J., Dong, T., Cai, X., Xu, R., and Zeng, Z.: Spatiotemporal variation of power law exponent on the use of wind energy, Appl. Energy, 356, 122441, https://doi.org/10.1016/j.apenergy.2023.122441, 2024.
Global Wind Atlas – https://globalwindatlas.info/en/ (last access: 30 September 2025).
GEBCO Database – https://www.gebco.net/ (last access: 22 September 2025).
Portugal Offshore leasing areas – https://webgis.dgrm.mm.gov.pt/portal/apps/webappviewer/index.html?id=9ea76f6fe4ca463a8ced196e30fcc2e1 (last access: 29 October 2025).