the Creative Commons Attribution 4.0 License.
the Creative Commons Attribution 4.0 License.
 | 23 Feb 2026
Numerical analysis of dynamic wind turbine airfoil characteristics in transonic flow
Maria Cristina Vitulano
Delphine De Tavernier
Giuliano De Stefano
Dominic von Terzi
Modern large wind turbine rotors can encounter airflow at inflow Mach numbers of around 0.3 and Reynolds numbers of the order of 10 million at the blade tip. Our previous study (Vitulano et al., 2025) showed that for these operational conditions, the incompressibility assumption is violated, and supersonic flow can occur locally. The present follow-up study reports on a numerical investigation of the dynamic behavior of the FFA-W3-211 wind turbine tip airfoil in transonic flow using unsteady Reynolds-averaged Navier–Stokes (URANS) simulations. The computations are performed for a highly unsteady aerodynamic regime by imposing a dynamic sinusoidal pitching motion across the transonic threshold determined in our previous study. This way, the airfoil is forced to enter and leave the supersonic flow regime. The simulations are conducted by varying the reduced frequency and the inflow Mach number, while keeping the Reynolds number constant at nine million. The choice of non-negligible inflow Mach numbers combined with high Reynolds numbers results in a realistic combination for full-scale wind turbines, but it is still challenging to achieve experimentally with the test facilities available nowadays. The dynamic pitching motion is found to lead to the formation of a hysteresis loop with an extent, depending on both reduced frequency and inflow Mach number. In particular, it is observed that an increase in one of these two parameters induces an expansion of the hysteresis loop with the consequences of (1) an increase in the magnitude and variability of loads experienced by the airfoil, (2) a delay in the beginning and ending of the transonic flow regime, and (3) the onset of shock waves occurring at inflow Mach numbers lower than those estimated under static conditions. Moreover, since the formation of a hysteresis loop implies a range of conditions in which transonic flow can occur, this needs to be better understood and considered when defining any safety margin in the definition of the transonic threshold for turbine design and operation purposes. In general, this study suggests the need to take into account dynamic effects when predicting aerodynamic loads and performance for next-generation wind turbine rotors.
- Article
(17770 KB) - Full-text XML
- BibTeX
- EndNote


To address the growing demand for clean energy in recent decades, wind turbine rotors have increased in size, with the largest blades exceeding 100 m in length. As a result, the tip speed of current and next-generation wind turbines also increases, reaching the order of 100 m per second. In such operational conditions, wind turbine blades experience air flows characterized by inflow Mach numbers of around 0.3, where the incompressibility assumption is violated, and even local supersonic flow could appear at outboard blade sections, leading to the occurrence of shocks, flow separation, and buffeting. This poses a significant challenge to the performance, loads, and fatigue-life predictions of wind turbine rotors.
Several academic investigations have mainly been directed toward analyzing the impact of high-speed flows on large rotors, identifying how aerodynamics could be affected by local variations in air density (see Vitulano et al., 2025, for references). However, it is only rather recently that De Tavernier and von Terzi (2022) pointed out the possibility of transonic flow affecting the next generation of wind turbines. They analyzed the real operational conditions of the IEA-15MW reference wind turbine (RWT) employing the OpenFAST software and compressibility corrections for the airfoil polars. Their study identified that, near the cut-out wind speed, transonic flow can occur on a portion of the blade tip. In these conditions, the blade operates at high negative incidences, while the flow is strongly accelerated on the airfoil suction side. In addition, local supersonic flow could potentially also appear in off-design conditions at lower wind speeds. These results were more recently corroborated with experiments conducted by Aditya et al. (2024, 2025) for a limited number of operating conditions and by our numerical analysis reported in Vitulano et al. (2025) over the whole range of relevant parameters.
The methodology proposed by De Tavernier and von Terzi (2022) allowed the establishment of the operating condition for transonic flow occurrence, i.e., the tip-speed ratio and pitch angle for a given wind speed or, alternatively, the inflow Mach number and angle of attack (AoA). Nonetheless, some uncertainties in their results persisted due to the application of compressibility corrections, as previously stated by Sørensen et al. (2018). Moreover, this method cannot predict the flow behavior once supersonic flow appears. Vitulano et al. (2025) confirmed the previous findings provided by De Tavernier and von Terzi (2022) using the more accurate computational fluid dynamics (CFD) approach by solving the unsteady Reynolds-averaged Navier–Stokes (URANS) equations. This study highlighted the effects of the Reynolds number in promoting transonic flow, even under normal operating conditions, and the appearance of shock waves as well. Moreover, a “transonic threshold” was found for three different Reynolds numbers, demonstrating that, for the same Mach number, the occurrence of shocks in the supersonic flow regime depends on the Reynolds number.
In the above analysis, key dynamic effects were not accounted for even though a URANS approach was taken. For example, AoA changes commonly encountered for wind turbine blades were neglected, resulting in a steady-state analysis. As described in Leishman (2002), wind turbines are affected by interacting flow phenomena that can cause the blade sections to operate in a highly unsteady flow regime. These effects can cause complex phenomena such as dynamic stall in both design and off-design conditions. Leishman (2002) stated that, under yawed wind conditions, fluctuations in air flow velocity can result in high reduced frequencies (introduced below), say above 0.1, and even higher inboard on the blade. Also, as the blade passes through the tower shadow, transient changes in the angle of attack occur, potentially resulting in effective values of the reduced frequency that exceed 0.2, corresponding to a highly unsteady regime. In the same work, Leishman outlined the different theories used to model the effects of unsteady aerodynamics on wind turbines. It is crucial to recognize that the majority of these theoretical methods rely on the assumption of linearity, which limits their validity to low inflow Mach numbers and up to moderate values of reduced frequency. However, in some cases, the assumption of linearity is very difficult to justify, and practical CFD simulations are needed.
Advances have been reported in the literature in characterizing dynamic flow conditions over airfoils. For a range of applications outside of wind energy, Corke and Flint (2015) and Gardner et al. (2023) provide reviews on dynamic stall, including compressibility and the hysteresis of lift and drag as the airfoil enters and leaves the stall regime. Giannelis et al. (2017) describe the different categories of buffeting for transonic (aviation) airfoils. For wind turbine applications, dynamic stall in the incompressible flow regime has received considerable attention in the literature, with the recent work of Chellini et al. (2024, 2025) characterizing dynamic stall for the tip airfoil of the IEA-15MW RWT. However, it remains unclear how wind turbine airfoils behave in transonic flow conditions, especially in the so-called highly unsteady regime.
The present work aims to provide insight into the characterization of the unsteady aerodynamics of the FFA-W3-211 wind turbine airfoil in transonic flow. This particular airfoil is used at the blade tip of the IEA 15MW RWT (Gaertner et al., 2020) and its successor, the 22MW RWT (Zahle et al., 2024). For this purpose, a dynamic sinusoidal pitching motion is imposed across the transonic threshold on the airfoil, considering the actual operational conditions of a large wind turbine blade section. The main motivation driving the current computational setup is the dilemma experimentalists face when trying to achieve realistic operating conditions of large modern wind turbines, as reported in Jung et al. (2022). In wind tunnels currently used for scientific research on wind energy, either the correct (non-negligible) Mach numbers can be achieved, albeit at an order of magnitude lower Reynolds number of the order of only one million (see Aditya et al., 2025), or the correct order of magnitude of the Reynolds number but at a much lower Mach number can be attained, effectively resulting in incompressible flow (see Brunner et al., 2021, for example). Even more often in wind energy research, neither the inflow Mach nor the Reynolds number match full scale. The current CFD analysis is performed by taking into account the dependence on two of the main (dimensionless) parameters characterizing the flow field, specifically the reduced frequency, in a highly unsteady regime, and the inflow Mach number, in a compressible regime. As far as the Reynolds number is concerned, it is maintained at a typical (high) value experienced by tip airfoils of real wind turbine blades.
The paper is organized as follows: in Sect. 2, the numerical methodology is described, highlighting the case studies taken into account. In Sect. 3, the main findings are presented and discussed. In particular, it is demonstrated that the introduction of a dynamic pitching motion results in the formation of a hysteresis loop, strongly dependent on the value of the reduced frequency and the inflow Mach number. Both the occurrence of transonic flow and shock-wave formation are investigated. Finally, some concluding remarks are provided in Sect. 4.
2.1 Tip airfoil operational conditions
In De Tavernier and von Terzi (2022) it was shown that operational conditions near the cut-out wind speed carry the highest risk of transonic flow for large wind turbines. Therefore, the present analysis is restricted to negative angles of attack corresponding to the aerodynamic regime near cut-out. As this may not be obvious to all readers, the reasoning is detailed in this paragraph.
The performance of a horizontal-axis wind turbine (HAWT) is governed by the aerodynamic loading along the rotor blades, which converts the kinetic energy of the wind into mechanical torque. The local contribution of each blade section to the total torque is determined by the lift and drag forces generated by each airfoil of the blade. These forces act relative to the incident flow velocity, which is given by the vector composition of the free-stream wind velocity and the tangential velocity induced by rotor rotation. The local relative wind vector significantly deviates from the free-stream wind direction due to the superposition of the rotor-induced tangential velocity and the incoming wind velocity. This results in an inflow angle at each blade section that is increasing progressively from the root toward the tip.
Blade pitch control provides an active mechanism to regulate the aerodynamic loading along a wind turbine rotor. The pitch angle θ is defined as the rotation of the blade around its longitudinal axis, shown in Fig. 1a.
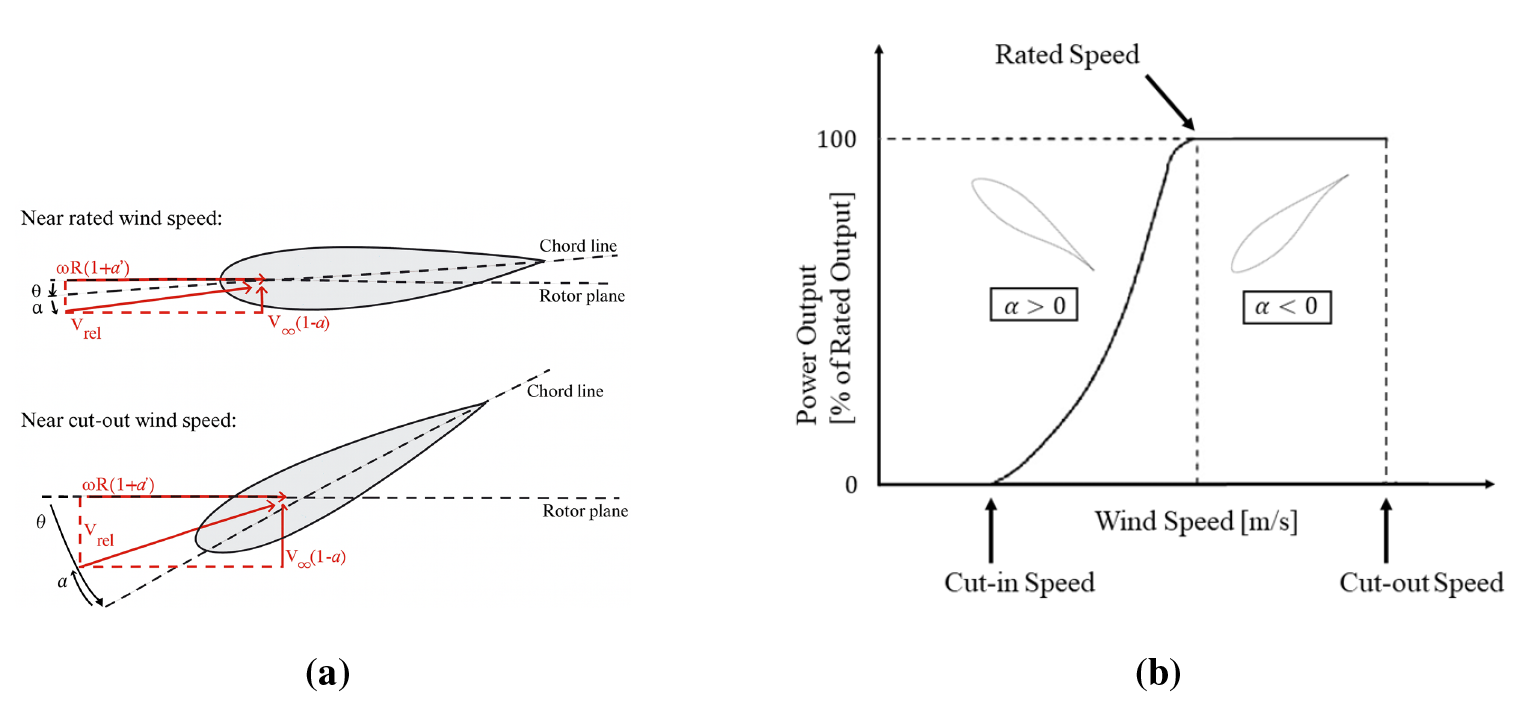
Figure 1Sketch of (a) the angle of attack distribution for a wind turbine airfoil above-rated wind speed operating points and (b) a power curve.
Figure 1b shows a sketch of a HAWT's power curve, which describes how the power output varies with the wind speed. As the wind speed reaches the cut-in velocity, the blades are set at a low or slightly negative pitch angle to achieve a positive and sufficiently high angle of attack, enabling rotor acceleration and power production onset. Between cut-in and rated wind speeds, the pitch angle is typically kept nearly constant and close to zero degrees. This configuration allows the tip section to operate at a moderately positive angle of attack, close to the airfoil’s optimal lift-to-drag ratio. As a result, aerodynamic efficiency and torque generation are maximized, allowing the turbine to follow the cubic relationship between wind speed and power output. As the wind speed exceeds the rated value, the pitch angle is progressively increased to reduce the effective angle of attack. This deliberate reduction in angle of attack limits lift and aerodynamic torque, thereby maintaining constant rated power and preventing overloading of the blades and drivetrain. At the tip, pitching out the blades will result in negative angles of attack in the above-rated conditions. De Tavernier and von Terzi (2022) considered the operational conditions along 97 % of the blade of the IEA-15MW RWT. Their analysis indicates that local Mach numbers exceeding 1 can occur at the blade tip close to the cut-out wind speed, highlighting the occurrence of transonic flow. In these operational conditions, the wind turbine tip airfoil is operating at a highly negative angle of attack.
2.2 Case study
The current analysis focuses on the numerical investigation of the unsteady aerodynamic characteristics of the FFA-W3-211 wind turbine tip airfoil used for the IEA-15MW RWT and its successor, the IEA-22MW RWT.
These two turbines were designed with input from industry to spearhead research supporting the ongoing development of next-generation wind turbine technologies. For the IEA 15MW RWT, De Tavernier and von Terzi (2022) demonstrated the possibility of the emergence of transonic flow, and our previous study in Vitulano et al. (2025) established the “transonic threshold” as a combination of the inflow Mach number and angle of attack, as reported in Fig. 2b.
The sets of computations performed in this work correspond to sinusoidal pitching motion, whose effective angle of attack is given by
where the mean geometric angle of attack is , and the oscillation amplitude is a0=5°. This way, a rotation from an incidence of −15 to −5° is produced across the transonic threshold, forcing the airfoil to enter and leave the supersonic flow region and establishing a transonic regime.
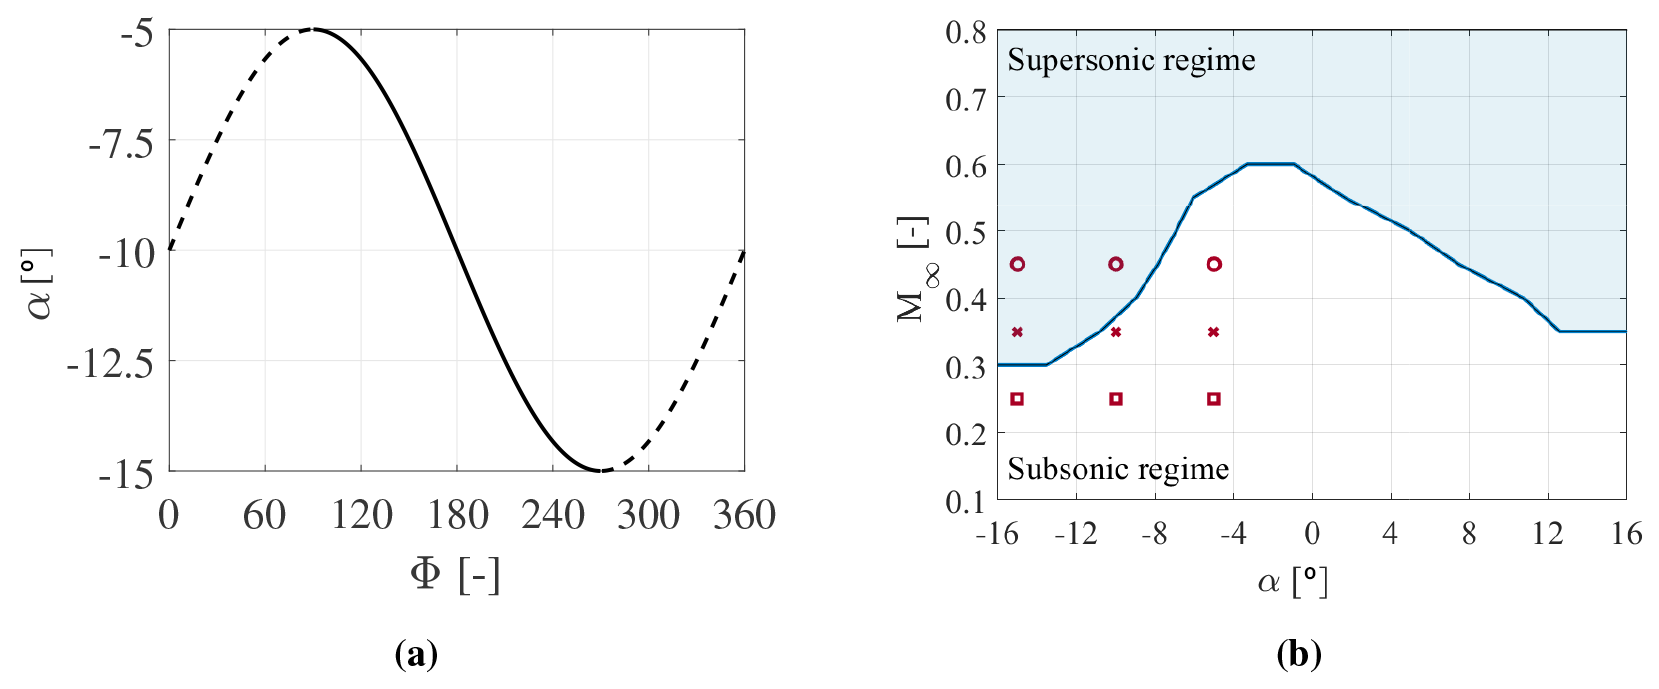
Figure 2Case studies: (a) evolution of the effective angle of attack during one period of oscillation for the pitching airfoil: downstroke (solid line) and upstroke (dashed line); (b) the border of the supersonic flow regimes at (solid blue line from Vitulano et al. (2025)), and the pitching motion mean and boundary values at M∞=0.25 (red squares), M∞=0.35 (red crosses), and M∞=0.45 (red circles).
Figure 2a shows the effective angle of attack during a harmonic oscillation period, as a function of the phase angle , with representing the characteristic timescale. Here, c is the airfoil chord, and U∞ is the free-stream velocity. In this picture, the downstroke and upstroke are highlighted, considering the downstroke as that part of the pitching motion in which the airfoil advances into the transonic flow condition, while the upstroke is the motion through which the airfoil moves out of this condition. Note that the unsteady aerodynamics for a pitching motion can involve several physical mechanisms, depending on Reynolds and inflow Mach numbers, and especially the reduced frequency , where f is the physical frequency. All the present computations are performed in the so-called highly unsteady regime, corresponding to k>0.2, according to Corke and Flint (2015).
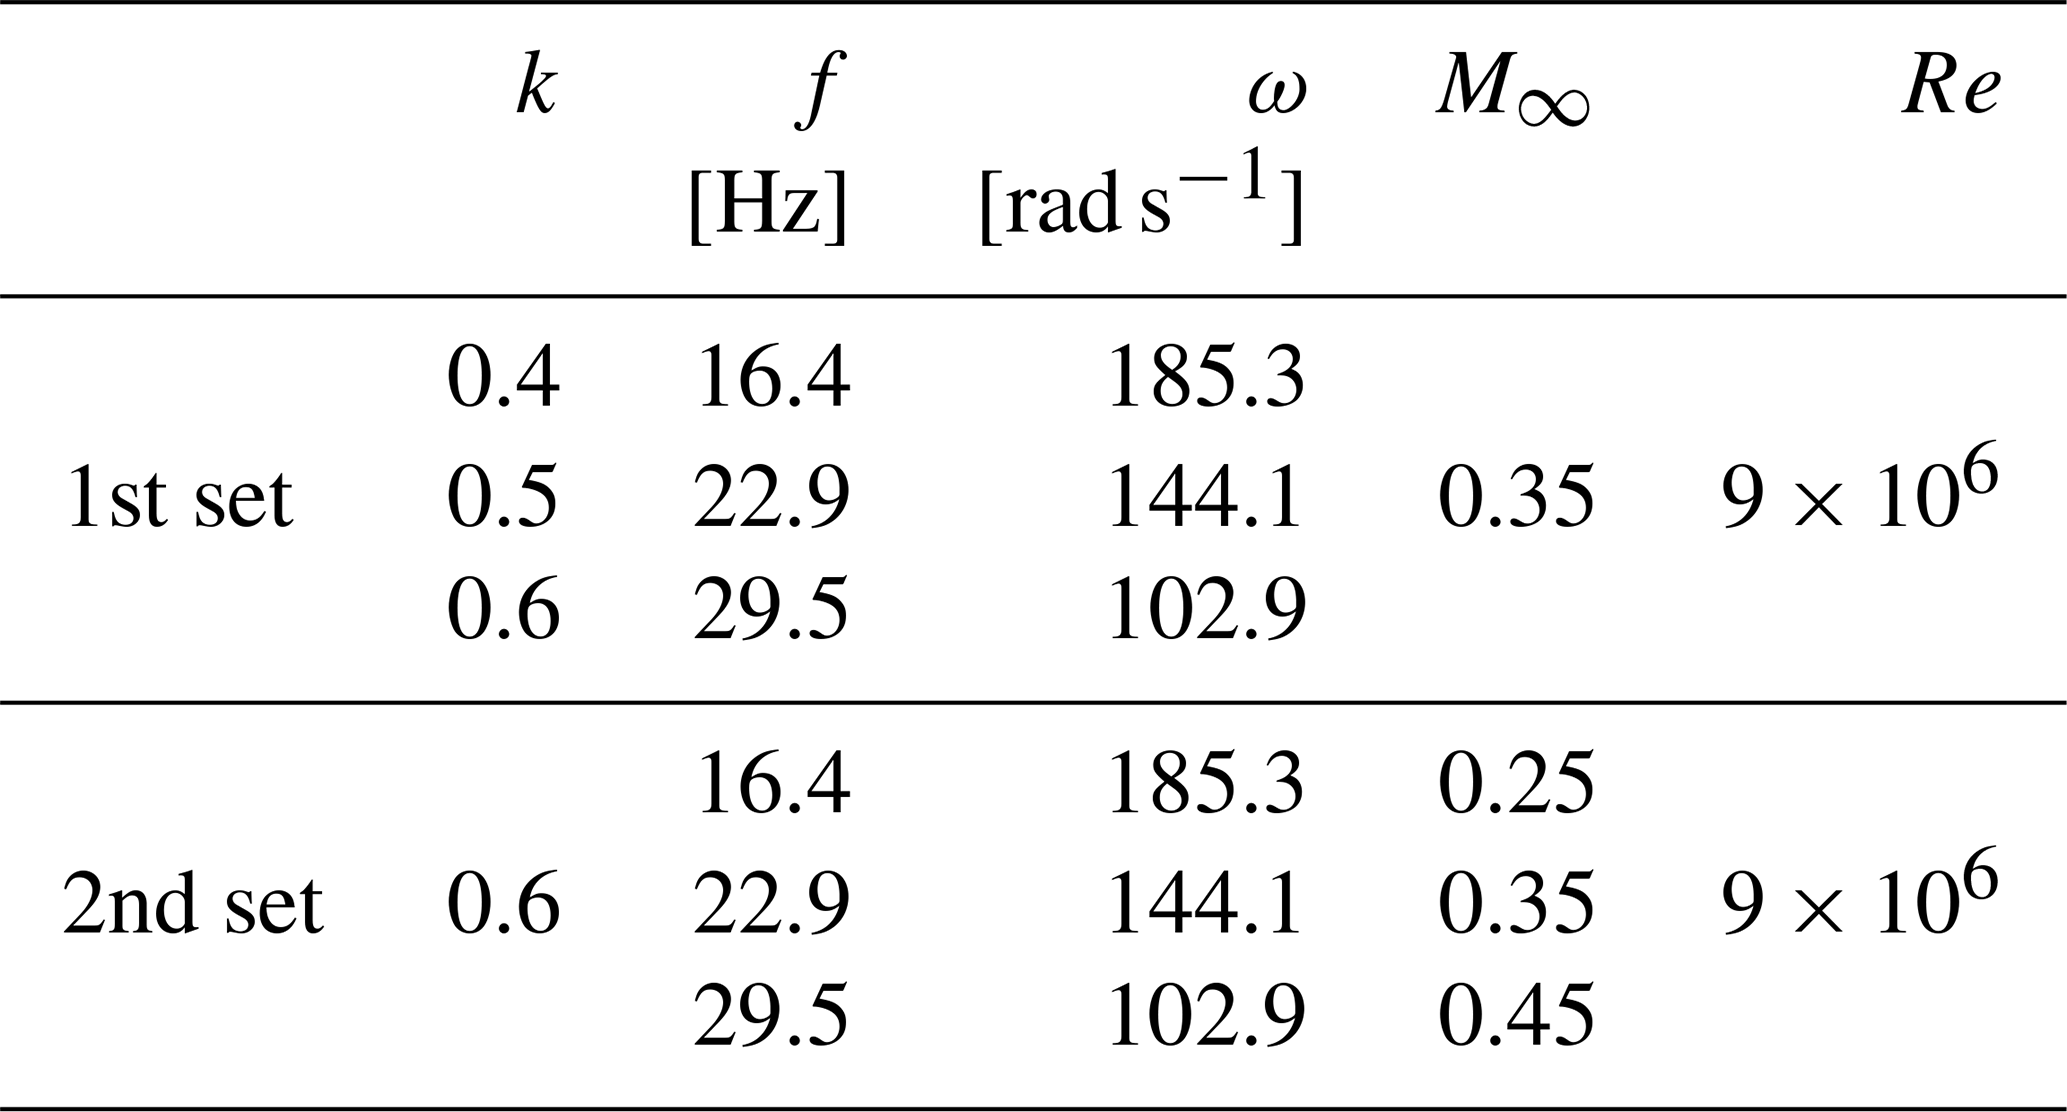
Specifically, two different sets of simulations are considered for the current CFD analysis that is conducted at a fixed Reynolds number of nine million. First, the effects of introducing a dynamic pitching motion that forces the airfoil to enter and leave the transonic regime are investigated by varying the reduced frequency while fixing the inflow Mach number. This first set of computations is used to identify the value of the reduced frequency that results in the most severe conditions for the occurrence of transonic flow at very high reduced frequencies, neglecting possibly structural issues that limit experimental analysis. Then, the effect of varying the Mach number is assessed. This would be very challenging to analyze experimentally for a case of particular industrial interest, owing to the high Reynolds number. To address this, inflow Mach numbers of 0.25 and 0.35 are selected to represent realistic wind turbine operating conditions. An additional case with an inflow Mach number of 0.45, although slightly beyond typical operational values, is also included to align more closely with experimentally achievable conditions to allow future potential comparisons with experimental data.
For the second set of simulations, the reduced frequency is kept constant while varying the inflow Mach number. The various flow conditions tested are summarized in Table 1.
Table 1Flow conditions for the two different sets of simulations.
2.3 Numerical setting
The present simulations are carried out by means of the open-source CFD software OpenFoam using the transient solver rhoPimpleFoam, which is particularly suitable for turbulent compressible flow, with the possibility of introducing mesh motion (OpenFoam Foundation, 2016). The current analysis investigates a fully turbulent flow, employing the k-ω shear stress transport (SST) model (Menter, 1994) to account for the effects of unresolved turbulent fluctuations on the resolved two-dimensional mean flow. Free-stream boundary conditions are enforced on pressure, velocity, and temperature fields, while no-slip boundary conditions are imposed at the wall, and adaptive wall-functions are used to model the near-wall region. A second-order scheme is used for discretizing the spatial variables, while the first-order implicit Euler scheme is used for the time integration, with a prescribed maximum Courant number of 0.5 to guarantee numerical stability and temporal accuracy. An extensive discussion and validation of the present computational model were provided in our previous work in Vitulano et al. (2025).
The CFD model has been adapted to the current dynamic configuration, enforcing a sinusoidal pitching motion on the airfoil. Practically, the circular computational domain is divided into two concentric subdomains corresponding to an inner and an outer circle, as shown in Fig. 3a. The outer subdomain is fixed with respect to the reference system, while the inner one, containing the airfoil, rotates around the center of the domain according to the pitching law of Eq. (1). The interface between the two subdomains, which is highlighted in red in the figure, is modeled by the cyclic arbitrary mesh interface (AMI) technique. The cyclic AMI algorithm addresses a periodic interface with a discretization that is equivalent to connecting two adjacent blocks. The two above-mentioned regions can also include non-conforming faces and can even be cyclic. This approach ensures a high convergence rate and robust simulations (Mangani et al., 2017). More details on the numerical setup are provided in Appendix A.
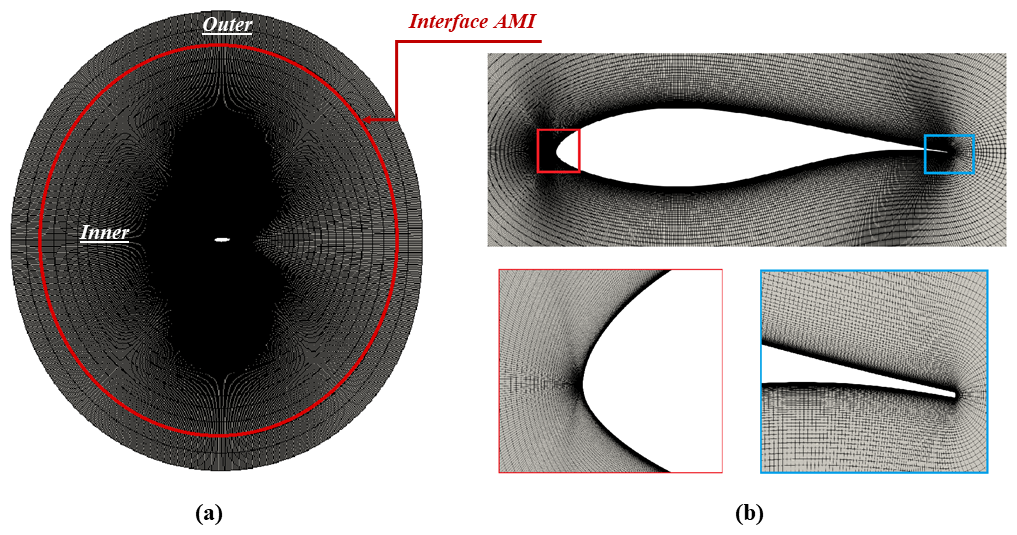
Figure 3Sketch of the computational domain (a), the FFA-W3-211 wind turbine airfoil (b) top, and details of the leading and trailing edges (b) bottom.
The transonic flow features of a wind turbine tip airfoil strongly rely on the unsteadiness and the associated change in its effective angle of attack (De Tavernier and von Terzi, 2022). This study explores the effect of forcing a wind turbine tip airfoil to enter and leave the supersonic flow regime, and whether this influences the transonic threshold and the occurrence of shock waves. To this end, the impact of a prescribed dynamic pitching motion on the transonic boundary has been assessed in a highly unsteady regime for varying reduced frequency and inflow Mach number.
3.1 Reduced frequency dependence
The present section aims to assess the effects of introducing a sinusoidal pitching motion across the transonic threshold of the FFA-W3-211 wind turbine tip airfoil by varying the reduced frequency in a highly unsteady regime.
3.1.1 Transonic flow behavior for varying frequency
In Fig. 4, the minimum pressure coefficient as a function of the effective angle of attack is shown for varying reduced frequency, namely 0.4, 0.5, and 0.6. From the Bernoulli equation along an (inviscid) streamline, it is known that an increase in velocity leads to a decrease in pressure. As a result, the maximum velocity corresponds to the minimum value of the pressure coefficient. By tracking the minimum pressure coefficient during the pitching motion, it is possible to determine the angles of attack at which transonic flow can occur. Specifically, when the minimum pressure coefficient exceeds a critical value, a possible transition to a supersonic flow regime is established. This regime is found for all incidences whose minimum pressure coefficient is above the red curve in Fig. 4. By inspection of this figure, where the critical level is explicitly indicated, it is possible to discern that the range of angles of attack, for which local supersonic flow can occur, increases with the reduced frequency. Figure 4 also reveals the appearance of a pronounced hysteresis loop, strongly dependent on the reduced frequency, which also appears in the variation of the aerodynamic loads with the angles of attack during the pitching motion, shown in Fig. 5. Notably, for the downstroke phase defined in the previous section, transonic flow occurs at for k=0.4, for k=0.5, and for k=0.6. Meanwhile, in the static case, the critical angle of attack is equal to −10.8°. A similar delay is also observed when the airfoil is in the upstroke, with the transonic flow disappearing at for k=0.4, for k=0.5, and for k=0.6.
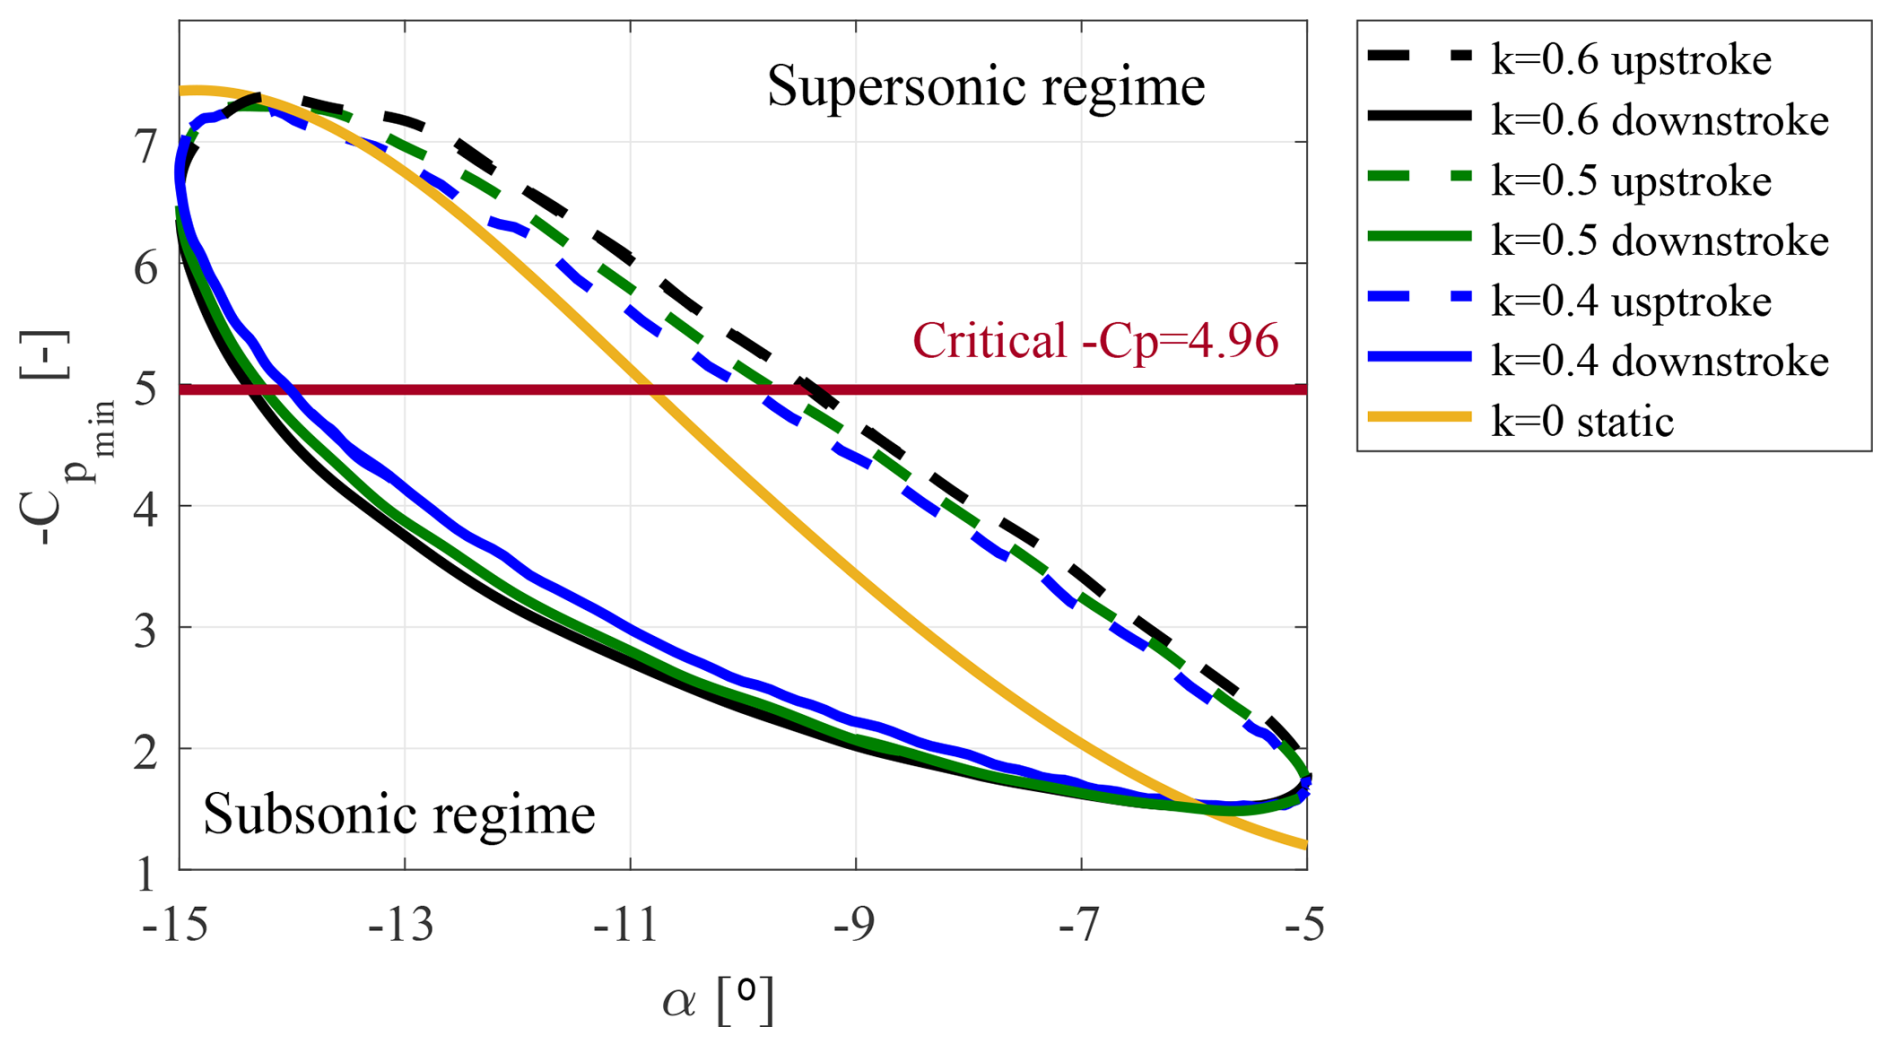
Figure 4Minimum pressure coefficient as a function of the effective angle of attack for k=0.4 (blue lines), k=0.5 (green lines), k=0.6 (black lines), and k=0 (yellow line): downstroke (solid lines) and upstroke (dashed lines); M∞=0.35 and .
Practically, this numerical analysis demonstrates that increasing the reduced frequency leads to a spread of incidences for which the transonic flow regime is established.
Figure 5a and b show the lift and drag coefficients, respectively, as a function of the effective angle of attack during the pitching motion of the airfoil. A moderate hysteresis loop appears for the lift, while a more pronounced hysteresis is established for the drag. Furthermore, the width of the hysteresis loop is strongly correlated to the value of the reduced frequency, so that higher reduced frequencies correspond to a larger variability of the aerodynamic loads acting on the wind turbine section. In particular, an increase in this parameter results in an expansion of the loop for both lift and drag coefficients, as well as an increase in the risk of establishing a local supersonic flow. In addition, the presence of the hysteresis loop observed in the pressure, lift, and drag coefficients illustrates that defining any threshold with a single value may be misleading and certainly is prone to high uncertainties, since the existence of a hysteresis loop rather involves the definition of a range of values.
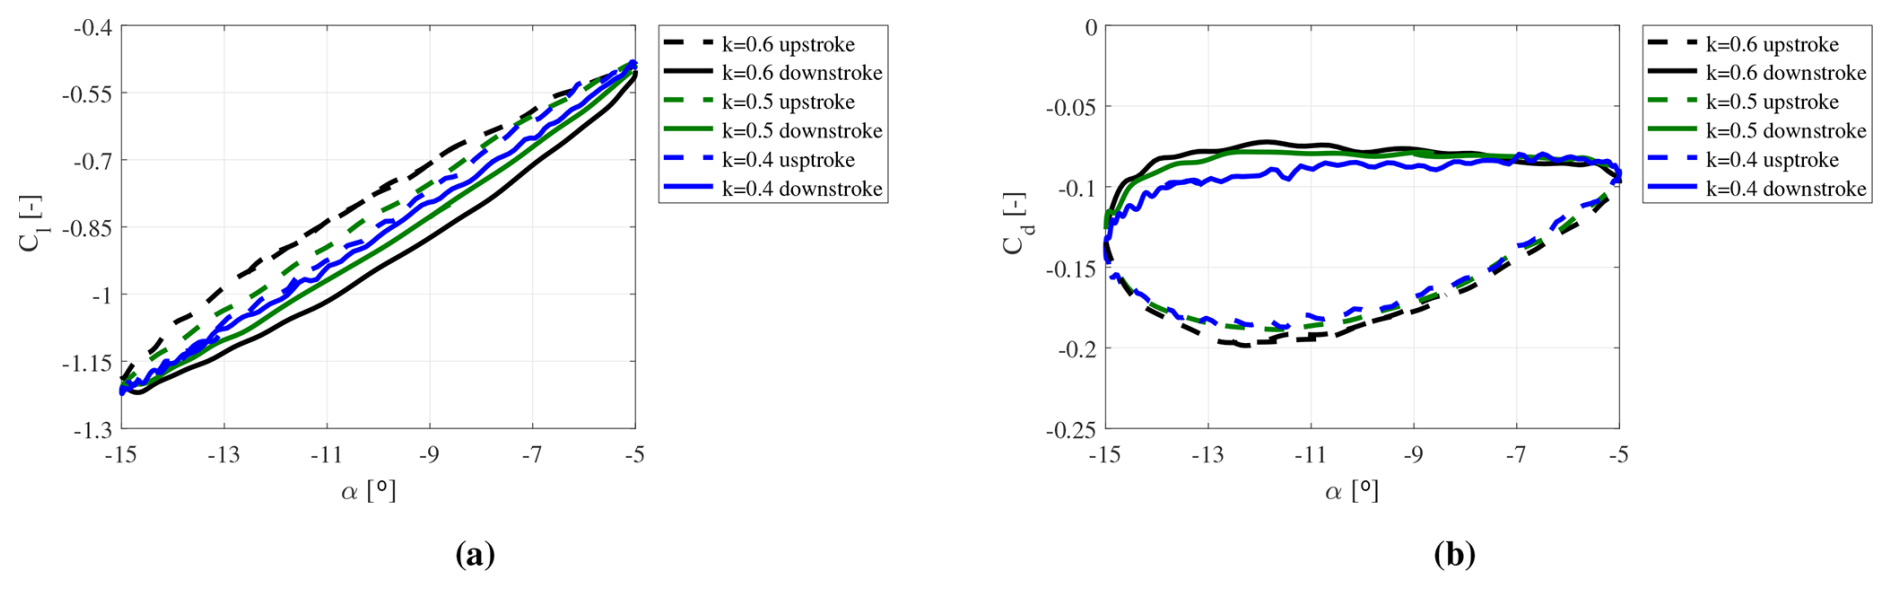
Figure 5(a) Lift coefficient as a function of the effective angle of attack for k=0.4 (blue line), k=0.5 (green line), and k=0.6 (black line); M∞=0.35 and : downstroke (solid line) and upstroke (dashed line). (b) Drag coefficient as a function of the effective angle of attack for k=0.4 (blue line), k=0.5 (green line), and k=0.6 (black line); M∞=0.35 and : downstroke (solid line) and upstroke (dashed line).
3.1.2 Shock wave occurrence for varying frequency
Following Vitulano et al. (2025), it should be emphasized that establishing a local supersonic flow regime does not necessarily imply the occurrence of (visible) shock waves, as also confirmed by experimental findings in Aditya et al. (2024, 2025). Therefore, these two physical phenomena must be analyzed separately. The occurrence of a transonic flow can simply be identified when the local Mach number exceeds unity, indicating that the flow becomes locally supersonic. For the identification of shock waves, this is not sufficient. Here, we follow the method proposed by Lovely and Hsimes (1999) to identify the presence of (visible) shock waves, which relies on the evaluation of the normal Mach number. In this approach, we make use of the flow properties before and after an oblique shock that follow the normal shock relations in the normal direction. The normal direction of the shock is perpendicular to the local pressure gradient, which allows the normal Mach number to be derived from the pressure distribution. The iso-surface of the normal Mach number equal to unity represents the shock wave surface. The mathematical formulation is
where a stands for the local speed of sound.
Figure 6 shows the maximum normal Mach number () as a function of the effective angle of attack during the pitching motion for various reduced frequencies and an inflow Mach number of 0.35. Note that for this Mach number, our static analysis reported in Vitulano et al. (2025) led to a supersonic flow without shocks. The presence of a shock wave can be detected when the normal Mach number exceeds the value of 1. Therefore, Fig. 6 illustrates that, for dynamic conditions, shocks could appear at this lower Mach number. Here, this is the case for all angles of attack for which the maximum normal Mach number is above the red line in the graph.
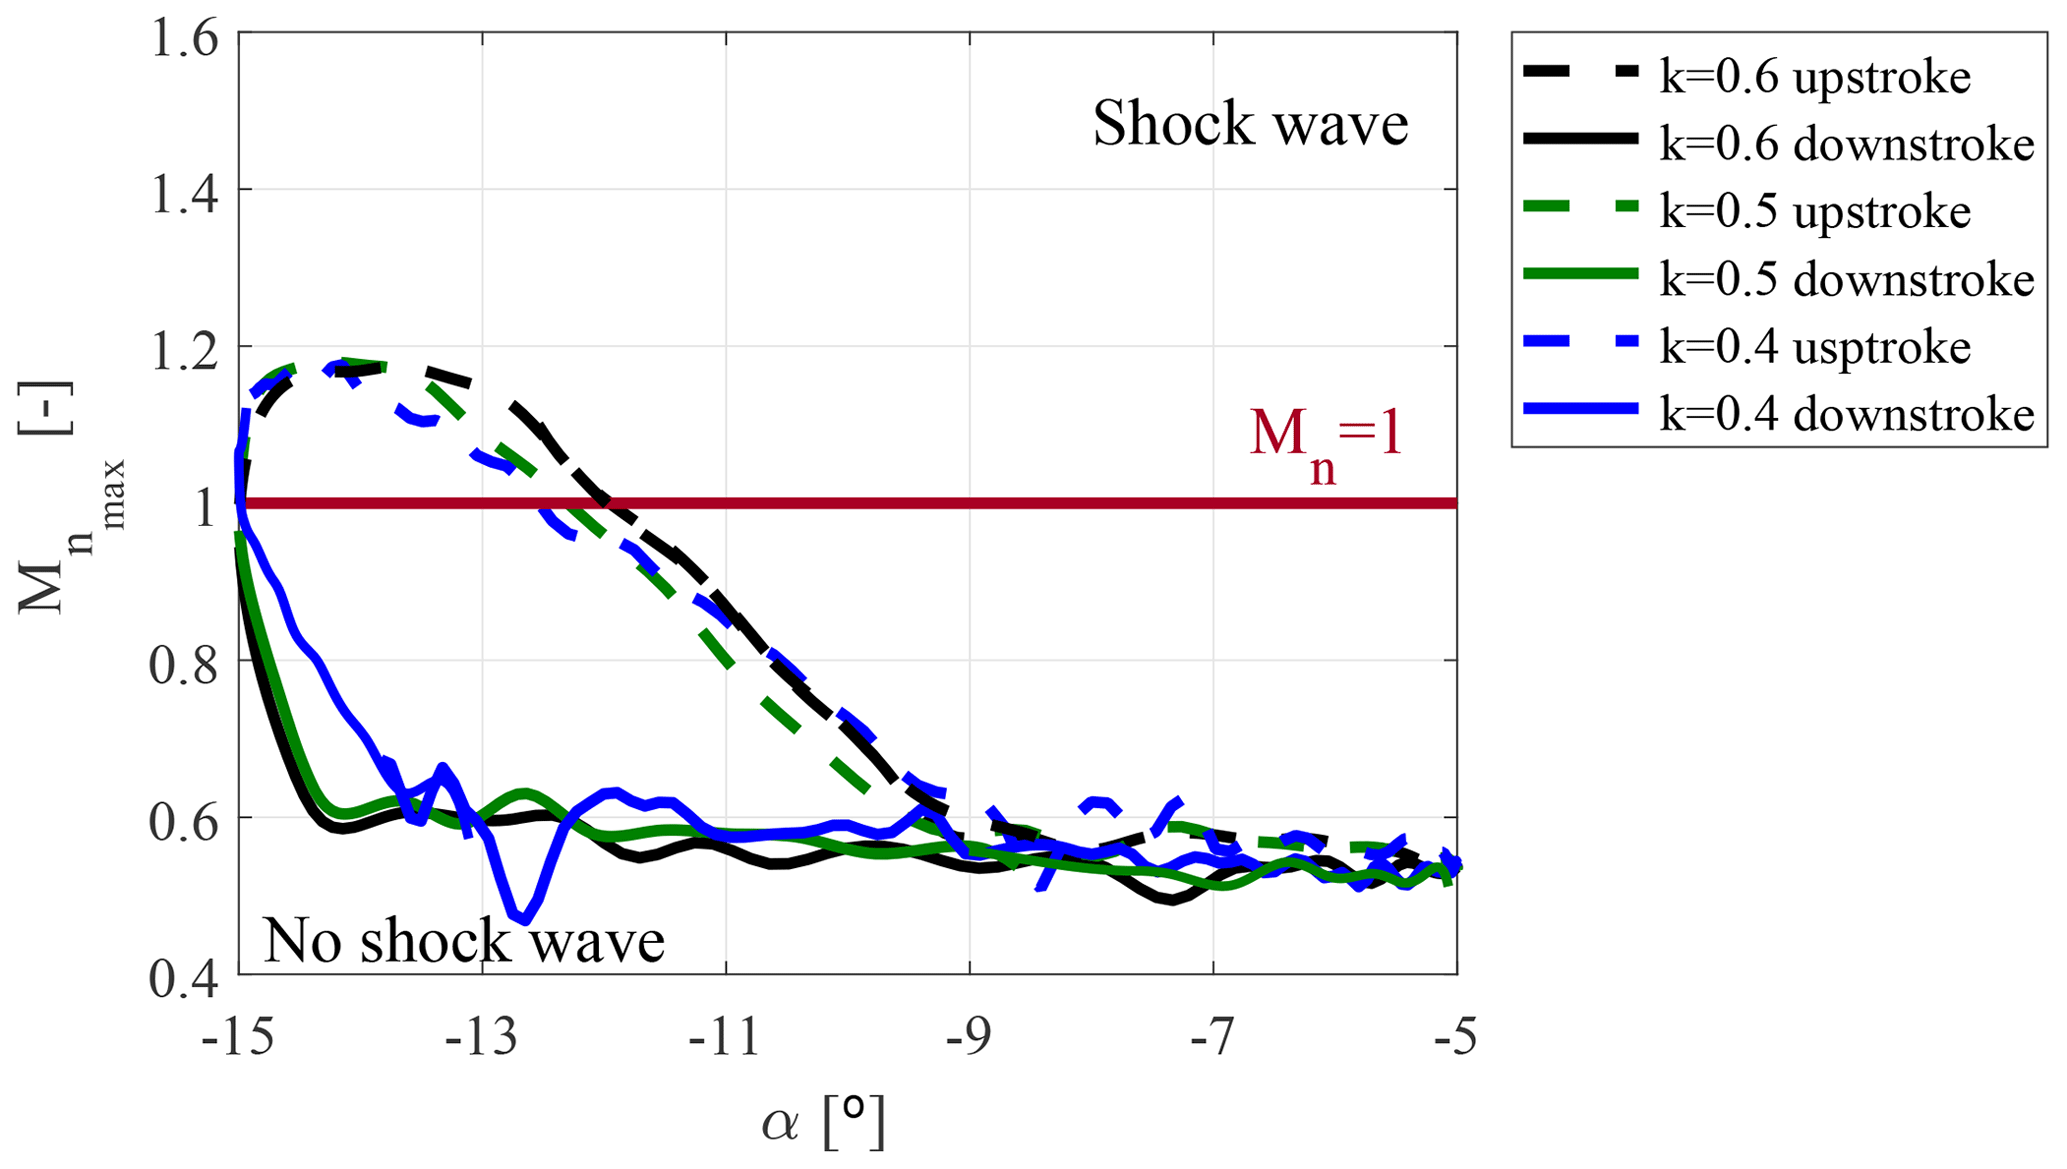
Figure 6Maximum normal Mach number coefficient as a function of the effective angle of attack for k=0.4 (blue line), k=0.5 (green line), and k=0.6 (black line); M∞=0.35 and : downstroke (solid line) and upstroke (dashed line).
A dependence on the reduced frequency is demonstrated. During the downstroke, shock waves are consistently observed when the pitching angle reaches . On the other hand, when the airfoil is moving upstroke, an increase in reduced frequency results in a delayed dissipation of shock waves. In particular, shock waves disappear at for k=0.4, for k=0.5, and for k=0.6. As a result, higher reduced frequencies are associated with a wider range of effective angles where shock waves occur during the pitching motion.
Figure 7 shows instantaneous (numerical) Schlieren images at different reduced frequencies for an angle of attack of −12°, which is the incidence at which a shock wave should appear for the three frequencies analyzed. A discontinuity in the density gradient is shown near the leading edge for the set of reduced frequencies considered in this work, suggesting that compressibility effects are non-negligible. However, this discontinuity is quite faint, and no significant differences are observed for varying frequency, while, in contrast, the trend of the maximum local normal Mach number reveals a delay in the dissipation of the shock waves as the reduced frequency increases. This suggests that further analyses, conducted at a higher level of fidelity, will be needed.
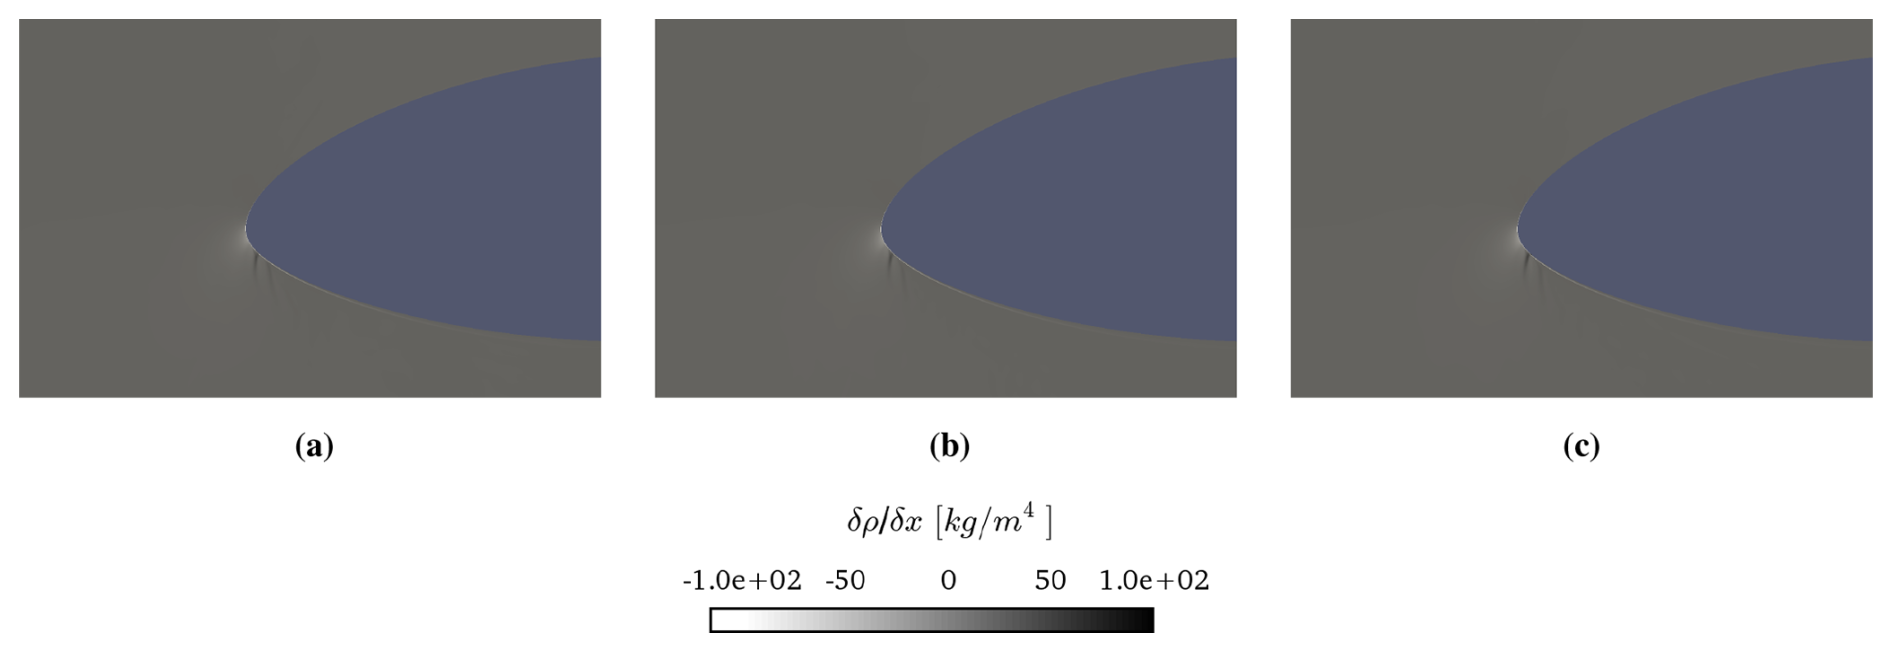
Figure 7Instantaneous (numerical) Schlieren images at (a) k=0, (b) k=0.5 in the downstroke, and (c) k=0.5 in the upstroke, with , M∞=0.35, and .
3.2 Inflow Mach number dependence
The present section aims to assess the effects of varying the inflow Mach number on the transonic flow boundary of the FFA-W3-211 wind turbine tip airfoil, while keeping the Reynolds number at 9 million and the reduced frequency at a value of 0.6, i.e., in the highly unsteady regime. The fluid viscosity is adjusted to preserve a constant Reynolds number. In this section, three inflow Mach numbers are investigated, specifically, the values of 0.25 and 0.35 are chosen as representative of realistic operating conditions for this class of turbines. Additionally, an inflow Mach number equal to 0.45, which lies slightly above the typical operational range, is included to facilitate future comparisons between the present numerical results and future experimental data.
3.2.1 Transonic flow behavior for varying Mach number
Based on the previous discussion, higher frequencies lead to an increased risk for both the onset of transonic flow and the formation of shock waves. Therefore, the following CFD computations are conducted considering the constant reduced frequency of 0.6.
Figure 8 shows the predicted minimum pressure coefficient as a function of the effective angle of attack during the pitching motion for three different inflow Mach numbers that are M∞=0.25 (a), 0.35 (b), and 0.45 (c). As mentioned in the previous section, a transonic regime is established for all incidences above the red curve in the picture. The formation of a hysteresis loop is confirmed for all three inflow Mach numbers. Note that the critical Cp is not explicitly shown in Fig. 8a, being outside of the represented range. For a Mach number of 0.25, the value of the minimum pressure coefficient remains well below the critical level that is −10.25, which corresponds to the absence of transonic flow. Considering a Mach number of 0.35, instead, a local supersonic flow appears when the effective angle of attack exceeds a certain incidence. In particular, a delay in both upstroke and downstroke is observed, compared to the static case where a transonic flow occurs up to an incidence of −10.8° (Vitulano et al., 2025). Practically, this leads to an increase in the range of incidences for which transonic flow occurs, as shown in Fig. 8. Finally, a local supersonic flow also appears for M∞=0.45. Looking at Fig. 8c, a plateau for the minimum pressure coefficient appears in the upstroke phase, associated with α, approximately ranging from −15 to −7.5°; beyond this threshold, a sudden change in the slope of is observed. This behavior arises as a consequence of the onset stall, which occurs at these incidence and inflow Mach numbers, as shown in Fig. 9a.
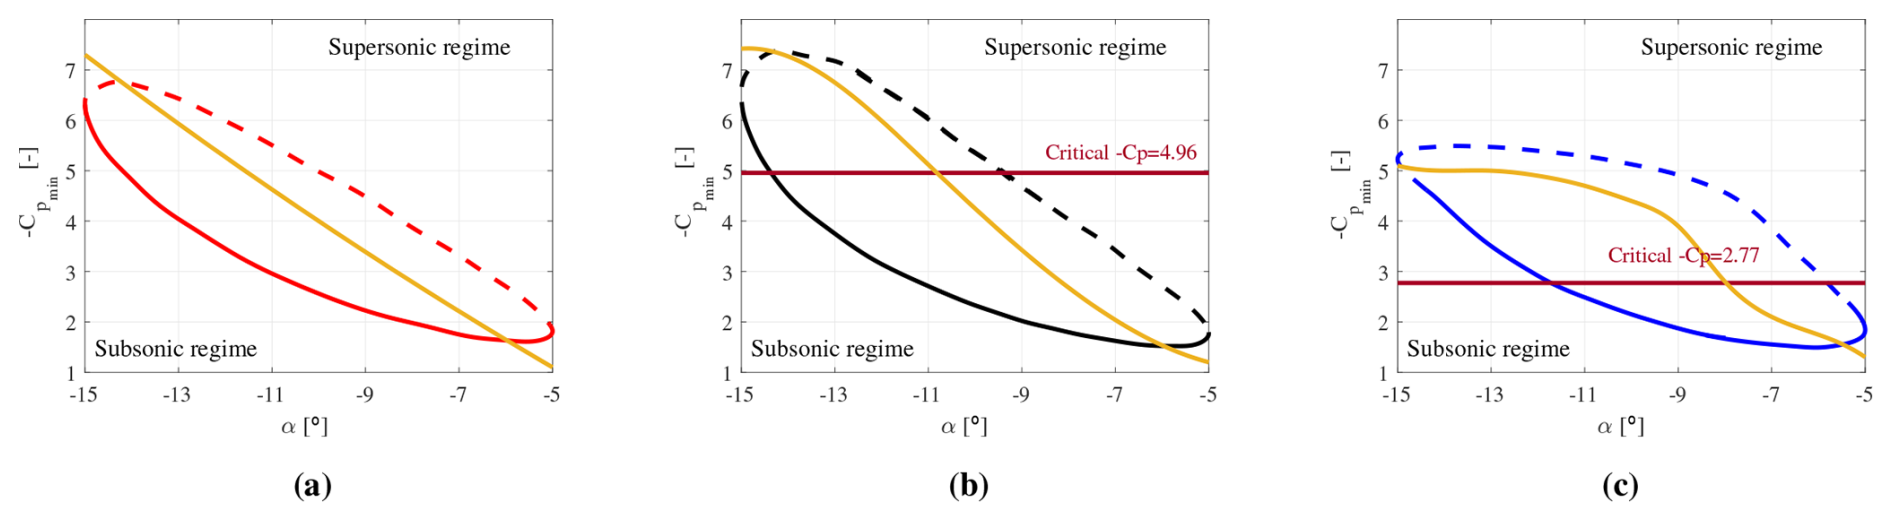
Figure 8Minimum pressure coefficient as a function of the effective angle of attack for M∞=0.25 (a), 0.35 (b), and 0.45 (c); k=0.6 and : downstroke (solid line) and upstroke (dashed line). The yellow line corresponds to the fixed airfoil.
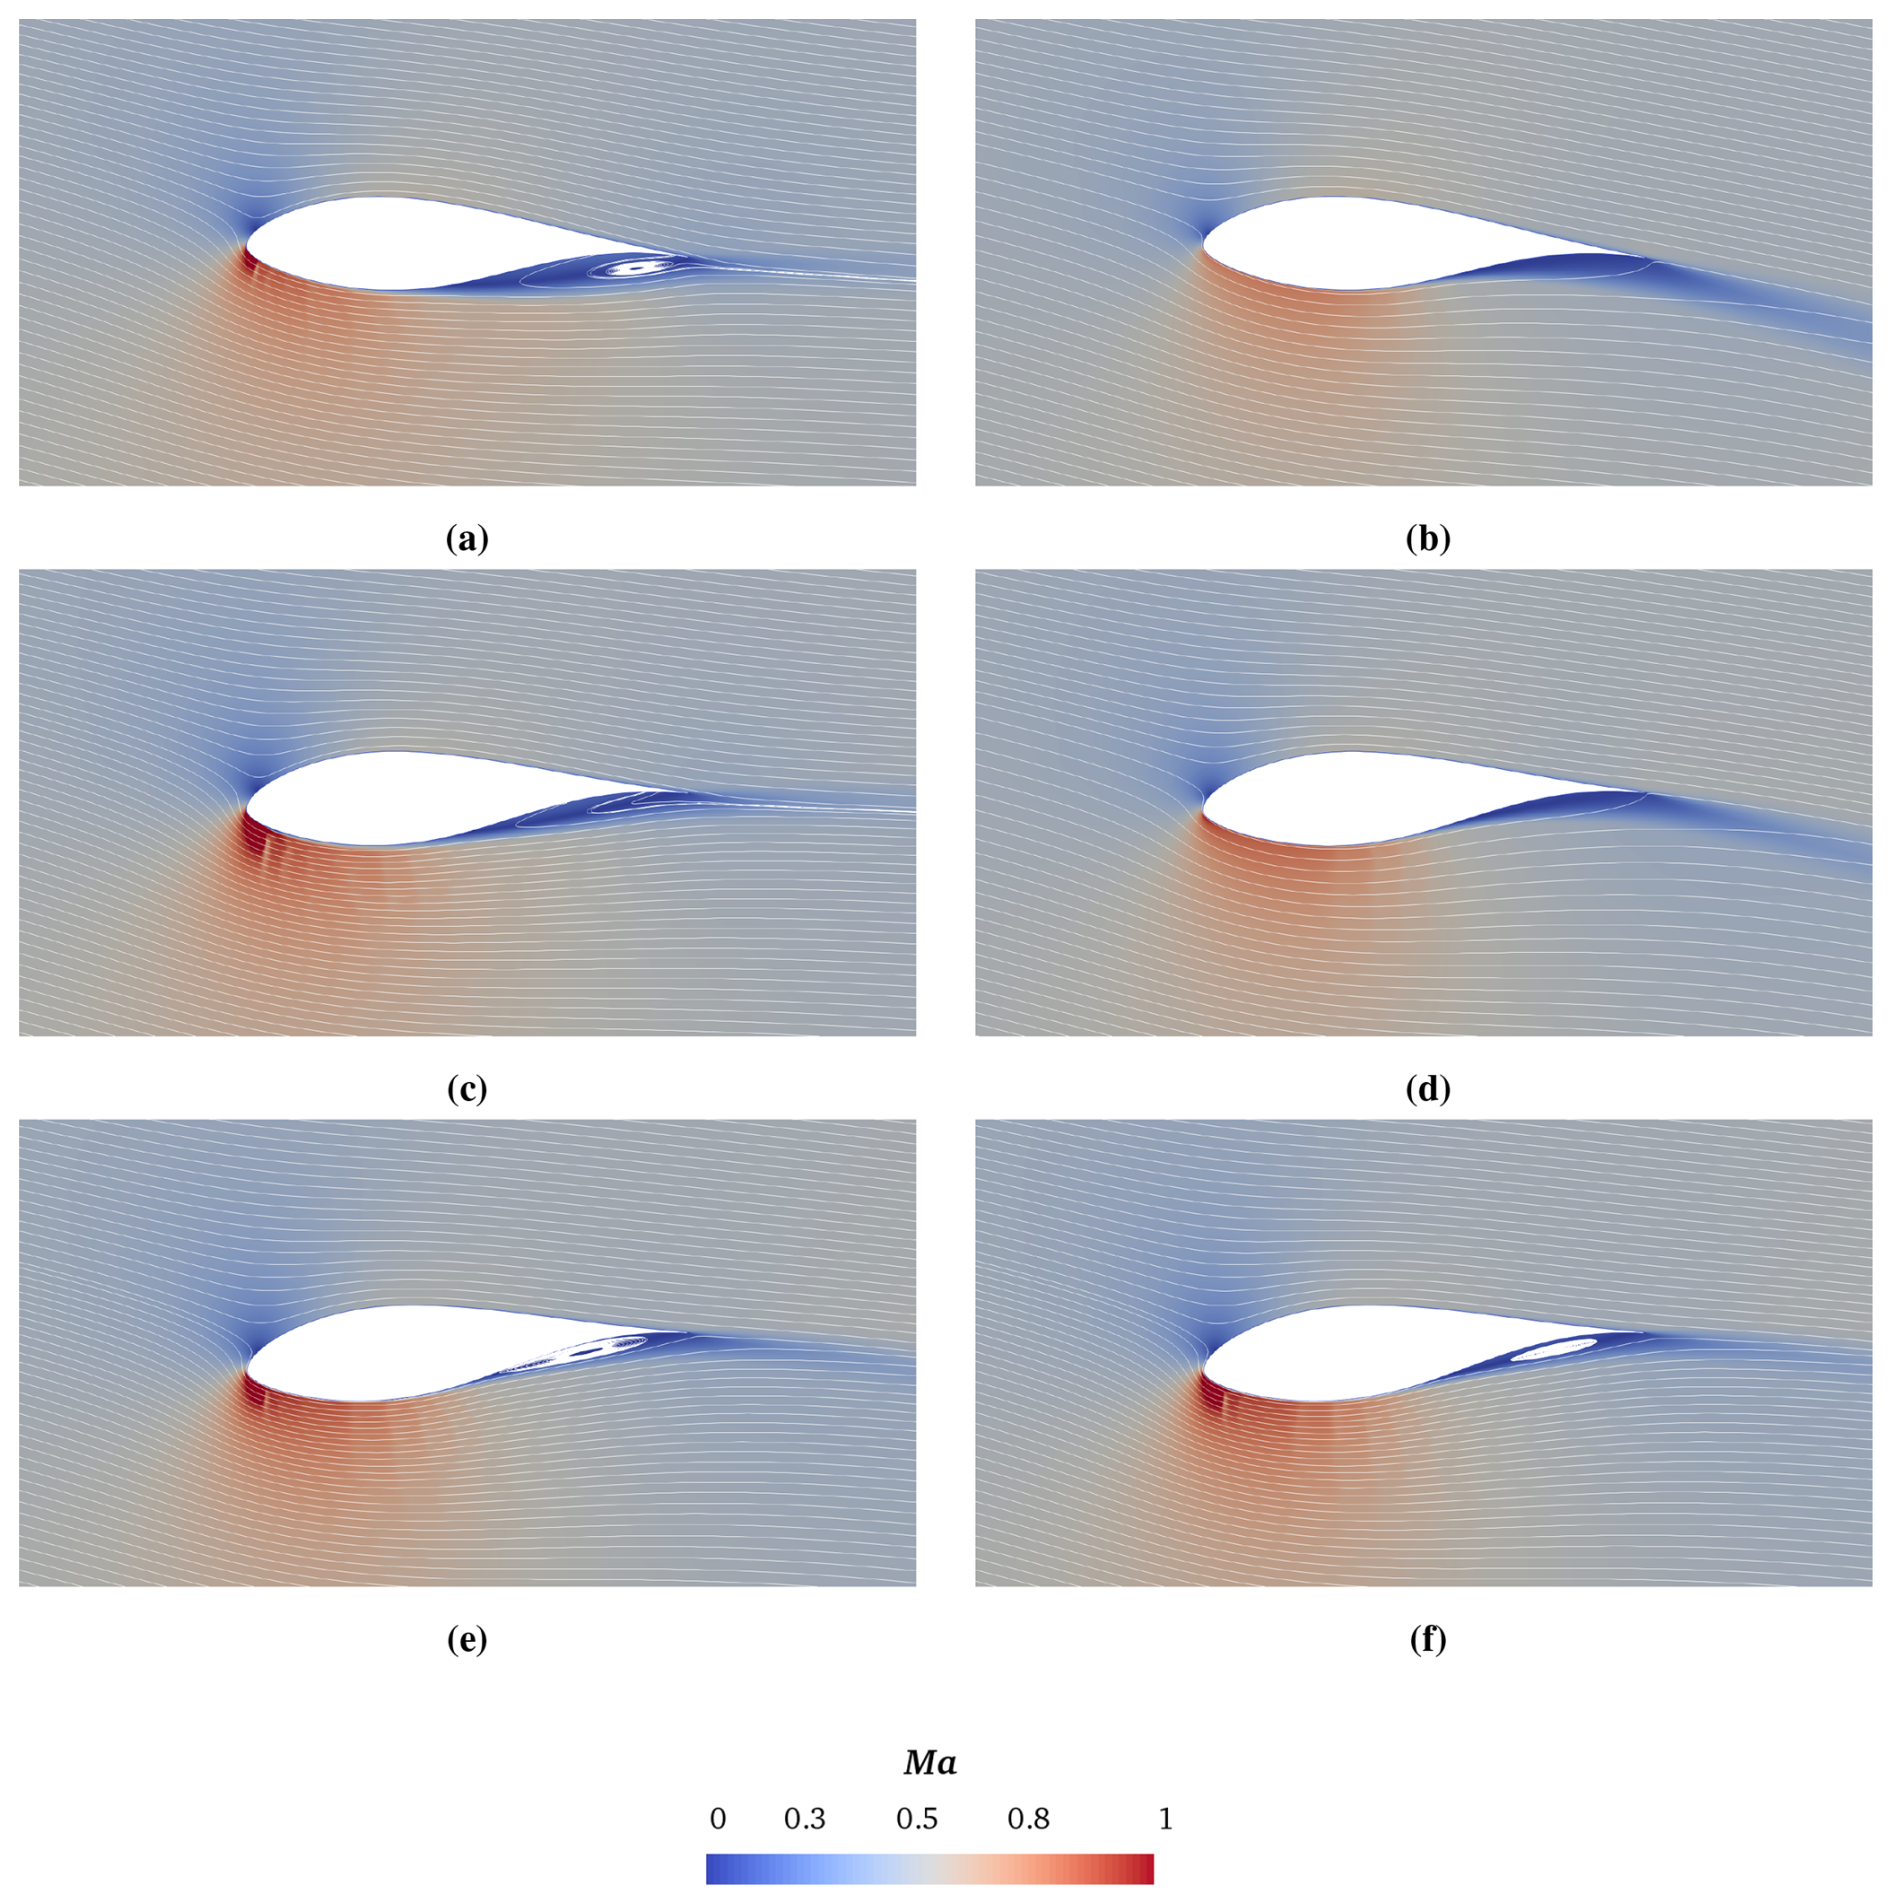
Figure 9Instantaneous streamlines and contour maps of the local Mach number; , k=0.6, and M∞=0.45: (a) downstroke, (b) upstroke, (c) downstroke, (d) upstroke, (e) downstroke, and (f) upstroke.
Flow separation arises during the downstroke at an angle of attack of approximately , and the flow remains separated until an incidence of . Reattachment occurs when the airfoil is pitching up. This behavior is indicative of the onset of a dynamic stall. The occurrence of flow separation is further confirmed by examining the distribution of the skin friction coefficient shown in Fig. 10. As the incidence increases from to 15°, the Cf profiles exhibit a minor upstream shift of the separation onset, with the skin friction minima becoming slightly more pronounced at higher angles of attack. Notably, at equivalent instantaneous incidences, the distributions for the upstroke and downstroke phases appear to be largely overlapping, indicating a negligible aerodynamic hysteresis in terms of boundary layer separation for the conditions investigated. This behavior might be partly attributed to the inherent limitations of the URANS turbulence modeling, which may provide a conservative estimation of the aerodynamic hysteresis and the transient response of the boundary layer under unsteady conditions. In addition, discontinuities in the skin friction coefficient are observed in flow configurations exhibiting transonic behavior, highlighting the complex nature of the flow in these regimes.
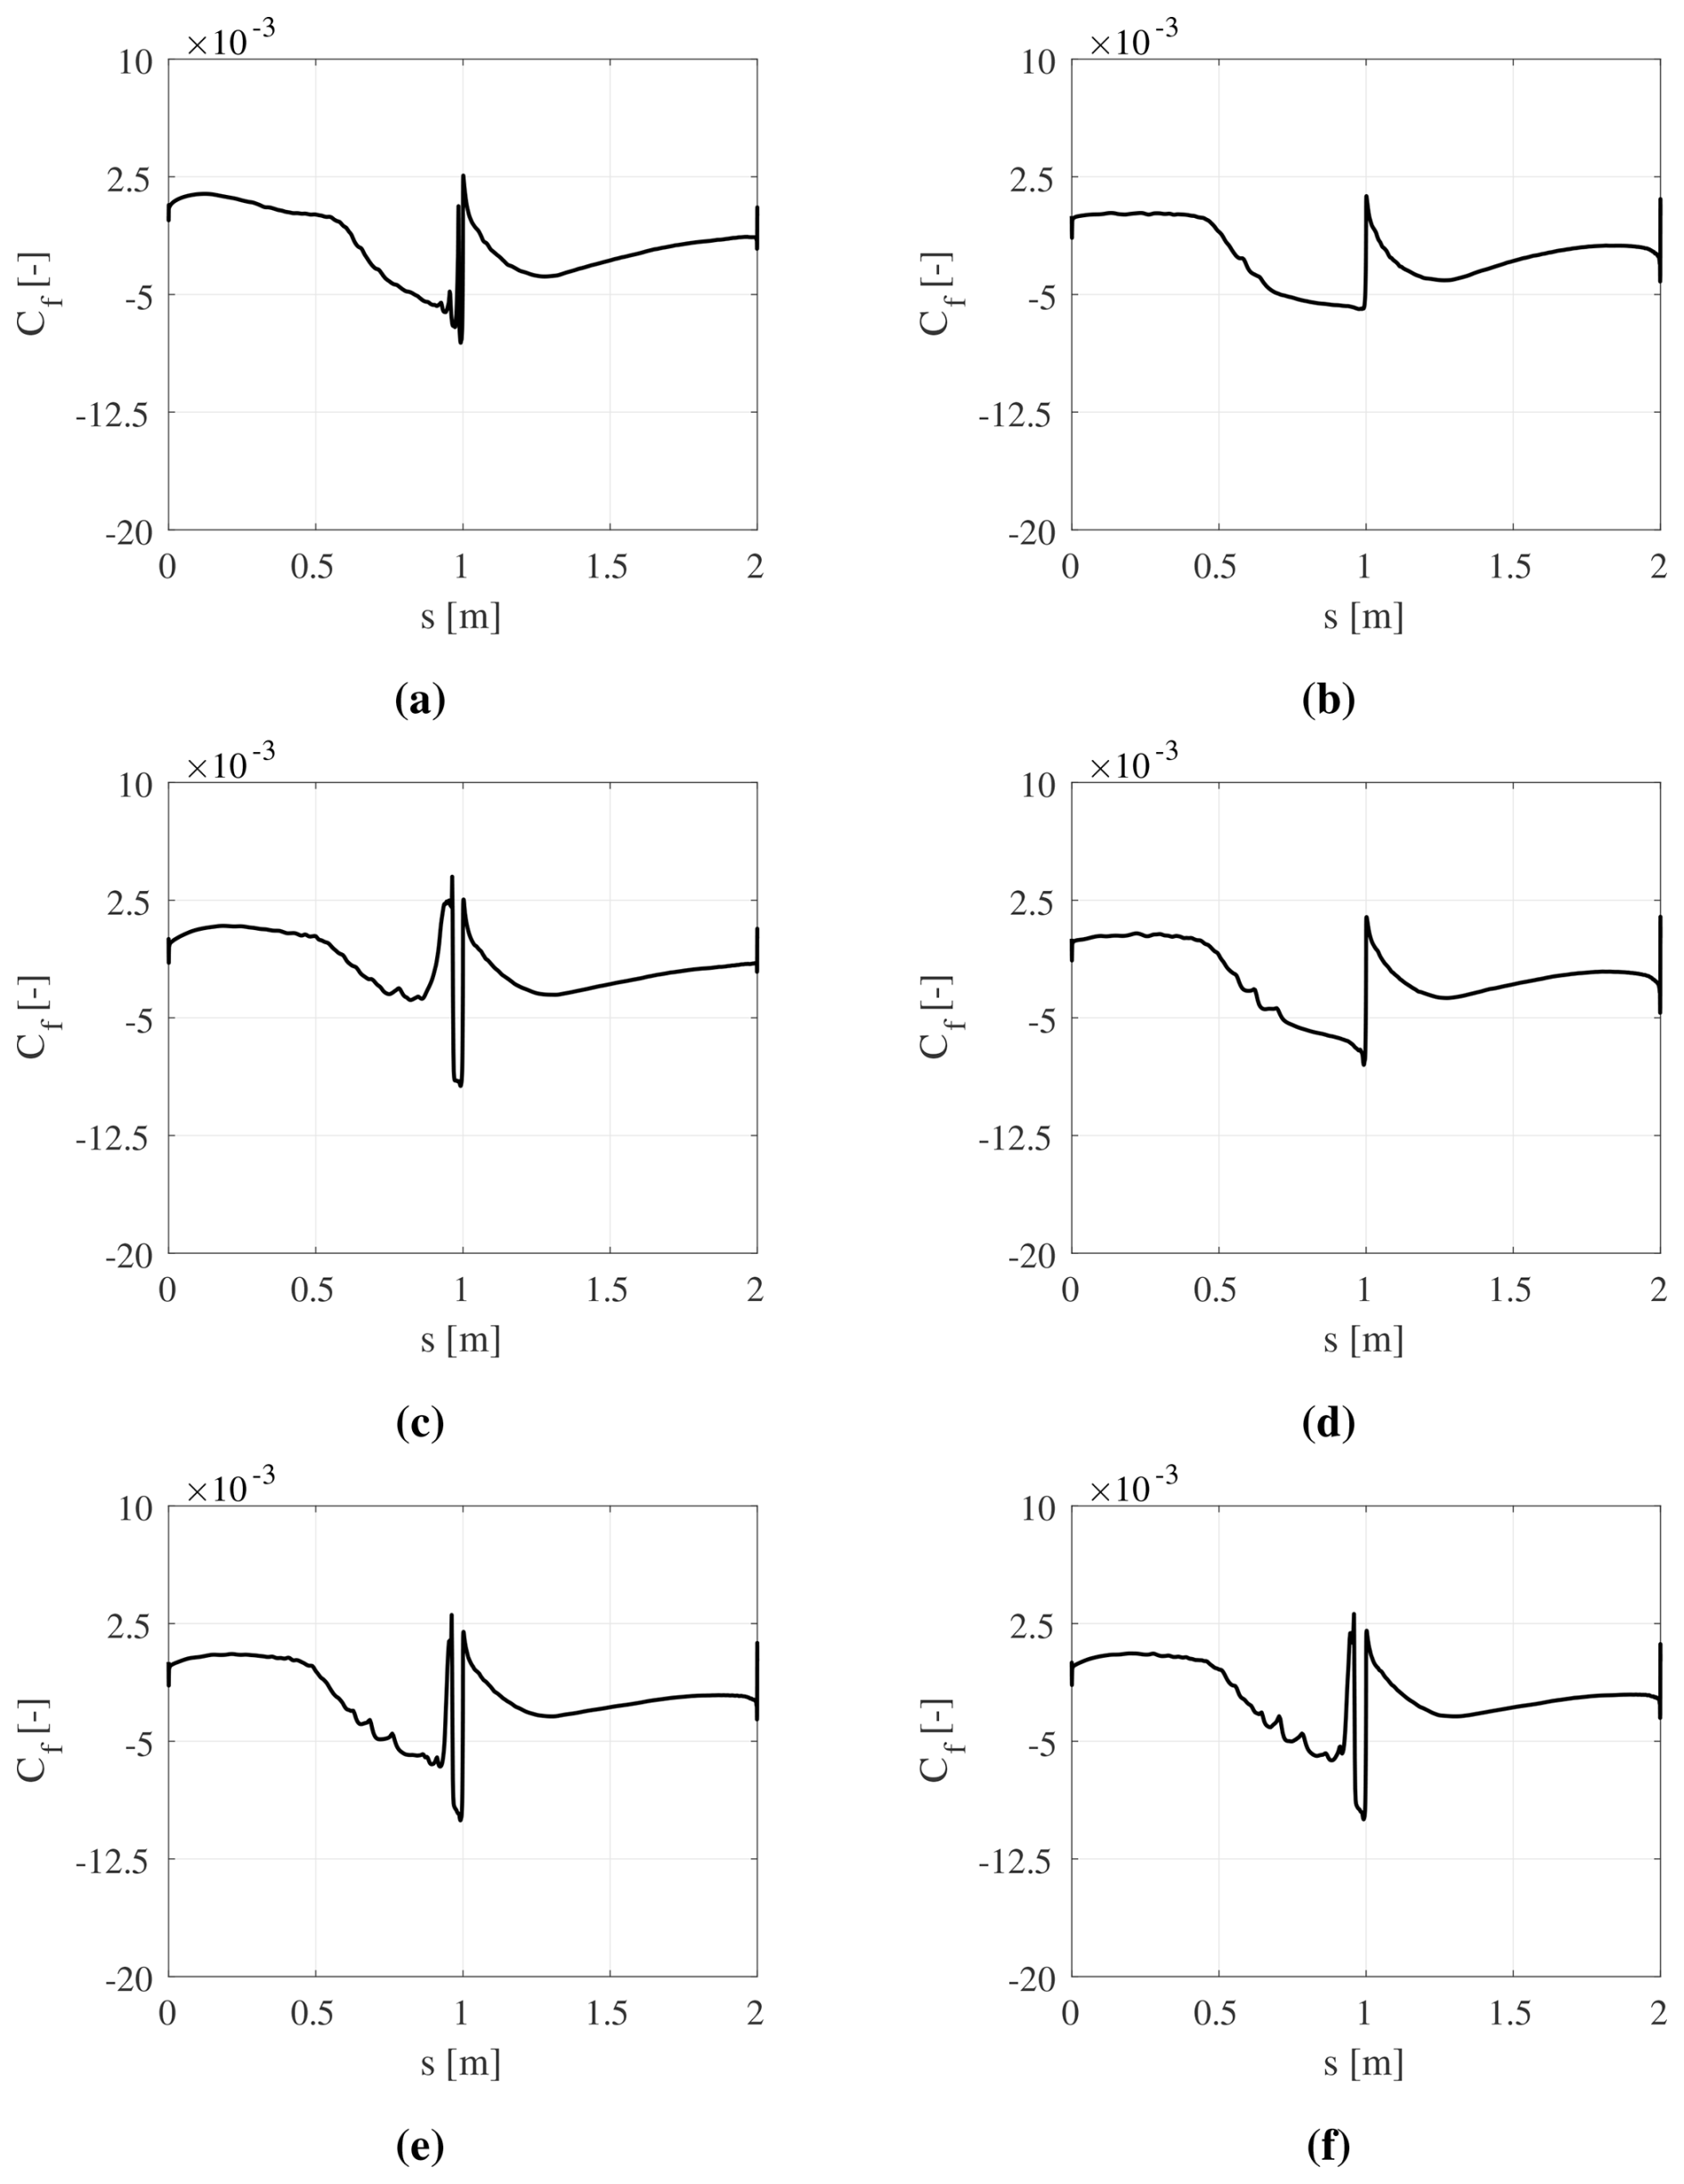
Figure 10Instantaneous skin friction coefficient distribution; , k=0.6, and M∞=0.45: (a) downstroke, (b) upstroke, (c) downstroke, (d) upstroke, (e) downstroke, and (f) upstroke.
It is also crucial to observe an increase in the absolute value of the minimum pressure coefficient, going from M∞=0.25 to 0.35, with a subsequent decrease in this quantity at M∞=0.45, resulting from the strong compressibility effects experienced by the airfoil in high-speed flow. Moreover, considering the incidences for which the local exceeds the critical value (that is, points on the curves positioned above the red line in Fig. 8c), it becomes visible that the unsteady flow field with an inflow Mach number of 0.45 is characterized by a wider range of configurations (in terms of effective angles of attack) for which a local supersonic flow is established. In fact, Fig. 8c shows a strong delay in the occurrence of transonic flow during the downstroke to , while for the static case, a local supersonic flow appears already at . A delay is also shown for the upstroke phase, for which the airfoil moves out of the transonic regime for an incidence of . Therefore, the present investigation reveals that an increase in the inflow Mach number, for a pitching dynamic motion, leads to an increase in the number of incidences for which transonic flow occurs.
Figure 11a shows the hysteresis loop of the lift coefficient for varying inflow Mach number. For M∞ up to 0.35, no substantial changes are observed in terms of aerodynamic load, while a sharp decrease in the amplitude of the hysteresis cycle is observed at M∞=0.45, which is consistent with the presence of a plateau in the pressure distribution, as previously discussed. Furthermore, during the downstroke, the lift coefficient increases in magnitude with a constant rate, pitching from an incidence of up to . In contrast, during the upstroke, the coefficient Cl decreases almost linearly until . Beyond this point, the slope of the curve is increasing considerably, corroborating the hypothesis of the presence of an onset stall at this angle of attack. By inspection of Fig. 11b, the presence of a hysteresis loop for the aerodynamic drag coefficient is confirmed, with an amplitude that appears unaffected by the inflow Mach number. However, Cd decreases in absolute value with M∞.
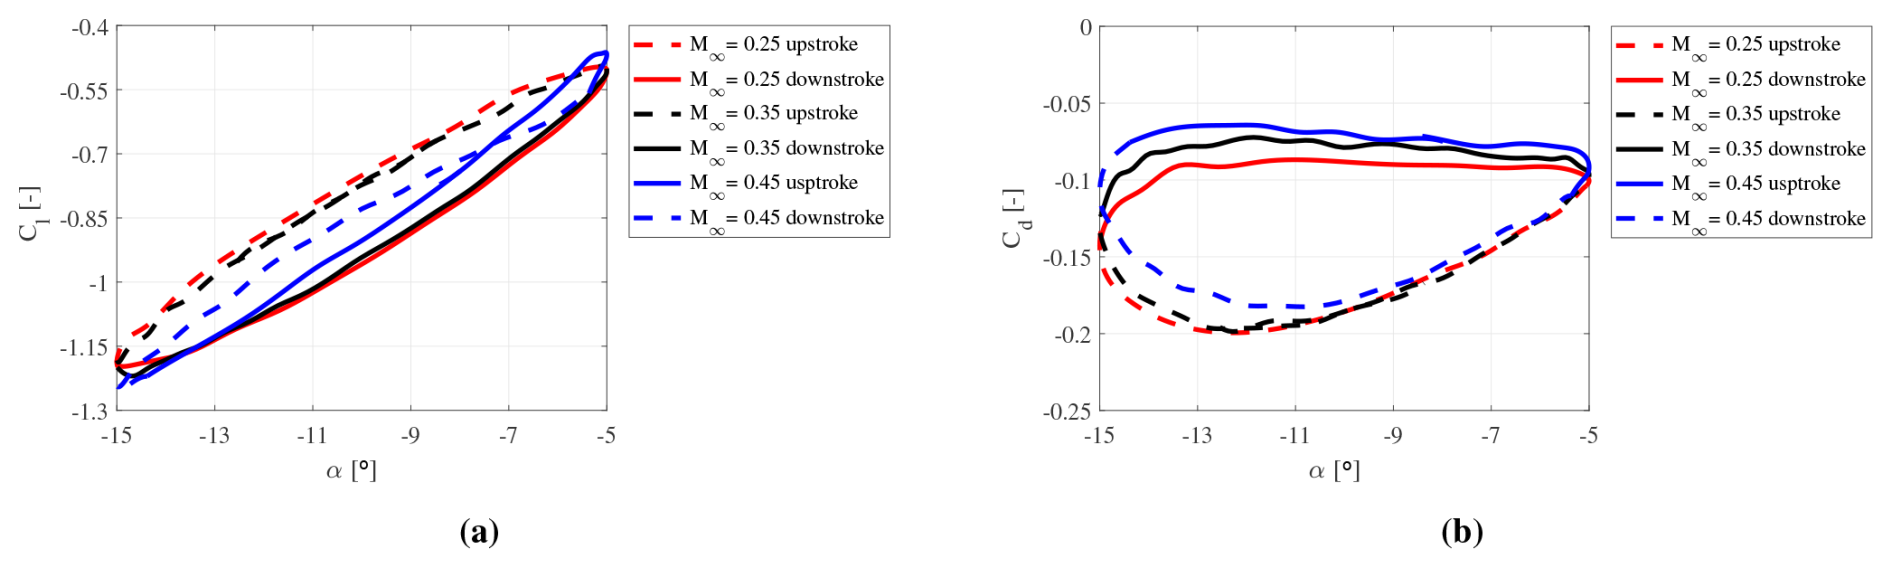
Figure 11(a) Lift coefficient as a function of the effective angle of attack for M∞=0.25, M∞=0.35, and M∞=0.45; k=0.6 and : downstroke (solid line) and upstroke (dashed line). (b) Drag coefficient as a function of the effective angle of attack for M∞=0.25, M∞=0.35, and M∞=0.45; k=0.6 and : downstroke (solid line) and upstroke (dashed line).
The following discussion focuses only on the analysis of the inflow Mach numbers at which the onset of transonic flow was demonstrated, i.e., M∞ = 0.35 and 0.45. By inspection of the local Mach number contours plotted in Fig. 12 for the angle of attack of −15°, a local supersonic flow appears for both Mach numbers. For M∞ = 0.35 (Fig. 12a), a small supersonic pocket arises close to the leading edge, while for M∞=0.45 (Fig. 12b), the supersonic pocket appears enlarged. In the latter case, a clearly defined boundary between supersonic and subsonic flow regions exists, suggesting the presence of a strong shock wave. A similar flow configuration is also observed for in the upstroke phase. For M∞=0.45, a significant drop in the velocity field appears, confirming the hypothesis of separated flow (Fig. 12e), while a decrease in the inflow Mach number down to 0.35 leads to a significant reduction of the supersonic flow region (Fig. 12b). During the pitching downstroke phase, instead, the supersonic region completely disappears for both M∞=0.35 and 0.45, as shown in Fig. 12c and f, respectively. These results clearly suggest that an increase in the inflow Mach number promotes the occurrence of transonic flow for wind turbine tip airfoils.
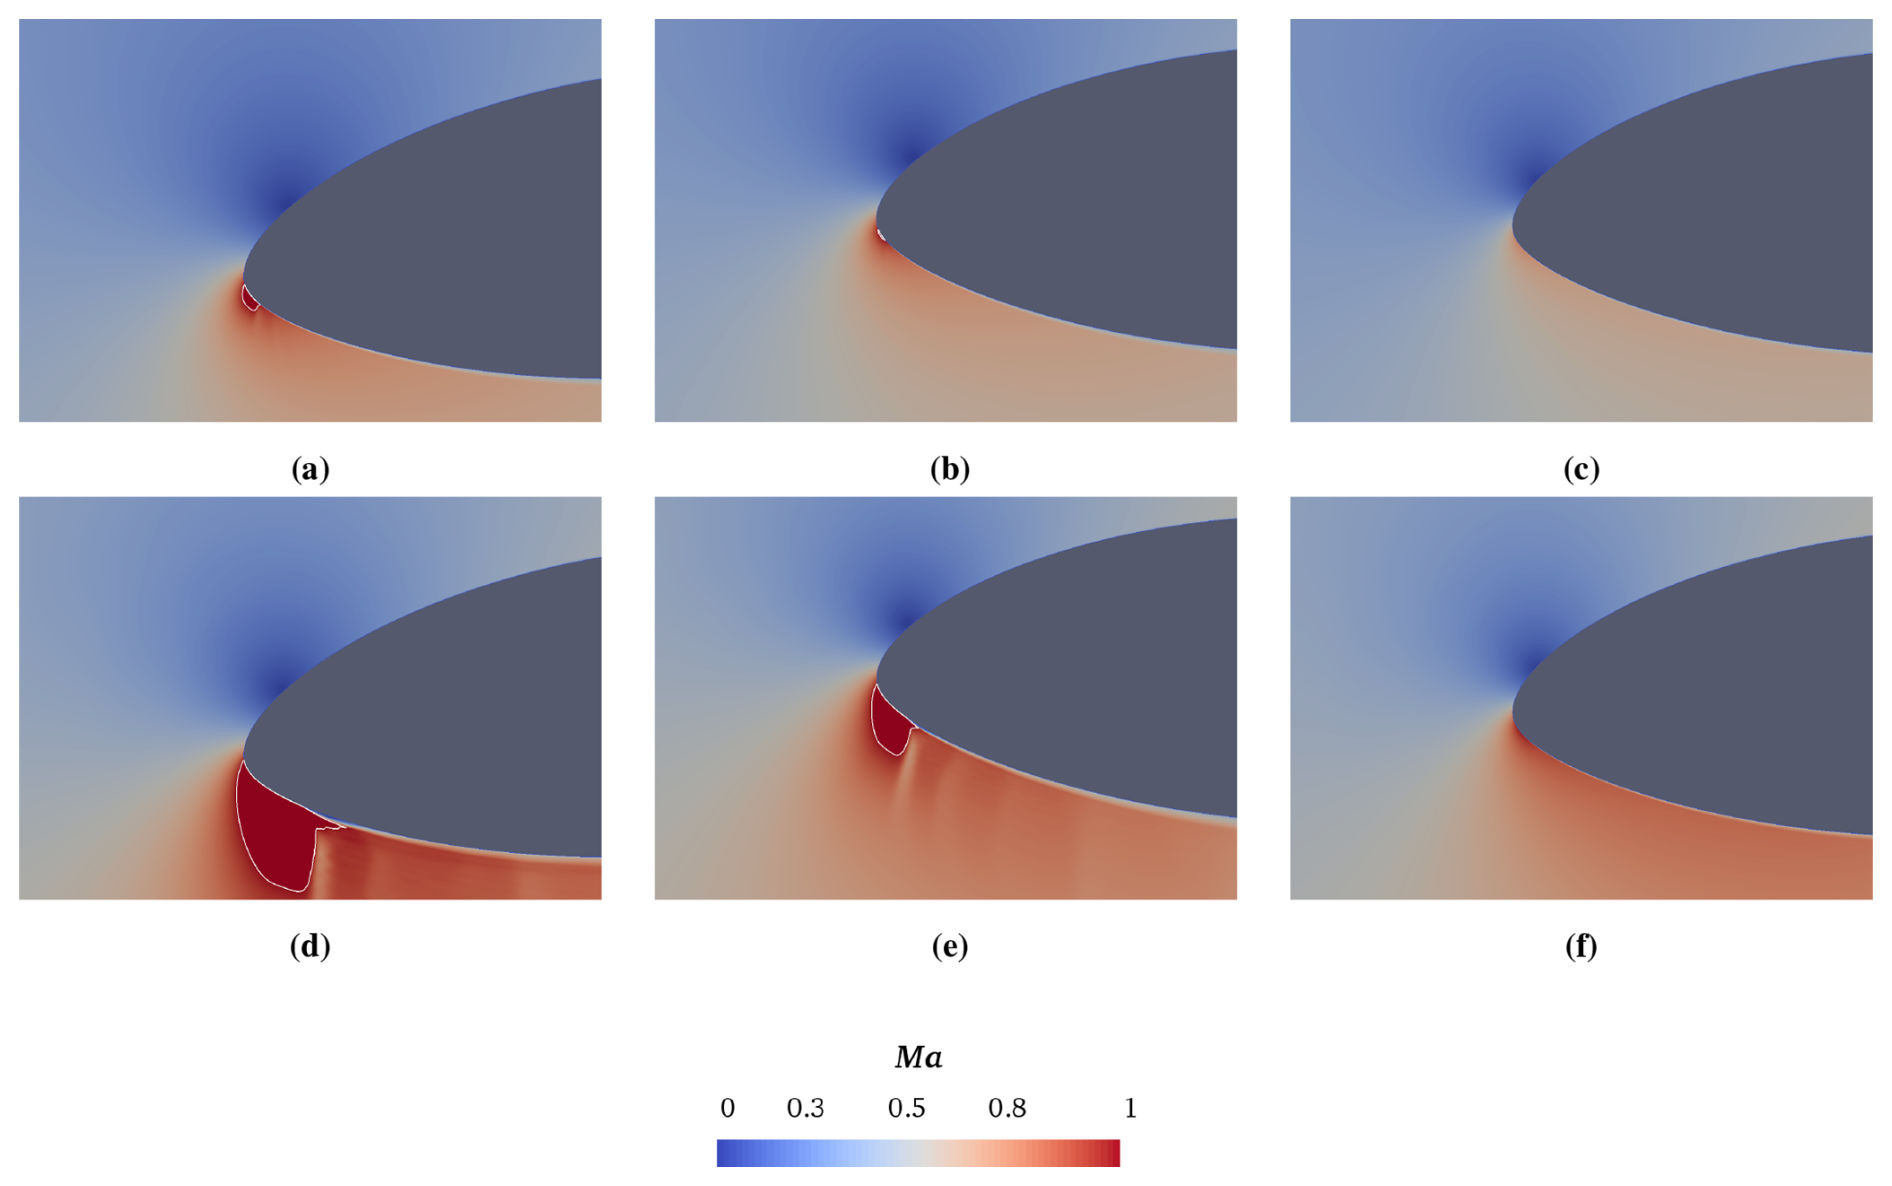
Figure 12Instantaneous contour maps of local Mach number at and k=0.6 for varying free-stream velocity: M∞=0.35 at (a) , (b) upstroke, and (c) downstroke; M∞=0.45 at (d) , (e) upstroke, and (f) downstroke. The iso-line corresponds to Ma =0.99.
3.2.2 Shock-wave occurrence for varying Mach number
The present section focuses on the investigation of the occurrence of shock waves for varying the inflow Mach number. Only M∞=0.35 and 0.45 are considered, since it was previously demonstrated that transonic flow does not arise at M∞=0.25. The trend of the maximum normal Mach number versus the angle of attack, during the pitching motion, is shown in Fig. 13. The presence of a shock wave can be detected when the normal Mach number exceeds the value of 1, i.e., points above the red line in the graph. The occurrence of shock waves is demonstrated for both M∞=0.35 and 0.45. Notably, even at an inflow Mach number of 0.35, shock waves occur alongside the establishment of a transonic regime. This represents a novel finding for the present dynamic case, because the previous static analysis performed by Vitulano et al. (2025) found that, at the same Mach number, a transonic flow occurs without the formation of shock waves, even at . In particular, an increase in the inflow Mach number leads to a rise in the normal Mach number, as well as to an expansion of the range of angles of attack where shock waves appear. Figure 13a shows that at M∞=0.35, shock waves are observed only at during the downstroke, while Fig. 13b reveals that shock waves appear already at . Additionally, a delay in the disappearance of shock waves is noted during the upstroke ascent, at , suggesting that an increase in the inflow Mach number leads to an increase in the incidence at which a shock wave appears. A plateau comparable to that one presented in Fig. 8c can also be observed in Fig. 13b, corresponding to M∞=0.45.
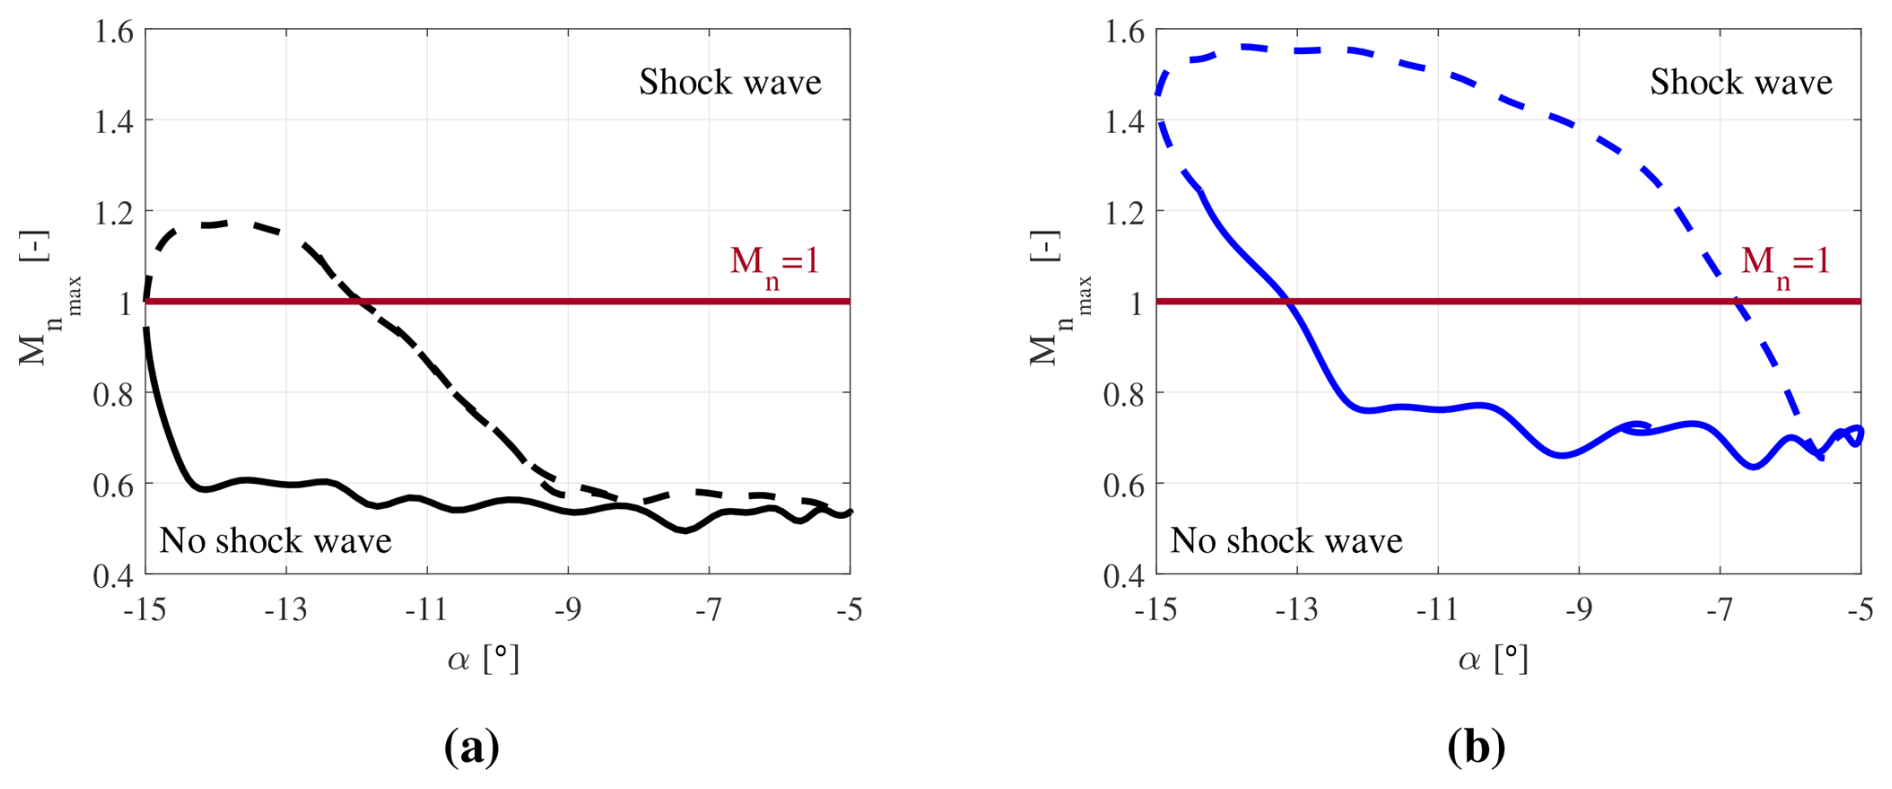
Figure 13Maximum normal Mach number coefficient as a function of the effective angle of attack: (a) M∞=0.35 and (b) M∞=0.45; k=0.6 and , solid line: downstroke, dashed line: upstroke.
Figure 14 presents the instantaneous numerical Schlieren images for an inflow Mach number of either 0.35 or 0.45, at , for the upstroke phase. At this particular incidence, for an inflow Mach number of 0.35, it can be assumed that the shock wave begins to dissipate. In fact, a slight discontinuity in the density gradient is observed, corroborating this hypothesis. However, when the Mach number is increased to 0.45, a significant increase in this discontinuity is evident, suggesting the presence of a strong shock wave. Furthermore, the separation of the boundary layer flow is observed downstream of the shock. For an inflow Mach number of 0.45, although the flow field is characterized by a large number of configurations in which a shock is present, a significant distinction between the upstroke and downstroke phases is observed, as highlighted in Fig. 15, which shows the Schlieren images at . The presence of a shock is observed in both cases, as expected by inspection of Fig. 13; however, the discontinuity in the density gradient is significantly greater during the upstroke, suggesting the influence of higher compression loads.
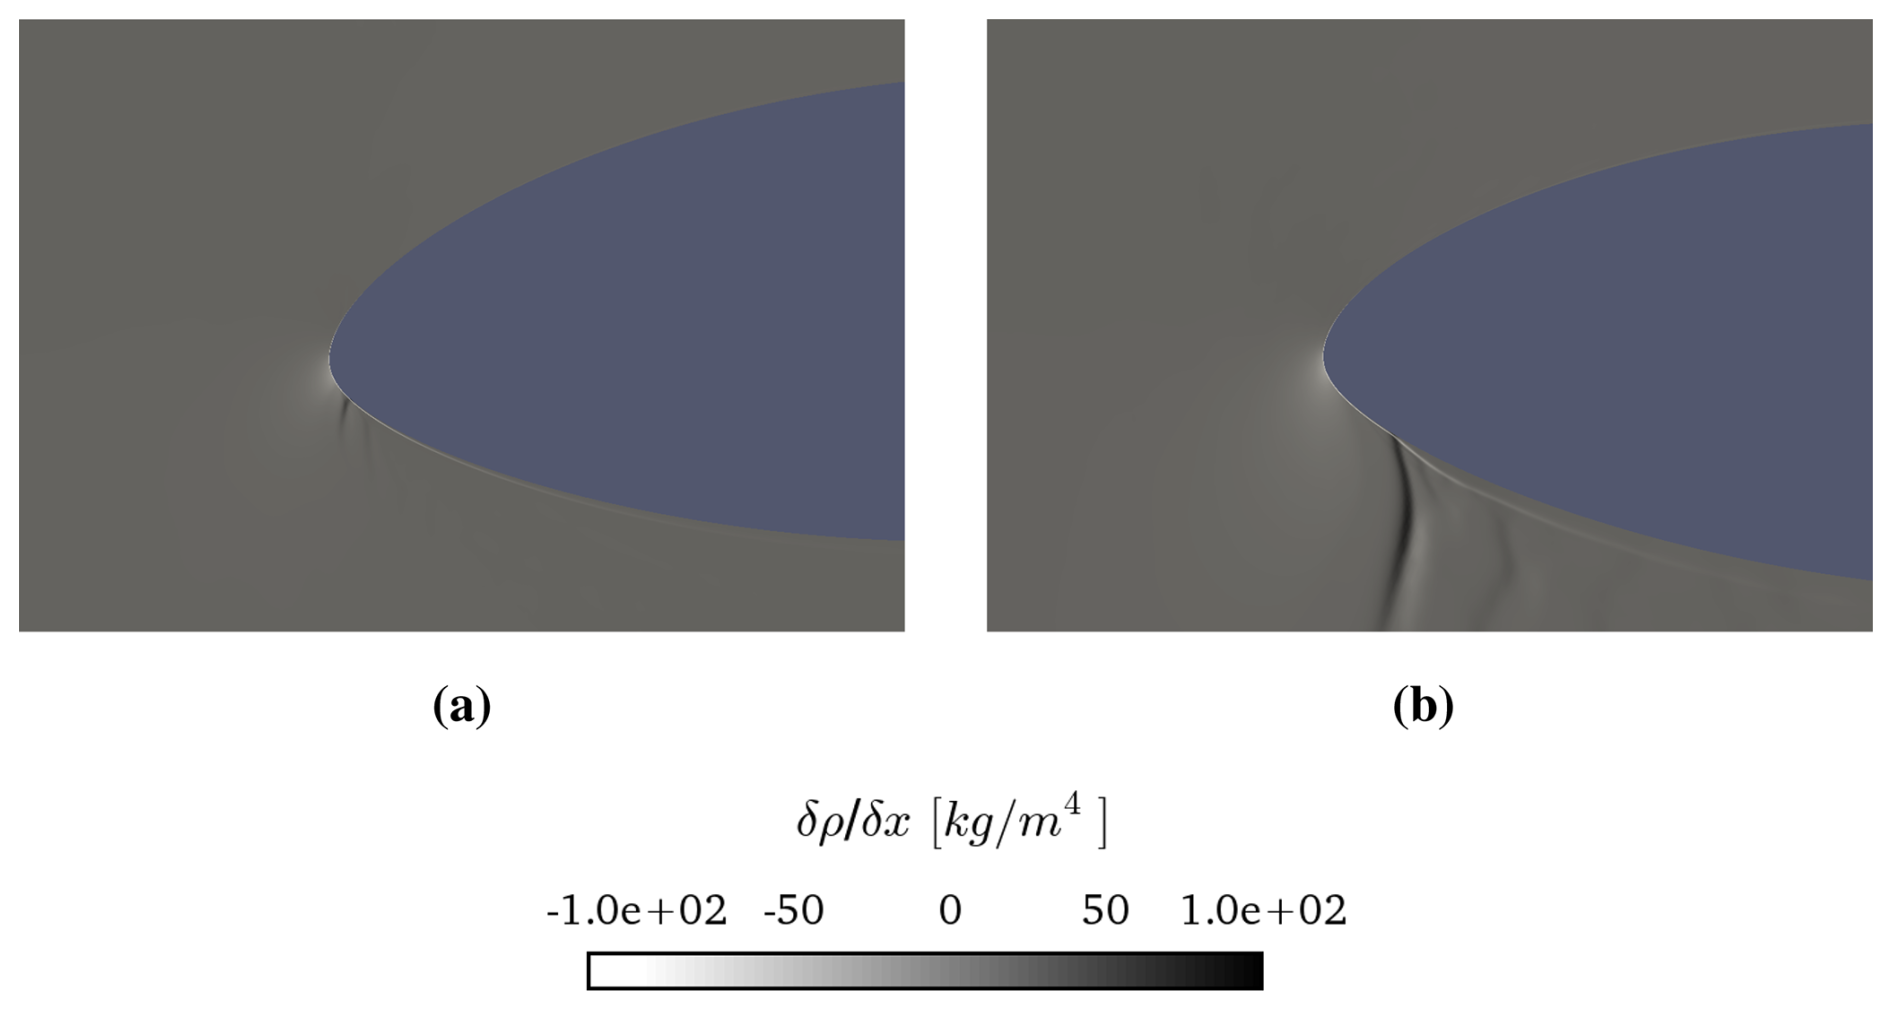
Figure 14Instantaneous (numerical) Schlieren images at (a) M∞=0.35 and (b) M∞=0.45 in the upstroke; , k=0.6, and .
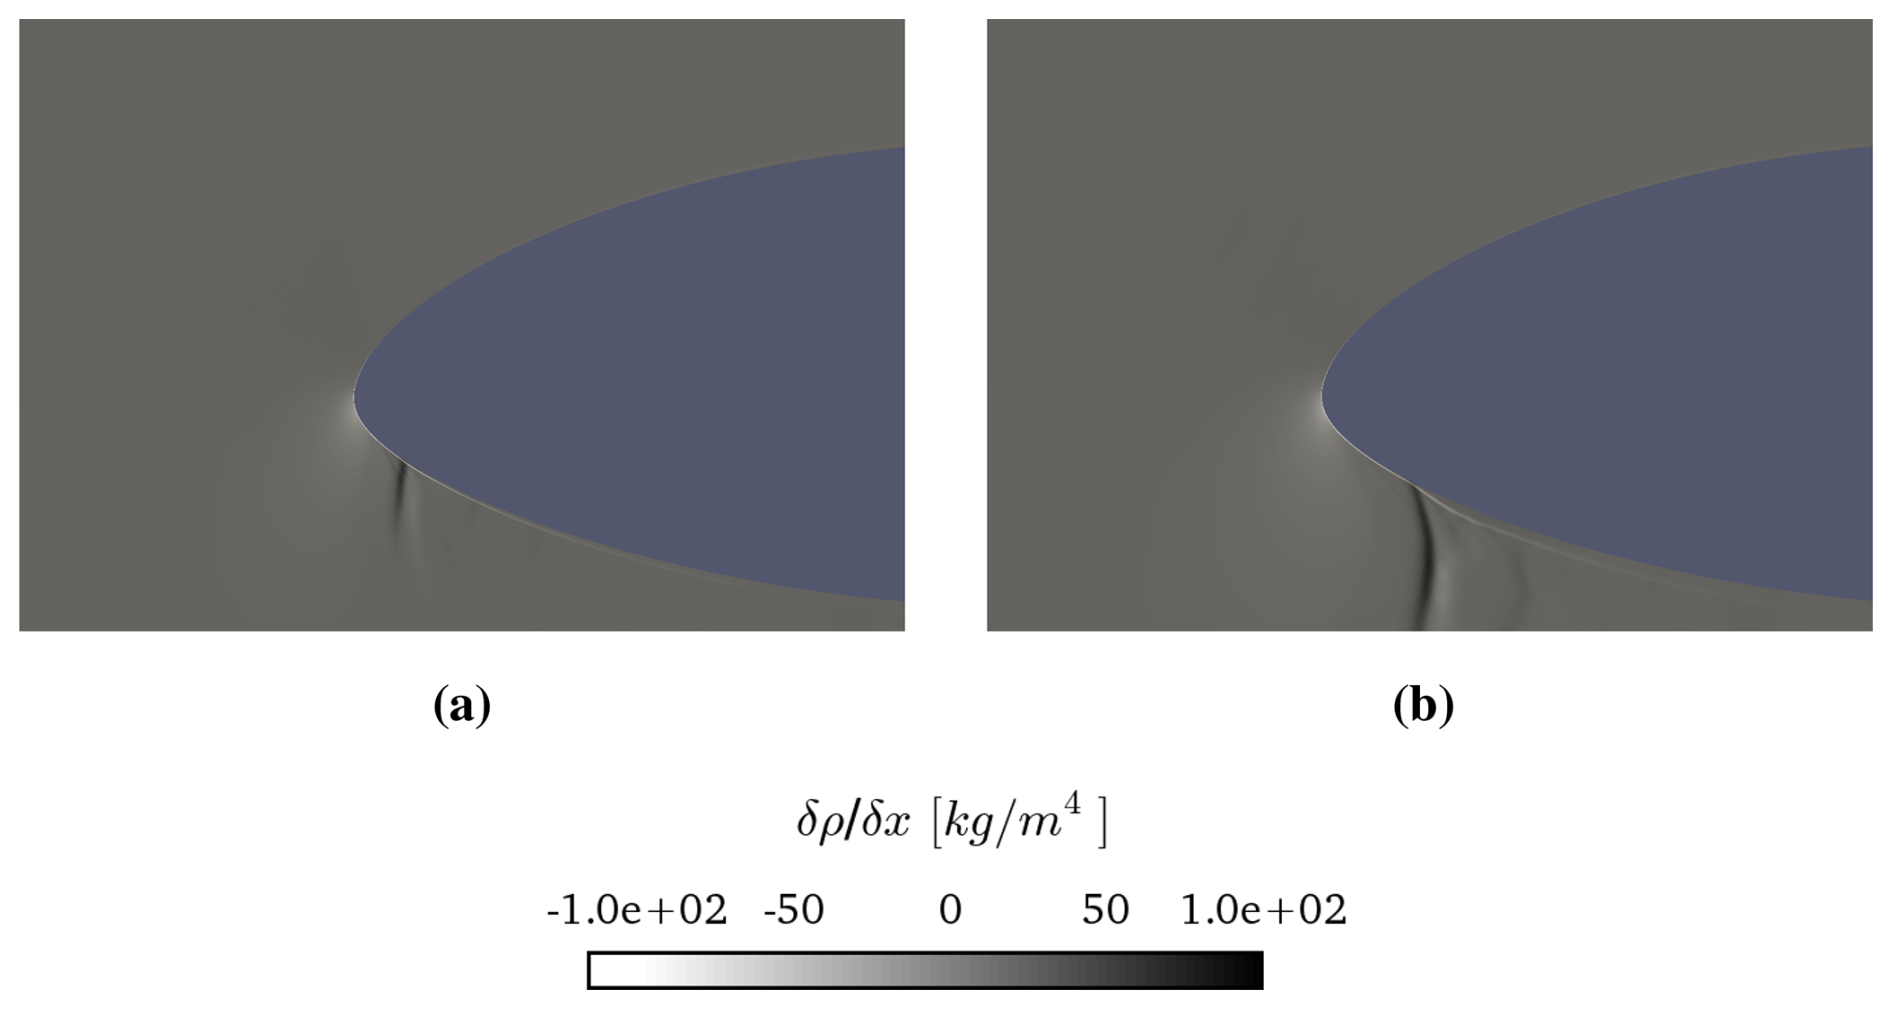
Figure 15Instantaneous (numerical) Schlieren images: (a) downstroke and (b) upstroke; M∞=0.45; k=0.6, and .
The presence of the plateau depicted in Fig. 13b is also supported by the qualitative results shown in Fig. 16. At high incidences, specifically at and −14°, a strong shock wave is observed close to the airfoil leading edge. The shock wave–boundary layer interaction leads to the boundary layer flow separation, which justifies the decrease in the absolute value of the minimum pressure coefficient, compared against the case M∞=0.35, where no separation has been observed. Moreover, as the angle of attack reaches −8.5°, a weakening of the intensity of the density gradient discontinuity is shown, along with a reattachment of the boundary layer flow. This fact results in a reduced compression, which is quantitatively reflected in the variation of the slope in the curves shown in Figs. 8c and 13b, for the minimum pressure coefficient and the maximum normal Mach number, respectively.
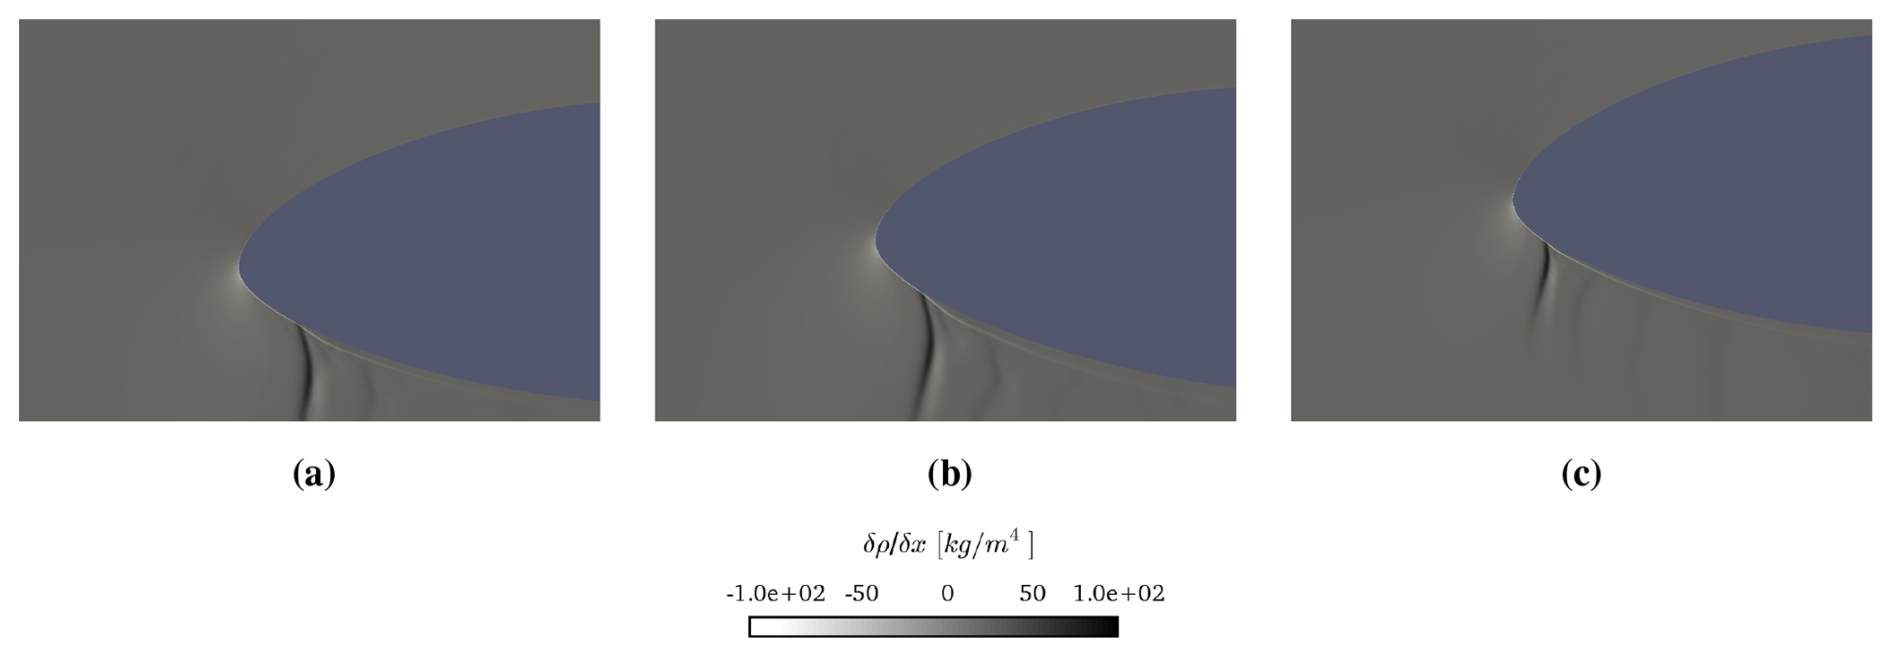
Figure 16Instantaneous (numerical) Schlieren images: (a) , (b) , and (c) upstroke; M∞=0.45, k=0.6, and .
The current numerical investigation provides the unsteady aerodynamic characterization of the FFA-W3-211 wind turbine tip airfoil in a highly unsteady regime for compressible and transonic flow conditions. The analysis was performed by means of CFD computations using the URANS model previously validated in Vitulano et al. (2025) for steady flow conditions. A dynamic mesh motion was introduced in order to impose a sinusoidal pitching oscillation, forcing the airfoil to enter and leave the supersonic regime. Two different sets of simulations were conducted for varying reduced frequency and inflow Mach number, respectively.
The flow Reynolds number was kept equal to 9 million, which is a value typically experienced at a blade tip of large state-of-the-art wind turbines. In particular, all the simulations were conducted in the compressible regime, accounting for non-negligible inflow Mach numbers while maintaining a high Reynolds number as well. It is worth stressing that a similar configuration would be very challenging to achieve experimentally.
This study confirms that flow compressibility plays a crucial role in accurately predicting the aerodynamic performance and loads experienced by next-generation large wind turbine rotors under real operational conditions in a dynamic regime. In fact, it is shown that the introduction of a harmonic oscillation, with the airfoil entering and leaving the transonic threshold, promotes the onset of a local supersonic flow, as well as the occurrence of shock waves. The flow over the pitching airfoil is also characterized by the establishment of a hysteresis loop, similar but distinct from that associated with dynamic stall. This loop, whose morphology results in being strongly dependent on reduced frequency and inflow Mach number parameters, affects not only the aerodynamic loads experienced by the airfoil but especially the range of incidences for which transonic flow and shock waves occur. In particular, a delay in transonic flow development is observed, for both downstroke and upstroke phases, caused by an increase in either reduced frequency or the inflow Mach number. An incremental change in these quantities leads to an expansion of the hysteresis loop, resulting in more severe loads experienced by the wind turbine tip section.
The present study also reveals that an increase in either reduced frequency or inflow Mach number leads to an increase in the range of incidences for which local supersonic flow can manifest itself. Shock waves occur already for an inflow Mach number of 0.35, different from previous findings for the static analysis reported (Vitulano et al., 2025), where no such discontinuities were observed for this case. For an inflow Mach number of 0.45, the existence of a strong shock is shown, together with a separation of the boundary layer in a wide range of incidences, during the upstroke phase of the pitching motion. The occurrence of the hysteresis loop also involves the definition of a range of incidences in which transonic flow can occur. Hence, once the inflow Mach number is fixed, defining only one incidence as a transonic threshold, albeit a useful starting point, would require sufficient safety margins to account for the observed dynamic widening.
All these results are summarized in Fig. 17, which illustrates the influence of reduced frequency k (Fig. 17a) and inflow Mach number M∞ (Fig. 17b) on the flow regime encountered during a pitching motion. The light gray bars represent the full pitching range in terms of angle of attack. The dark-blue regions correspond to angles where shock waves are present, while the light-blue regions indicate transonic flow without shock formation. Solid black lines denote the downstroke limits, and dashed black lines indicate the upstroke limits. From the analysis of this figure, it is evident that, although an increase in reduced frequency promotes the onset of both transonic flow and shock waves, the inflow Mach number has a significantly stronger influence on the extent and intensity of these flow regimes.
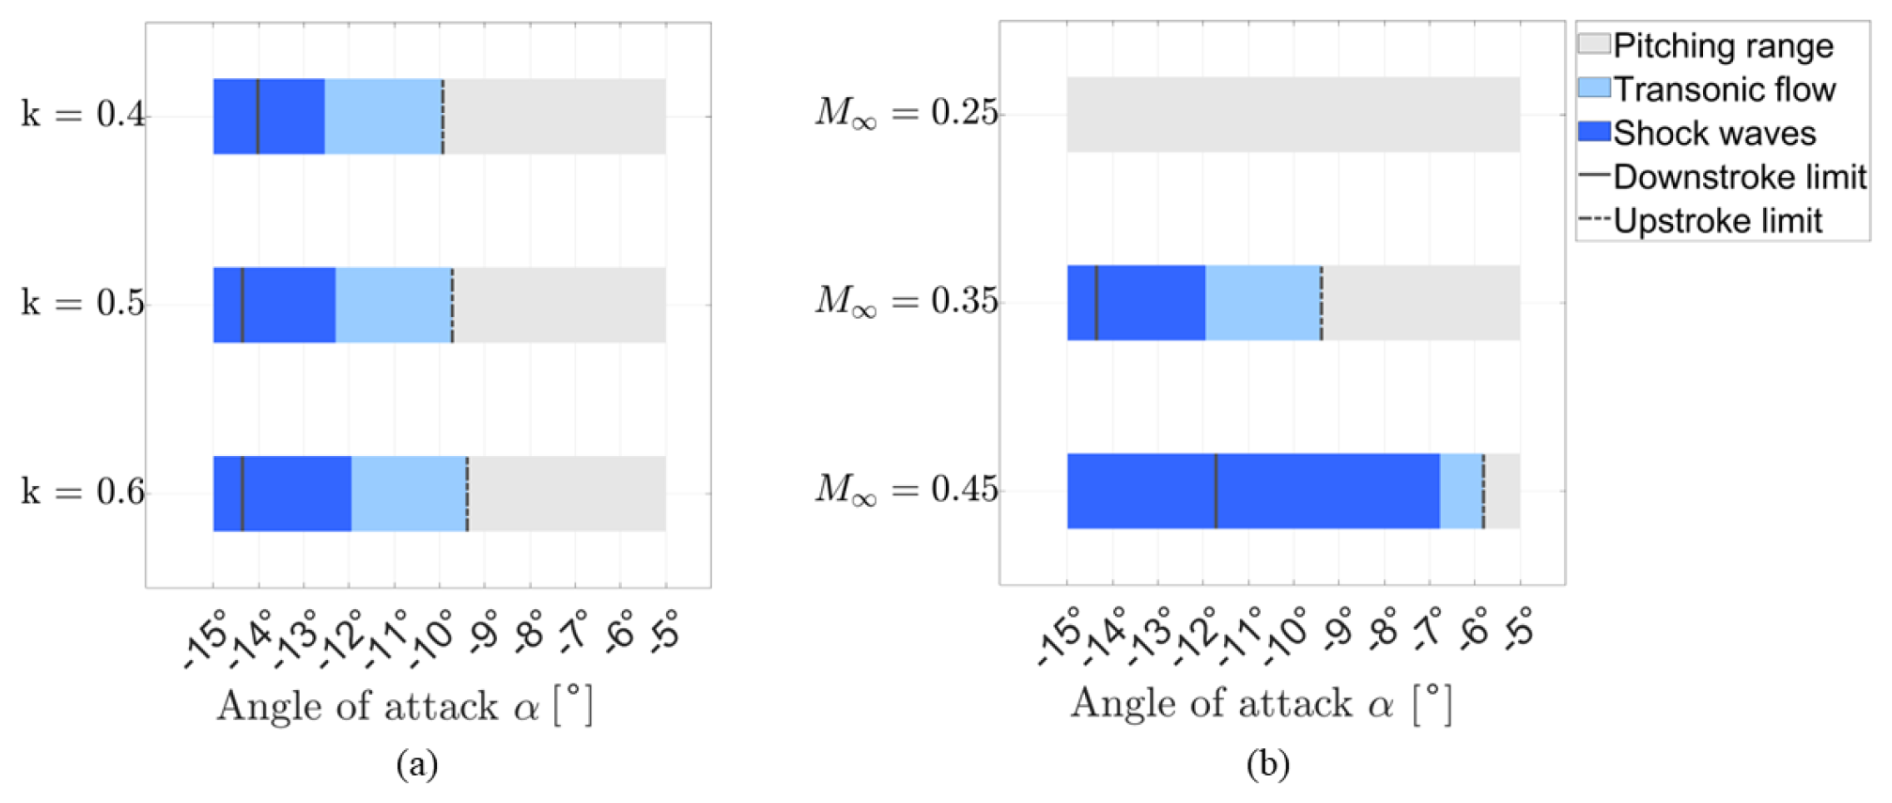
Figure 17Flow regimes during pitching motion as a function of (a) reduced frequency and (b) inflow Mach number, highlighting the angles of attack of the full pitching period (gray), in which transonic flow occurs (light-blue) and shock waves appear (dark-blue). The transonic limits of the downstroke (solid line) and upstroke (dashed line) are indicated for reference.
The extension of the region in which transonic flow occurs, together with the appearance of the hysteresis loop and the presence of shock waves, can induce additional unsteady loads on the tip section. This phenomenon can potentially reduce fatigue life and negatively impact rotor dynamics. Properly accounting for compressibility and dynamic effects in aerodynamic predictions allows for a more accurate estimation of both performance and structural loads. This is particularly crucial for the design and operation of next-generation large wind turbines with the likely higher tip speeds.
Finally, it is important to bear in mind the limitations of the present analysis. First, the current URANS approach may not be fully adequate for accurately capturing unsteady transonic flow phenomena, primarily due to inherent assumptions in turbulence modeling and its interaction with shocks. The Reynolds-averaging procedure either eliminates or attenuates, in the case of strong flow instabilities, a significant amount of flow unsteadiness, while shifting the dominant frequency toward lower values (Fröhlich and von Terzi, 2008). As unsteadiness was shown to be a key driver in the occurrence of local supersonic flow, URANS may underestimate transonic effects. In addition, it is essential to recall that this URANS study only considered fully turbulent flow conditions. Laminar to turbulent flow transition could occur on clean wind turbine airfoils, possibly leading to a larger suction peak and, hence, aggravating the situation with respect to susceptibility to supersonic flow. Moreover, the presence of local supersonic flow prompts challenges in the understanding of the influence of shock waves and buffeting on wind turbine performance and longevity, especially in the highly unsteady flow regime. Therefore, it would be essential to evaluate these effects to ensure the efficient operation and durability of future large wind turbines.
Furthermore, given the highly unsteady and three-dimensional nature of the phenomenon under investigation, as well as the necessity to predict dominant frequencies in the flow field to assess aeroelastic instabilities, it is recommended to conduct experiments and/or employ high-fidelity simulations. Considering the limitations associated with the high-flow Reynolds number in transonic wind tunnels, future investigations may benefit from utilizing the large eddy simulation (LES) approach, supplied with advanced wall models, or hybrid RANS/LES techniques (Fröhlich and von Terzi, 2008; Salomone et al., 2023).
The present numerical investigation was performed by employing the URANS formulation (Wilcox, 2006). As the setup is based on our previous work (Vitulano et al., 2025), some of the material below can also be found there. All computations were carried out with the open-source CFD tool OpenFoam, employing the rhoPimpleFoam solver, which is suitable for transient, turbulent, and compressible flows (OpenFoam Foundation, 2016). The flow was assumed to be fully turbulent, and the two-equation k−ω shear stress transport (SST) eddy-viscosity model (Menter, 1994) was used to model the turbulence effects. Free-stream boundary conditions were prescribed for pressure, velocity, and temperature, while no-slip conditions are enforced on the solid surfaces. To reduce computational cost, adaptive wall-functions (OpenFoam Foundation, 2016) were applied as wall boundary conditions on the airfoil. The gradient terms were treated with 2nd-order accurate schemes, with limiters applied to velocity and turbulence quantities to prevent spurious oscillations near steep gradients such as shock waves. Convective terms for momentum were discretized using a 2nd-order upwind scheme, which is robust and accurate in capturing shock-related flow features. Pressure, turbulence, and energy fluxes were treated with a 2nd-order total variation diminishing (TVD) scheme to avoid overshoots and undershoots at discontinuities. Diffusive terms were handled with a corrected Laplacian discretization, improving accuracy on non-orthogonal meshes, and surface-normal gradients were also corrected to enhance the resolution of shock–boundary layer interactions. Finally, a 2nd-order linear interpolation scheme was employed to provide a smooth representation of the flow variables in regions away from discontinuities. This combination of schemes provides a good compromise between accuracy and robustness, ensuring reliable shock resolution without introducing excessive numerical oscillations (Moukalled et al., 2015). A variable time step was used, with the maximum Courant number limited to 0.5 to ensure temporal accuracy while maintaining numerical stability. An inflow turbulence intensity of 0.15% was imposed, consistent with the previous work of Bertagnolio et al. (2001). The computational model was validated in our previous study (Vitulano et al., 2025). A two-dimensional domain was used and discretized with a structured mesh generated by the open-source software Construct2D, employing an O-grid topology, as shown in Fig. 3. The influence of domain size on the numerical results was investigated by analyzing the pressure coefficient distribution at an angle of attack of α=7.99° and a Reynolds number of .
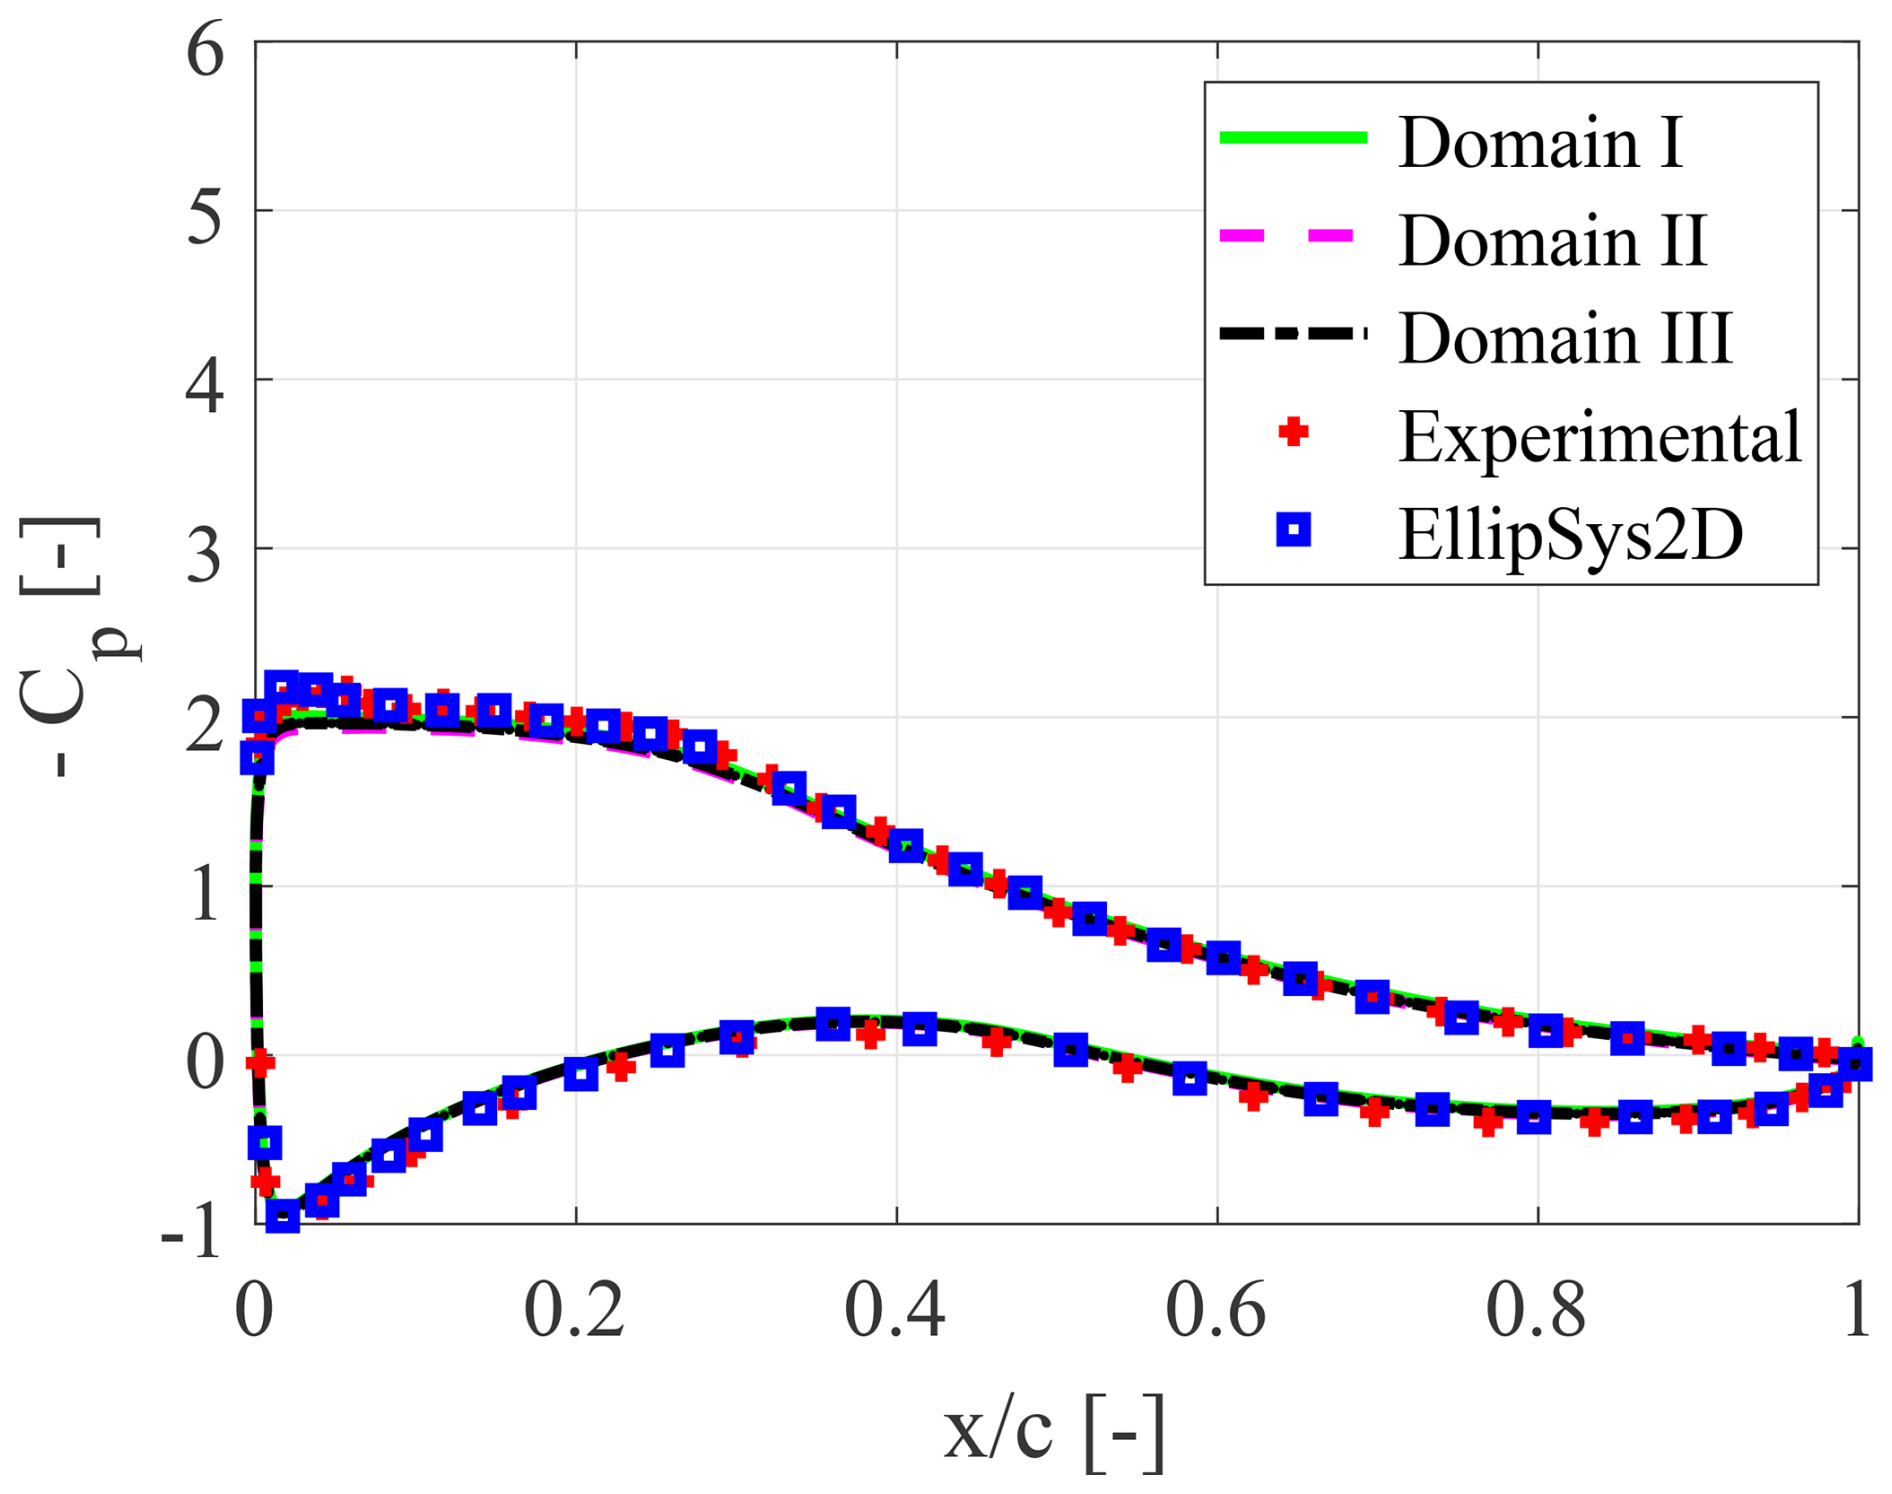
Figure A1Mean pressure coefficient distribution for varying domain size at α=7.99° and , compared to reference data (Bertagnolio et al., 2001). This image is taken by Vitulano et al. (2025).
Three computational domains with radii of 10 (domain I), 30 (domain II), and 50 (domain III) chord lengths were considered. The corresponding results were reported in Fig. A1 alongside reference experimental and numerical data from Bertagnolio et al. (2001). The discretization of the airfoil surface was kept constant across all cases, with N=499 points. Taking the largest domain (domain III) as a reference, the mean error for the smaller domains was computed as
The angle of 7.99° was chosen deliberately to perform a preliminary validation focusing only on domain size. For this incidence, the flow remained attached and within the linear portion of the lift polar, so any discrepancies could reasonably be attributed to changes in the computational domain rather than flow separation effects. Table A1 summarizes the mean errors for each domain. The 10-chord radius (domain I), also employed in a recent study by Carta et al. (2022), represented a good compromise between accuracy and computational costs.
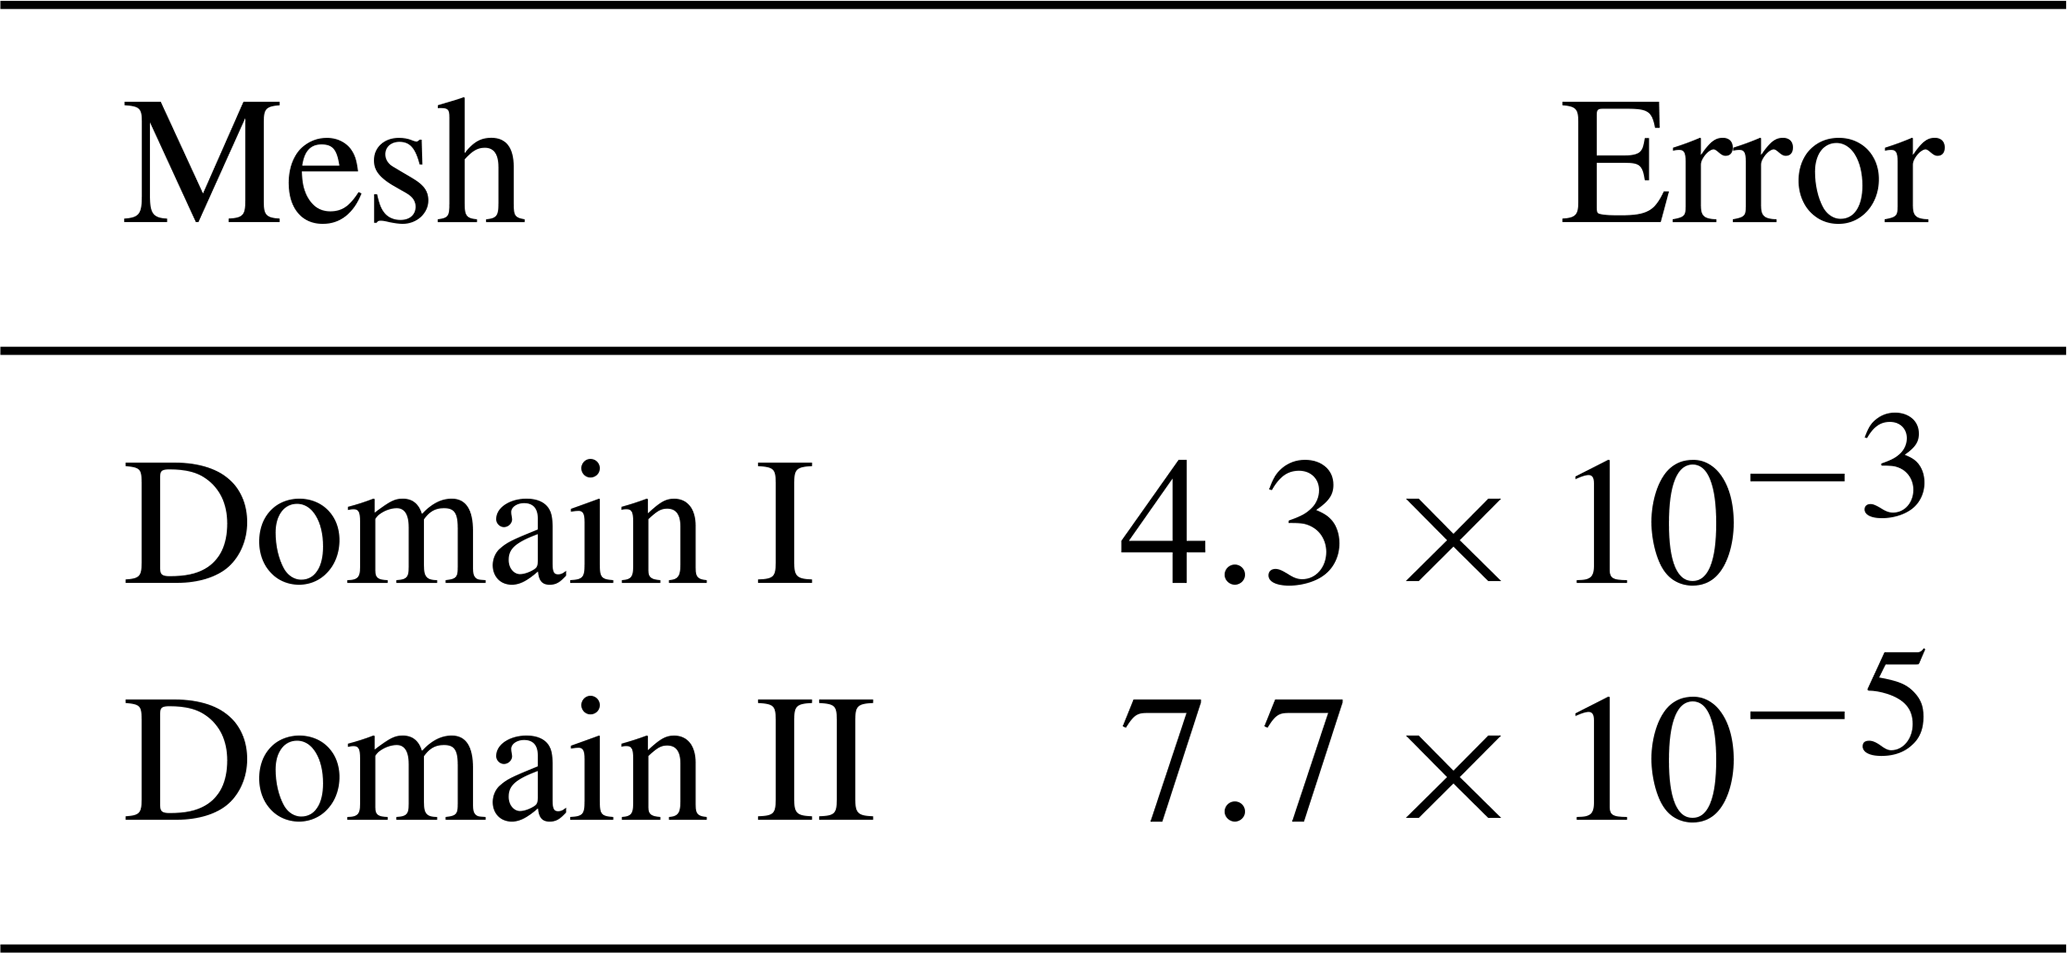
The analysis reported in Table 1 indicates that a computational domain extending to 10 chord lengths provides an optimal balance between accuracy and computational efficiency. This choice is consistent with the approach recently employed by Carta et al. (2022). With the domain size established, the CFD model was validated by comparing predicted pressure distributions at a Reynolds number of for three angles of attack – α=7.99, 14.98, and 20.33° – against both numerical and experimental results from Bertagnolio et al. (2001).
The URANS solutions for three different mesh resolutions, shown in Fig. A2, demonstrate convergence toward the experimental data. The numerical results are independent of mesh refinement, indicating a stable and reliable solution. Slight deviations are observed on the suction side at high angles of attack, corresponding to regions of flow separation. These differences may result from variations in the stall behavior between the simulations and experiments, or they could be numerical artifacts related to the adaptive wall-function boundary condition. It should also be noted that the details of the airfoil tripping procedure in the reference experiments are not clearly specified. Furthermore, the EllipSys2D simulations were performed under the assumption of steady flow; the present results represent time-averaged quantities.
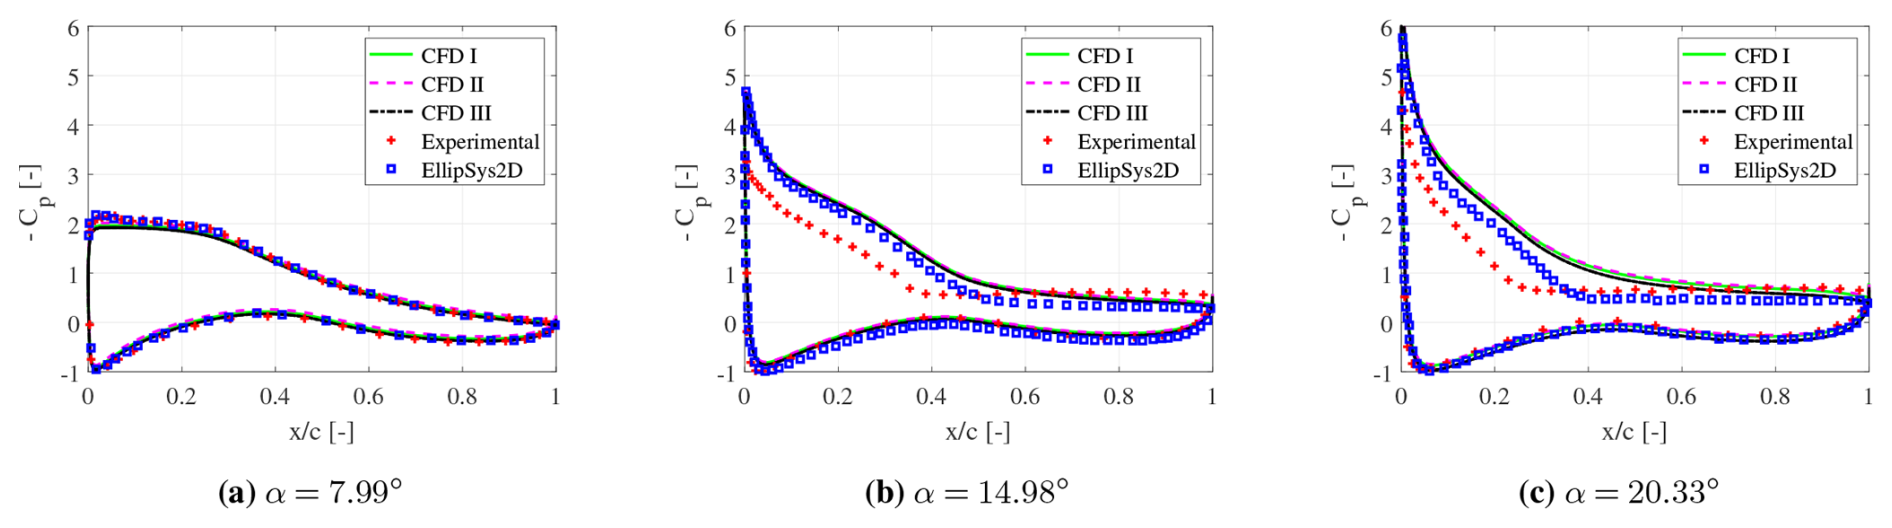
Figure A2Mean pressure coefficient distribution at : CFD I (7.4×10⁴ cells), CFD II (10×104 cells), and CFD III (12×104 cells), compared to reference data (Bertagnolio et al., 2001). This image is taken by Vitulano et al. (2025).
Following the validation of the numerical setup, a prescribed sinusoidal pitching motion was imposed on the airfoil to investigate its aerodynamic response under strongly unsteady flow conditions. In the present simulations, 20 oscillation cycles were performed to ensure convergence, so that a fully periodic state was reached.
To ensure mesh convergence in the dynamic case, a finer mesh was considered. The trend of the minimum pressure coefficient was compared between the mesh validated for the static case and a more refined mesh obtained by increasing the resolution around the airfoil. Numerical computations were performed at an inflow Mach number of 0.45, a reduced frequency of 0.5, and a Reynolds number of 9×10⁶. As shown in Fig. A3, results from both meshes converge to the same solution, particularly at high angles of attack, where transonic effects are most pronounced. Consequently, the simulations reported in this study were performed using the mesh already validated in Vitulano et al. (2025).
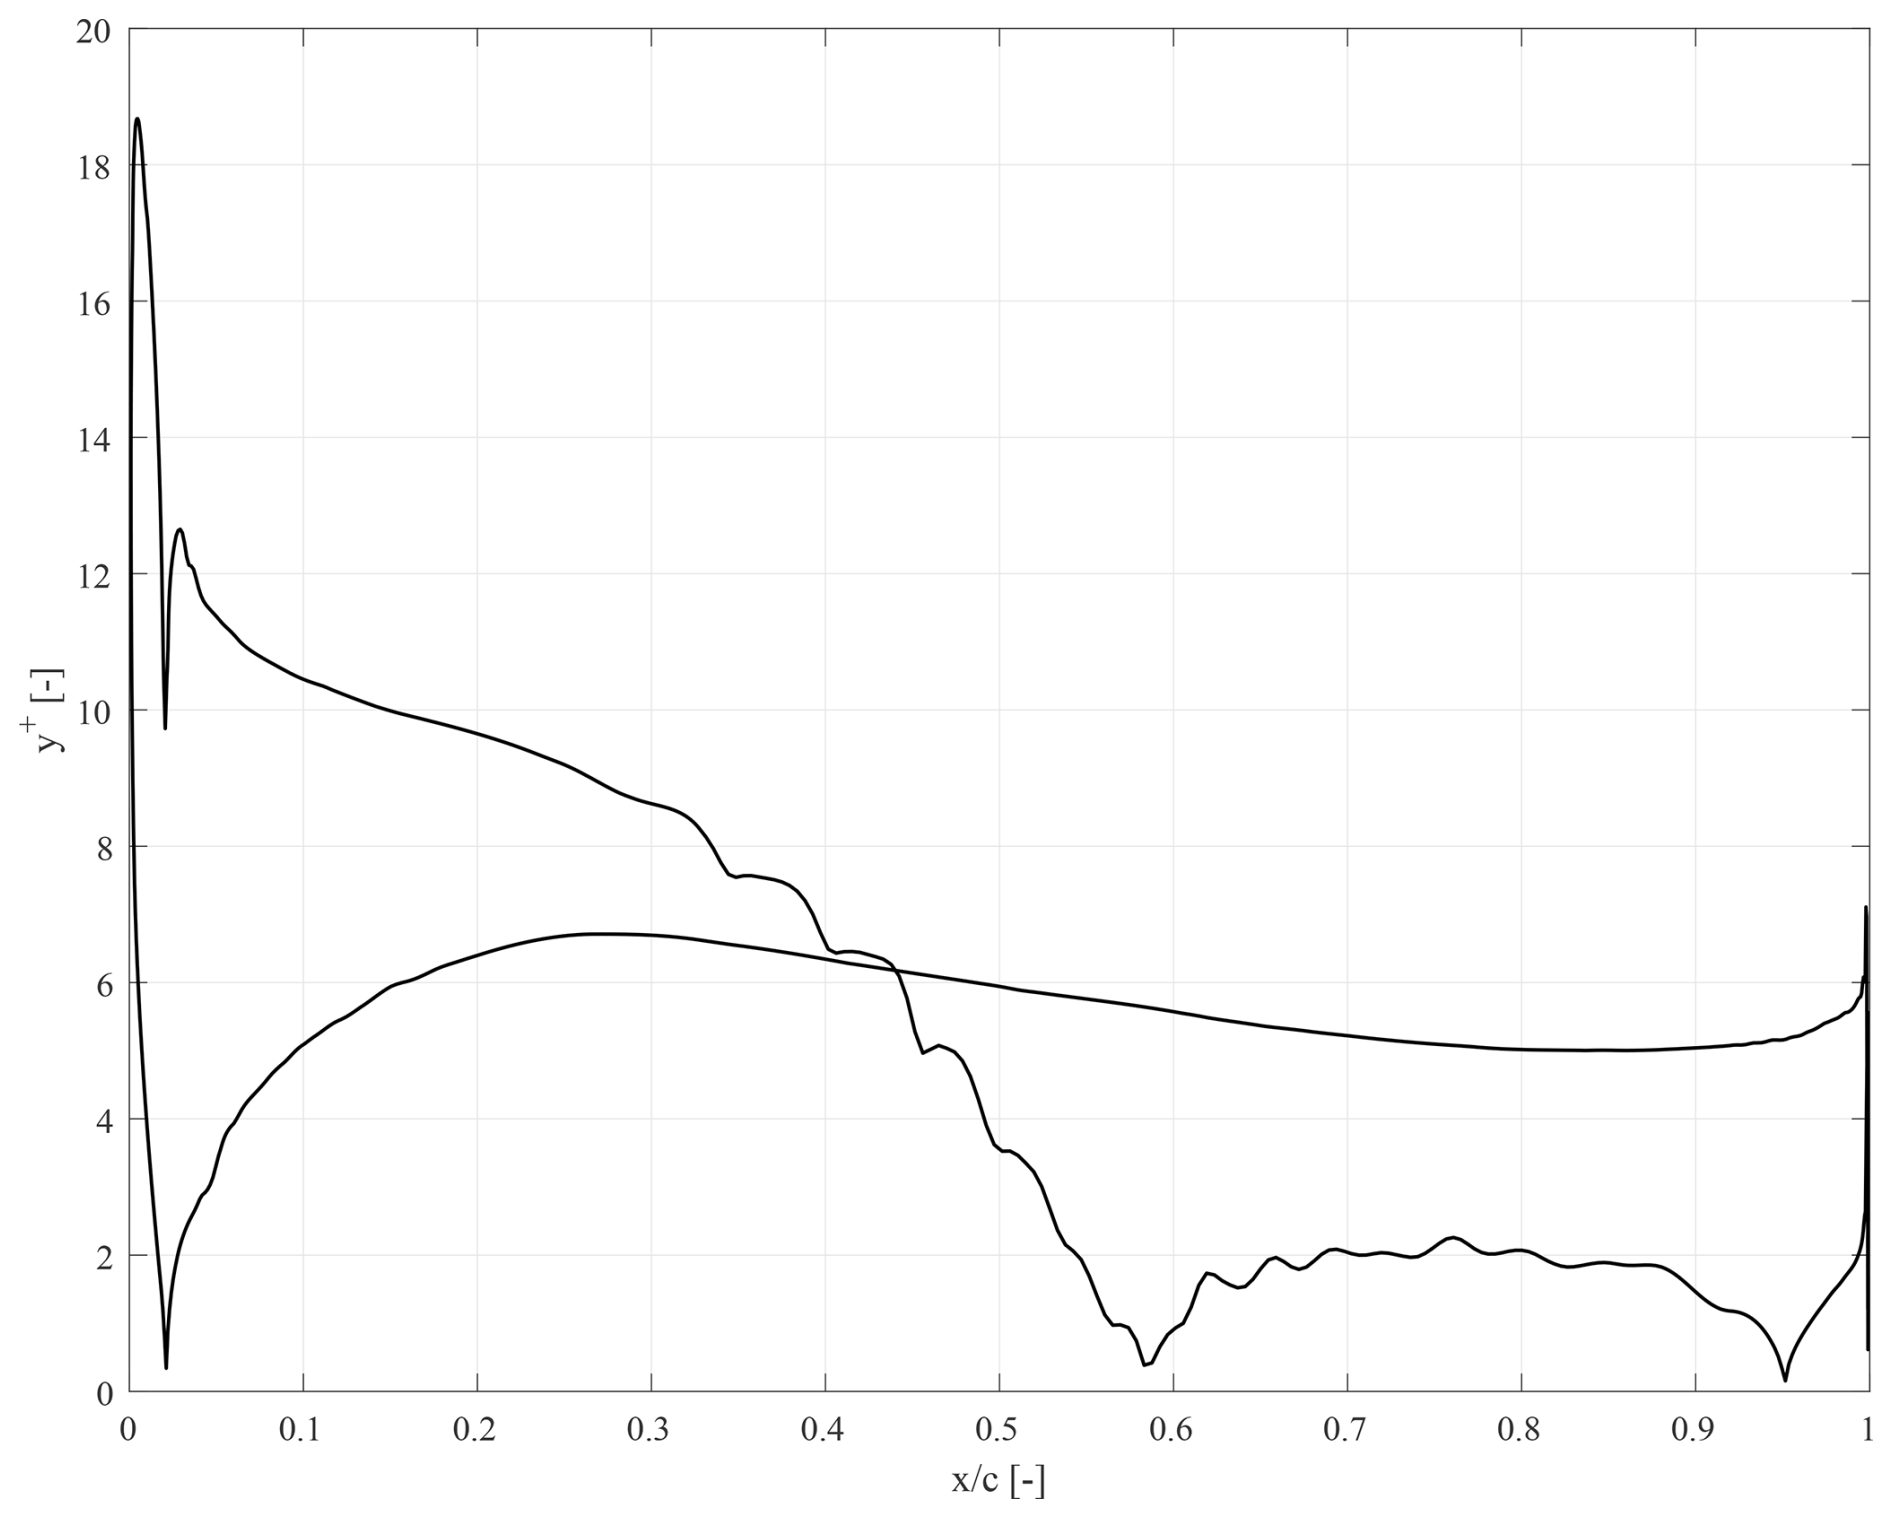
Figure A4 shows the chordwise distribution of the y+ along the airfoil surface at the maximum angle of attack reached during the pitching motion, . The y+ values remain within the range over the entire chord, with the highest values occurring close to the leading edge, where the local velocity gradients and wall shear stress are at a maximum. Along the suction side, y+ decreases progressively toward the trailing edge, reaching values close to unity in regions affected by flow separation. These values confirm that the near-wall resolution remains compatible with the employed adaptive wall-function treatment.
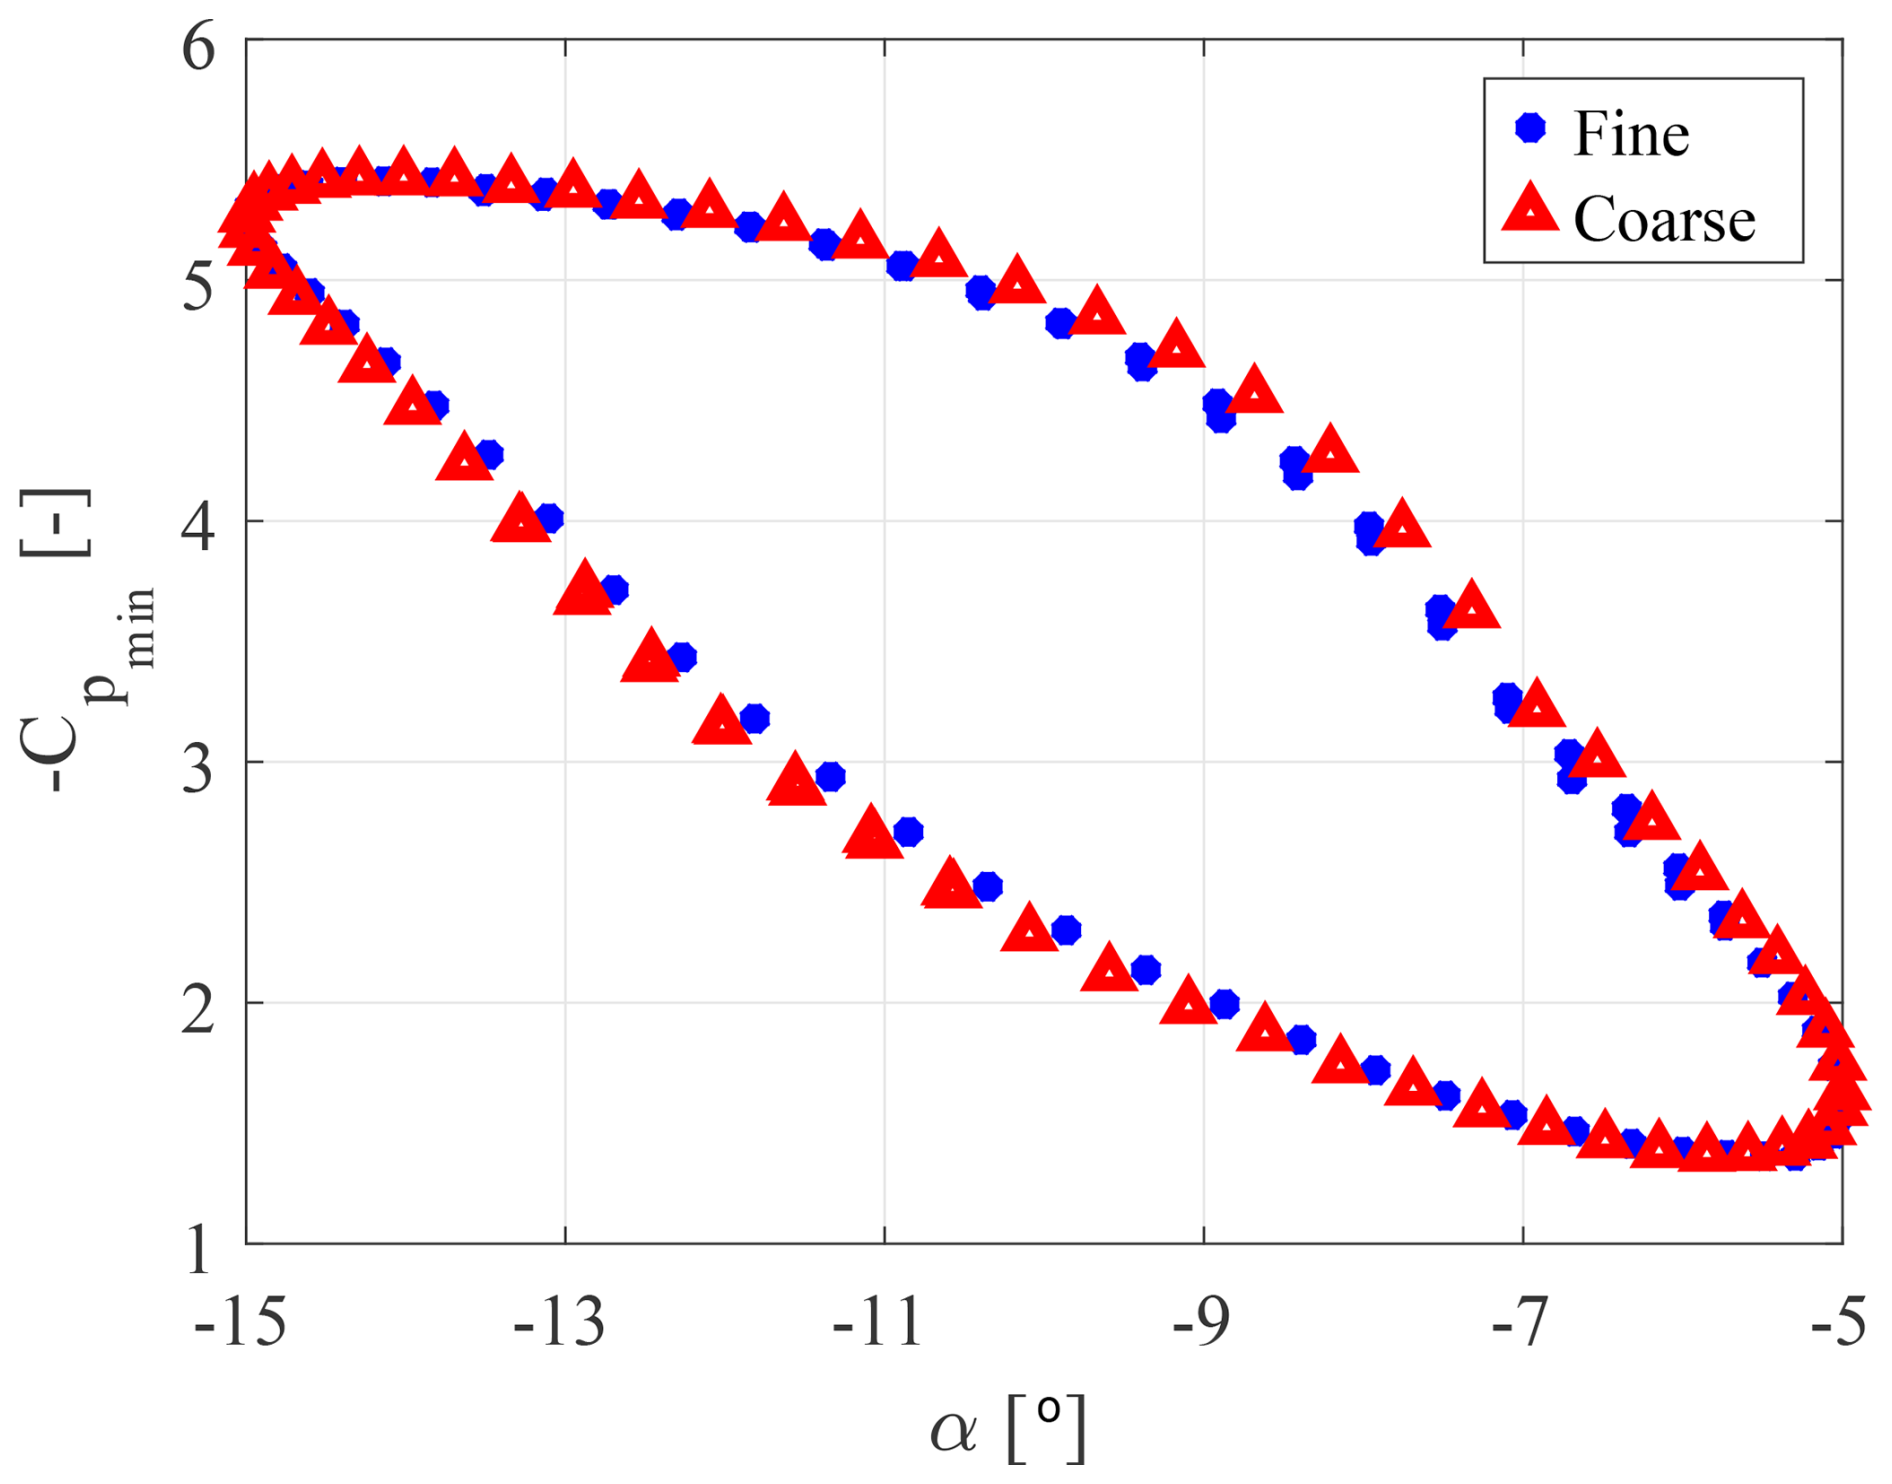
Figure A3Minimum pressure coefficient as a function of the effective angle of attack for M∞=0.45, k=0.5, and .
The code and data can be provided on request by contacting Maria Cristina Vitulano.
MCV conducted the overall research under the supervision of DDT, GD, and DvT. The conceptualization of the research and the methodology was theorized by MCV, DDT, and DvT. The implementation of the computational model and the investigations were carried out by MCV. The results were analyzed and visualized by MCV, DDT, GD, and DvT. MCV wrote the original draft, which was reviewed and edited by DDT, GD, and DvT.
The contact author has declared that none of the authors has any competing interests.
Publisher's note: Copernicus Publications remains neutral with regard to jurisdictional claims made in the text, published maps, institutional affiliations, or any other geographical representation in this paper. The authors bear the ultimate responsibility for providing appropriate place names. Views expressed in the text are those of the authors and do not necessarily reflect the views of the publisher.
This paper was edited by Xiaolei Yang and reviewed by three anonymous referees.
Aditya, A., De Tavernier, D., Schrijer, F., van Oudheusden, B., and von Terzi, D.: Experimental investigation of the occurrence of transonic flow effects on the FFA-W3-211 airfoil, J. Phys. Conf. Ser., 2767, 022031, https://doi.org/10.1088/1742-6596/2767/2/022031, 2024. a, b
Aditya, A., Vitulano, M. C., De Tavernier, D., Schrijer, F., van Oudheusden, B., and von Terzi, D.: Experimental study of transonic flow over a wind turbine airfoil, Wind Energ. Sci., 10, 2925–2946, https://doi.org/10.5194/wes-10-2925-2025, 2025. a, b, c
Bertagnolio, F., Sørensen, N., Johansen, J., and Fuglsang, P.: Wind turbine airfoil catalogue, ISBN 87-550-2910-8, 2001. a, b, c, d, e
Brunner, C. E., Kiefer, J., Hansen, M. O. L., and Hultmark, M.: Study of Reynolds number effects on the aerodynamics of a moderately thick airfoil using a high-pressure wind tunnel, Experiments in Fluids, 62, 178, https://doi.org/10.1007/s00348-021-03267-8, 2021. a
Carta, M., Putzu, R., and Ghisu, T.: A comparison of plunging-and pitching-induced deep dynamic stall on an SD7003 airfoil using URANS and LES simulations, Aerosp. Sci. Technol., 121, 107307, https://doi.org/10.1016/j.ast.2021.107307, 2022. a, b
Chellini, S., De Tavernier, D., and von Terzi, D.: Impact of dynamic stall model tailoring on wind turbine loads and performance prediction, J. Phys. Conf. Ser., 2767, 022016, https://doi.org/10.1088/1742-6596/2767/2/022016, 2024. a
Chellini, S., De Tavernier, D., and von Terzi, D.: The experimental characterisation of dynamic stall of the FFA-W3-211 wind turbine airfoil, Wind Energ. Sci. Discuss. [preprint], https://doi.org/10.5194/wes-2025-121, in review, 2025. a
Corke, T. C. and Flint, O. T.: Dynamic stall in pitching airfoils: aerodynamic damping and compressibility effects, Annu. Rev. Fluid Mech., 47, 479–505, https://doi.org/10.1146/annurev-fluid-010814-013632, 2015. a, b
De Tavernier, D. and von Terzi, D.: The emergence of supersonic flow on wind turbines, J. Phys. Conf. Ser., 2265, 042068, https://doi.org/10.1088/1742-6596/2265/4/042068, 2022. a, b, c, d, e, f, g
Fröhlich, J. and von Terzi, D.: Hybrid LES/RANS methods for the simulation of turbulent flows, J. Prog. Aerosp. Sci., 44, 349–377, https://doi.org/10.1016/j.paerosci.2008.05.001, 2008. a, b
Gaertner, E., Rinker, J., Sethuraman, L., Zahle, F., Anderson, B., Barter, G., E., Abbas, N., J., Meng, F., Bortolotti, P., Skrzypinski, W., Scott, G., Feil, R., Bredmose, H., Dykens, K., Shields, M., Allen, C., and Viselli, A.: Definition of the IEA 15-megawatt offshore reference wind turbine, Tech. Rep., National Renewable Energy Laboratory (NREL), Golden, CO https://www.nrel.gov/docs/fy20osti/75698.pdf (last access: 8 July 2025), 2020. a
Gardner, A. D., Jones, A. R., Mulleners, K., Naughton, J. W., and Smith, M. J.: Review of rotating wing dynamic stall: Experiments and flow control, J. Prog. Aerosp. Sci., 137, https://doi.org/10.1016/j.paerosci.2023.100887, 2023. a
Giannelis, N. F., Vio, G. A., and Levinski, O.: A review of recent developments in the understanding of transonic shock buffet, Prog. Aerosp. Sci., 92, 39–84, https://doi.org/10.1016/j.paerosci.2017.05.004, 2017. a
Jung, Y. S., Vijayakumar, G., Ananthan, S., and Baeder, J.: Local correlation-based transition models for high-Reynolds-number wind-turbine airfoils, Wind Energ. Sci., 7, 603–622, https://doi.org/10.5194/wes-7-603-2022, 2022. a
Leishman, J. G.: Challenges in modelling the unsteady aerodynamics of wind turbines, Wind Energy, 5, 85–132, https://doi.org/10.1002/we.62, 2002. a, b
Lovely, D. and Haimes, R.: Shock detection from computational fluid dynamics results, 14th computational fluid dynamics conference, 3285, https://doi.org/10.2514/6.1999-3285, 1999. a
Mangani, L., Buchmayr, M., Darwish, M., and Moukalled, F.: A fully coupled OpenFOAM® solver for transient incompressible turbulent flows in ALE formulation, Numerical Heat Transfer, Part B: Fundamentals, 71, 313–326, https://doi.org/10.1080/10407790.2017.1293969, 2017. a
Menter, F. R.: Two-equation eddy-viscosity turbulence models for engineering applications, AIAA J., 32, 1598–1605, https://doi.org/10.2514/3.12149, 1994. a, b
Moukalled, F., Mangani, L., and Darwish, M.: The finite volume method in computational fluid dynamics: An advanced introduction with OpenFOAM® and Matlab, 103–135, https://doi.org/10.1007/978-3-319-16874-6_5, 2015. a
OpenFOAM Foundation: OpenFOAM, User's Guide, Version 4.1, https://openfoam.org/release/4-1/ (last access: 8 July 2025), 2016. a, b, c
Salomone, T., Piomelli, U., and De Stefano, G., Wall-modeled and hybrid large-eddy simulations of the flow over roughness strips, Fluids, 8, 10, https://doi.org/10.3390/fluids8010010, 2023. a
Sørensen, N. N., Bertagnolio, F., Jost, E., and Lutz, T.: Aerodynamic effects of compressibility for wind turbines at high tip speeds, J. Phys. Conf. Ser., 1037, 022003, https://doi.org/10.1088/1742-6596/1037/2/022003, 2018. a
Vitulano, M. C., De Tavernier, D., De Stefano, G., and von Terzi, D.: Numerical analysis of transonic flow over the FFA-W3-211 wind turbine tip airfoil, Wind Energ. Sci., 10, 103–116, https://doi.org/10.5194/wes-10-103-2025, 2025. a, b, c, d, e, f, g, h, i, j, k, l, m, n, o, p, q, r
Wilcox, D. C.: Turbulence Modelling for CFD, 3rd ed., DCW Industries, Inc.: La Canada, CA, USA, ISBN 978-1-928729-08-2 (1-928729-08-8), 2006. a
Zahle, F., Barlas, T., Lonbaek, K., Bortolotti, P., Zalkind, D., Wang, L., Labuschagne, C., Sethuraman, L., and Barter, G.: Definition of the IEA Wind 22-Megawatt Offshore Reference Wind Turbine, DTU Wind Energy Report E-0243 IEA Wind TCP Task 55 https://doi.org/10.11581/DTU.00000317, 2024. a