the Creative Commons Attribution 4.0 License.
the Creative Commons Attribution 4.0 License.
Ducted wind turbine optimization and sensitivity to rotor position
Nojan Bagheri-Sadeghi
Brian T. Helenbrook
Kenneth D. Visser
The design of a ducted wind turbine modeled using an actuator disc was studied using Reynolds-averaged Navier–Stokes (RANS) computational fluid dynamics (CFD) simulations. The design variables included the rotor thrust coefficient, the angle of attack of the duct cross section, the radial gap between the rotor and the duct, and the axial location of the rotor in the duct. Two different power coefficients, the rotor power coefficient (based on the rotor swept area) and the total power coefficient (based on the exit area of the duct), were used as optimization objectives. The optimal value of thrust coefficients for all designs was nearly constant, having a value between 0.9 and 1. The rotor power coefficient was sensitive to rotor gap but was insensitive to the rotor's axial location for positions ranging from upstream of the throat to nearly half the distance down the duct. Compared to the design that maximized rotor power coefficient, the design for maximal total power coefficient was characterized by a smaller angle of attack, a smaller rotor gap, and a downstream placement of the rotor. The insensitivity of power output to the rotor position implies that a rotor placed further downstream in the duct could produce the same power with a considerably smaller duct exit area and thus a greater total power coefficient. The design for that maximized total power coefficient exceeded Betz's limit with a total power coefficient of 0.67.
Please read the corrigendum first before continuing.
-
Notice on corrigendum
The requested paper has a corresponding corrigendum published. Please read the corrigendum first before downloading the article.
-
Article
(6818 KB)
-
The requested paper has a corresponding corrigendum published. Please read the corrigendum first before downloading the article.
- Article
(6818 KB) - Full-text XML
- Corrigendum
- BibTeX
- EndNote
A properly designed duct placed around a wind turbine can increase power output by increasing the mass flow rate through the rotor. Ducted wind turbines (DWTs) are also called diffuser-augmented wind turbines (DAWT) or shrouded wind turbines. Lilley and Rainbird (1956) performed a one-dimensional momentum analysis of DWTs and concluded that higher expansion ratios of the duct and more subatmospheric pressures at the exit plane of the duct result in higher power outputs. They also suggested wind tunnel tests with screens of different porosities to model the pressure drop across the rotor. Such experimental tests were performed by Igra (1976, 1977, 1981), Foreman et al. (1978), Gilbert et al. (1978), and Gilbert and Foreman (1979). The negative effect of flow separation on the power output of DWTs was observed, and various methods of preventing separation were investigated. Also, experimental tests with real turbines were performed, and the power augmentation of DWTs was demonstrated (Gilbert and Foreman, 1979, 1983; Igra, 1981). As the duct can be considered an annular wing (de Vries, 1979) with higher lift, meaning more suction and circulation, high-lift airfoils were used from early experimental studies.
Using lifting line theory for the rotor and modeling the duct as a superposition of vortex and source rings, Koras and Georgalas (1988) and Georgalas et al. (1991) studied the power output of DWTs with airfoil cross sections and large rotor gaps (the clearance between the tip of the rotor and the duct) as a function of several design variables including the angle of attack of the duct cross section, the chord length of the duct, the maximum camber of the duct cross section, and the relative position of the rotor with respect to the maximum camber point of the duct cross section. They found a linear increase of power with duct chord length and angle of attack of the duct cross section. They also concluded that the effect of rotor position on the power output was weak. Politis and Koras (1995) extended the previous work to DWTs with any rotor gap.
Axisymmetric computational fluid dynamics (CFD) models were used (Phillips et al., 1999, 2002 and Phillips, 2003) to improve the design of the first full-scale DWT built (the Vortec 7). Hansen et al. (2000) performed a CFD study of DWTs and used the k−ω shear stress transport (SST) turbulence model for the axisymmetric model as it is more sensitive to adverse pressure gradients (Menter, 1994) and can be more accurate in predicting flow separation. Another similar CFD study was performed by Abe and Ohya (2004), where effects of rotor loading and the incidence angle of the duct on power output of a flanged DWT were examined and compared with experimental data. Ohya et al. (2012) and Kardous et al. (2013) did further CFD simulations of the flanged DWT with the rotor modeled as an actuator disc and found good agreement with wind tunnel data.
Van Bussel (1999, 2007) analyzed DWTs using 1-D momentum theory and concluded that optimal coefficient of thrust in a DWT is similar to an open rotor equal to 8∕9. He also concluded that experimental power coefficients based on the exit area of the duct (the total power coefficient) above 0.5 have not been achieved yet and that very significant back pressure reductions are needed to achieve values of total power coefficients significantly above Betz's limit. Jamieson (2009) also used a similar momentum analysis and derived the same value of 8∕9 for optimal loading on the rotor and noted that it should be independent of duct design. Werle and Presz (2008) in another study based on 1-D momentum analysis found that the maximum attainable power from a DWT is determined by shroud force coefficient, , where Fs is the axial force on the duct (shroud) and T is the thrust of the rotor.
Hjort and Larsen (2014) used an axisymmetric CFD model with an actuator disc modeling the wind turbine for a multi-element DWT. They characterized the performance of the DWT using power coefficients based on the exit area of the duct with values well above Betz's limit. Aranake and Duraisamy (2017) also utilized an axisymmetric Reynolds-averaged Navier–Stokes (RANS) solver with an actuator disc model for the turbine to optimize the airfoils used for the duct cross section and blades and verified the result with 3-D simulations. Venters et al. (2017) investigated the optimal design of a DWT using the same approach (i.e., using a RANS solver and actuator disc model). The design variables investigated were the rotor loading, the angle of attack of the duct cross section, the rotor gap, and the axial position of the rotor. They used a response surface fitted to a number of design point calculations, and then the surface was searched using the NLPQL (Nonlinear Programming by Quadratic Lagrangian) algorithm (Schittkowski, 1986). They concluded that rotor loading is the main factor defining the performance of the DWT with the coefficient of thrust almost constant (close to 1) for different duct sizes. The power output of DWT was sensitive to the angle of attack of the duct cross section. However, the results for effect of the rotor gap and axial position of rotor were not conclusive. This paper improves on the work of Venters et al. (2017) with a more accurate CFD model, a direct optimization technique, and a wider range of design variables. One of the goals of this study is to continue the investigation of Venters et al. (2017) into how the objective of the optimization changes the optimal design. Specifically, Venters et al. (2017) examined two objective functions, the rotor power coefficient and the total power coefficient. Their results indicated that the optimal design changes significantly depending on the objective function, but the results for optimizing the total power coefficient did not converge to an optimal solution. The goal of this work is to identify an optimal configuration for this objective function.
The paper is organized as follows. The details of the CFD model along with an evaluation of two different pattern search optimization methods are given in Sect. 2. Optimization results with the objective of maximizing the rotor power coefficient are given in Sect. 3, and the variation of the rotor power coefficient and flow field with different design variables is presented. In Sect. 4, optimization results are presented for the objective of maximizing the total power coefficient. These results are compared with the goal of understanding how the optimal axial position of the rotor depends on the optimization objective.
A two-dimensional axisymmetric numerical model was developed in ANSYS Fluent 17.1 to simulate the flow field of a DWT. The wind turbine rotor was modeled as an actuator disc with a pressure drop, Δp, given by
where ρ is the air density and CT, rotor is the thrust coefficient based on the axial velocity, Vz, at the rotor. The thrust force, T, is given by
where D is the rotor diameter. The extracted power, P, is given by
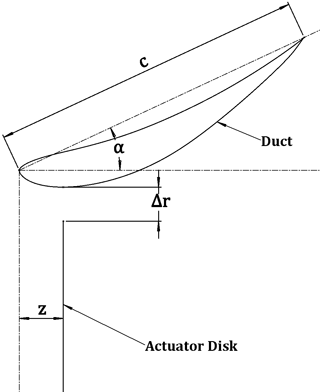
Clearly, with an actuator disc model, rotor blade efficiency losses are not considered. The design variables, shown in Fig. 1, were the thrust coefficient of the rotor , the angle of attack of the duct cross section α, the radial gap of the rotor Δr∕D, and the axial location of the rotor z∕c. Because the thrust coefficient based on the freestream velocity, V∞, is easier to interpret, most results are presented in terms of . All results are made nondimensional by the rotor diameter, the freestream velocity, and the fluid density. The conditions studied correspond to air with a free-stream velocity of 11 m s−1, a rotor diameter of 2.5 m, and a duct chord length c such that 27.6 %. This corresponds to Re and Re, where ReD and Rec are the Reynolds numbers based on the rotor diameter and duct chord length, respectively. An Eppler E423 airfoil was chosen as the cross section of the duct. This airfoil is designed to create high lift and operate at low Reynolds numbers. The operating range of Eppler E423 is Re (Selig et al., 1996). Two power coefficients, and , were used as objective functions for the optimizations and to compare the performance of different DWT designs.
The domain and mesh used for the simulations are shown in Fig. 2. These were defined to ensure mesh independence for power coefficients as the design variables were varied. The domain extended 15 duct chord lengths upstream of the rotor and 25 chord lengths downstream. Numerical tests showed that this domain size gave power coefficient values that were independent of the domain size to two significant digits. As all optimizations were done with the same domain, this was deemed large enough to accurately calculate changes in the solutions with the design variables. The shape of the domain at its top made a distinct transition between inflow and outflow boundaries, which eliminated convergence issues due to reverse flow through outlet boundaries. The reverse-flow issue occurred when the inlet and outlet were smoothly connected. The mesh of Fig. 2 consisted of about 500 000 elements. The duct boundary layer mesh had a growth rate of 1.1, and the first mesh point was set at . The boundary layer thickness was calculated as a function of Rec for each case, and enough inflation layers were used to span the entire boundary layer. The quality-based smoothing option in Fluent was used to improve the mesh quality.
ANSYS Fluent's k−ω SST turbulence model was used to solve the incompressible Navier–Stokes equations. The pressure-based solver was chosen with the coupled scheme used for the pressure–velocity coupling. Gradients were calculated using the Green–Gauss node-based method, and second-order discretization schemes were used for pressure, momentum, turbulent kinetic energy, and specific dissipation rate. The output power, thrust, and drag coefficient of the duct were calculated and monitored at each iteration to ensure convergence.
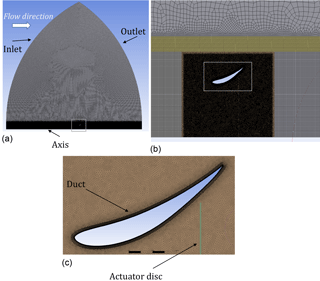
Figure 2The domain and mesh (a); the zoomed-in view of mesh showing the structured mesh upstream and downstream of the duct (b); and the more-zoomed-in view of mesh showing the boundary layer mesh, the structured mesh of the actuator disc, and the unstructured triangular mesh between duct and the actuator disc.
Optimization techniques
For most of the optimization results, a pattern search method (Powell, 1964) was used to find the optimal design of the DWT. Optimizations were first performed with CP as the objective function and then with CP, total as the objective function. The optimization for both objective functions started from the same set of design variables (; α=25∘; ; and ). In our implementation of Powell's method a quadratic interpolation of the function values is used to identify the optimal step length to move the design point in the coordinate or pattern directions. The optimization was stopped when the improvements obtained from the optimization methods were within a specified tolerance. The termination criterion was , where CP,0 is the initial value of CP at the beginning of a search cycle. The design variables were then varied to determine the sensitivity of the objective function to the design parameters in the vicinity of the optimal design point.
Powell's method is known to be slow converging for objective functions that are discontinuous. As shown in Sect. 3 and Sect. 4, it was observed that the optimal design points were on the verge of flow separation along the duct airfoil and that separation was accompanied with a large drop in power output. Therefore, the objective functions were nearly discontinuous at the optimal design point. With such an objective function, the optimizer worked inefficiently in finding the optimal step length. Also, when the optimizer moved the design point close to a discontinuity, it moved away from that point very slowly. Figure 3a shows the history of an optimization using Powell's method with fixed and the design variables being CT, rotor, α and Δr∕D. The optimization method was stopped at about 100 iterations without meeting its termination tolerance. At that point the search algorithm was jumping around significantly. This is shown in Fig. 3b, which shows the search history of CT,α points. The optimal point is shown as a red triangle which occurs at CT≈1 and α≈27∘. The points close to each other in Powell's method that are not near the optimum point are design points close to separation where the optimizer had trouble finding the optimal step length and was stuck close to the function discontinuity. The maximum Cp obtained by the search method was 1.031.
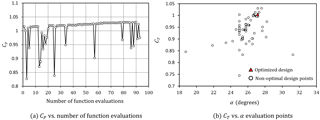
Figure 3Optimization of CP using Powell's method for z∕c fixed at 0.05. The red triangle denotes the optimized solution.
The same problem was subsequently approached with the Hooke and Jeeves method (Hooke and Jeeves, 1961) with the same termination criterion and starting point. The optimization history is shown in Fig. 4a. This time the optimization algorithm reached the optimal design in only 16 function evaluations and reached the termination criterion in 32 function evaluations. In addition, a better design with CP=1.053 was found. The more efficient performance of the Hooke and Jeeves method can also be observed in Fig. 4b, which shows the (CT, α) search points. The optimum point is again shown as a red triangle and occurred at CT=0.97 and α=30∘. Because the Hooke and Jeeves method does not fit an analytic function to the function values, it did not face the same difficulty when it got close to sharp variations in the objective function.
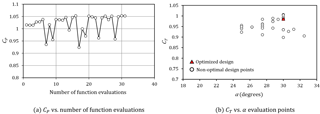
Figure 4Optimization of CP using Hooke and Jeeves' method for z∕c fixed at 0.05. The red triangle denotes the optimized solution.
Although the Hooke and Jeeves method was more efficient, unless stated otherwise, most of the results obtained below were found using Powell's method as this was the first method implemented. As this method did not always satisfy the optimization stopping criterion, we call the optimized designs “near-optimum” points. The search history shown in Fig. 3b is fairly typical for the cases shown below. For each search direction, function evaluations at design points in the search directions of roughly ±1 % were evaluated with no increases in the optimal value. This, however, does not preclude the possibility of a slow variation along a ridge in the optimization function, which is essentially the reason we see 5 % differences in the optimized design variables between the two different optimization methods for this example. In many of the figures below, individual design variables are varied around the optimal point to give a further sense of the sensitivity to the design variables.
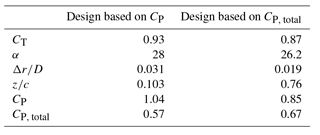
The middle column of Table 1 shows the near-optimal design found with Powell's method when optimizing for maximum CP. The design values are close to what was observed by Venters et al. (2017). Venters et al. (2017) used a smaller chord length for the duct ( %) and a different turbulence model (k−ϵ realizable) and obtained a maximal value for CP=1.00 at CT=1.08 and α=37.5∘. Our results predicted a lower value of optimal CT and α, which could be because of the more accurate turbulence model as the k−ω SST turbulence model is known to be more accurate in prediction of flows with significant adverse pressure gradient and flow separation (Menter, 1994).
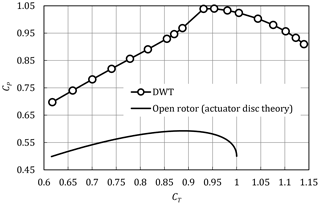
The results for the variation of CP with CT are shown in Fig. 5. The highest CP in this plot is at CT≈0.93. When using the Hooke and Jeeves optimization, optimal CT values very close to 1 were observed, which is closer to that observed by Venters. One-dimensional momentum analysis done by van Bussel (1999) and Jamieson (2009) predicted that the optimal CT for a ducted turbine would be independent of duct design and have a value of 8∕9, which is the same as that of an open rotor. The plot of Fig. 5 also shows the curve for an open rotor as predicted by actuator disc theory. Similar to an open rotor, increasing the loading on the rotor beyond the near-optimal design point of the DWT reduced the mass flow rate through the rotor and thus its output power. Also similar to an open rotor, at loadings less than the near-optimal design point, the flow rate through the rotor was larger, but the pressure drop was too low to obtain optimal power. In the ducted case, however, the reduction in CT had an additional effect, which was to cause flow separation in the duct. As shown next, there is a strong coupling between the coefficient of thrust, the angle of attack of the duct, and separation. Increasing the angle of attack or decreasing the coefficient of thrust can lead to separation.
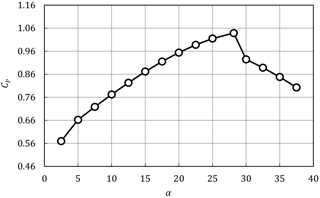
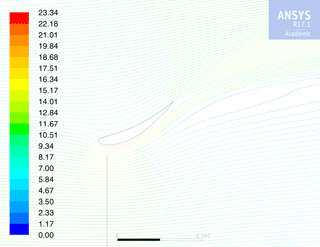
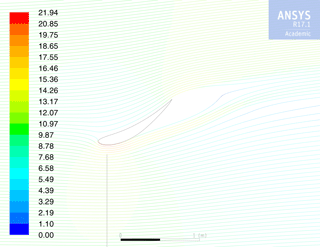
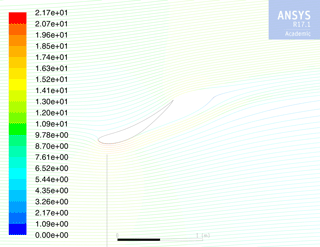
The effect of changing α is shown in Fig. 6. When α was increased beyond the near-optimal design point, a large flow separation resulted, which was accompanied by a sharp decrease in the output power. The flow field of the near-optimal design is shown in Fig. 7. The effect of increasing α on the flow field is shown in Fig. 8. Comparing the two flow fields, it is apparent that the small increase in angle of attack leads to a large separated region at the trailing edge of the airfoil. The separated region effectively reduces the exit area area of the duct, resulting in the capture of a smaller upstream flow area and a smaller power extraction. Similarly, reducing α from the near-optimal design also resulted in a decrease of CP because of the decreased exit area.
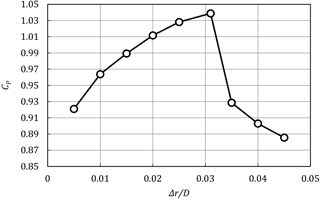
Likewise, as shown in Fig. 9, if rotor gap, Δr∕D, was increased beyond the near-optimal design point (while keeping other design variables constant), a large power drop was observed due to flow separation and the streamlines appeared similar to Fig. 8. Decreasing Δr∕D also reduced the power output of the rotor. Reduction of the rotor gap results in a decrease in the exit area of the duct, which could be the reason for the reduction in power.
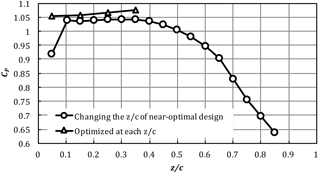
The dependence of CP on the axial position of the rotor, z∕c, can be seen from Fig. 10. As z∕c was varied from the near-optimal design, the power output did not change significantly. To better understand the effect of axial location on the power output of the rotor, the design was optimized using the Hooke and Jeeves pattern search method at a number of fixed z∕c values from 0.05 to 0.35. The results shown in Fig. 10 confirm that CP within the range of z∕c values shown is not very sensitive to the axial position of the rotor. The higher values of CP shown are due to better performance of the Hooke and Jeeves search algorithm as discussed in Sect. 2.1. This result shows that one can place the rotor anywhere from upstream of the throat to halfway down the duct and obtain similar performance.
The last column of Table 1 shows the near-optimal design parameters when CP, total was the objective function, and Fig. 11 shows the geometry and flow field of the near-optimal design. Compared to the design for optimal CP, when a DWT was designed for optimal CP, total, the values of α and Δr∕D were decreased, whereas z∕c was increased. All of these changes have a similar effect: to decrease the exit area of the duct, which is in the denominator of the objective function.
The value of CT of the near-optimal design (0.87) was close to the optimal CT when CP was optimized using Powell's method (0.93). It is also close to the optimal value for an open rotor which van Bussel (1999) and Jamieson (2009) predicted. However, there is some ambiguity in the preciseness of this value because both Venters and the Hooke and Jeeves optimization showed values near 1.00 when optimizing CP.
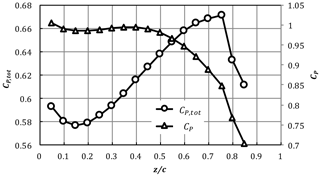
The variation of CP, total with z∕c is presented in Fig. 12. All other design variables were fixed at the near-optimal design point for CP, total as given in Table 1 as z∕c was varied. Since CP, total depends on both power output and the exit area of the duct, the values of CP at each design point are also shown so that variations due to changes in exit area or power can be better understood. Similar to Fig. 10 the power of the rotor, Cp, is not very sensitive to z∕c when . The exit area decreases as z∕c is increased, which makes CP, total increase as the rotor is moved towards the exit of the duct. When z∕c is increased past 0.5, the power extracted decreases, but CP, total continues to increase because of the decreasing exit area. Just past the optimal value of z∕c the flow separates, leading to a sharp decrease in both CP and CP, total.
The best value obtained here for was above Betz's limit and was also higher than the previous result by Venters et al. (2017) of 0.621. Thus, it is possible to extract more power per unit device area using a ducted turbine than when using an open rotor. This is in agreement with theoretical predictions by van Bussel (2007) at high back pressure reductions. To obtain this value of CP, total, the rotor must be at the rear of the duct.
The optimal design of a ducted wind turbine characterized by the thrust coefficient of the rotor CT, rotor, the angle of attack of the duct cross section α, the rotor gap Δr∕D, and the axial location of the rotor z∕c was investigated. The optimal design was significantly different when different power coefficients CP (based on rotor area) and CP, total (based on the exit area of the duct) were used as design objectives. Compared to the design for optimal CP, the design for optimal CP, total resulted in a duct with smaller α and Δr∕D and a rotor placed at the rear of the duct rather than towards the front. This type of design has been experimentally investigated in Kanya and Visser (2018).
The design for optimal CP, total attained , which was above Betz's limit. This optimal design was on the brink of flow separation; increases in α, decreases in CT, or increases in Δr∕D all resulted in flow separation and a sharp decrease in power output. The Hooke and Jeeves optimization method was found to be more efficient in finding the optimal designs than Powell's method, which was attributed to this sharp variation in CP around the design point.
Although optimal design data obtained from Powell's method should represent characteristics of a good design based on CP or CP, total, due to convergence issues they should be considered approximate. Also at higher Reynolds numbers (i.e., with larger DWTs) the flow field and separation characteristics of the DWT may change, which in turn can change the characteristics of the optimal design. Additionally, including effect like swirl and center body in the CFD model should give more realistic results and can change the optimal design.
A set of ANSYS Fluent case and data files is publicly available online (Bagheri-Sadeghi, 2018).
The authors declare that they have no conflict of interest.
This article is part of the special issue “Wind Energy Science Conference 2017”. It is a result of the Wind Energy Science Conference 2017, Lyngby, Copenhagen, Denmark, 26–29 June 2017.
We are grateful for the funding support of this project from the New York
State Energy and Research Development Authority (NYSERDA) through NEXUS-NY.
We would also like to thank Ken Willmert of Clarkson University for
providing the numerical implementation of Powell's method.
Edited by: Jens Nørkær Sørensen
Reviewed by: two anonymous referees
Abe, K.-i. and Ohya, Y.: An Investigation of Flow Fields around Flanged Diffusers Using CFD, J. Wind Eng. Ind. Aerod., 92, 315–330, https://doi.org/10.1016/j.jweia.2003.12.003, 2004. a
Aranake, A. and Duraisamy, K.: Aerodynamic Optimization of Shrouded Wind Turbines, Wind Energy, 20, 877–889, https://doi.org/10.1002/we.2068, we.2068, 2017. a
Bagheri-Sadeghi, N., Helenbrook, B. T., and Visser, K. D.: Data associated with publication “Ducted wind turbine optimization and sensitivity to rotor position”, https://doi.org/10.17605/OSF.IO/XFSZM, 2018.
de Vries, O.: Fluid Dynamic Aspects of Wind Energy Conversion, Advisory Group for Aerospace Research and Development (AGARD), Neuilly-sur-Seine, France, Technical Report no. 243, 1979. a
Foreman, K. M., Gilbert, B., and Oman, R. A.: Diffuser Augmentation of Wind Turbines, Sol. Energy, 20, 305–311, https://doi.org/10.1016/0038-092X(78)90122-6, 1978. a
Georgalas, C. G., Koras, A. D., and Raptis, S. N.: Parametrization of the Power Enhancement Calculated for Ducted Rotors with Large Tip Clearance, Wind Engineering, 15, 128–136, http://www.jstor.org/stable/43749450, 1991. a
Gilbert, B. L. and Foreman, K. M.: Experimental Demonstration of the Diffuser-Augmented Wind Turbine Concept, J. Energy, 3, 235–240, https://doi.org/10.2514/3.48002, 1979. a, b
Gilbert, B. L. and Foreman, K. M.: Experiments With a Diffuser-Augmented Model Wind Turbine, J. Energ. Resour.-ASME, 105, 46–53, https://doi.org/10.1115/1.3230875, 1983. a
Gilbert, B. L., Oman, R. A., and Foreman, K. M.: Fluid Dynamics of Diffuser-Augmented Wind Turbines, J. Energy, 2, 368–374, https://doi.org/10.2514/3.47988, 1978. a
Hansen, M. O. L., Sørensen, N. N., and Flay, R. G. J.: Effect of Placing a Diffuser around a Wind Turbine, Wind Energy, 3, 207–213, https://doi.org/10.1002/we.37, 2000. a
Hjort, S. and Larsen, H.: A Multi-Element Diffuser Augmented Wind Turbine, Energies, 7, 3256–3281, https://doi.org/10.3390/en7053256, 2014. a
Hooke, R. and Jeeves, T. A.: “Direct Search” Solution of Numerical and Statistical Problems, J. ACM, 8, 212–229, https://doi.org/10.1145/321062.321069, 1961. a
Igra, O.: Shrouds for Aerogenerators, AIAA Journal, 14, 1481–1483, https://doi.org/10.2514/3.61486, 1976. a
Igra, O.: Compact Shrouds for Wind Turbines, Energ. Convers., 16, 149–157, https://doi.org/10.1016/0013-7480(77)90022-5, 1977. a
Igra, O.: Research and Development for Shrouded Wind Turbines, Energ. Convers. Manage., 21, 13–48, https://doi.org/10.1016/0196-8904(81)90005-4, 1981. a, b
Jamieson, P. M.: Beating Betz: Energy Extraction Limits in a Constrained Flow Field, J. Sol. Energ.-T. ASME, 131, 031008-1–031008-6, https://doi.org/10.1115/1.3139143, 2009. a, b, c
Kanya, B. and Visser, K. D.: Experimental Validation of a Ducted Wind Turbine Design Strategy, Wind Energy Science Journal, in review, 2018. a
Kardous, M., Chaker, R., Aloui, F., and Nasrallah, S. B.: On the Dependence of an Empty Flanged Diffuser Performance on Flange Height: Numerical Simulations and PIV Visualizations, Renew. Energ., 56, 123–128, https://doi.org/10.1016/j.renene.2012.09.061, 2013. a
Koras, A. D. and Georgalas, C. G.: Calculation of the Influence of Annular Augmentors on the Performance of a Wind Rotor, Wind Engineering, 12, 257–267, http://www.jstor.org/stable/43750035, 1988. a
Lilley, G. and Rainbird, W.: A Preliminary Report on the Design and Performance of Ducted Windmills, Tech. rep., College of Aeronautics, Cranfield, UK, 1956. a
Menter, F. R.: Two-Equation Eddy-Viscosity Turbulence Models for Engineering Applications, AIAA Journal, 32, 1598–1605, https://doi.org/10.2514/3.12149, 1994. a, b
Ohya, Y., Uchida, T., Karasudani, T., Hasegawa, M., and Kume, H.: Numerical Studies of Flow around a Wind Turbine Equipped with a Flanged-Diffuser Shroud Using an Actuator-Disk Model, Wind Engineering, 36, 455–472, https://doi.org/10.1260/0309-524X.36.4.455, 2012. a
Phillips, D., Flay, R., and Nash, T.: Aerodynamic Analysis and Monitoring of the Vortec 7 Diffuser-Augmented Wind Turbine, Transactions of the Institution of Professional Engineers New Zealand: Electrical/Mechanical/Chemical Engineering Section, 26, 13–19, 1999. a
Phillips, D., Richards, P., and Flay, R.: CFD modelling and the development of the diffuser augmented wind turbine, Wind Struct., 5, 267–276, 2002. a
Phillips, D. G.: An Investigation on Diffuser Augmented Wind Turbine Design, PhD thesis, The University of Auckland, Auckland, New Zealand, 2003. a
Politis, G. K. and Koras, A. D.: A Performance Prediction Method for Ducted Medium Loaded Horizontal Axis Windturbines, Wind Engineering, 19, 273–288, http://www.jstor.org/stable/43749587, 1995. a
Powell, M. J. D.: An Efficient Method for Finding the Minimum of a Function of Several Variables without Calculating Derivatives, Computer J., 7, 155–162, https://doi.org/10.1093/comjnl/7.2.155, 1964. a
Schittkowski, K.: NLPQL: A fortran subroutine solving constrained nonlinear programming problems, Ann. Oper. Res., 5, 485–500, https://doi.org/10.1007/BF02022087, 1986. a
Selig, M. S., Guglielmo, J. J., Broeren, A. P., and Giguere, P.: Summary of Low-Speed Airfoil Data – Vol. 2, SoarTech Publications, Virginia Beach, VA, USA, 1996. a
van Bussel, D. G. J. W.: The Science of Making More Torque from Wind: Diffuser Experiments and Theory Revisited, J. Phys. Conf. Ser., 75, 012010, http://stacks.iop.org/1742-6596/75/i=1/a=012010, 2007. a, b
van Bussel, G.: An Assessment of the Performance of Diffuser Augmented Wind Turbines (DAWT's), in: Proceedings of the Third ASME/JSME Joint Fluids Engineering Conference, 18–23 July 1999, San Francisco, CA, USA, 1999. a, b, c
Venters, R., Helenbrook, B. T., and Visser, K. D.: Ducted Wind Turbine Optimization, J. Sol. Energ.-T. ASME, 140, 011005–011005–8, https://doi.org/10.1115/1.4037741, 2017. a, b, c, d, e, f, g
Werle, M. J. and Presz, W. M.: Ducted Wind/Water Turbines and Propellers Revisited, J. Propul. Power, 24, 1146–1150, https://doi.org/10.2514/1.37134, 2008. a
The requested paper has a corresponding corrigendum published. Please read the corrigendum first before downloading the article.
- Article
(6818 KB) - Full-text XML


