the Creative Commons Attribution 4.0 License.
the Creative Commons Attribution 4.0 License.
 | 01 Jun 2018
Wind tunnel experiments on wind turbine wakes in yaw: effects of inflow turbulence and shear
Jan Bartl
Franz Mühle
Jannik Schottler
Lars Sætran
Joachim Peinke
Muyiwa Adaramola
Michael Hölling
The wake characteristics behind a yawed model wind turbine exposed to different customized inflow conditions are investigated. Laser Doppler anemometry is used to measure the wake flow in two planes at x∕D = 3 and x∕D = 6, while the turbine yaw angle is varied from 30∘ to 0∘ to +30∘. The objective is to assess the influence of grid-generated inflow turbulence and shear on the mean and turbulent flow components.
The wake flow is observed to be asymmetric with respect to negative and positive yaw angles. A counter-rotating vortex pair is detected creating a kidney-shaped velocity deficit for all inflow conditions. Exposing the rotor to non-uniform highly turbulent shear inflow changes the mean and turbulent wake characteristics only insignificantly. At low inflow turbulence the curled wake shape and wake center deflection are more pronounced than at high inflow turbulence. For a yawed turbine the rotor-generated turbulence profiles peak in regions of strong mean velocity gradients, while the levels of peak turbulence decrease at approximately the same rate as the rotor thrust.
- Article
(5181 KB) - Full-text XML
- Companion paper
- BibTeX
- EndNote


In light of the steadily increasing worldwide use of wind energy, optimized control for wind farms has become a focus area of research. The reduced wind speeds in the wake leave significantly less energy for downstream turbines, causing wind farm power losses up to 20 % (Barthelmie et al., 2010). At the same time increased turbulence levels in the wake lead to higher fatigue loads on downstream rotors, which experience an increased probability for component failure (Thomsen and Sørensen, 1999). In order to mitigate these unfavorable consequences of wake impingement, different wind farm control methods have been suggested for optimizing the total power output and minimizing loads on a wind farm's individual turbines (Gebraad et al., 2015; Knudsen et al., 2014).
These methods include the reduction of the upstream turbine's axial induction by varying its torque or blade pitch angle (Annoni et al., 2016; Bartl and Sætran, 2016) as well as wake redirection techniques, which intentionally apply a tilted thrust vector on the front row rotors. In Fleming et al. (2015) different wake deflection mechanisms have been discussed with respect to higher wind farm power production and rotor loads. As individual pitch control has been shown to cause high structural loads and current turbine designs do not feature a degree of freedom in the tilt direction, yaw actuation has been concluded to be a very promising technique.
For the development of wake deflection strategies by yaw misalignment, the characteristics of the mean and turbulent wake flow behind a yawed turbine have to be understood in detail. Besides the turbine's geometry and operational state, the wake flow is strongly dependent on the atmospheric conditions which represent the inflow state to the turbine. The stability of the atmospheric boundary layer can be described by height-dependent distributions of potential temperature, wind direction (veer), velocity distribution (shear) and turbulence intensity (TI) (Vollmer et al., 2016). As it is rather impossible to simulate realistic atmospheric conditions in a wind tunnel environment, these parameters have to be investigated separately. Therefore, the present study investigates the dependency of the wake flow behind yawed turbines for different customized inflow conditions. The wind tunnel study intends to shed light on the effects of non-uniform shear and inflow turbulence levels on the wake characteristics. Wind tunnel wake experiments have the advantage of being conducted in a controlled laboratory environment. Thus, intentional variations of inflow conditions and turbine operating points can help to gain a deeper understanding of the effects on the wake flow. They furthermore can serve as validation data of numerical results and a base for the fine tuning of engineering wake models.
An early set of experimental studies on the wake of a yawed turbine was reported by Grant et al. (1997), in which they used optical methods in the wake behind a model turbine of D = 0.90 m to track the tip vortices and calculate wake deflection and expansion. In a follow-up study, Grant and Parkin (2000) presented phase-locked particle image velocimetry (PIV) measurements in the wake. The measured circulation in the wake showed clear asymmetries in the wake shape for positive and negative yaw angles. An asymmetric wake was also reported by Haans et al. (2005), who found non-symmetric tip vortex locations behind a yawed model turbine of D = 1.20 m. Another yaw experiment was conducted by Medici and Alfredsson (2006) on a small model turbine of D = 0.12 m. They reported a clear cross-stream flow component deflecting the wake laterally. These experimental results were later used by Jiménez et al. (2010) as verification data for a wake deflection model for yawed turbines. Based on large-eddy simulations (LESs) around a yawed actuator disc, they developed a simple analytical model that is able to predict the wake skew angle and wake velocity deficit in the far wake. An engineering model for the axially induced velocity on a yawed turbine was developed by Schepers (1999), which was based on inflow measurements in front of different yawed turbines.
An extensive study of flow and load characteristics on a yawed wind turbine rotor on a D = 4.50 m rotor was presented by Schepers et al. (2014). In the so-called Mexnext project, a comparison of 20 different computations with detailed PIV and load measurements revealed modeling deficiencies while simultaneously shedding light on complex instationary flow at the rotor. The topic of utilizing yaw misalignment for improved wind farm control was thoroughly investigated by Fleming et al. (2015) and Gebraad et al. (2016). They analyzed wake mitigation strategies by using both a parametric wake model and the advanced computational fluid dynamics (CFD) tool SOWFA. A recent follow-up study by Fleming et al. (2017) focused on large-scale flow structures in the wake behind one turbine and multiple aligned turbines and addressed a wake deflection behind a non-yawed downstream impinged by a partial wake of a yawed upstream turbine. In another LES investigation, Vollmer et al. (2016) studied the influence of three atmospheric stability classes on the wake characteristics behind a yawed turbine rotor. A strong dependency of the wake shape and deflection on the stability was found, showing significantly higher wake deflection for a stable atmosphere than for neutral or convective conditions. Another LES study on yaw misalignment was performed by Wang et al. (2017), who highlighted the importance of including nacelle and tower structures in the computational model when comparing with experimental results.
Yaw-angle-dependent turbine performance and near-wake measurements were performed by Krogstad and Adaramola (2012). They found a power decrease proportional to cos3(γ) and showed that the near-wake deflection is dependent on the turbine's tip speed ratio. A combined experimental and computational wake study for a larger range of downstream distances was recently reported by Howland et al. (2016). The wake behind a yawed small drag disc of D = 0.03 m was analyzed, describing the formation of a curled wake shape by a counter-rotating vortex pair. The influence of wake swirl, ground effect and turbulent diffusion on the formation mechanisms of this counter-rotating vortex pair was systematically investigated by Berdowski et al. (2018) using a free-wake vortex filament method. An extensive contribution to the field of yawed turbine wakes was recently made by Bastankhah and Porté-Agel (2016). In an experimental PIV study on a model turbine of D = 0.15 m an asymmetric flow entrainment in the wake by both mean and turbulent momentum fluxes was shown. Moreover, an analytical model for the far wake of a yawed turbine was developed based on self-similar velocity and skew angle distributions.
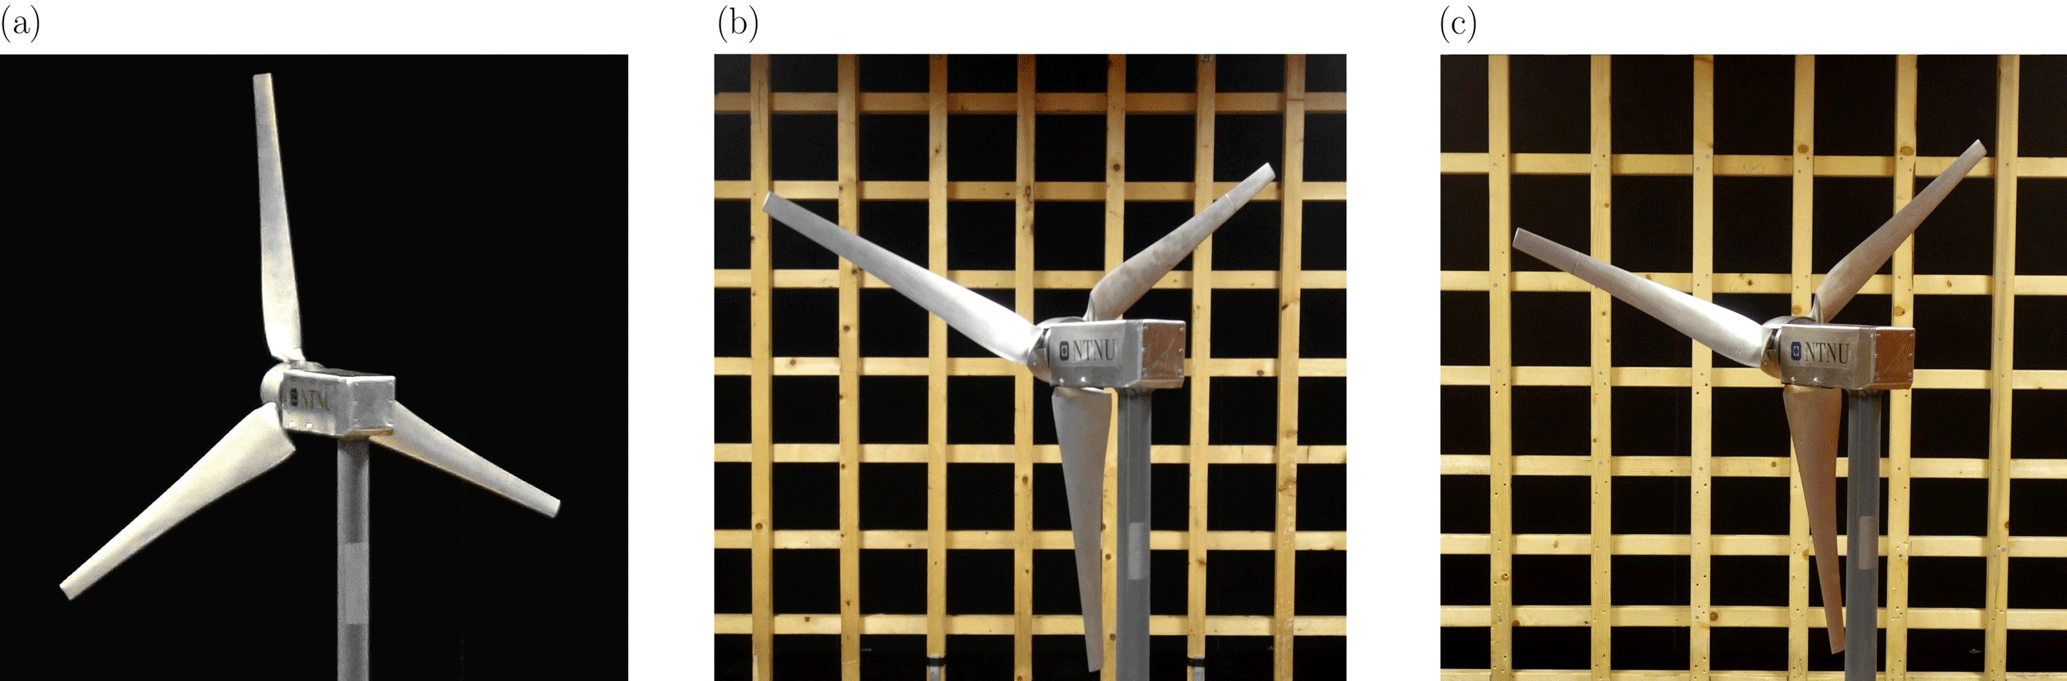
Figure 1Yawed model wind turbine exposed to different inflow conditions: (a) TIA = 0.23 %, uniform shear (b) TIB = 10.0 %, uniform shear; and (c) TIC = 10.0 %, non-uniform shear.
An experimental study on the interaction of two model wind turbines was conducted by Schottler et al. (2016) showing clear asymmetries of the downstream turbine power output with respect to the upstream turbine's positive or negative yaw angle. In a follow-up study the asymmetry was ascribed to a strong shear in the inflow, which caused an asymmetry in the opposite direction when the sheared inflow was vertically inverted (Schottler et al., 2017a). These studies encouraged a more detailed investigation of the inflow-dependent wake flow behind a yawed turbine. As for the present study, we aim to close the gap between turbine interactions for yaw-controlled wind farms by presenting high-fidelity wake measurement data at controlled inflow conditions. The influence of turbulence and shear in the inflow on the wake's shape, deflection and symmetry with respect to yaw angle is quantified. This work is part of a joint experimental campaign by the Norwegian University of Science and Technology (NTNU) in Trondheim and ForWind in Oldenburg. While this paper examines the influence of varying inflow conditions on the wake of one model wind turbine, a second paper by Schottler et al. (2018) compares the wake characteristics behind two different model wind turbines exposed to one inflow only while also adding two-point statistics to the evaluation.
2.1 Turbine model, inflow and operating conditions
Turbine model
The wind turbine model used for this study has a rotor diameter of D = 0.90 m with a hub diameter of Dhub = 0.090 m. The tower and nacelle structure of the turbine is a slimmer re-design of the turbines previously used in Bartl and Sætran (2017). The tower thickness and the nacelle length have been significantly reduced in size in order to minimize their impact on the wake flow behind the yawed rotor. Photographs of the turbine exposed to different inflow conditions are shown in Fig. 1. The blades are milled in aluminum and based on an NREL S826 airfoil, which was originally designed at the National Renewable Energy Laboratory (NREL). The rotor turns in the counterclockwise direction when observed from an upstream point of view. The rotation is controlled via an electric servomotor of the type 400 W Panasonic LIQI, which is located inside the nacelle. The frequency-controlled motor ensures a rotation at constant rotational speed, while the excessive power is burned off in an external resistor. The blade pitch angle was fixed to for the entire experiment.
Scaling and blockage
The experiments were performed at the low-speed wind tunnel at NTNU in Trondheim, Norway. The test section is 11.15 m long with an inlet cross section of 2.71 m × 1.81 m (width × height). Compared to a full-scale wind turbine, the model size is scaled down at a geometrical scaling ratio of approximately 1:100, resulting in a mismatch in Reynolds number in the model experiment. The turbine is operated at a Reynolds number of approximately Retip≈105 at the blade tip, which is more than one full order of magnitude lower than for full-scale turbines. Retip is based on the chord length at the blade tip and the effective velocity during turbine operation.
Furthermore, the rotor-swept area of the turbine model blocks 12.8 % of the wind tunnel's cross-sectional area. The wind tunnel height is approximately twice the rotor diameter, while its width measures about 3 times the diameter. Consequently, there is about one full diameter of space for lateral wake deflection on each side behind the rotor. However, an influence of the wind tunnel walls on the wake expansion and deflection cannot be completely excluded.
Inflow conditions
The measurements are performed for three different stationary inflow conditions as listed in Table 1. As shown in Fig. 1, inflows B and C are generated by static grids at the inlet. The streamwise mean velocities and turbulence intensity levels measured in the empty wind tunnel at the turbine position (x∕D = 0) and wake measurement locations (x∕D = 3 and x∕D = 6) are presented in Fig. 2.
Table 1Characteristics of the three different investigated inflow conditions.
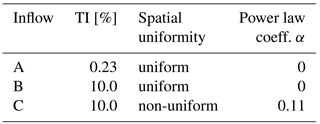
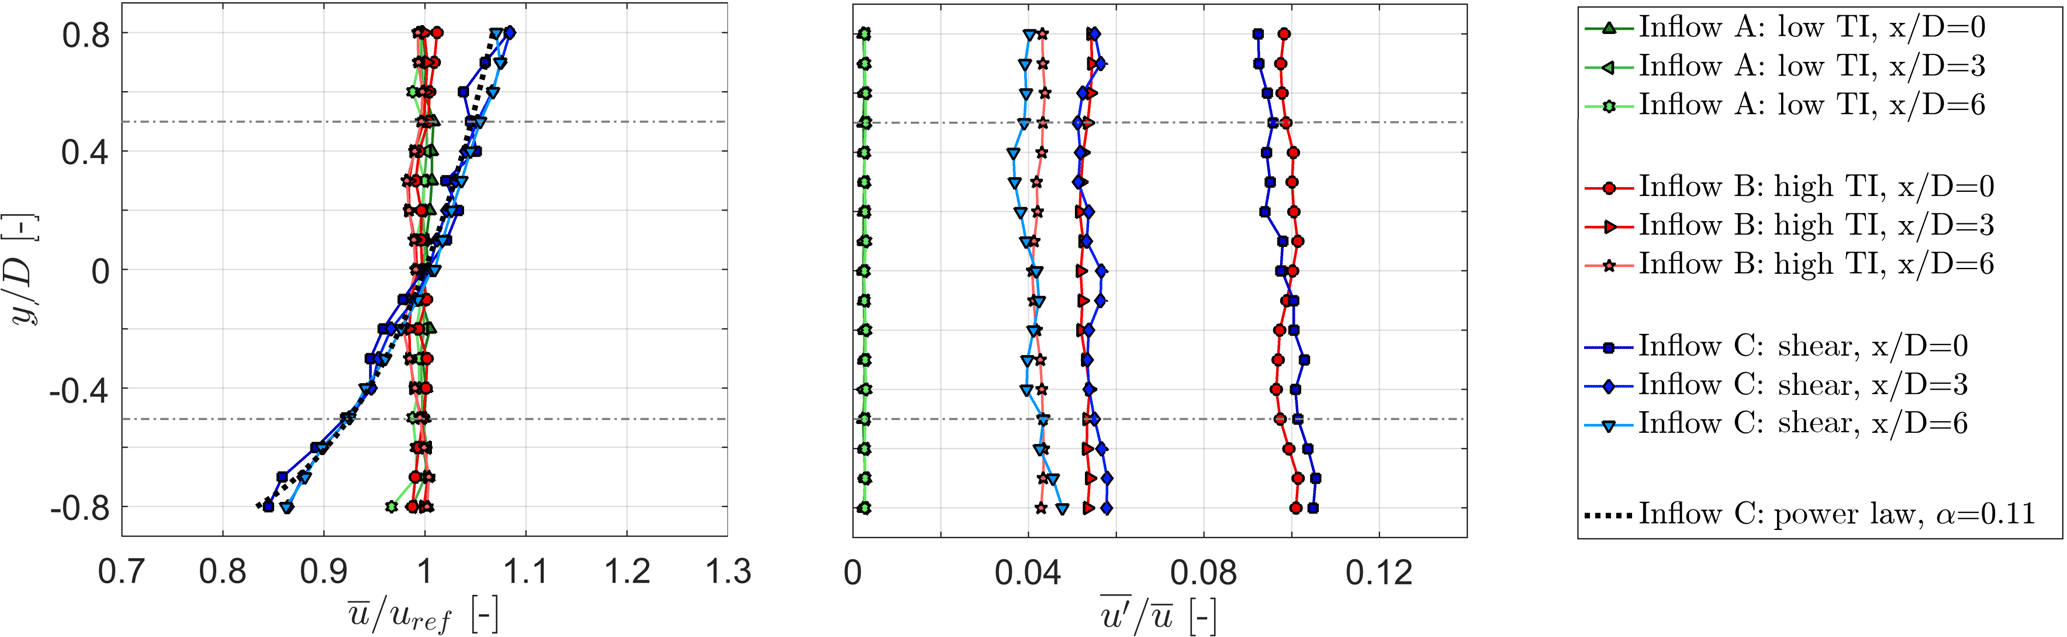
Figure 2Normalized mean velocity and turbulence intensity measured in the empty wind tunnel at the turbine position and wake measurement positions and .
Inflow A can be characterized as a typical laboratory flow, in which the turbine is exposed to the uniform, low turbulence inflow of the wind tunnel (TIA = 0.23 %). The low turbulence level in test case A is considered to be far below the intensities present in the real atmospheric boundary layer. Nevertheless, test case A is considered an extreme test case for the performance of computational prediction models. In order to generate a higher turbulence level for inflow B, a custom-made passive grid with evenly spaced horizontal and vertical bars is placed at the test section inlet x∕D = −2 upstream of the turbine. At the turbine position (x∕D = 0) a mean streamwise turbulence level of TIB = 10.0 % is measured, which decays to 5.5 % at x∕D = 3. Test case B represents turbulence conditions that are comparable to those of a neutral atmospheric boundary layer, although the inevitable decay of the grid-generated turbulence in the experiment is not representative for real conditions. Over the rotor-swept area, inflow A is measured to be uniform within ±0.8 % in the y and z direction for all downstream distances. For inflow B, wakes of the single grid bars are still observed at x∕D = 0, causing a spatial mean velocity variation within ±2.5 %, while already at x∕D = 3 the grid-generated turbulent flow is uniform within ±1.0 %.
The non-uniform shear inflow C is created by a grid with non-uniformly spaced horizontal bars, which is described in more detail in Bartl and Sætran (2017). The vertical flow profile is established for all streamwise positions and can be approximated by the power law
in which α describes the strength of the shear profiles gradient du∕dy. The grid-generated shear flow is approximated by a shear coefficient of α=0.11. Combined with a turbulence intensity of TIC = 10.0 %, inflow C resembles conditions measured at an onshore site for a neutral atmospheric boundary layer (Wharton and Lundquist, 2012). In the z direction, inflow C is measured to be spatially uniform within ±1.0 % over the rotor-swept area. The v component of the flow is observed to be slightly negative for inflow C ranging from v∕uref = −0.005 to −0.080 for all measurement positions. The influence of the negative v component in the inflow is deemed insignificant for the streamwise velocity u∕uref in the wake. For the analysis of three-dimensional flow effects in the wake, the v component from the inflow is subtracted. All presented mean velocity profiles and turbulence levels are measured in the empty wind tunnel at the reference velocity of .
Operating conditions
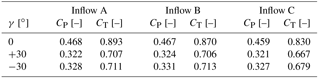
Figure 3 shows the turbine's measured power and thrust curves for different inflow conditions and yaw angles γ = 0∘ and γ = +30∘. In general, power and thrust measurements show very similar behavior for all three inflow conditions as shown in Table 2. Minor differences in the performance curves occur in the transition from stall around λ = 3 as previously discussed in Bartl and Sætran (2017).
Performance curves measured for γ = −30∘ match well with those of γ = +30∘ but for clarity are not plotted. For this study, the turbine tip speed ratio is kept constant at its design point at λopt=6.0 for all yaw angles and inflow conditions. For the investigated yaw angles γ = ±30∘ the power reduces about 30 % compared to the maximum power of the non-yawed turbine. An approximation of this reduction can be obtained with sufficient accuracy by multiplying the maximum power of the non-yawed turbine by . An adequate estimate of the thrust coefficient of the yawed rotor can be obtained assuming a reduction by on the thrust of the non-yawed rotor. This corresponds well to previous measurements by Krogstad and Adaramola (2012).
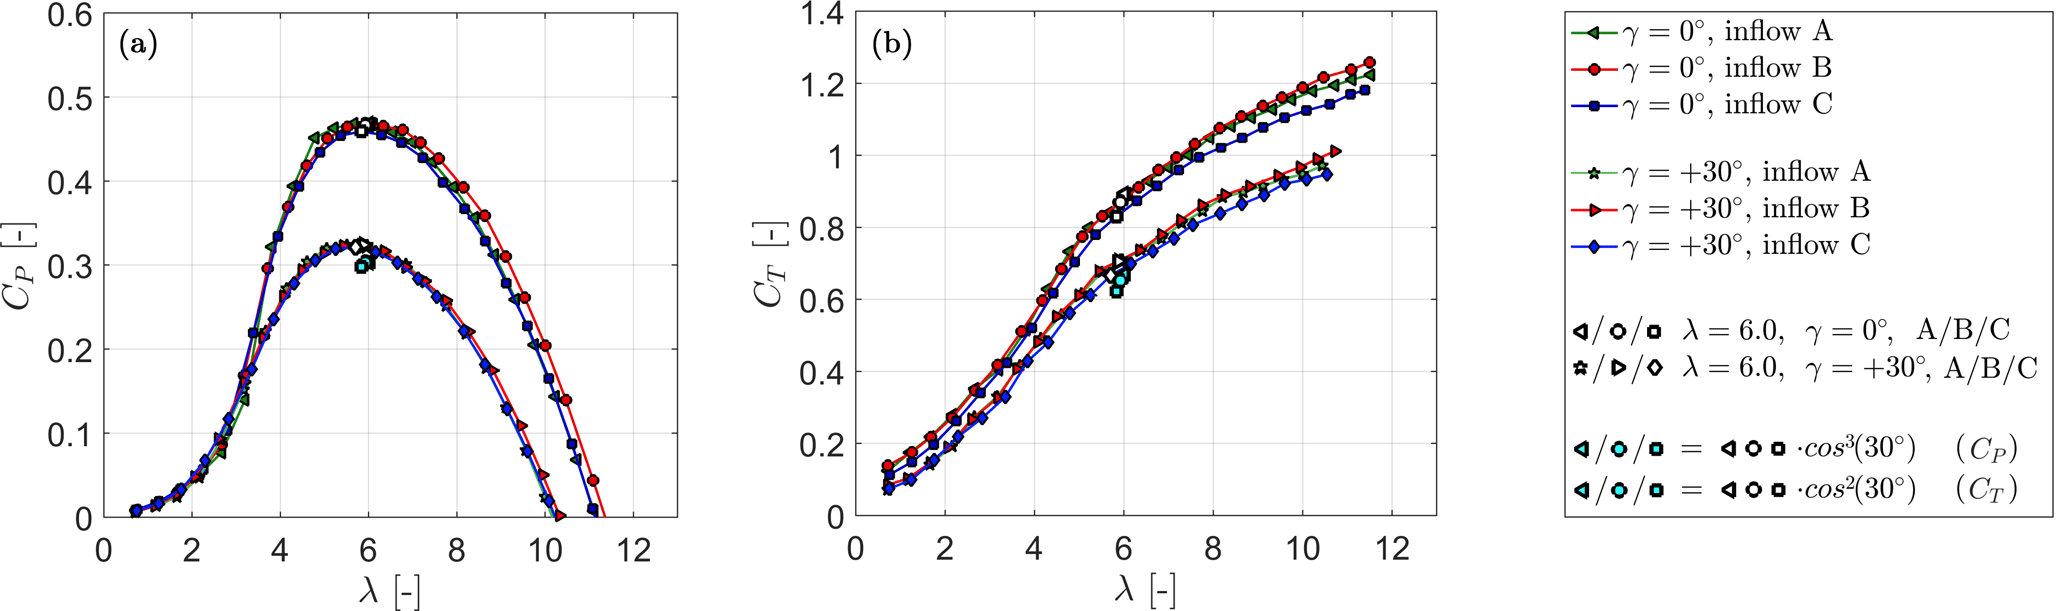
Figure 3Operating conditions of the model wind turbine: (a) power coefficient CP and (b) thrust coefficient CT for different turbine yaw angels and inflow conditions. The white points indicate the operational conditions under which wake measurements are performed. Cyan-colored points indicate a theoretical power and thrust reduction by yawing of and , respectively.
Table 2Turbine performance (CP and CT) at the optimal operating point (λ=6.0) for different yaw angles and inflow conditions.
2.2 Measurement techniques
Power and force measurements
In order to assess the rotor power characteristics, the rotor was installed at another test rig equipped with an HBM torque transducer of the type T20WN/2NM. Flexible couplings connect the torque transducer to the rotor shaft. An optical photo cell is installed on the shaft, enabling measurement of the rotor rotational speed. The friction in the ball bearing between the rotor and torque sensor is measured without the rotor and thereafter subtracted from the total mechanical power. For the wake measurements the rotor is then installed on a smaller nacelle, which interacts less with the flow. The rotational speed is controlled via a servomotor, ensuring the same power characteristics. For measurements of rotor thrust the model turbine is installed on a six-component force balance produced by Carl Schenck AG.
Flow measurements
The wake flow was measured with a two-component Dantec FiberFlow laser Doppler anemometer (LDA) system used in differential Doppler mode. The laser was set up to record the streamwise flow component u as well as the vertical flow component v. In order to obtain results for the lateral flow component w, the laser was turned in the u–w direction for one wake measurement. The reference coordinate system and measurement grid are shown in Fig. 4. A total of 5 × 10⁴ samples are taken for each measurement point over a period of approximately 30 s, resulting in an average sampling frequency of 1666 Hz. A grid consisting of 357 points is scanned for one full wake contour. For that purpose the LDA system is traversed from −1.0D to +1.0D in the z direction and from −0.8D to +0.8D in the y direction. The distance between two measurement points is 0.1D. For further analysis, these values are interpolated to a finer grid of 401 × 321 ≈ 129 000 grid points. The natural neighbor interpolation method is used, which gives a smoother interpolation of the value distribution according to Sukumar (1997).
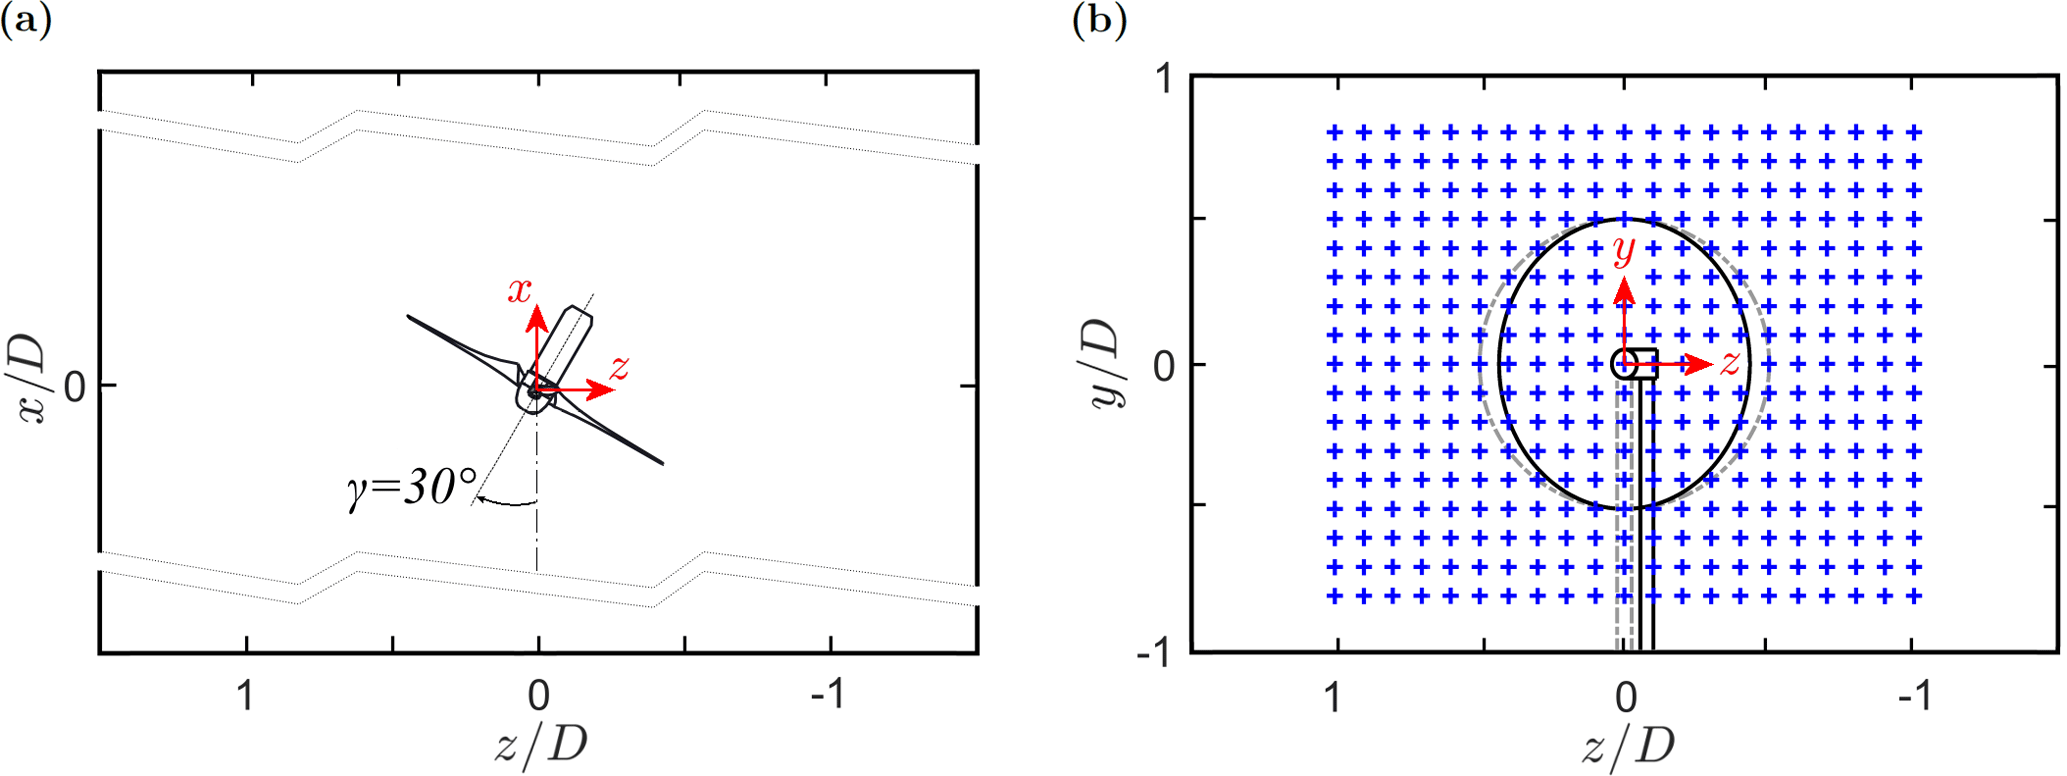
Figure 4Reference coordinate system in the wind tunnel: (a) top view of yawed turbine setup and (b) grid for wake measurements.
2.3 Measurement uncertainties
The uncertainty of the measured mean velocity is assessed for every sample following the procedure described in Wheeler and Ganji (2004). The LDA manufacturer Dantec Dynamics specifies the uncertainty on measured velocity by 0.04 %. Random errors are computed from repeated measurements of various representative measurement points based on a 95 % confidence interval. In the freestream flow as well as in the wake center the calculated uncertainties are below 1 %, while increased uncertainties of up to 4 % are calculated in the shear layers. Small inaccuracies in the adjustment of the traversing system are deemed to be the main contributor. The uncertainty in turbulent kinetic energy (TKE) is computed according to the method proposed by Benedict and Gould (1996). Corresponding to the mean velocity, the highest uncertainties up to 5 % are found in the shear layer between wake and freestream flow.
3.1 Wake shape parametrization
In order to compare the shape of the mean wake for different inflows, the velocity contours are parametrized. The wake contours are therefore sliced into horizontal profiles for each of the 321 interpolated vertical positions. Two hundred one of these 321 velocity profiles are located behind the rotor-swept area from y∕D = −0.5 to y∕D = 0.5. These profiles are fitted with an eighth-order polynomial to smoothen out local unsteadinesses. Then, an algorithm is applied to locate the z position of the minimum fitted velocity for each profile. When plotting the z positions of all these minima vs. their y position, an arc-shaped curve is obtained. The curves allow for a direct wake shape comparison depending on inflow condition and yaw angle.
3.2 Wake deflection assessment
As intentional yaw misalignment could possibly be utilized for optimized wind farm control, an exact quantification of the inflow-dependent wake deflection is an important input parameter. However, several methods of quantifying the wake deflection have been used in the past, showing a large method-dependent variation in the deflection. Some of these methods are discussed in Sect. 5. In the present study an available-power approach is used, which is deemed to give a solid assessment of the wake deflection. In order to assess the deflection of the wake, the potential power of an imaginary downstream turbine for various lateral offset positions is calculated. The z position, at which the available power P* is minimum, is then defined as the position of wake center deflection δ(z∕D). In this study the available power P* is calculated for 50 different locations in the range of −0.5 0.5. The details of the method including an illustration are described in Schottler et al. (2017a).
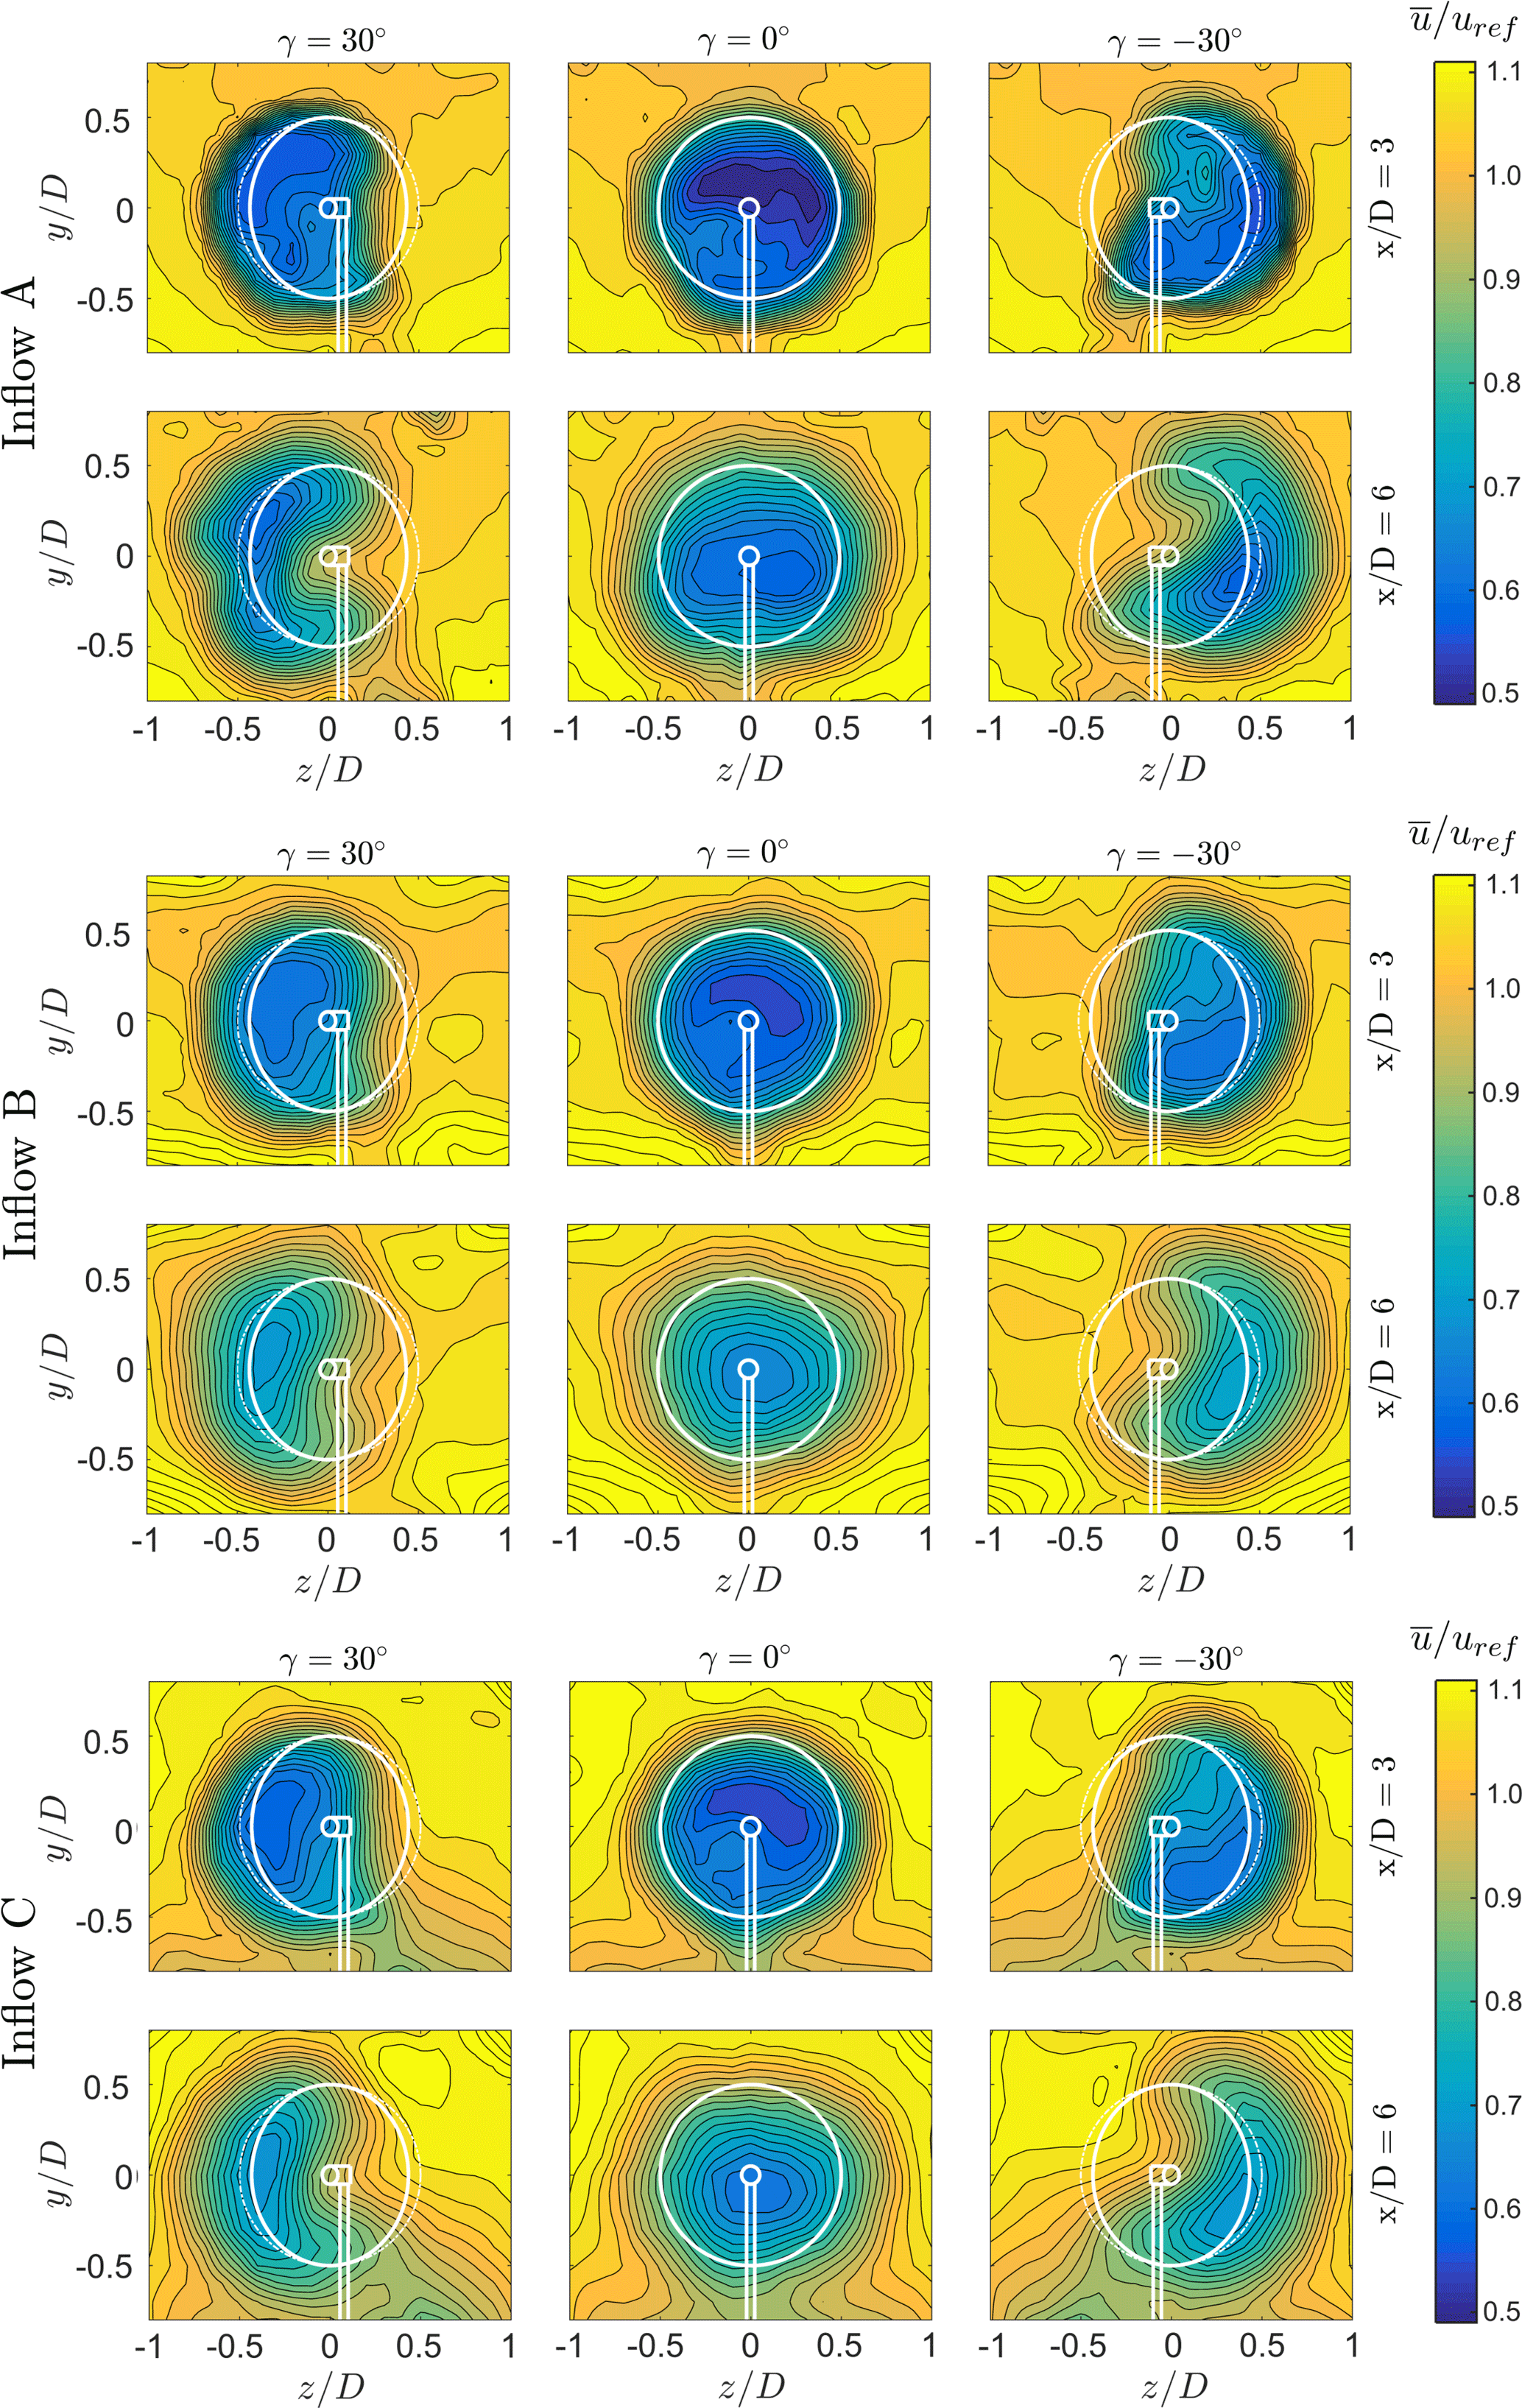
Figure 5Normalized mean velocity components for all measured yaw angles (30, 0 and +30∘), downstream distances (x∕D = 3 and 6) and inflow conditions (A, B, and C).
4.1 Mean wake flow
At first the mean wake flows for all three yaw angles (30, 0 and +30∘), both downstream distances (x∕D = 3 and 6) and all three inflow conditions (A, B and C) are analyzed. Full cross-sectional wake measurements are presented in Fig. 5. At the top, the wake flow for inflow A (TIA = 0.23 %) is presented. The velocity deficit in the wake is observed to reduce significantly when the turbine is yawed. As the rotor thrust is reduced, a smaller amount of streamwise momentum is lost in the x direction. For a yawed rotor, a cross-stream momentum in the z component is induced. Due to this lateral force component, the wake flow is deflected sideways. This is clearly observed at x∕D = 3, where the wake is seen to be deflected. Comparing the wake contours at γ = −30∘ and γ = +30∘, an asymmetry in the mean velocity distribution is obvious. The asymmetry between positive and negative wake deflection is even more pronounced at x∕D = 6, where the wakes are seen to form a kidney shape. Both wake deflection and location of maximum velocity deficit are not symmetric, which is analyzed in more detail in the following sections.
Effects of inflow turbulence
In the center of Fig. 5 the mean velocity results of test case B, in which the inflow turbulence level is increased to TIB = 10.0 %, are shown. Due to a faster wake recovery the velocity deficits are observed to be smaller for all yaw angles. Increased turbulent mixing smoothened out the gradients between wake and freestream flow compared to test case A. The general wake shape and its lateral deflection for 30∘ are seen to be similar to that for the low turbulence inflow. A curled kidney-shaped velocity deficit is also observed at x∕D = 6 for test case B; however, the curl is not as pronounced as in test case A. Increased mixing might have smoothened the strong gradients in the cross-flow direction in this case. The wake behind a positively and negatively yawed turbine appears to feature a higher degree of symmetry than in test case A. Yet an asymmetry of the minimum wake velocity is still obvious for the increased background turbulence level in test case B.
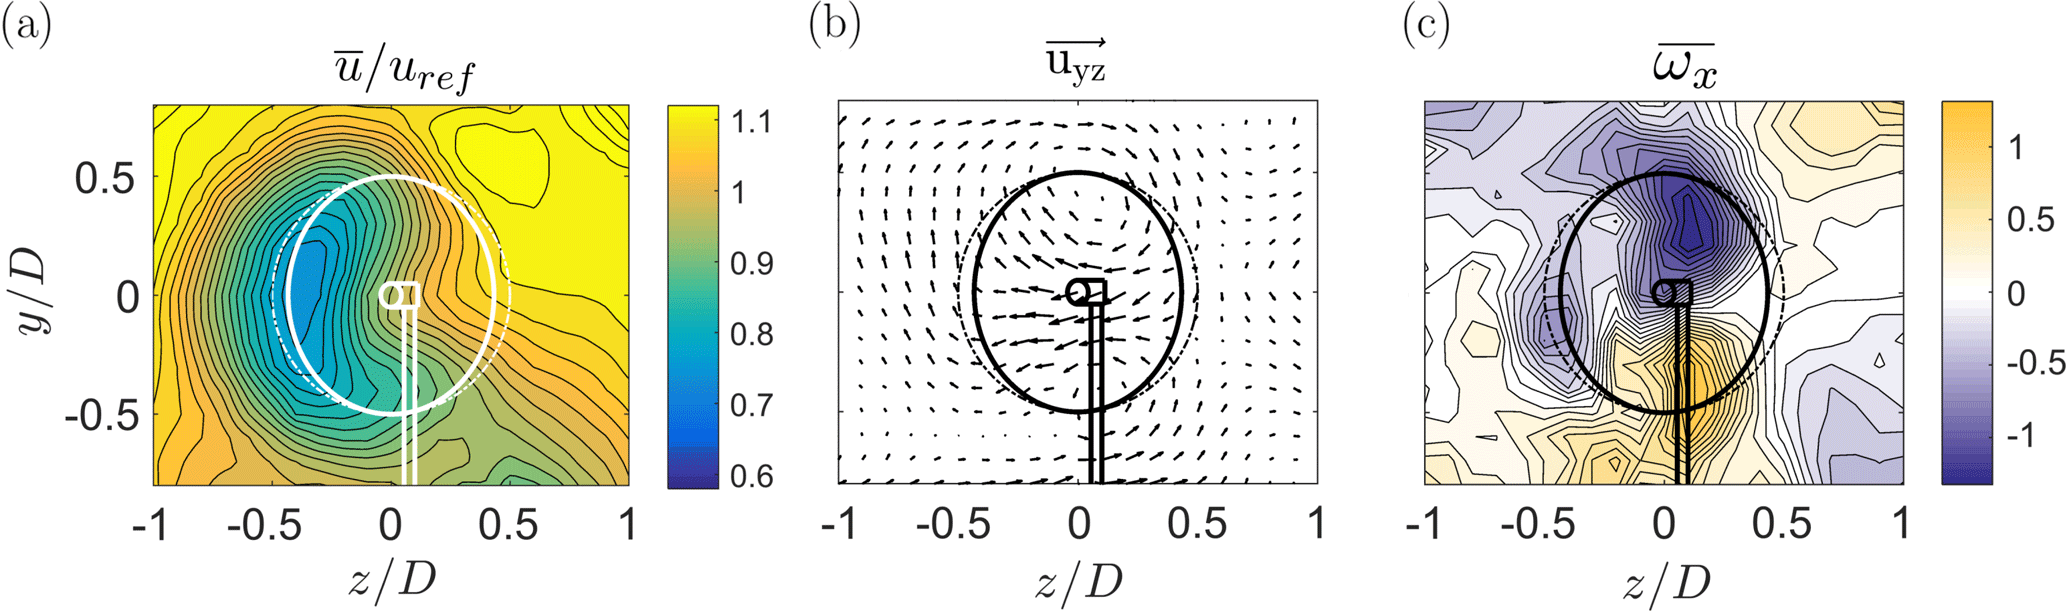
Figure 6(a) Streamwise mean velocity , (b) velocity vector uyz on the y–z plane and (c) streamwise mean vorticity at γ = 30∘ and at inflow C.
Effects of inflow shear
The wake results for a turbine exposed to inflow shear are shown at the bottom of Fig. 5. The turbulence level TIC = 10.0 % is the same as in test case B, but shear is present in the inflow. Despite the sheared inflow the wake shapes for all three yaw angles and both downstream distances are observed to be very similar to those of test case B. The normalized velocity levels and the inner structure of the wake are almost identical. The influence of shear is, however, only investigated at high inflow turbulence levels, which does not allow for any conclusions at lower inflow turbulence levels. In the freestream region outside the wake the shear is clearly visible, especially the lower half. Compared to test case B, the wake of the tower is detectable in test case C. The tower wake recovery seems to be slower as the freestream fluid near the tunnel floor contains less kinetic energy in test case C.
Curled wake shape
At x∕D = 6 a kidney-shaped velocity deficit is observed (Fig. 5), showing a higher local velocities behind the rotor center. In other words, the maximum wake deflection is found at hub height. The curled kidney shape of the wake can be explained by the formation of a counter-rotating vortex pair, which was previously discussed by Howland et al. (2016) as well as Bastankhah and Porté-Agel (2016). Bastankhah and Porté-Agel also presented a comprehensive explanation by the means of the differential form of the continuity equation. An illustration of the counter-rotating vortex pair at x∕D = 6 is presented in Fig. 6, where the velocity vector uyz and the mean streamwise vorticity are calculated from all three velocity components. The velocity vector on the y–z plane is defined as , while the streamwise time-averaged vorticity is defined as . As shown in terms of uyz, the two vortex centers are formed approximately at the lower and upper boundary of the rotor-swept area. The clockwise rotating vortex meets the counterclockwise-rotating vortex in the center behind the wake, leading to strong lateral velocities deflecting the wake sideways.
The locations of high rotation are furthermore visualized by increased levels of vorticity around the vortex centers. The phenomenon of a counter-rotating vortex pair is not limited to rotating wind turbines. Howland et al. (2016) detected the similar large-scale vortices behind a non-rotating drag disc. Counter-rotating vortex pairs have previously been investigated for jet flows exposed to a cross-flow, for example by Cortelezzi and Karagozian (2001), a phenomenon which can be interpreted is the inverse to the wake flow behind a skewed rotor. In both phenomena the free shear flow, i.e. a wake or a jet, is superimposed with a strong lateral cross-flow, leading to the formation of a counter-rotating vortex pair at higher downstream distances.
Tower wake deflection
On the bottom of the wake contour plot in Fig. 6a, the wake of the turbine tower is indicated. The tower wake is observed to be deflected in the opposite direction than the rotor wake when the turbine is yawed. The deflection of the tower wake in the opposite direction is believed to have two causes. Firstly, the turbine tower has a slight offset from z∕D = 0 as the center of yaw rotation was set to the rotor midpoint and not the tower. Therefore, a minor offset from the central position is expected for the tower wake. Secondly and more importantly, the tower wake experiences an additional deflection in the opposite direction due to an adversely directed cross-flow component outside near the wind tunnel floor as depicted in the vector plot in Fig. 6b. This cross-flow balances the counter-rotating vortex pair above and possibly deflects the tower wake further to the side.
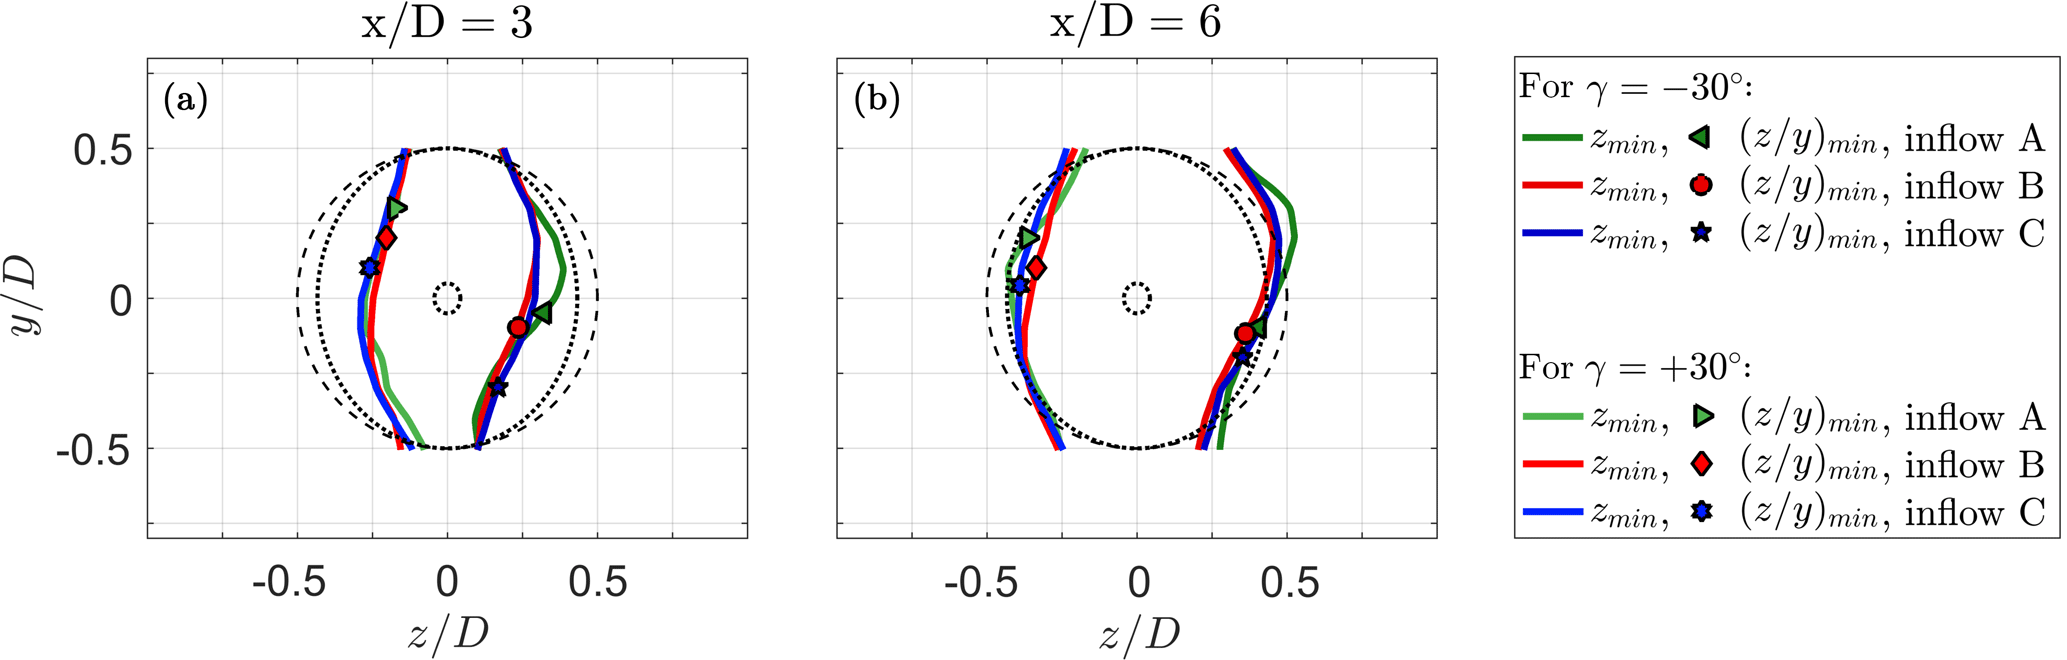
Figure 7Minimum values in streamwise velocity . Curl shapes and minimum positions are presented at x∕D = 3 (a) and x∕D = 6 (b) for the three different inflow conditions.
Wake curl symmetry
In order to compare the three-dimensional wake shapes behind a positively vs. negatively yawed turbine more quantitatively, the curled shapes of the velocity deficit area are parametrized to a two-dimensional line. For this purpose, the minimum values in streamwise velocity are extracted from the fitted wake contours for each vertical position in the range y∕D = [−0.5, …, 0.5]. The detailed method is described in Sect. 3.1. This results in the zmin lines as presented in Fig. 7, which indicate the inflow-dependent wake curl. In addition to that, the position of the minimum velocity (z∕y)min in both the y and z direction is extracted and depicted in the plot by different symbols. The zmin lines for all inflow conditions are observed to be slightly tilted in the clockwise direction for both downstream distances x∕D = 3 and x∕D = 6. The counterclockwise-rotating turbine induces an initial clockwise rotation to the wake flow. Superimposing the clockwise wake rotation with the counter-rotating vortex pair thus results in a slightly tilted curled wake shape. As previously mentioned, the wake curl is seen to be more asymmetric for the low-background-turbulence test case A. A significant bulge is visible for γ = −30∘ in the upper half of the wake for both downstream positions. For inflow conditions B and C the curl parametrization lines are almost coinciding, confirming the insignificant influence of the moderately sheared inflow on the wake shape. Analyzing the locations of minimum velocities (z∕y)min in the wake contours, a deviation from the horizontal centerline y∕D = 0 for both positive and negative yaw angles is obvious. For γ = −30∘ the minimum velocities (z∕y)min are deflected to the lower half of the wake, while an upward deflection happens for positive yaw angles γ = +30∘. In agreement with Bastankhah and Porté-Agel (2016), the wake rotation is assumed to turn the velocity minimum in the clockwise direction initially. The deflection from the wake centerline is observed to be larger for x∕D = 3 than for x∕D = 6, where mixing processes already have smoothened the gradients. In the case of sheared inflow of test case C, the locations of minimum wake velocity (z∕y)min are found to be lower than for test cases A and B.
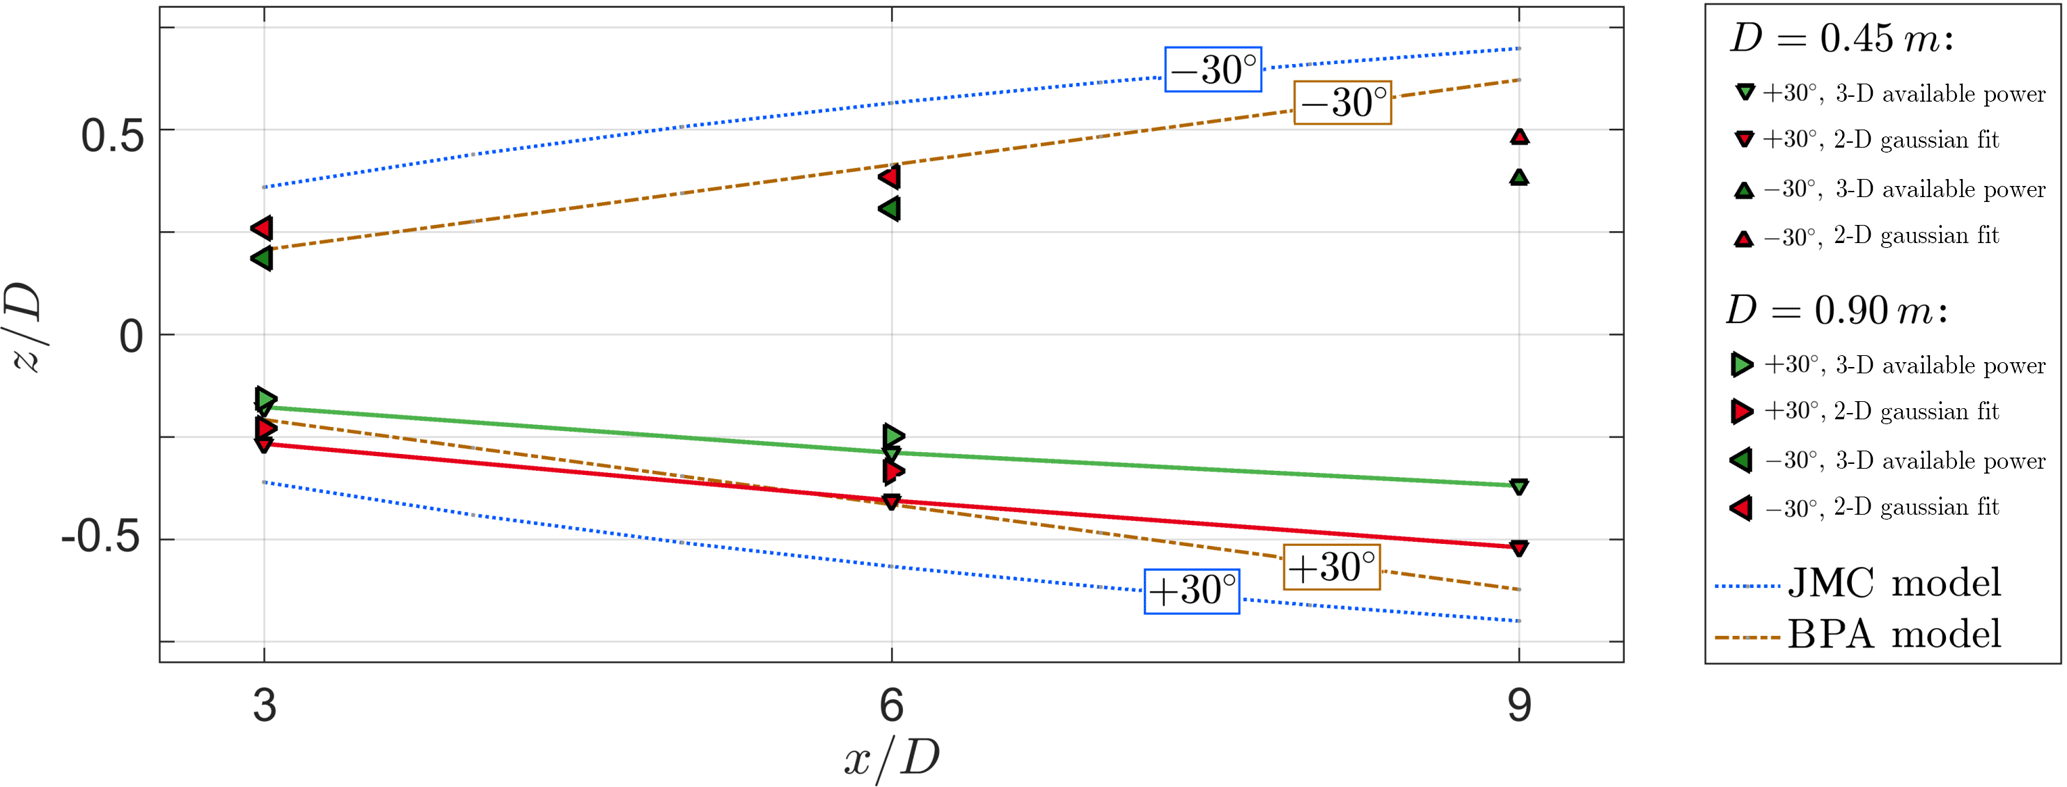
Figure 8Calculated wake deflection δ(z∕D) for the NTNU rotor (D = 0.90 m), a downscaled NTNU rotor (D = 0.45 m), and the wake deflection model of Jiménez et al. and of Bastankhah and Porte-Agél. The inflow turbulence level is TIA = 0.23 %.

Figure 9Calculated wake deflection δ(z∕D) at x∕D = 3 and x∕D = 6 for three different inflow conditions (A, B and C) compared to TI-dependent deflection predictions by Bastankhah and Porte-Agél's wake deflection model. Note that a small offset in x∕D of the measured values was chosen for better visibility.
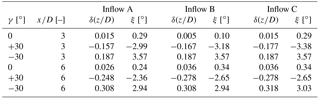
Table 3Lateral deflection δ(z∕D) [–] and wake skew angle ξ [∘] calculated with the available-power method.
Overall wake deflection
The three-dimensional available-power method is used to quantify the overall deflection of the kinetic energy contained in the wake. As explained in Sect. 3.2, the lateral location of the available power contained in the wake is detected, reducing the full wake flow field to a single deflection value. A comparison of the minimum available power in the wakes behind a positively vs. negatively yawed turbine enables a comparison of symmetry in the deflection of the energy contained in the wake with respect to the yaw angle. Additionally, a two-dimensional Gaussian fit method for the wake center detection at the turbine's hub height is used to demonstrate systematic differences in the deflection quantification methods. In order to judge possible blockage effects, another rotor of a smaller diameter (DRot, small = 0.45 m, = 3.3 %) was used in addition to the 0.90 m (σBlockage, large = 12.8 %) rotor. The details of the experimental setup featuring the smaller 0.45 m rotor are described in Bartl et al. (2018). Further, the results are compared with two different wake models by Jiménez et al. (2010) (JCM) and Bastankhah and Porté-Agel (2016) (BPA). The recommended default model parameters were used in the implementation of both wake deflection models. For the JCM model a linear wake expansion factor of β=0.125 was applied, while ky=0.022, kz=0.022, and were used in the case of the BPA model. The comparisons of the wake deflections are shown in Fig. 8. At x∕D = 3 the wake deflection for γ = +30∘ of the smaller rotor and the original rotor match very well. At x∕D = 6 a small deviation in the wake deflection after the rotors of different sizes and blockage is calculated. It can be assumed that blockage by the wind tunnel walls influences the wake deflection; however, the difference in deflection between the different rotors is observed to be rather small. Comparing the measured deflection with the prediction models reveals larger deviations. The deflection predicted by the JCM model is generally observed to be larger than the one predicted by the BPA model. The calculated wake deflection by the available-power method at x∕D = 3 is still well predicted by the BPA model, while more significant deviations are observed at x∕D = 6. Obviously larger differences in wake deflection are predicted by the JCM model, both at x∕D = 3 and x∕D = 6. A number of potential causes might be responsible for the significant deviations between measured and modeled deflection results. Besides the discussed wind tunnel blockage, a major source of uncertainty in this comparison arises from the method used to calculate the wake deflection. Quantifying the wake deflection by the minimum of a fitted Gaussian on the hub height velocity profiles results in a better match with the BPA model at x∕D = 6 as shown by the red curve in Fig. 8. However, using the hub height profile only for the wake center deflection does not take the total mean kinetic energy content in the wake into account. Due to the complex three-dimensional shape of the velocity deficit, a reduction of the wake deflection to one single value has been shown to be difficult. A number of different methods have been proposed, resulting in many different deflection quantifications (Vollmer et al., 2016). Further, the wake deflection δ(z∕D) for all three inflow conditions is compared. These results are shown in Fig. 9 and compared to the BPA model. In contrast to the JCM model, the inflow turbulence intensity is an input variable in the BPA model. It can be observed that the BPA model predicts a higher wake deflection for a smaller inflow turbulence level. Bastankhah and Porté-Agel (2016) argue that smaller inflow turbulence reduces the flow entrainment in the far wake and thus increases the wake deflection. The calculated lateral deflection values δ(z∕D) and the associated wake skew angle ξ are furthermore listed in Table 3.
In general, a very similar wake deflection is observed for all three inflow conditions at both downstream distances. A systematic asymmetry in the wake deflection represented by the minimum available power behind a turbine yawed γ = −30∘ and γ = +30∘ is observed. The wake shows a higher deflection for negative yaw angles in all inflow cases. Also the wake behind the non-yawed turbine is seen to be slightly deflected in the positive z direction, which is assumed to stem from the interaction of the rotating wake with the turbine tower. As discussed by Pierella and Sætran (2017), who performed experiments on the same rotor with a larger tower, the tower–wake interaction leads to an uneven momentum entrainment in the wake. For a non-yawed setup, they observed both a lateral and vertical displacement of the wake vortex center, induced by an interaction with the tower wake. It can therefore be assumed that the interaction of the counter-rotating vortex pair with the tower wake's slightly displaced wake vortex in the yawed cases might also be influenced by an interaction with the tower wake, which is the only source of asymmetry in an otherwise perfectly symmetrical setup. Increasing the turbulence level from TIA = 0.23 % to TIB = 10.0 % is found to only have a small influence on the wake deflection. In fact, no difference is detected for γ = −30∘. For γ = +30∘, however, a slightly smaller wake deflection is calculated for the lower inflow turbulence. This can also be interpreted as a higher degree of asymmetry for low background turbulence. Adding shear to the inflow is not observed to change the wake deflection significantly. This confirms the abovementioned similarity in wake shapes measured for test cases B and C.
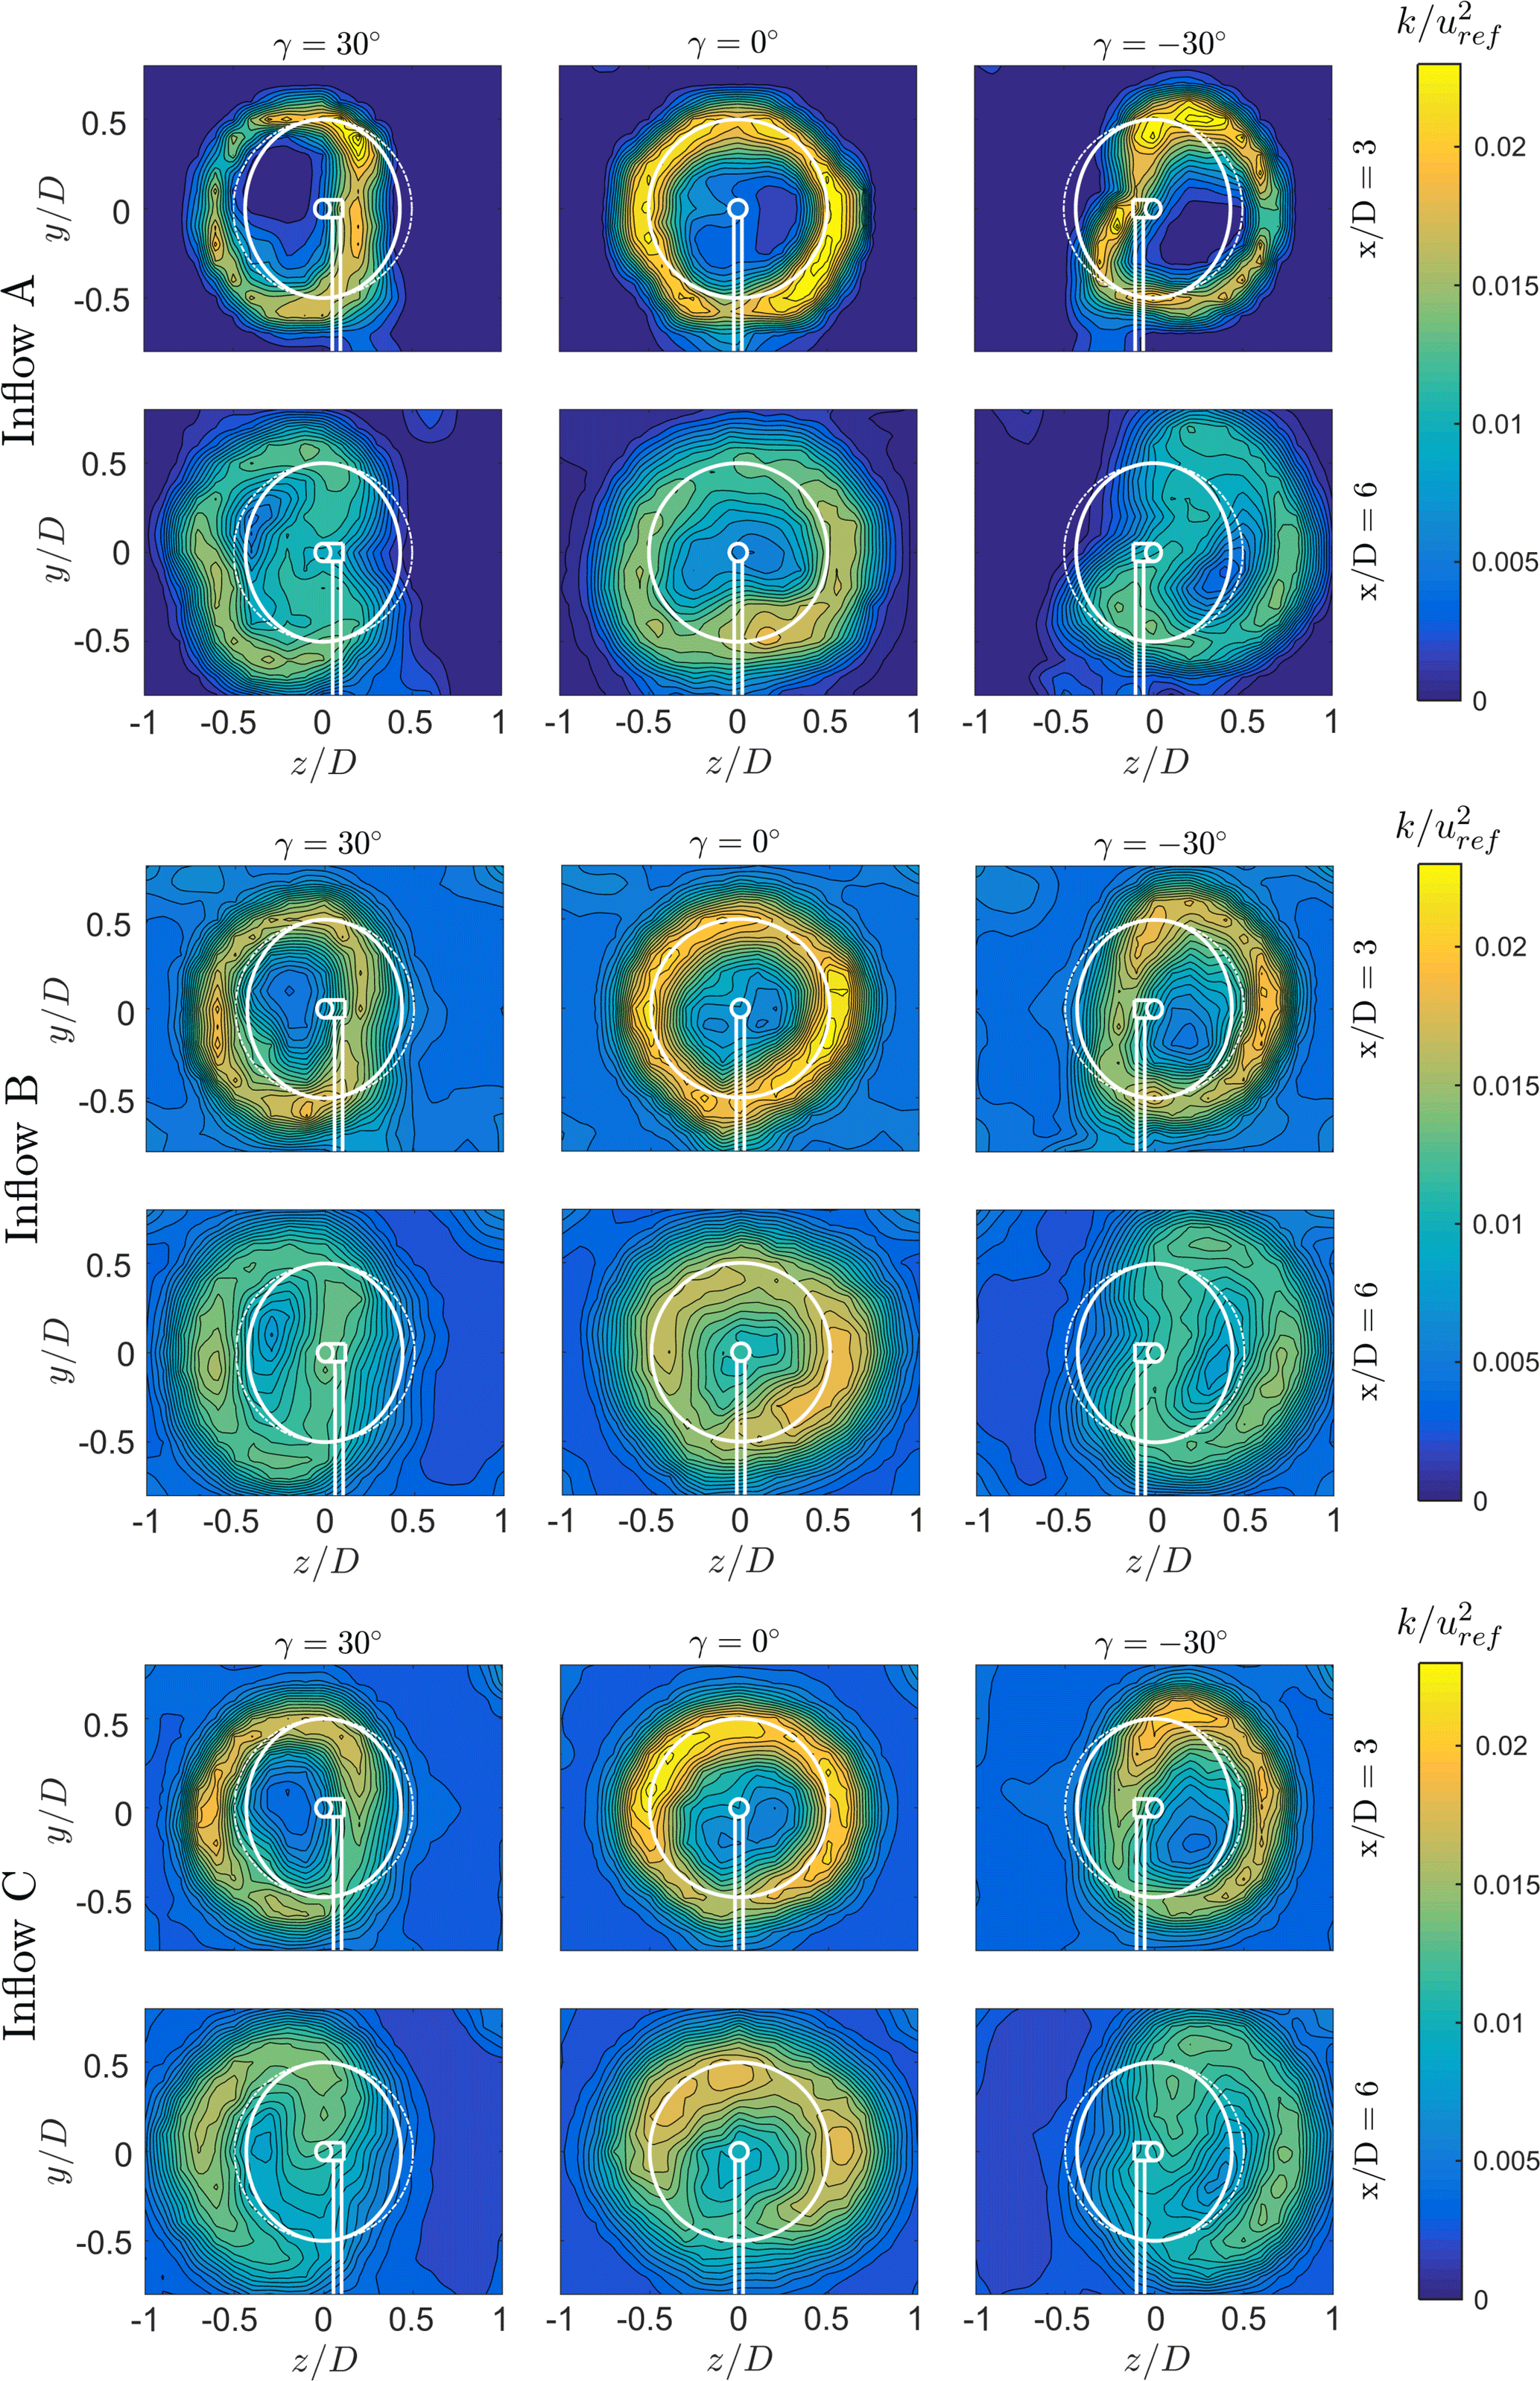
Figure 10Turbulent kinetic energy for all measured yaw angles (30, 0 and +30∘), downstream distances (x∕D = 3 and 6) and inflow conditions (A, B, and C).
4.2 Rotor-generated turbulence
For the measurements presented in the this study the kinetic energy is considered to be fully dominated by turbulent motions from 3 for inflow A, as Eriksen and Krogstad (2017) recently showed that the production of rotor-generated turbulent kinetic energy is finished at x∕D = 3 for measurements on the same rotor and under inflow conditions. For inflow conditions B and C, the transition to fully turbulent motions is expected to take place at even smaller downstream distances.
Effects of yawing on turbulent kinetic energy distributions
At the top of Fig. 10 the TKE levels in the wake are presented for test case A (TIA = 0.23 %). As observed in earlier studies (Bartl and Sætran, 2017; Eriksen and Krogstad, 2017), a ring of high turbulence levels is formed behind the tips of the rotor blades for a non-yawed turbine. In this region the tip vortices decayed into turbulent motions. With increasing downstream distance the sharp peaks decrease in magnitude and blur out to their surroundings. For a yawed turbine, the ring of peak turbulence is laterally deflected and deformed accordingly. For x∕D = 3 the peaks are clearly separated by an area of low turbulence in the center of the deflected wake. For x∕D = 6, this area is observed to be significantly smaller. The peaks are still distinct, but it is expected that they start merging into one peak for higher downstream distances. The strongest TKE levels are observed for locations of the highest gradient in mean streamwise velocity. Thus, the TKE ring's extension is observed to be slightly larger than the contours of the mean streamwise velocity, emphasizing the need to take the parameter TKE into account in wind farm site planning or yaw control studies.
Effects of inflow turbulence and shear
The TKE contours for increased inflow turbulence of test case B are shown in the center of Fig. 10 as well as the red lines in Fig. 11. At x∕D = 3, slightly smaller TKE peaks and higher centerline turbulence are measured for test case B than for test case A. The higher TKE levels in the freestream lead to increased mixing, which reduces the TKE peaks in the tip region. At x∕D = 6 the TKE peaks are observed to be at about the same level for both inflow conditions. For the yawed cases the turbulence level in the wake center has also evened out between inflow cases A and B. The TKE levels for the sheared inflow in test case C are observed to be very similar to those of test case B for all investigated yaw angles. These findings suggest that the presence of a moderate shear flow in a highly turbulent boundary layer does not influence the production of rotor-generated turbulent kinetic energy significantly.
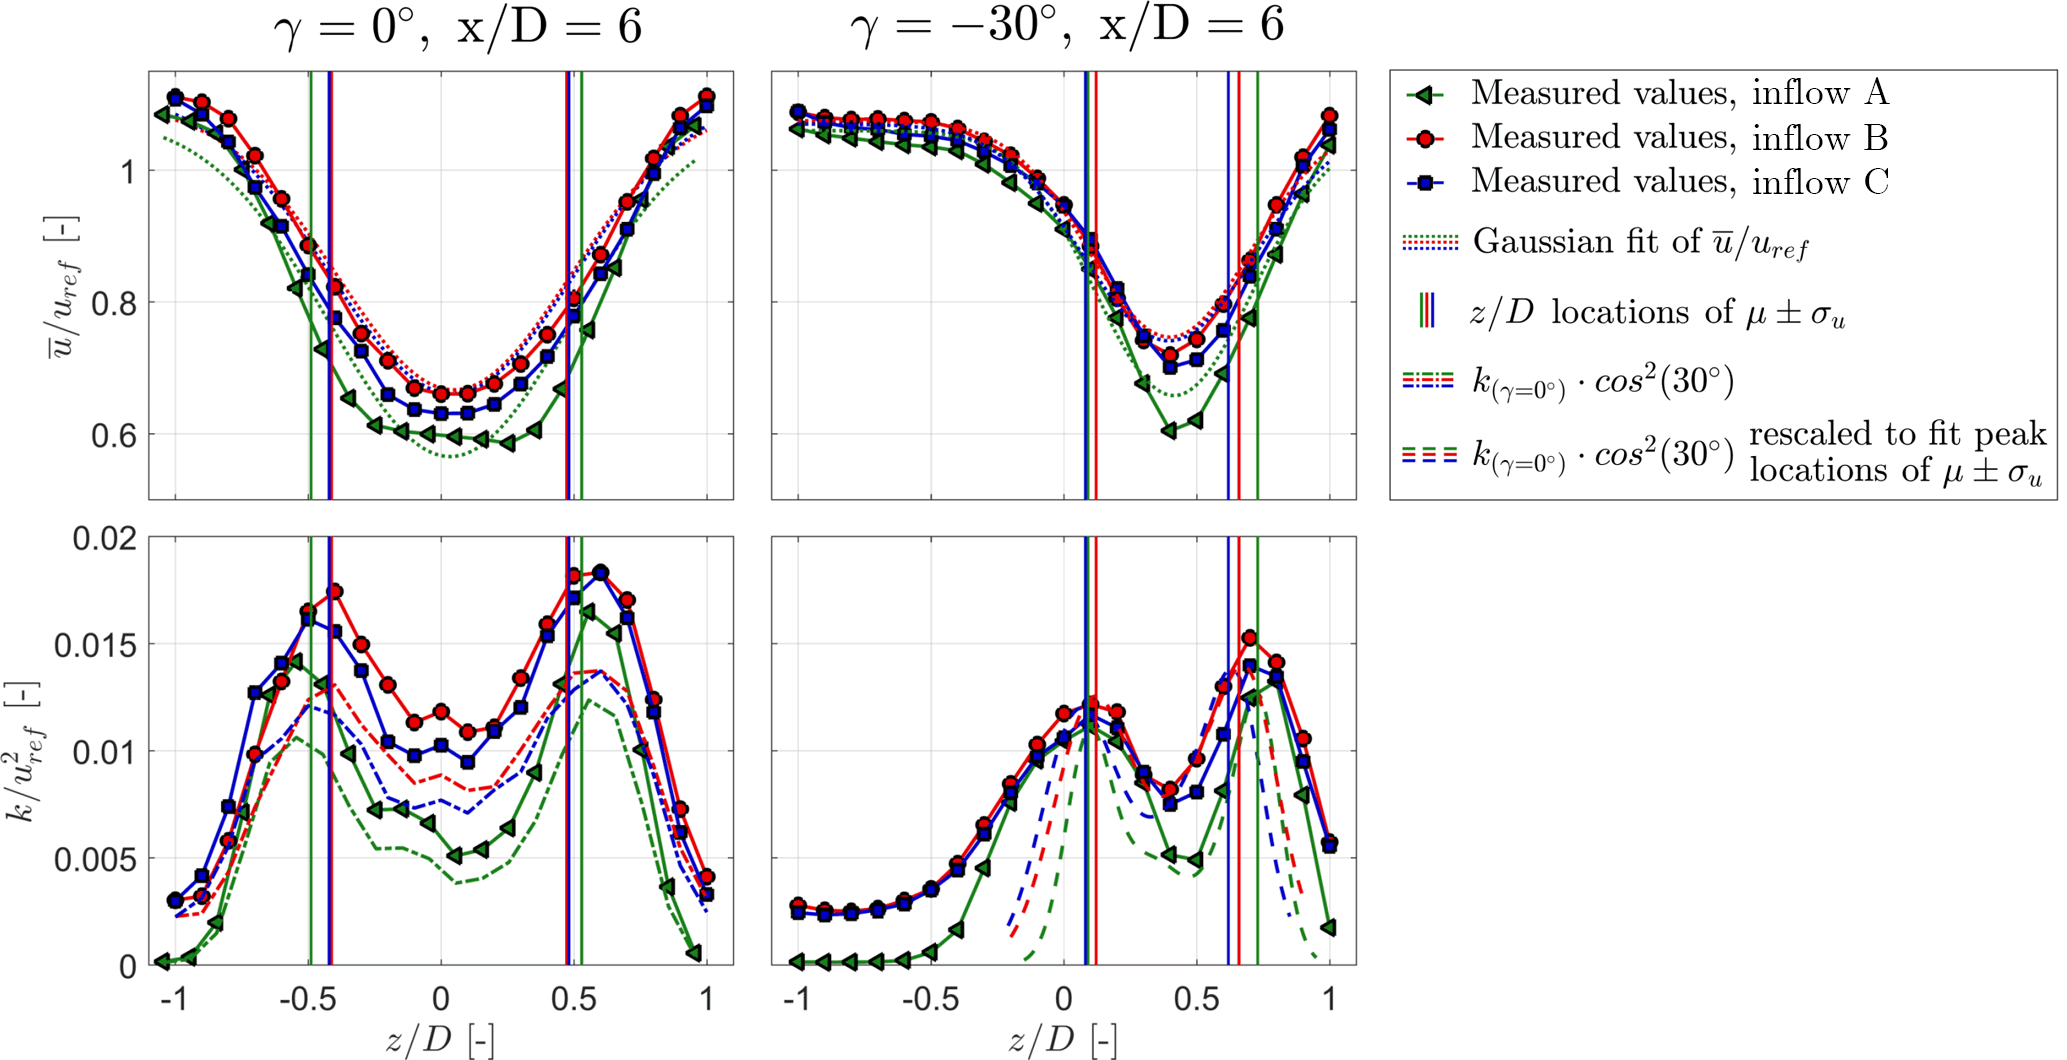
Figure 11Normalized mean velocity and turbulent kinetic energy profiles at hub height y=0 and x∕D = 6. The yaw angles are set to γ=0∘ and ∘. Vertical lines indicate the borders of SDs of Gaussian-fitted velocity profiles μ±σu. Chain-dotted lines indicate TKE profiles at γ=0∘ multiplied by cos2(−30∘). Dashed lines in the lower right subplot have the same magnitude as the chain-dotted lines but are linearly scaled in z to fit the peak locations of μ±σu.
Approximation for turbulent kinetic energy distributions in yaw
The levels of peak turbulence are observed to decrease considerably when the rotor is yawed. For a direct case-to-case comparison, TKE profiles at hub height y = 0 and x∕D = 6 are presented for and ∘ in the lower plots of Fig. 11. For a yawed turbine, the rotor thrust reduces with approximately cos2(γ) as previously shown in Fig. 3. Multiplying also the TKE levels generated by the non-yawed rotor with cos2(γ) is observed to result in a decent first-order approximation of the turbulence levels behind the yawed rotor. The reduced TKE levels for ∘ are indicated by the chain-dotted lines in the lower left plot of Fig. 11. For an approximation of the lateral deflection of the turbulence peaks for yawed rotors, their location can be estimated as proposed by Schottler et al. (2018). In this approach the expected value and standard deviation (SD) of a Gaussian fit of the velocity profile behind a yawed rotor are calculated. Adding the SD to the expected value μ±σu gives a rough estimate of the locations of the corresponding TKE peaks, as shown by the vertical lines in Fig. 11. Thus, it is possible to approximate both TKE peak locations and levels by knowing TKE and mean velocity for the now-yawed case. This might be a useful addition for modeling the rotor-generated turbulence in yawed wakes. For a complete assessment of mean velocity and turbulent kinetic energy in a yawed wind turbine wake, the model for streamwise velocity profiles by Bastankhah and Porté-Agel (2016) could be extended by the proposed relations for the rotor-generated turbulence.
The present wind tunnel investigation showed detailed flow measurements in the wake of a yawed model turbine for different inflow conditions. A number of modeling techniques and turbine sizes were used in previous yaw wake studies in the literature, resulting in a significant variation in wake shapes and their deflection. However, a number of general flow effects in the wake behind a yawed turbine seem to be reproducible.
Our results indicated minor asymmetries in the wake flow behind positively and negatively yawed turbines. The interference of the modified flow field around the tower and wake rotation is deemed to be the source for this asymmetry. This explanation is consistent with findings by Grant and Parkin (2000), who reported clear asymmetries in the tip vortex shedding and circulation in the wake for positive and negative yaw angles. Our experimental measurements showed a kidney-shaped mean velocity deficit at x∕D = 6 for all inflow conditions. These results agree well with recently discussed experimental results by Howland et al. (2016). Although the wake shape was not specifically discussed, a curled wake shape was already indicated in the results presented by Medici and Alfredsson (2006). The results presented by Bastankhah and Porté-Agel (2016) offer a good comparison as wakes were measured at a number of yaw angles and downstream distances. The wake shape and velocity deficit at and x∕D = 6 match qualitatively well with our results when an opposite sense of turbine rotation is taken into account. A direct comparison of the wakes at x∕D = 3 and x∕D = 6 of the results presented here of test case B with an equivalent setup for a slightly smaller model turbine of different rotor geometry was performed by Schottler et al. (2017b, 2018). These results show a more distinct curl in the wake already at x∕D = 3, while velocity deficit and wake deflection are generally found to be very similar for both model turbines.
Our study moreover indicates that the wake shape and deflection are affected by inflow turbulence. The overall wake deflection was observed to be similar for both investigated turbulence levels. For a more detailed investigation of diffusion mechanisms in the wake, however, a vorticity analysis in the wake of a turbine exposed to low and high turbulence is encouraged for future studies. The inflow turbulence is furthermore implemented as an input parameter in the recently developed wake model by Bastankhah and Porté-Agel (2016). The influence of the inflow turbulence seems to be slightly overpredicted by their model, although a more thorough analysis for different yaw angles and downstream distances on a smaller, unblocked rotor are needed for a solid assessment of the model's sensitivity to inflow turbulence. Furthermore, the comparison of the model-predicted deflection and experimentally obtained results is not straightforward. Due to the various different calculation methods used, the assessment of the wake center deflection is found to be equivocal. Gaussian fitting to locate the minimum wake velocity was used by, amongst others, Jiménez et al. (2010) and Fleming et al. (2014), while Luo et al. (2015) and Howland et al. (2016) calculated the center of mass of the three-dimensional velocity contour. A comparison of different wake deflection methods was presented by Vollmer et al. (2016), showing the significant method-related variation in deflection quantification.
Another focus of the present study was to assess whether the wake's properties are significantly influenced by sheared inflow. Shear is present in most atmospheric boundary layer flows and highly dependent on stability and the terrain's complexity and roughness. The strength of the investigated shear in test case C is rather moderate and considered typical for a neutral atmospheric boundary layer (Wharton and Lundquist, 2012). As the study investigated only two different shear flows (αB = 0.0 and αC = 0.11), solid statements about the wake flow's sensitivity to this parameter cannot be made. The results do, however, indicate a rather insignificant effect of such a moderate shear on the wake flow. Possibly, a considerably stronger shear at lower inflow turbulence would have resulted in more distinguishable wake characteristics. In contrast to a recent full-scale LES study by Vollmer et al. (2016), our results seem to shown a rather small dependency of the wake characteristics on the inflow conditions. However, Vollmer et al. (2016) varied four different inflow parameters (turbulence intensity, potential temperature wind shear and veer) simultaneously, which made direct conclusions on the sensitivity to a single inflow parameter difficult. In conclusion, our results do not contradict their findings as the inflow conditions in both setups were modeled very differently.
An experimental study on the inflow-dependent wake characteristics of a yawed model wind turbine was realized. In accordance with previous studies, it is confirmed that intentional turbine yaw misalignment is an effective method to laterally deflect the velocity deficit in the wake and thus offers a large potential for power optimization in wind farms. For the equally important optimization of downstream turbine fatigue loads, a careful planning of wind farm layout and control strategy should thus also take the strength and expansion of rotor-generated turbulence footprints into account. We show that the rotor-generated turbulence distributions are deflected to the same degree as the mean velocity profiles but feature a slightly wider expansion. Further analysis demonstrated that an increasing yaw angle reduces the levels of the peak turbulence, which decreases at a similar rate to that of the rotor thrust.
The study moreover recommends a consideration of the inflow turbulence level as an important parameter for deflection models implemented in wind farm controllers, as it affects the yaw-angle-dependent symmetry in shape and deflection. The degree of asymmetry was observed to be higher for lower inflow turbulence. The recently proposed wake deflection model by Bastankhah and Porté-Agel (2016) proved to deliver good approximations of inflow-turbulence-dependent wake deflection. However, more wake measurements at different yaw angles and various downstream distances should be performed to fully assess the model's sensitivity to inflow turbulence. As the influence of a gentle inflow shear on the wake characteristics was found to be insignificant, an inclusion of this parameter in wake models is thus not considered to be essential at this stage. The experimental results revealed very similar velocity deficit and rotor-generated turbulence distributions to those measured for a uniform inflow.
All presented wake data in this paper are available at https://doi.org/10.5281/zenodo.1193656 (Schottler et al., 2018).
The authors declare that they have no conflict of interest.
The authors would like to acknowledge the IPID4all travel support granted by the German Academic Exchange Service
(DAAD).
Edited by: Gerard J. W. van Bussel
Reviewed by: two anonymous referees
Annoni, J., Gebraad, P., Scholbrock, A., Fleming, P., and van Wingerden, J.-W.: Analysis of axial-induction-based wind plant control using an engineering and a high-order wind plant model, Wind Energy, 19, 113–1150, https://doi.org/10.1002/we.1891, 2016. a
Barthelmie, R. J., Pryor, S. C., Frandsen, S. T., Hansen, K. S., Schepers, J. G., Rados, K., Schlez, W., Neubert, A., Jensen, L. E., and Neckelmann, S.: Quantifying the impact of wind turbine wakes on power output at offshore wind farms, J. Atmos. Ocean. Tech., 27, 1302–1317, https://doi.org/10.1175/2010JTECHA1398.1, 2010. a
Bartl, J. and Sætran, L.: Experimental testing of axial induction based control strategies for wake control and wind farm optimization, J. Phys. Conf. Ser., 753, 032035, https://doi.org/10.1088/1742-6596/753/3/032035, 2016. a
Bartl, J. and Sætran, L.: Blind test comparison of the performance and wake flow between two in-line wind turbines exposed to different turbulent inflow conditions, Wind Energ. Sci., 2, 55–76, https://doi.org/10.5194/wes-2-55-2017, 2017. a, b, c, d
Bartl, J., Müller, A., Landolt, A., Mühle, F., Vatn, M., Oggiano, L., and Sætran, L.: Validation of the real-time-response ProCap measurement system for full wake scans behind a yawed model-scale wind turbine, DeepWind 2018 Conference, J. Phys. Conf. Ser., in review, 2018. a
Bastankhah, M. and Porté-Agel, F.: Experimental and theoretical study of wind turbine wakes in yawed conditions, J. Fluid Mech., 806, 506–541, https://doi.org/10.1017/jfm.2016.595, 2016. a, b, c, d, e, f, g, h, i, j
Benedict, L. and Gould, R.: Towards better uncertainty estimates for turbulence statistics, Exp. Fluids, 22, 129–136, https://doi.org/10.1007/s003480050030, 1996. a
Berdowski, T., Ferreira, C., van Zuijlen, A., and van Bussel, G.: Three-dimensional free-wake vortex simulations of an actuator disc in yaw, in: AIAA SciTech Forum, Wind Energy Synopsium 2018, https://doi.org/10.2514/6.2018-0513, 2018. a
Cortelezzi, L. and Karagozian, A.: On the formation of the counter-rotating vortex pair in transverse jets, J. Fluid Mech., 446, 347–373, https://doi.org/10.1017/S0022112001005894, 2001. a
Eriksen, P. E. and Krogstad, P.-Å.: Development of coherent motion in the wake of a model wind turbine, Renew. Energ., 108, 449–460, https://doi.org/10.1016/j.renene.2017.02.031, 2017. a, b
Fleming, P., Gebraad, P., Lee, S., van Wingerden, J.-W., Johnson, K., Churchfield, M., Michalakes, J., Spalart, P., and Moriarty, P.: Evaluating techniques for redirecting turbine wakes using SOWFA, Renew. Energ., 70, 211–218, https://doi.org/10.1016/j.renene.2014.02.015, 2014. a
Fleming, P., Gebraad, P., Lee, S., van Wingerden, J.-W., Johnson, K., Churchfield, M., Michalakes, J., Spalart, P., and Moriarty, P.: Simulation comparison of wake mitigation control strategies for a two-turbine case, Wind Energy, 18, 2135–2143, https://doi.org/10.1002/we.1810, 2015. a, b
Fleming, P., Annoni, J., Churchfield, M., Martinez-Tossas, L. A., Gruchalla, K., Lawson, M., and Moriarty, P.: A simulation study demonstrating the importance of large-scale trailing vortices in wake steering, Wind Energ. Sci., 3, 243–255, https://doi.org/10.5194/wes-3-243-2018, 2018. a
Gebraad, P. M. O., Fleming, P. A., and van Wingerden, J. W.: Comparison of actuation methods for wake control in wind plants, in: American Control Conference, https://doi.org/10.1109/ACC.2015.7170977, 2015. a
Gebraad, P. M. O., Teeuwisse, F. W., van Wingerden, J. W., Fleming, P. A., Ruben, S. D., Marden, J. R., and Pao, L. Y.: Wind plant power optimization through yaw control using a parametric model for wake effects-a CFD simulation study, Wind Energy, 19, 95–114, https://doi.org/10.1002/we.1822, 2016. a
Grant, I. and Parkin, P.: A DPIV study of the trailing vortex elements from the blades of a horizontal axis wind turbine in yaw, Exp. Fluids, 28, 368–376, https://doi.org/10.1007/s003480050396, 2000. a, b
Grant, I., Parkin, P., and Wang, X.: Optical vortex tracking studies of a horizontal axis wind turbine in yaw using laser-sheet, flow visualisation, Exp. Fluids, 23, 513–519, https://doi.org/10.1007/s003480050, 1997. a
Haans, W., Sant, T., van Kuik, G., and van Bussel, G.: Measurement of tip vortex paths in the wake of a HAWT under yawed flow conditions, J. Sol. Energ-T. ASME, 127, 456–463, https://doi.org/10.1115/1.2037092, 2005. a
Howland, M. F., Bossuyt, J., and Mart, L. A.: Wake structure of wind turbines in yaw under uniform inflow conditions, J. Renew. Sustain. Ener., 8, 043301, https://doi.org/10.1063/1.4955091, 2016. a, b, c, d, e
Jiménez, Á., Crespo, A., and Migoya, E.: Application of a LES technique to characterize the wake deflection of a wind turbine in yaw, Wind Energy, 13, 559–572, https://doi.org/10.1002/we.380, 2010. a, b, c
Knudsen, T., Bak, T., and Svenstrup, M.: Survey of wind farm control – power and fatigue optimization, Wind Energy, 18, 1333–1351, https://doi.org/10.1002/we.1760, 2014. a
Krogstad, P.-Å. and Adaramola, M. S.: Performance and near wake measurements of a model horizontal axis wind turbine, Wind Energy, 15, 743–756, https://doi.org/10.1002/we.502, 2012. a, b
Luo, L., Srivastava, N., and Ramaprabhu, P.: A study of intensified wake deflection by multiple yawed turbines based on large eddy simulations, in: AIAA SciTech Forum, (AIAA 2015-0220), https://doi.org/10.2514/6.2015-0220, 2015. a
Medici, D. and Alfredsson, P. H.: Measurements on a wind turbine wake: 3D effects and bluff body vortex shedding, Wind Energy, 9, 219–236, https://doi.org/10.1002/we.156, 2006. a, b
Pierella, F. and Sætran, L.: Wind tunnel investigation on the effect of the turbine tower on wind turbines wake symmetry, Wind Energy, 20, 1753–1769, https://doi.org/10.1002/we.2120, 2017. a
Schepers, J. G.: An engineering model for yawed conditions, developed on basis of wind tunnel measurements, in: American Institute of Aeronautics and Astronautics, 99-0039, 164–174, https://doi.org/10.2514/6.1999-39, 1999. a
Schepers, J. G., Boorsma, K., and Munduate, X.: Final results from Mexnext-I: analysis of detailed aerodynamic measurements on a 4.5 m diameter rotor placed in the large German Dutch Wind Tunnel DNW, J. Phys. Conf. Ser., 555, 012089, https://doi.org/10.1088/1742-6596/555/1/012089, 2014. a
Schottler, J., Hölling, A., Peinke, J., and Hölling, M.: Wind tunnel tests on controllable model wind turbines in yaw, in: AIAA 34th Wind Energy Symposium, p. 1523, https://doi.org/10.2514/6.2016-1523, 2016. a
Schottler, J., Hölling, A., Peinke, J., and Hölling, M.: Brief communication: On the influence of vertical wind shear on the combined power output of two model wind turbines in yaw, Wind Energ. Sci., 2, 439–442, https://doi.org/10.5194/wes-2-439-2017, 2017a. a, b
Schottler, J., Mühle, F., Bartl, J., Peinke, J., Adaramola, M. S., Sætran, L., and Hölling, M.: Comparative study on the wake deflection behind yawed wind turbine models, J. Phys. Conf. Ser., 854, 012032, https://doi.org/10.1088/1742-6596/854/1/012032, 2017b. a
Schottler, J., Bartl, J., Mühle, F., Sætran, L., Peinke, J., and Hölling, M.: Wind tunnel experiments on wind turbine wakes in yaw: redefining the wake width, Wind Energ. Sci., 3, 257–273, https://doi.org/10.5194/wes-3-257-2018, 2018. a, b, c
Schottler, J., Bartl, J., and Mühle, F.: Wind tunnel experiments on wind turbine wakes in yaw, Zenodo, available at: https://doi.org/10.5281/zenodo.1193656, last access: 29 May 2018.
Sukumar, N.: A Note on Natural Neighbor Interpolation and the Natural Element Method (NEM), Theoretical and Applied Mechanics, Northwestern University, IL 60208, available at: http://dilbert.engr.ucdavis.edu/~suku/nem/nem_intro/nem_intro.html (last access: 25 February 2017), 1997. a
Thomsen, K. and Sørensen, P.: Fatigue loads for wind turbines operating in wakes, J. Wind Eng. Ind. Aerod., 80, 121–136, https://doi.org/10.1016/S0167-6105(98)00194-9, 1999. a
Vollmer, L., Steinfeld, G., Heinemann, D., and Kühn, M.: Estimating the wake deflection downstream of a wind turbine in different atmospheric stabilities: an LES study, Wind Energ. Sci., 1, 129–141, https://doi.org/10.5194/wes-1-129-2016, 2016. a, b, c, d, e, f
Wang, J., Foley, S., Nanos, E. M., Yu, T., Campagnolo, F., Bottasso, C. L., Zanotti, A., and Croce, A.: Numerical and experimental study of wake redirection techniques in a boundary layer wind tunnel, J. Phys. Conf. Ser., 854, 012048, https://doi.org/10.1088/1742-6596/854/1/012048, 2017. a
Wharton, S. and Lundquist, J. K.: Assessing atmospheric stability and its impacts on rotor-disk wind characteristics at an onshore wind farm, Wind Energy, 15, 525–546, https://doi.org/10.1002/we.483, 2012. a, b
Wheeler, A. J. and Ganji, A. R.: Introduction to Engineering Experimentation, XI, 3rd edn., Pearson/Prentice Hall, Upper Saddle River, NJ, USA, 2004. a