the Creative Commons Attribution 4.0 License.
the Creative Commons Attribution 4.0 License.
 | 23 Sep 2019
Performance study of the QuLAF pre-design model for a 10 MW floating wind turbine
Freddy J. Madsen
Antonio Pegalajar-Jurado
Henrik Bredmose
This paper presents a comparison study of the simplified model QuLAF (Quick Load Analysis of Floating wind turbines) and a FAST model of the Technical University of Denmark (DTU) 10 MW reference wind turbine mounted on the LIFES50+ OO-Star Wind Floater Semi 10 MW floating substructure. The purpose is to investigate how accurate results can be obtained from this simplified model for different load cases. The two models are briefly presented and the limitations of QuLAF are discussed. These are (a) an under-prediction of the wave excitation loads for large sea states; (b) a simplified representation of the rotor-induced forcing and damping; (c) an over-predicted aerodynamic damping for the tower mode motion and (d) restriction to planar motion. All the limitations are linked to approximations applied for achieving the substantial model speedup relative to the state-of-the-art model. The comparative study is based on the planar version of design load cases (DLCs) 1.2, 1.3, 1.6, 2.1 and 6.1, and the overall analysis shows that the simplified model is generally good at estimating the bending moment at the tower base and the floater motions in heave and pitch. The largest tower-base bending moments are slightly over-predicted, but it is observed that while stronger wind leads to an over-prediction, stronger waves lead to an under-prediction. Thus, in DLC 1.6, where the largest load was obtained at 10.3 m s−1, a good match in tower-base bending moments between the two models is found. The nacelle acceleration, however, is generally under-predicted, which is linked to an over-prediction of the aerodynamic damping on the tower mode. Furthermore, the floater response in large sea states is influenced by the omission of viscous hydrodynamic drag forcing, which leads to an under-prediction of the wave excitation loads. A further investigation of the model limitations confirms these findings with respect to the tower mode damping and viscous drag loads, while the simplified approach to rotor-induced loads is found to provide remarkably accurate forcing results. Although a full design load basis evaluation with a state-of-the-art model must be carried out for the final design, the present results show the potential of applying simplified models in the preliminary design phase.
- Article
(7519 KB) - Full-text XML
- BibTeX
- EndNote


Table 1Main properties of the DTU 10 MW reference wind turbine.

The design of floaters for offshore wind turbines usually follows three steps: conceptual design, basic design and detailed design. Within basic design, state-of-the-art models such as FAST, Bladed or HAWC2 are used to calculate time-domain loads under various design load cases. As described in Müller et al. (2018), load cases are an inherent part in the wind turbine standards and define the specific design load criteria for the structural design according to defined classes of environmental conditions. These generic conditions describe wind, waves, gusts, currents, etc. and their related meteorological parameters in different classes of severity. The goal of conducting load cases is to cover all relevant load situations within the designated lifetime of the structure but more importantly to cover all potential design-driving situations, i.e. the situations leading to critical design loading. Load cases consist of normal operation, extreme events, stand-still conditions and transient events such as startup, shutdown and fault conditions.
Conducting a full design load basis (DLB) analysis, consisting of all design load cases for a floating wind turbine design for several concepts, is computationally expensive, especially if they are carried out with time-domain numerical tools simulating at real-time CPU speed (i.e. a simulated-to-simulation ratio of 1). Faster models may thus be valuable in the conceptual design phase, where quick answers for response levels and load levels may affect the design at an early stage. Also the accuracy requirements may be relaxed and allow for application of low-dimensional models enabling the application of optimization methods. Next, when the concept design is more refined, state-of-the-art models can be used in the design validation following current practice; and eventually more advanced models can be used for detailed design tasks. For certification, loads analysis of the full set of design load cases according to recognized standards using state-of-the-art models is required.
The present study concerns the applicability of simplified models in the design of floaters for offshore wind turbines in the 10 MW class, in order to answer the following question: how can accurate results be obtained from simplified models for different load cases? The work is part of the Lifes50+ project where both a state-of-the-art FAST model (Pegalajar-Jurado et al., 2018b, c) and a simplified model (Pegalajar-Jurado et al., 2018a) have been developed.
The simplified model, QuLAF (Quick Load Analysis of Floating wind turbines), is based on the same principles as the QuLAF model of Schløer et al. (2018) for monopile-type offshore wind turbines. First, in Sect. 2, the wind turbine, controller and the floating substructure are briefly described. Details on the FAST model and the simplified QuLAF model are given in Sect. 3. In Sect. 4, a selection of load cases is presented and the simulation setup described. Results of the simulations are shown in Sect. 5, along with a discussion of the observed trends. In continuation of the main results, Sect. 6 presents an investigation of QuLAF's limitations, focussing on how they affect the response of the structure. Lastly, some conclusions of the study are presented in Sect. 7.
The floating wind turbine is the Technical University of Denmark (DTU) 10 MW reference wind turbine (RWT) (Bak et al., 2013) mounted on the OO-Star Wind Floater Semi 10 MW, extensively described in Yu et al. (2018). Some of the main properties of the reference wind turbine are collected in Table 1.
The basic DTU wind energy controller is employed (Hansen and Henriksen, 2013), which consists of a controller for the partial load region (i.e. operation below rated wind speed) and one for the full load region (i.e. operation above rated wind speed), and a mechanism that smoothly switches between these around rated wind speed. The pole-placement method, described in Hansen et al. (2005), was used to tune the controller to avoid pitch instability, as detailed in Yu et al. (2018).
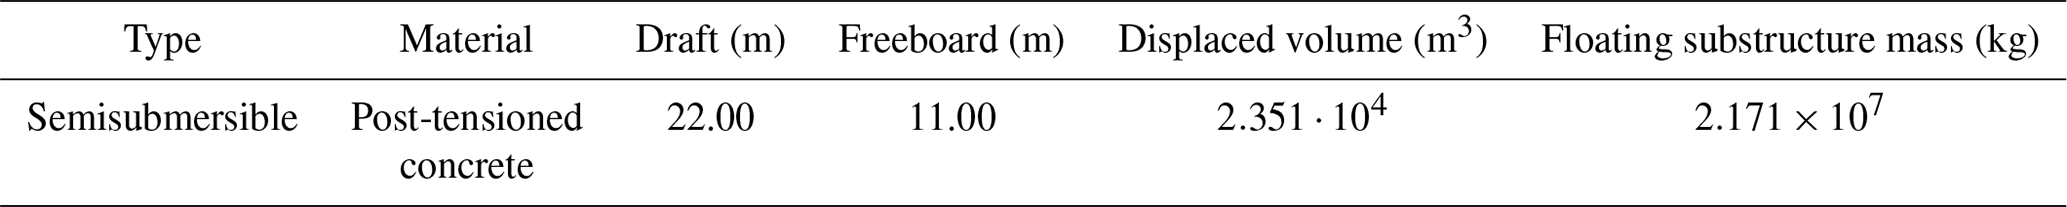
The floating substructure, developed by Olav Olsen AS (http://www.olavolsen.no, last access: 29 April 2019) is made of post-tensioned concrete and consists of a central column and three outer columns mounted on a star-shaped pontoon with three legs. Each outer column is connected to the seabed by a catenary mooring line with a suspended clump weight. Some of the main properties of the floater configuration are stated in Table 2 and further information can be found in Yu et al. (2018).
Table 2Main properties of the OO-Star Semi floating substructure.
3.1 State-of-the-art model
A FAST (Jonkman and Jonkman, 2016) time-domain model of the DTU 10 MW RWT mounted on the OO-Star Wind Floater Semi 10 MW has been developed in the LIFES50+ and reported in Pegalajar-Jurado et al. (2018b) and Pegalajar-Jurado et al. (2018c). A semi-flexible approach has been adapted in the modelling work to capture some of the floating substructure flexibility by extending the definition of the tower to still water level (SWL) (Pegalajar-Jurado et al., 2018b). Two tower modes are included in each direction (fore–aft and side–side).
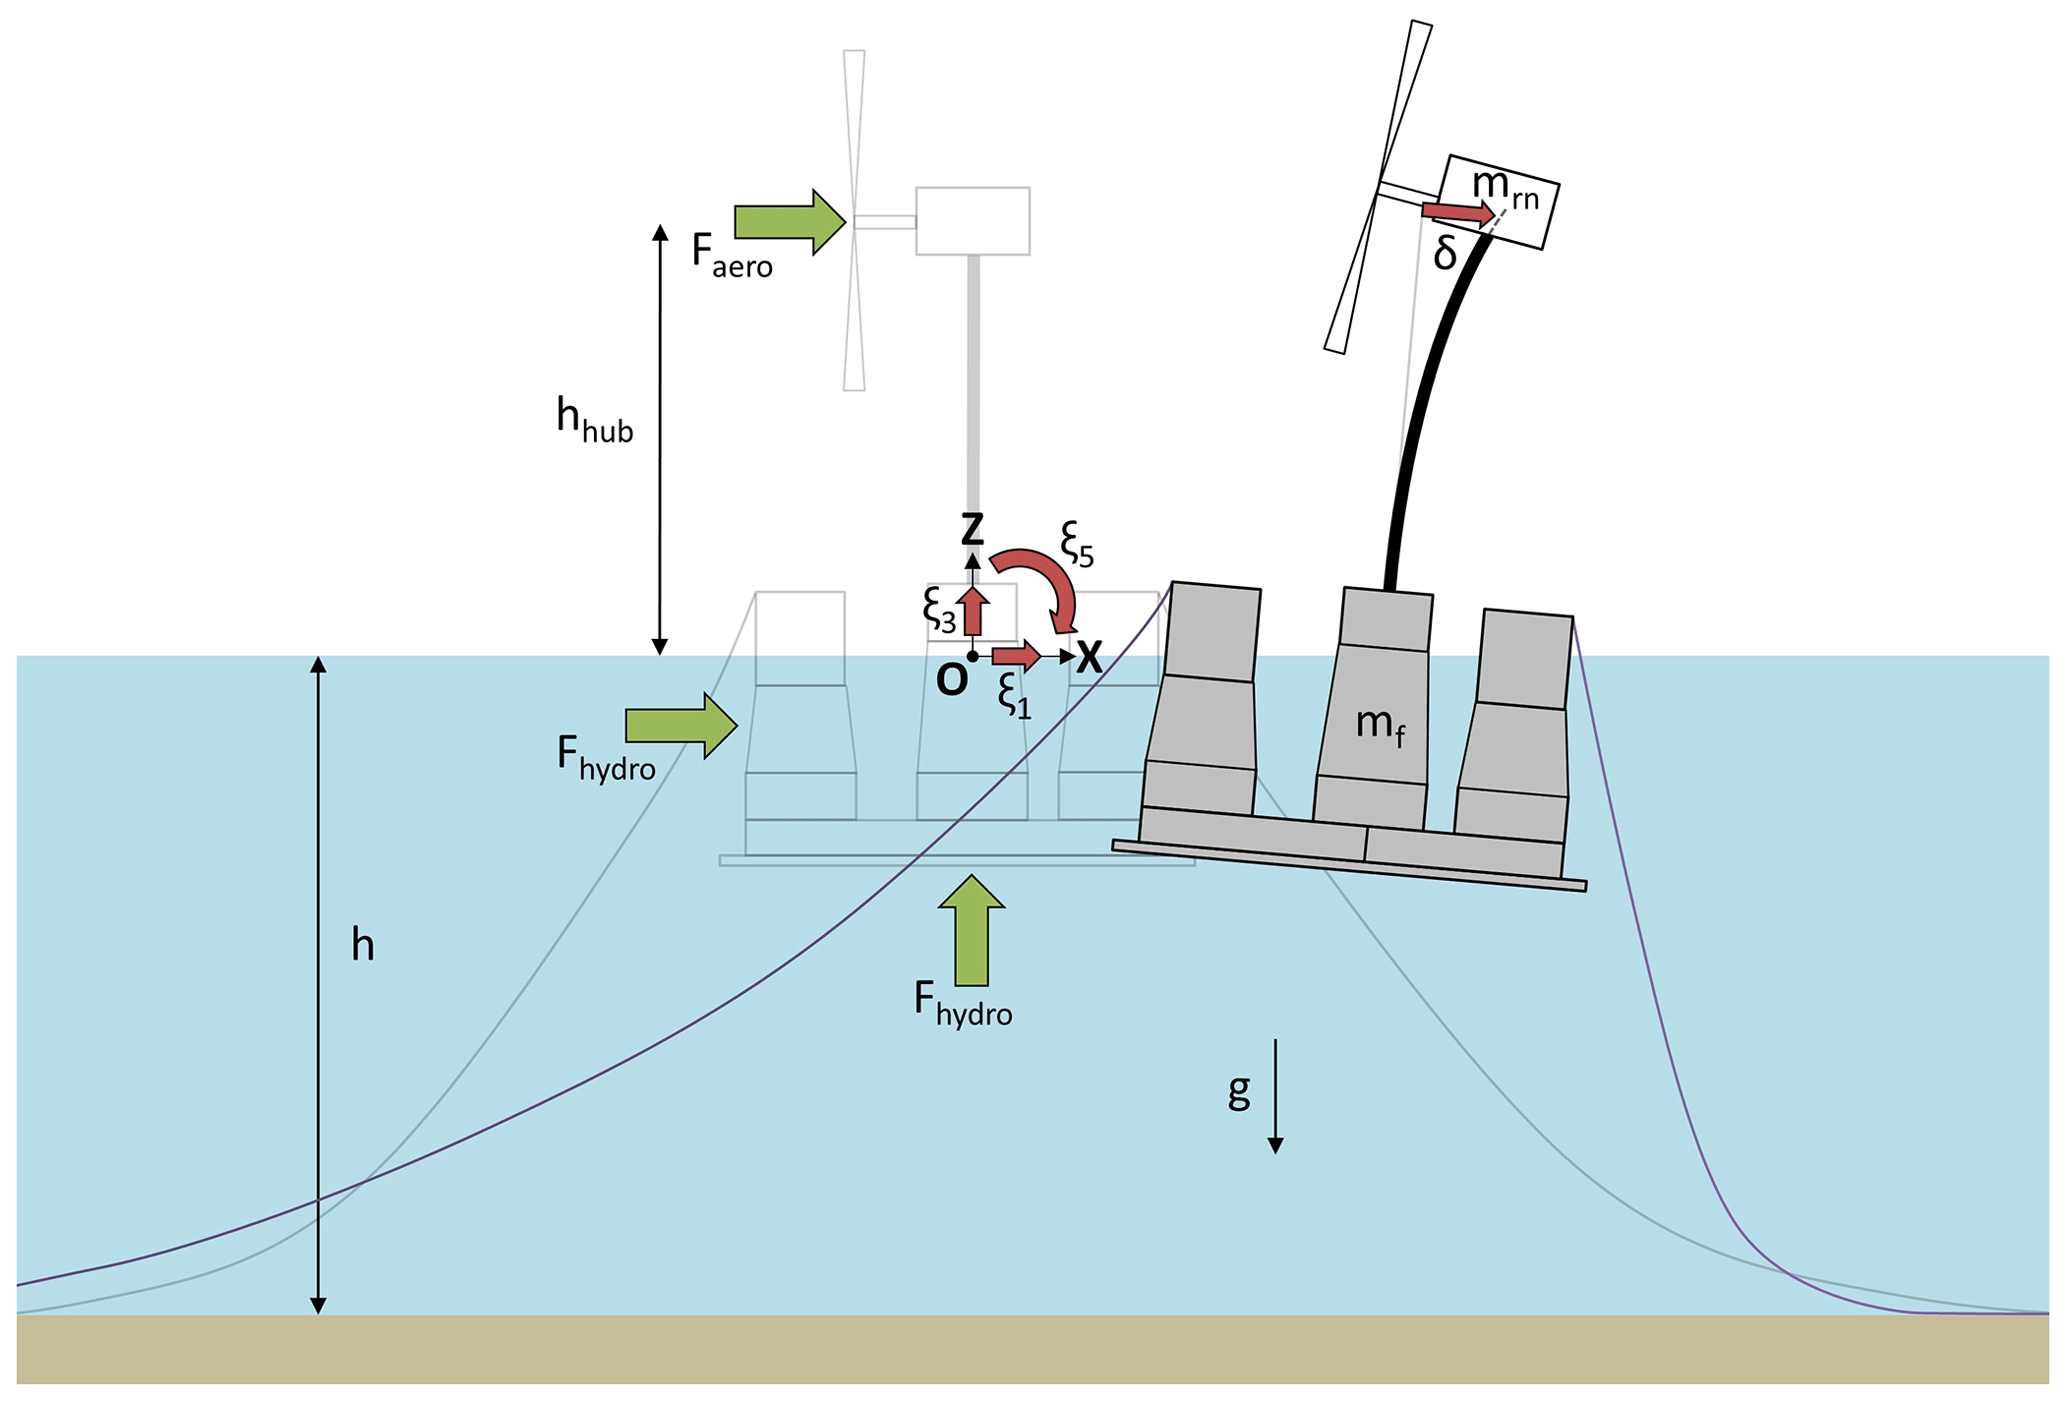
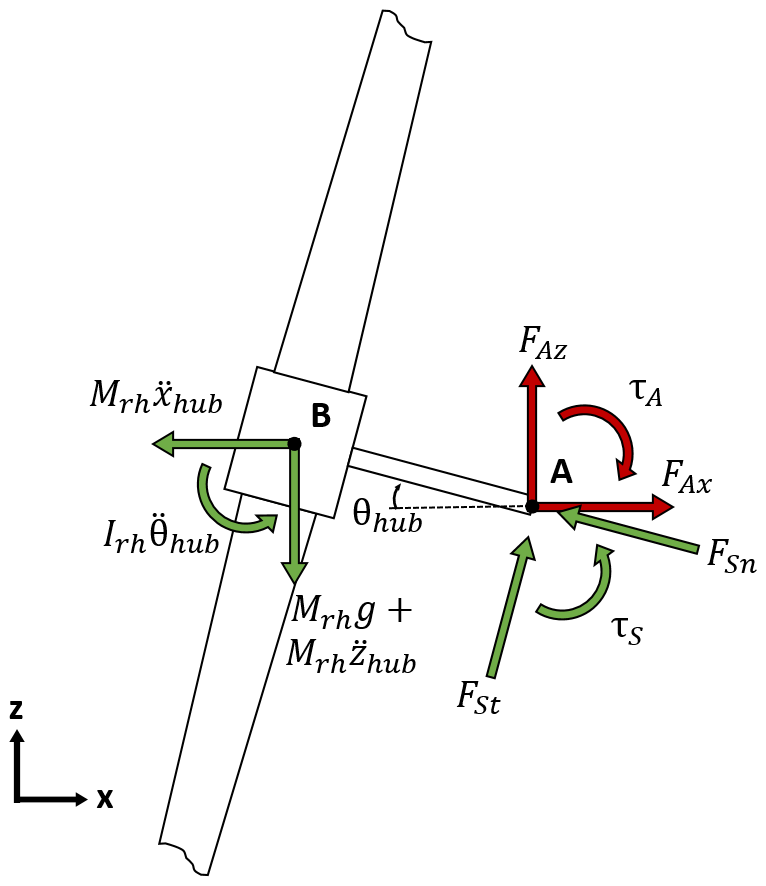
Figure 1Sketch of the floating wind turbine as seen by the QuLAF model from Pegalajar-Jurado et al. (2018a).
The hydrodynamic modelling is based on pre-computed linear radiation–diffraction coefficients, obtained by the frequency-domain, potential-flow solver WAMIT (Lee and Newman, 2016). No second-order effects were included in this study. Viscous drag is not captured by potential-flow solvers; thus, it is included by the drag term in the Morison equation. Since FAST allows only cylindrical members of the floater for the Morison description, special effort was made to represent the effect of the heave plates in both surge/sway, heave and pitch/roll. This is detailed in Pegalajar-Jurado et al. (2018b). Finally, the model utilizes a dynamic lumped-mass mooring line model that allows the use of multi-segmented mooring lines.
3.2 The simplified model: QuLAF
A simplified model of the floater–turbine configuration was implemented in terms of the QuLAF model. The modelling concept and philosophy are described in Schløer et al. (2018) for bottom-fixed substructures and in Pegalajar-Jurado et al. (2018a) for floating wind turbines; see also Lemmer et al. (2016). The main purpose of QuLAF is to provide quick answers about design loads and natural frequencies in the pre-design phase, where many design variations are tried before the first basic design is chosen. The simplicity and efficiency are obtained by inclusion of only four degrees of freedom (DoF), linearization of the equations of motion, pre-computation of aerodynamic rotor forcing and damping, and solution of the equations of motion in the frequency domain. As a result of these simplifications, the computational speed in QuLAF is approximately 2000 times faster than real time (after pre-processing of the aerodynamic loads), whereas standard time-domain models have a simulated-to-real-time ratio around 1.
The four degrees of freedom are the platform surge, heave and pitch and the modal amplitude of the first tower mode, which is illustrated in Fig. 1. Thus, QuLAF solves only a 2-D problem and is restricted to aligned wind and waves. For the load predictions, this means that only the fore–aft moments and forces can be considered. The linear equations of motion in the frequency domain are written in QuLAF as Eq. (1), considering the three in-plane floater degrees of freedom and the flexible tower mode as a fourth degree of freedom.
Here, ω is the angular frequency, is the response vector, Mstr is the structural mass matrix, Bstr is the structural damping, Cstr is the structural stiffness, and Fhyd is the hydrodynamic loads. The aerodynamic loads Faero are pre-computed with fixed nacelle, rigid blades and active control. The matrices A(ω), Brad(ω) and Chyd are the hydrodynamic added mass, hydrodynamic radiation damping and the hydrostatic stiffness, which are obtained from the WAMIT solver. The mooring restoring matrix Cmoor is extracted from the state-of-the-art model by linearization around each equilibrium position, i.e. for each mean wind speed. In QuLAF, the viscous forcing is neglected, while the viscous damping Bvisc is represented by a linearized damping matrix under the assumptions of inertia load dominance and small amplitude motion. More details are given in Pegalajar-Jurado et al. (2018a). It should be noted that damping on the mooring lines is not included in QuLAF, but for floaters where this is important, this can be included in the global damping matrix.
A state-of-the-art model, which in this study is the FAST model, is used to provide inputs to QuLAF, such as the simplified structural tower modelling, the aerodynamic forcing and damping, and the linearized mooring matrix. This means that QuLAF contains phase information, as time series of pre-computed aerodynamic loads and free-surface elevation are input to the model. As a consequence, time series of the results are available for comparison to time-domain models and for further post-processing, such as rainflow counting.
The linear representation of the aerodynamic damping Baero is obtained from step tests in steady wind, where the wind speed goes from the cut-in to the cut-out. This means that for every step to a new wind speed, the structure decays to a new equilibrium position. These “decays” allow an equivalent linear damping ratio to be extracted and the principle is based on the work done by Schløer et al. (2016) and Schløer et al. (2018). Schafhirt and Muskulus (2018) made a detailed analysis of this approach and found that although the aero-elastic damping process is not linear, it can be successfully modelled by a linear damping model. In QuLAF, the approach is extended to multiple degrees of freedom. These decay tests are carried out in the FAST model in calm water and with the wind turbine controller active, for each degree of freedom with all the other degrees of freedom locked and rigid blades. This allows the floating wind turbine to be a one-degree-of-freedom spring-mass-damper system in each degree of freedom, where the horizontal position of the hub is of interest.
If all sources of hydrodynamic and structural damping are disabled, the aerodynamic damping is the only responsible for the decay of the hub motion, and it can be extracted from the time series. For simplicity, the turbulence intensity was put to zero to limit the number of decay tests.
3.3 Summary of model limitations
QuLAF solves a linear and reduced version of the equations of motion typically solved in a full state-of-the-art model, to allow for the linearization and fast solution in the frequency domain. Prior to the present study, a smaller set of results with the QuLAF model has been presented in Pegalajar-Jurado et al. (2018a). In Pegalajar-Jurado et al. (2018a) and the present results, the main limitations of QuLAF were summarized as follows:
- a.
The first limitation is an under-prediction of the wave excitation loads for strong sea states due to the omission of viscous hydrodynamic drag forcing. This leads to an under-prediction of surge, nacelle acceleration and pitch responses for strong sea states.
- b.
Another limitation is the difficulty to capture the complexity of aerodynamic loads around rated wind speed, where the controller switches between the partial-load (torque control; fixed blade pitch) and full-load control regions (varying blade pitch; fixed target shaft speed).
- c.
The final limitation is an under-predicted nacelle acceleration due to over-predicted aerodynamic damping for the tower mode motion (at 0.682 Hz). Since the damping of the decay test, used to extract the aerodynamic damping, is based on a clamped tower with rigid blades, the natural frequency of this setup (0.51 Hz) is lower and thus leads to a larger damping than that at the coupled tower frequency in QuLAF (0.682 Hz). In comparison, the full FAST model has a coupled tower frequency of 0.746 Hz when moored and with flexible blades.
Table 3Selection of design load cases. Note that the comparative study was limited to aligned wind–wave conditions only, due to the restriction of QuLAF to planar motion. Each simulation had a length of 90 min, where the first 30 min were discarded to remove transient response in the time-domain model.

The present study shows the mapping of accuracy between the simplified model, QuLAF (Pegalajar-Jurado et al., 2018a), and the FAST model for a subset of critical load cases, which are selected based on the findings from Müller et al. (2018). The selected load cases included fatigue during normal operation (DLC 1.2), ultimate loads during power production in severe sea states (DLC 1.6) and ultimate loads when the turbine is parked during a 50-year storm event (DLC 6.1). Further, for the present study of analysing the applicability of QuLAF in the design phase, it was decided to add two additional design load cases, namely ultimate loads during power production in extreme turbulence (DLC 1.3) and ultimate loads during a transient event triggered by a loss of electrical network connection (DLC 2.1). DLC 1.3 was considered in order to fully evaluate the results of QuLAF by comparing with the baseline load case (DLC 1.2) and the extreme sea state load case (DLC 1.6). DLC 2.1 was included to see how well QuLAF handles a transient event.
Table 3 details the selection of load cases as stated in the IEC61400-3 design code (IEC, 2009). Here, NTM, ETM and EWM refer to normal turbulence model, extreme turbulence model and extreme wind model. Further NSS, SSS and ESS refer to normal, severe and extreme sea states. Simplifications have been made to each load case since QuLAF only solves a 2-D problem and is thus restricted to aligned wind and wave load conditions. This also means that only in-plane loads and motions have been investigated. All NSS load cases were based on the long-term joint probability distribution of MetOcean parameters presented in Krieger et al. (2015), which were to be considered for the fatigue analysis. Ideally, one would use the site-specific data for the other DLCs with NSS, but in order to have DLC 1.2 to also serve as a baseline load case for the ultimate limit state (ULS) DLCs, it was decided to use the joint probability distribution (NSS). In agreement with the project design basis (Krieger et al., 2015), each wind speed in each load case had three realizations of the wave spectrum peak period.
Six different wind and wave seeds were simulated for each environmental condition, with the only exception of DLC 2.1 where four seeds were deemed sufficient, as the maximum loads in this case are governed by the transient shutdown event. For each environmental condition, the characteristic value is the mean of the maximum values of the different realizations (seeds) and is used for evaluation. Furthermore, a simulation time of 5400 s with the same length of turbulent wind field was used for all the load cases including 1800 s run-in time to remove any transient response in the time-domain model. This run-in time corresponds to approximately nine surge periods, which was deemed acceptable for the lowest sea state, where the transient influence is highest.
The results involve a fatigue limit state (FLS) analysis and a ULS analysis, each displaying the design load and response values for different parts of the floating wind turbine, i.e. nacelle acceleration, tower-base bending moment, surge, heave and pitch motion of the floater.
In general, the design load and response values for both the QuLAF model and the FAST model are presented as a function of wind speed. Thus, the wave heights and periods were chosen according to the wind speed, as specified in Table 3 and in Krieger et al. (2015). In addition, to better compare the load prediction of the two models, corresponding quantile–quantile (Q–Q) plots are also presented. Furthermore, at the end of Sect. 5, box plots of the response peaks are used to describe the spread and median of the ratio between the damage-equivalent or maximum values from QuLAF and FAST.
5.1 FLS study
First, we present the results of the fatigue evaluation study. In the analysis, the damage-equivalent loads (DELs) are presented, computed from each load time series by the rainflow counting method. Although the nacelle acceleration is not a load, it was analysed with the rainflow counting method and presented as DEL, since internal loads in the nacelle may be directly related to the nacelle acceleration. The fatigue DEL nacelle acceleration and tower-base bending moment for FAST and QuLAF are shown in Fig. 2 as a function of wind speed, together with the corresponding Q–Q plot.
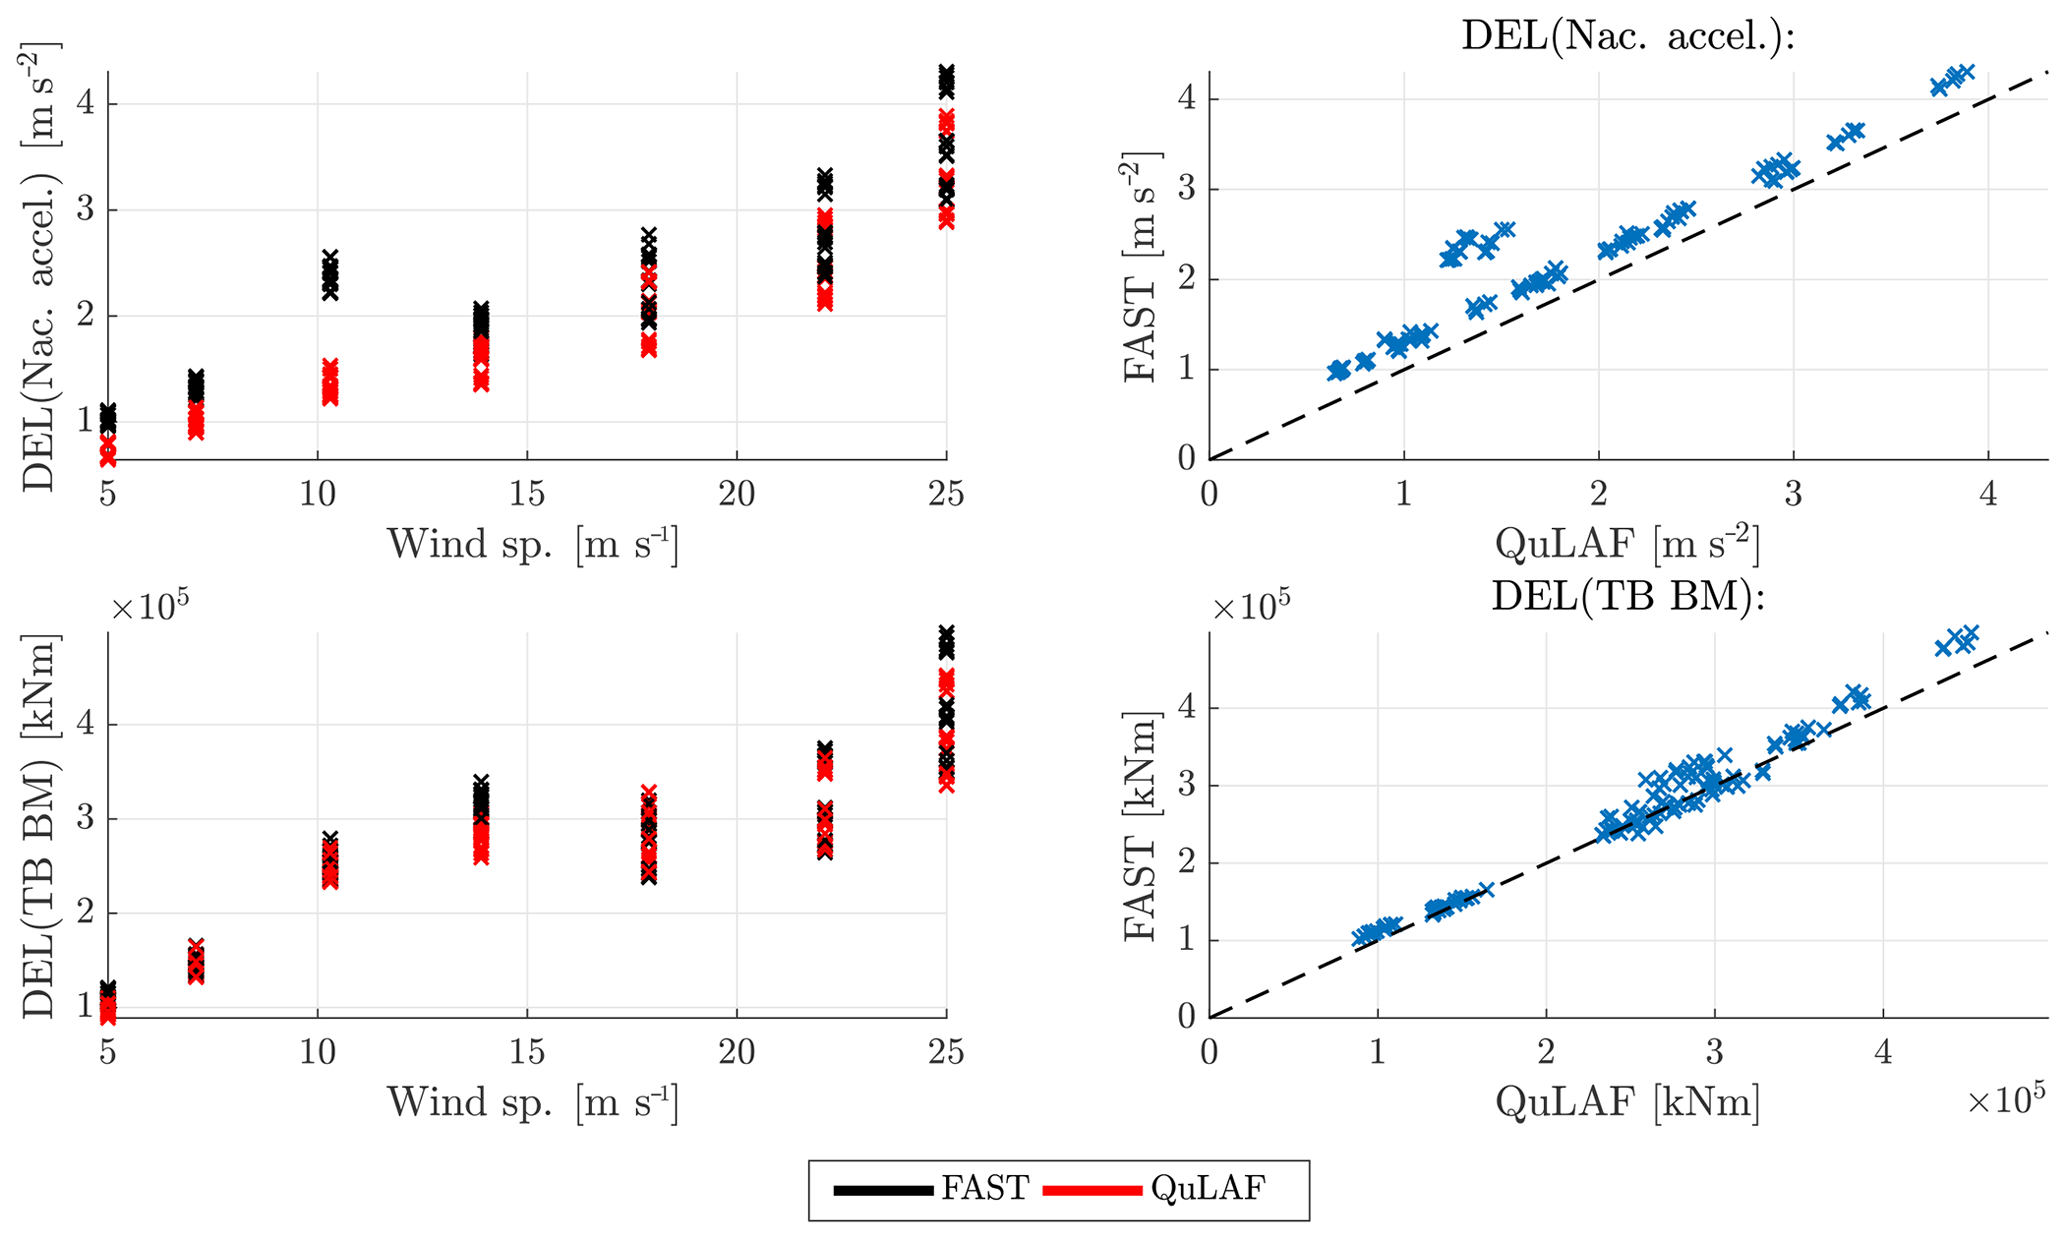
Figure 2Fatigue damage-equivalent nacelle acceleration and bending moment at the tower base for DLC 1.2.
These results are followed by Table 4 presenting the DEL values, where the weighting of the different wind speeds and wave periods according to the assumed Weibull distribution and probabilities (Krieger et al., 2015) has been taken into account.
It can be seen that the nacelle acceleration is generally under-predicted in QuLAF, and since the nacelle acceleration is governed by the wind forcing for this load case, it might be explained by an enhanced effect of limitation B (the complex dynamics around rated conditions makes the controller behave differently in the two models) and C (the over-estimated aerodynamic damping on the tower vibrations in QuLAF). This may also explain the distinct deviation at 10.3 m s−1, which is highly affected by the controller transition. The largest DEL for both models is observed at the strongest environmental state, i.e. 25 m s−1, but with a 20 % under-prediction in QuLAF. However, the largest DEL contribution is associated with rated conditions when the probabilities from the Weibull distribution are taken into account.
The tower-base bending moment, on the other hand, shows an overall good agreement between the two models but with a slight under-prediction of QuLAF just above rated conditions and at cut-out. A conclusion that can also be observed in Table 4 for the total Weibull-weighted DEL. It is seen that, while a disagreement is seen for the nacelle acceleration DEL (an under-prediction of 26 %), the tower-base bending moment agrees well, with an under-prediction of 5 %.
5.2 ULS study for operational load cases
We now proceed with the ULS simulation study for the operational load cases. A total of 126 1 h simulations (7 wind speeds × 3 wave periods × 6 seeds) were carried out for each of the two models. Although DLC 1.2 (power production in normal conditions) is intended for fatigue analysis, we present ULS results from this load case as well, to form a baseline for DLC 1.3 and DLC 1.6 with stronger turbulence and waves, respectively.
Table 4FAST and QuLAF probability-weighted DEL results, based on probabilities from the Weibull distribution of NSS (Krieger et al., 2015).
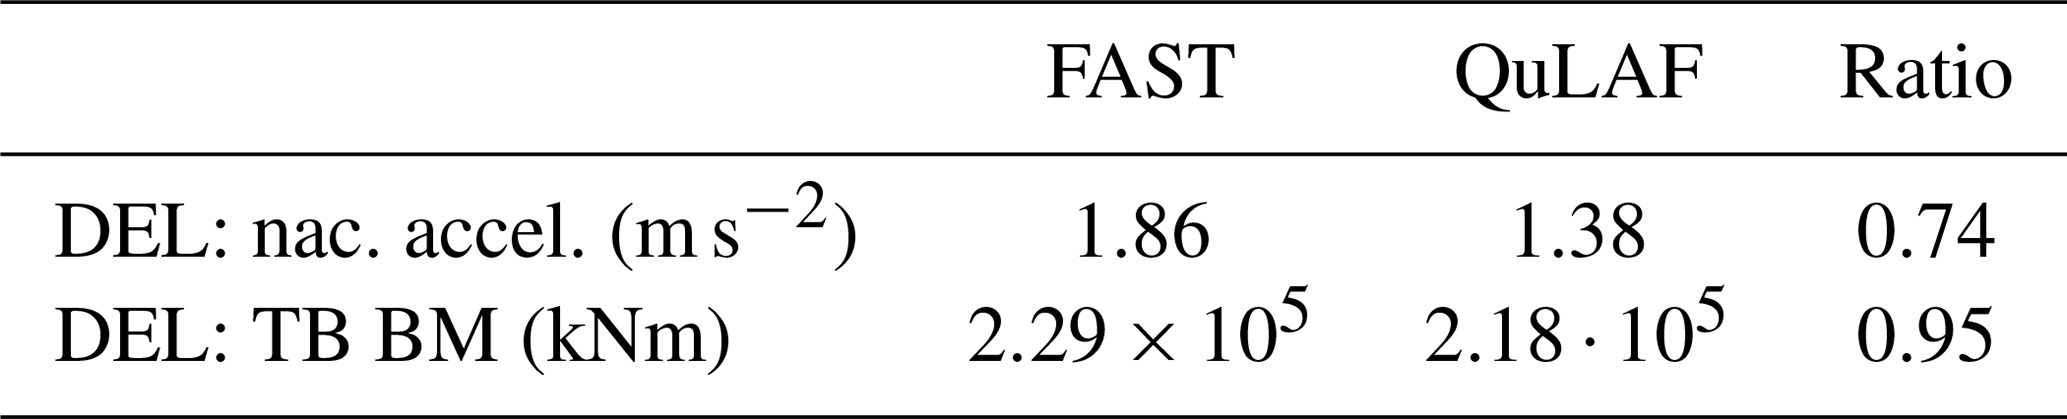
Figure 3 shows the nacelle acceleration, tower-base bending moment and floater motion across the various wind speeds for the two models. Overall, there is a good agreement between the models, especially for the floater motion (5 % mean deviation of the max. values), even at large values of response, and it is seen that all but the heave motion are wind-dominated. Similarly to the FLS study, the nacelle acceleration is under-predicted by QuLAF and the largest value is obtained at 25 m s−1 with an 11 % under-prediction, as seen in Table 5. The largest under-prediction is observed around rated conditions and may be linked to limitation B. It is also seen that QuLAF also over-predicts the tower-base bending moment for the largest values obtained around rated conditions by 7 %–13 %.
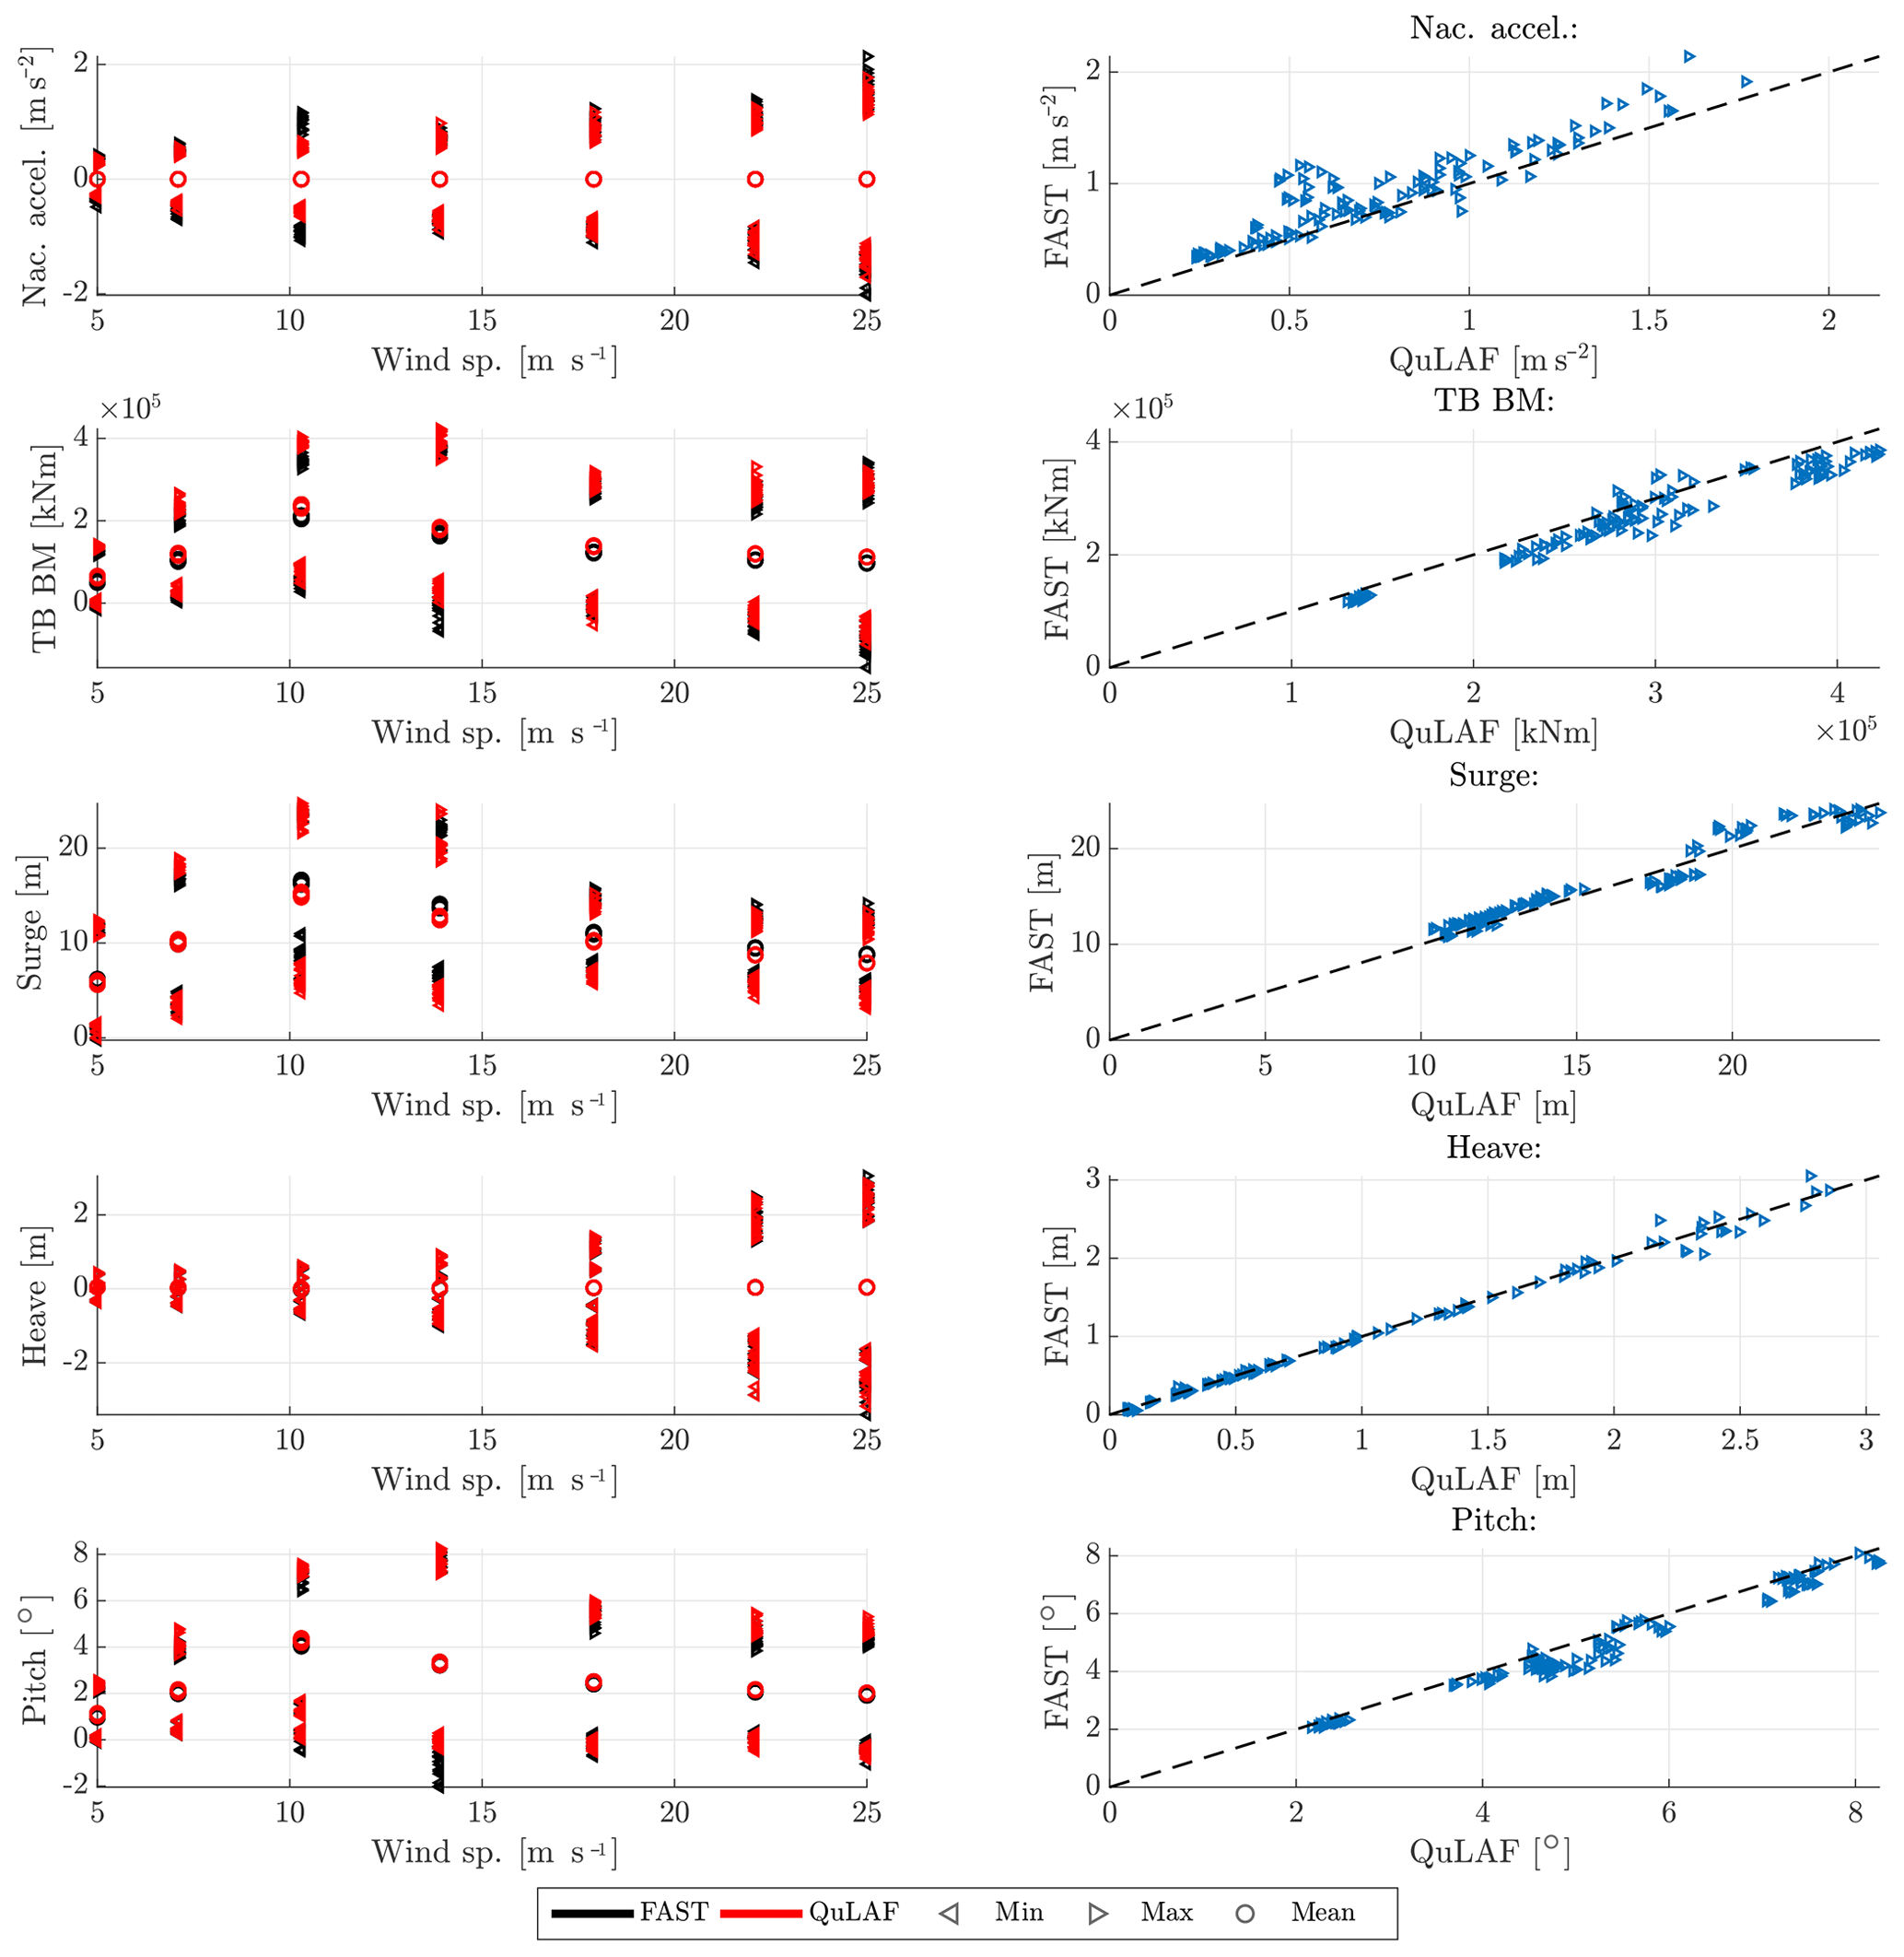
Figure 3Response to DLC 1.2 for FAST and QuLAF. Left: min., max. and mean values for every realization as a function of wind speed. Right: maximum values for FAST as a function of the corresponding maximum values in QuLAF.
Table 5Ratio of max. response (QuLAF ∕ FAST) averaged per wind speed for DLC 1.2.
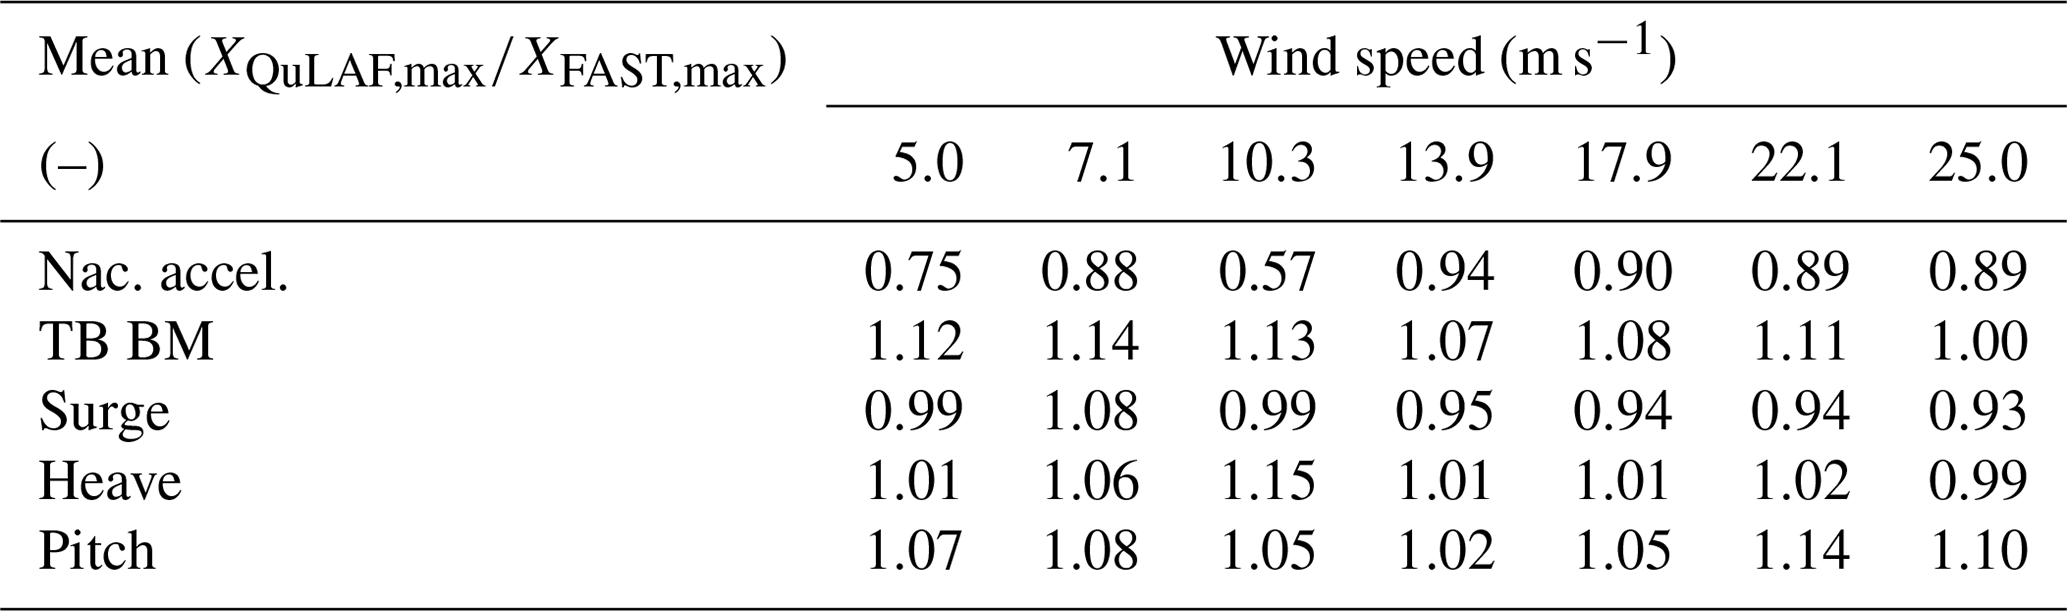
We can now turn to DLC 1.3, which consists of the same number of simulations as DLC 1.2 but now with extreme turbulence. In Fig. 4, the nacelle acceleration, tower-base bending moment and planar motions of the floater are shown as a function of mean wind speed together with the corresponding Q–Q plot.
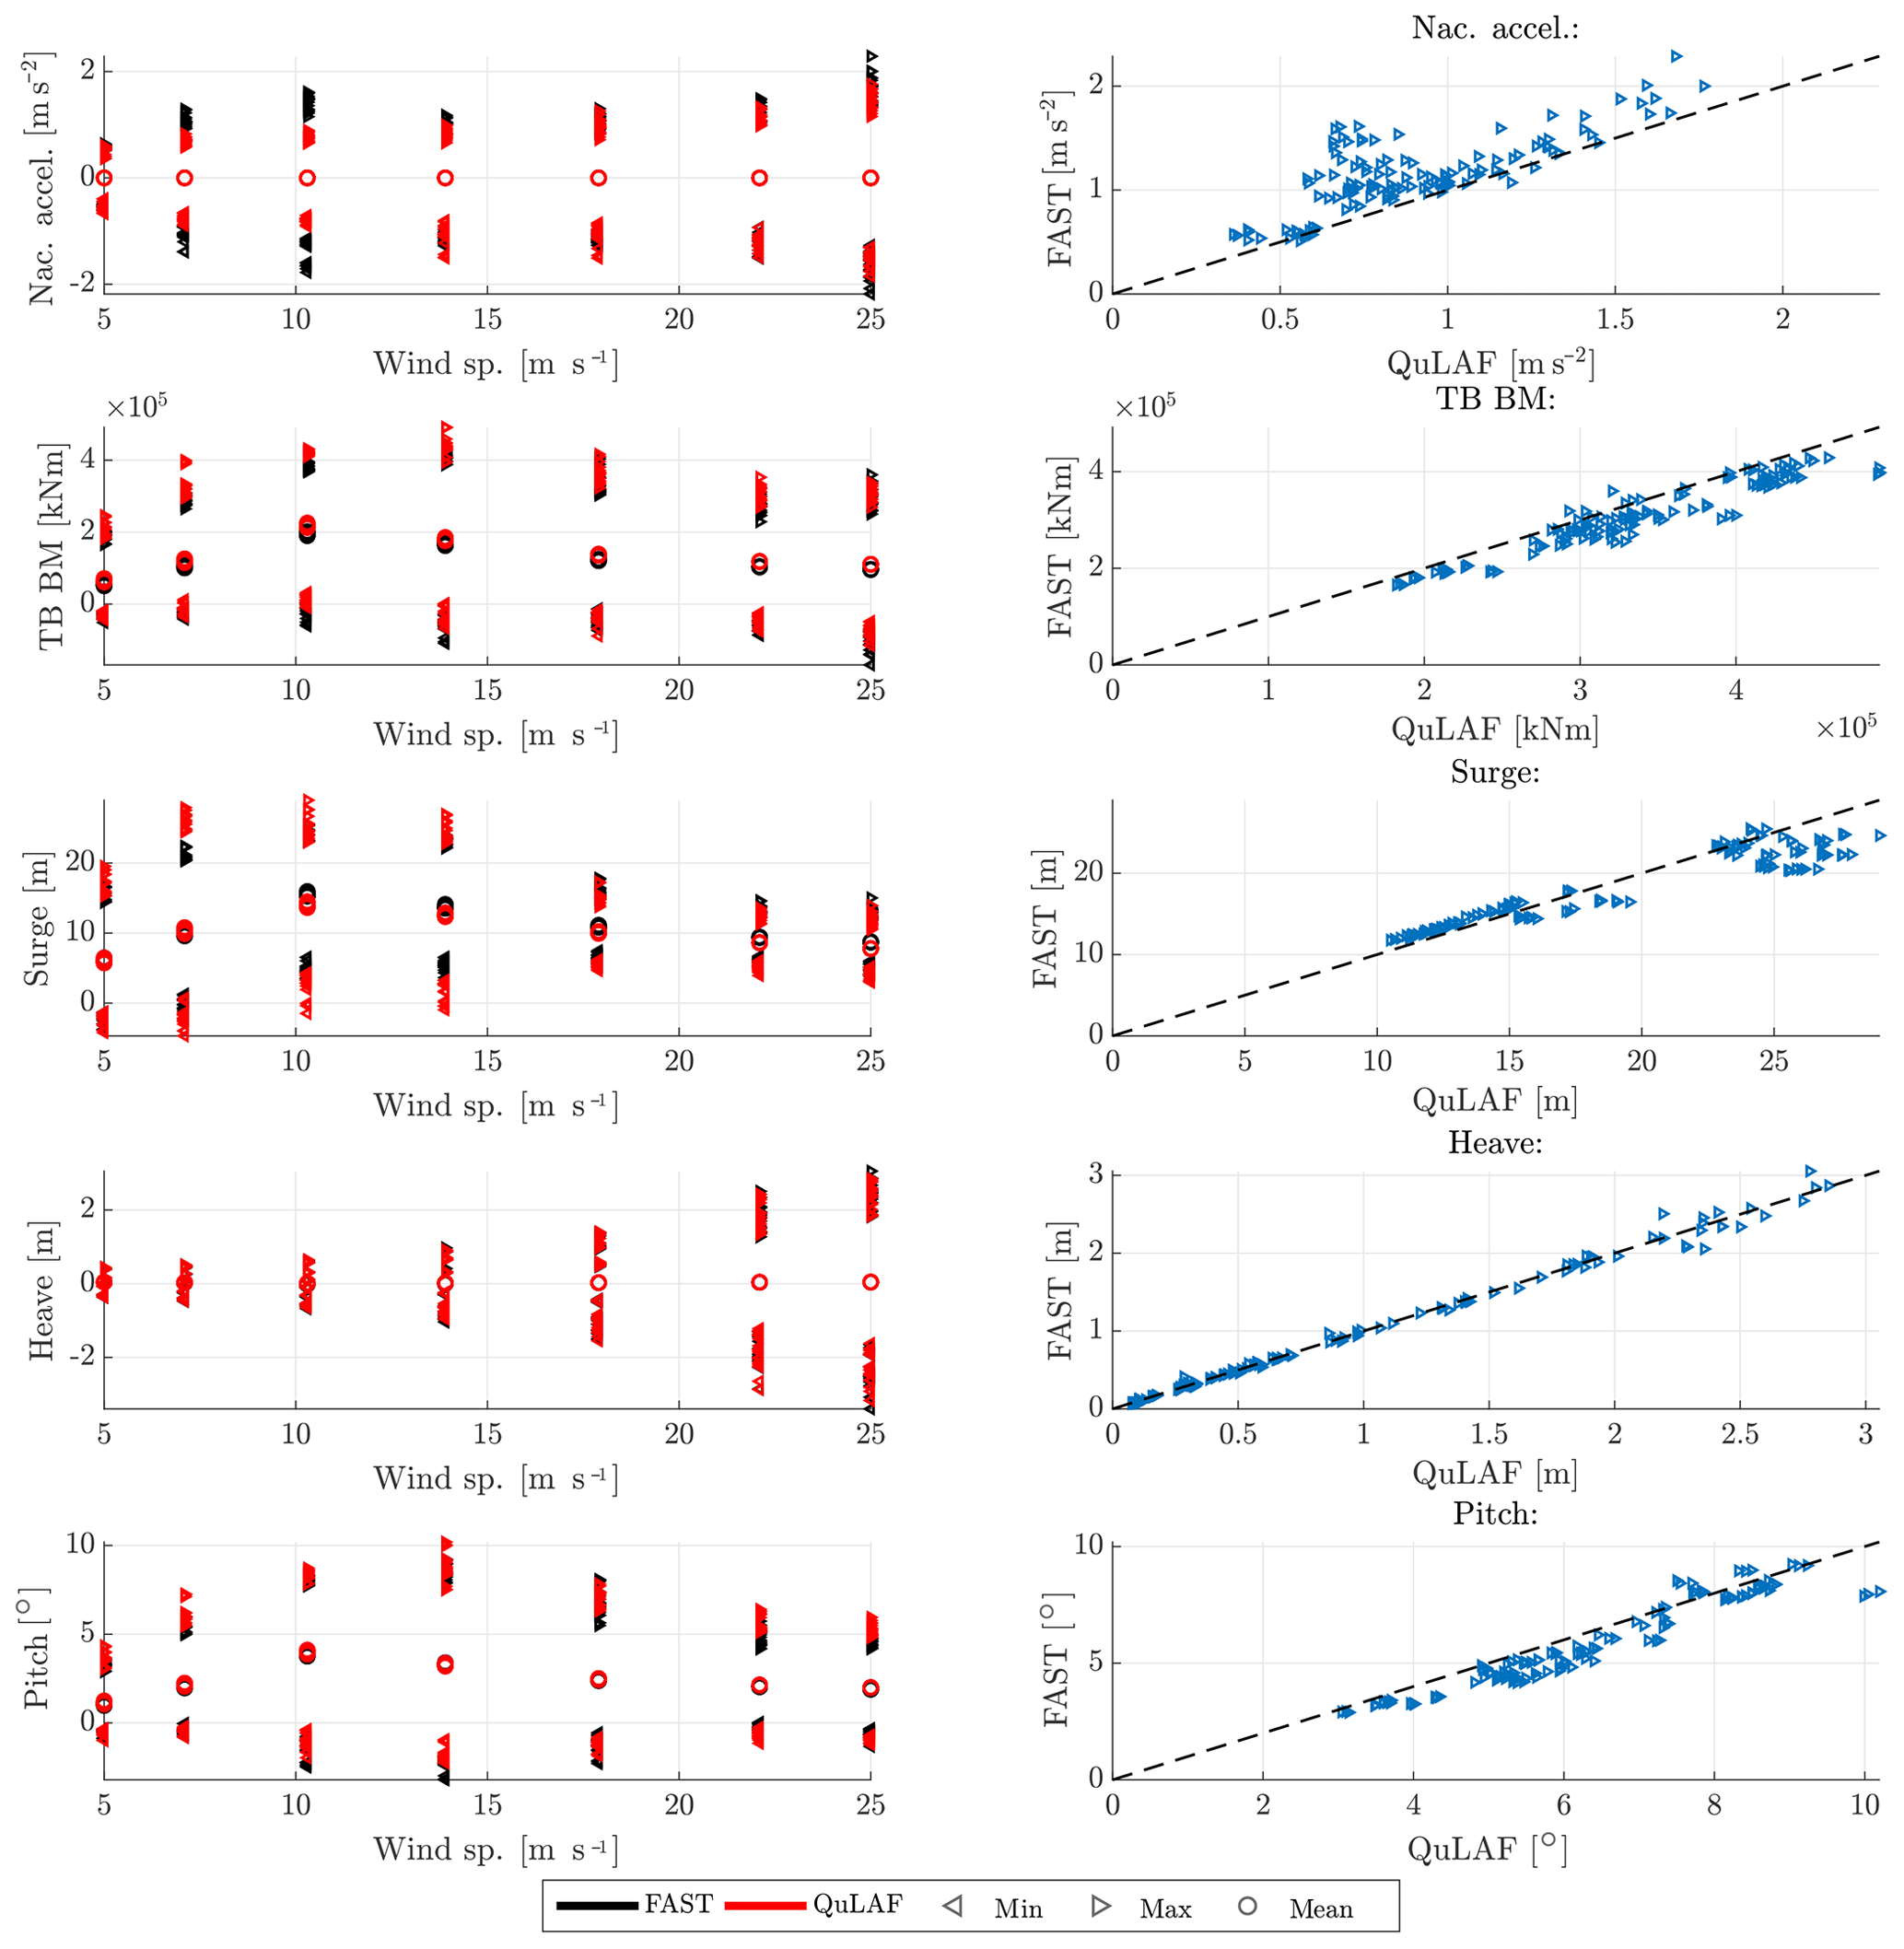
Figure 4Response to DLC 1.3 for FAST and QuLAF. Left: min., max. and mean values for every realization as a function of wind speed. Right: maximum values for FAST as a function of the corresponding maximum values in QuLAF.
Overall, the wind forcing is more dominant for low wind speeds when compared to DLC 1.2. However, the load variation trend is similar to DLC 1.2, where the largest values of response are seen around rated wind speed for the tower-base bending moment, surge and pitch, while the nacelle acceleration and heave are largest at 25 m s−1. The extreme turbulence enhances the relative surge and pitch response in QuLAF. This can be seen as a large over-prediction in surge and pitch at 7.1 m s−1 of 22 % and 13 %, respectively, while an 44 % under-prediction of the nacelle acceleration is also observed. The largest nacelle acceleration is obtained at rated conditions with a severe under-prediction of 47 %, as seen in Table 6. As for DLC 1.2, the tower-base bending moment shows the largest load at rated conditions, with the same level of over-prediction of 11 %. For the heave motion, the responses from the two models agree very well (mean deviation of 3 %) and are largest at cut-out.
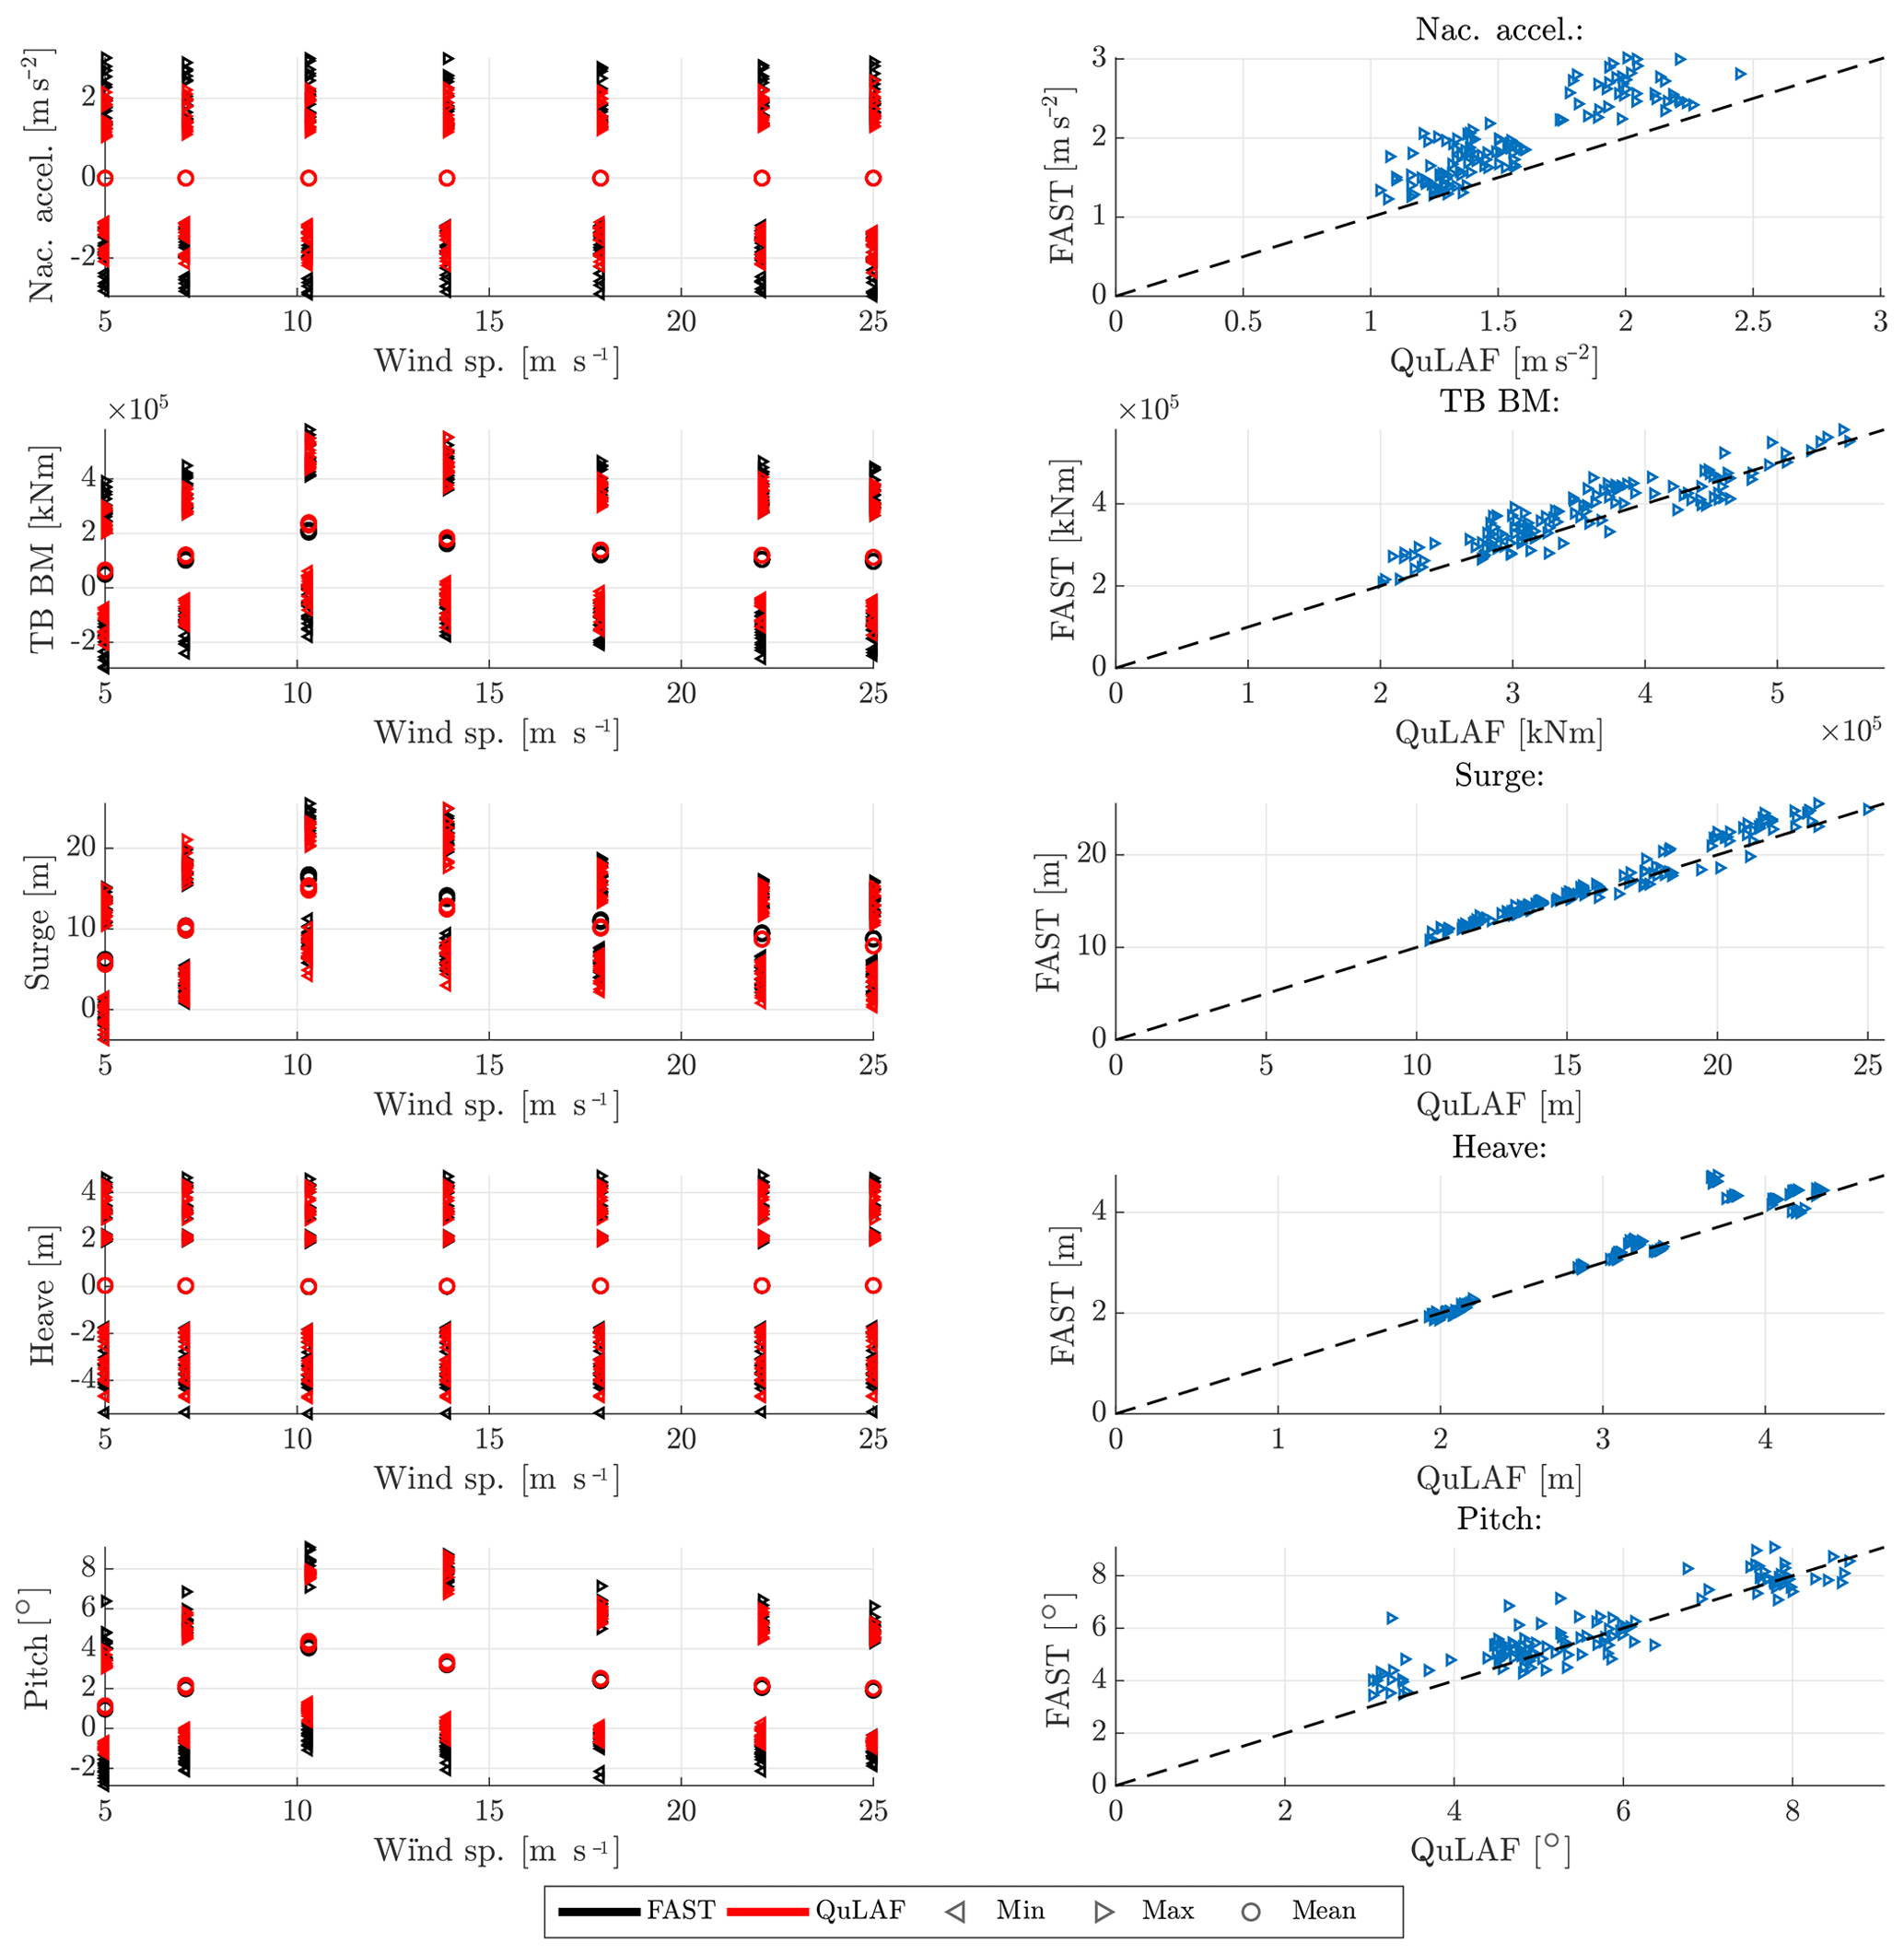
Figure 5Response to DLC1.6 for FAST and QuLAF. Left: min., max. and mean values for every realization as a function of wind speed. Right: maximum values for FAST as a function of the corresponding maximum values in QuLAF.
Table 6Ratio of max. response (QuLAF ∕ FAST) averaged per wind speed for DLC 1.3.
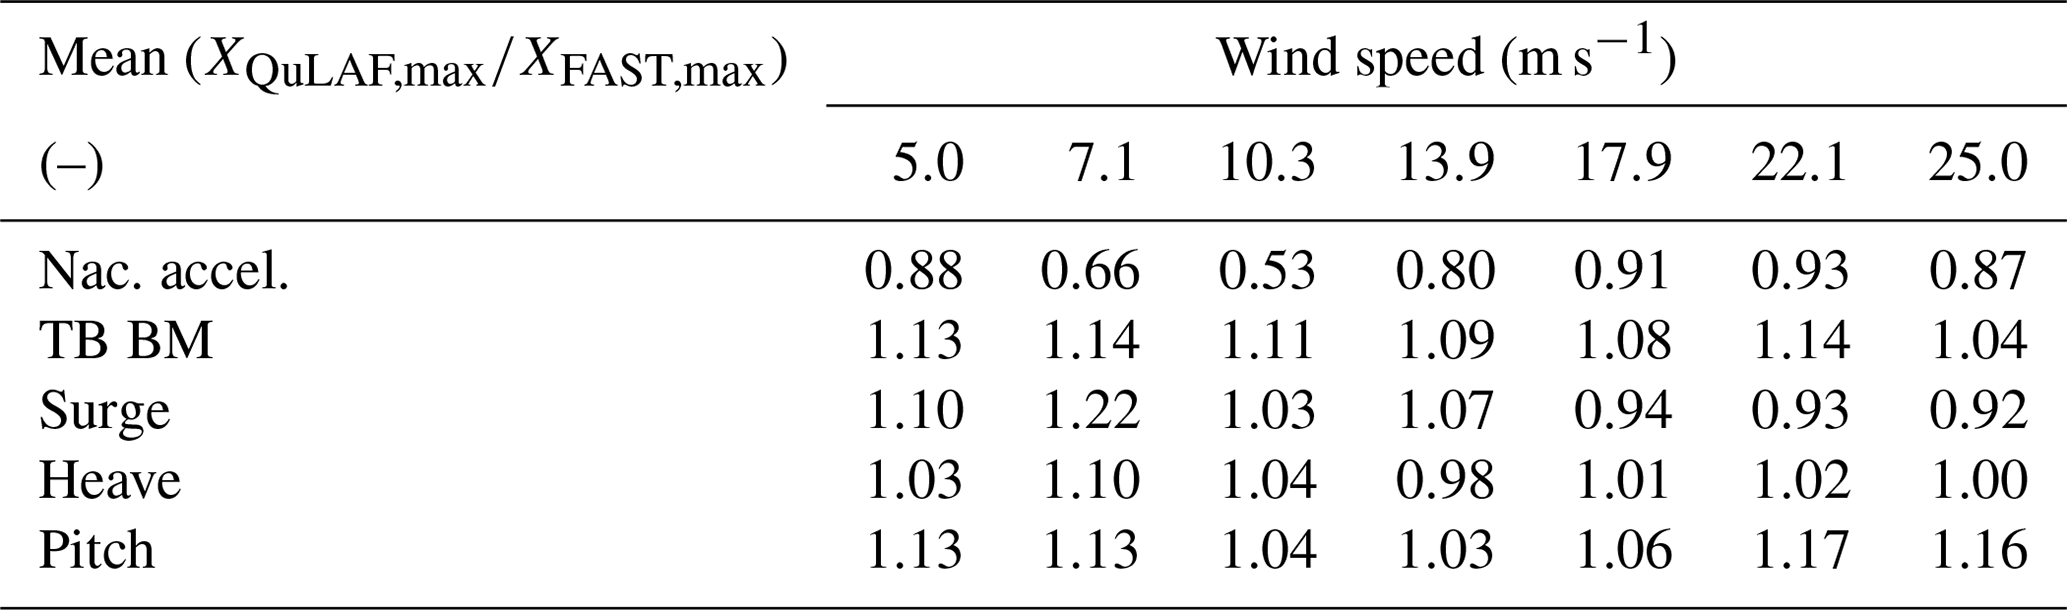
Table 7Ratio of max. response (QuLAF ∕ FAST) averaged per wind speed for DLC1.6.
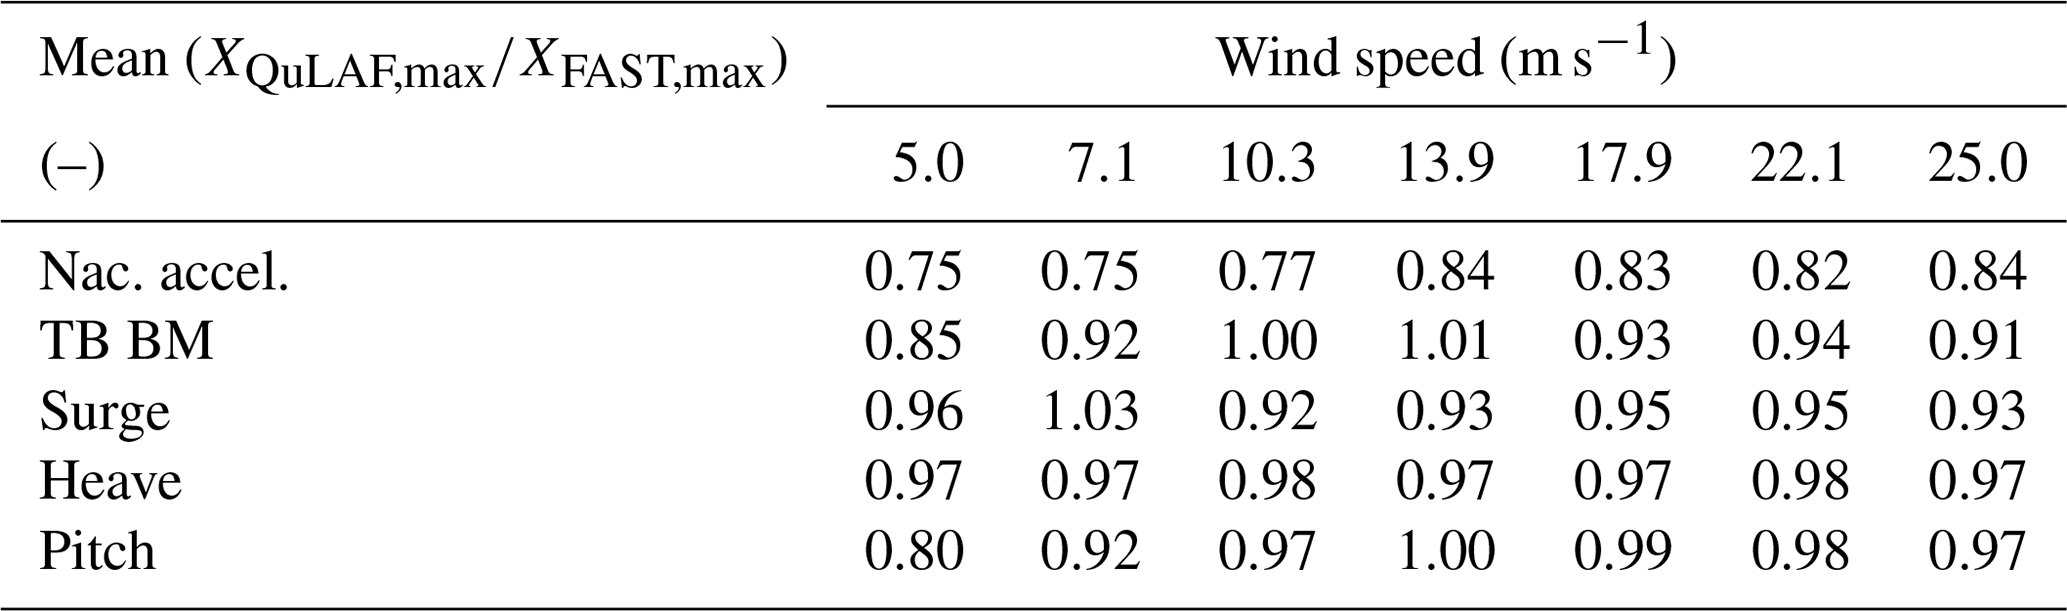
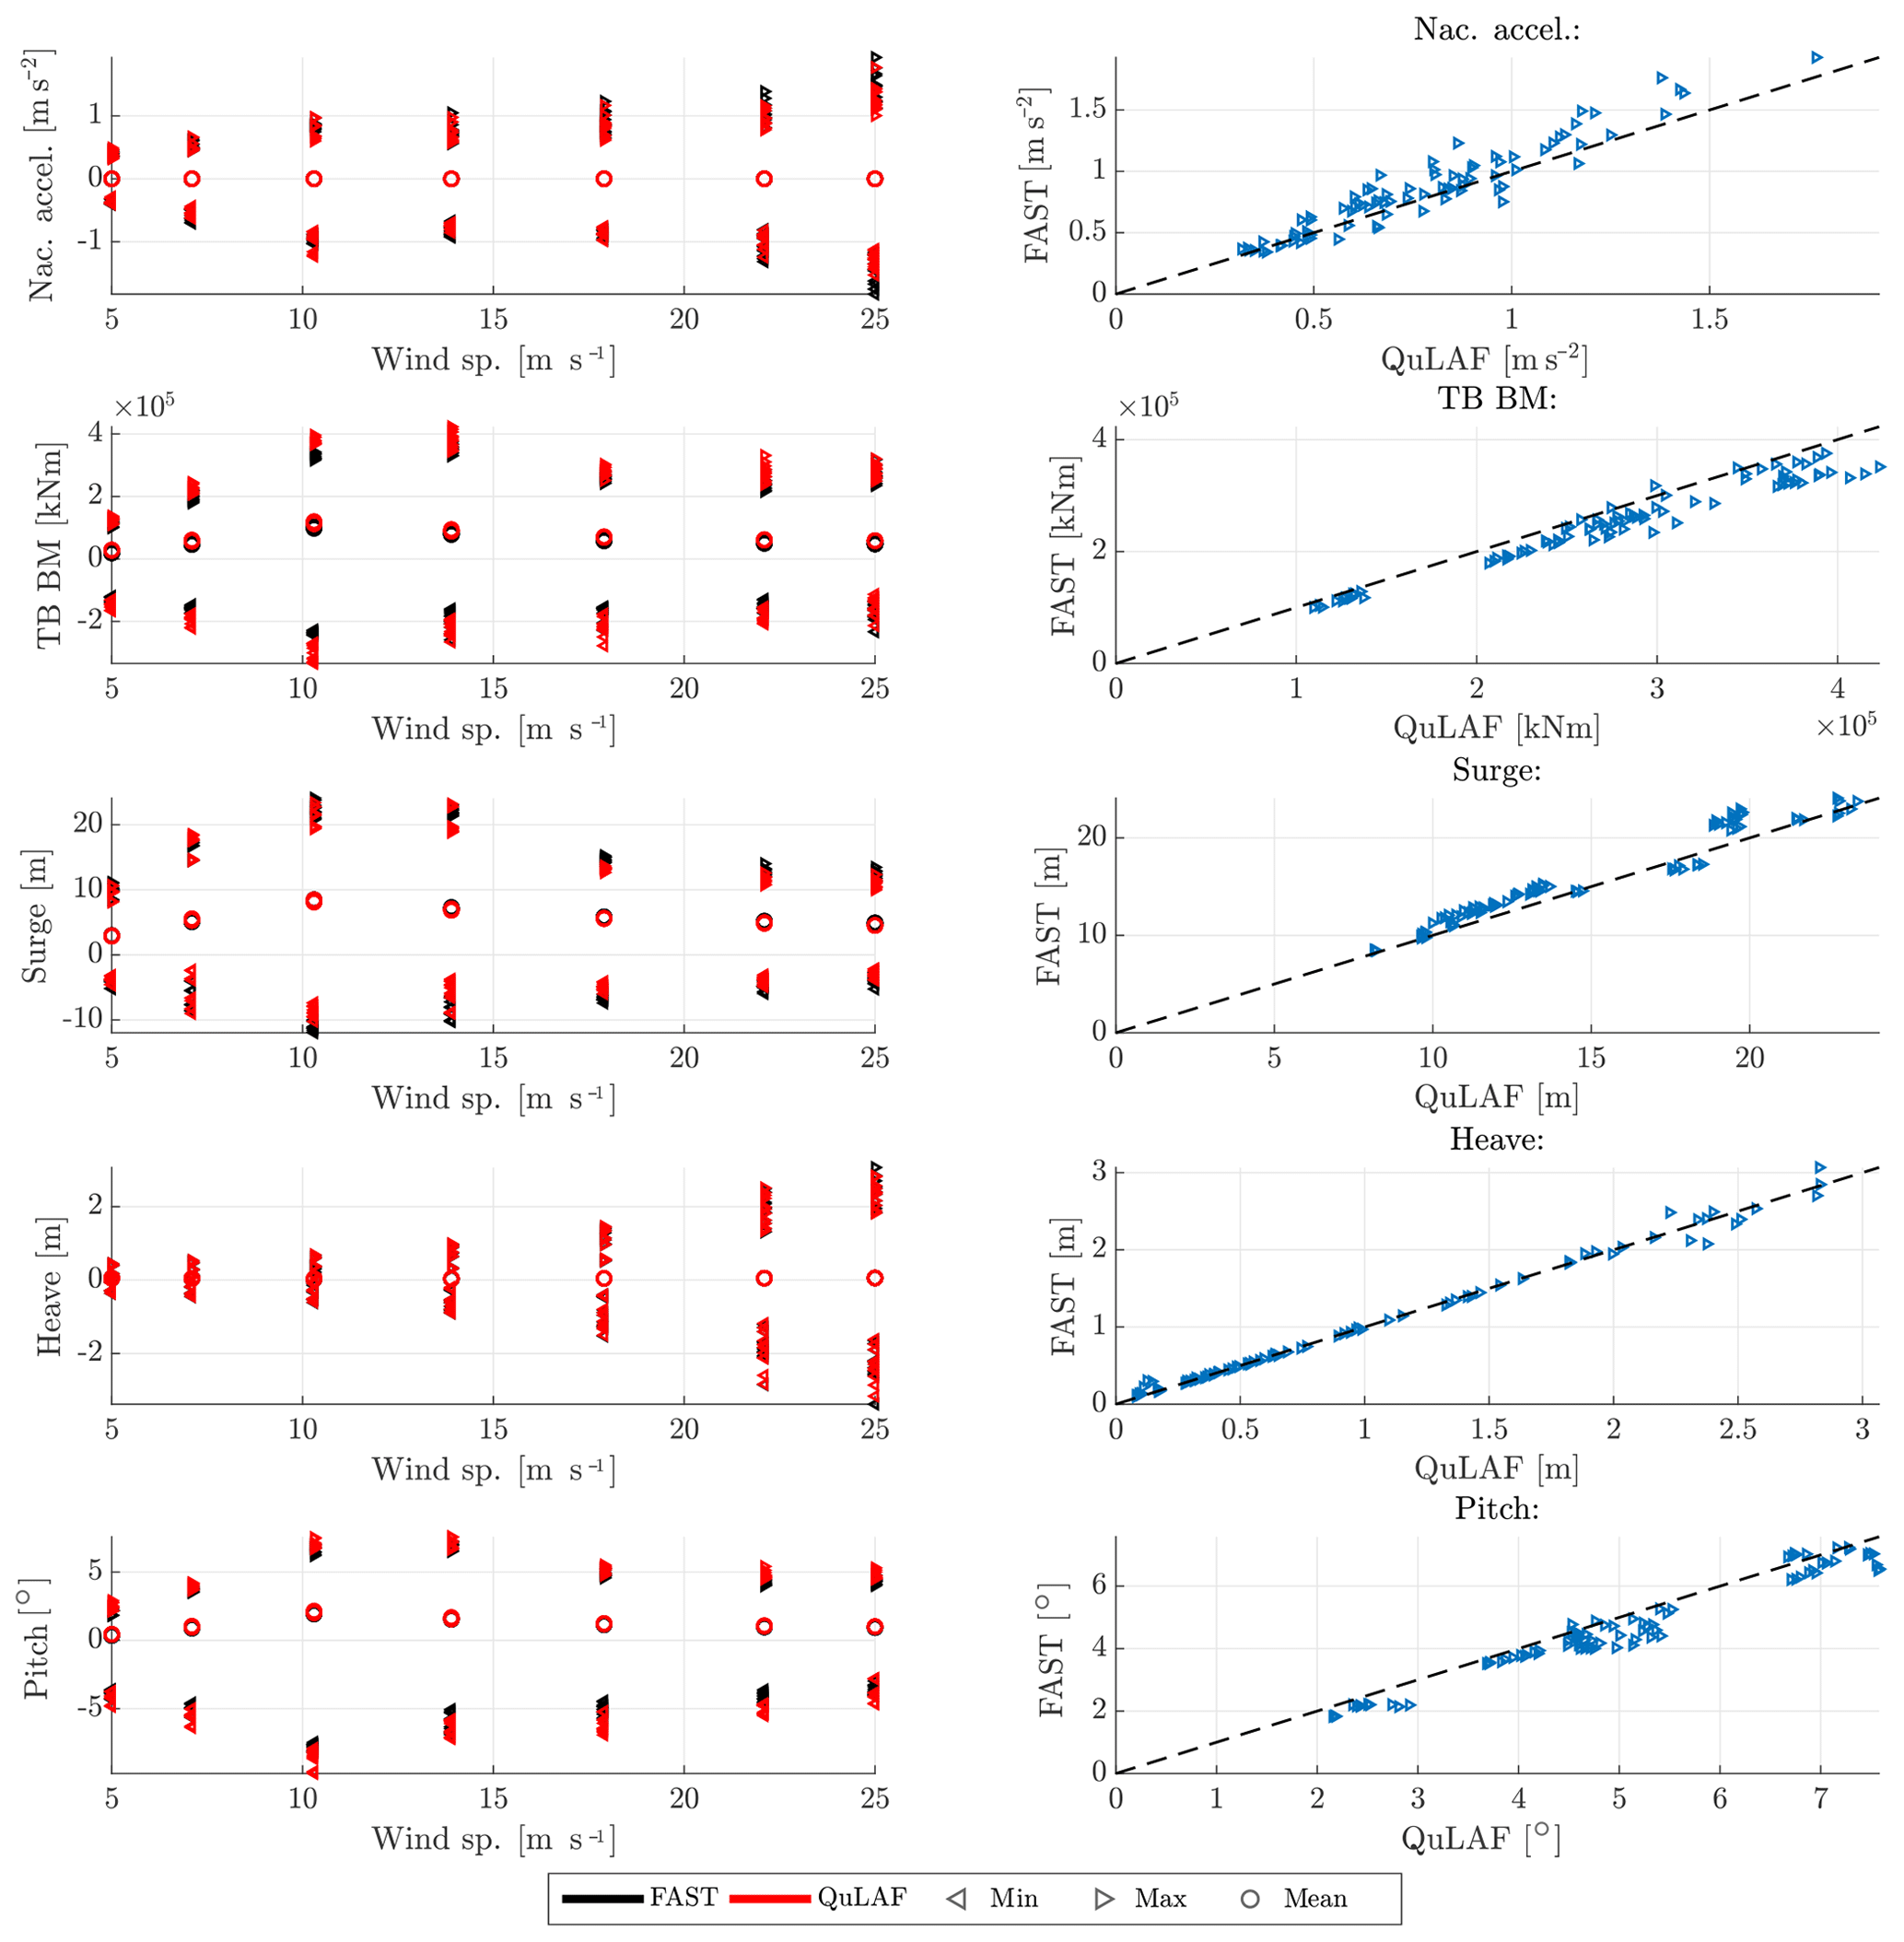
Figure 6Response to DLC2.1 for FAST and QuLAF. Left: min., max. and mean values for every realization as a function of wind speed. Right: maximum values for FAST as a function of the corresponding maximum values in QuLAF.
For DLC 1.6, the waves are given by the severe sea state, which for the given design basis corresponds to the 50-year sea state, while the turbulence model is normal as in DLC 1.2. This means that the same severe waves are applied across all wind speeds, thus consisting of the same number of simulations as DLC 1.2 and DLC 1.3 (7 wind speeds × 3 wave periods × 6 seeds). The nacelle acceleration, tower-base bending moment and planar motions of the floater are shown in Fig. 5 as a function of mean wind speed together with the corresponding Q–Q plot. Furthermore, Table 7 describes the mean values of the response ratios.
Table 8Ratio of max. and min. response (QuLAF ∕ FAST) averaged per wind speed for DLC 2.1.

Compared to DLC 1.2, the nacelle acceleration and tower-base bending moment are now more wave-dominated, as the max response values are more uniform over the wind speeds due to the fact that severe waves are the same across all wind speeds. It is seen that nacelle acceleration is generally under-predicted up to 25 %, which may be due to limitations A and C. However, the largest tower-base bending moments, obtained at rated wind, are matched very well by QuLAF. This good match is unexpected, given the observed discrepancies for extreme wave and extreme wind situations for the present floater, and it is probably due to a cancellation effect.
The floater motions, with respect to surge and heave, show a good agreement around rated conditions for surge with a 7 %–8 % under-prediction and overall a very good match for heave, where an under-prediction of 3 % is observed. The consistent under-prediction of the surge response by QuLAF, seen in Table 7, is linked to limitation A (omission of the viscous hydrodynamic drag forcing) but could be a mix of A and C (QuLAF over-estimates the aerodynamic damping on the tower vibrations) around rated conditions. Furthermore, it can be observed for the surge motion that the combination of larger waves and under-prediction in DLC 1.2 and DLC 1.3 compensates the deviation between QuLAF and FAST for the largest responses, which might be linked to limitation A.
5.3 ULS study for grid loss and parked conditions
We now proceed with the ULS simulation study for grid loss and parked conditions. This load case is included to demonstrate that, even for a transient event, the frequency-domain approach is applicable. In all simulations, an emergency stop at t=3600 s was simulated during operation with normal turbulence and normal sea state. A total number of 84 simulations (7 wind speeds × 3 wave periods × 4 seeds) are considered, where only four seeds are included as the transient event governs the maximum loads and responses.
The nacelle acceleration, tower-base bending moment and planar motions of the floater are shown in Fig. 6. Overall, we see that QuLAF does a good job in handling the transient load case when compared to the FAST results. Also it can be seen that the load and response variation trends are very similar to DLC 1.2, and from Table 8 the deviation levels on the maximum values are of the same magnitude.
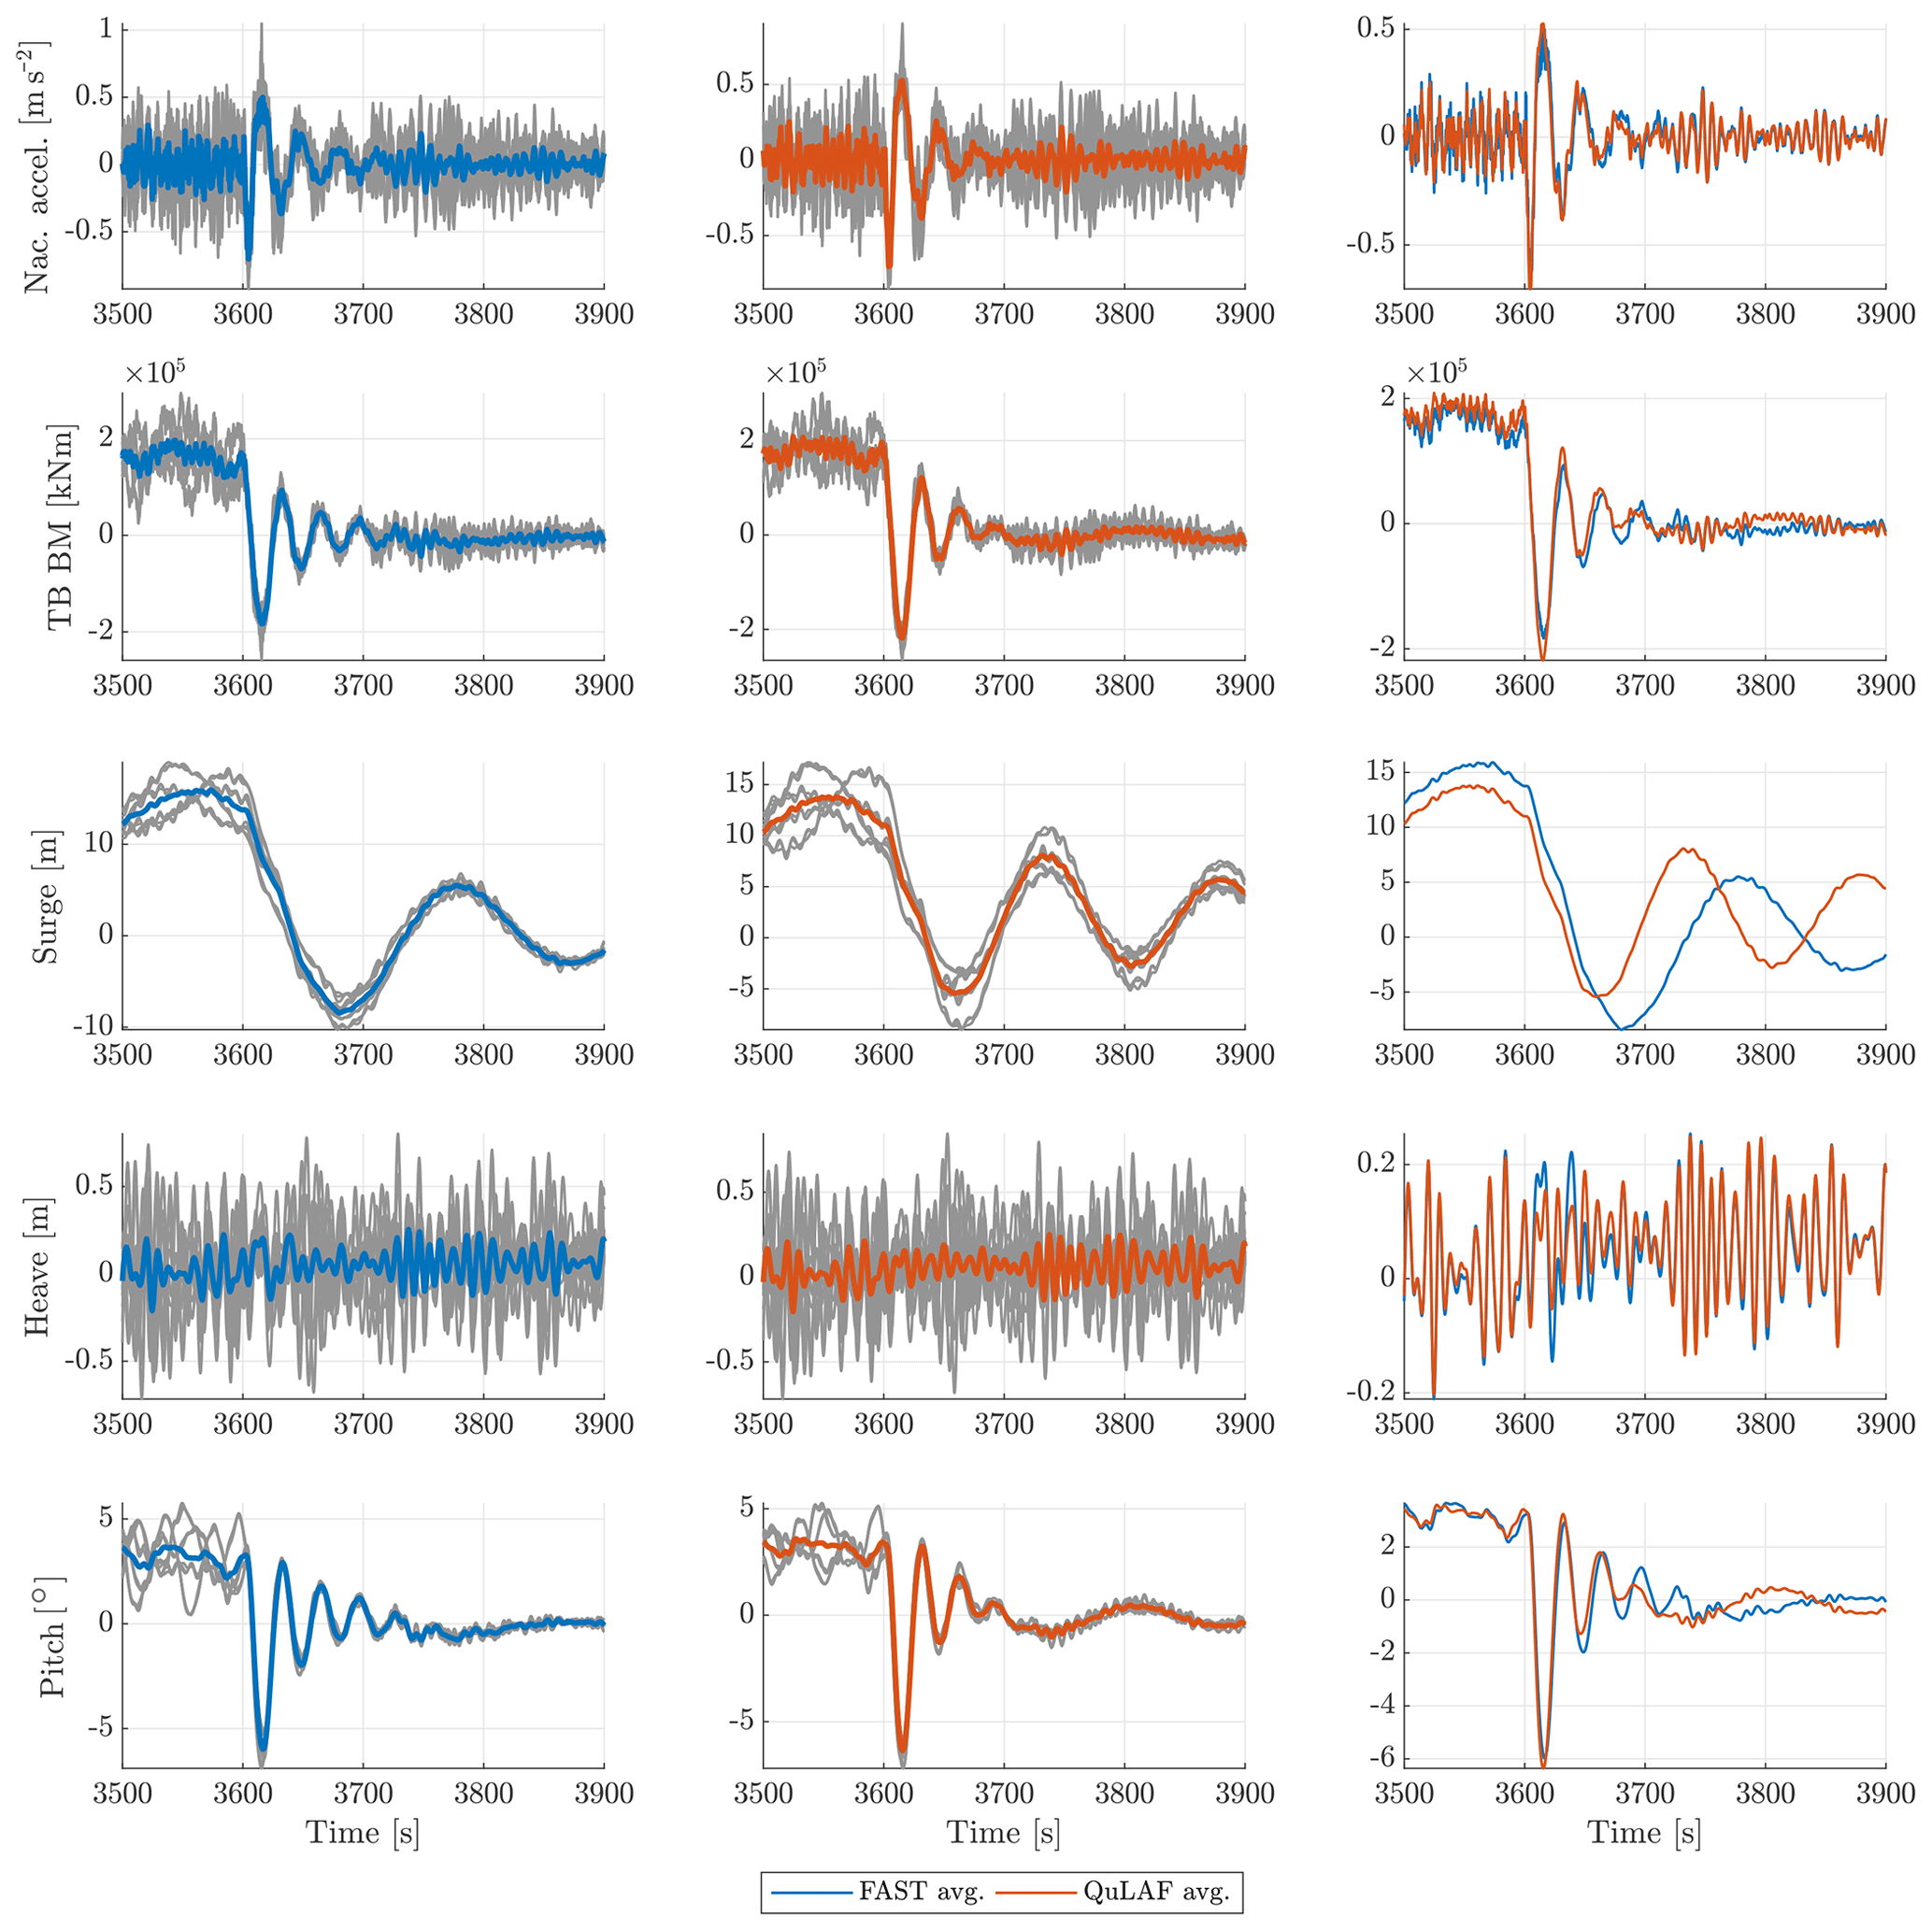
Figure 7Zoomed time series of DLC 2.1 with a mean wind speed of 13.9 m s−1 for FAST and QuLAF. The average responses are obtained based on the four different wave and wind seeds and three realizations of the peak period.
By inspection of the left column of Fig. 6, the negative extreme values are of the same importance as the extreme positive in this transient load case. Thus, the deviation levels on the minimum values are also included in Table 8. Generally, it is seen that higher deviation levels are obtained for the minimum response ratios compared to the maximum. The largest deviations are seen for the surge motion for wind speeds greater than 5 m s−1. This is further investigated by examination of the corresponding time series, as seen in Fig. 7. We chose the case with a mean wind speed of 13.9 m s−1, as it is close to rated wind speed where the largest bending moments occur. At this wind speed, the time series for the 12 simulations (3 wave periods × 4 seeds) are shown in grey. Further, their average is shown in blue and red for FAST (first column) and QuLAF (second column), respectively. The right column shows a direct comparison of the averaged signals.
From the figure, it can be concluded that QuLAF captures the decay after shutdown very well, except for a pronounced deviation in the surge motion. This is likely due to the surge mooring stiffness not being “updated” in QuLAF. Physically, after the shutdown, the structure goes back to the equilibrium position due to the restoring effects. In FAST, the mooring system is represented by a dynamic mooring model, which includes non-linear effects and thus takes into account the reduction in surge stiffness as the floater moves back to the equilibrium position. In QuLAF, on the other hand, the mooring matrix used in this case is the one for the given wind speed (13.9 m s−1), which represents well the stiffness at that operating point but differs from the stiffness matrix at the equilibrium position. Thus, in QuLAF, the system decays with a stiffer mooring system, which is consistent with the shorter surge natural period observed in Fig. 7. This is an inherent limitation of frequency-domain models, which do not allow the system properties to change during the simulation.
Table 9Ratio of max. response (QuLAF ∕ FAST) averaged per wind speed for DLC 6.1.
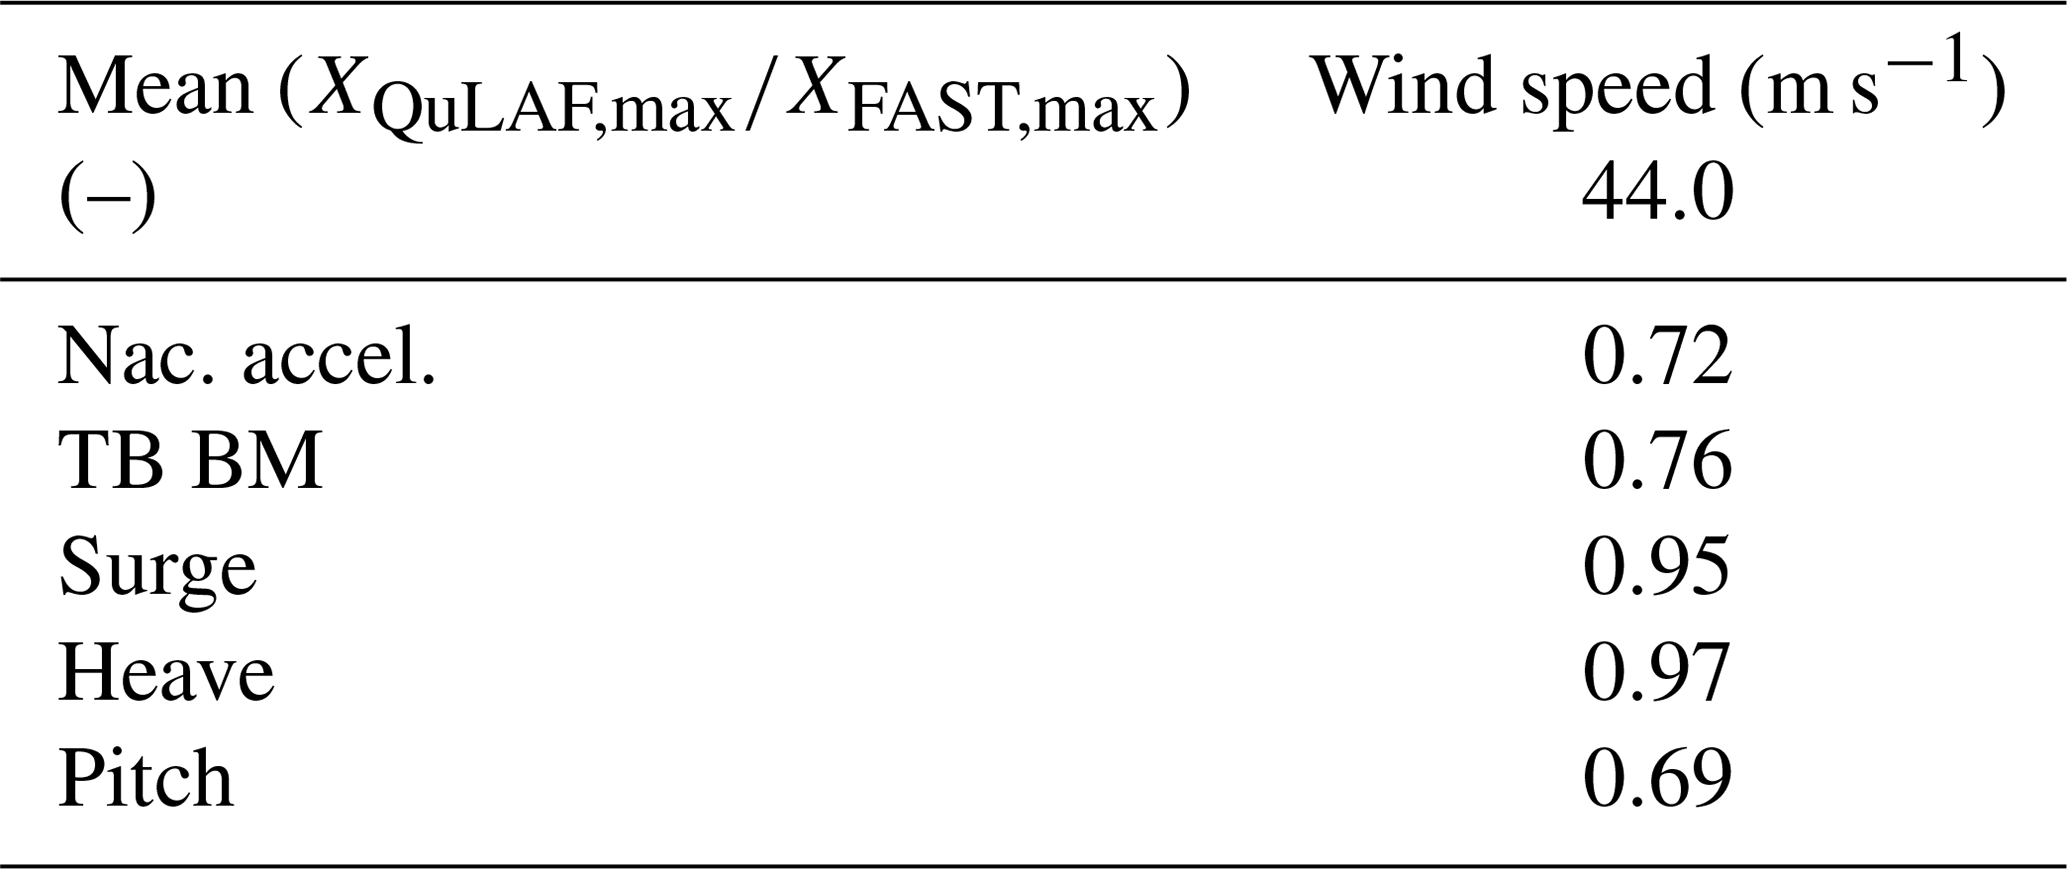
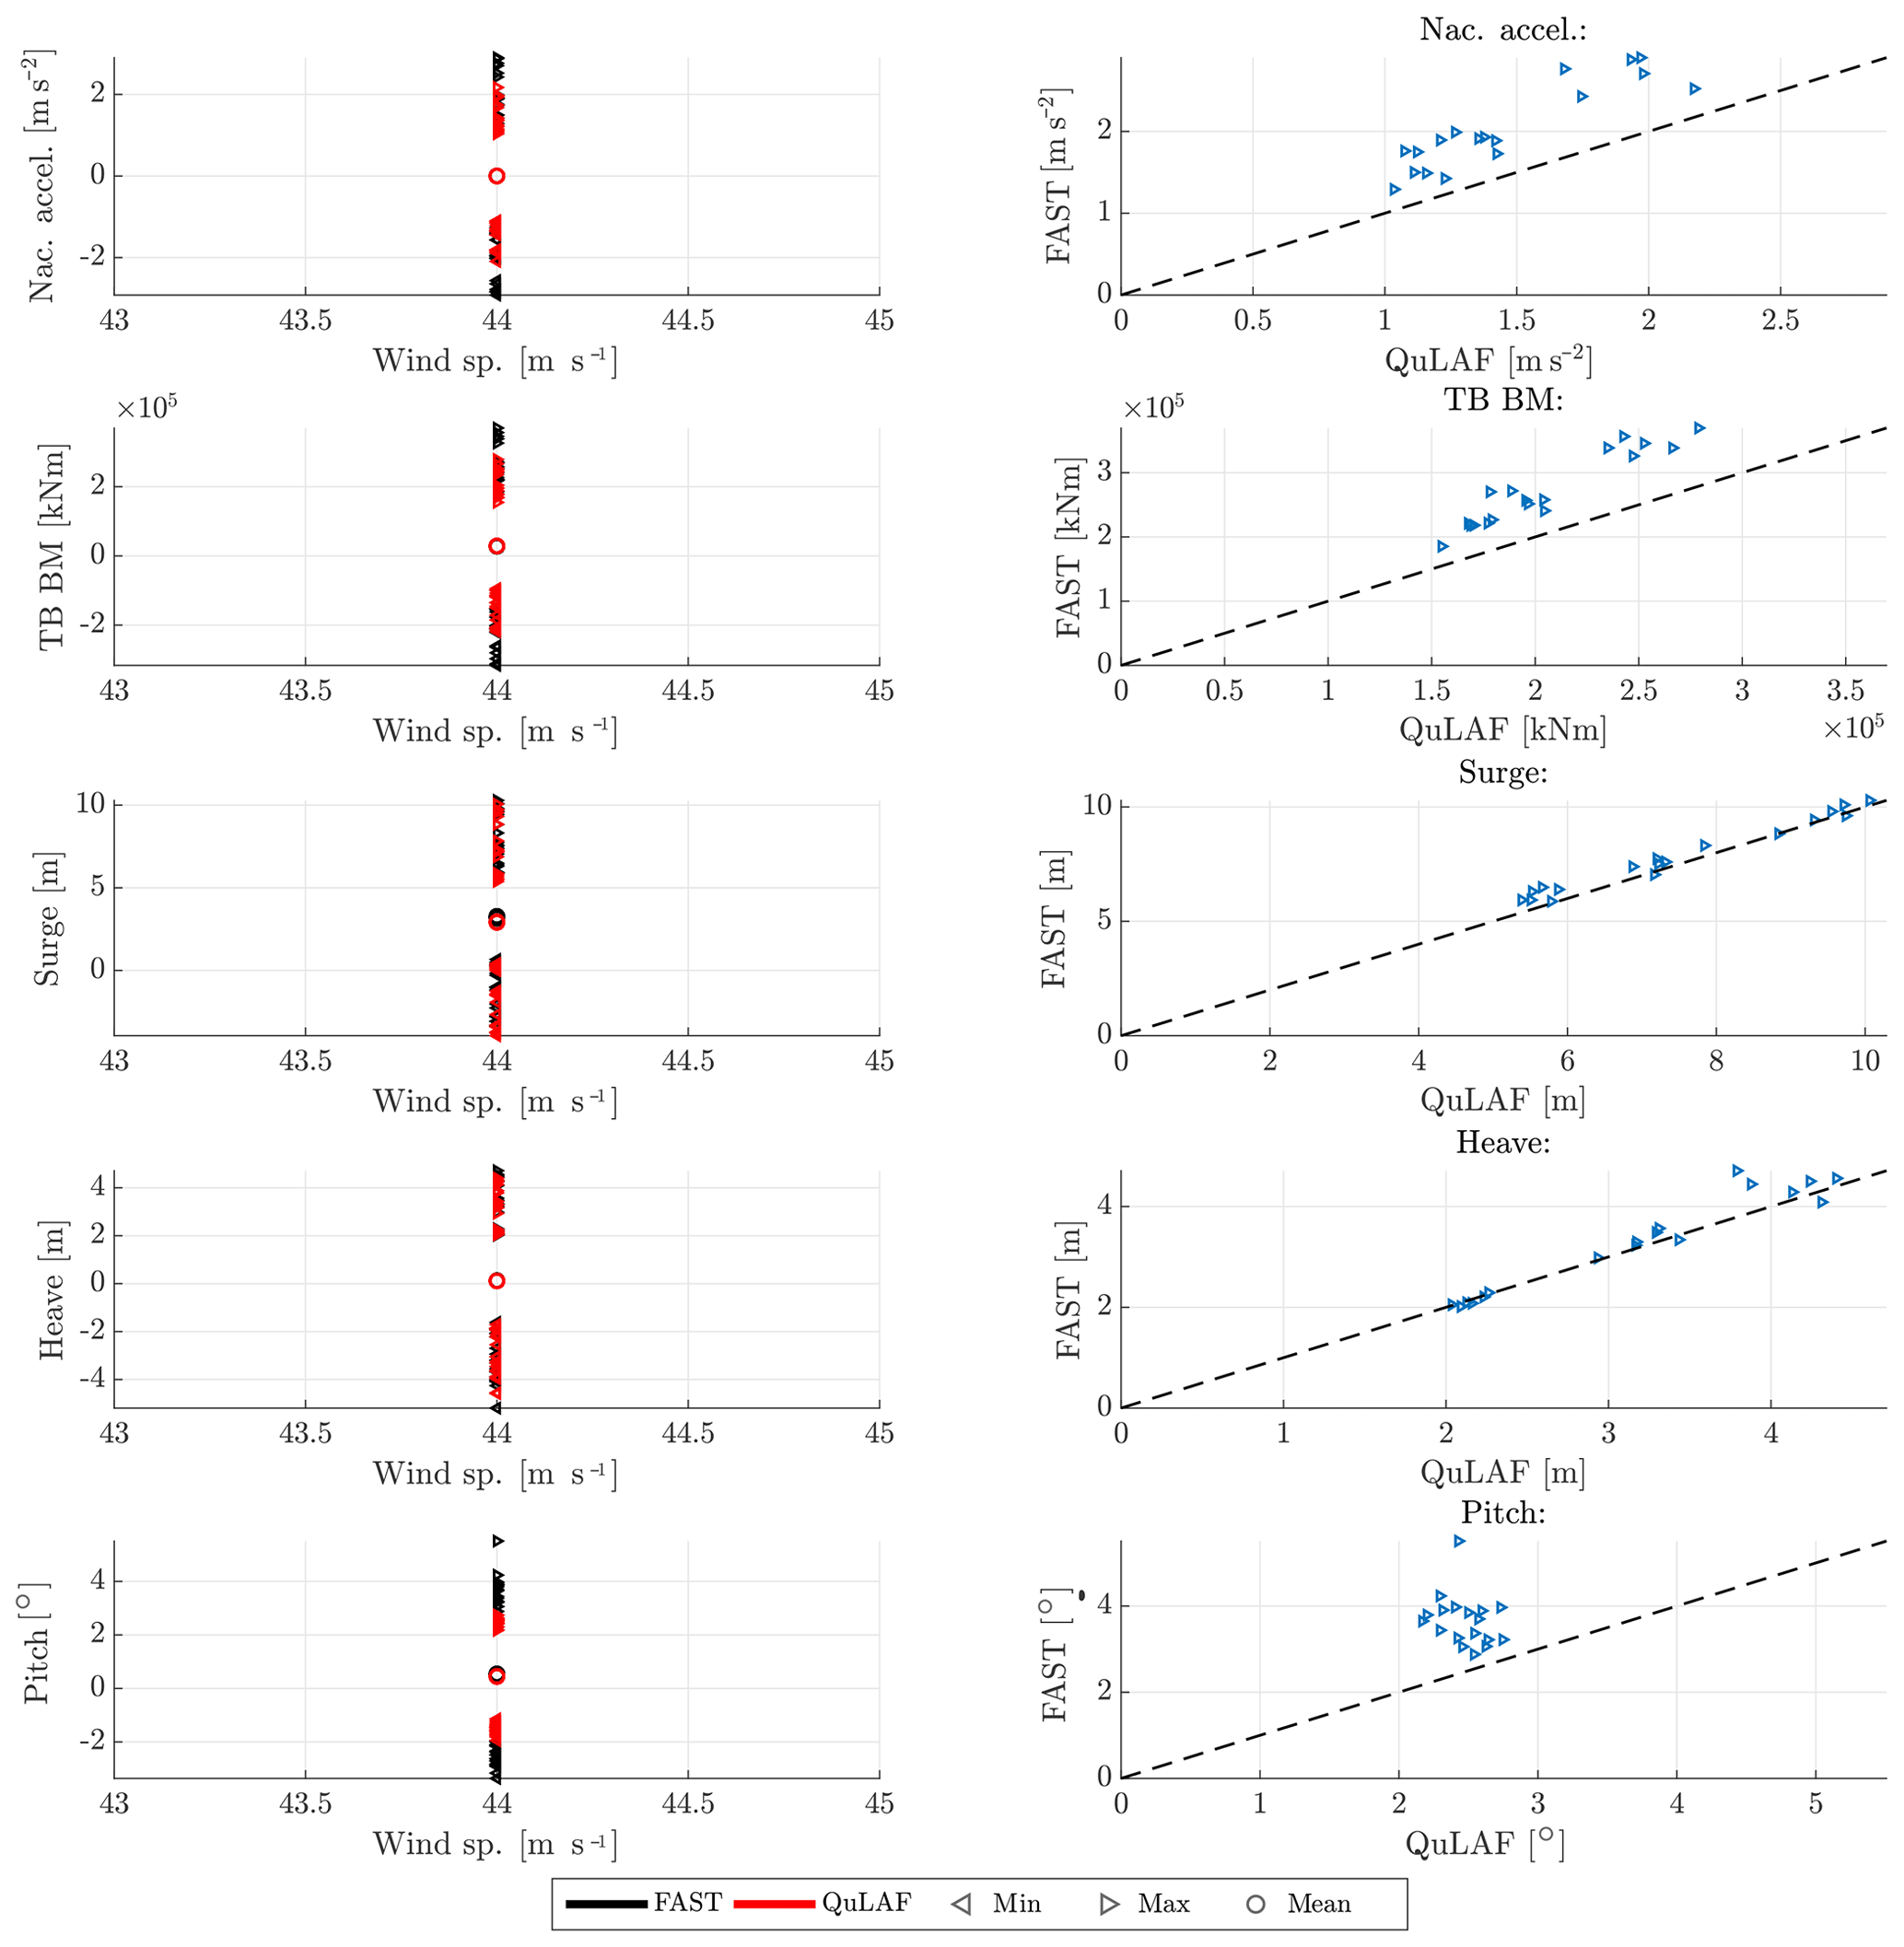
Figure 8Response to DLC 6.1 for FAST and QuLAF. Left: min., max. and mean values for every realization as a function of wind speed. Right: maximum values for FAST as a function of the corresponding maximum values in QuLAF.
We can now turn to DLC 6.1 which describes the turbine in parked condition with a mean wind speed of 44 m s−1 and with extreme sea state. This load case consists of 18 simulations (1 wind speed × 3 wave periods × 6 seeds). In Fig. 8, the nacelle acceleration, tower-base bending moment and planar motions of the floater are shown. Furthermore, Table 9 shows the deviation values of the two models.
Overall, the results are similar to DLC 1.6 at 5 m s−1, since the thrust level is nearly the same for that case and both load cases utilize the extreme sea state. The nacelle acceleration, tower-base bending moment and pitch motion all show an under-prediction by QuLAF which can be explained by limitation of A, regarding the missing viscous effects. Surge and heave, on the other hand, are well matched with deviations of 5 % and 3 %, respectively.
5.4 Summary of ULS study
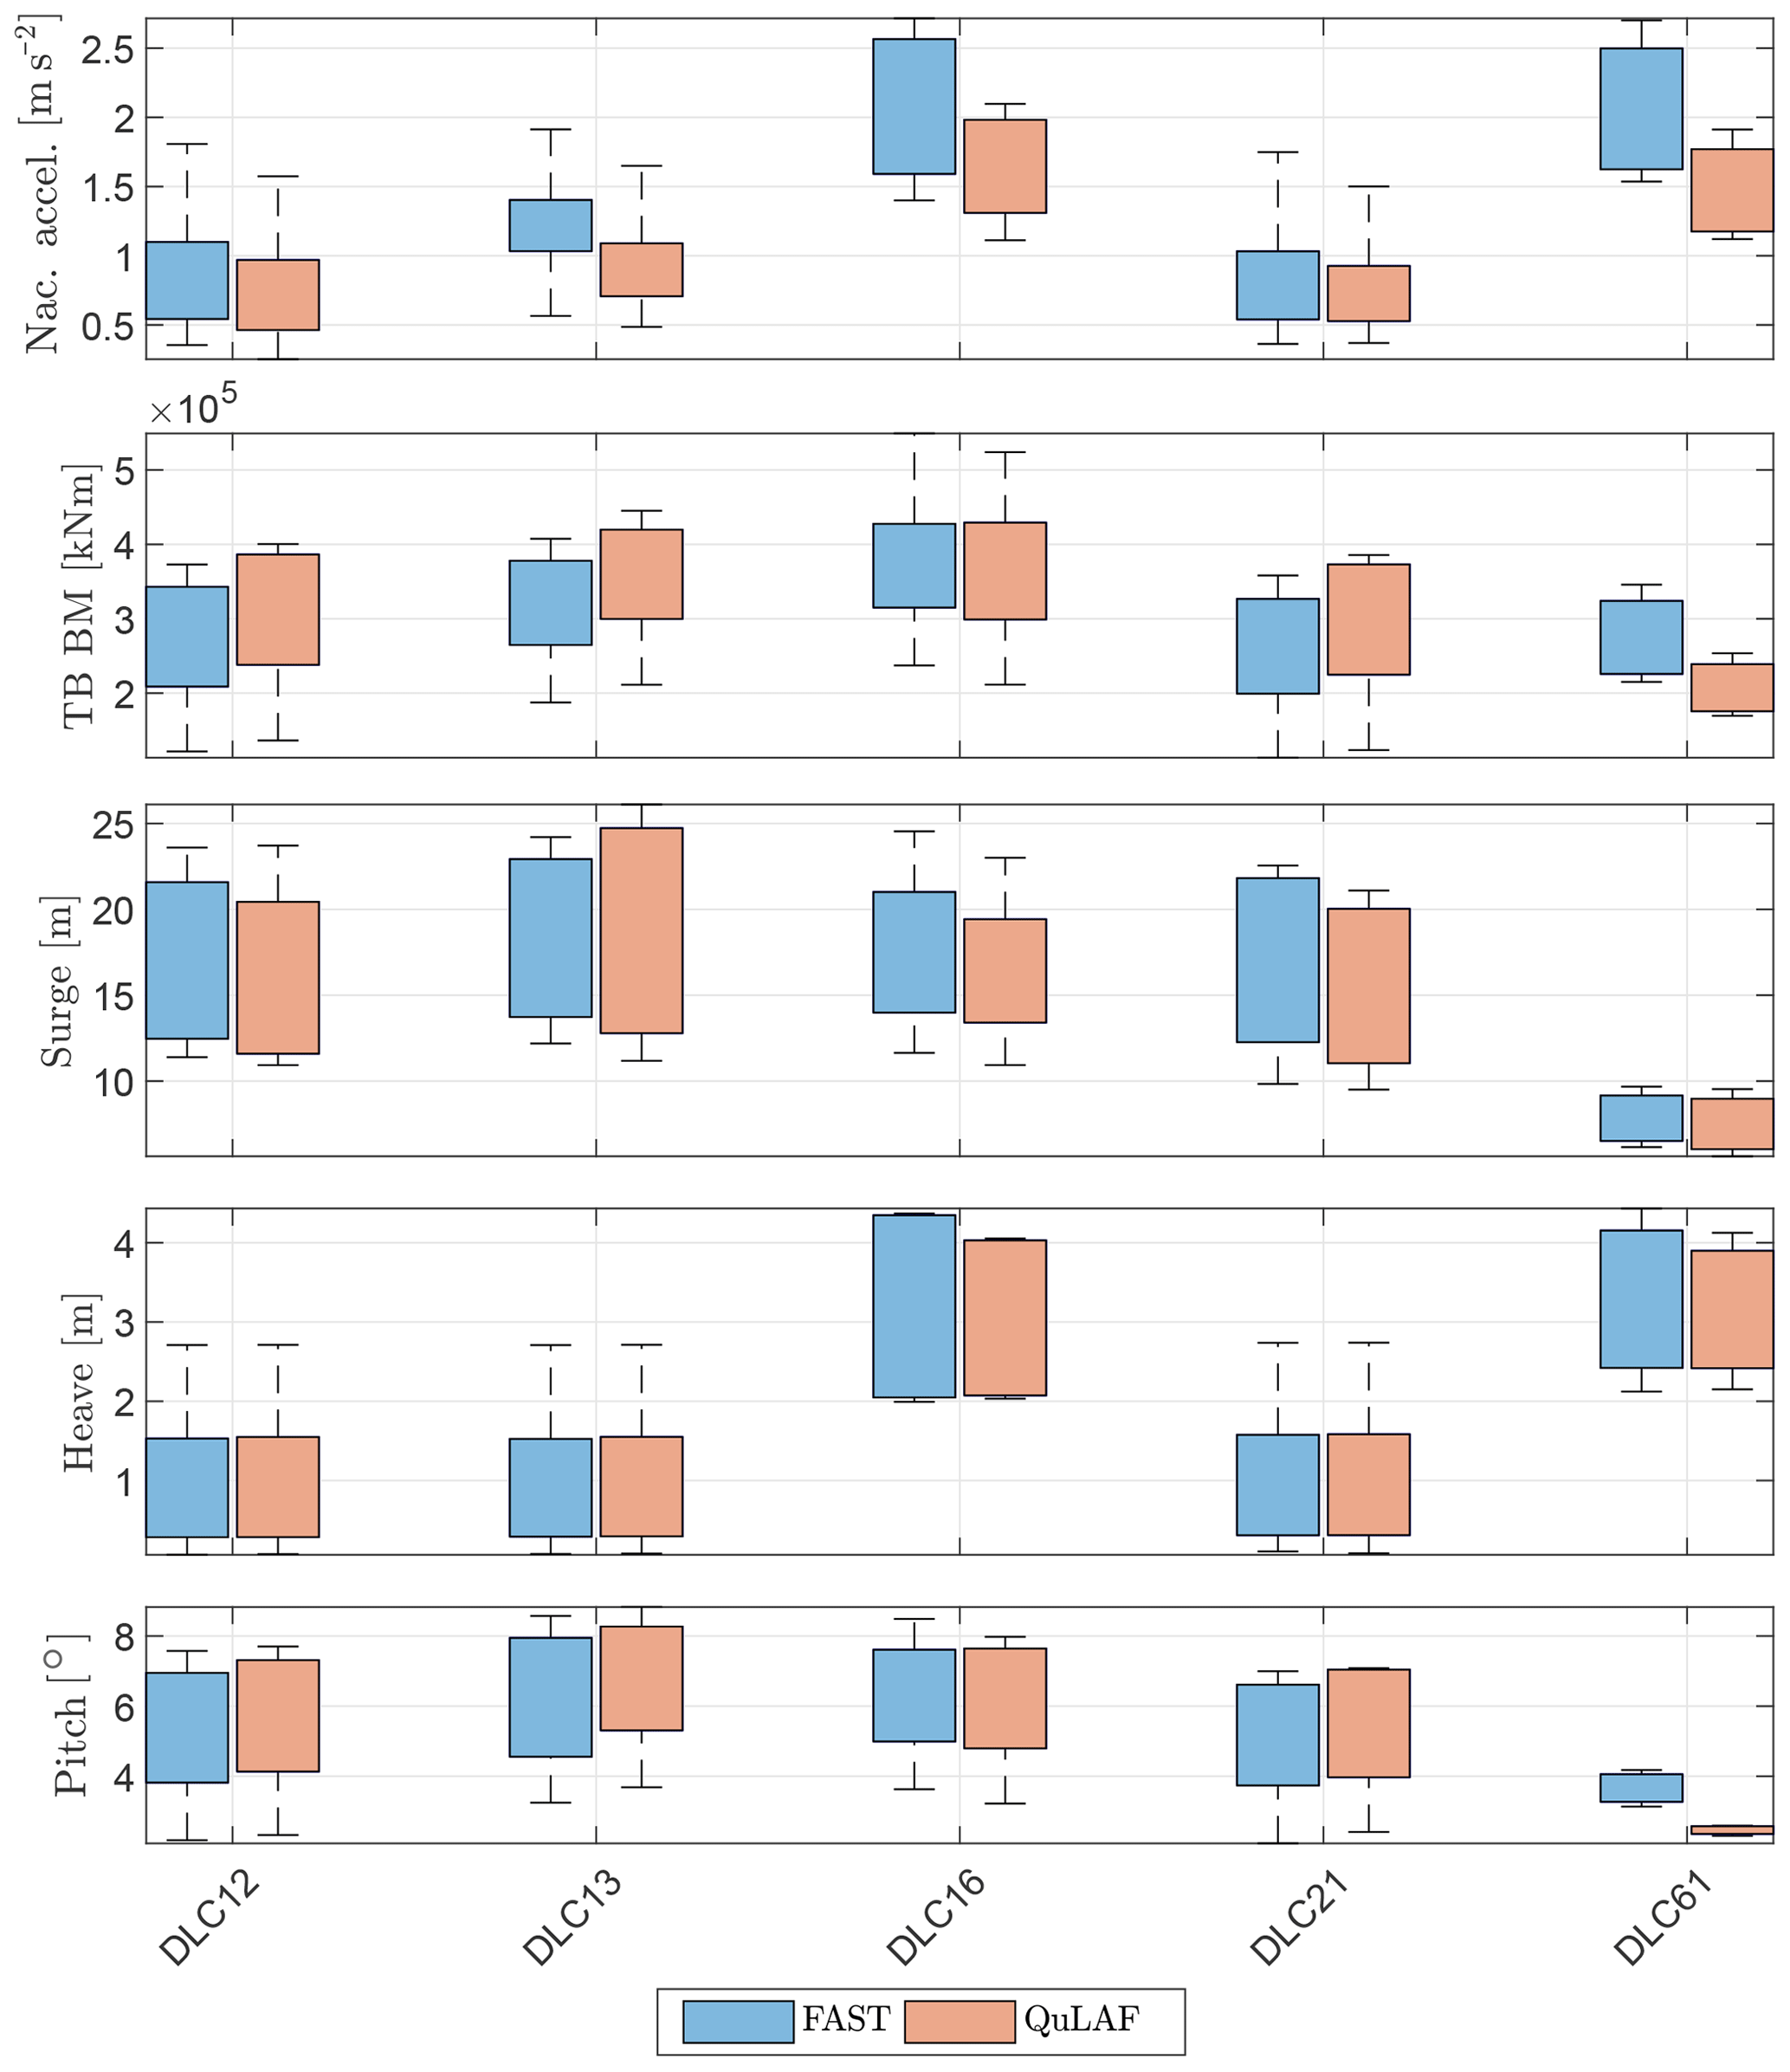
To summarize the ULS study, an overview of the ultimate load and response populations is presented in a box plot for each of the five load cases in Fig. 9. This way, the critical cases can be identified and compared for the two models. The box plots show the minimum, first quantile, median (line in the centre of the box), third quantile and the maximum of the data for each wind speed. The ultimate load and response values in the summary plot are obtained as a mean of all the maximum values for each seed associated with the specific environmental condition.
It can be seen that the ultimate nacelle accelerations are governed by the extreme sea state and thus by DLC 1.6 and DLC 6.1. Both models agree on this conclusion but with an under-prediction of the values in QuLAF due to limitation A. The ultimate tower-base bending moments and pitch motion are obtained in DLC 1.6 and DLC 1.3, respectively, and both models agree well on the values. Similarly, the largest heave motions are generally well matched by QuLAF, since it is always dominated by waves and the hydrostatics are modelled the same way in both models; hence, the largest response is obtained in the extreme sea states. The largest surge motions are obtained in DLC 1.3 with an over-prediction of the response in QuLAF, likely due to limitations B and C, but with a slight under-prediction in all other load cases.
In order to investigate whether the models predict the same design-driving cases, the rankings of the eight highest maximum values of the nacelle acceleration, tower-base bending moment and planar motions with their corresponding load case simulation are presented in Fig. 10.
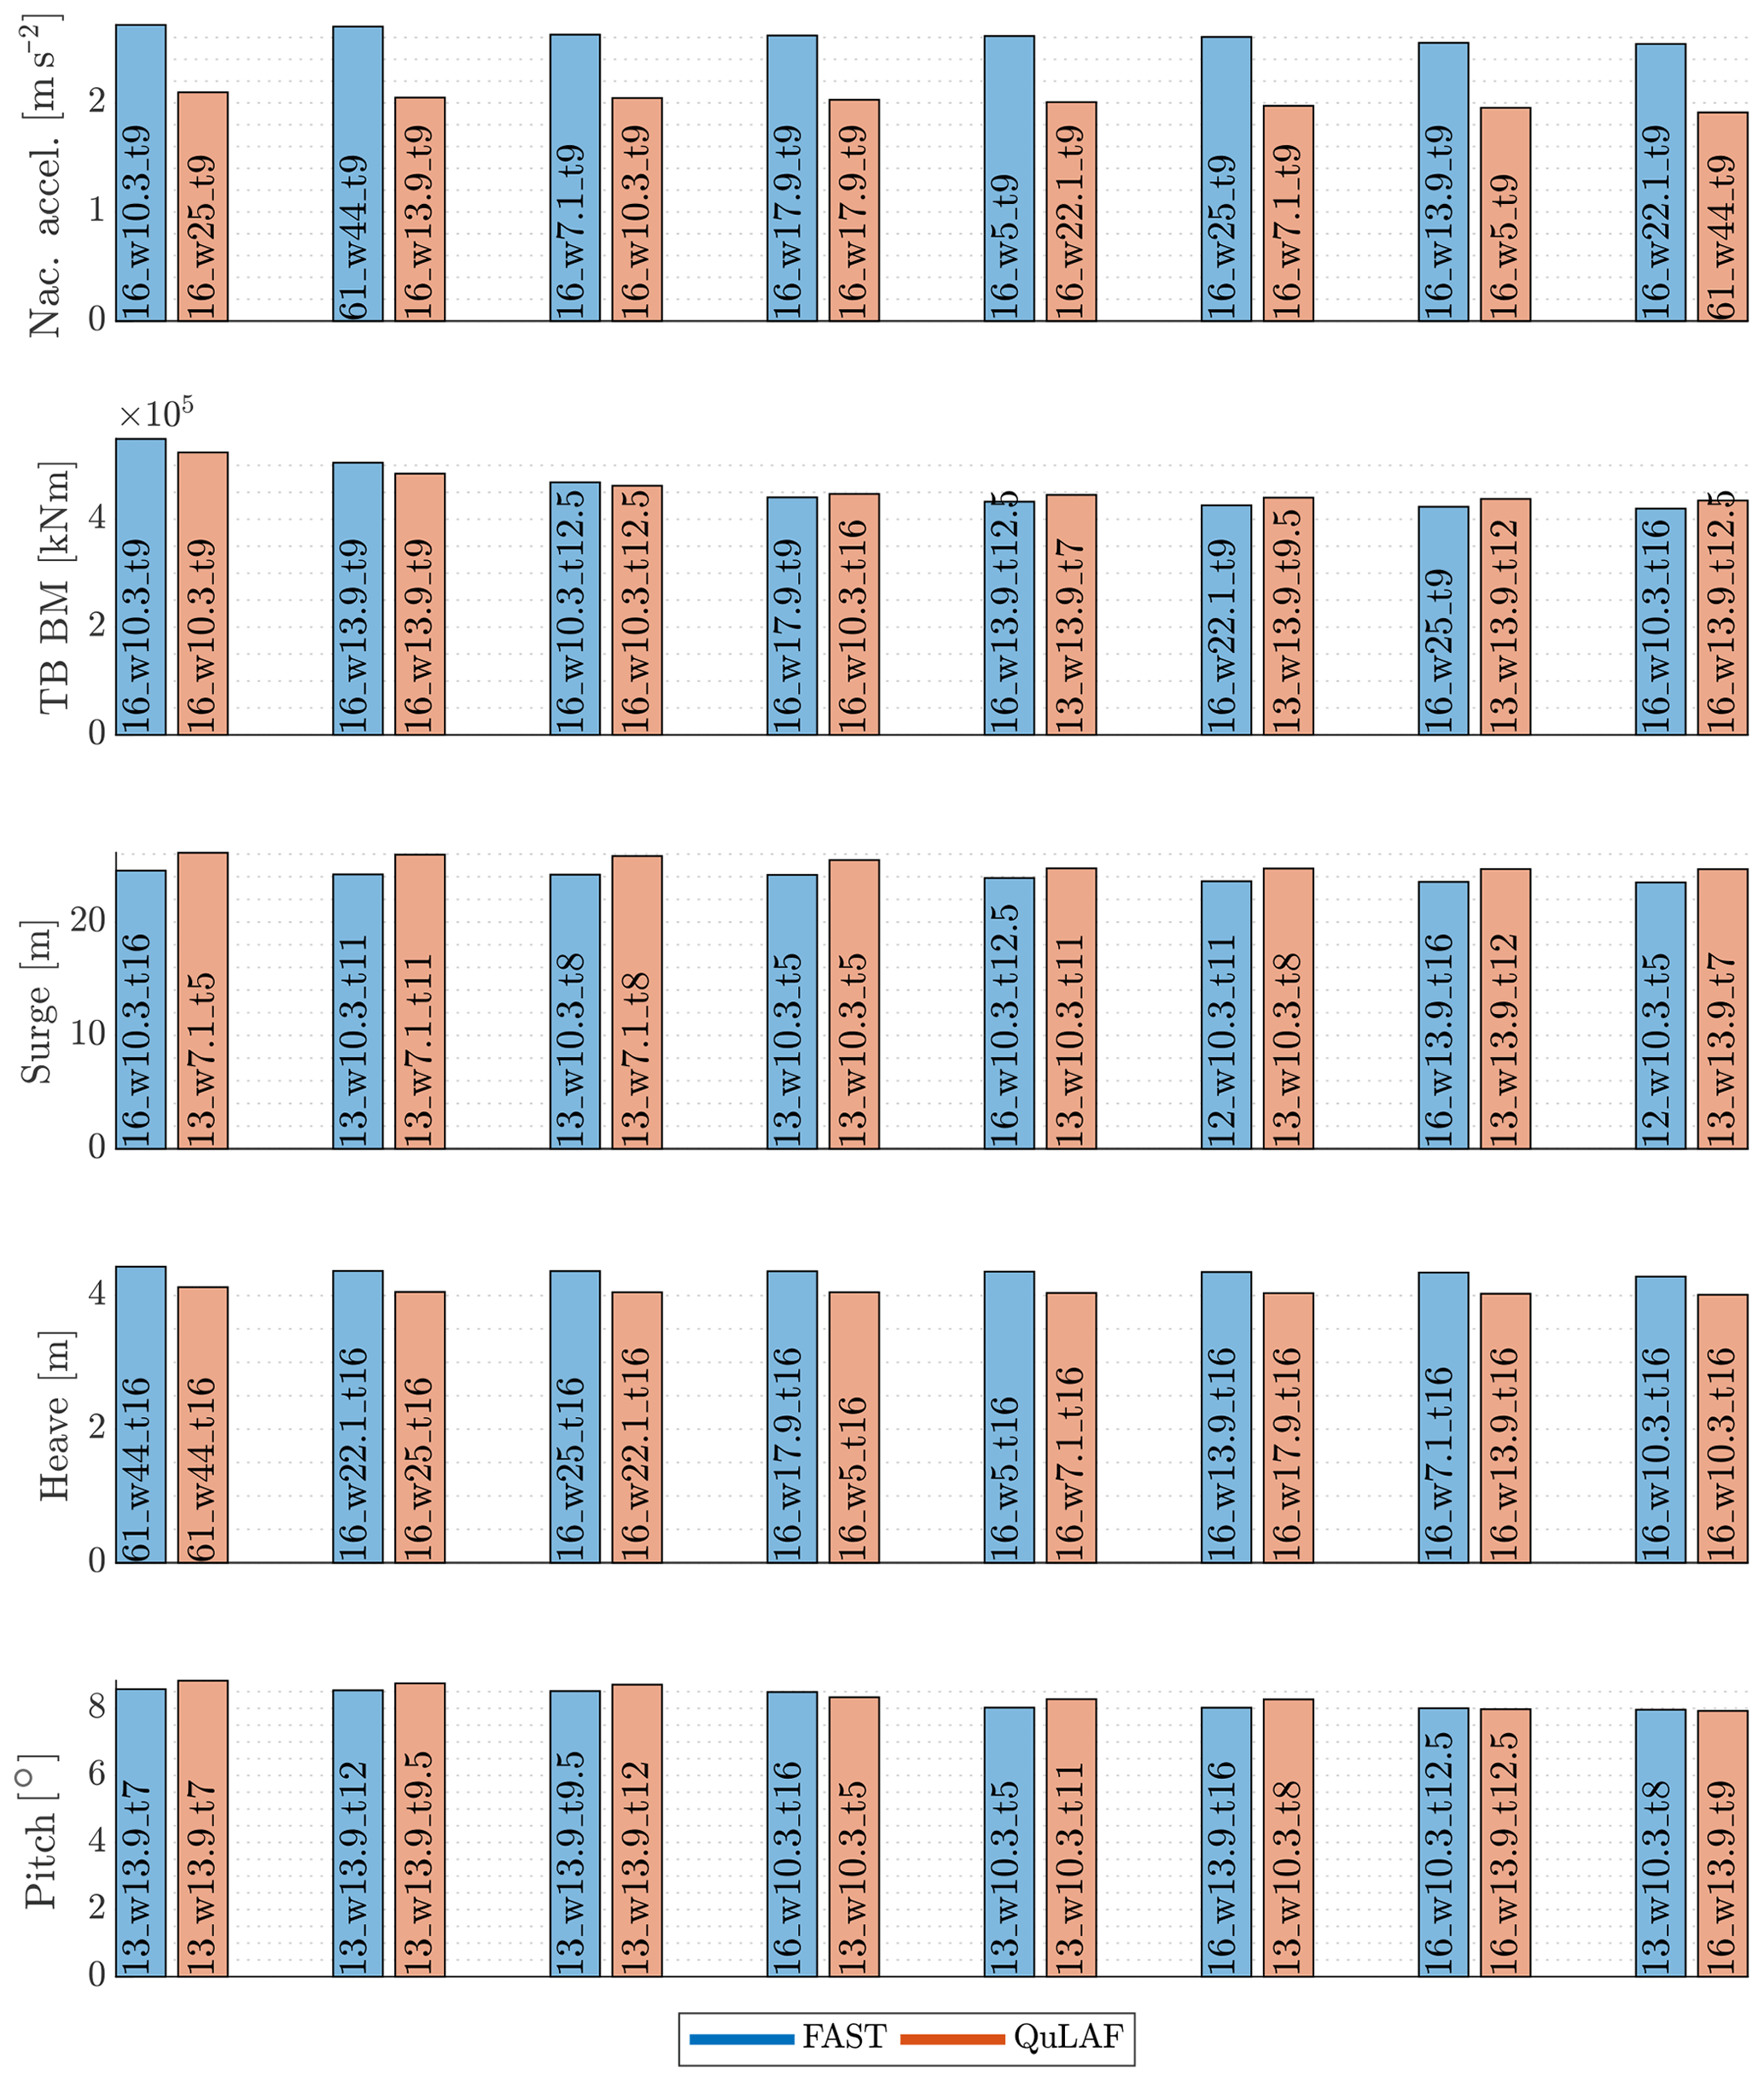
Figure 10Rankings of the eight highest max. values of each signal and corresponding load case simulations for FAST and QuLAF. The text in each box follows the pattern of design load case, mean wind speed and then wave period, i.e. dlc_wsp_tp.
The load levels are generally in good agreement. Looking at the nacelle acceleration, the values are under-predicted by QuLAF but the two models agree on the same governing load cases. For the tower-base bending moment, the two models show a agreement in both maximum values (up to 6 % deviation) and load cases, where the maximum tower bending moments for both models are obtained in severe sea states around rated wind speed. Generally, both models predict that the highest surge and pitch motions are obtained in extreme turbulence just below rated wind speed but with a slight over-prediction in QuLAF.
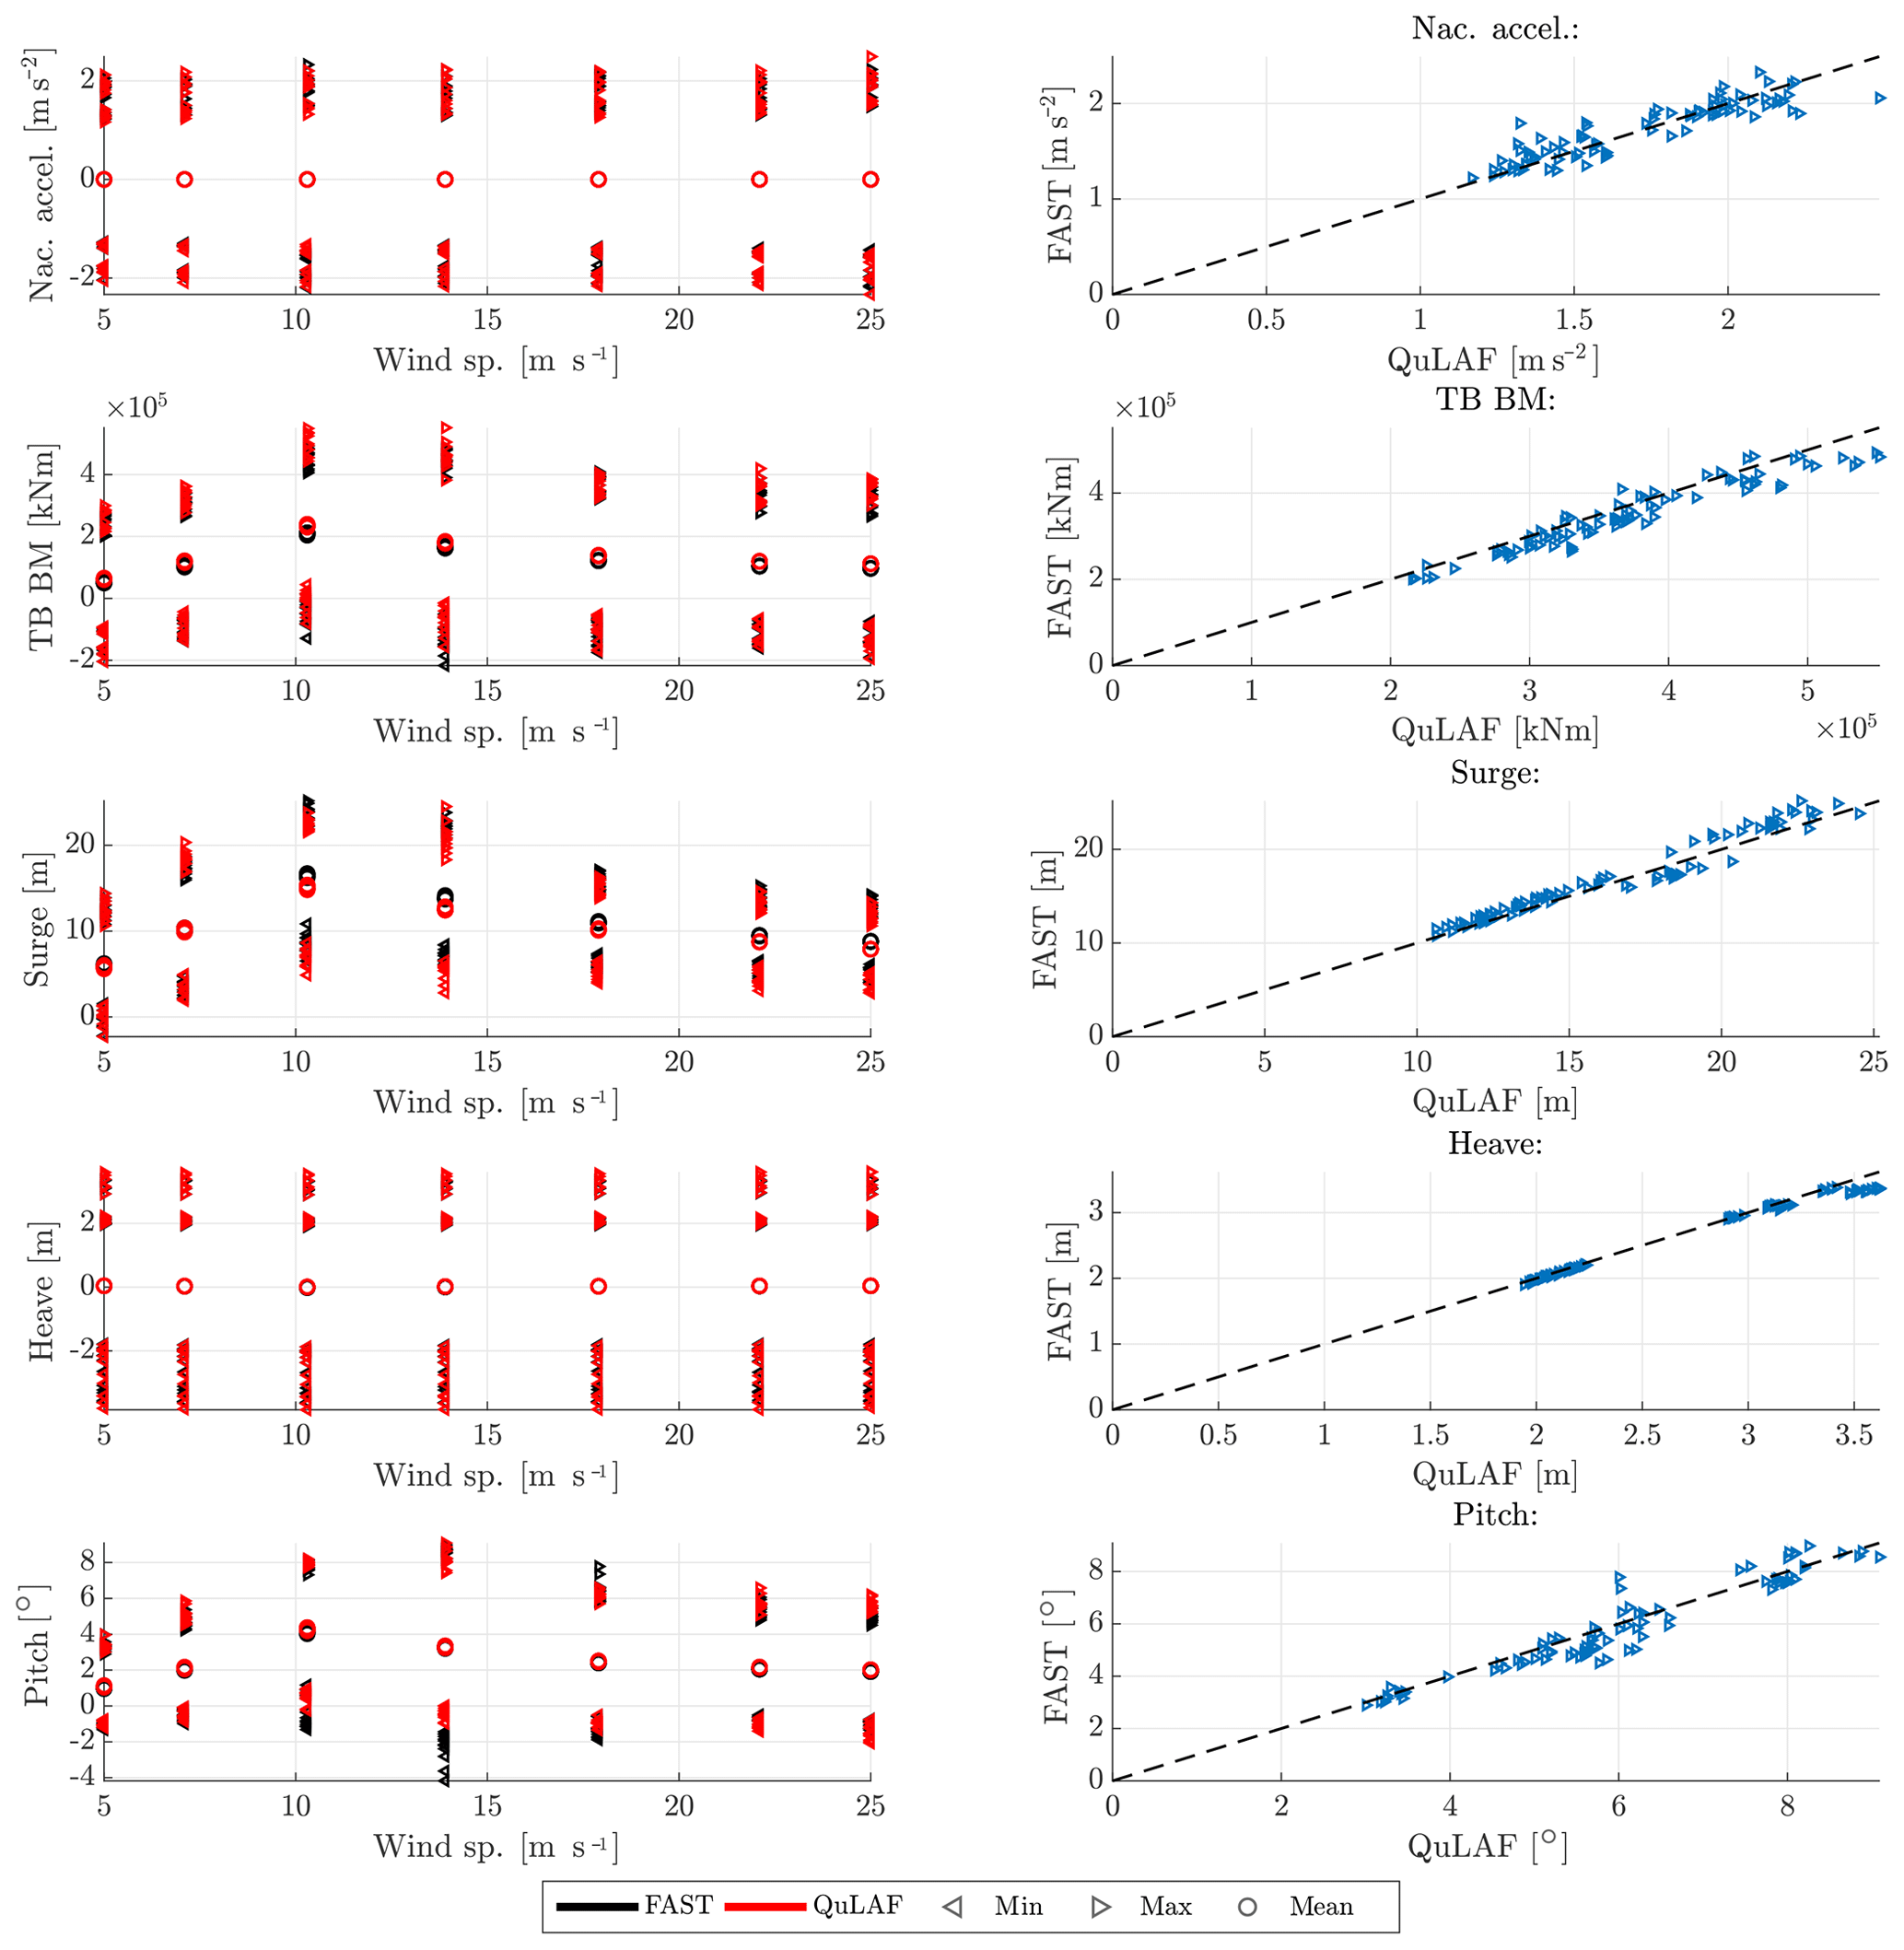
Figure 11Response to DLC 1.6 (without viscous drag) for FAST and QuLAF. Left: min., max. and mean values for every realization as a function of wind speed. Right: maximum values for FAST as a function of the corresponding maximum values in QuLAF.
All load cases have shown a good agreement in heave (up to 8 % deviation), which is due to the fact that it is dominated by hydrodynamic forcing. Both wave loads, hydrostatics and hydrodynamic inertia loads are modelled the same way in the two models. Differences exist mainly in the viscous loads and mooring stiffness, but the effect of these on heave is less important.
Following the main results from the study, the limitations of the QuLAF model (Sect. 3.3) are now investigated further with the purpose to assess their impact on the response.
6.1 Omission of viscous drag forcing
First, we look at limitation A, where the results for the severe sea state of DLC 1.6 (Fig. 5) are repeated but with the viscous drag loads disabled in both models. Since the waves are dominating, both models should give very similar responses for this case. For this comparison only, an additional constant linear damping matrix was included in both models to avoid unphysical resonant responses, mostly in QuLAF for the heave DoF. When disabling the viscous effects in QuLAF, the only damping contribution left in the heave DoF is the radiation damping, which is very low at the heave natural frequency and is therefore not sufficient to avoid unphysical resonant response in heave. In FAST, on the other hand, the dynamic representation of the mooring system introduces both viscous damping and non-linear stiffness that limit the resonant response in heave. Figure 11 shows the results. A good match in the nacelle acceleration, tower-base bending moment and all floater motions is now seen. By comparison to Fig. 5 (DLC 1.6 with viscous effects in FAST), we clearly see the effect of the omission of viscous drag forcing in QuLAF.
Limitation A is thus confirmed and can explain the under-prediction of the nacelle acceleration, tower-base bending moment and floater motions in QuLAF for the load cases where the waves are dominating, i.e. DLC 1.6 and DLC 6.1.
6.2 Simplified rotor-induced forcing and damping
Secondly, we investigate the complexity of extracting aerodynamic loads around rated wind speed, where the controller switches between the partial- and full-load regions, i.e. limitation B. A study was made comparing the extracted aerodynamic forcing for surge, pitch and tower deflection in the full FAST model setup and the response-locked loads plus damping setup, which is utilized in QuLAF.
We extract the aerodynamic rotor loads from the full FAST computation and compare them to the aerodynamic rotor loads applied in QuLAF. This is done with basis in the shaft loads from FAST, which are the next subtracted inertial and gravitational effects. Based on a free body diagram (see Fig. 12) the purely aerodynamic rotor loads in the full FAST computation are calculated as
Here, A is the point of output for the shaft loads in FAST, B is the position of the rotor centre of gravity, and is the distance from A to B. The shaft force FS is defined in its own coordinate system and consists of a normal and tangential shaft force. Hence, the global x component is determined from vector transformation. The angle θhub is the sum of the fixed tilt angle and the instantaneous hub deflection angle. The rotor and hub mass and the mass moment of inertia around point A are denoted Mrh and Irh, respectively. Lastly, xhub and zhub are the horizontal and vertical translations of the hub centre of gravity.
The same equations with , , were applied in the original response-locked FAST calculations for the extraction of the loads for QuLAF. We will refer to the latter as the simplified method.
In QuLAF, the extracted forcing (for a response-locked nacelle) and damping are applied in the surge, pitch and tower deflection degrees of freedom as described in Pegalajar-Jurado et al. (2018a):
Here, hhub is the hub height, the mode shape deflection evaluated at the hub is ϕhub, and B11, B55 and Btower are the aerodynamic damping terms for surge ξ1, pitch ξ5 and tower deflection α degrees of freedom, respectively.
The loads are applied in the undeflected point (B), which is consistent with the linearization and with further neglect of the moment correction from A to B.
We now compare these to the similar forcing based on the extracted loads from the full FAST computations, which include damping implicitly:
The combined comparison of both forcing and damping in the simplified approach is needed since the damping cannot be extracted as an isolated component from the full FAST computations. To focus on the loads, the full FAST response results for , and were applied in the calculation of the damping contribution in Fsimple.
Figures 13 and 14 show the extracted aerodynamic forcing applied in the surge, pitch and tower deflection degrees of freedom together with the rotor speed and blade pitch angle for the case of extreme turbulence (DLC 1.3). The two cases are conducted for wind speeds of 10.3 and 13.9 m s−1, just below and above rated wind speed in order to assess the effect of the switching between the control regions.
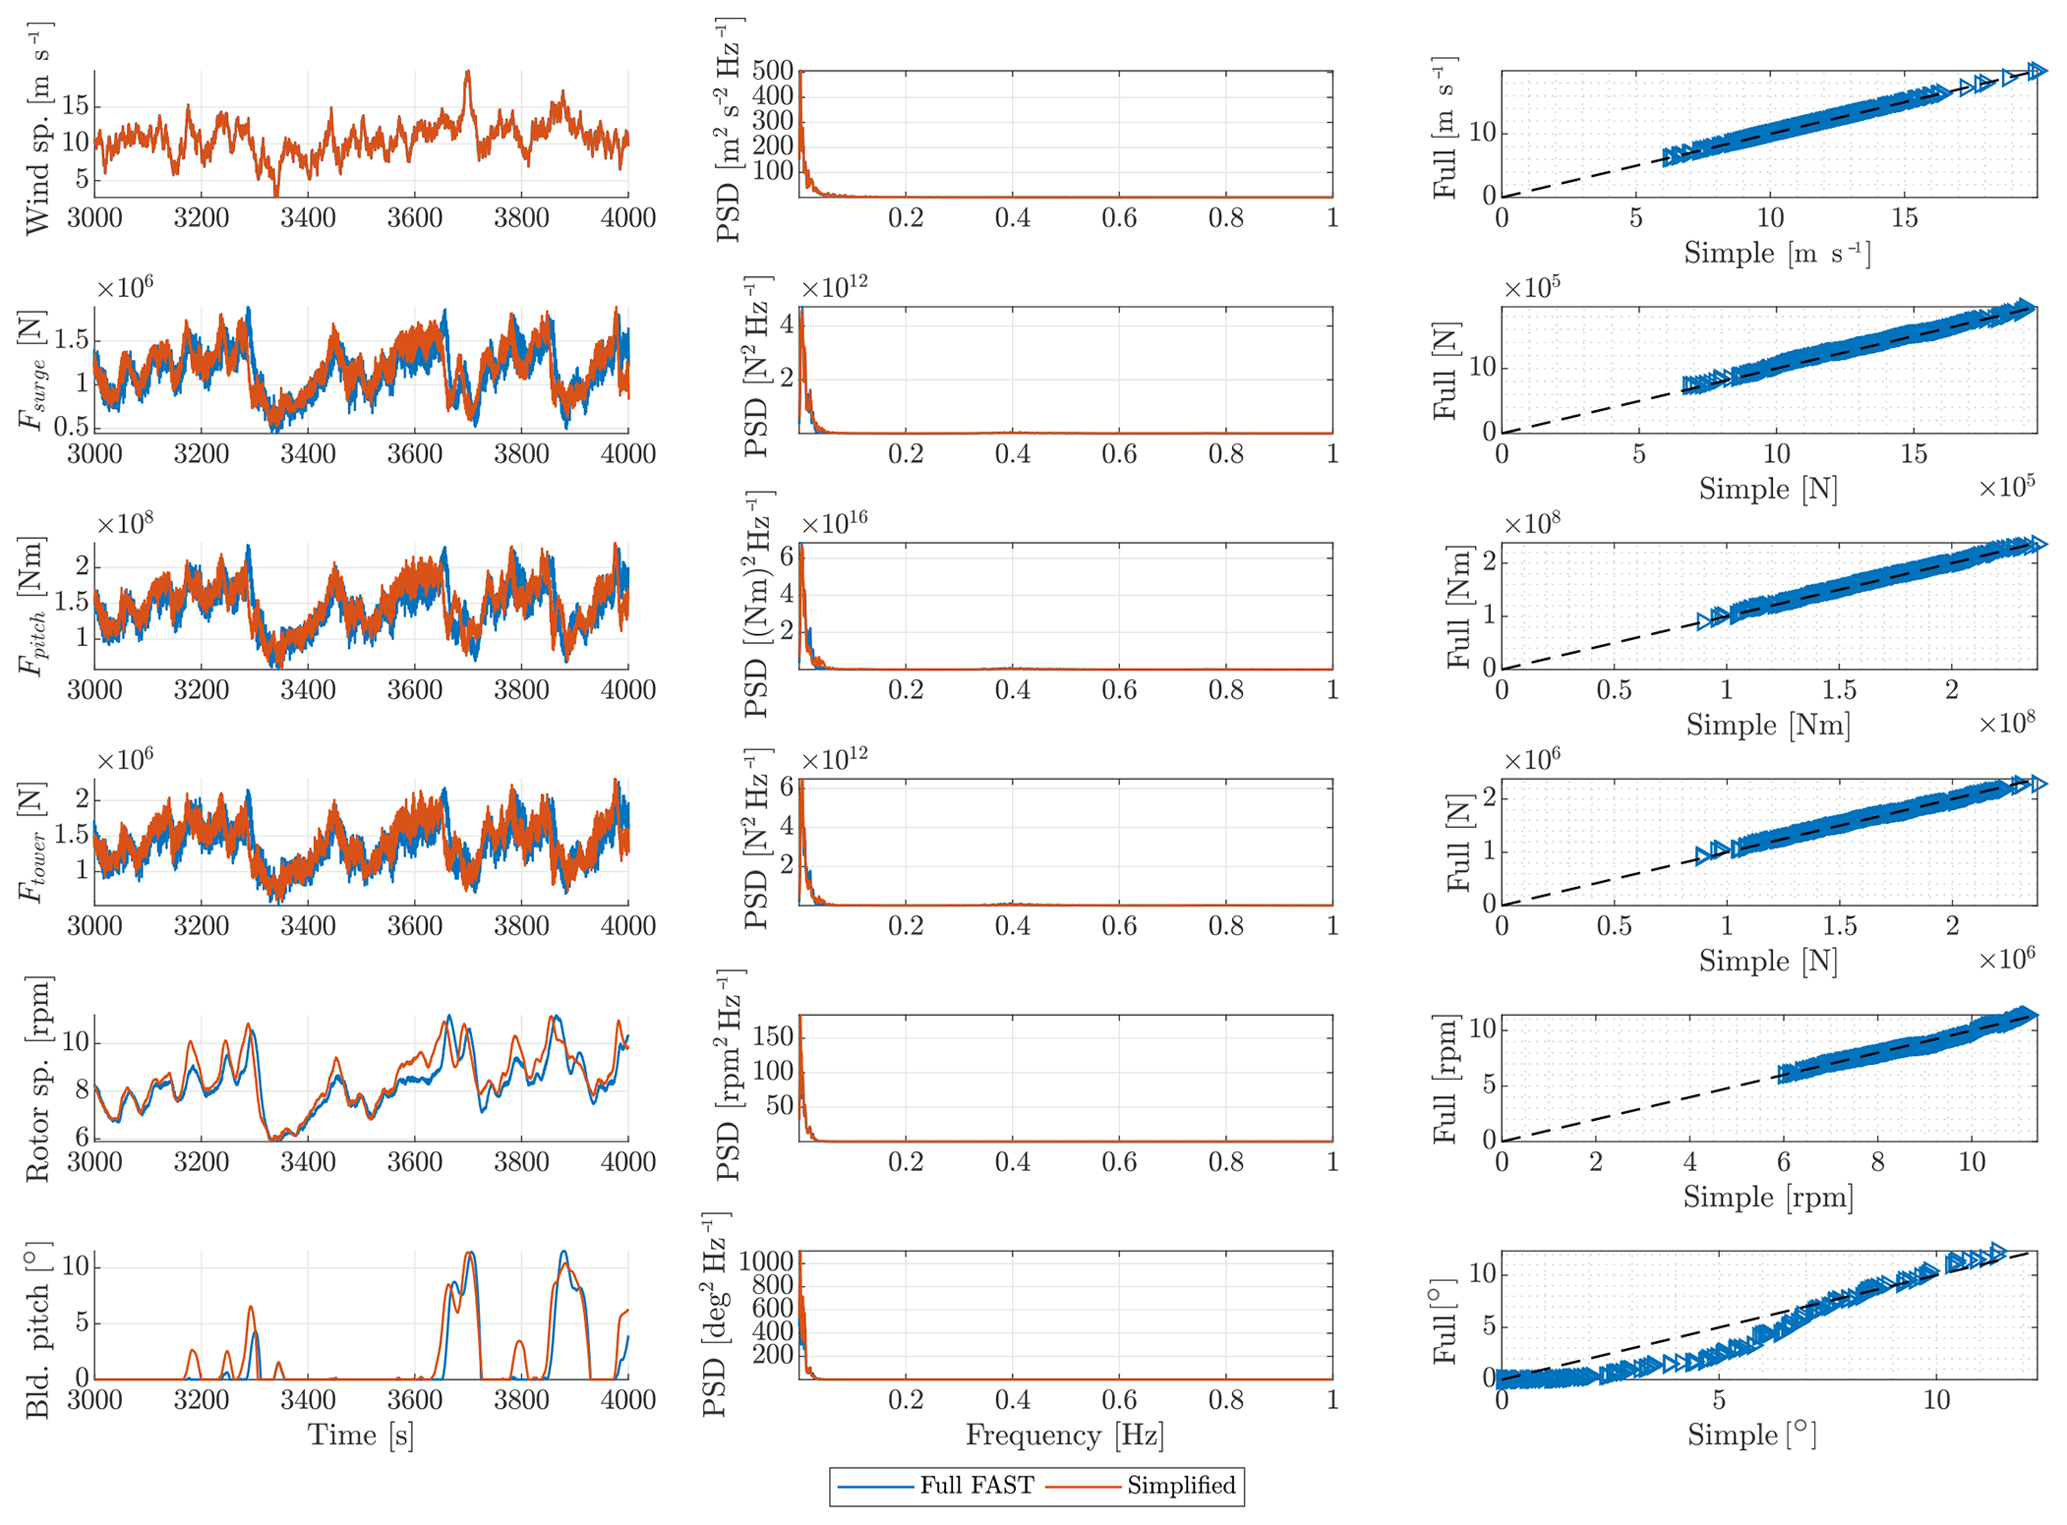
Figure 13Extracted aerodynamic forcing applied in the surge, pitch and tower deflection degrees of freedom and turbine operational data for DLC 1.3 with 10.3 m s−1 mean wind speed. Left: time series outline. Middle: corresponding power density spectrum (PDF). Right: peak values (sorted) for the full FAST computations as a function of the corresponding maximum values in the simplified method.
It is observed that the applied aerodynamic forcing in the surge, pitch and tower deflection degrees of freedom below rated wind speed is matched well. From the blade pitch angle in Fig. 13, it can be seen that the response-locked computations switch significantly more between the control regions compared to the full FAST computations. This is to be expected, as the fixed nacelle configuration will feel larger peaks of the wind speed compared to the full FAST computations. Then, looking at the full FAST computations, a slight over-prediction of the aerodynamic forcing term in surge, pitch and tower is seen, but the maximum values match well with the full FAST computations.
Limitation B is thus found to have a minor impact on the results. Apart from a small under-prediction at 13.9 m s−1 mean wind speed, the wind-induced loads are matched remarkably well by QuLAF.
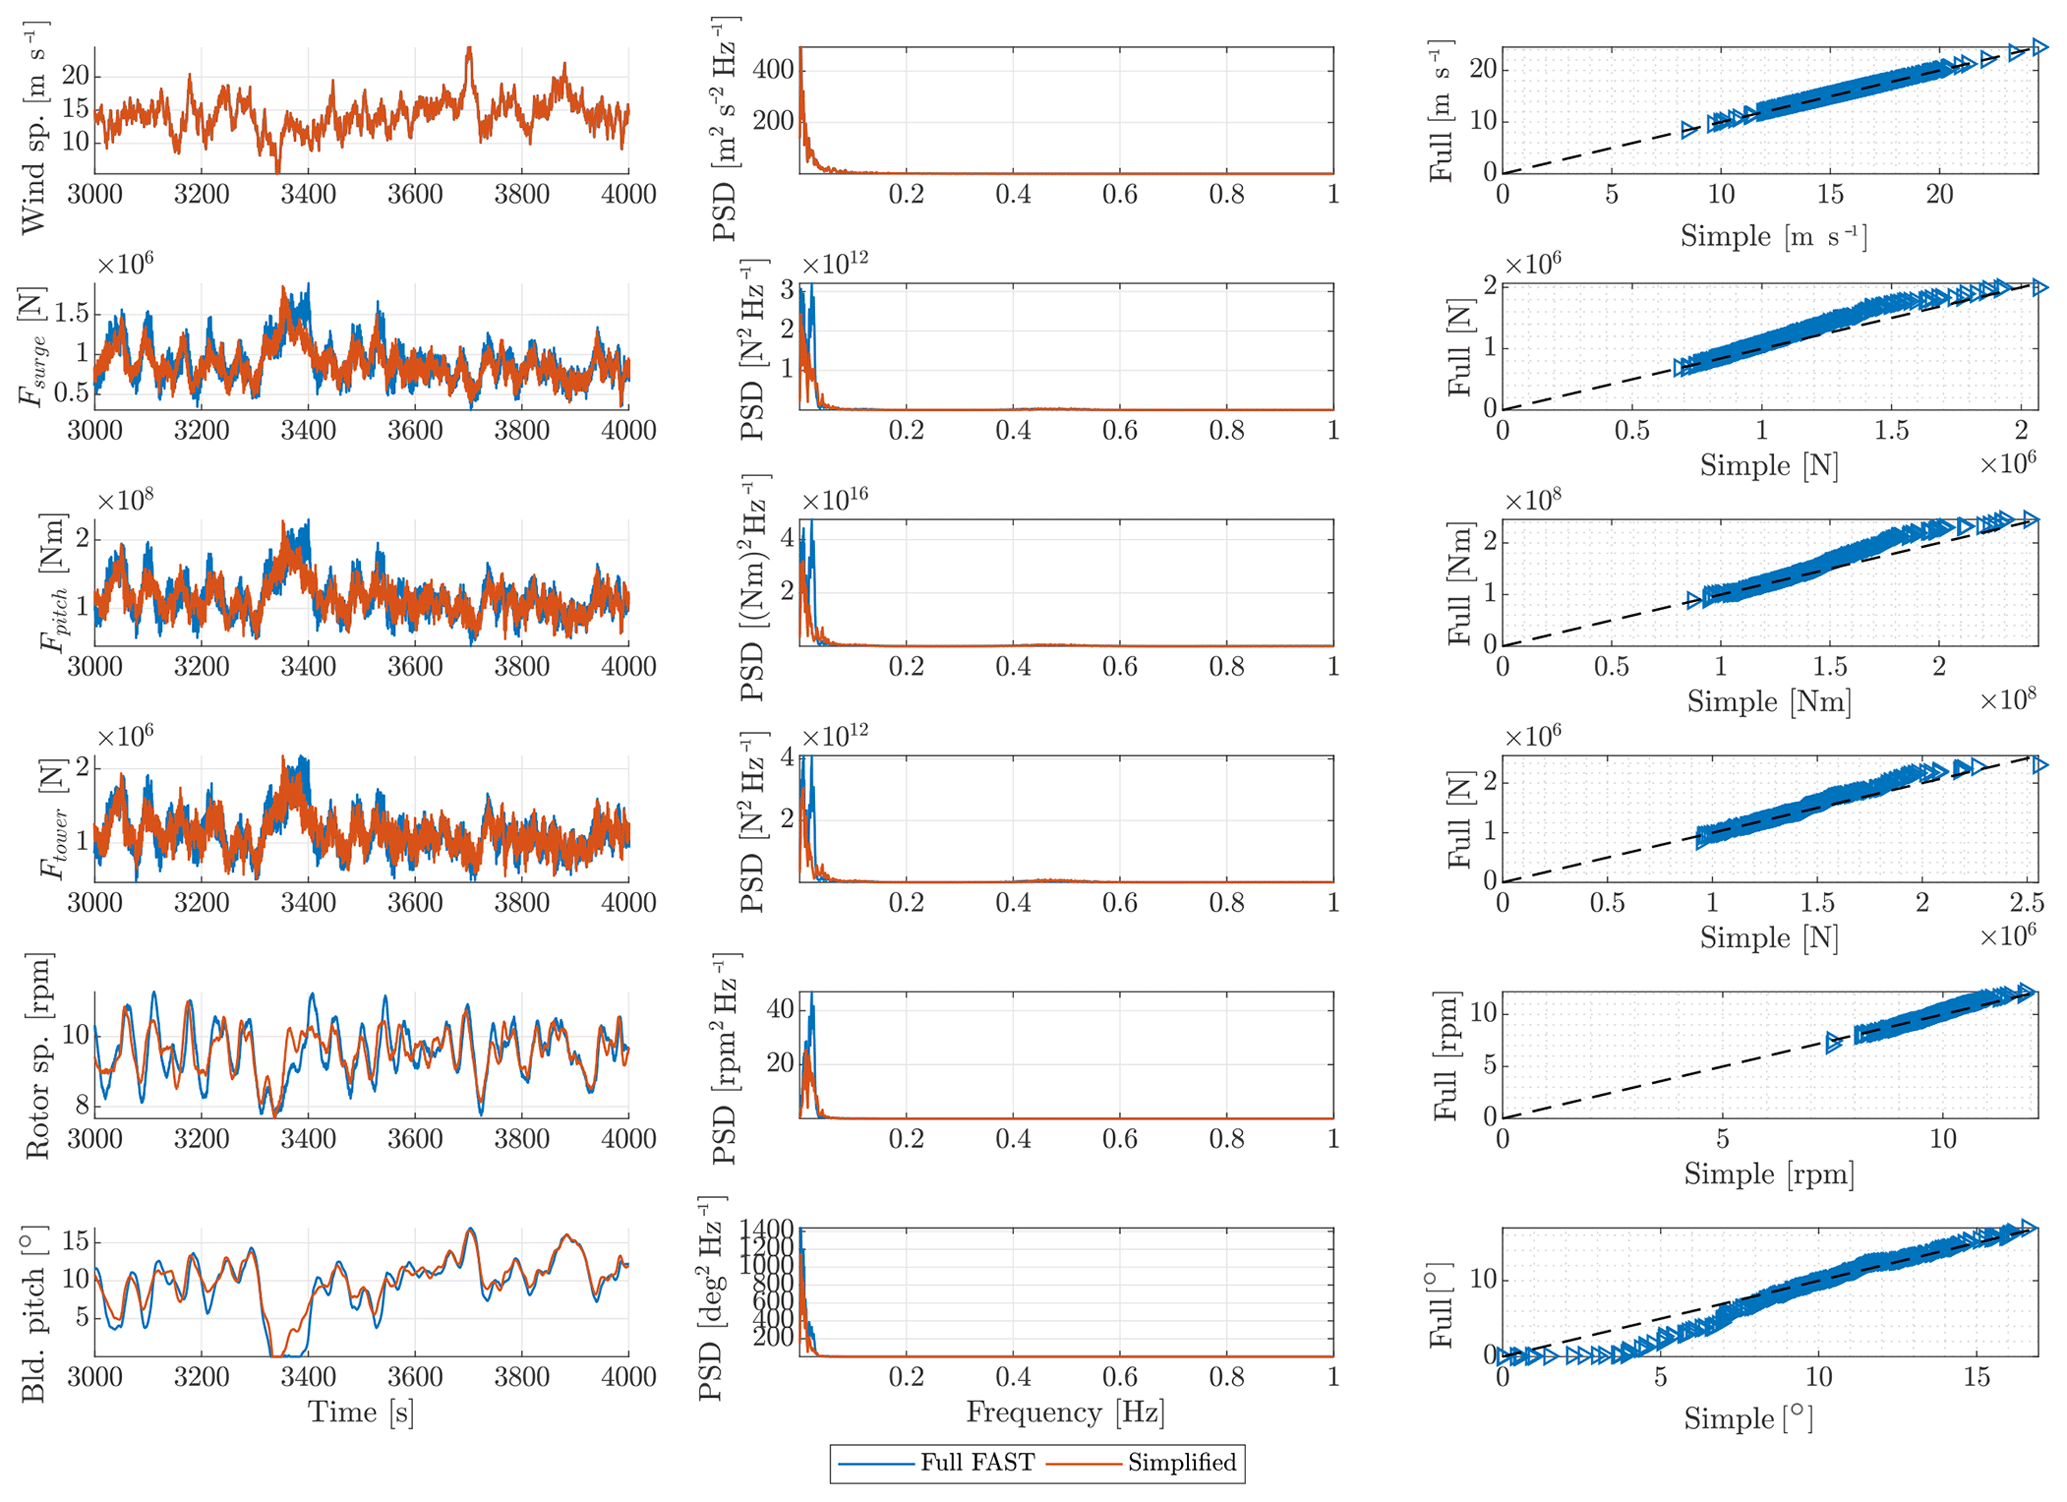
Figure 14Extracted aerodynamic forcing applied in the surge, pitch and tower deflection degrees of freedom and turbine operational data for DLC 1.3 with 13.9 m s−1 mean wind speed. Left: time series outline. Middle: corresponding power density spectrum (PDF). Right: peak values (sorted) for the full FAST computations as a function of the corresponding maximum values in the simplified method.
6.3 Over-predicted tower damping
Finally, limitation C, regarding the extraction of aerodynamic damping, is investigated. Figure 15 shows the aerodynamic damping ratio as a function of the natural frequency of the tower. It is observed that the aerodynamic damping decreases with tower frequency. Since the aerodynamic damping in QuLAF is extracted for a clamped tower with rigid blades, i.e. at a lower natural frequency compared to the full FAST model, the aerodynamic damping for the tower mode motion will be over-predicted, leading to a under-prediction of the tower response and nacelle acceleration in QuLAF. Also the under-predicted tower frequency in QuLAF relative to FAST (0.682 Hz vs. 0.746 Hz) will lead to smaller accelerations for the same motion amplitude.

Limitation C is thus confirmed and can explain the large under-prediction of the nacelle acceleration in the FLS study and in DLC 1.2 and DLC 1.3 of the ULS study.
Based on a selected subset of critical load cases, the accuracy of the simplified model QuLAF for different load cases has been investigated through comparison to a FAST state-of-the-art model. The study was based on the OO-Star Wind Floater Semi 10 MW floater and the DTU 10 MW reference wind turbine. The model accuracy was assessed both in terms of an FLS analysis and a ULS analysis.
The FLS analysis showed that the simplified model was very good at estimating the damage-equivalent bending moment at the tower base, but it systematically under-predicted the nacelle acceleration. The high under-prediction in the nacelle acceleration is likely due to the tower vibrations being too damped. The same picture of the nacelle acceleration being under-predicted in the simplified model was also present in the ULS analysis. The largest tower-base bending moments were generally over-predicted, but it was observed that stronger wind would lead to an over-prediction, whereas stronger waves would lead to an under-prediction. However, the largest load was obtained at 10.3 m s−1 in DLC 1.6, and here the effects compensated each other and gave a good match between the two models. Regarding the platform motions, the largest surge responses were observed in DLC 1.3 and DLC 1.6 with a 3 % over-prediction and 11 % under-prediction, respectively. The largest heave motions were generally well matched by the two models and presented highest values in the ESS cases. Further, the ultimate pitch responses were obtained in DLC 1.3 and DLC 1.6 (both at rated conditions) and within 4 % deviation. Lastly, for the emergency stop case of DLC 2.1, comparisons at the time series level showed that QuLAF is able to reproduce a transient event.
Analysis of the model limitations confirmed that the omission of viscous hydrodynamic loads is the cause of the under-estimated response for large sea states. Also the over-estimated damping of the tower mode was confirmed and explained by the frequency dependency of the damping, which implies a larger damping level for the clamped tower configuration. Recalibration of this damping is straightforward but will be configuration specific. Finally, a close inspection of the rotor-induced loads showed that the decoupled approach of QuLAF with linear damping provides very accurate loads when compared to a full FAST simulation. Based on the results at two wind speeds, there seems to be no strong limitation in this simple approach to rotor loads, even for a configuration with multiple degrees of freedom.
Despite its limitations, QuLAF has been found to be a quite accurate load and response prediction tool for the five aligned wind–wave load cases (DLC 1.2, 1.3, 1.6, 2.1 and 6.1), especially for tower-base bending moments, heave and pitch motions. The model can therefore be used as a tool to explore the design space in the preliminary design stages of a floating platform for offshore wind. The model can quickly give an estimate of the main natural frequencies, response and loads for a wide range of environmental conditions, which makes it useful for optimization loops. A full aero-hydro-servo-elastic model is still necessary to assess the performance in a wider range of environmental conditions, including non-linearities, fault conditions and real-time control.
The FAST model is publicly available, as detailed in Pegalajar-Jurado et al. (2018c) and Pegalajar-Jurado et al. (2018b). The QuLAF source code is not public due to possible commercialization in the future. The data used in figures and tables can be obtained by contacting the first author.
FJMA is the main responsible person for developing the comparison study, thus setting up the load cases, carrying out the simulations, analysing the results and preparing the manuscript. APJ and MB provided inputs to the limitations study and to the first and second versions of the manuscript.
The authors declare that they have no conflict of interest.
This work is part of the LIFES50+ project (http://lifes50plus.eu, last access: 29 April 2019) and the research leading to these results has received funding from the European Union's Horizon 2020 research and innovation programme (grant agreement no. 640741). Further support has been granted by Innovation Fund Denmark as part of the FloatStep project (grant no. 8055-00075A). The support and discussions with Frank Lemmer, Kolja Müller, Yu Wei (University of Stuttgart), Denis Martha (Rambøll) and Andreas Manjock (DNV-GL) are gratefully acknowledged.
This research has been supported by the European Union's Horizon 2020 programme (grant no. 640741). Further support has been granted by Innovation Fund Denmark as part of the FloatStep project (grant no. 8055-00075A).
This paper was edited by Gerard J. W. van Bussel and reviewed by Tor Anders Nygaard, Maurizio Collu, and one anonymous referee.
Bak, C., Zahle, F., Bitsche, R., Kim, T., Yde, A., Henriksen, L., Natarajan, A., and Hansen, M.: Description of the DTU 10 MW reference wind turbine, Tech. rep., No. I-0092, DTU Wind Energy, 2013. a
Hansen, M. and Henriksen, L.: Basic DTU Wind Energy controller, Tech. rep., No. E-0028, DTU Wind Energy, 2013. a
Hansen, M., Hansen, A., Larsen, T., Øye, S., Sørensen, P., and Fuglsang, P.: Control design for a pitch-regulated, variable-speed wind turbine, Tech. rep., No. Risø-R-1500(EN), Risø National Laboratory, 2005. a
IEC: 61400-3: Wind turbines – Part 3: Design Requirements for Offshore Wind Turbines, International Electrotechnical Commision, available at: https://webstore.iec.ch/publication/5446 (last access: 29 April 2019), 2009. a
Jonkman, J. and Jonkman, B.: NWTC Information Portal (FAST v8), available at: https://nwtc.nrel.gov/FAST8 (last access: 29 April 2019), 2016. a
Krieger, A., Ramachandran, G., Vita, L., Gómez-Alonso, G., Berque, J., and Aguirre, G.: LIFES50+ D7.2: Design basis, Tech. rep., DNV-GL, 2015. a, b, c, d, e
Lee, C. and Newman, J.: WAMIT, available at: http://www.wamit.com/ (last access: 29 April 2019), 2016. a
Lemmer, F., Müller, K., Pegalajar-Jurado, A., Borg, M., and Bredmose, H.: LIFES50+ D4.1: Simple numerical models for upscaled design, Tech. rep., University of Stuttgart, 2016. a
Müller, K., Faerron-Guzman, R., Borg, M., and Manjock, A.: LIFES50+ D7.7: Identification of critical environmental conditions and design load cases, Tech. rep., University of Stuttgart, 2018. a, b
Pegalajar-Jurado, A., Borg, M., and Bredmose, H.: An efficient frequency-domain model for quick load analysis of floating offshore wind turbines, Wind Energ. Sci., 3, 693–712, https://doi.org/10.5194/wes-3-693-2018, 2018a. a, b, c, d, e, f, g, h
Pegalajar-Jurado, A., Bredmose, H., Borg, M., Straume, J., Landbø, T., Andersen, H., Yu, W., Müller, K., and Lemmer, F.: State-of-the-art model for the LIFES50+ OO-Star Wind Floater Semi 10 MW floating wind turbine, J. Phys. Conf. Ser., 1104, 012024, https://doi.org/10.1088/1742-6596/1104/1/012024, 2018b. a, b, c, d, e
Pegalajar-Jurado, A., Madsen, F., Borg, M., and Bredmose, H.: LIFES50+ D4.5: State-of-the-art models for the two LIFES50+ 10 MW floater concepts, Tech. rep., Technical University of Denmark, 2018c. a, b, c
Schafhirt, S. and Muskulus, M.: Decoupled simulations of offshore wind turbines with reduced rotor loads and aerodynamic damping, Wind Energ. Sci., 3, 25–41, https://doi.org/10.5194/wes-3-25-2018, 2018. a
Schløer, S., Garcia-Castillo, L., Fejerskov, M., Stroescu, E., and Bredmose, H.: A model for Quick Load Analysis for monopile-type offshore wind turbine substructures, J. Phys. Conf. Ser., 753, 092008, https://doi.org/10.1088/1742-6596/753/9/092008, 2016. a
Schløer, S., Garcia Castillo, L., Fejerskov, M., Stroescu, E., and Bredmose, H.: A model for quick load analysis for monopile-type offshore wind turbine substructures, Wind Energ. Sci., 3, 57–73, https://doi.org/10.5194/wes-3-57-2018, 2018. a, b, c
Yu, W., Müller, K., and Lemmer, F.: LIFES50+ D4.2: Public definition of the two LIFES50+ 10 MW floater concepts, Tech. rep., University of Stuttgart, 2018. a, b, c