the Creative Commons Attribution 4.0 License.
the Creative Commons Attribution 4.0 License.
 | 11 Dec 2019
A double-multiple streamtube model for vertical axis wind turbines of arbitrary rotor loading
Anis A. Ayati
Konstantinos Steiros
Mark A. Miller
Subrahmanyam Duvvuri
Marcus Hultmark
We introduce an improved formulation of the double-multiple streamtube (DMST) model for the prediction of the flow quantities of vertical axis wind turbines (VAWT). The improvement of the new formulation lies in that it renders the DMST valid for any induction factor, i.e., for any combination of rotor solidity and tip speed ratio. This is done by replacing the Rankine–Froude momentum theory of the DMST, which is invalid for moderate and high induction factors, with a new momentum theory recently proposed, which provides sensible results for any induction factor. The predictions of the two DMST formulations are compared with VAWT power measurements obtained at Princeton's High Reynolds number Test Facility, over a range of tip speed ratios, rotor solidities, and Reynolds numbers, including those experienced by full-scale turbines. The results show that the new DMST formulation demonstrates a better overall performance, compared to the conventional one, when the rotor loading is moderate or high.
- Article
(2023 KB) - Full-text XML
- BibTeX
- EndNote


The study of vertical axis wind turbines (VAWTs) has received renewed attention in the last decade. There were noticeable research efforts devoted to VAWTs from the mid-1970s to the mid-1980s, primarily led by Sandia National Laboratories and NASA (Strickland, 1975, 1987; Sheldahl and Klimas, 1981; Paraschivoiu et al., 1983; Paraschivoiu, 1981; Muraca et al., 1975). The following two decades saw relatively little research activity on the topic, as it was concluded that VAWTs were more prone to fatigue and less efficient than horizontal axis wind turbines (HAWTs). Recently, however, it was suggested that by tightly packing VAWTs in a wind farm one can achieve increased power output per land area, compared to large modern HAWT farms (Dabiri, 2011). The above, coupled with the fact that VAWTs are insensitive to wind direction, have a low center of gravity, are serviceable from the ground, and offer low manufacturing and maintenance costs, have created a resurgence of interest in VAWT wind farms.
An important prerequisite for the successful realization of wind farms is the development of engineering flow models that combine low computational cost and sufficient accuracy, so that they can be used as design and optimization tools. In the case of HAWTs, blade element momentum (BEM) algorithms have been shown to fulfill these conditions and have subsequently become standard aerodynamic tools of the HAWT industry. A significant amount of research has been devoted to the development of analogous models for the case of VAWTs.
This is not a trivial matter, however, as the aerodynamics that govern VAWTs are inherently more complex than HAWTs. The effective angle of attack experienced by a VAWT blade section is not constant, as in the case of HAWTs, but depends on the blade's instantaneous orbital position as well as on the tip speed ratio (ratio of turbine tip to free-stream velocities). In addition, at relatively low tip speed ratios a blade section may experience large and rapid variations in effective angle of attack over the course of one rotation cycle. This leads to the highly unsteady and nonlinear flow phenomenon known as dynamic stall (Simão Ferreira et al., 2009; Buchner et al., 2015, 2018), which causes significant hysteresis in drag and lift forces. Lastly, depending on the tip speed ratio and rotor solidity, a blade located on the downwind rotor section may interact with its own or another blade's wake generated upwind (Kozak et al., 2016; Posa and Balaras, 2018), complicating further the VAWT response.
Despite these inherent complexities, a number of simplified analytical predictive methodologies have been proposed over the years (e.g., vortex, cascade, fixed-wake, streamtube approaches; Islam et al., 2008; Wilson and McKie, 1980). The streamtube, and specifically its variant, the double-multiple streamtube (DMST) model (Paraschivoiu, 1981; Rolin and Porté-Agel, 2018), is one of the most popular approaches, due to its low computational cost, high robustness, and ease of implementation. In a DMST model, the flow domain is discretized into a set of adjacent streamtubes, each featuring two actuators in tandem, one in the upstream rotor half-cycle and the second in the downstream half-cycle. In that way, two important aspects of the flow physics are taken into account: the constantly changing flow conditions experienced by the blades and the difference in perceived wind between the front and rear part of the rotor.
Nevertheless, such treatment of the rotor fails to model other important aspects of the flow physics: DMST assumes zero expansion of the streamtubes, and it neglects the wake–blade interaction and the effect of the downstream half of the rotor on the upstream half. For these reasons, DMST algorithms are known to fail to accurately capture the local aerodynamic loads on the rotor (Wilson and McKie, 1980; Ferreira et al., 2014); still, their “global” or mean predictions are of significant accuracy, and as a result DMST remains a popular tool in VAWT design protocols.
Despite its usefulness, however, DMST is inapplicable to highly loaded VAWTs, i.e., characterized by high values of rotor solidity and tip speed ratio. That is because rotor loading correlates with the induction factors of the streamtubes. At an induction factor of 50 % the core of the DMST model, the classical momentum theory of Rankine–Froude breaks down, predicting zero wake velocity and infinite wake width. For even larger induction factors the wake velocities and wake widths assume nonphysical negative values, while drag is greatly underpredicted (Hansen, 2015).
In HAWT BEM models, this inconsistency of the momentum theory is rectified by using empirical values for the drag, the so-called Glauert correction (Buhl and Marshall, 2005). In the case of VAWTs, however, this is not sufficient as the wake flow quantities need to be corrected as well. That is because in a DMST solution the wake velocity of the front half-rotor determines the response of the rear half-rotor. Classical momentum theory cannot accurately predict the wake flow quantities at high induction factors. As such, DMST is typically considered valid only for weakly loaded rotors where the induction factor is smaller than 50 % (Ferreira et al., 2014).
In this article, we propose a resolution to this issue by substituting the Rankine–Froude momentum theory of the DMST with the momentum theory proposed by Steiros and Hultmark (2018). This momentum theory takes into account the effect of “base suction” in the wake (i.e., low wake pressure due to dissipation and wake entrainment), which is neglected in the theory of Rankine–Froude. For low induction factors, where base suction is minimal, the predictions of the two momentum theories coincide, while for large induction factors the theory of Steiros and Hultmark produces much more realistic predictions. In that way DMST becomes valid, in principle, for any rotor loading.
To quantify the accuracy of the proposed methodology, we compare predictions of a conventional DMST model equipped with both the momentum theories of Rankine–Froude and Steiros and Hultmark, and with VAWT data acquired at Princeton's High Reynolds number Test Facility (HRTF). The data cover a range of rotor solidities, Reynolds numbers, and tip speed ratios, which involve both weakly and heavily loaded rotors, at dynamically similar conditions to field VAWTs.
The structure of the article is as follows: the most relevant steps of the DMST model are outlined in Sect. 2, the HRTF experiments are briefly described in Sect. 3, results are discussed in Sect. 4, and concluding remarks are given in Sect. 5.
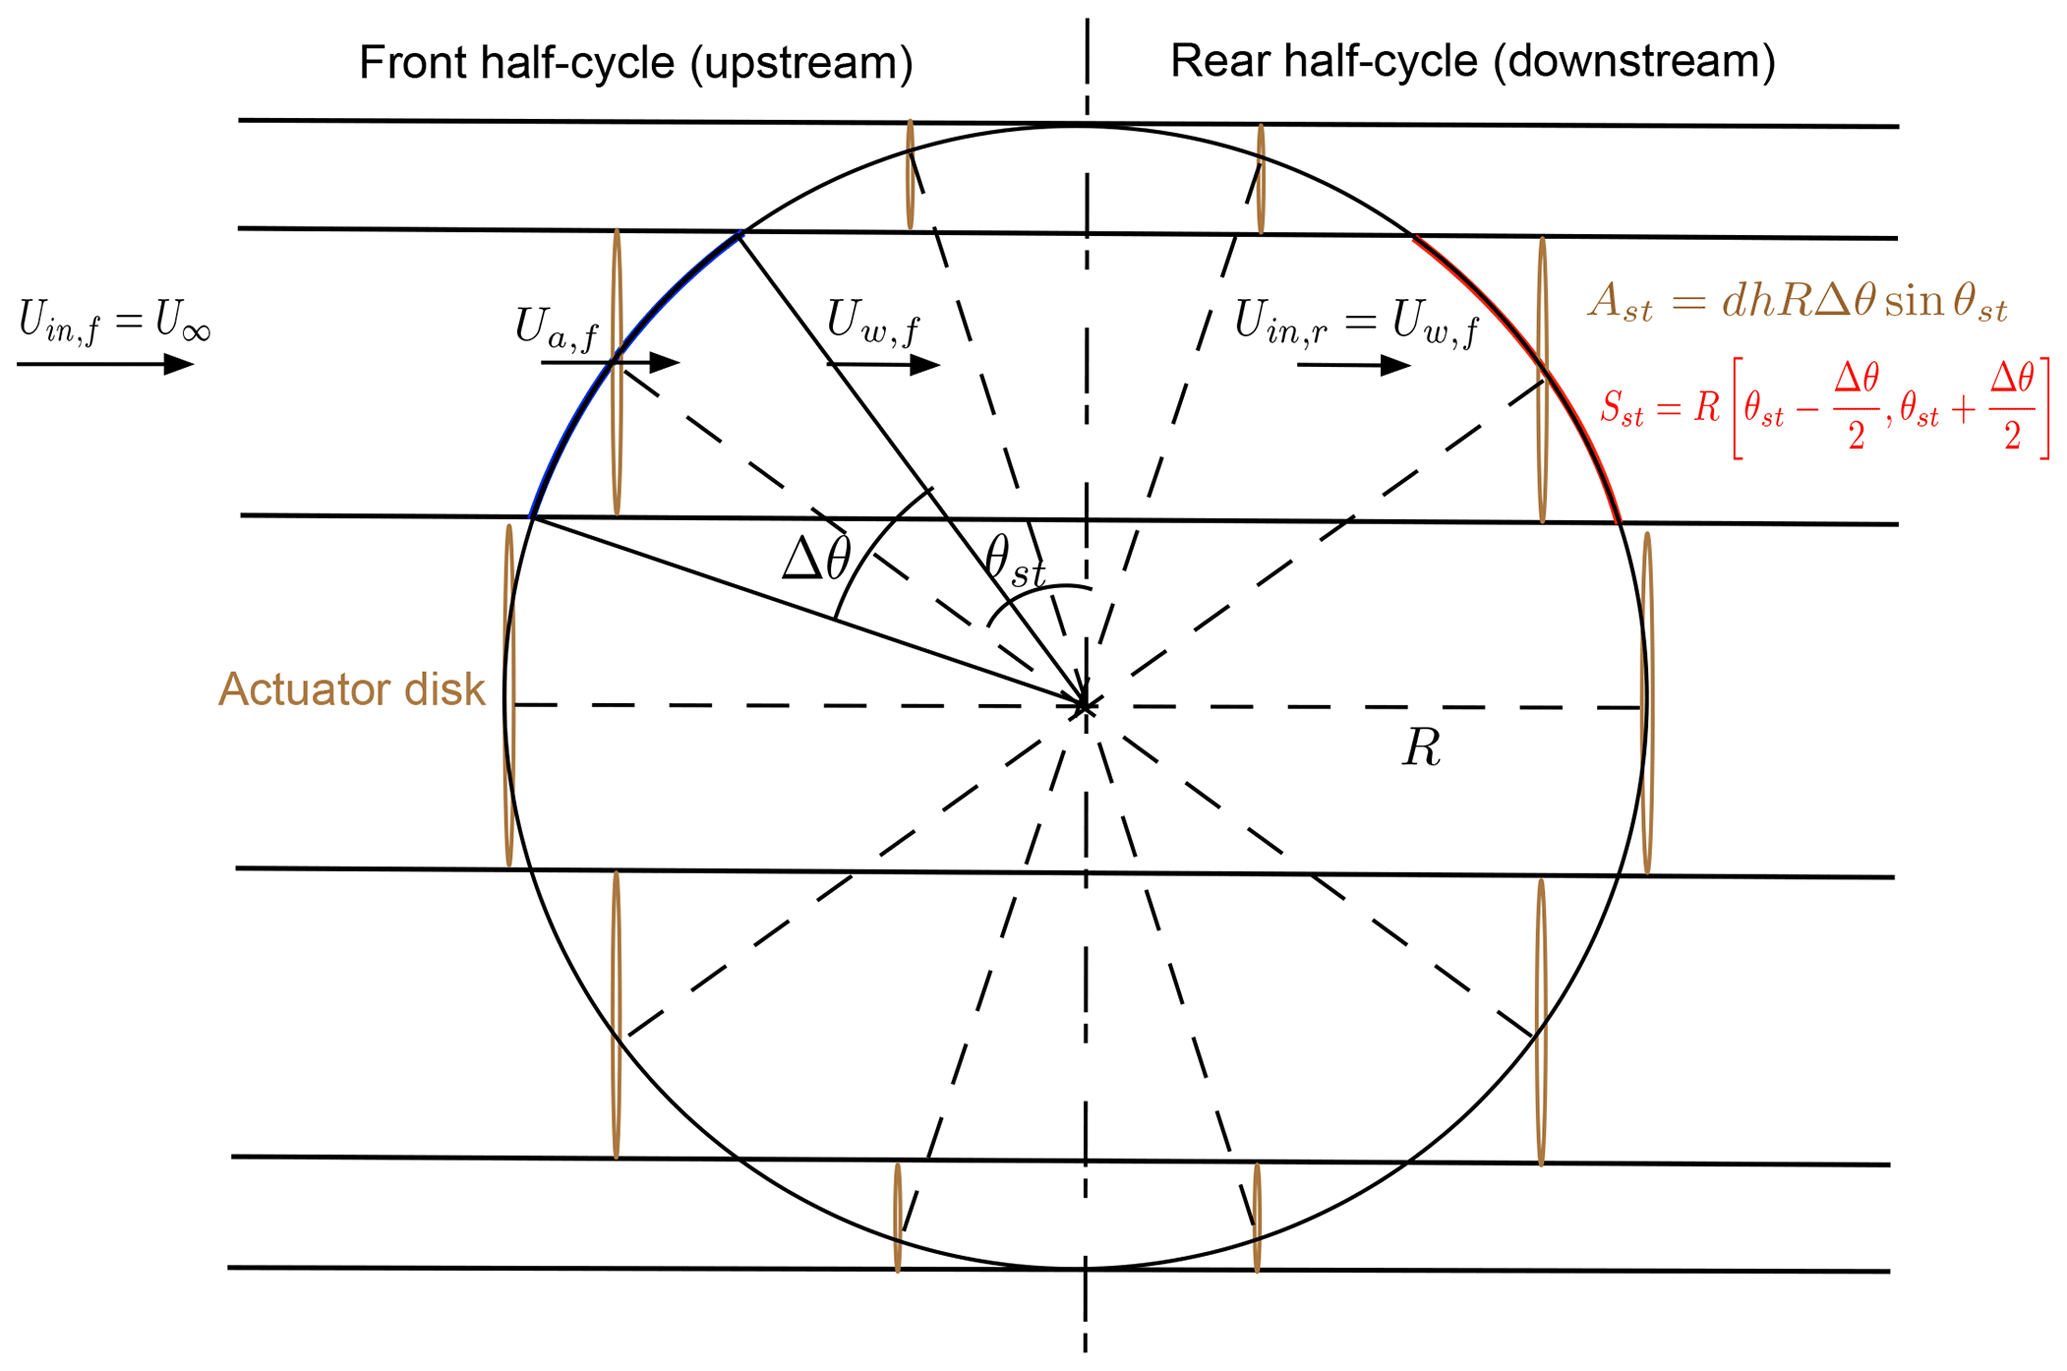
In a DMST model, the rotor is divided into a front (upstream) and rear (downstream) half-cycle. The flow through a rotor of radius R is discretized into a set of adjacent streamtubes, each featuring two actuator plates in tandem, as illustrated in Fig. 1. The rotor circumference is divided into 2Nst arcs of equal length, Sst=RΔθ, where and Nst is the number of streamtubes. Each streamtube is defined by an azimuth angle θst which depicts the middle point on the rotor arc bounded by the streamtube boundaries, . Note that the frontal area of each actuator plate, Ast=dhRΔθsin θst, in which dh is the length of a blade element in the spanwise direction, is not constant. Finally, an important aspect of DMST modeling is that an upstream disk is subjected to the free-stream velocity, i.e., , while a downstream disk is assumed to be subjected to the wake velocity produced by the front disk, i.e., .
Using the above simplified flow description, the DMST model is able to provide predictions based on two methodologies: the momentum theory and the aerodynamic load analysis.
2.1 Classical momentum theory
The momentum theory aspect of conventional BEM models (including the DMST) builds upon the classical Rankine–Froude actuator disc theory (Betz, 1920; Glauert, 1930). We consider a permeable disk which acts as a drag device slowing the free-stream velocity from U∞ far upstream to Ua at the disc plane and to Uw in the wake. Ua is referred to as the induced velocity and can be expressed in terms of the induction factor a defined as
The actuator disk theory assumes potential flow everywhere apart from the immediate vicinity of the disc, a nonrotating actuator disc, and no base suction in the wake. The latter assumption implies that the wake can be treated using potential flow theory up to a far point where the pressure becomes equal to the free-stream pressure, i.e., the boundary condition of the wake becomes pw=p∞.
By applying mass and momentum balance to a control volume enclosing the actuator disk and normalizing the resulting drag with the term , where A and ρ are the disc area and fluid density, respectively, we obtain the well-known expression for the disk drag coefficient (Hansen, 2015). However, this expression has been shown to agree well with experimental data only for low induction factors (see Fig. 2). In practice, the following expression is used
where the theoretical prediction is applied only for a≤0.4, while for larger induction factors Glauert's empirical correction (Buhl and Marshall, 2005) is used. The wake velocity Uw(a) takes the form
Note that for a>0.5 the momentum theory breaks down and predicts negative Uw values. The failure of the theory is even more evident if we inspect the normalized wake cross-sectional area, predicted to be . For a>0.5 this expression yields nonphysical negative areas.
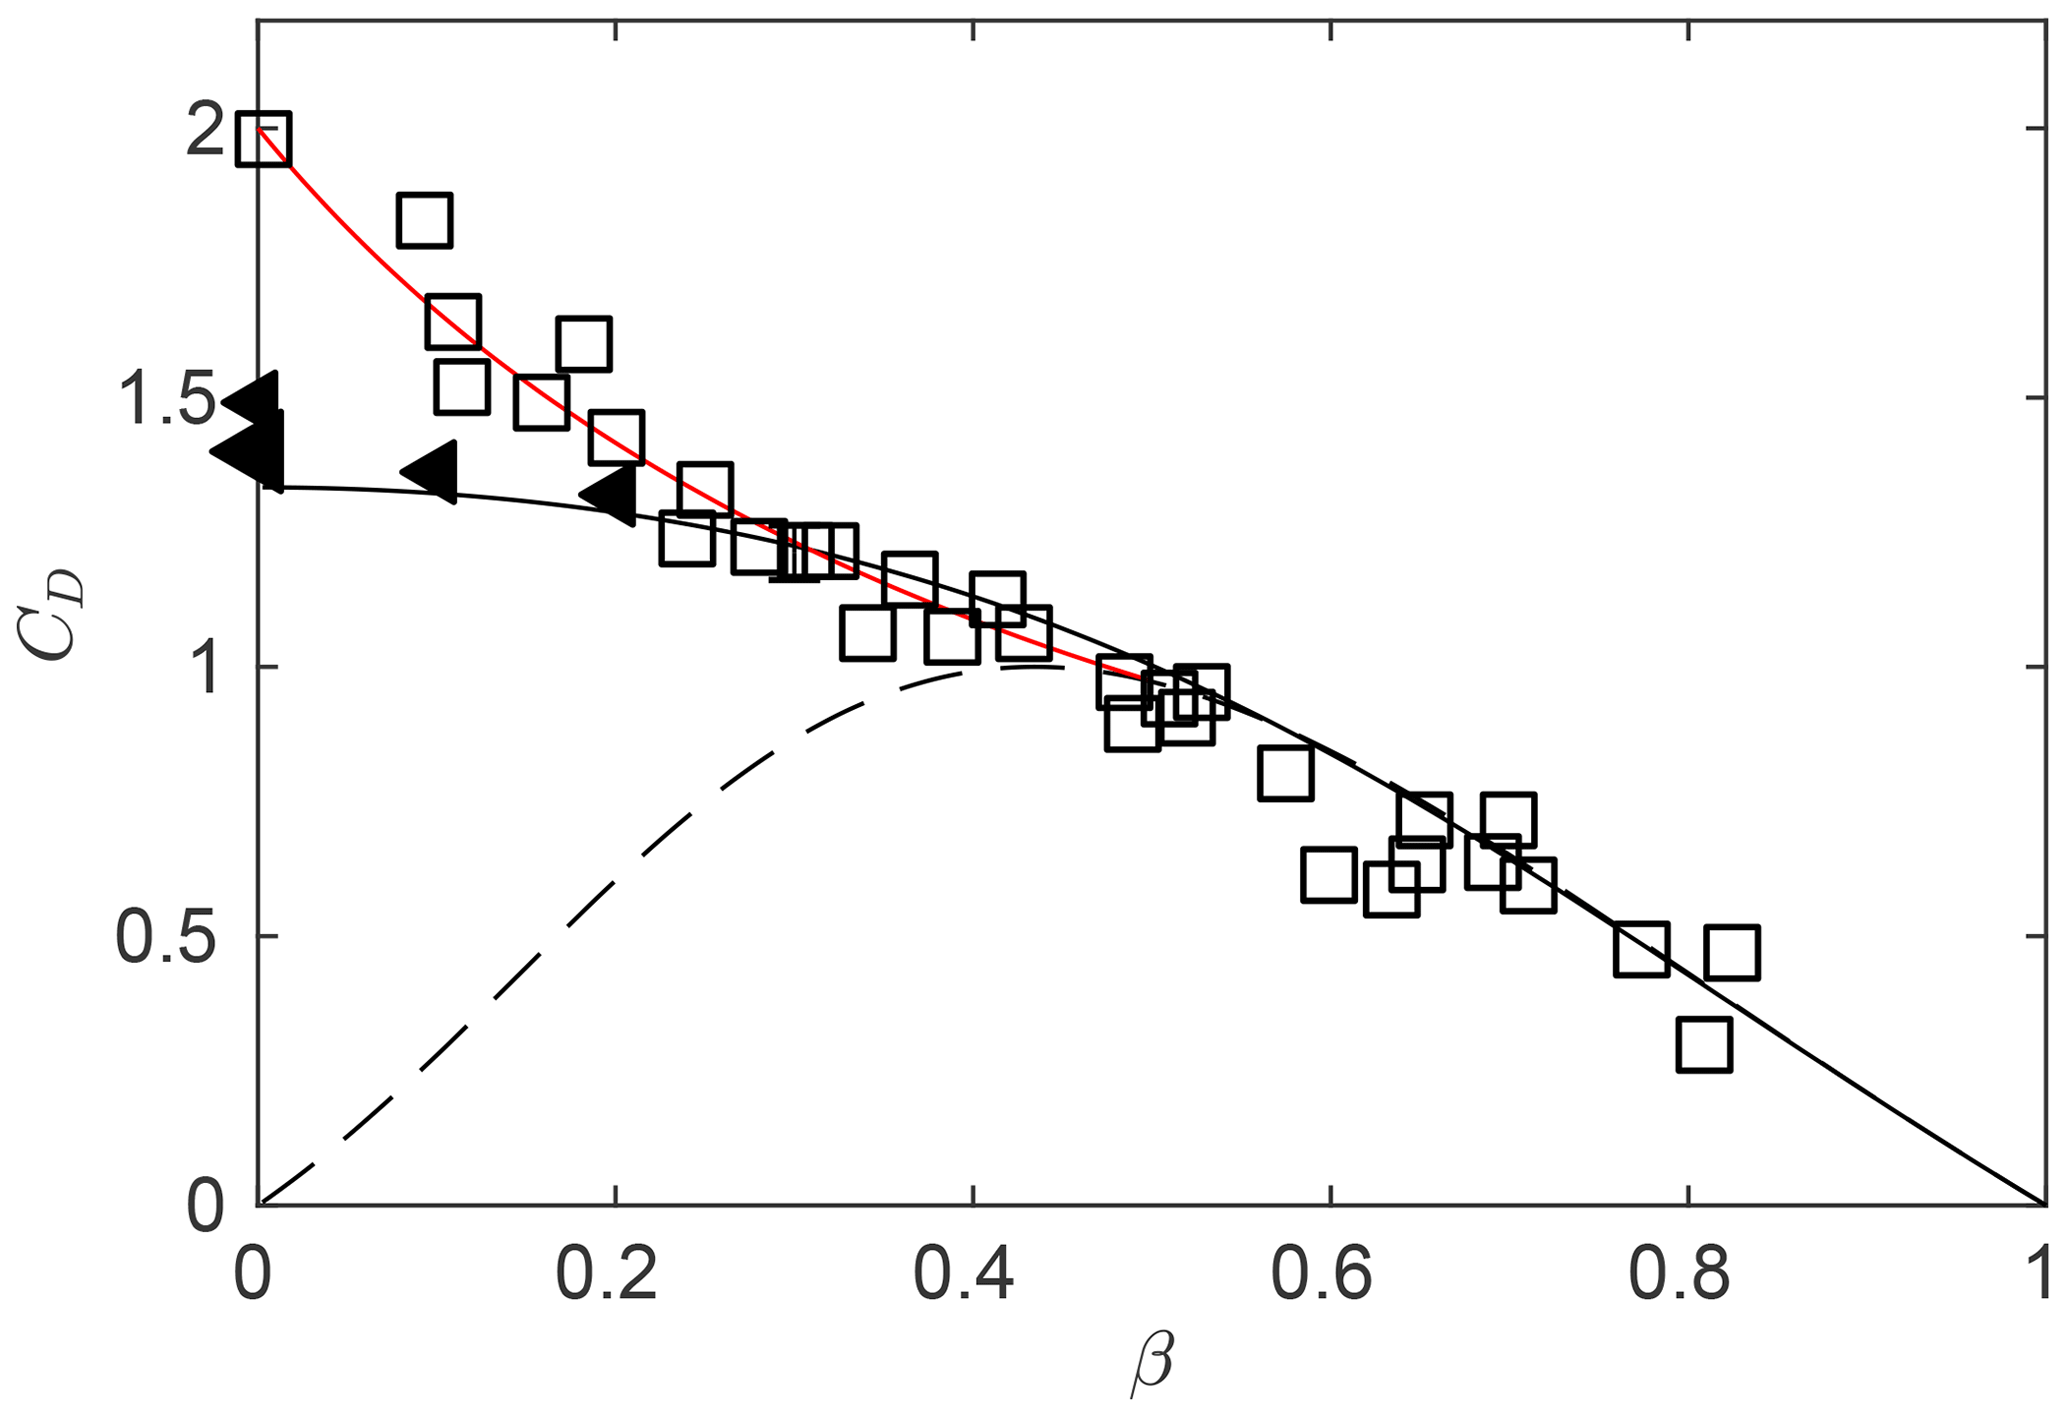
Figure 2Porous plate drag coefficient versus plate open area ratio, , where Ap is the porous plate area and A is the gross plate area. Squares: measurements with no splitter plate. Triangles: measurements with splitter plate. Solid line: analytical prediction of Steiros and Hultmark (2018). Dashed line: analytical prediction of Rankine–Froude theory. Red line: Glauert's empirical correction. Adapted from Steiros and Hultmark (2018).
Equations (1), (2), and (3) form the basis of the momentum theory which is incorporated in conventional BEM models (including the conventional DMST model used in this study).
2.2 Current momentum theory
Steiros and Hultmark (2018) extended the momentum theory of Rankine–Froude by including the effect of base suction in the wake. This theory is based on potential flow principles, where the plate is represented as a distribution of sources of equal strength. The wake velocities are rescaled, to ensure mass continuity across the plate, while the wake pressure is allowed to assume arbitrary values, so that base suction is taken into account. The various unknown quantities of the problem are then calculated using mass, momentum, and energy balances.
The drag coefficient is predicted to be
which, as shown Fig. 2, agrees well with experimental data for a larger range of plate porosities, compared to the Rankine–Froude theory. Note that in Fig. 2 the drag coefficient is plotted as a function of the plate porosity, β, rather than the induction factor a. These two quantities can be linked using a methodology described in the work of Steiros and Hultmark (2018), which is based on the modeling of the expansion losses of the fluid that passes through the plate.
Figure 2 shows that for low plate porosities (less than 20 % of the gross plate area) the model of Steiros and Hultmark underpredicts the drag. This is because at low porosities the wake becomes unsteady and vortices are shed from the plate, a phenomenon which is not modeled by this momentum theory. However, if the wake is stabilized (e.g., with the use of a splitter plate), drag measurements collapse with the theoretical curve for all plate porosities, even up to the solid case (see Fig. 2).
If we express CD as a function of the induction factor, we find that the drag predictions of Steiros and Hultmark (2018) agree well with experimental data for a≤0.7, while a correction is still needed for higher induction factors, to take into account the effect of the unsteadiness of the wake on the drag. Similarly to the classic BEM formulation, we use Glauert's empirical correction for a>0.7. The resulting drag coefficient is
which is shown to agree with experimental measurements for all plate porosities (see Fig. 2). The wake velocity is predicted to be
while the normalized wake width is predicted to be . Both wake quantities do not assume nonphysical infinite or negative values at any induction factor, a fact which further demonstrates that this theory is more suitable than the Rankine–Froude theory for cases of high loading.
Equations (5) and (6) are used instead of Eqs. (2) and (3) in the formulation of the novel DMST algorithm.

2.3 Aerodynamic loads analysis
The other aspect of the BEM method deals with the local aerodynamics of a blade segment (airfoil). Figure 3 provides a top-down view of a VAWT rotor and displays a velocity and force diagram associated with a blade section. The blade forces depend on the constantly changing effective angle of attack α, which is a function of the azimuth angle, θ, induction factor a and tip speed ratio , where ω is the angular velocity of the turbine and Uin=U∞ for the front streamtubes, while Uin=Uw for the rear streamtubes. From the velocity triangle, it can be seen that
The relative velocity experienced by the blade, Ur, is the vector sum of the orbital velocity, ωRiθ, and the induced velocity, Uaix. By virtue of Eq. (1) we obtain
Given the angle of attack and relative velocity, aerodynamic loads can be determined using tabulated lift and drag coefficients (CL,CD) and geometric considerations. In this study, static lift and drag coefficients for the airfoil profile NACA-0021 were collected from the Sandia National Laboratories technical report of Sheldahl and Klimas (1981) for static Re and angles of attack . These static Reynolds numbers are based on the free-stream velocity and blade chord length. In the case of a VAWT, the static Reynolds numbers must match the effective blade Reynolds number based on the chord length and relative blade velocity. Subsequently, local drag and lift coefficients are found by interpolation in the [Re, α] space.
It is noted that Sheldahl and Klimas (1981) did not provide measurements for the high-Re quantities that we use in this study (in fact high-Re airfoil data are sparse in the literature). Instead, they inferred their high-Re data using an airfoil-property-synthesized code which extended measurements of thinner NACA airfoil profiles, obtained at moderate Reynolds numbers. The above introduces a degree of error in the DMST predictions. Nevertheless, as shown below in the text, the predictions of the DMST model are relatively accurate for all tested Re, and therefore the inferred data of Sheldahl and Klimas (1981) can be considered reasonable estimations.
The drag and lift coefficients of the airfoils can be combined to yield the local tangential and normal force coefficients
and
By further combining Cn and Ct and multiplying with the local dynamic force , where Ab is the blade surface, we obtain the instantaneous thrust
Finally, the torque τ is the product of the tangential force and radius; i.e.,
2.4 Solving for the induction factor in a streamtube
The DMST model calculates the induction factor a, by equating the drag of an actuator disk associated with a given streamtube to the cycle-averaged thrust on Nb blades that move along the rotor section Sst.
The cycle-averaged thrust coefficient corresponding to Nb blades crossing the ist streamtube can be approximated as
where the integration domain is . In the limit of an infinite number of streamtubes or Nst→Nθ, the integral in Eq. (13) reduces to ΔθTh(θst,ast). κ is a coefficient relevant to the way blade element theory is applied in a VAWT. There is some ambiguity in the literature regarding the value of κ, which has taken different values in various streamtube algorithm implementations (e.g., κ=1 Freris, 1990, κ=2 Strickland, 1975, or κ=4 Beri and Yao, 2011). Our experimental data agree well only with the κ=4 version, no matter the momentum theory choice; this value is therefore chosen in the DMST model and remains constant in our comparisons of current and conventional momentum theory approaches.
By equating Eq. (13) to the drag of the actuator disk related to each streamtube (Eq. 2 for the conventional model and Eq. 5 for the new model), we obtain a nonlinear equation on ast which we solve iteratively. This process is repeated twice, once for the upstream and once of the downstream rotor half-cycles.
After the induction factor ast has been determined for each streamtube in both the front and rear half-cycles, the total power coefficient , where indices 1 and 2 indicate front and rear contributions, can be computed using
where Ad is the rotor frontal area.
In order to compare the effect of the two momentum theories in the DMST, the power of a VAWT model was tested at Princeton's High Reynolds number Test Facility (HRTF). The HRTF is a variable-pressure, low-velocity wind tunnel that can be operated at static pressures of up to ps=230 bar and free-stream velocities of up to U∞=10 ms−1. This permits the testing of a large range of Reynolds numbers, while keeping the free-stream velocities and Mach numbers small. The inlet turbulence intensities of the test section are 0.3 % at the lowest Reynolds numbers, and 1.1 % at the highest Reynolds numbers (Jiménez et al., 2010). The above facility permitted the attainment of dynamic similarity in the current experiment, by simultaneously matching the Reynolds number, tip speed ratio, and Mach number of the VAWT lab-scale models with those encountered in full-scale VAWTs.

Figure 4(a) Five-bladed VAWT model with dimensions. (b) Top-down view of all four turbine configurations. The airfoil profile is that of NACA-0021 in all models.
The VAWT models (see Fig. 4) had a diameter D=96.60 mm, a rotor span S=162.58 mm, and a chord c=21.63 mm, leading to a tunnel blockage (Atunnel is the cross-sectional area of the tunnel's test section). A total of four lab-scale VAWT models were tested, each characterized by its number of blades (). The experiments covered a range of Reynolds numbers () and tip speed ratios (). Except for the number of blades, all other turbine features were identical in all four VAWT models. The airfoil profile was that of a NACA-0021. The rotor was designed to be similar to the one used in the Field Laboratory for Optimized Wind Energy (FLOWE) (Dabiri, 2011). More details related to the experimental campaign can be found in Miller et al. (2018).
4.1 DMST convergence
In a DMST algorithm, the number of streamtubes, Nst, is an arbitrary parameter. To decide on that number, a convergence test was performed, based on the “normalized error”
where Cpi and are the measured and predicted power coefficients for a given tip speed ratio, as indicated by the subscript i. In Fig. 5 we show a typical convergence plot of ϵ. The results are independent of Nst after approximately 15 streamtubes. We therefore used for all our tests Nst=30. This yielded an average run time of about 0.7 s per λ case, for both current and conventional DMST algorithms, using a 3.1 GHz Intel Core i7 laptop computer running an in-house MATLAB code.
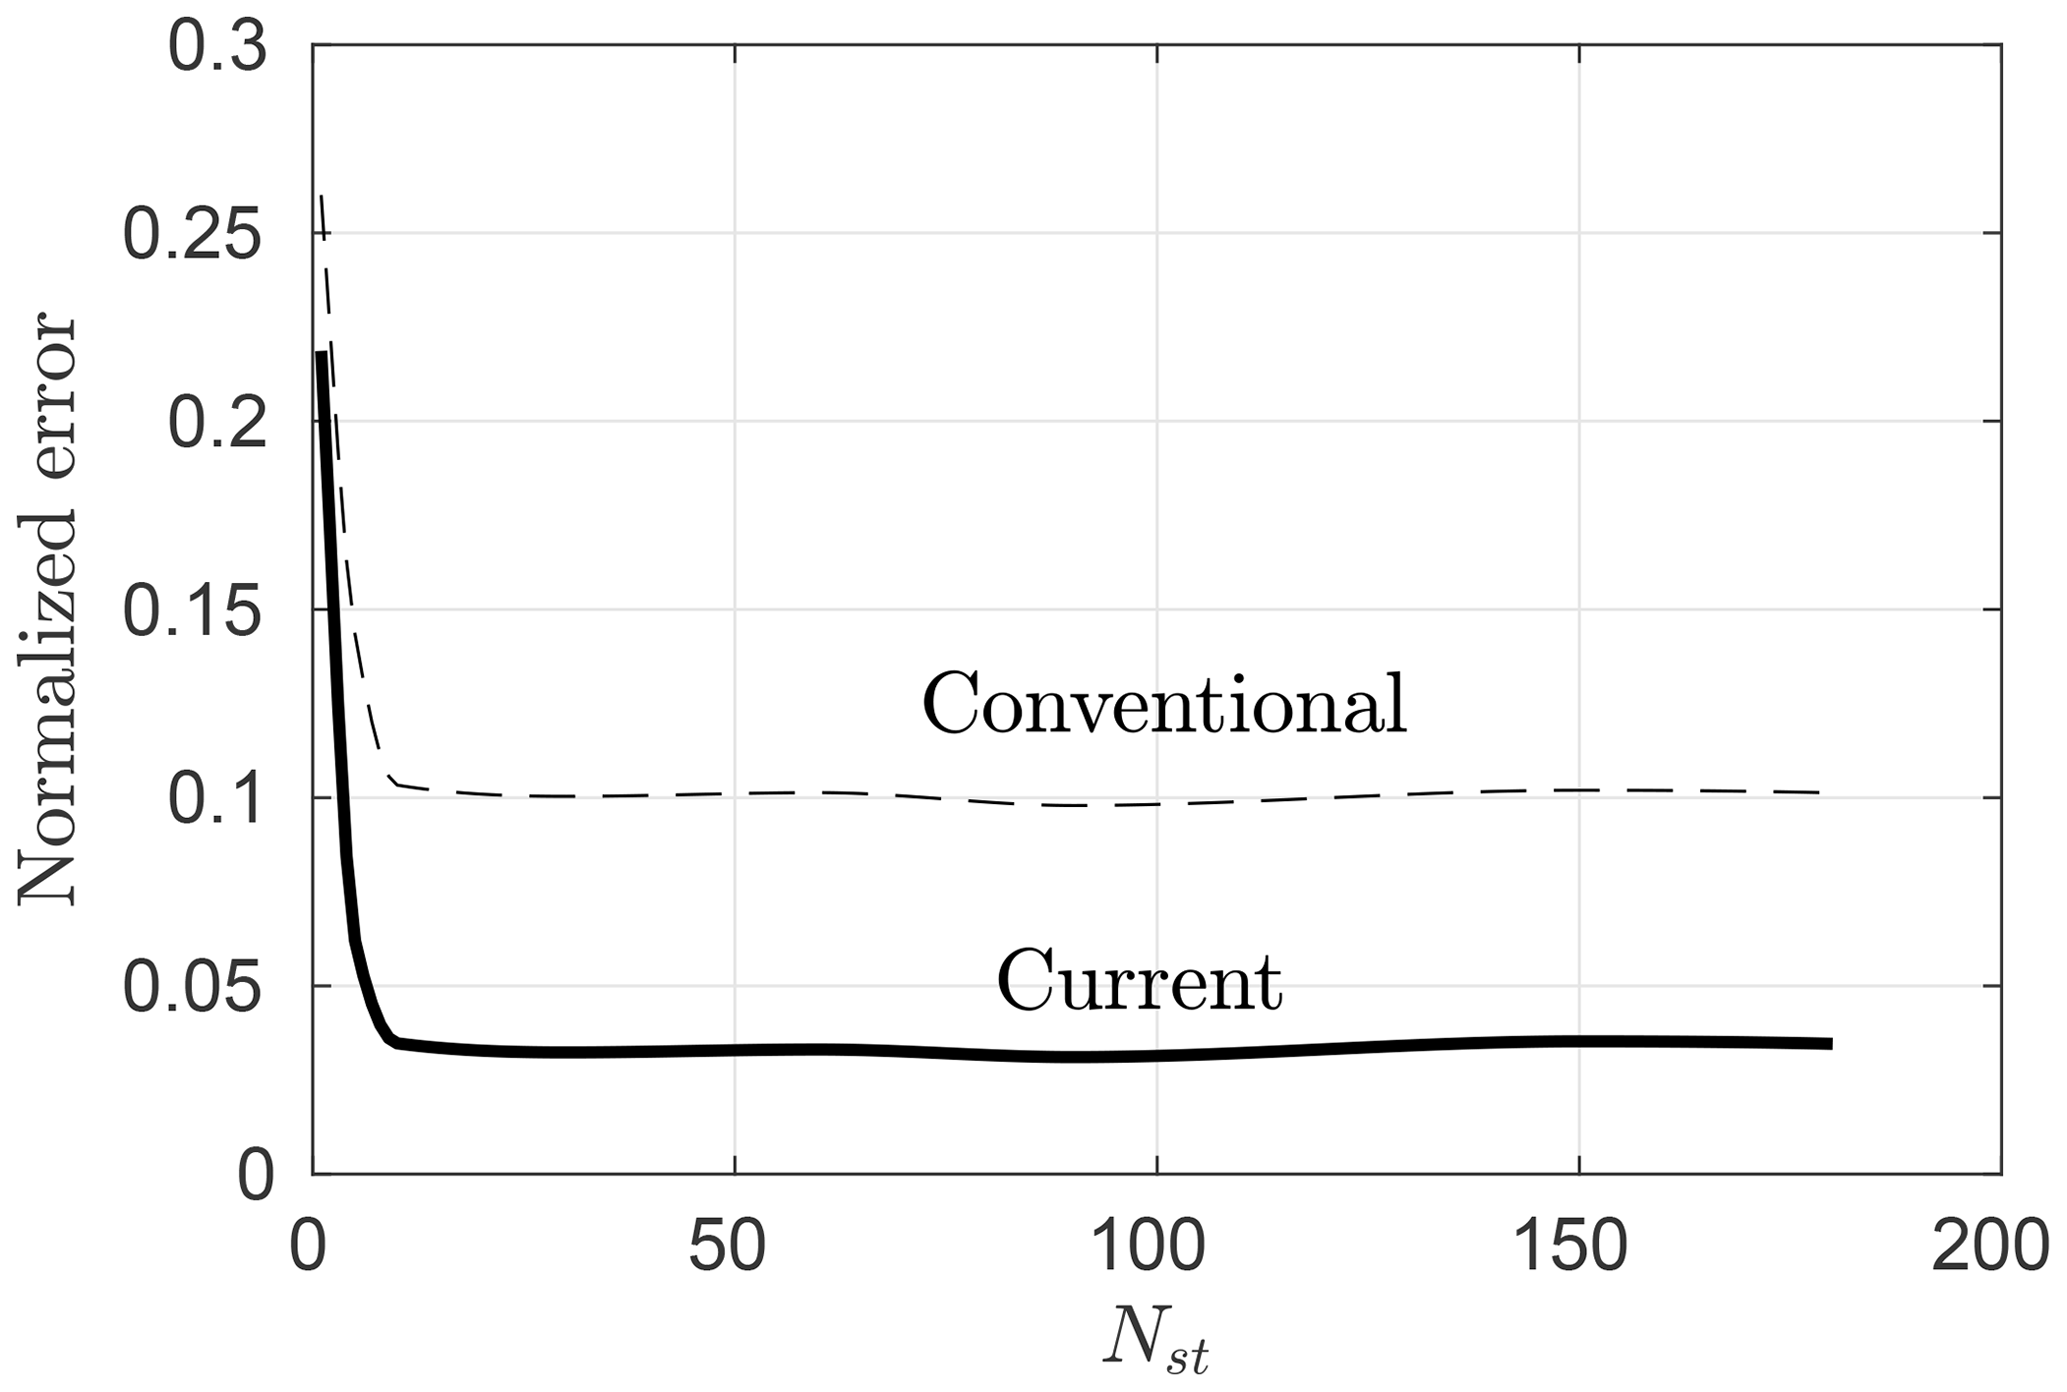
Figure 5Normalized error as a function of the number of streamtubes shown for both conventional and current DMST models, for a three-bladed turbine at Re.
From Fig. 5 it can be qualitatively seen that the current DMST model yields more accurate results than the conventional one. In order to assess this increase in accuracy more thoroughly, in the following sections we compare the predicted power coefficients of the two DMST versions for all four turbine configurations and across a range of operating conditions.
4.2 Experimental validation
Figure 6 shows predicted and measured power coefficients for a three-bladed VAWT. Results from the current and conventional DMST models are shown on Fig. 6a and b, respectively. The predictions include the total power coefficient Cp and its contributions from the front (Cp,f) and rear (Cp,r) disks. The measurements correspond to tip speed ratios , the free-stream velocity U∞=3.1 ms−1, and the Reynolds number based on the rotor diameter Re.
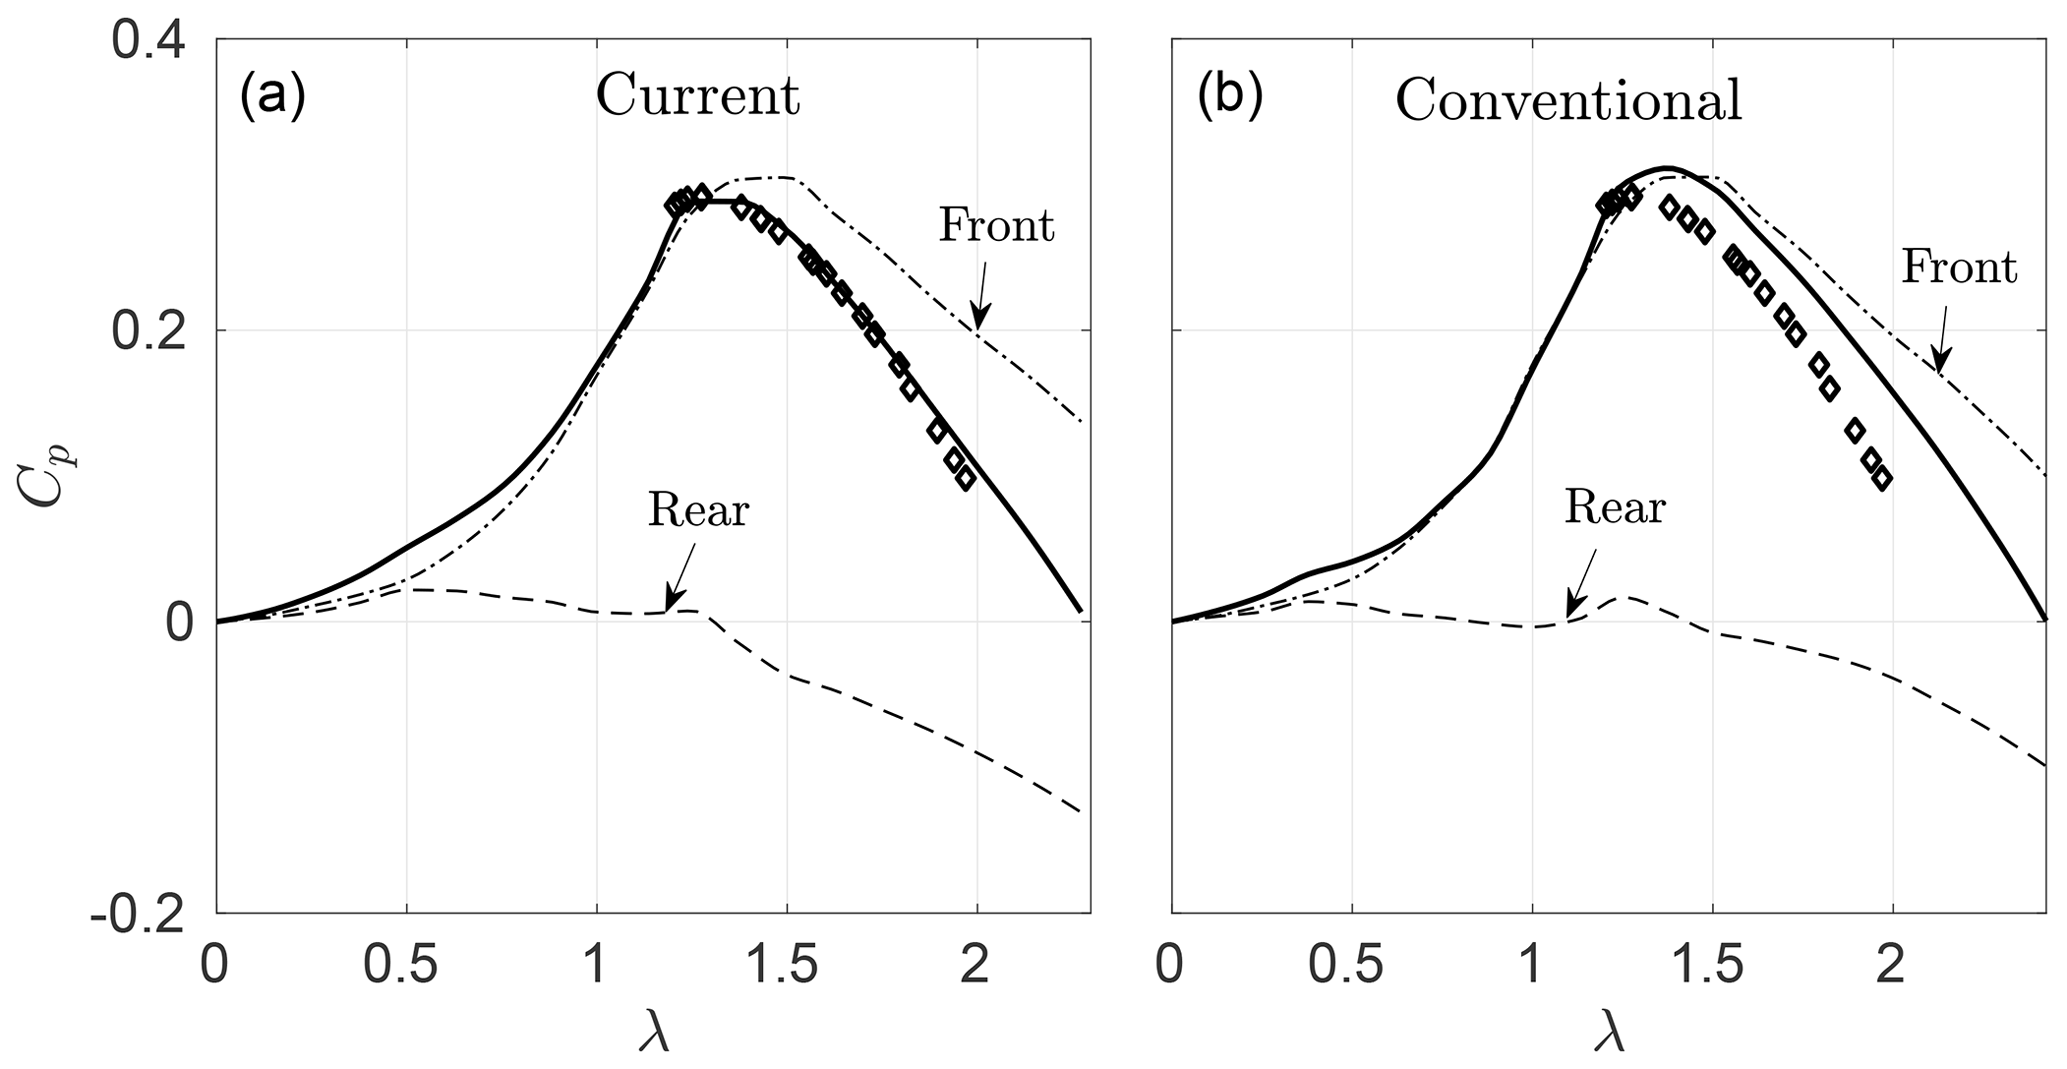
Figure 6Comparison of current (a) and conventional (b) model predictions of power coefficients for the three-bladed VAWT. HRTF experimental data (diamonds) at Re are plotted as a reference. Front and rear power contributions Cp,f and Cp,r are shown explicitly.
As the tip speed ratio increases, the current DMST model provides power predictions which are in better agreement with the measurements, compared to the conventional one. The reason for this improvement can be seen if we compare the contributions of the front and rear disks for each model. As expected, the front power contributions are very similar, since the input velocity is the same in both models, and actuator drag is approximately captured by the Glauert correction. However, there is a noticeable difference in the rear half-cycle power predictions, due to the nonnegative rear streamtube input velocities of the new model.
To assess this difference in wake velocity in the above case, in Fig. 7 we plot the distribution of the upstream wake velocity, Uw,f(θ), at the highest tested tip speed ratio (λ=1.97), that is, for the case where base suction (and therefore the difference between the two DMST implementations) is largest. We observe that, indeed, the proposed DMST model, which has the new momentum theory incorporated, predicts positive wake velocities. The conventional DMST model produces, in general, nonphysical negative wake velocities. As seen from the induction factor distribution (right plot in Fig. 7) the negative wake velocities correspond to a>0.5, in accordance with the Rankine–Froude momentum theory. We remind that for such high induction factors, DMST results based on the Rankine–Froude theory are considered invalid and were not plotted in previous studies (see for instance Ferreira et al., 2014).
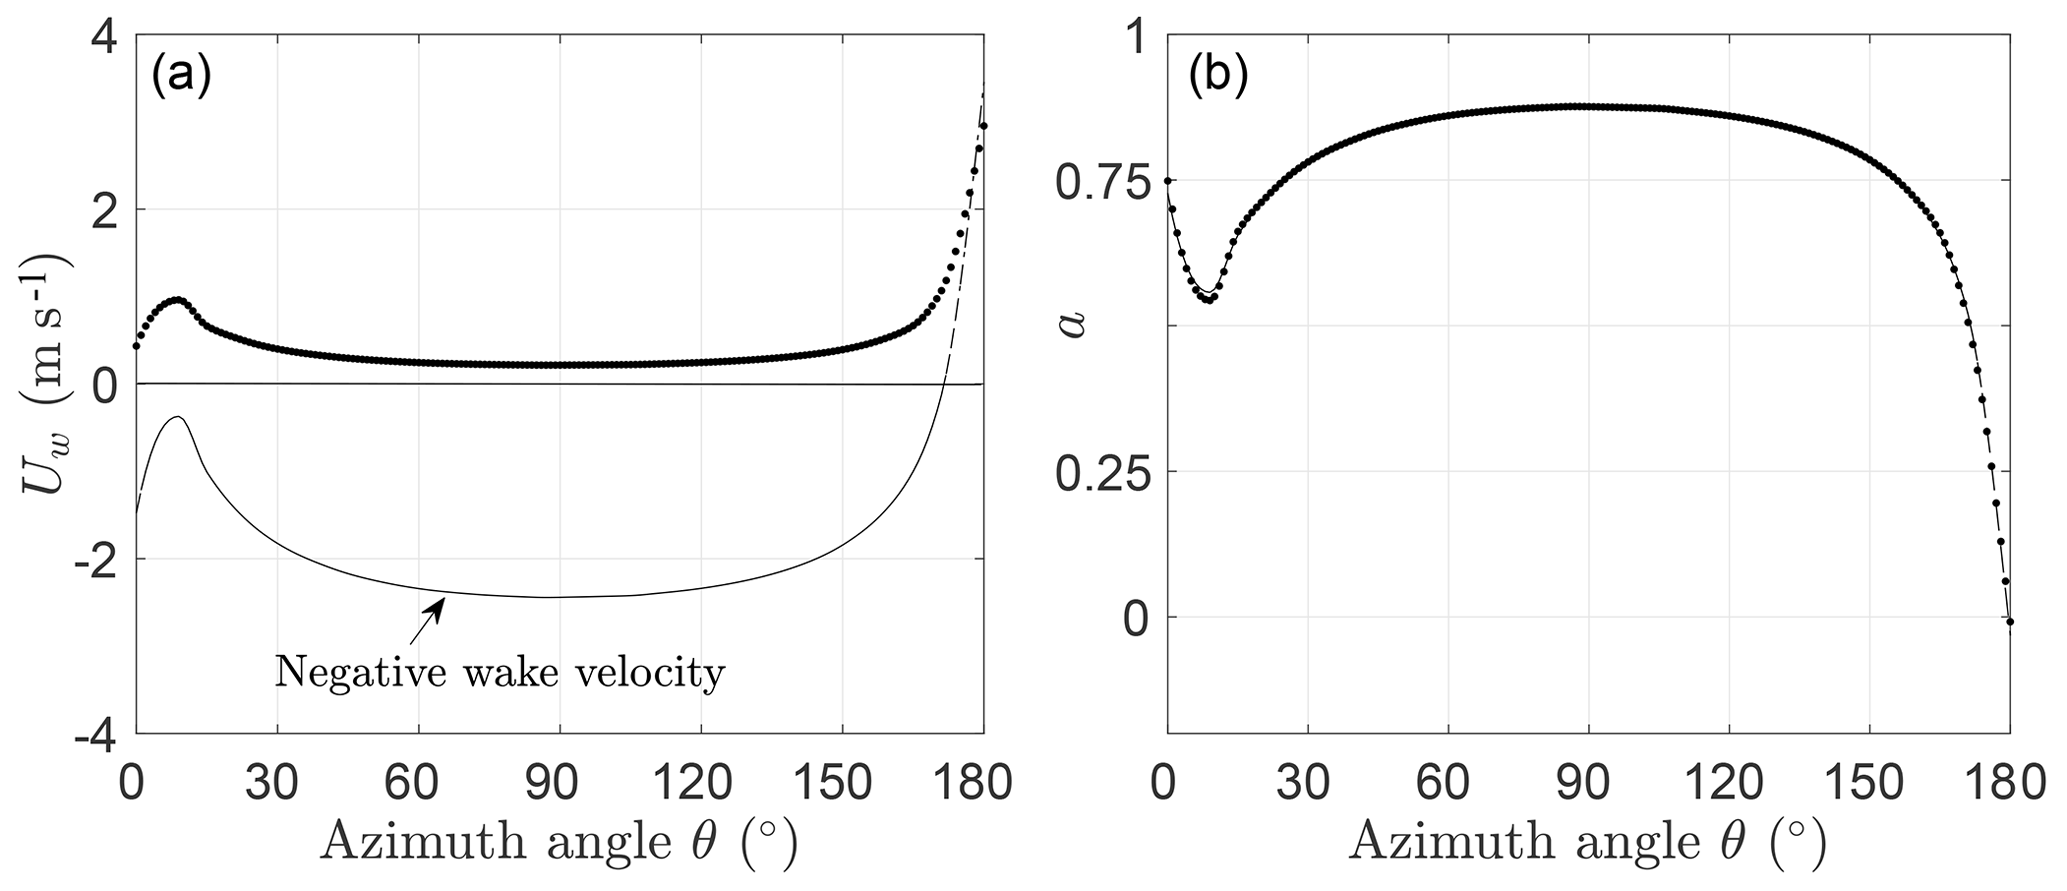
Figure 7Front half-cycle wake velocity profile, Uw (a), and induction factor, a (b), as a function of azimuth angle θ, for the three-bladed VAWT. Current model (points) and conventional model (solid line) at λ=1.97. The induction factor distribution is almost identical for both DMST formulations, as it concerns the front half of the rotor.
Figure 8 shows predicted and measured power coefficients for a three-bladed turbine at four different Reynolds numbers (Re). In general, the modified DMST agrees quite well with the data and performs consistently better than the conventional DMST model at high tip speed ratios, for all Reynolds numbers. This agreement also suggests that the static airfoil data of Sheldahl and Klimas (1981), which were used in the current DMST implementation, are sufficiently accurate. It is noteworthy to mention, however, that static data do not include the effect of dynamic stall, which is an important feature of VAWT, especially at low tip speed ratios. A better agreement of the models can be therefore expected if semiempirical corrections for dynamic stall are included in the DMST algorithm (Paraschivoiu, 2002; Major and Paraschivoiu, 1992).
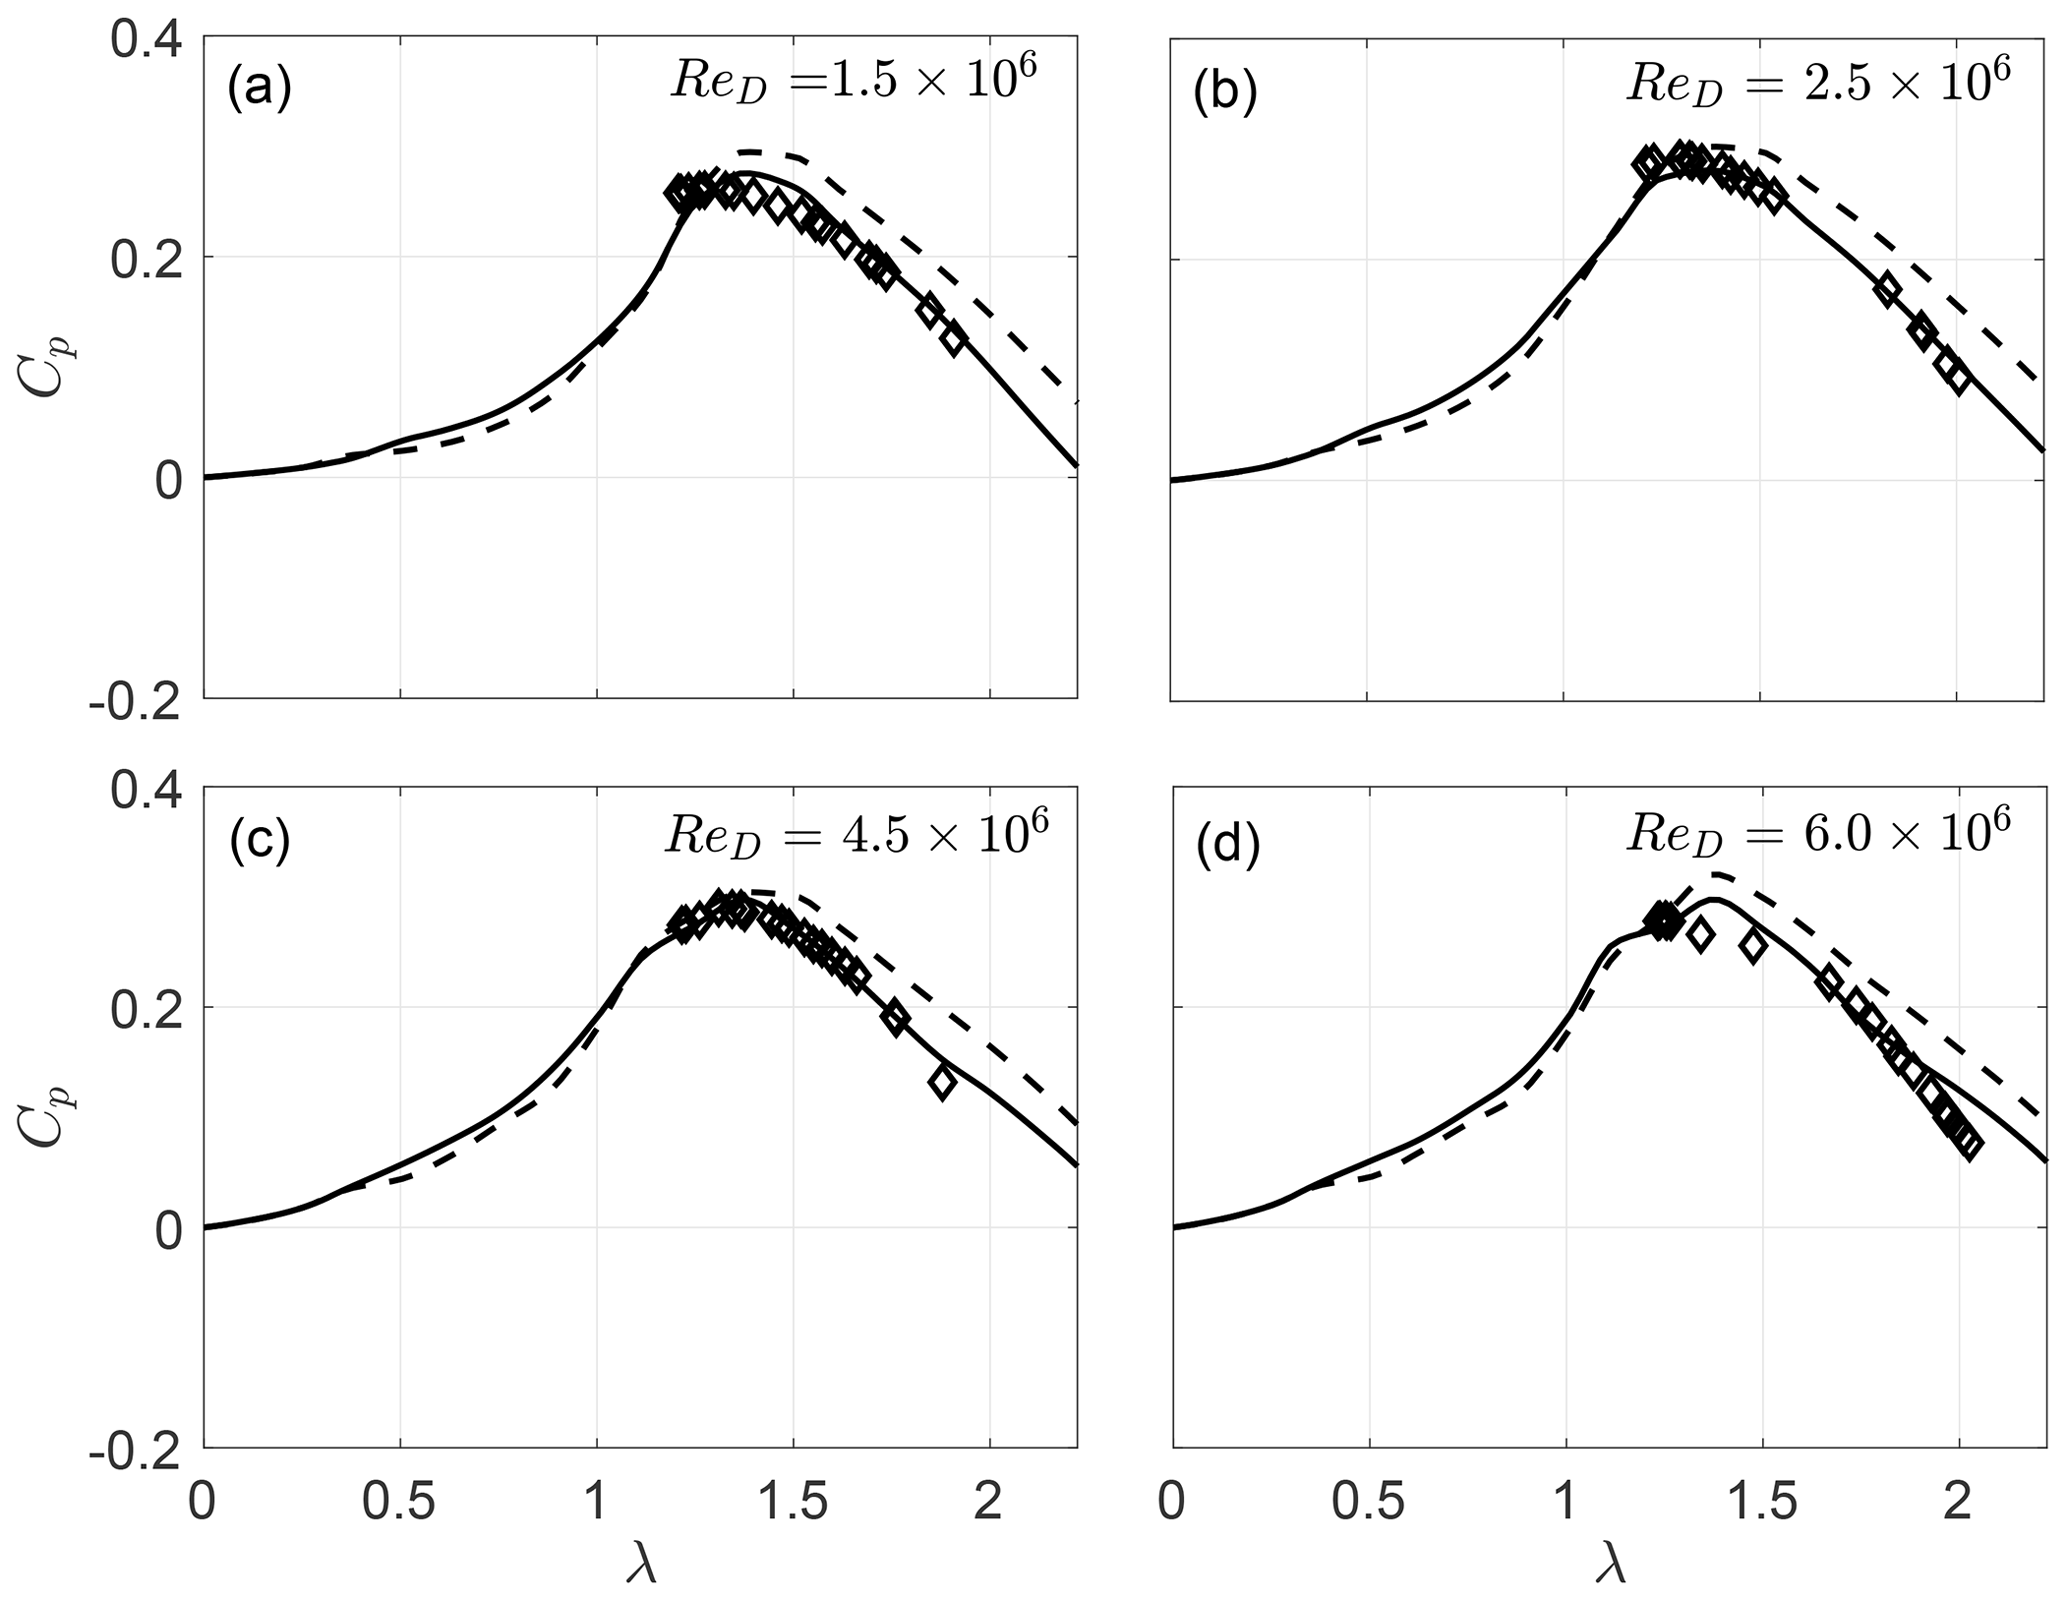
Figure 8Measured (diamonds) and predicted (current model: solid lines; conventional model: dashed lines) power coefficients, Cp, for a three-bladed VAWT (Nb=3) at Re.
In Fig. 9 we plot the measured and predicted power coefficients for four different VAWT solidities (Nb=2, 3, 4, and 5) at constant wind-tunnel conditions (Re). Again, the proposed DMST formulation improves the predictions as the tip speed ratio increases (for all rotor configurations).
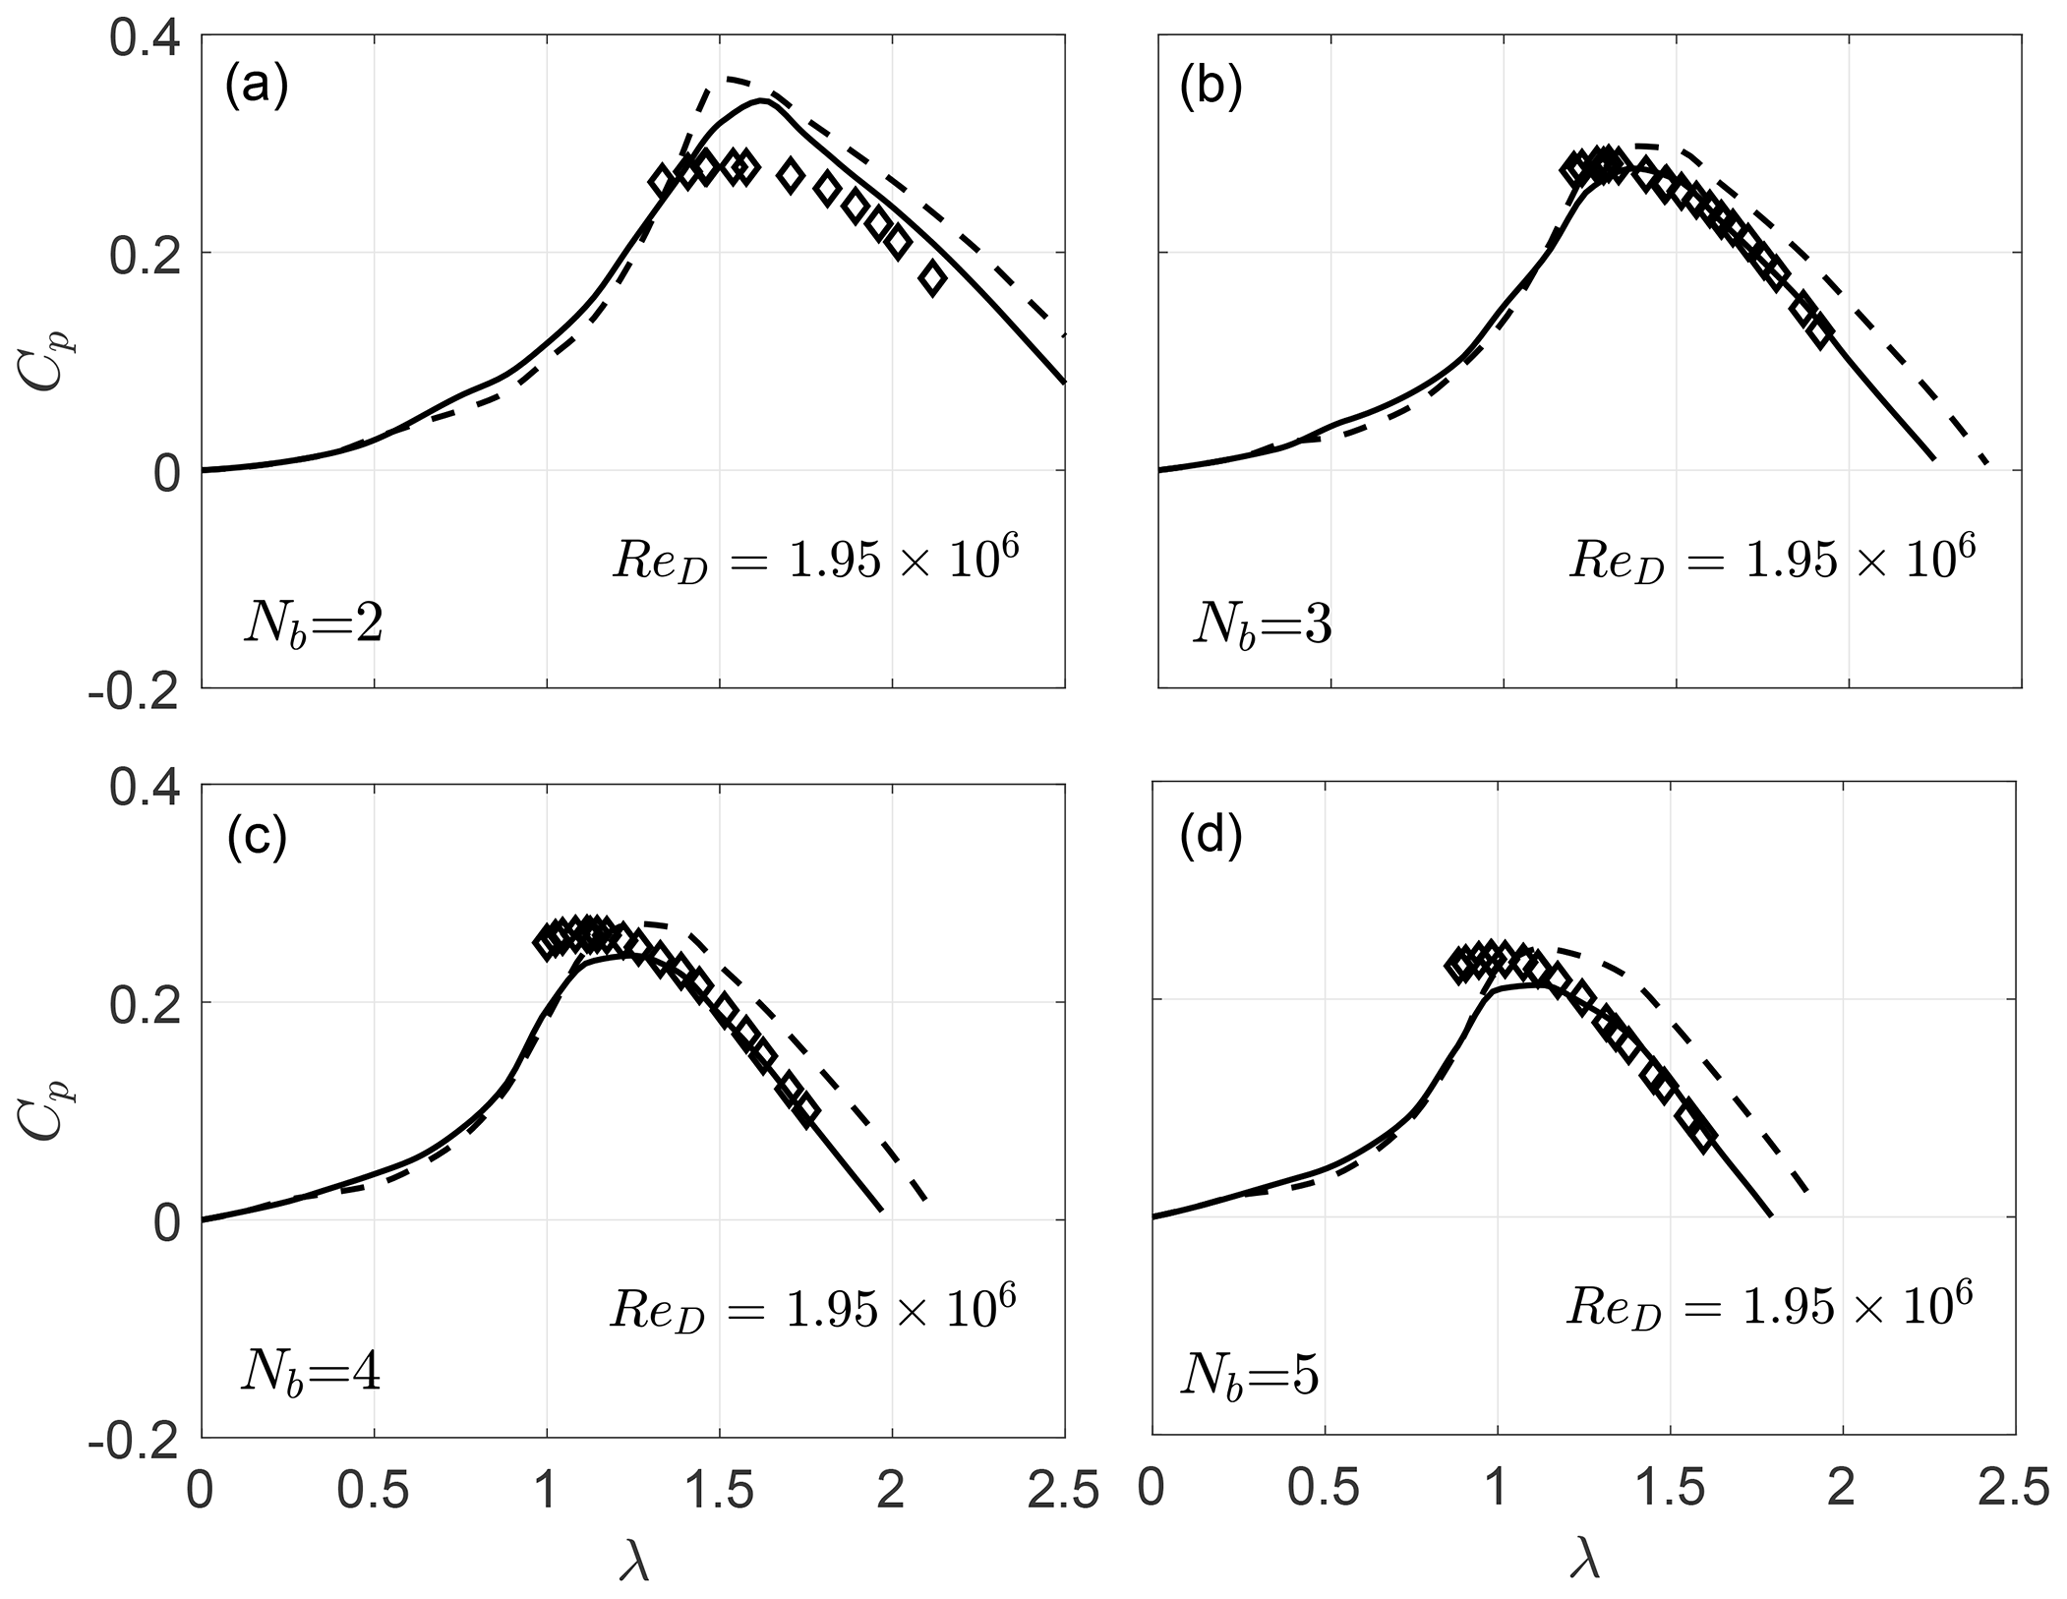
Figure 9Measured (diamonds) and predicted (current model: solid lines; conventional model: dashed lines) power coefficients, Cp, for four VAWT configurations and at constant Re.
A double-multiple streamtube (DMST) model for vertical axis wind turbines (VAWT) is presented, where the classical Rankine–Froude momentum theory is replaced with the momentum theory of Steiros and Hultmark (2018). The classical momentum theory becomes invalid at moderate to high induction factors and therefore limits the applicability of conventional DMST to small rotor solidities and tip speed ratios, that is, to small rotor loadings. In contrast, the new model introduced here is valid for any induction factor and therefore renders the DMST applicable, in principle, to any rotor loading.
The predictions of the two DMST formulations were compared with VAWT measurements acquired at Princeton's HRTF facility, covering a range of rotor solidities, tip speed ratios, and Reynolds numbers. The data represent both lightly and heavily loaded rotors, in dynamically similar conditions to field-scale VAWTs. The results showed that the new momentum theory improves the predictions of the DMST, especially as the tip speed ratio increases. It was found that this improvement is explained by a more realistic representation of the wake velocities, or equivalently input velocities to the second rear part of the rotor, from the new momentum theory.
Despite its simplicity and lack of certain flow physics, the DMST model proved reliable in its predictions of the mean power coefficient of the VAWT for the tested range of parameters. This could be in part due to the fact that our tested tip speed ratios are rather low, while DMST inaccuracies tend to emerge at high tip speed ratios where friction and wake effects are more significant (Delafin et al., 2017).
Data can be provided upon request. Please contact Anis A. Ayati (ayati.anis@gmail.com).
AAA and KS wrote the article, implemented the modeling, and performed the simulations. MAM and SD performed the experiments and data analysis. MH supervised the research.
The authors declare that they have no conflict of interest.
Anis A. Ayati gratefully acknowledges the support of the Akademia program at the Faculty of Mathematics and Natural Sciences, University of Oslo.
This research has been supported by the National Science Foundation under grant CBET-1652583 (Program Manager Ron Joslin).
This paper was edited by Raúl Bayoán Cal and reviewed by Hubert Branger and two anonymous referees.
Beri, H. and Yao, Y.: Double multiple streamtube model and numerical analysis of vertical axis wind turbine, Energy and Power Engineering, 3, 262–270, 2011. a
Betz, A.: Das Maximum der theoretisch möglichen Ausnützung des Windes durch Windmotoren, Zeitschrift für das gesamte Turbinenwesen, 26, 307–309, 1920. a
Buchner, A. J., Lohry, M. W., Martinelli, L., Soria, J., and Smits, A. J.: Dynamic stall in vertical axis wind turbines: comparing experiments and computations, J. Wind Eng. Ind. Aerod., 146, 163–171, 2015. a
Buchner, A. J., Soria, J., Honnery, D., and Smits, A. J.: Dynamic stall in vertical axis wind turbines: scaling and topological considerations, J. Fluid Mech., 841, 746–766, 2018. a
Buhl, J. and Marshall, L.: New empirical relationship between thrust coefficient and induction factor for the turbulent windmill state, Tech. rep., National Renewable Energy Laboratory (NREL), Golden, CO, 2005. a, b
Dabiri, J. O.: Potential order-of-magnitude enhancement of wind farm power density via counter-rotating vertical-axis wind turbine arrays, J. Renew. Sustain. Ener., 3, 043104, https://doi.org/10.1063/1.3608170, 2011. a, b
Delafin, P.-L., Nishino, T., Kolios, A., and Wang, L.: Comparison of low-order aerodynamic models and RANS CFD for full scale 3D vertical axis wind turbines, Renew. Energ., 109, 564–575, 2017. a
Ferreira, C. S., Madsen, H. A., Barone, M., Roscher, B., Deglaire, P., and Arduin, I.: Comparison of aerodynamic models for Vertical Axis Wind Turbines, J. Phys. Conf. Ser., 524, 012125, https://doi.org/10.1088/1742-6596/524/1/012125, 2014. a, b, c
Freris, L. L.: Wind energy conversion systems, Prentice Hall, Upper Saddle River, 1990. a
Glauert, H.: Aerodynamic theory, Aeronaut. J., 34, 409–414, 1930. a
Hansen, M. O. L.: Aerodynamics of wind turbines, Taylor & Francis, London, 2015. a, b
Islam, M., Ting, D. S. K., and Fartaj, A.: Aerodynamic models for Darrieus-type straight-bladed vertical axis wind turbines, Renew. Sust. Energ. Rev., 12, 1087–1109, 2008. a
Jiménez, J., Hultmark, M., and Smits, A. J.: The intermediate wake of a body of revolution at high Reynolds numbers, J. Fluid Mech., 659, 516–539, 2010. a
Kozak, P. A., Vallverdú, D., and Rempfer, D.: Modeling Vertical-Axis Wind-Turbine performance: Blade-Element Method versus Finite Volume Approach, J. Propul. Power, 32, 592–601, 2016. a
Major, S. R. and Paraschivoiu, I.: Indicial method calculating dynamic stall on a vertical axis wind turbine, J. Propul. Power, 8, 909–911, 1992. a
Miller, M., Duvvuri, S., Brownstein, I., Lee, M., Dabiri, J. O., and Hultmark, M.: Vertical-axis wind turbine experiments at full dynamic similarity, J. Fluid Mech., 844, 707–720, 2018. a
Muraca, R. J., Stephens, M. V., and Dagenhart, J. R.: Theoretical performance of cross-wind axis turbines with results for a catenary vertical axis configuration, Tech. rep., NASA Technical Memorandum, Langley Research Center, 1975. a
Paraschivoiu, I.: Double-multiple streamtube model for Darrieus wind turbines, Tech. rep., Institut de Recherche d'Hydro-Québec, Varennes, Québec, Canada, 1981. a, b
Paraschivoiu, I.: Wind turbine design: with emphasis on Darrieus concept, Presses inter Polytechnique, 2002. a
Paraschivoiu, I., Delclaux, F., Fraunie, P., and Beguier, C.: Aerodynamic analysis of the Darrieus rotor including secondary effects, J. Energ., 7, 416–422, 1983. a
Posa, A. and Balaras, E.: Large Eddy Simulation of an isolated vertical axis wind turbine, J. Wind Eng. Ind. Aerod., 172, 139–151, 2018. a
Rolin, V. F. C. and Porté-Agel, F.: Experimental investigation of vertical-axis wind-turbine wakes in boundary layer flow, Renew. Energ., 118, 1–13, 2018. a
Sheldahl, R. E. and Klimas, P. C.: Aerodynamic characteristics of seven symmetrical airfoil sections through 180-degree angle of attack for use in aerodynamic analysis of vertical axis wind turbines, Tech. rep., Sandia National Labs., Albuquerque, N. Mex., USA, 1981. a, b, c, d, e
Simão Ferreira, C., van Kuik, G., van Bussel, G., and Scarano, F.: Visualization by PIV of dynamic stall on a vertical axis wind turbine, Exp. Fluids, 46, 97–108, 2009. a
Steiros, K. and Hultmark, M.: Drag on flat plates of arbitrary porosity, J. Fluid Mech., 853, R3, https://doi.org/10.1017/jfm.2018.621, 2018. a, b, c, d, e, f, g, h, i, j
Strickland, J. H.: Darrieus turbine: a performance prediction model using multiple streamtubes, Tech. rep., Sandia Labs., Albuquerque, N. Mex., USA, 1975. a, b
Strickland, J. H.: VAWT stochastic wind simulator, Tech. rep., Sandia National Laboratories, Albuquerque, N. Mex., USA, 1987. a
Wilson, R. and McKie, W.: A comparison of aerodynamic analyses for the Darrieus rotor, Aerospace Sciences Meetings, Wind Energy Conference, 2, https://doi.org/10.2514/6.1980-605, 1980. a, b