the Creative Commons Attribution 4.0 License.
the Creative Commons Attribution 4.0 License.
Optimal tuning of engineering wake models through lidar measurements
Lu Zhan
Stefano Letizia
Giacomo Valerio Iungo
Engineering wake models provide the invaluable advantage to predict wind turbine wakes, power capture, and, in turn, annual energy production for an entire wind farm with very low computational costs compared to higher-fidelity numerical tools. However, wake and power predictions obtained with engineering wake models can be insufficiently accurate for wind farm optimization problems due to the ad hoc tuning of the model parameters, which are typically strongly dependent on the characteristics of the site and power plant under investigation. In this paper, lidar measurements collected for individual turbine wakes evolving over a flat terrain are leveraged to perform optimal tuning of the parameters of four widely used engineering wake models. The average wake velocity fields, used as a reference for the optimization problem, are obtained through a cluster analysis of lidar measurements performed under a broad range of turbine operative conditions, namely rotor thrust coefficients, and incoming wind characteristics, namely turbulence intensity at hub height. The sensitivity analysis of the optimally tuned model parameters and the respective physical interpretation are presented. The performance of the optimally tuned engineering wake models is discussed, while the results suggest that the optimally tuned Bastankhah and Ainslie wake models provide very good predictions of wind turbine wakes. Specifically, the Bastankhah wake model should be tuned only for the far-wake region, namely where the wake velocity field can be well approximated with a Gaussian profile in the radial direction. In contrast, the Ainslie model provides the advantage of using as input an arbitrary near-wake velocity profile, which can be obtained through other wake models, higher-fidelity tools, or experimental data. The good prediction capabilities of the Ainslie model indicate that the mixing-length model is a simple yet efficient turbulence closure to capture effects of incoming wind and wake-generated turbulence on the wake downstream evolution and predictions of turbine power yield.
- Article
(3761 KB) - Full-text XML
- BibTeX
- EndNote
Wake interactions are responsible for significant power losses of wind farms (Barthelmie, et al., 2007; El-Asha et al., 2017), and thus numerical tools for predicting the intra-wind-farm velocity field are highly sought after for the optimal design of wind farm layout (Kusiak and Song, 2010; González et al., 2010; Santhanagopalan et al., 2018b), development of control algorithms for improving turbine operations (Lee et al., 2013; Annoni et al., 2016), and enhancement of accuracy in predictions of power capture (Tian et al., 2017).
Wind turbine wakes present a structural paradigm where the flow responds to both turbine settings and incoming wind conditions: the former being associated with thrust coefficient affecting power production and wake velocity deficit (Iungo et al., 2018a), the latter being a combination of velocity variability within the atmospheric boundary layer and turbulence characteristics depending on the atmospheric-stability regime (Hansen et al., 2012; Iungo and Porté-Agel, 2014).
Engineering wake models have widely been used in the wind energy industry because they provide a good trade-off between fidelity, in terms of accuracy of the predicted flow and turbine power capture, and required computational costs. High-fidelity models, such as large-eddy simulation (LES), enable detailed characterization of the wake flow and dynamics, together with effects on wind turbine performance (Martínez-Tossas et al., 2015; Santoni et al., 2017). However, the required high computational costs make LES an unsuitable tool for wind farm optimization problems. On the other hand, midfidelity models have been proposed as tools to bridge the need to resolve flow physics with adequate spatiotemporal resolution and the constraint of achieving results in a timely manner. Among midfidelity wake models, we would mention the dynamic meandering wake model (Larsen et al., 2007), prescribed vortex wake model (Chattot, 2007; Shaler et al., 2019), free vortex wake model (Sebastian and Lackner, 2012), and data-driven Reynolds-averaged Navier–Stokes (RANS) models (Iungo et al., 2015, 2018a; Santhanagopalan et al., 2018a).
For wind farm problems involving hundreds to thousands of simulations, engineering wake models represent suitable tools to achieve predictions of power capture from a wind turbine array in a limited amount of time (Mortensen et al., 2011; Acker and Chime, 2011). There are two general classes of wake engineering models: the kinematic models (explicit models) solving the conservation of mass and momentum as governing equations to obtain an explicit analytical formulation, while the field models (implicit models) generate predictions of the wake velocity field through a numerical approach.
The pioneering work by Jensen (1983) and Katic et al. (1987) assumed a linear wake expansion and a top-hat shape of the wake velocity profile at each downstream location. Despite its simplicity, this model provides a good estimation of the mean kinetic energy content available for downstream turbines. Based on the Jensen model, Frandsen kept the top-hat wake profile and derived an asymptotic equilibrium state for an infinite wind farm by solving both mass and momentum budgets (Frandsen et al., 2006). More recently, an axisymmetric Gaussian wake velocity distribution has been considered as a wake model (Bastankhah and Porté-Agel, 2014) based on the classical theory for shear flows (Tennekes et al., 1972). For the Bastankhah wake model, the Gaussian distribution of the velocity at a given downstream location has been embedded into the derivation of the mass and momentum budgets. The model parameters were tuned by leveraging datasets obtained through LES and wind tunnel experiments. Furthermore, this Gaussian wake model still inherits the assumption of linear wake expansion from the Jensen model. A more recent model, denoted the one-parameter model, stemmed from the entrainment hypothesis, which is formulated without linearizing the governing equations or assuming the linearity in the growth of the wake width (Luzzatto-Fegiz, 2018).
Other wake models have been developed without assuming the wake velocity distribution and expansion formula. For instance, Larsen used the RANS equations with the mixing-length model as turbulence closure (Swain, 1929; Larsen, 1988). Despite the relatively complicated calibration process, the Larsen wake model has ambient turbulence intensity embedded in the model.
Field models (implicit models) use different methodologies to resolve the governing equations implicitly. Ainslie developed one of the classic field models and calculated the complete flow field numerically by solving the RANS equations with a turbulence closure based on the mixing-length assumption (Ainslie, 1988). This model has identical governing equations as for the Larsen model, for which the turbulent eddy viscosity is modeled based on the wake-generated and ambient turbulence. For the Ainslie model, the governing equations are solved numerically with a parabolic approach to reduce computational costs.
Engineering wake models generally require parametric calibration. Light detection and ranging (lidar) measurements were used to calibrate and validate the wake growth rate of the Bastankhah wake model obtaining a good agreement between the model predictions and the experimental data (Carbajo Fuertes et al., 2018). Wind tunnel experiments were performed to improve the initial profile and filter function of the Ainslie model (Kim et al., 2018). For the Larsen model, a calibration procedure is introduced in the European standards (Dekker, 1998), while it is also calibrated by a data-driven method with high-frequency supervisory control and data acquisition (SCADA) data in Göçcmen et al. (2018). Similarly, the SCADA data can be leveraged to tune the wake decay coefficient for the Jensen model as a function of the incoming wind turbulence intensity (Duc et al., 2019). Several researchers have validated various wake models for different wind farms showing the nontrivial process to assess accuracy, robustness, reliability, and uncertainty of the models (Archer et al., 2018; Duckworth and Barthelmie, 2008; Jeon et al., 2015; Gaumond et al., 2012; Göçcmen et al., 2018). A cluster analysis of the experimental datasets, such as considering atmospheric conditions, turbine settings, and wake velocity fields, has been recommended for wake model benchmarking (Doubrawa et al., 2019).
In this paper, we optimally tune parameters of four engineering wake models based on lidar measurements collected for a utility-scale wind farm. Firstly, the models and their parameters are examined and discussed. The optimization of the model parameters is carried out by minimizing the objective function defined by the percentage error between the average velocity field measured by the lidar and the respective one predicted by the engineering wake models. The optimal tuning of the model parameters is performed for various clusters of the lidar dataset based on the turbine thrust coefficient and incoming wind turbulence intensity at hub height. The optimally tuned parameters of the engineering wake models are then scrutinized through linear regression analysis. Limitations and advantages of the various models will be discussed based on the results obtained from the optimal calibration process.
The paper is organized as follows: in Sect. 2, the wind farm under investigation and lidar dataset are described. The four engineering wake models used for the present work are then elucidated together with the methodology of their optimal tuning in Sect. 3. Finally, the results and discussion of the wake models are reported in Sect. 4, followed by concluding remarks in Sect. 5.
A lidar experiment was carried out at a wind farm in northern Texas made of 39 2.3 MW wind turbines with rotor diameter, D, of 108 m and a hub height of 80 m. The topography map of the site was downloaded from the US Geological Survey (US Geological Survey, 2017; Fig. 1a), and the meteorological data indicated a prevailing southerly wind direction (Fig. 1b). Meteorological data were provided as 10 min averages and standard deviation of wind speed, wind direction, temperature, humidity, and barometric pressure. SCADA data were provided for each turbine as 10 min averages and standard deviation of wind speed, power output, rotor rotational velocity, and yaw angle. For more details on this dataset and used quality control process see El-Asha et al. (2017) and Zhan et al. (2020a).
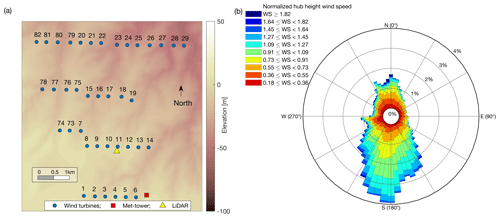
Figure 1Characterization of the test site: (a) layout of the wind farm, where the size of the blue markers represents downscaled rotor diameter; (b) wind rose of the hub-height wind measured by the met tower for the entire duration of the experiment and reported as a ratio of the turbine rated wind speed.
The scanning pulsed Doppler wind lidar deployed for this experiment is a Windcube 200S manufactured by Leosphere, which emits a laser beam into the atmosphere and measures the radial wind speed, i.e., the velocity component parallel to the laser beam, from the Doppler frequency shift of the backscattered lidar signal. The lidar system operates in a spherical coordinate system and measures the radial velocity defined as the summation of three velocity components projected onto the laser beam direction. It features a typical scanning range of about 4 km with a range gate of 50 m, an accumulation time of 500 ms, and an accuracy of 0.5 m s−1 in wind speed measurements.
According to the wind farm layout and the prevalence of southerly wind directions (Fig. 1), for wind directions within the sector 145 and 235∘, the wakes produced by the turbines from 1 to 6 evolve roughly towards the lidar location, which is a favorable condition for the lidar to measure with close approximation the streamwise velocity through single-wake plan-position indicator (PPI) scans. Furthermore, according to the layout of Fig. 1a, for the considered wind directions, these wind turbines are not affected by upstream wakes.
The lidar measurements were typically performed by using a range gate of 50 m, elevation angle of ϕ=3∘, azimuthal range of 20∘, and rotation speed of the scanning head of 2∘ s−1, leading to a typical scanning time for a single PPI of 10 s. After rejecting lidar data with a carrier-to-noise ratio (CNR) lower than −25 dB, a proxy for the streamwise velocity is obtained through the streamwise equivalent velocity, , where θ is the azimuthal angle of the lidar laser beam, and θw is the wind direction. The streamwise equivalent velocity is then made nondimensional through the velocity profile in the vertical direction of the incoming boundary layer, which is also measured with the lidar. The reference frame used has the x direction aligned with the wake direction, which is estimated with linear fitting of the wake centers at various downstream locations. The transverse position of the wake center is defined as the location of the minimum velocity obtained by fitting the velocity data at a specific downstream location through a Gaussian function. More details on the lidar system and the field campaign are available in Zhan et al. (2020a).
About 10 000 PPI lidar scans of isolated wind turbine wakes have been processed to provide the nondimensional average velocity fields used for this study (Zhan et al., 2020a). Lidar measurements were clustered according to different categories of inflow condition, namely 13 bins of the hub-height wind speed and five regimes of static atmospheric stability. The various clusters are defined to capture wake variability for different incoming wind turbulence intensity, TI, and different turbine operations and, thus, control settings along the turbine power curve. The lidar scans within each cluster have been averaged through a technique based on the Barnes scheme (Barnes, 1964; Newsom et al., 2017; Letizia et al., 2020a, b). The used data-filtering process, the cluster analysis, and the ensemble-averaging process ensured the standard error of the weighted mean was always lower than 0.8 % (Zhan et al., 2020a). For more details on the cluster analysis and the calculation of the ensemble statistics of the lidar data see Zhan et al. (2020a); the clustered statistics are publicly available on Zenodo (Iungo, 2020).
By leveraging the average velocity field of wakes measured with a scanning Doppler wind lidar for different atmospheric-stability regimes and rotor thrust coefficients, we perform optimal tuning of four widely used engineering wake models, namely the Jensen model (Jensen, 1983), the Bastankhah model (Bastankhah and Porté-Agel, 2014), the Larsen model (Larsen, 1988, 2009), and the Ainslie model (Ainslie, 1988). In the following, these models are described, then their parameters are optimally calibrated based on the lidar measurements. Specifically, the objective function of the optimization problem is the mean percentage error (PE) calculated over the measurement domain with x coordinates between 1.25 and 7 D, while r is between ±1.5 D. The parameter PE is defined via the lidar average streamwise velocity field, Ulidar, and the respective model prediction, Umodel, as follows
where 〈 〉 refers to the arithmetic mean, and (i, j) locates the grid points within the area probed by the lidar. The minimization of PE is performed with a heuristic approach by mapping each model parameter within prescribed ranges.
For this work, it is noteworthy that the thrust coefficient of the turbine rotor can be estimated through the lidar measurements, , by leveraging the mass and streamwise-momentum budgets (Iungo et al., 2018b; Zhan et al., 2020a) and from the SCADA data, referred to as , which is calculated by applying the actuator disk theory. Considering a 1-D stream-tube analysis, mass conservation can be expressed as
where R0 and R are the radius of the bases of the stream tube upstream and downstream of the turbine rotor, respectively. The free-stream velocity is indicated as U∞, while r is the radial coordinate, u is the wake streamwise velocity, and ρ is the air density. By neglecting the pressure forces and the shear stresses at the boundary of the stream tube, the momentum conservation reads as
According to Iungo et al. (2018b), this approach can produce a good approximation for the rotor thrust coefficient if the downstream base of the stream tube is located in a wake region where the streamwise pressure gradient due to the induction zone becomes negligible, and the turbulent shear stresses are still small compared with those of the far-wake region. By using this strategy, Eqs. (2) and (3) have been applied by using the lidar data acquired at the position x=1.75 D to obtain the two unknown parameters, R and , for each lidar cluster. Specifically, the radius of upstream stream tube, R0, has been preset as 0.75 D in Eq. (2) to determine the downstream radius, R, which is then used in Eq. (3) to calculate .
Additionally, the rotor thrust coefficient, which is referred to as , can be estimated directly from the SCADA data. The streamwise induction factor, a, is calculated from the solution of the power coefficient with 1-D stream-tube assumption
where P is the power yield recorded by the SCADA. Subsequently, the thrust coefficient is calculated as follows:
These two parameters, and , allow us to gauge the accuracy in the optimal tuning of the engineering wake models.
3.1 Jensen wake model
For the Jensen wake model, mass conservation is applied for a control volume located immediately downstream of a turbine rotor, while an explicit formula is derived to predict the wake velocity field by using only two parameters as input, namely the rotor thrust coefficient, Ct, and the wake expansion coefficient, k. The expression for this wake model is:
where Uw is wake velocity, which is only a function of the downstream location, x. Known as top-hat wake model, at each downstream location the velocity is uniform within the wake region, which is identified through the wake diameter, Dw, which grows linearly in the downstream direction as follows:
The wake expansion coefficient, k, is defined in analogy with the jet spreading within shear flows (Pope, 2000). According to the Wind Atlas Analysis and Application Program (WAsP; Mortensen et al., 2011), the value of the wake expansion coefficient, k, is suggested to be equal to 0.075 and 0.05 for onshore and offshore wind farms, respectively. However, in Barthelmie and Jensen (2010) a lower k value of 0.03 is found to achieve a better agreement with the SCADA data collected for the Nysted offshore wind farm. The reason for a lower k value might be due to the high occurrence of stable atmospheric conditions for that offshore wind farm.
In Frandsen et al. (2006), a semiempirical formula is proposed to estimate k by using the aerodynamic roughness length and friction velocity as input. In Peña and Rathmann (2014), a generalized expression for k is proposed, which includes modulations due to atmospheric stability. In Peña et al. (2016), the same authors provide an empirical formula to predict the wake expansion factor based on the incoming wind turbulence intensity:
For the optimization of the parameters of the Jensen model, the thrust coefficient, Ct, is varied between 0.01 and 1 with a step of 0.01, while the wake expansion coefficient, k, is varied between 0.001 and 0.3 with a step of 0.001. The optimally tuned wake expansion coefficient, kopt, for the Jensen model is reported in Fig. 2a against the wind turbulence intensity, TI, measured by the SCADA. The parameter kopt is proportional to TI even though the R-square value of 0.85 may seem quite low due to the limited number of points used for the linear fitting. However, it is noteworthy that the data reported in Fig. 2 are obtained from the mean velocity fields of each cluster of the lidar measurements, including about 10 000 PPI scans. Furthermore, it is also observed that operative conditions belonging to region 3 of the power curve, namely for incoming wind speed at hub height normalized by the wind turbine rated wind speed, , higher than 0.9, are characterized by a wake expansion coefficient lower than 0.04. In contrast, for operative conditions in region 2 of the power curve, kopt grows rapidly with the incoming-turbulence intensity approaching values close to 0.1. This different variability of kopt with TI indicates that this model parameter reflects the effects of not only the incoming-turbulence intensity on the wake evolution but the wake-generated turbulence as well.
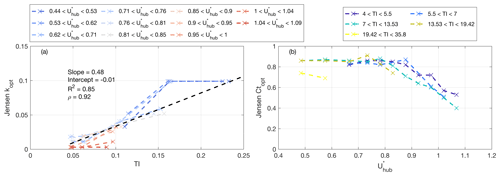
Figure 2Optimal tuning of the Jensen wake model: (a) optimized wake expansion coefficient, kopt, as a function of the incoming-turbulence intensity, TI, and colored by the normalized incoming wind speed at hub height, . The dashed black line is the linear fitting; (b) optimized thrust coefficient, , as a function of and colored according to TI.
In analogy with the model proposed in (Peña et al., 2016; Eq. 8), linear fitting between kopt and TI is calculated, producing a Pearson correlation coefficient of 0.92, an intercept of −0.01, and a slope of 0.48, while the slope proposed in Peña et al. (2016) is 0.4. Therefore, this work would suggest a slightly revised model for estimating the wake expansion coefficient for the Jensen wake model as
The optimization of the parameters for the Jensen model also produces estimates of the rotor thrust coefficient, , for the various clusters of the used lidar dataset. Figure 2b shows that a roughly constant is observed for the region 2 of the power curve while approaching a nondimensional hub-height velocity, , of about 0.9; a reduction in is observed as a consequence of the blade pitching operated by the turbine controller to keep power capture equal to the rated power. The rotor thrust coefficients calculated through the mass and streamwise-momentum budgets (Eqs. 2 and 3), , is compared with that obtained from the optimal tuning of the Jensen model, , in Fig. 3a for each cluster of the lidar dataset. The Pearson correlation coefficient between these two parameters is 0.95, which corroborates the accuracy of the optimal tuning of the Jensen model from the lidar data. The comparison of with in Fig. 3d confirms the previous results presented in Iungo et al. (2018b), namely that the thrust coefficient estimated from the SCADA is generally an underestimation of its actual value because of not including drag components related to the torque generation, namely, drag connected with airfoil stall or bluff-body behavior due to the wind turbine tower and nacelle.
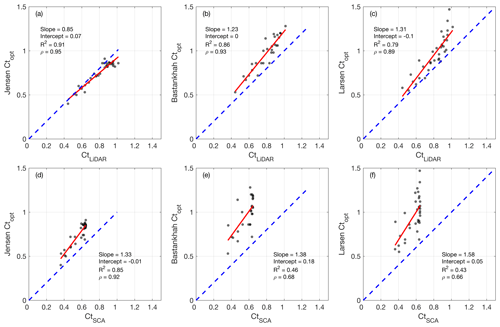
Figure 3Linear regression of the thrust coefficient obtained from the optimal tuning of the wake models, , against that calculated directly from the lidar data, (a–c), or SCADA data, (d–f): (a) and (d) Jensen model; (b) and (e) Bastankhah model; (c) and (f) Larsen model. The solid red line is the linear fitting result, and the dashed blue line is the 1:1 line.
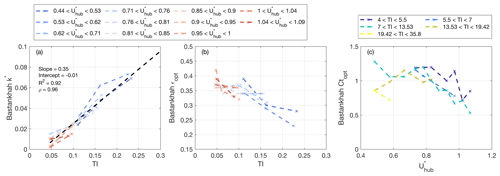
Figure 4Optimally tuned parameters from Bastankhah wake model: (a) wake expansion parameter, k*, as a function of the incoming wind turbulence intensity, TI (dashed black line is the linear fitting), colored by ; (b) offset of the standard deviation of the Gaussian wake velocity profile, ϵ, as a function of the incoming wind turbulence intensity, TI, colored by ; (c) Ct as a function of , colored by TI.
3.2 Bastankhah wake model
For the Bastankhah wake model, a Gaussian profile is used to describe the wake velocity field in the transverse direction at a given downstream location. This Gaussian velocity profile is then used to solve the mass and momentum budgets as for jets evolving in a boundary layer (Tennekes et al., 1972; Bastankhah and Porté-Agel, 2014). The derived self-similar wake velocity profile can be formulated as
where ΔU is the wake velocity deficit at the downstream location x, σ is the standard deviation of the Gaussian velocity profile, and C(x) is the maximum velocity deficit. Inheriting linear wake expansion from the Jensen model, σ is modeled as
where k* is the growth rate of the Gaussian standard deviation, and ε, which by definition is only a function of Ct, is its offset at the rotor location. The wake velocity field predicted through the Bastankhah wake model can be written as
where y and z are transverse and vertical coordinates, respectively, while zh is hub height. For the Bastankhah wake model, the thrust coefficient, Ct, is varied between 0.01 and 1.71 with a step of 0.01, while the wake expansion coefficient, k*, is varied between 0.001 and 0.3 with a step of 0.001. Furthermore, the parameter ϵ in Eq. (11) is varied between 0.2 and 0.5 with a step of 0.01.
The optimized wake expansion factor of the Bastankhah wake model, , is reported in Fig. 4a as a function of the incoming wind turbulence intensity. In agreement with the results obtained for the wake expansion factor of the Jensen model, also increases monotonically with the incoming-turbulence intensity. Furthermore, a secondary trend with the rotor thrust coefficient is observed, which is an effect of the wake-generated turbulence. Indeed, the operative conditions with are characterized by a slightly smaller . Similarly to previous work (Carbajo Fuertes et al., 2018), the linear fitting between and TI is calculated, producing the following optimal values: , with an R-square value of 0.96. The slope between and TI of 0.34 is equal to that found in Carbajo Fuertes et al. (2018).
The offset of the standard deviation of the velocity profile, ϵ (Eq. 11), which is by definition only a function of Ct, slightly decreases with increasing , suggesting that lower Ct values associated with high , i.e., for operations in region 3 of the power curve, lead to a narrower and shallower velocity deficit in the near wake. However, the results of the model optimization show that the main variability of ϵ is connected with the incoming-turbulence intensity, and, specifically, ϵ decreases with increasing TI. This effect on ϵ might be due to the modulation induced on wake recovery by the atmospheric stability (Iungo and Porté-Agel, 2014; Zhan et al., 2020a).
Figure 4c shows the optimized thrust coefficient, , against the normalized hub-height velocity, . Similarly to the results obtained for the Jensen wake model, the is practically uniform in region 2 of the power curve (), then it monotonically decreases in region 3 of the power curve (). The thrust coefficient obtained from the optimal tuning of the Bastankhah wake model is then compared with that obtained from the mass and momentum budgets applied to the lidar data in Fig. 3b and the respective values derived from the SCADA data in Fig. 3e. In Fig. 3, the optimized thrust coefficient, , is generally higher than the respective values predictable with the 1-D stream-tube assumption (Eq. 5) because of including contributions to drag due to the bluff-body behavior of the turbine tower, nacelle, and blade stall.
It is noteworthy that can be larger than 1 as a result of Eq. (12), for which a real solution can only be obtained for . This model limitation was later overcome in Abkar et al. (2018) and Shapiro et al. (2019). This constraint has been added for the optimization of the parameters of the Bastankhah wake model, which results in rejecting some lidar data in the near wake. Furthermore, removing lidar data collected in the near wake can be beneficial for the optimal tuning of the Bastankhah model because in the near wake the velocity profile can be significantly different from the typical Gaussian shape, which is an underlying assumption for this wake model.
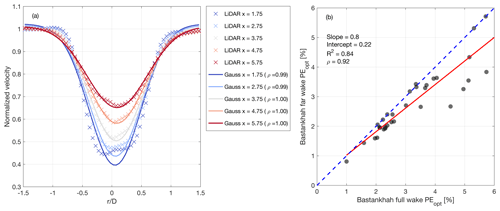
Figure 5(a) Normalized velocity profiles from a lidar cluster with , 0.76] and TI∈[7 %, 13.5 %]. The cross marker represents lidar measurements, solid lines indicate Gaussian fitting, and different colors indicate the downstream location; (b) linear regression between optimized average PE retrieved by using the lidar data for the entire wake or excluding the near-wake region. The solid red line is the linear fit, and the dashed blue line represents a 1:1 ratio.
Similarly to Carbajo Fuertes et al. (2018), the detection of the near- to far-wake transition is associated with the downstream location where the fitting of the streamwise velocity as a function of the radial position with a Gaussian function produces a Pearson correlation coefficient larger than 0.99. In Fig. 5a, the velocity profiles for the cluster with , 0.76] and TI∈[7 %, 13.5 %] are reported. Based on the aforementioned criterion, the near-wake region ends at x=1.75 D. However, a difference of 0.05 in the minimum of the normalized velocity is observed between the measured and fitted profile. As a consequence, the Bastankhah wake model overestimates the maximum velocity deficit to maximize the correlation between the data and the Gaussian fitting, especially in proximity of the sides of the wake. The drawback of this fitting procedure consists of an overestimation of Ct. Rejecting lidar data in the near-wake region for the optimization of the Bastankhah wake model can thus be beneficial for a more accurate estimation of Ct. Figure 5b shows that the percentage error, PE, obtained by using lidar data from the entire wake region is larger than only using far-wake lidar data. On average, the error drops down by 15.8 % from the full-wake cases, while the maximum improvement is 69.5 %.
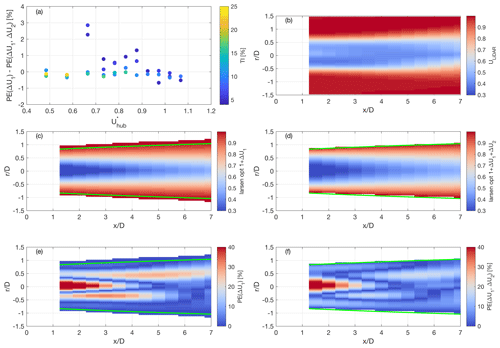
Figure 6(a) Percentage error, PE, between the Larsen model predictions with or without second-order solution; the color bar indicates incoming-turbulence intensity of the considered lidar cluster. Color maps of the wake velocity field for the lidar cluster with and : (b) lidar data; (c) and (d) are prediction through the Larsen model without or with, respectively, second-order contribution (green lines are the location of wake edge); (e) and (f) are percentage error with respect to the lidar data without or with, respectively, second-order contributions.
3.3 Larsen model
For the Larsen wake model, the RANS equations are simplified by neglecting gradients with a smaller order of magnitude considering the boundary layer approximation and dropping the viscous term due to the high Reynolds numbers involved for applications to utility-scale wind turbines (Swain, 1929). The axial velocity field is solved by leveraging the similarity solution and using the mixing-length model as turbulence closure. The first-order contribution to the axial velocity prediction is expressed as
where ΔU1 is the wake velocity deficit, Ct is the thrust coefficient of the turbine rotor, x0 is the streamwise offset for the reference frame, A is the rotor area, and c1 is a constant related to the mixing-length model. The wake region is identified through the following wake radius:
The coefficients c1, x0 are calculated by following the calibration procedure in Larsen et al. (2003). For more details, the reader can refer to Appendix A. The radial velocity for the Larsen wake model is calculated as
To satisfy the continuity constraint, the coefficient 1∕3 should be changed to ; for more details see the Appendix B. In Larsen (2009), a formula for the second-order contribution to the axial velocity field is provided as
For the Larsen model, both first- and second-order contributions require two fundamental input parameters: the thrust coefficient, Ct, and the incoming wind turbulence intensity, TI. The parameter c1 is calibrated through x0 and Ct (Eq. A1). However, we seek a more data-driven approach to compute the velocity field with the Larsen wake model, yet avoiding the proposed empirical formulas for x0 and c1. Therefore, in this work, we consider Ct, c1, and x0 as input parameters, whose physical interpretation is further illustrated in the following. The thrust coefficient, Ct, is varied between 0.4 and 1.5 with a step of 0.01, the optimal c1 value is searched from 0.01 up to 0.25 with a resolution of 0.002, and x0 ranges from 0.01 up to 3.01 with a step of 0.05. It is noteworthy that Ct values larger than 1 are allowed since the constraint of Eq. (A3) is bypassed by considering Ct as a free input parameter.
In the case study shown in Fig. 6b, the ensemble-averaged wake velocity field for the lidar cluster is presented with a hub-height velocity range of and turbulence intensity range of . The optimally tuned velocity field obtained with or without the second-order contribution of the Larsen model is reported in Fig. 6d and c, respectively. The first-order solution of the Larsen model seems to predict higher wind speed at the wake edge and a lower velocity in proximity to the wake center. In contrast, the second-order solution seems to be more accurate and characterized by a lower PE. Therefore, we used the second-order solution for the optimal tuning of the Larsen wake model and found the relative norm of PE decreases by −13.74 % on average for all the lidar clusters compared to the case with only considering the first-order solution (Fig. 6a).
The optimally tuned parameters for the Larsen wake model are reported in Fig. 7. The model has successfully captured the reduction in the thrust coefficient for operations in region 3 of the power curve, regardless of the incoming-turbulence intensity, TI. In Fig. 7b, the parameter x0 converges to 0 when the incoming-turbulence intensity increases. As mentioned in Sect. 3.3, x0 is defined as the distance between the rotor position and the origin of the used coordinate system. Nonetheless, it can also be denoted physically as the position where the initial wake width equals one rotor diameter. Therefore, a faster wake recovery rate due to higher incoming turbulence makes this condition occur closer to the turbine rotor.
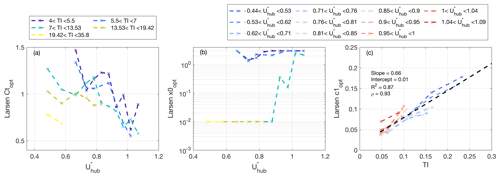
Figure 7Optimally tuned parameters for the Larsen wake model: (a) Ct and (b) x0 as a function of the hub-height velocity, , for each lidar cluster, while the lines are colored by the incoming-turbulence intensity (legend at the top left corner); (c) Prandtl's mixing-length parameter, c1, versus incoming-turbulence intensity and colored by (legend at the top right corner). The dashed black line is the linear fitting between c1 and TI.
Regarding the wake recovery rate reported in Fig. 7c, we can see the enhancement of turbulent mixing (c1) as a function of increasing turbulence intensity, which can be modeled through a linear function with a slope of 0.66 and interception of 0.01. However, the secondary effect on turbulent diffusion due to Ct is not singled out for the Larsen wake model. The justification can be found in the calibration procedure. Assuming an increase in Ct, the effective rotor Deff increases monotonically. If we substitute Eq. (A2) into Eq. (A1) and recast it, we obtain
which suggests that c1 automatically decreases with increasing Ct.
3.4 Ainslie model
Similarly to the Larsen wake model, the Ainslie wake model is derived from the RANS equations for incompressible flows (Ainslie, 1988). The turbulent eddy viscosity (EV) is formulated as follows:
where kl is a constant expected to be a function of the wake shear rather than incoming-turbulence intensity. In Ainslie (1988), a suggested value of 0.015 is proposed, which was obtained from wind tunnel experiments. The parameters b and U∞−Uc are the wake width and velocity deficit, respectively. KM is the eddy diffusivity for momentum, which is defined as
where κ is the Von Kármán constant; u* is the friction velocity; and ϕm is a stability correction defined through the Businger–Dyer relationships, which is a function of the stability parameter z∕L (Stull, 1988). Furthermore, a filter function, F, is introduced to model effects of the wake-generated turbulence:
It is noteworthy that the filter function F, wake width b, and velocity deficit U0−Uc are all functions of the downstream distance from the rotor. Therefore, the turbulent eddy viscosity, EV, is also a function of the downstream position and coupled with the solution of the wake velocity field. For the sake of reducing the required computational costs, the equations of the Ainslie wake model are solved with a parabolic approach advancing in the downstream direction.
For the Ainslie wake model, the wake width, b, is defined as the radial location where the wake velocity is equal to 90 % of the free-stream velocity. Similarly to Kim et al. (2018), we adopted as the initial wake velocity profile the experimental lidar data measured at a downstream distance of 1.25 D. In this regard, the Ainslie model provides the advantage of using experimental data as the initial wake velocity profile as long as the data are axisymmetric per the model formulation. For more details on the numerical solution of the Ainslie wake model see Appendix C.
Summarizing, the inputs of the Ainslie model are the thrust coefficient, Ct; turbulence intensity, TI; filter function, F; shear layer constant, kl; and eddy diffusivity of momentum, KM. In this study, we set the filter function, F (Eq. 20), equal to 1 throughout the whole wake region for the sake of simplicity. The wake-generated turbulence is taken into account through the parameters kl and KM. It is noteworthy that Ct and TI are only used to tune the initial wake profile at the downstream location x=1.25 D, where the lidar measurements are available. Therefore, the independent parameters required for the optimal tuning of the Ainslie wake model are kl, which is varied between 0.001 and 0.101 with a step of 0.005, and KM, which is varied between 0.001 and 0.501 with a step of 0.002.
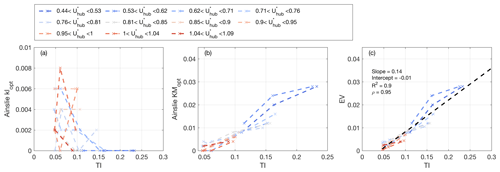
Figure 8Optimal tuning of the parameters for the Ainslie wake model: (a) kl, (b) KM, and (c) eddy viscosity versus the incoming-turbulence intensity of each lidar cluster, while the lines are colored by the hub-height velocity. The dashed black line represents linear fitting.
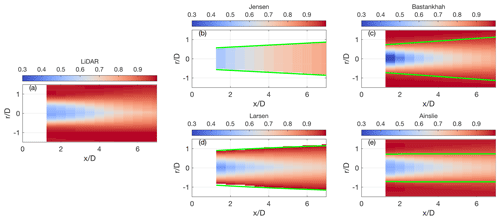
Figure 9Normalized velocity for the cluster with of [0.76, 0.81] and TI of [13.5 %, 19.4 %]: (a) lidar data, (b) Jensen wake model, (c) Bastankhah wake model, (d) Larsen wake model, (d) Ainslie wake model. The green lines represent the wake edges, while for (c) they represent the spanwise position corresponding to 2σ.
Since the two model parameters kl and KM are directly hinged on the eddy viscosity and thus with turbulence mixing and wake recovery rate, in Fig. 8 we show them as a function of the incoming-turbulence intensity. The parameter kl quantifies the contribution of wake deficit and wake width to the eddy viscosity. In Fig. 8a it is interesting to note that kl seems to be independent of hub-height velocity. A region with higher kl is observed for TI<15 %, then kl approaches 0 for higher TI values. In contrast, the parameter is proportional to the incoming wind turbulence intensity, as shown in Fig. 8b. A similar trend is obtained for the eddy viscosity in Fig. 8c. Furthermore, we calculated the standard deviation of eddy viscosity along the x direction for all the lidar clusters (not shown here) and found that it is 2 orders of magnitude smaller than the average eddy viscosity for the respective lidar cluster. This suggests that a constant eddy viscosity model can well reproduce the downstream evolution of the wake velocity field. Finally, these results suggest that the turbulent eddy viscosity can be modeled as with a Pearson correlation coefficient of 0.95.
Once the parameters of the four considered engineering wake models have been optimally tuned based on the mean velocity fields retrieved from the lidar measurements, and their trends as functions of the normalized incoming wind speed at hub height, , and turbulence intensity, TI, have been discussed, it is worth scrutinizing the predictions generated from the wake models more. For instance, the mean velocity field measured from the lidar for the cluster with 0.76, 0.81] and TI∈[13.5 %, 19.4 %] is reported in Fig. 9 and compared with the respective predictions obtained from the selected wake models. Firstly, the simplistic predictions obtained through the Jensen model are evident, even though overall information on the mean kinetic energy content available within the wake and its evolution in the downstream direction are provided.
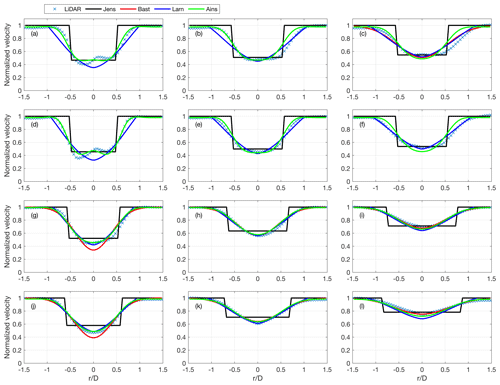
Figure 10Velocity profiles predicted from four wake models and compared with lidar data for and different values of TI (a–c: ; d–f: ; g–i: ; j–l: ) and different downstream location (a, d, g, j: X=1.75 D; b, e, h, k: X=3.75 D; c, f, i, l: X=5.75 D).
The velocity field predicted through the Bastankhah wake model looks very similar to the mean velocity field measured by the lidar, especially in the far wake, indicating that the velocity profiles in the radial direction can be modeled with a good level of accuracy through a Gaussian function, which is the underlying assumption of the Bastankhah wake model. A larger wake velocity deficit with respect to the reference lidar data is observed in the near wake for the model predictions. This feature of the Bastankhah wake model can be better understood through the velocity profiles in the radial direction reported for various downstream locations and incoming-turbulence intensity in Fig. 10. For these data clusters, which are calculated for incoming wind speed within the range and different TI, it is observed that in the near wake the mean velocity field measured by the lidar is not axisymmetric, and, more importantly, it is significantly different from a Gaussian function (Zhan et al., 2020a). The velocity profiles recover a more Gaussian-like trend by moving downstream and/or increasing the incoming-turbulence intensity, TI. The optimization procedure of the Bastankhah wake model attempts to maximize the agreement between the model predictions and the lidar data, especially in proximity of the sides of the wake, by enhancing the maximum velocity deficit, which often results in an overestimated thrust coefficient (see Fig. 5a). As discussed in Sect. 3.2, this feature has motivated the rejection of wake regions for the fitting of the lidar data with a Gaussian function with a Pearson correlation coefficient smaller than 0.99 for the optimal tuning of the model.
Predictions of the near-wake velocity field are improved for the Larsen wake model (Fig. 9d). Furthermore, very good accuracy is generally observed throughout the downstream evolution of the wake, which suggests that the use of the RANS equations with the mixing-length turbulence closure model is an efficient strategy to accurately predict wind turbine wake, yet with very low computational costs. Compared to the empirical modeling of wake expansion in the Jensen and Bastankhah wake models, the mixing-length approach not only provides more clarity in interpreting the role of turbulence but also defines the wake width without ambiguity (green line in Fig. 9). Prediction accuracy is further enhanced with the Ainslie wake model, where a modeling strategy similar to that of the Larsen model is used with the undeniable advantage of using the mean velocity field measured through the lidar at x=1.25 D as the initial condition in the near wake. For general applications, information about the wake velocity field at the near wake might not be available, and this input should thus be replaced by a modeling approach or alternatively by previous experimental or numerical datasets.
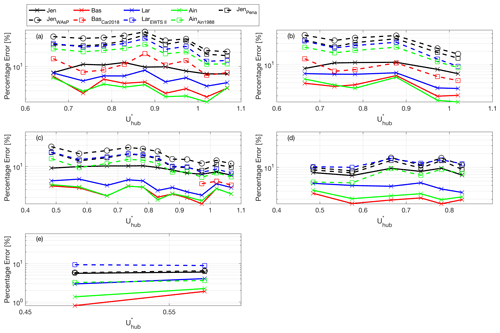
Figure 11Percentage error, PE (Eq. 1), for four optimized wake models (solid lines) and models tuned with values from the literature (dashed lines). Different panels include data with TI: (a) ; (b) ; (c) ; (d) ; (e) .
Accuracy in the wake-flow predictions obtained through the optimally tuned engineering wake models is quantified through the average percentage error, PE (Eq. 1), which is reported with solid lines in Fig. 11 for the various clusters of the lidar dataset. A similar analysis is performed for the wake predictions obtained with the four models under investigation using typical parameter values available from the literature (dashed lines in Fig. 11). Specifically, for the baseline wake predictions obtained with the Jensen model, the wake expansion parameter, k, is set equal to 0.075, which is the typical value for onshore wind farms according to the settings of the software WAsP (Mortensen et al., 2011), or to as proposed in Peña et al. (2016). For the baseline wake predictions generated with all four engineering wake models, the thrust coefficient is calculated from the SCADA data through Eqs. (4) and (5). For the Bastankhah wake model, the wake expansion parameter, k*, and initial wake width parameter, ϵ, are set as for Carbajo Fuertes et al. (2018). For the Larsen wake model, the typical first-order solution is used as a baseline wake prediction (see Appendix A for details). For the Ainslie model, the baseline predictions are obtained using the parameters from the original paper Ainslie (1988), where kl=0.015, , and the initial wake profile is calibrated from Ct and TI.
In Fig. 11, we observe that a general improvement in the wake-prediction accuracy is achieved through the optimal-tuning procedure for all the considered wake models and every cluster of the lidar dataset. It is evident that the baseline Jensen model is characterized by the lowest (average PE of 25 %) yet comparable accuracy, which is a consequence of the top-hat representation of the wake velocity field. The calibration of the wake expansion parameter, k, as a function of TI proposed by Peña et al. (2016) allows the reduction of the average PE to 19 %. However, the optimal-tuning procedure adopted for the current work enables a PE about 3 times smaller than for the baseline (average PE of 8 %). The optimally tuned Larsen model has a better accuracy than the Jensen model but worse than Ainslie and Bastankhah models. The Bastankah model produces in general a similar PE as for the Ainslie model for the various lidar clusters. It is noteworthy that the accuracy in model prediction generally increases for higher incoming-turbulence intensity, TI. Indeed, the enhanced turbulent mixing leads to smoother and more Gaussian-like wake velocity profiles.
Finally, a sensitivity analysis of the optimally tuned model parameters as a function of Ct and TI is provided. To this aim, both input and output parameters are normalized as follows:
where f is a generic input or output parameter. Through the linear regression of the normalized parameters, we report four quantities, namely, slope, intercept, R-square value, and Pearson correlation coefficient ρ. In Table 1, the numbers in bold highlight the dominant correlations between model parameters and input parameters, i.e., Ct and TI.
Table 1Linear regression between inputs from lidar cluster and output parameters from the wake models. Bold values indicate high correlation between the respective parameters.

As mentioned above, the optimal tuning of the Jensen, Bastankhah, and Larsen wake models generates an estimate of the thrust coefficient of the turbine rotor, Ct. The linear regression of the optimally tuned Ct with the respective values obtained from the lidar data through the application of mass and momentum budgets (Sect. 3), , produces a slope between 0.93 and 1.1. This indicates a very good accuracy of the optimal-tuning procedure, especially considering that for the linear regression the R-square value is always larger than 0.84, and the Pearson correlation coefficient is larger than 0.91.
Regarding the model parameters representing the wake turbulent diffusion, the slope obtained through the linear regression of these parameters with the incoming-turbulence intensity, TI, is between 0.86 and 1.12 (R-square value and Pearson correlation coefficient larger than 0.85 and 0.92, respectively). These results further corroborate the models already proposed by Peña et al. (2016) and Carbajo Fuertes et al. (2018), for which the wake turbulent expansion is always assumed to be linearly proportional to TI.
Low-computational costs and easy implementation are key factors for the wide application of engineering wake models in wind energy for both industrial and academic pursuits. However, it is challenging to tune parameters of these engineering wake models to achieve satisfactory accuracy for predictions of wakes and power capture required for the design and control of wind farms. Furthermore, this calibration can be even more challenging when wake models are used for a broad range of atmospheric-stability regimes or in the presence of flow distortions induced by the site topography.
In this paper, we have considered four widely used engineering wake models, namely the Jensen model, Bastankhah model, Larsen model, and Ainslie model. The tuning parameters of these engineering wake models have been optimally calibrated by minimizing the mean percentage error between the wake flow predicted through the models and the mean velocity fields measured through a scanning Doppler wind lidar deployed at an onshore wind farm in northern Texas. Statistics of the wake velocity field are obtained through a cluster analysis based on the incoming-turbulence intensity at hub height and the normalized hub-height wind speed. The results of the optimal-tuning procedure have shown that the thrust coefficient obtained through this numerical approach is in very good agreement with the values obtained by applying the mass and streamwise momentum budgets on the mean lidar data by neglecting pressure gradients and turbulent stresses. Furthermore, the model parameters representing the wake turbulent expansion and recovery are roughly linearly proportional to the incoming wind turbulence intensity at hub height.
This study has shown that the Jensen model has a lower yet comparable accuracy than the remaining three wake models, which is mainly connected with the simplistic top-hat assumption used for modeling the wake velocity deficit. However, a good estimate of the mean kinetic energy within the wake as a function of the downstream location is achieved through the Jensen wake model. The Larsen wake model has generally shown better accuracy than the Jensen model yet lower than for the Bastankhah and Ainslie wake models. This feature seems to be the effect of a slightly more complex formulation of the model, leading to the presence of parameters that are not easy to tune through a data-driven approach, as for this work.
The Bastankhah wake model has shown great accuracy in wake predictions upon the optimal tuning of the model parameters for a broad range of incoming-turbulence intensity and incoming wind speed at hub height, namely thrust coefficient of the turbine rotor. The main assumption of the Bastankhah wake model consists of modeling the wake velocity profile in the radial direction through a Gaussian function. Therefore, significant differences between the predictions and the lidar data have been observed in the near wake and/or for relatively low incoming-turbulence intensity for which the velocity profiles might not be axisymmetric and may differ from a Gaussian-like profile. Therefore, we recommend using the Bastankhah wake model only for downstream locations and wind conditions for which the Pearson correlation coefficient between the actual velocity field and the Gaussian model is expected to be higher than 0.99.
Finally, the Ainslie wake model has shown great accuracy, indicating that the mixing-length model for the RANS equations is a simple yet efficient turbulence closure model to capture the effects of incoming turbulence and wake-generated turbulence on wake downstream evolution and recovery. The Ainslie wake model provides a great advantage to use as input the velocity profile at a specific streamwise location. This input can be obtained through experiments, numerical simulations, or other models.
The optimal tuning of the considered wake models has enabled us to significantly reduce the mean percentage error in the predictions of the wake velocity field. For certain clusters of the lidar dataset, the mean percentage error has been 4 times smaller than for the respective baseline wake prediction obtained by using standard parameter values available from the literature. Considering that the wind farm under investigation is characterized by a typical layout, flat terrain, and typical daily cycle of the atmospheric stability for onshore wind farms, we expect that similar improvements in wake-prediction accuracy can be generally achieved for wind farms with similar characteristics by using the reported optimally tuned model parameters.
For the Larsen wake model, the coefficient representing the wake turbulent diffusion is
where the rotor position, x0, is calculated as
while the effective rotor diameter Deff is calculated as
The wake radius at a distance of 9.5 rotor diameters downstream, R9.5, is calculated as follows:
where the empirical formula to calculate Rnb is
noting that TI is the incoming-wind-turbulence intensity at hub height. Equation (A4) includes the blockage effect from the ground as the wake radius could not be larger than hub height (Larsen et al., 2003; Renkema, 2007). Subsequently, Larsen added another empirical expression for R9.6 that consists of input parameters Ct and TI and can be written as
where all the constants can be found in Larsen (2009). The only difference between these two calibration procedures is the calculation of the wake radius at 9.5 or 9.6 D.
For the terms in the second-order contribution of the Larsen model solution, they are defined as
and
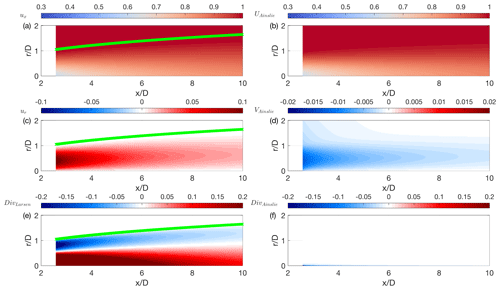
The authors noticed that for roughly identical predictions in streamwise velocity component from the Larsen and Ainslie wake models, the radial velocity predicted from the former is 1 order of magnitude larger than that for the latter while having the opposite sign. Subsequently, we calculated the divergence in cylindrical coordinate and nonconservative form, (), for both models. For the case in Fig. B1, the input Ct and turbulence intensity are set equal to 0.9 % and 12 %, respectively. The ux profile at x=x0 obtained from the Larsen wake model is used as the initial profile for the Ainslie wake model, while KM=0.01 and kl=0.015 are used for turbulence closure of the Ainslie wake model. Both models practically provide identical streamwise velocity fields (Fig. B1a and b) yet completely different radial velocity fields (Fig. B1c and d), and, in turn, a significant residual is obtained when calculating the mass conservation of the Larsen wake model (Fig. B1e). Therefore, we revisited the derivation of the velocity formulas from the Larsen model as follows:
The three contributions of the mass conservation can be written as
If we sum up Eqs. (B6)–(B8), the result will not be 0, which means the mass is not conserved in the model. Now we look at the derivation of ux for the Larsen wake model:
which are identical to the Eqs. (4.2.3), (4.2.10), (4.2.12), (4.2.13), (4.2.9), and (4.2.2) in the original paper (Larsen, 1988). Substituting Eqs. (B10)–(B15) into Eq. (B9), we confirm that the expression of ux is correctly obtained as shown in Eq. (13). The radial velocity ur is directly induced by conservation of mass as
We injected Eq. (B6) into Eq. (B16), and the result is
which is not equal to Eq. (B5); thus we rederived Eq. (4.2.17) in Larsen (1988) starting from
We substitute Eqs. (B11)–(B15) into Eq. (B18) to finally achieve
It is noteworthy that, comparing this result with Eq. (15), the first coefficient becomes instead of 1∕3, which leads to a negative radial velocity that is 1 order of magnitude smaller than the original calculation. The negative sign is consistent with the flow entrainment expected for the downstream recovery of a turbulent wake (Schlichting and Gersten, 2016). To verify divergence computed from the corrected radial velocity, we get
It is clear that if we sum up the above equations and Eq. (B6), the divergence equals 0.
The Ainslie wake model consists of two governing equations, the continuity and momentum budgets, which are solved through the boundary layer approximation
Knowing that , we can substitute this equation into the momentum equation and discretize the result as
where i and j are the dummy index in the x and r directions, respectively; i=1, 2, …, Nx and j=2, 3, …, Nr. It is worth mentioning that Nx has to be sufficiently large to ensure numerical stability. To compute the axial velocity gradient, we need to know the radial velocity, ur. Therefore, a parabolic approach advancing in the radial direction is applied. To this aim, the continuity equation is firstly discretized as
Then, we use it to replace the term on the left-hand side of Eq. (C3), producing
Therefore, the radial velocity ur can advance in the r direction by following
An initial value is assumed as the one used in the Larsen model. Finally, we insert Eq. (C6) back to Eq. (C3) to get and apply
The solution of the velocity field is then advanced in the x direction until the entire velocity field of interest is computed.
The lidar dataset used is publicly available to download at https://doi.org/10.5281/zenodo.3604444 (Iungo, 2020).
The code for the optimal tuning of the models is available at https://www.utdallas.edu/windflux/ (last access: 11 June 2020) (Zhan et al., 2020b).
This research has been funded by a grant from the National Science Foundation CBET Fluid Dynamics (award number 1705837). This material is based upon work supported by the National Science Foundation under grant IIP-1362022 (collaborative research: I/UCRC for Wind Energy, Science, Technology, and Research) and from the WindSTAR I/UCRC members Aquanis, Inc.; EDP Renewables; Bachmann Electronic Corp.; GE Energy; Huntsman; Hexion; Leeward Asset Management, LLC; Pattern Energy; and TPI Composites. Any opinions, findings, and conclusions or recommendations expressed in this material are those of the authors and do not necessarily reflect the views of the sponsors.
The authors declare that they have no conflict of interest.
This research has been supported by the National Science Foundation, Directorate for Engineering (grant no. 1705837), and the National Science Foundation, Directorate for Engineering (grant no. IIP-1362022).
This paper was edited by Julie Lundquist and reviewed by two anonymous referees.
Abkar, M., Sørensen, J. N., and Porté-Agel, F.: An analytical model for the effect of vertical wind veer on wind turbine wakes, Energies, 11, 1838, https://doi.org/10.3390/en11071838, 2018. a
Acker, T. and Chime, A. H.: Wind modeling using WindPro and WAsP software, Norther Arizon University, USA, available at: https://docuri.com/download/wind-modeling-using-windpro-and-wasp-software_59c1d09ff581710b28646f50_pdf (last access: 11 June 2020), 2011. a
Ainslie, J. F.: Calculating the flow field in the wake of wind turbines, J. Wind Eng. Indust. Aerodyn., 27, 213-224, https://doi.org/10.1016/0167-6105(88)90037-2, 1988. a, b, c, d, e
Annoni, J., Gebraad, P. M., Scholbrock, A. K., Fleming, P. A., and Wingerden, J. W.: Analysis of axial-induction-based wind plant control using an engineering and a high-order wind plant model, Wind Energy, 19, 1135-1150, https://doi.org/10.1002/we.1891, 2016. a
Archer, C. L., Vasel-Be-Hagh, A., Yan, C., Wu, S., Pan, Y., Brodie, J. F., and Maguire, A. E.: Review and evaluation of wake loss models for wind energy applications, Appl. Energy, 226, 1187–1207, https://doi.org/10.1016/j.apenergy.2018.05.085, 2018. a
Barnes, S. L.: A technique for maximizing details in numerical weather map analysis, J. Appl. Meteorol., 3, 396–409, https://doi.org/10.1175/1520-0450(1964)003<0396:ATFMDI>2.0.CO;2, 1964. a
Barthelmie, R. J. and Jensen, L. E.: Evaluation of wind farm efficiency and wind turbine wakes at the Nysted offshore wind farm, Wind Energy, 13, 573–586, https://doi.org/10.1002/we.408, 2010. a
Barthelmie, R. J., Frandsen, S. T., Nielsen, M. N., Pryor, S. C., Rethoré, P. E., and Jørgensen, H. E.: Modelling and measurements of power losses and turbulence intensity in wind turbine wakes at Middelgrunden offshore wind farm, Wind Energy, 10, 517–528, https://doi.org/10.1002/we.238, 2007. a
Bastankhah, M. and Porté-Agel, F.: A new analytical model for wind-turbine wakes, Renew. Energy, 70, 116–123, https://doi.org/10.1016/j.renene.2014.01.002, 2014. a, b, c
Carbajo Fuertes, F., Markfort, C. D., and Porté-Agel, F.: Wind turbine wake characterization with nacelle-mounted wind lidars for analytical wake model validation, Remote Sens., 10, 668, https://doi.org/10.3390/rs10050668, 2018. a, b, c, d, e, f
Chattot, J. J.: Helicoidal vortex model for wind turbine aeroelastic simulation, Comput. Struct., 85, 1072–1079, https://doi.org/10.1016/j.compstruc.2006.11.013, 2007. a
Dekker, J. W.: European wind turbine standards II: executive summary, edited by: Pierik, J. T., Netherlands Energy Research Foundation ECN, available at: https://cordis.europa.eu/docs/publications/4840/48401361-6_en.pdf (last access: 11 June 2020), 1998. a
Doubrawa, P., Debnath, M., Moriarty, P. J., Branlard, E., Herges, T. G., Maniaci, D. C., and Naughton, B.: Benchmarks for model validation based on lidar wake measurements, J. Phys.: Conf. Ser., 125, 012024, https://doi.org/10.1088/1742-6596/1256/1/012024, 2019. a
Duckworth, A. and Barthelmie, R. J.: Investigation and validation of wind turbine wake models, Wind Energy, 32, 459–475, https://doi.org/10.1260/030952408786411912, 2008. a
Duc, T., Coupiac, O., Girard, N., Giebel, G., and Göçcmen, T.: Local turbulence parameterization improves the Jensen wake model and its implementation for power optimization of an operating wind farm, Wind Energ. Sci., 4, 287–302, https://doi.org/10.5194/wes-4-287-2019, 2019. a
El-Asha, S., Zhan, L., and Iungo, G. V.: Quantification of power losses due to wind turbine wake interactions through SCADA, meteorological and wind LiDAR data, Wind Energy, 20, 1823-1839, https://doi.org/10.1002/we.2123, 2017. a, b
Frandsen, S., Barthelmie, R., Pryor, S., Rathmann, O., Larsen, S., Højstrup, J., and Thøgersen, M.: Analytical modelling of wind speed deficit in large offshore wind farms, Wind Energy, 9, 39–53, https://doi.org/10.1002/we.189, 2006. a, b
Gaumond, M., Réthoré, P. E., Bechmann, A., Ott, S., Larsen, G. C., Diaz, A. P., and Hansen, K. S.: Benchmarking of wind turbine wake models in large offshore wind farms, in: Proc. of The Science of Making Torque from Wind 2012: 4th scientific conference, available at: http://www.eera-dtoc.eu/wp-content/uploads/files/Gaumond-et-al-Benchmarking-of-wind-turbine-wake-models- (last access: 11 June 2020), 2012. a
Göçcmen, T., and Giebel, G.: Data-driven wake modelling for reduced uncertainties in short-term possible power estimation, J. Phys.: Conf. Ser., 1037, 072002, https://doi.org/10.1088/1742-6596/1037/7/072002, 2018. a, b
González, J. S., Rodriguez, A. G., Mora, J. C., Santos, J. R., and Payan, M. B.: Optimization of wind farm turbines layout using an evolutive algorithm, Renew. Energy, 35, 1671–1681, https://doi.org/10.1016/j.renene.2010.01.010, 2010. a
Hansen, K. S., Barthelmie, R. J., Jensen, L. E., and Sommer, A.: The impact of turbulence intensity and atmospheric stability on power deficits due to wind turbine wakes at Horns Rev wind farm, Wind Energy, 15, 183–196, https://doi.org/10.1002/we.512, 2012. a
Iungo, G. V.: LiDAR Cluster Statistic of Wind Turbine Wakes [Data set]. Wind Energy, Zenodo, https://doi.org/10.5281/zenodo.3604444, 2020. a, b
Iungo, G. V. and Porté-Agel, F.: Volumetric lidar scanning of wind turbine wakes under convective and neutral atmospheric stability regimes, J. Atmos. Ocean. Tech., 31, 2035–2048, https://doi.org/10.1175/JTECH-D-13-00252.1, 2014. a, b
Iungo, G. V., Santoni, C., Abkar, M., Porté-Agel, F., Rotea, M. A., and Leonardi, S.: Data-driven reduced order model for prediction of wind turbine wakes, J. Phys.: Conf. Ser., 625, 012009, https://doi.org/10.1088/1742-6596/625/1/012009, 2015. a
Iungo, G. V., Santhanagopalan, V., Ciri, U., Viola, F., Zhan, L., Rotea, M. A., and Leonardi, S.: Parabolic RANS solver for low-computational-cost simulations of wind turbine wakes, Wind Energy, 21, 184–197, https://doi.org/10.1002/we.2154, 2018a. a, b
Iungo, G. V., Letizia, S., and Zhan, L.: Quantification of the axial induction exerted by utility-scale wind turbines by coupling LiDAR measurements and RANS simulations, J. Phys.: Conf. Ser., 1037, 062010, https://doi.org/10.1088/1742-6596/1037/7/072023, 2018b. a, b, c
Jensen, N. O.: A note on wind generator interaction, Risoe National Laboratory, Copenhagen, Denmark, 1983. a, b
Jeon, S., Kim, B., and Huh, J.: Comparison and verification of wake models in an onshore wind farm considering single wake condition of the 2 MW wind turbine, Energy, 93, 1769–1777, https://doi.org/10.1016/j.energy.2015.09.086, 2015. a
Katic, I., Højstrup, J., and Jensen, N. O.: A simple model for cluster efficiency, in: Proc. of Europ. Wind Energy Ass. Conf. Exhib, 407–410, 1987. a
Kim, H., Kim, K., Bottasso, C. L., Campagnolo, F., and Paek, I.: Wind turbine wake characterization for improvement of the Ainslie eddy viscosity wake model, Energies, 11, 2823, https://doi.org/10.3390/en11102823, 2018. a, b
Kusiak, A. and Song, Z.: Design of wind farm layout for maximum wind energy capture, Renew. Energy, 35, 685–694, https://doi.org/10.1016/j.renene.2009.08.019, 2010. a
Larsen, G. C.: A simple wake calculation procedure, Risoe National Laboratory, Copenhagen, Denmark, 1988. a, b, c, d
Larsen, G. C.: A simple stationary semi-analytical wake model, Risoe National Laboratory for Sustainable Energy, Forskningscenter Risoe, Risoe-R, No. 1713(EN), Technical University of Denmark, Denmark, 2009. a, b, c
Larsen, G. C., Madsen, H. A., and Sørensen, N. N.: Mean wake deficit in the near field, in: Proc. Europ. Wind Energy Conf. Exhibit, Madrid, Spain, 2003. a, b
Larsen, G. C., Aagaard, H. M., Bingöl, F., Mann, J., Ott, S., Sørensen, J. N., Okulov, V., Troldborg, N., Nielsen, N. M., Thomsen, K., and Larsen, T. J.: Dynamic wake meandering modeling, Forskningscenter Risoe, Risoe-R, No. 1607(EN), Risø National Laboratory, Roskilde, Denmark, 2007. a
Lee, J., Son, E., Hwang, B., Lee, S., and Lee, S.: Blade pitch angle control for aerodynamic performance optimization of a wind farm, Renew. Energy, 54, 124–130, https://doi.org/10.1016/j.renene.2012.08.048, 2013. a
Letizia, S., Zhan, L., and Iungo, G. V.: LiSBOA: LiDAR Statistical Barnes Objective Analysis for optimal design of LiDAR scans and retrieval of wind statistics. Part I: Theoretical framework, Atmos. Meas. Tech. Discuss., https://doi.org/10.5194/amt-2020-227, in review, 2020a. a
Letizia, S., Zhan, L., and Iungo, G. V.: LiSBOA: LiDAR Statistical Barnes Objective Analysis for optimal design of LiDAR scans and retrieval of wind statistics. Part II: Applications to synthetic and real LiDAR data of wind turbine wakes, Atmos. Meas. Tech. Discuss., https://doi.org/10.5194/amt-2020-228, in review, 2020b. a
Luzzatto-Fegiz, P.: A one-parameter model for turbine wakes from the entrainment hypothesis, J. Phys.: Conf. Ser., 1037, 072019, https://doi.org/10.1088/1742-6596/1037/7/072019, 2018. a
Martínez-Tossas, L. A., Churchfield, M. J., and Leonardi, S.: Large eddy simulations of the flow past wind turbines: actuator line and disk modeling, Wind Energy, 18, 1047–1060, https://doi.org/10.1002/we.1747, 2015. a
Mortensen, N. G., Heathfield, D. N., Rathmann, O., amd Nielsen, M.: Wind atlas analysis and application program: WAsP 10 Help facility, Department of Wind Energy, Technical University of Denmark, Roskilde, Denmark, 366 pp., 2011. a, b, c
Newsom, R. K., Brewer, W. A., Wilczak, J. M., Wolfe, D. E., Oncley, S. P., and Lundquist, J. K.: Validating precision estimates in horizontal wind measurements from a Doppler lidar, Atmos. Meas. Tech, 10, 1229–1240, https://doi.org/10.5194/amt-10-1229-2017, 2017. a
Peña, A. and Rathmann, O.: Atmospheric stability-dependent infinite wind-farm models and the wake-decay coefficient, Wind Energy, 17, 1269–1285, https://doi.org/10.1002/we.1632, 2014. a
Peña, A., Réthoré, P. E., and van der Laan, M. P.: On the application of the Jensen wake model using a turbulence-dependent wake decay coefficient: the Sexbierum case, Wind Energy, 19, 763–776, https://doi.org/10.1002/we.1863, 2016. a, b, c, d, e, f
Pope, S. B.: Turbulent flows, Cambridge University Press, Cambridge, https://doi.org/10.1017/CBO9780511840531, 2000. a
Renkema, D. J.: Validation of wind turbine wake models, MS Thesis, Delft University of Technology, Delft, the Netherlands, 19 pp., 2007. a
Santhanagopalan, V., Letizia, S., Zhan, L., Al-Hamidi, L. Y., and Iungo, G. V.: Profitability optimization of a wind power plant performed through different optimization algorithms and a data-driven RANS solver, in: 2018 Wind Energ. Symp., AIAA SciTECH, Kissimmee, Florida, https://doi.org/10.2514/6.2018-2018, 2018a. a
Santhanagopalan, V., Rotea, M. A., and Iungo, G. V.: Performance optimization of a wind turbine column for different incoming wind turbulence, Renew. Energy, 116, 232–243, https://doi.org/10.1016/j.renene.2017.05.046, 2018b. a
Santoni, C., Carrasquillo, K., Arenas-Navarro, I., and Leonardi, S.: Effect of tower and nacelle on the flow past a wind turbine, Wind Energy, 20, 1927–1939, https://doi.org/10.1002/we.2130, 2017. a
Schlichting, H. and Gersten, K.: Boundary-layer theory, Springer, Berlin, Germany, 2016. a
Sebastian, T. and Lackner, M. A.: Development of a free vortex wake method code for offshore floating wind turbines, Renew. Energy, 46, 269–275, https://doi.org/10.1016/j.renene.2012.03.033, 2012. a
Shaler, K., Kecskemety, K. M., and McNamara, J. J.: Benchmarking of a free vortex wake model for prediction of wake interactions, Renew. Energy, 136, 607–620, https://doi.org/10.1016/j.renene.2018.12.044, 2019. a
Shapiro, C. R., Starke, G. M., Meneveau, C., and Gayme, D. F.: A wake modeling paradigm for wind farm design and control, Energies, 12, 2956, https://doi.org/10.3390/en12152956, 2019. a
Stull, R. B.: An introduction to boundary layer meteorology, Springer Science, the Netherlands, 1988. a
Swain, L. M.: On the turbulent wake behind a body of revolution, P. Roy. Soc. Lond. A, 125, 647–659, https://doi.org/10.1098/rspa.1929.0193, 1929. a, b
Tennekes, H., Lumley, J. L., and Lumley, J. L.: A first course in turbulence, MIT Press, London, UK, 1972. a, b
Tian, J., Zhou, D., Su, C., Soltani, M., Chen, Z., and Blaabjerg, F.: Wind turbine power curve design for optimal power generation in wind farms considering wake effect, Energies, 10, 395, https://doi.org/10.3390/en10030395, 2017. a
US Geological Survey: Website, available at: https://www.usgs.gov/, last access: 31 October 2017. a
Zhan, L., Letizia, S., and Iungo, G. V.: LiDAR measurements for an onshore wind farm: Wake variability for different incoming wind speeds and atmospheric stability regimes, Wind Energy, 23, 501–527, https://doi.org/10.1002/we.2430, 2020a. a, b, c, d, e, f, g, h
Zhan, L., Letizia, S., and Iungo, G. V.: Matlab function for optimal tuning of wake engineering models, available at: https://www.utdallas.edu/windflux/ (last access: 11 June2020), 2020b. a
- Abstract
- Introduction
- Lidar experiment for a wind farm on flat terrain
- Data-driven optimal tuning of engineering wake models
- Results and discussion
- Conclusions
- Appendix A: Calibration procedure of first- and second-order solutions of the Larsen wake model
- Appendix B: A note on the Larsen wake model
- Appendix C: Numerical scheme to solve the Ainslie model
- Data availability
- Code and data availability
- Acknowledgements
- Competing interests
- Financial support
- Review statement
- References


