the Creative Commons Attribution 4.0 License.
the Creative Commons Attribution 4.0 License.
 | 26 Nov 2020
Aerodynamic effects of Gurney flaps on the rotor blades of a research wind turbine
Jörg Alber
Rodrigo Soto-Valle
Marinos Manolesos
Sirko Bartholomay
Christian Navid Nayeri
Marvin Schönlau
Christian Menzel
Christian Oliver Paschereit
Joachim Twele
Jens Fortmann
This paper investigates the aerodynamic impact of Gurney flaps on a research wind turbine of the Hermann-Föttinger Institute at the Technische Universität Berlin. The rotor radius is 1.5 m, and the blade configurations consist of the clean and the tripped baseline cases, emulating the effects of forced leading-edge transition. The wind tunnel experiments include three operation points based on tip speed ratios of 3.0, 4.3, and 5.6, reaching Reynolds numbers of approximately 2.5×10⁵. The measurements are taken by means of three different methods: ultrasonic anemometry in the wake, surface pressure taps in the midspan blade region, and strain gauges at the blade root. The retrofit applications consist of two Gurney flap heights of 0.5 % and 1.0 % in relation to the chord length, which are implemented perpendicular to the pressure side at the trailing edge. As a result, the Gurney flap configurations lead to performance improvements in terms of the axial wake velocities, the angles of attack and the lift coefficients. The enhancement of the root bending moments implies an increase in both the rotor torque and the thrust. Furthermore, the aerodynamic impact appears to be more pronounced in the tripped case compared to the clean case. Gurney flaps are considered a passive flow-control device worth investigating for the use on horizontal-axis wind turbines.
- Article
(5806 KB) - Full-text XML
- BibTeX
- EndNote


The energy yield of modern horizontal-axis wind turbines (HAWTs) is supposed to be optimal while keeping the maintenance costs as low as possible over a lifetime of around 20 years. However, the performance of rotor blades faces serious challenges, two of which are early separation and roughness effects. Early separation is a problem especially in the inner blade region towards the root, where the angles of attack (AoAs) are elevated due to structural constraints, such as limited chord length and twist angles (see Fig. 1a). Over time, the resulting dynamic loads contribute to the material fatigue of the blade (Mueller-Vahl et al., 2012). For this reason, passive flow-control (PFC) devices, such as vortex generators (VGs), are implemented in the inner blade region of different-size HAWTs aiming at stall delay (Pechlivanoglou et al., 2013). At the same time, the long-standing surface erosion causes roughness effects, especially close to the leading edge (LE; see Fig. 1b). LE roughness is relevant throughout the entire blade span and especially in the outer region towards the blade tip. Apart from the broad range of weather conditions, surface roughening is aggravated by rain and insects as well as sand or salt particles (Pechlivanoglou et al., 2010). Consequently, the energy yield of HAWTs is often found to be lower than predicted or regressing over time (Wilcox et al., 2017).
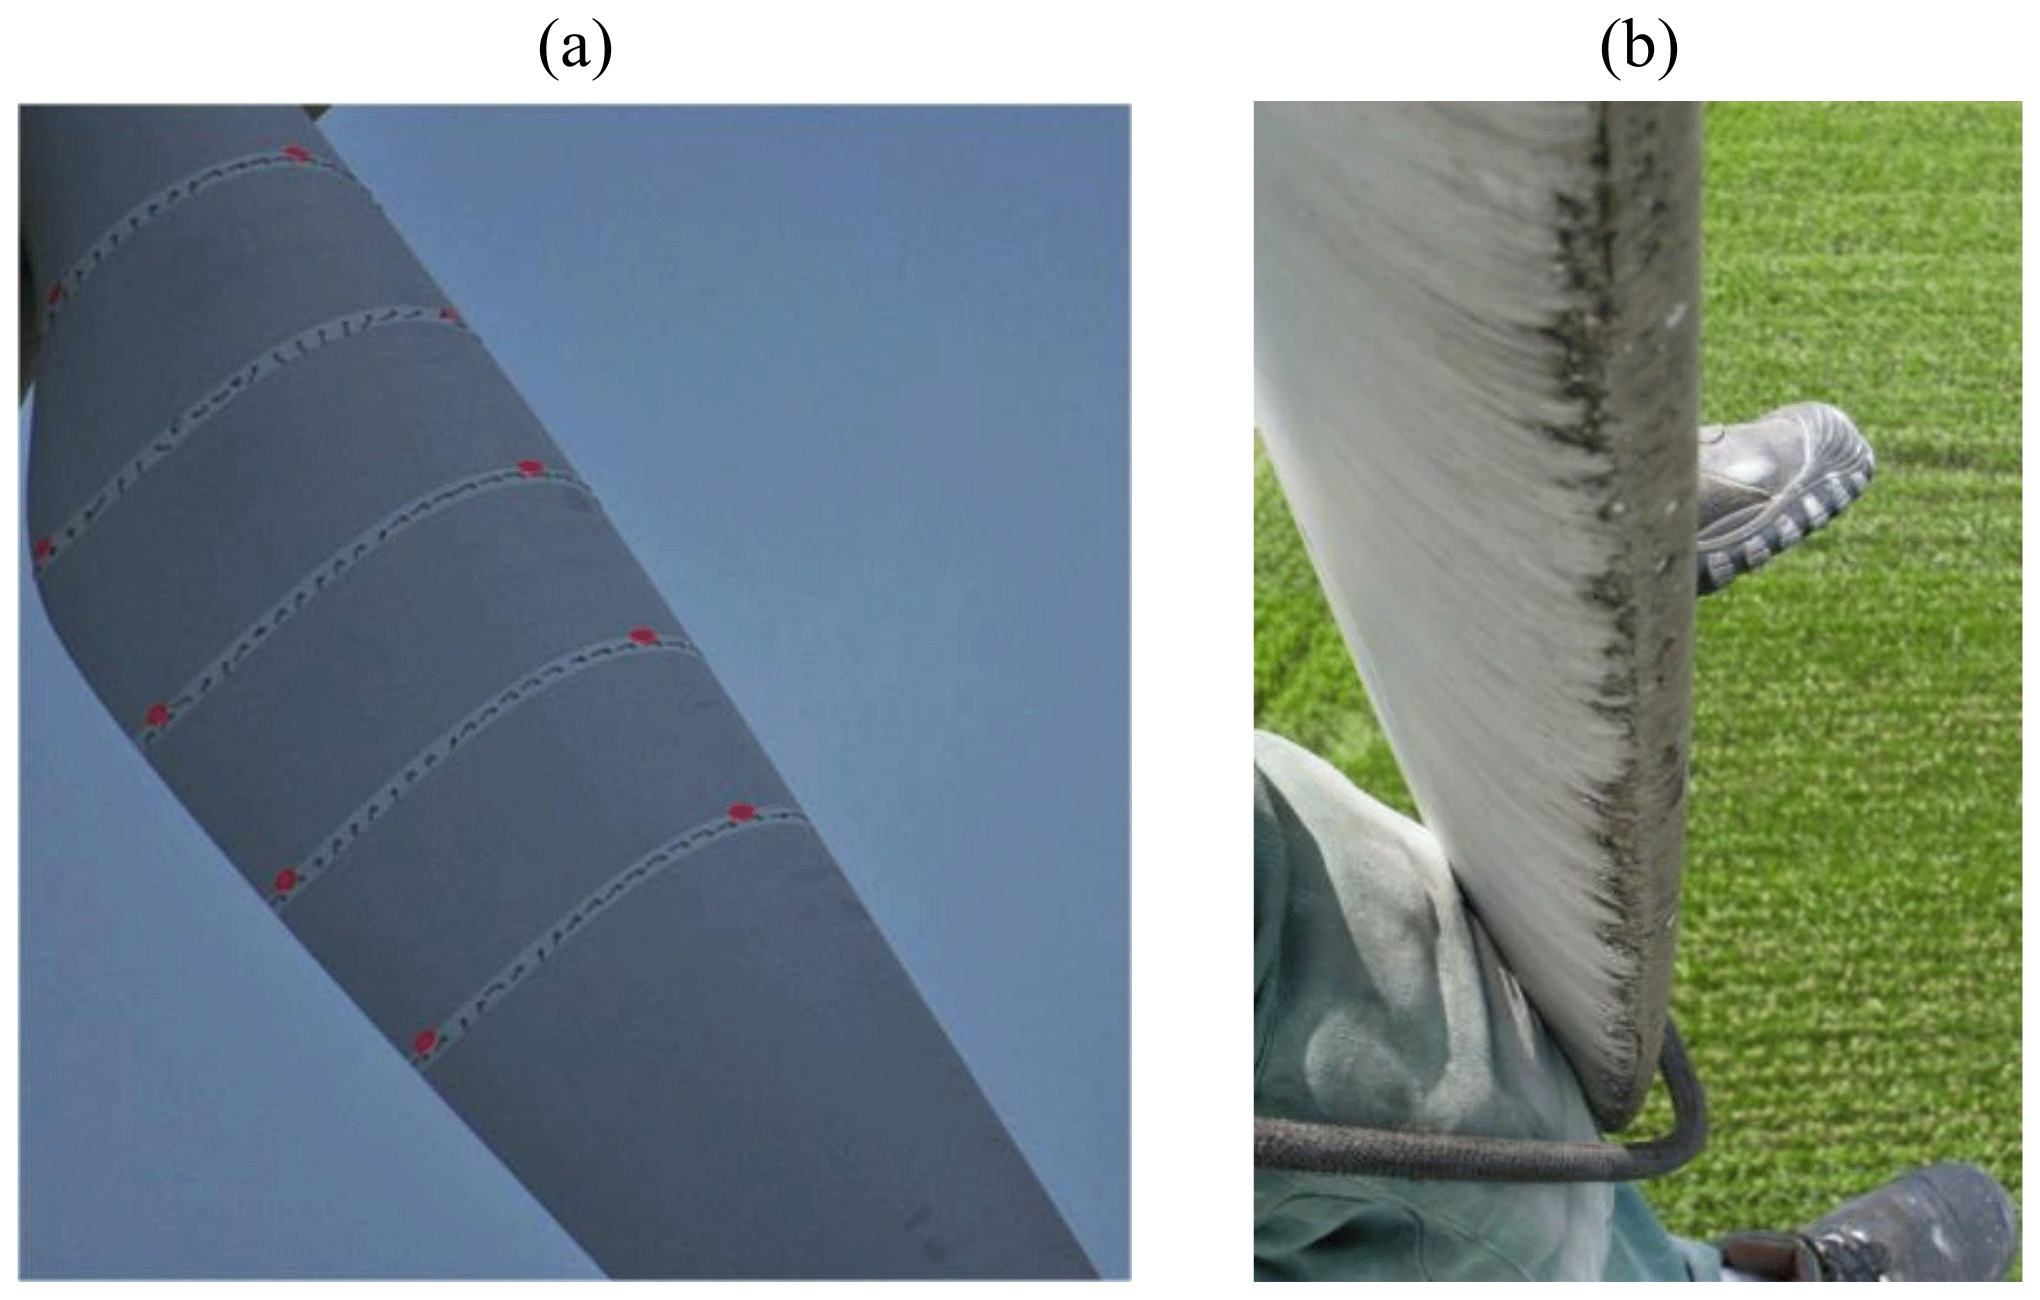
Figure 1Rotor blades of utility-scale wind turbines. (a) Flow indicators to detect early separation in the inner blade region, reproduced from Pechlivanoglou et al. (2013). (b) Leading-edge erosion, with permission from Seilpartner Windkraft GmbH.
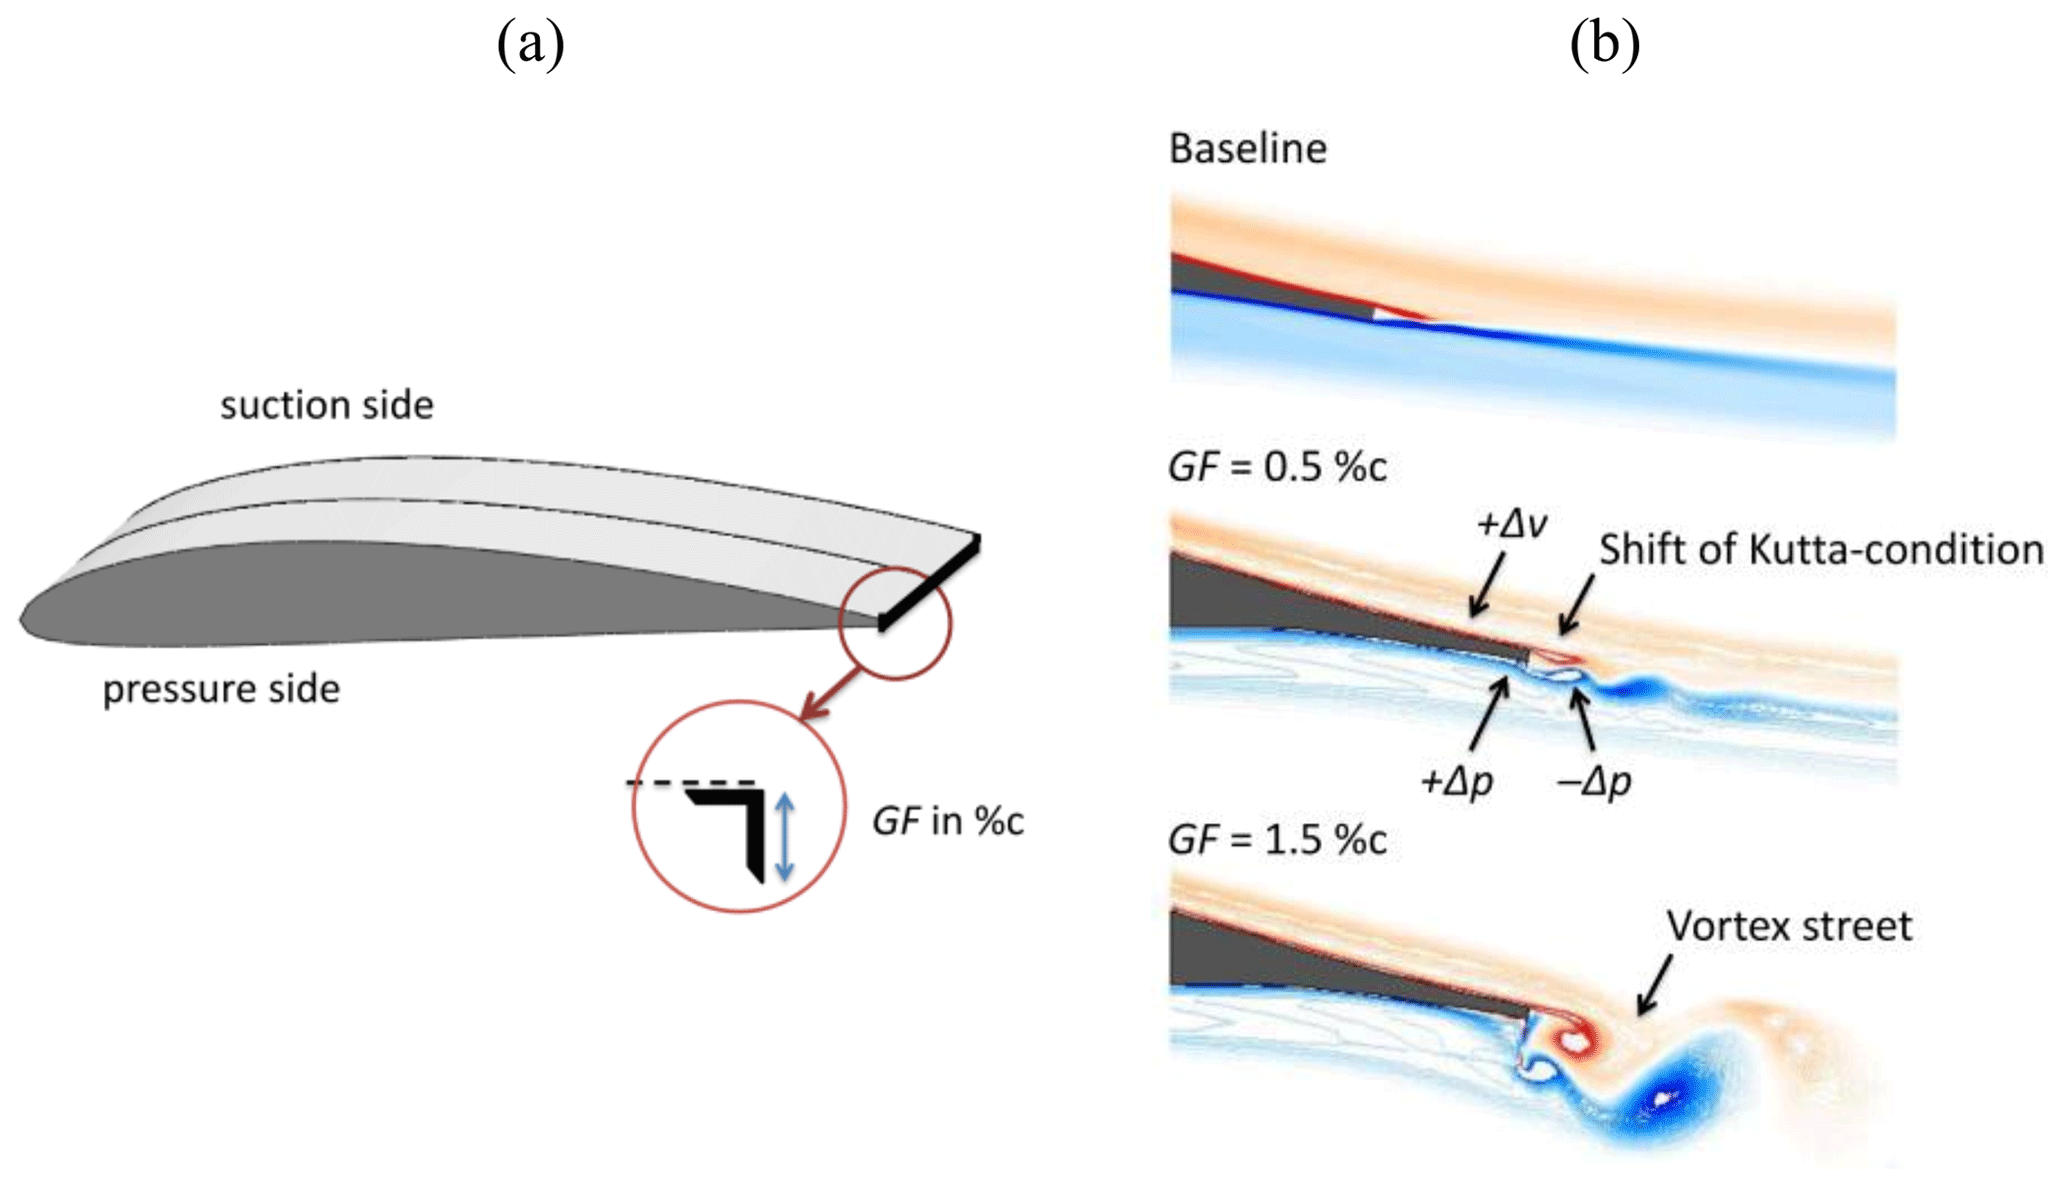
Figure 2(a) Position of the Gurney flap at the trailing edge of a Clark-Y airfoil section. (b) CFD simulation of the HQ17 airfoil at , reproduced and modified from Schatz et al. (2004a).
This paper investigates the retrofit application of Gurney flaps (GFs) in order to improve the aerodynamic performance of rotor blades. This PFC device consists of a wedge or right-angle profile that is attached perpendicularly to the pressure side at the trailing edge (TE). The Gurney flap height, in relation to the chord length, c, is the main design parameter, illustrated in Fig. 2a. It is usually in the range of 0.5 %c < GF < 2.0 %c without taking the TE thickness into account.
The research on TE flaps of airplane wings dates back to the early 20th century (Gruschwitz and Schrenk, 1933). The GF itself is named after the race car driver Dan Gurney, who discovered the significant gain in downforce when applying the device on the rear spoilers. Following from that, GFs have been implemented on high-lift-dependent transport airliners (Bechert et al., 2000) and helicopter stabilizers (Houghton et al., 2013). More recently, Vestas® has started offering GFs in combination with VGs as so-called aerodynamic upgrades of HAWTs, predicting annual yield improvements of up to 2.0 % (Vestas, 2020). The design of the DTU 10 MW reference wind turbine includes smooth wedge-shaped GFs in the first half of the blade length, 0.05R < r < 0.4R, using GF heights in the range of 1.3 %c < GF < 3.5 %c (Bak et al., 2013).
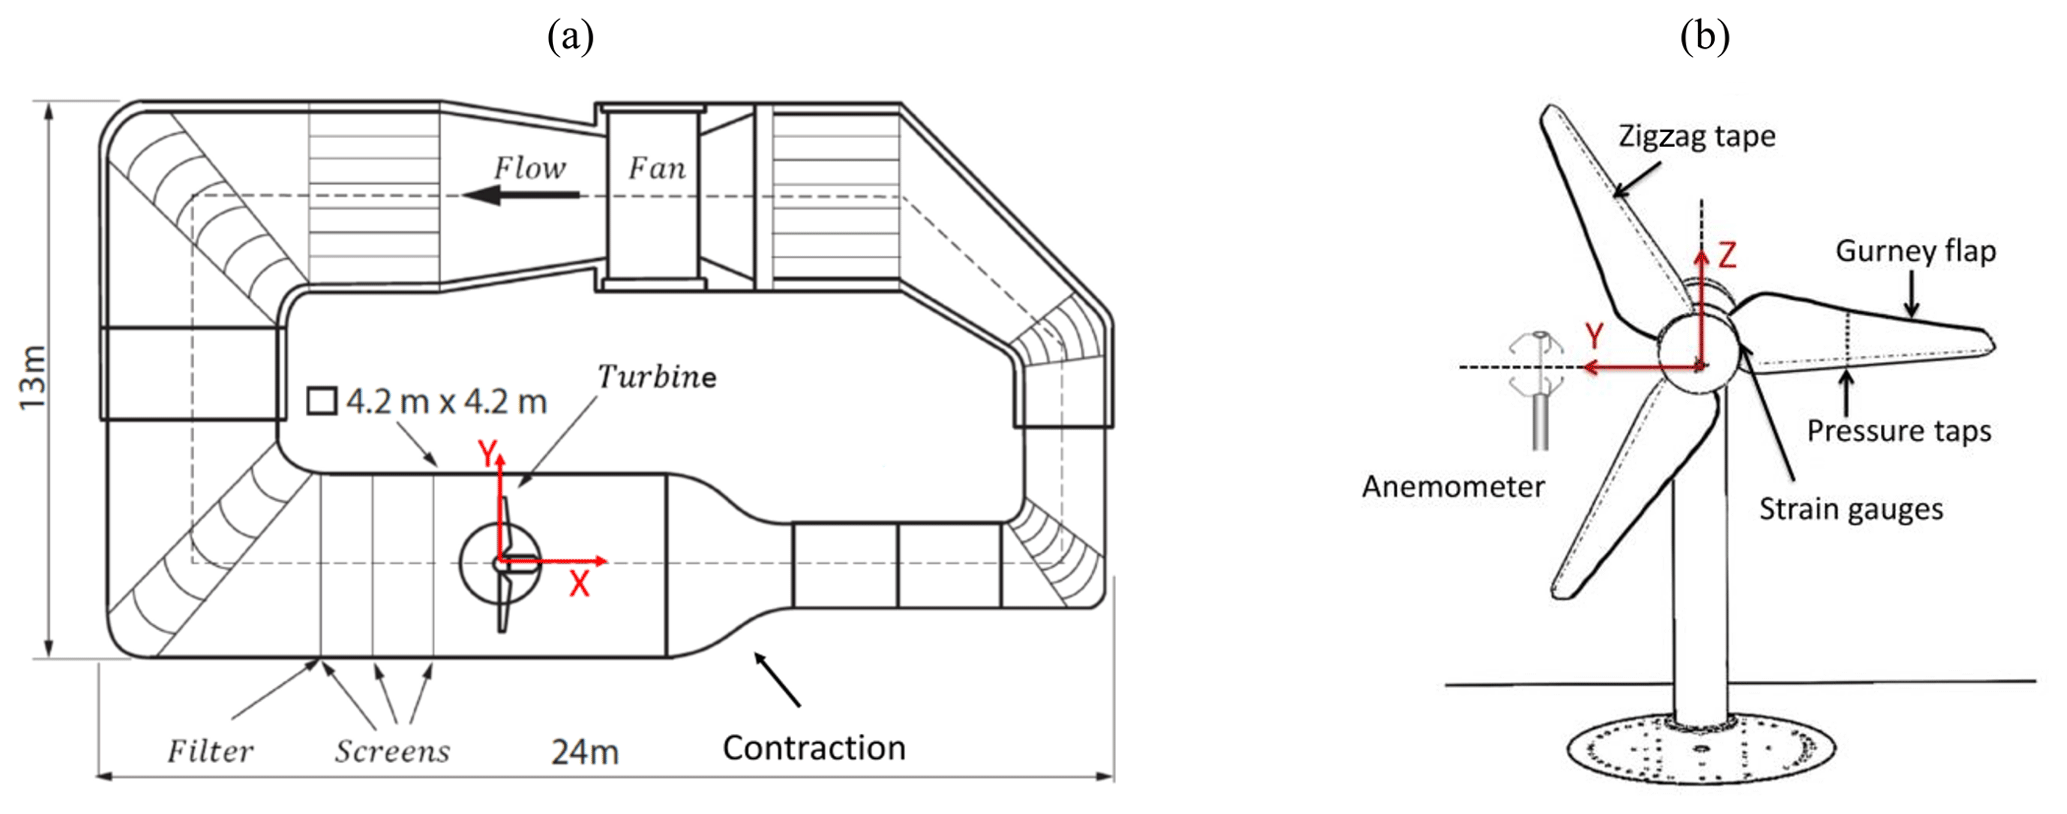
Figure 3(a) Closed-loop wind tunnel in top view, reproduced and modified from Klein at al. (2018). (b) BeRT setup in front view looking downstream.
Figure 2b illustrates the changes in the flow field of the laminar airfoil HQ17 when implementing different GF heights, as reported by Liebeck (1978) by means of the Newman airfoil. Key to the aerodynamic understanding is the development of one vortex upstream and two counterrotating vortices downstream of the GF, as such entailing a low-pressure region in the TE wake. As a result, the downwash angle of the flow becomes steeper, the requirements for pressure recovery on the suction side milder, the local boundary layer thinner, and the suction peak higher. Additionally, the flow on the pressure side decelerates, leading to a positive pressure built up in the TE region. The resulting shift of the Kutta condition leads to increased circulation and thus to elevated lift forces, which is the main Gurney flap characteristic. At the same time, the low-pressure region aft of the TE induces additional drag, especially if vortex shedding is initiated in the form of a Kármán vortex street. Hence, the lift increase is accompanied by a certain drag penalty that affects the lift-to-drag (L ∕ D) ratio accordingly.
This is why various experimental and numerical research projects aim to limit the adverse drag increase while maintaining the beneficial lift enhancement. Giguère et al. (1995) and Kentfield (1996) conclude that the GF height is supposed to be submerged into the local boundary layer (BL) in order to keep the drag at an acceptable level. Bechert et al. (2000) demonstrate that additional holes, slits, and especially the pattern of dragonfly wings lead to reduced drag on the HQ17 airfoil (thmax=15.2 %c, ). In addition, promising results are presented for very small GF heights in the range of 0.2 %c < GF < 0.5 %c, i.e., substantially smaller than the BL thickness at the TE. Following from that, wake simulations based on computational fluid dynamics (CFD) of Schatz et al. (2004b) reveal that the amount of induced drag depends on the GF height, in fact, in a disproportionate manner, as illustrated in Fig. 2b: for GF = 1.5 %c a vortex street is triggered, while for GF = 0.5 %c the wake is shed in a relatively smooth way. In a similar manner, Alber et al. (2017) suggest the use of very small GF heights of approximately half the local BL thickness in order to maintain, or even improve, the airfoil L ∕ D ratio of different DU and NACA airfoils.
The aforementioned design principle, GF < δ, is applied on the rotor blades of the Berlin Research Turbine (BeRT) using GF heights of 0.5 %c and 1.0 %c. In addition, forced LE transition is triggered in order to emulate the effects of leading-edge roughness.
The aerodynamic impact of GFs is investigated by means of the following measurement methods:
-
3D ultrasonic anemometry in the turbine wake to determine the local AoA;
-
chord-wise pressure taps to calculate the local pressure distribution and the lift performance;
-
strain gauges at the blade root to measure the flapwise and the edgewise root bending moments.
In summary, the objective of the experiments is to assess the suitability of retrofit GFs in order to alleviate the following adverse effects:
-
early separation due to the high-AoA regime, relevant in the inner blade region (see Fig. 1a);
-
decreasing lift forces due to leading-edge erosion, relevant in the outer blade region (see Fig. 1b).
In the remainder of this paper, the experimental setup is described in detail, followed by the presentation and the discussion of the results. The main conclusions are summarized in the final section of this report.
2.1 Berlin Research Turbine
The BeRT is a test bench of the closed-loop wind tunnel of the Hermann-Föttinger Institut at the Technische Universität Berlin. It is a unique wind turbine demonstrator to explore specific fluid-dynamic phenomena based on a fully equipped rotating system (Vey et al., 2015).
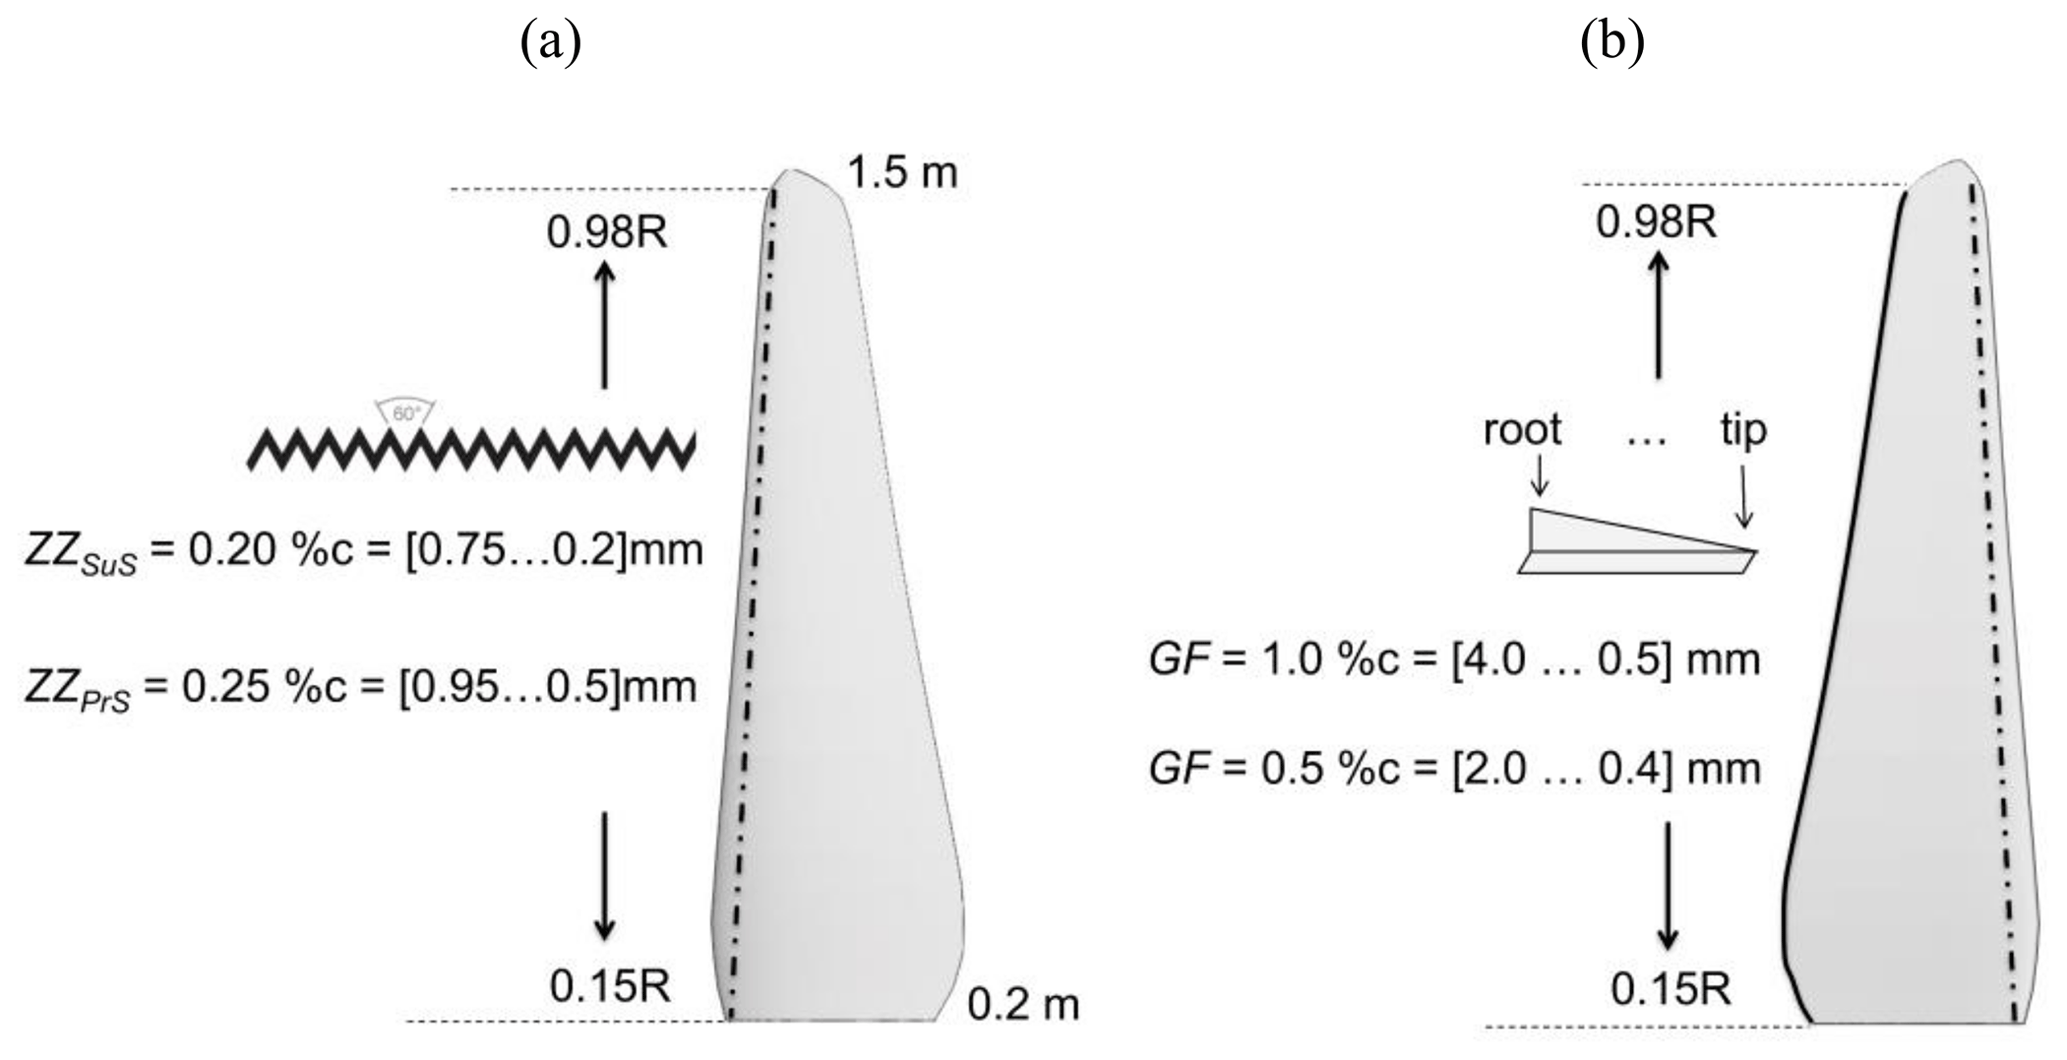
Figure 4(a) Zigzag tape at the leading edge of the suction side. (b) Gurney flap and ZZ tape at the pressure side of the trailing edge.
Figure 3a depicts the wind tunnel facility consisting of the high-speed (2.0 m×1.4 m) and the low-speed (4.2 m×4.2 m) test section. The BeRT is situated in the low-speed test section downstream of the flow-conditioning screens and upstream of the wind tunnel contraction. The maximum inflow velocity is 10 m s−1. The third screen upstream of the rotor plane is equipped with an additional turbulence filter mat (Vildedon P15/150s) in order to reduce the turbulence intensity to 1.0 % < Ti < 1.5 %, as reported by Bartholomay et al. (2017). Figure 3b displays the BeRT setup and the measurement methods applied. The rotor radius is R= 1.5 m, producing a relatively large blockage ratio of approximately 40 % in relation to the test section area. The blockage effects on both the flow and the rotor performance are discussed in Sect. 3.1. Relative distances are expressed in relation to the rotor radius, R, and the zero position at the center of the rotor plane at 0. The blades consist of the low Reynolds profile, Clark-Y, with a maximum thickness of thmax= 11.9 %c and a modified TE thickness of 0.75 %c. The blade geometry is optimized aerodynamically, including a linear decrease in both the chord lengths and the twist angles from root to tip alongside most of the blade span. The root section is contiguous to the round rotor hub, and the tip section is pointy (see Fig. 4). The tip speed ratio (TSR) at rated conditions is 4.3, developing a span-wise Re number range from root to tip of 1.7×10⁵ < Re < 3.0×10⁵. The axial inflow velocity is captured by two parallel Prandtl tubes that are permanently installed at approximately one rotor radius upstream, close to each wind tunnel wall and slightly above hub height. At rated conditions, the inflow velocity is 6.5 m s−1 at a rotational frequency of frot= 3.0 Hz. The data acquisition system of the rotating sensors, such as pressure taps and strain gauges, is installed within the rotational spinner (see Fig. 6a). The electrical power is transferred to the rotating system through a slip ring. Communication with the host PC is established via Wi-Fi connection in order to set and modify the rotational speed. The signals are captured on all channels simultaneously at a rate of 10 kHz, generating around 6.0×10⁵ data points per measurement, which are streamed to a host PC via network connection.
2.2 Blade configurations and operation points
The test matrix consists of six blade configurations (Table 1) and three operation points (Table 2), which are specified throughout this section.

2.2.1 Forced transition
Following Klein et al. (2018), the principal baseline configuration of the BeRT includes zigzag (ZZ) turbulator tape: in short, the tripped case. ZZ tape is applied in order to initiate the laminar-to-turbulent transition of the boundary layer (BL) at a fixed location. In practical terms, it is used to emulate LE roughness effects on both airfoil sections (van Rooij and Timmer, 2003) and rotor blades (Zhang et al., 2017). Its height is slightly smaller than the local BL thickness, δ, in order to trigger the BL transition while avoiding a disproportionate drag increase or even turbulent separation. The ZZ tape is implemented on all BeRT blades at a chord-wise LE position of both the suction side (SuS) at xSuS= 5.0 %c and the pressure side (PrS) at xPrS= 10.0 %c. The BL thickness of the clean baseline is calculated with the software XFOIL (Drela, 1989) based on the Re number, the AoA, and the N criterion (Ncrit) modeling the transition location. The design conditions of the Clark-Y airfoil are defined by αopt= 5.0∘, Re= 2.5×10⁵, and Ncrit = 6 accounting for the elevated Ti inside the test section (Sect. 2.1). As such, the attached flow at prestall conditions is assumed two-dimensional in order to estimate δ by means of the XFOIL code. The absolute height of the ZZ tape is adjusted in various steps in relation to the chord length, as depicted in Fig. 4a. In addition, all experiments are also performed under the consideration of the free BL transition, i.e., without including ZZ tape: in short, the clean case.
2.2.2 Gurney flaps
The GF height is supposed to be submerged into the BL at the TE in order to keep the drag penalty at an acceptable level, as discussed in Sect. 1. Hence, it is important to estimate δ before dimensioning the GF height since the aerodynamic impact depends on the GF ∕ δ ratio. Apart from the AoA and the transition location, δ is related to Re. The Re number range of the BeRT is significantly lower compared to the blades of multi-MW HAWTs. At design conditions (Re = 2.5×10⁵), the XFOIL code predicts the BL thickness at the TE to be δTE= 1.0 %c. Additionally, another GF height of half the local δ is chosen so that the GF configurations consist of GF = 1.0 %c and GF = 0.5 %c. For comparison, the FFA-W3-241 airfoil (thmax= 24.1 %c, Re = 12.0×10⁶), which is used in the outer blade region of the DTU 10 MW reference wind turbine (Bak et al., 2013), generates a BL of δTE≈0.30 %c. As such, the application of GF > 0.30 %c would be likely to cause the L ∕ D ratio to decline, as illustrated in Fig. 2b.
Apart from the very tip section, the GFs are implemented in the form of thin angle profiles made of brass. One side of the angle profiles is cut in a linear way in order to match the chord decrease, as shown in Fig. 4b. The other side of the profile is attached with thin double-sided adhesive tape adjacent to the TE.
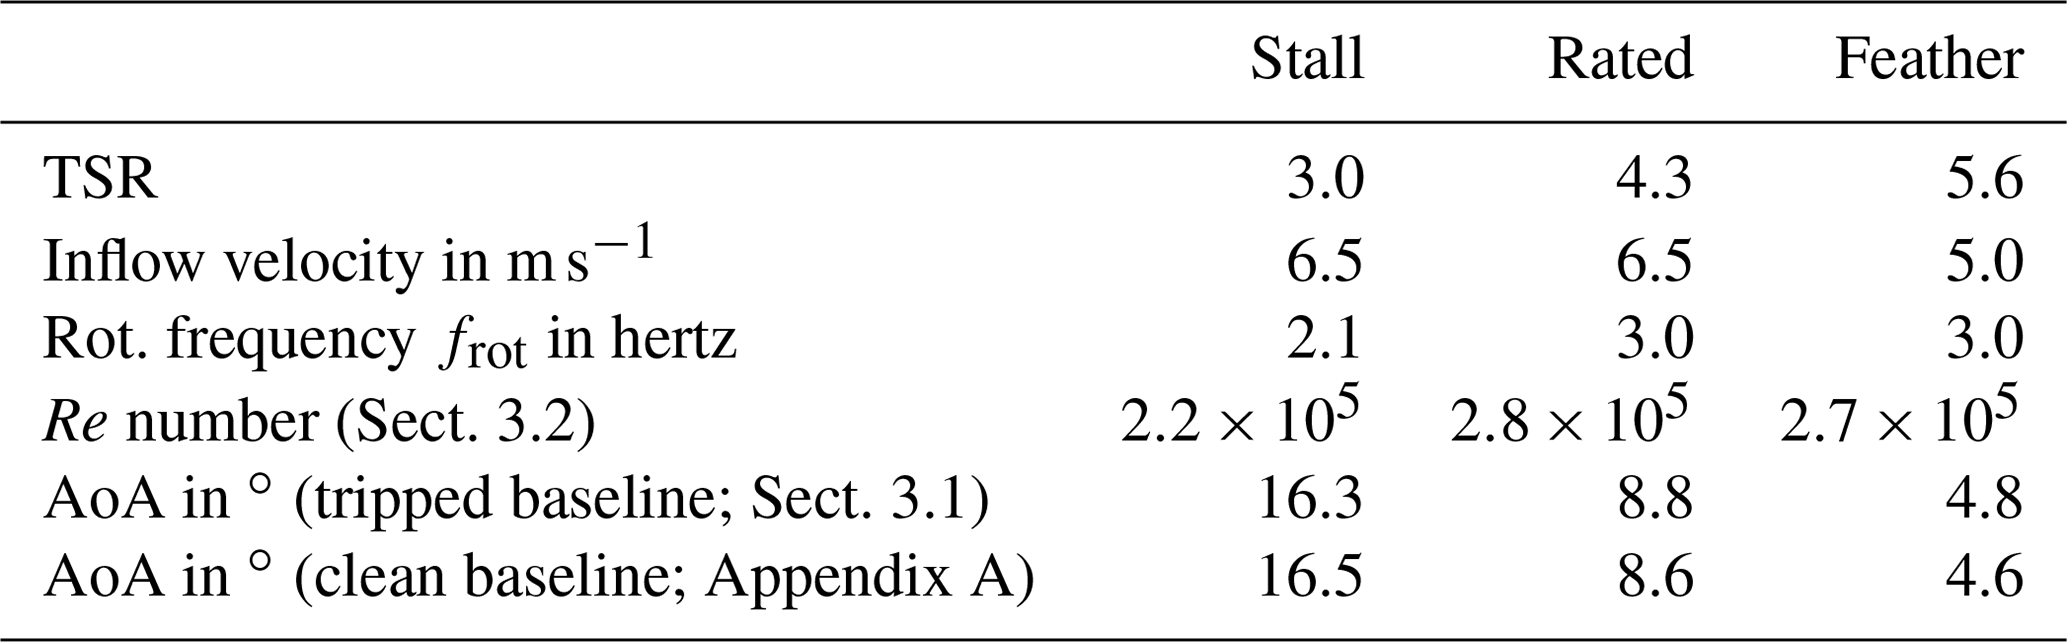
2.2.3 Operation points
The operation points (OPs) include the so-called stall, rated, and feather conditions, which are characterized by low, medium, and high TSRs or AoAs, respectively (see Table 2). Each measurement has a total duration of 60 s. No blockage correction is applied so that the results refer to the conditions inside the closed test section. All sensors are calibrated, and a zero-offset measurement is performed before each test run in order to reduce experimental errors. The uncertainty of the results is evaluated in Appendix B.
2.3 Measurement methods
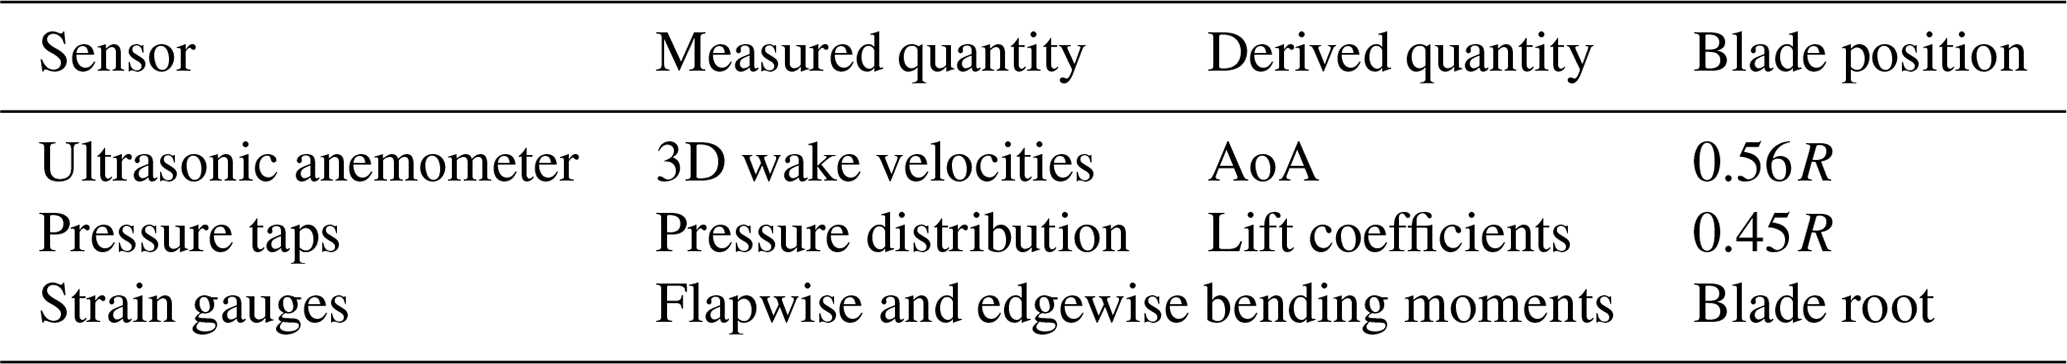
The experimental approaches are summarized in Table 3 and explained in detail throughout this section.
2.3.1 Ultrasonic anemometry
Three-dimensional ultrasonic anemometers (UAs) are widely spread in the wind energy industry. The technology is recognized by different wind industry standards, such as the IEC 61400 to determine the power curve of wind turbines or the Association of German Engineers (VDI) for turbulence measurements. There are numerous references for the use of UAs in the context of wind tunnel campaigns, such as Weber et al. (1995), Hand et al. (2001), and Cuerva et al. (2003). The UA is a commercial product of Thies CLIMA (version 4.383). According to the manufacturer, they are precalibrated and free from maintenance.
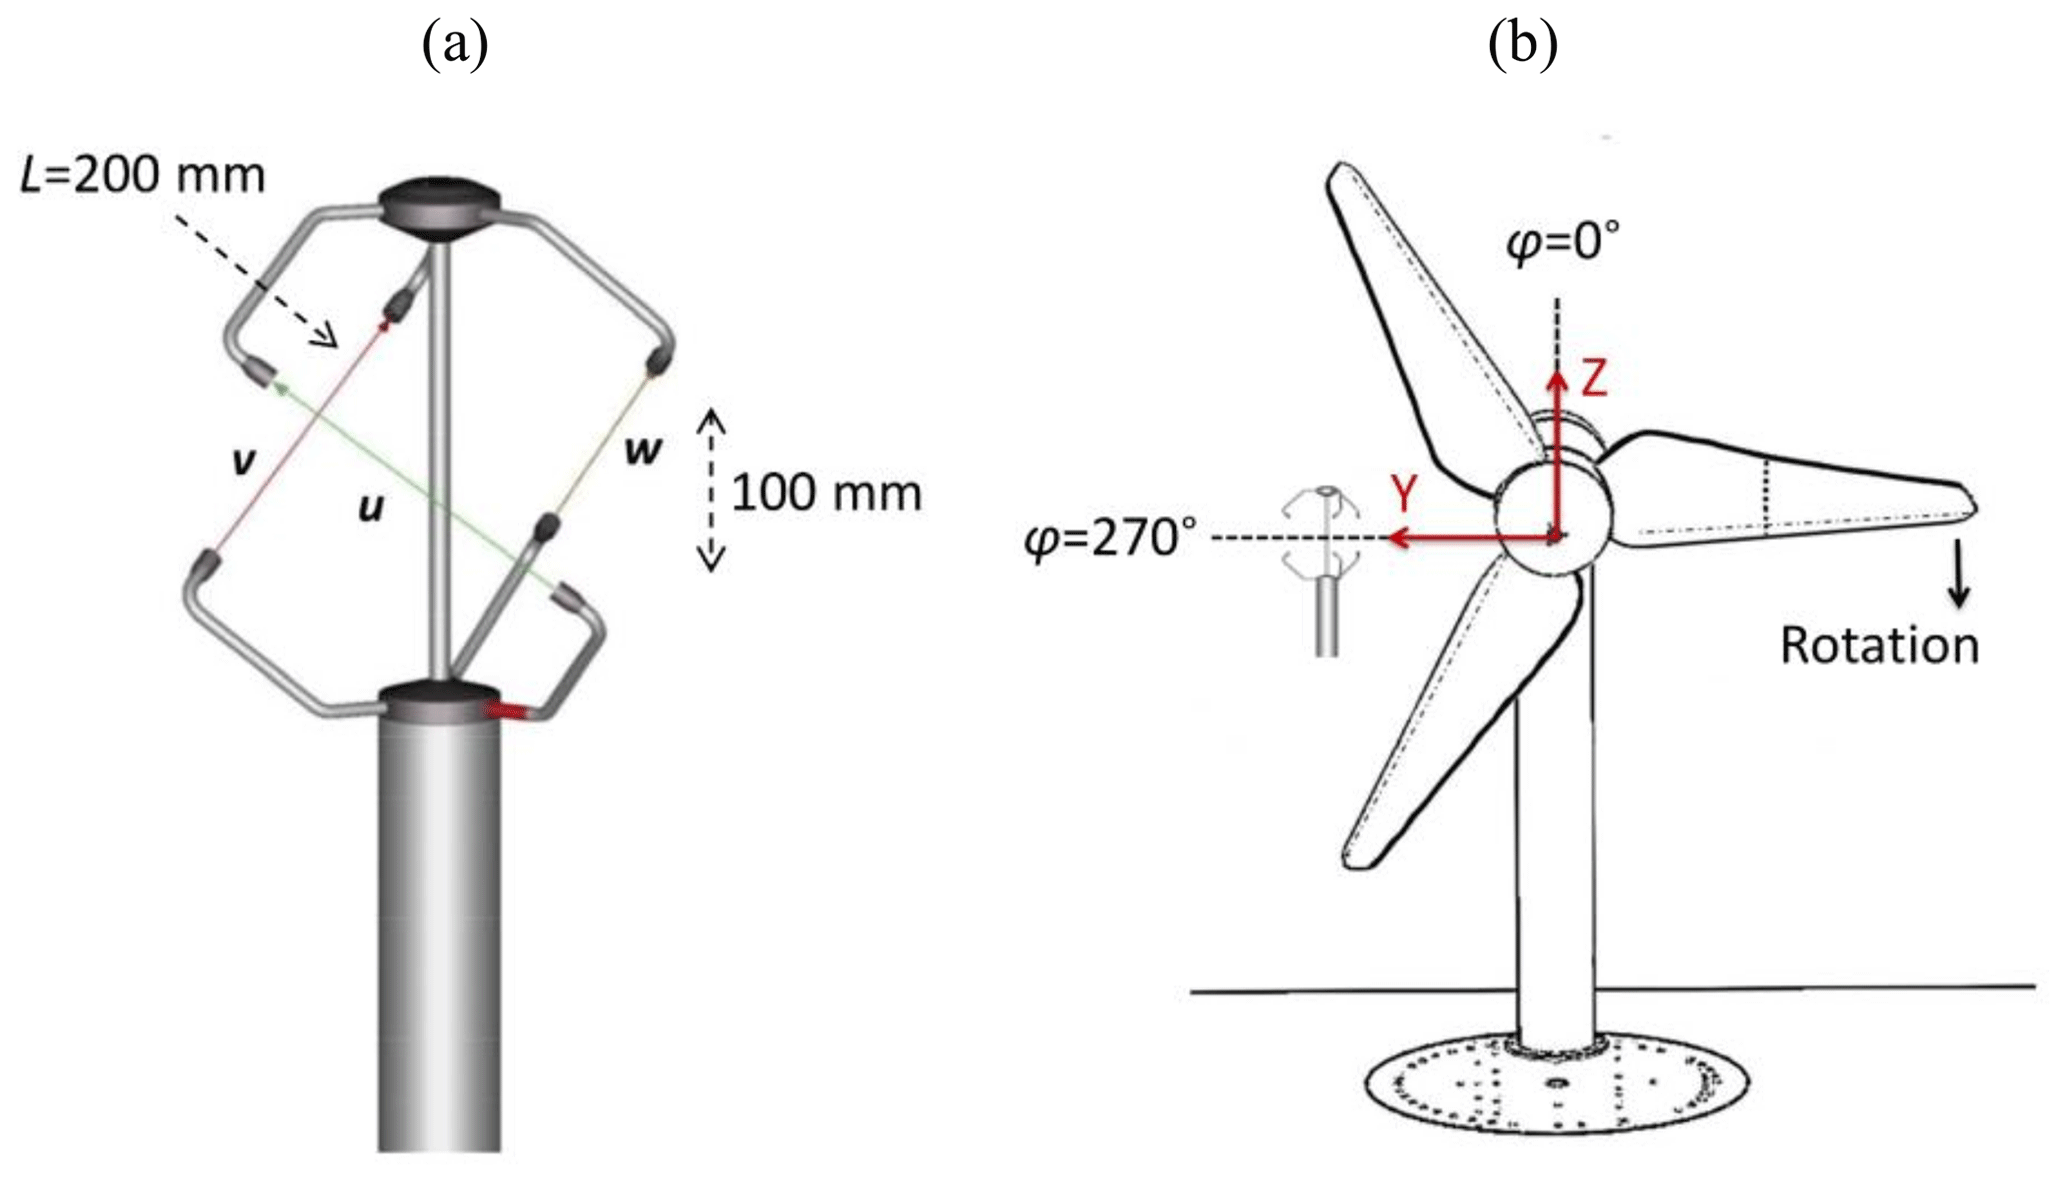
Figure 5(a) Ultrasonic anemometer, with permission from Thies CLIMA. (b) Definition of the azimuthal blade positions looking downstream.
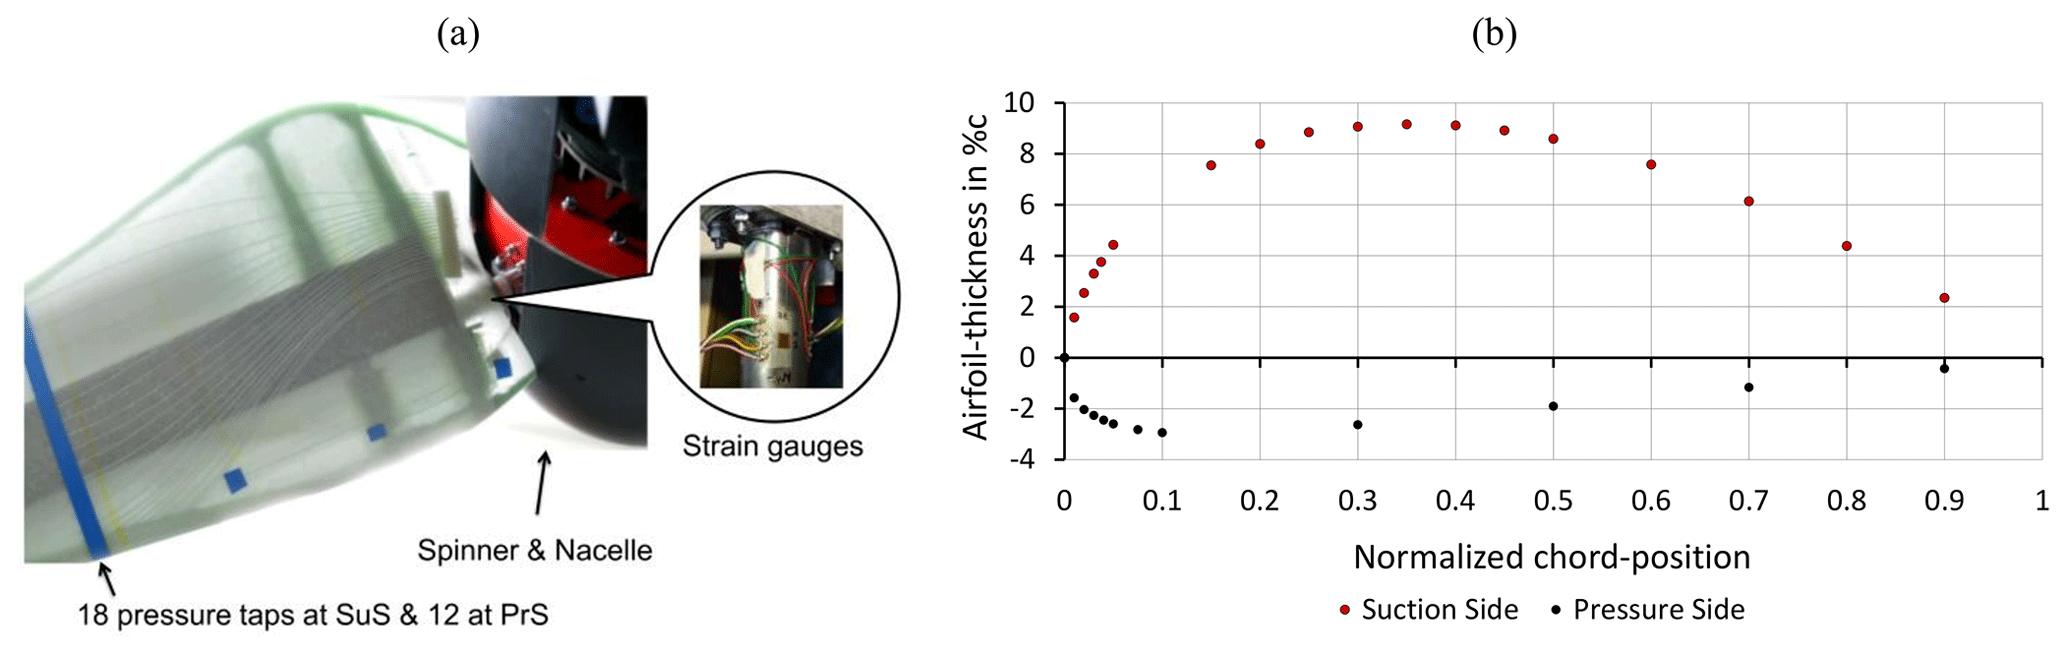
Figure 6(a) BeRT blade and pressure taps, with permission from SMART BLADE GmbH. (b) Chord-wise position of pressure taps at r= 0.45R.
Figure 5a displays the three separate acoustic transmitter–receiver pairs that are installed orthogonally to each other. The velocity vectors, u, v, and w, are determined by six individual measurements based on the bidirectional time-of-flight principle, i.e., the duration of each signal to be sent and received.
where L is the exact running length between each sensor pair so that the measurement volume amounts to . The velocity vectors v and w are determined accordingly. Equation (1) shows that the 3D velocity calculation depends solely on the average propagation time of the ultrasound, t1 and t2, depending on the specific airflow passing through the measurement volume. As such, the output values already imply the density and temperature of the air. Subsequently, the velocity vectors are transformed into a natural coordinate system so that the output time series consist of the axial, lateral, and vertical velocity components (u, v, and w). The device-internal data acquisition system is a half-duplex interface that is completely independent of both the wind tunnel and the BeRT system. According to the manufacturer, the measurement accuracy is 0.1 m s−1 per integrated value and 0.01 m s−1 with respect to each of the three velocity components. The data are recorded at a sampling rate of 60 Hz, thus providing around 3600 data points per measurement. Considering the relatively large measurement volume and the low sampling rate compared to, e.g., hot-wire or laser-based devices, the UA is not adequate for the investigation of complex or high-speed flow structures. However, the BeRT wake flow is expected to consist of an axial and a tangential velocity component due to the formation of a rotating wake tube. The impact of complex tip and root vortices is considered negligible in the midspan blade region, as shown by Herráez et al. (2018).
The UA is installed at one static position downstream, X= 1.3R; in the midspan region, Y= 0.56R; and at hub height, Z= 0R (see Fig. 5b). It is positioned vertically with a spirit level and turned around its own axis towards the undisturbed axial inflow so that the lateral and the vertical components, v and w, tend to 0. The setup is fixed at its final position for all measurements, which are presented in Sect. 3.
2.3.2 Pressure taps
The pressure distribution is extracted by means of 18 pressure taps (PTs) on the SuS and 12 on the PrS, located along the chord length at r= 0.45R (see Fig. 6b). Each orifice is connected via silicone tubing to its corresponding differential pressure sensor (HCL0025E), i.e., the pressure box inside the spinner. The sensor accuracy is given with 0.05 % of the full-scale range of ±2500 Pa under nominal conditions. The experimental procedure and the data postprocessing are based on Soto-Valle et al. (2020).
The differential pressure values are transformed into the pressure coefficient,
where
-
Δpsti is the static pressure difference between each PT and the inflow Prandtl tube,
-
prot refers to the pressure due to the rotation of the blade element (it is added to Δpsti in the form of a constant correction term in accordance with Hand et al., 2001);
-
pdyn,ref describes the referential dynamic pressure, i.e., the effective flow velocity experienced by the blade element (following Hand et al., 2001, it is determined by the maximum pressure that is recorded on the pressure side, the frontal stagnation point, where cpi= 1.0; according to Eq. 2 the referential dynamic pressure is then calculated with ).
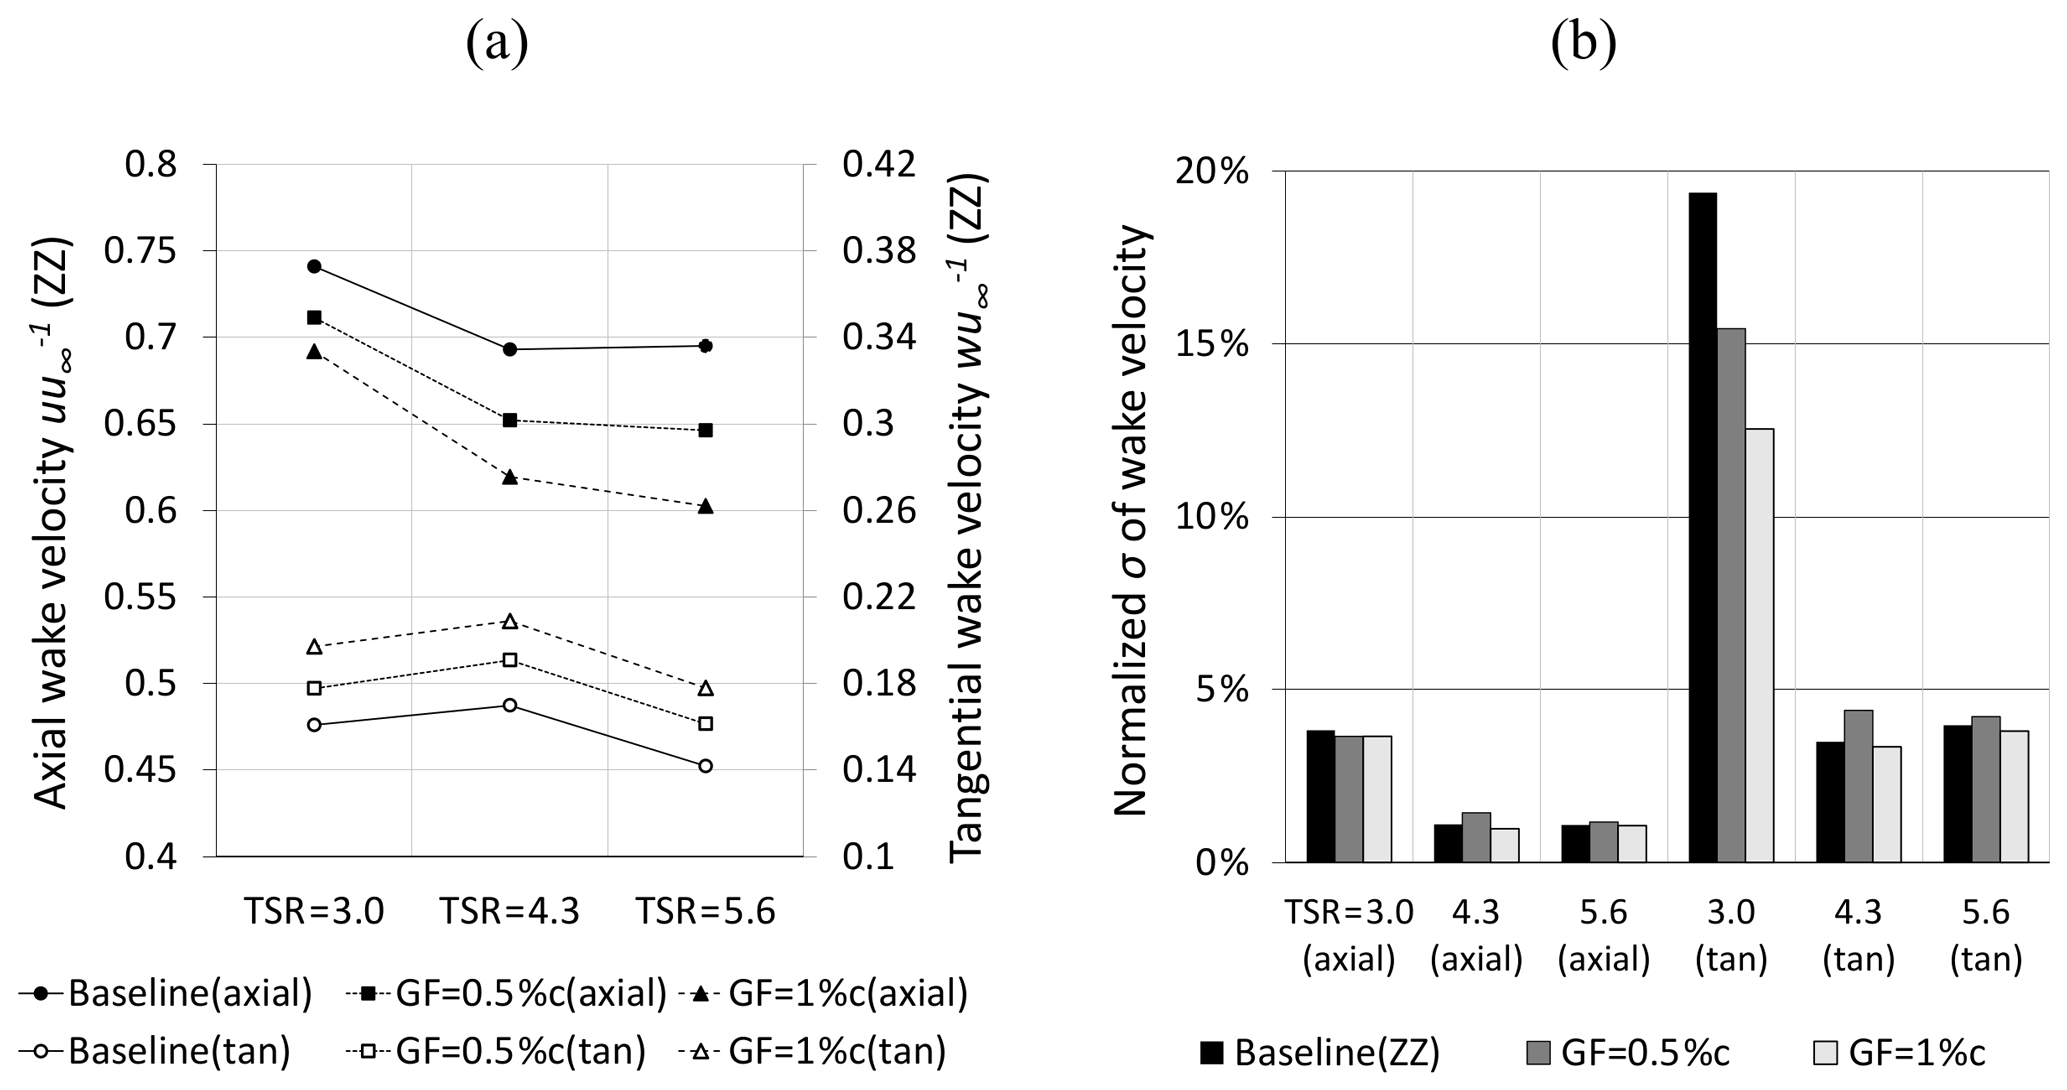
Figure 7Tripped case at r= 0.56R and φ= 270∘. (a) Mean axial and tangential (tan) wake velocity normalized by the inflow velocity. (b) Standard deviation of the wake velocity normalized by the average wake velocity.
The cp values are phase-averaged over an azimuthal angle of φ= 10∘ (see Fig. 5b). Each PT provides a total of 36 pressure values at the following blade positions: φ= [0, 10, 20 … 350∘] so that φ= 270∘ contains the average of all data points between 265∘ and 275∘. The pressure difference, Δcp, is calculated by subtracting the integrated cp distribution between the PrS and the SuS in order to determine both the normal coefficient, cn, and the tangential coefficient, ct. Per definition, cn is orthogonal to the chord line pointing towards the SuS, while ct is parallel to the chord line pointing towards the LE.
According to Hand et al. (2001), the axial and tangential coefficients are calculated with
and
where x and y are the normalized chord positions of each PT. The numbering starts at the TE (x= 0.9) with the PTs on the SuS, moving counterclockwise until the LE (x= 0) and back to the TE on the PrS.
Subsequently, the lift coefficient, cl, and the pressure drag coefficient, cdp, are determined by (Fuglsang et al., 1998)
and
The required AoAs, α, are adopted by the uncorrected inflow and wake velocity measurements (Sect. 3.1). At prestall conditions, i.e., considering small AoAs, ct ≪ cn so that cn≈cl (Barlow et al., 1999). It is noted that Eq. (6) describes the pressure drag, which does not account for the skin-friction drag component. Hence, it is not possible to extract the total drag, cd, of the blade element via the local cp distribution (Houghton et al., 2013).
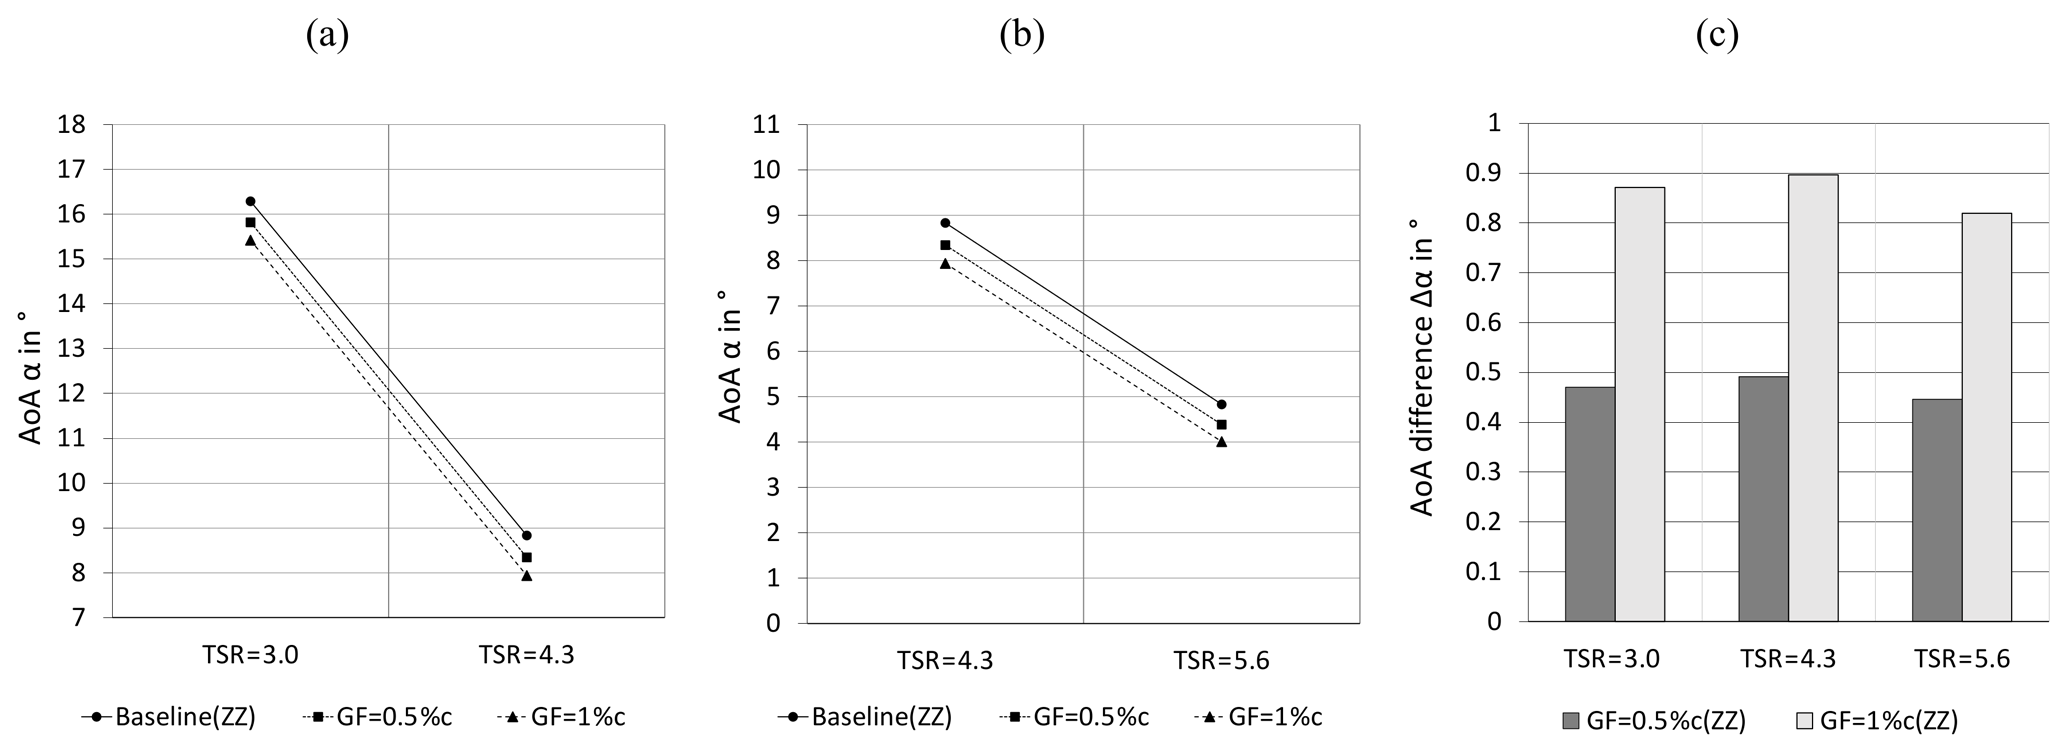
Figure 8Angles of attack in the tripped case at r= 0.56R and φ = 270∘. (a) Stall and rated conditions. (b) Rated and feather conditions. (c) AoA difference between Gurney flap configurations and the baseline.
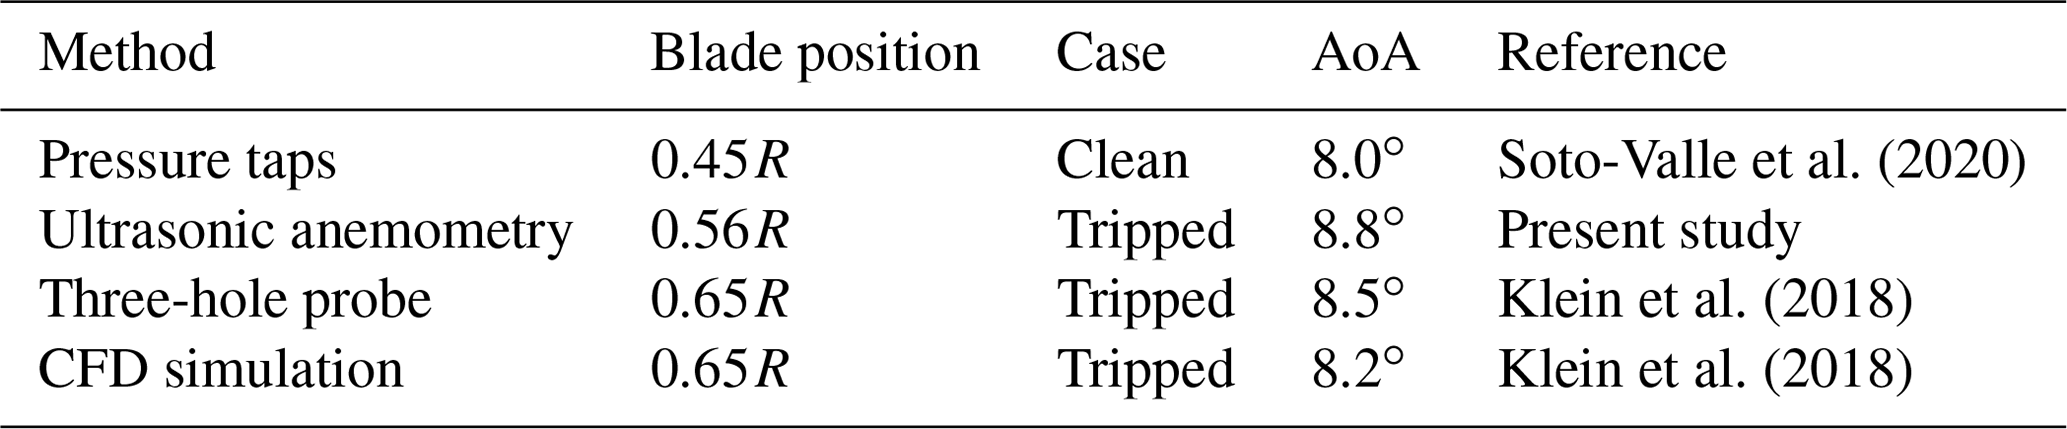
Table 4Comparison of approximate AoA results at rated conditions and φ= 270∘.
2.3.3 Strain gauges
The strain gauges (SGs) are mounted at the clamping of the blade detecting the root bending moments (RBMs) in the out-of-plane or flapwise and in-plane or edgewise direction (see Fig. 6a). They are connected in a full-bridge configuration aiming at the mitigation of temperature and cross-talk effects (FAET-A6194N-35). The experimental procedure to determine the RBMs is based on Bartholomay et al. (2018). For the purpose of the presented baseline measurements, a simplified postprocessing protocol is applied without including the data-based cross-talk correction.
Before testing each blade configuration, the offset signal is recorded in slow motion at the lowest rotating frequency available, frot= 0.1 Hz. In this way, the gravitational RBMs are subtracted from the results, which are otherwise registered as a sinusoidal signal in the edgewise direction. At operational frequencies, the axial forces due to the blade rotation are causing a material deformation directed towards the blade tip. They are quantified as a combination of centrifugal and gravitational forces by
where mblade= 5.67 kg, the center of gravity is located at rcg = 0.31R, g is the gravitational constant, and φ refers to each phase-locked blade position. The rotational frequency, ω, is kept constant during each test run so that the centrifugal force Fcent becomes a constant correction term at each OP. The effective flapwise and edgewise RBMs, which are related exclusively to the aerodynamic loads acting on the blade, are determined by
and
where
-
Mflap and Medge are the aerodynamic flapwise or edgewise RBMs in Nm;
-
Uf,raw and Ue,raw stand for the raw data signal in V;
-
Uf,off and Ue,off describe the slow-motion offset signal in V;
-
Kf1 and Ke1 refer to constant calibration factors to transform V into Nm;
-
Kf2 and Ke2 refer to constant calibration factors to transform the axial forces from N into Nm.
Applying Eqs. (8) and (9), both the out-of-plane and the in-plane RBMs are computed for each of the 36 blade positions (see Sect. 3).
The measurement results of both the tripped and the clean cases are presented and discussed. For space economy, the clean case is only presented in terms of the concluding results, such as the lift performance in Sect. 3.2 and the root bending moments in Sect. 3.3, but otherwise accessible in Appendix A for completeness.
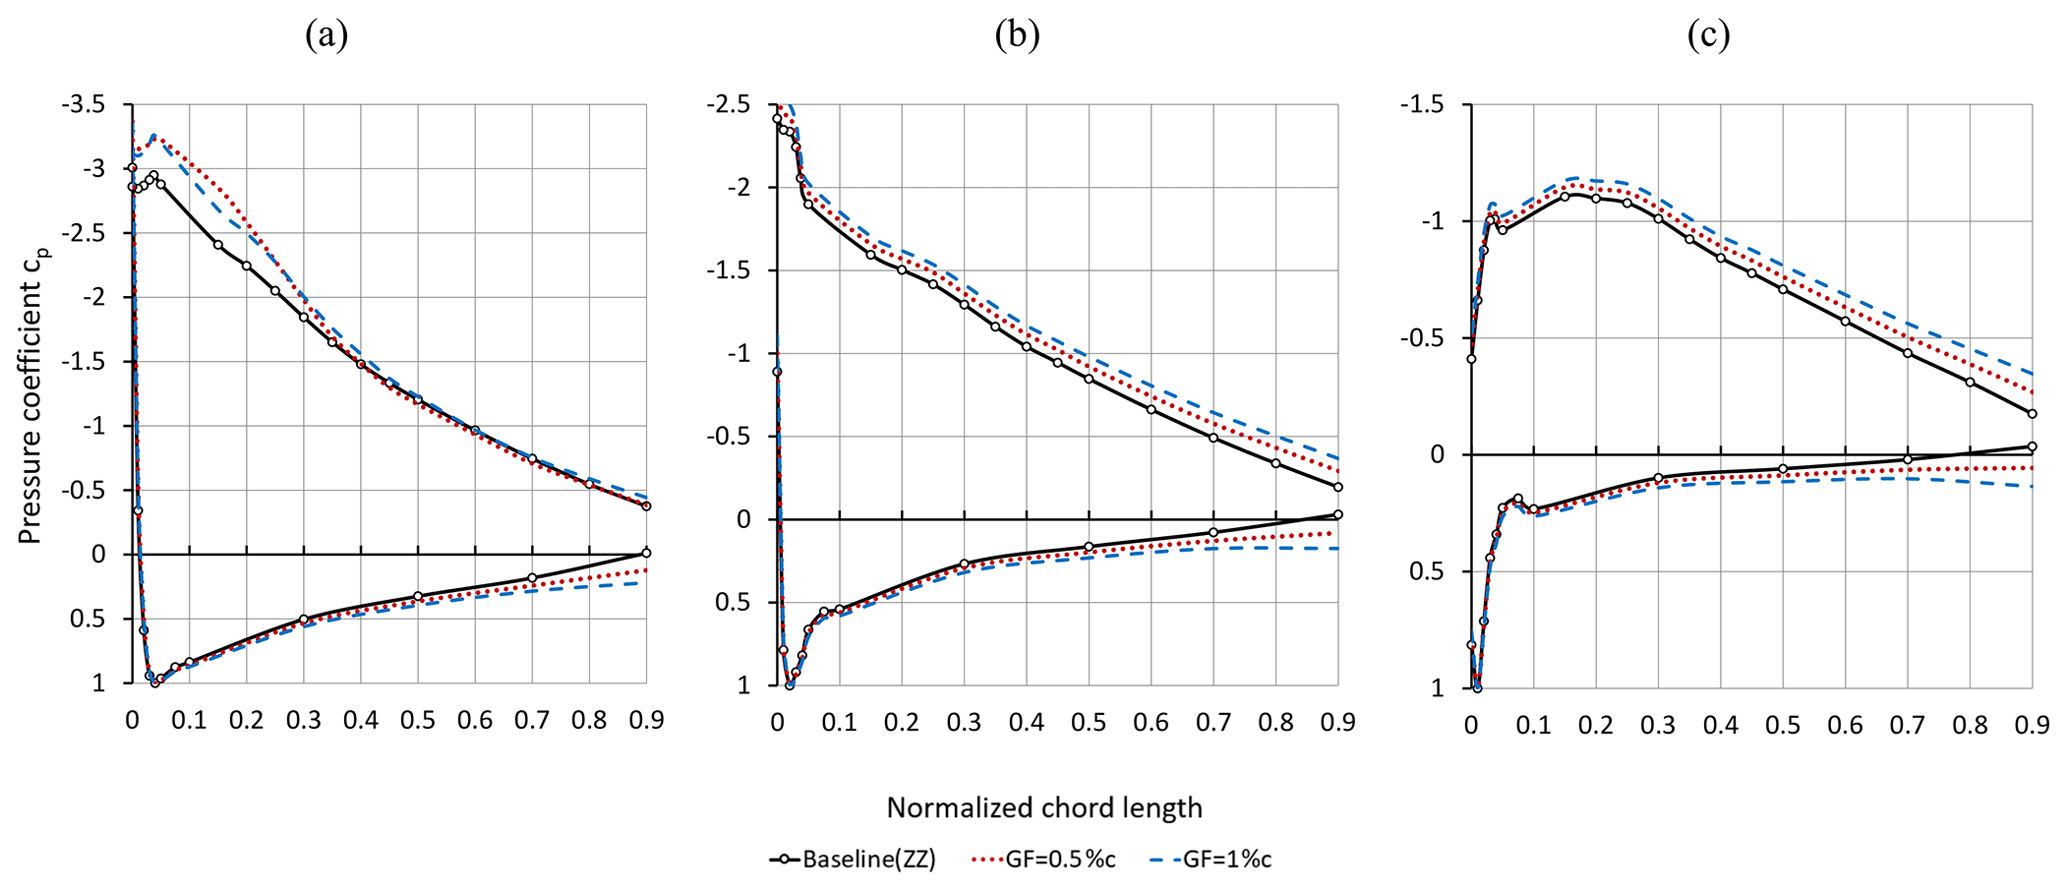
Figure 9Pressure coefficients in the tripped case with respect to different scales at r= 0.45R and φ= 270∘. (a) TSR = 3.0. (b) TSR = 4.3. (c) TSR = 5.6.
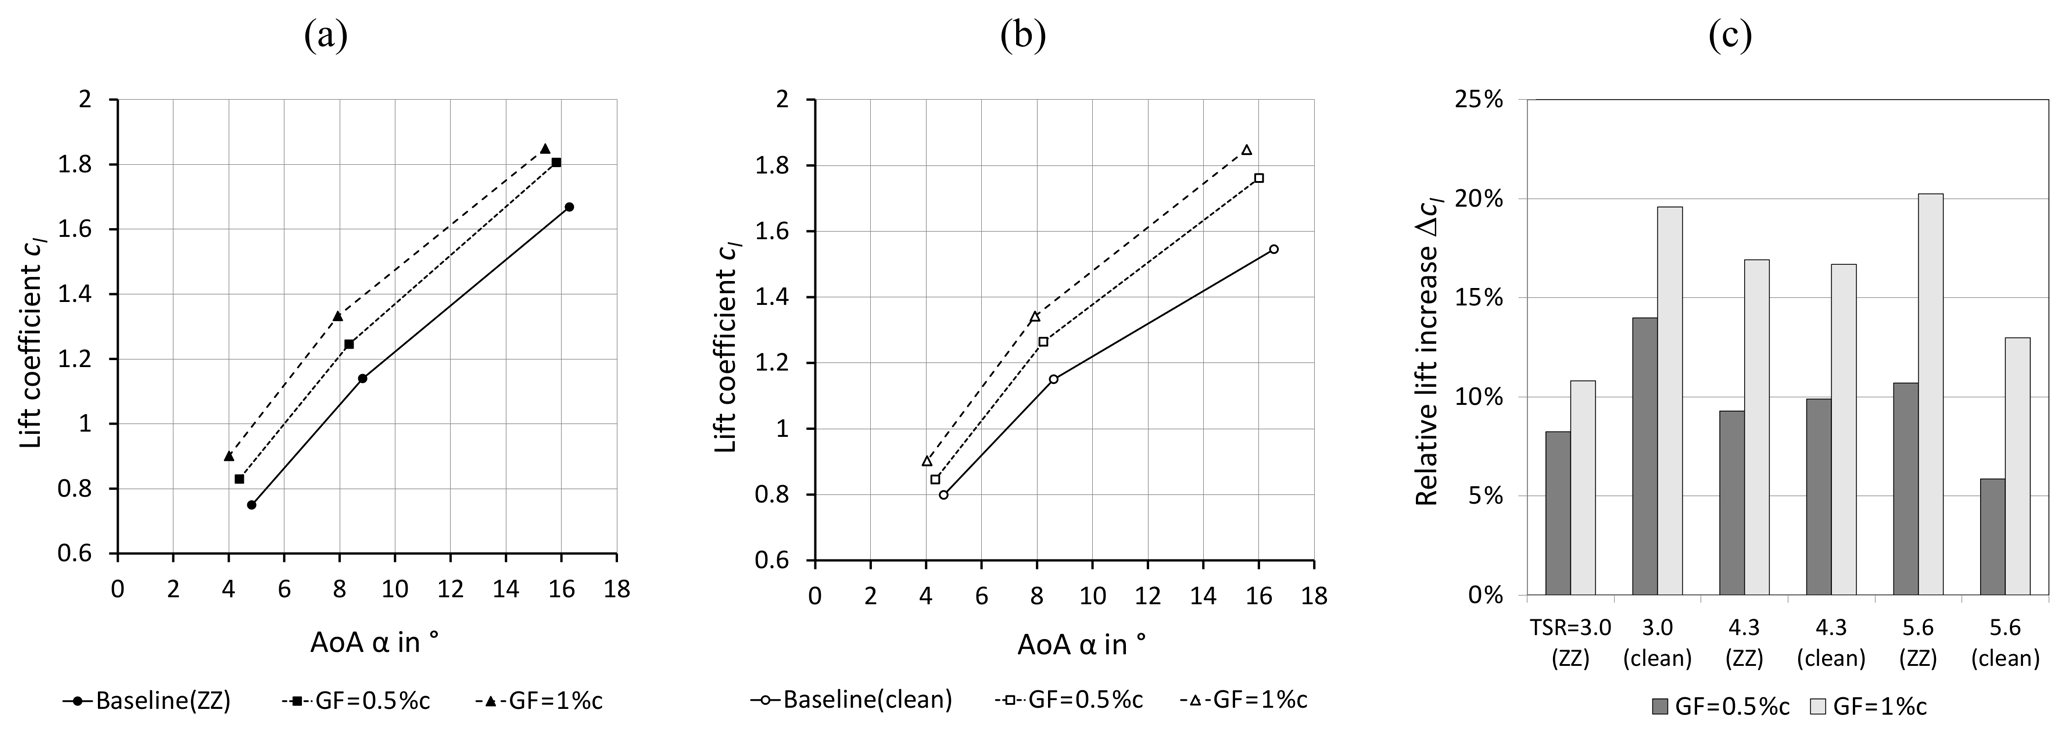
Figure 10Lift coefficients over angles of attack at r= 0.45R and φ= 270∘. (a) Tripped case. (b) Clean case. (c) Relative lift increase in Gurney flap configurations in relation to the corresponding baseline.
3.1 Wake velocities and angles of attack
Following Snel et al. (2009), Fig. 7a shows the average axial and tangential wake velocity normalized by the axial inflow velocity at each OP, uu and wu.
Starting from the baseline, Fig. 7a shows that the axial wake velocities are found to be significantly higher compared to typical free-flow conditions without wind tunnel walls. According to the steady-state blade element momentum (BEM) method, the optimum axial wake velocity is supposed to be around one-third of the inflow (Burton et al., 2011). In this case, it amounts to more than two-thirds at all OPs. This phenomenon is caused by the wind tunnel blockage effects, previously shown by CFD simulations using the fluid-dynamic code FLOWer. At rated conditions of the BeRT, Klein et al. (2018) conclude that the flow decelerates to an axial wake velocity in the range of 0.62u∞ < uCFD < 0.77u∞, which is in agreement with the experimental results, uexp= 0.69u∞. The corresponding tangential velocity, on the other hand, is similar to the steady-state BEM simulation of QBlade (Marten et al., 2013), with wBEM= 0.18u∞ compared to wexp= 0.17u∞. According to Eq. (11), w depends primarily on the rotational speed of the blade. The tangential wake velocity is therefore less affected by the wind tunnel blockage effect.
Regarding the impact of the GFs, Fig. 7a illustrates the consistent decrease in the axial and the consistent increase in the tangential wake velocity in relation to the GF height. The lateral velocity component is neglected as it amounts to . Figure 7b shows the standard deviation normalized by the corresponding average velocity component describing the 1D turbulence intensity, expressed in percent (Burton et al., 2011). As expected, the flow separation, TSR = 3.0, is captured by the UA in the form of a more turbulent wake field, especially regarding the tangential component. The GF configurations do not influence the wake turbulence considerably, except for the tangential velocity component at stall, where the GFs appear to mitigate the turbulence level.
According to the BEM method (Hansen, 2015), the wake velocity is converted into the axial and tangential rotor induction factors,
and
The induction factors, a and a′, describe the decrease in the axial and the increase in the tangential velocity component from a reference point sufficiently far away from the rotor plane rather than the rotor plane itself (Burton et al., 2011). The wake measurements are recorded at a distance of X= 1.3R downstream in order to avoid the influence of the wind tunnel contraction (see Fig. 3a).
Subsequently, the AoAs are derived by means of Eqs. (10) and (11) with
where the twist angle at the radial location of the UA is β(0.56R) = 9.8∘.
At rated conditions, the AoA of the baseline case is αZZ= 8.8∘ (see Fig. 8a and b). This outcome is in agreement with different experimental and numerical investigations of the BeRT, gathered in Table 4.
The relatively small deviations between the results are due to the different measurement methods as well as blade configurations (Table 4). The AoA is therefore considered constant in the midspan region within the range of 0.45. In all cases, the AoAs are significantly higher compared to the original blade design of the BeRT, αopt = 5.0∘.
Figure 8c displays the consistent AoA decrease caused by the GF configurations. The AoA differences between GF and baseline configurations amount to 0.5∘ and 0.9∘, i.e., to a level that is closer to the optimum blade operation. The results quantify an important effect of retrofit GFs on the blade performance: decreasing axial wake velocities and thus reduced AoA.
In Sect. 3.2, the AoAs are correlated with the normal-force coefficients in order to obtain the lift coefficients.
3.2 Pressure distribution and lift performance
Figure 9 shows the distribution of the pressure coefficients, cp, in relation to the different OPs.
The cp curves shown in Fig. 9b and c represent the prestall cases at 8.8∘ and 4.8∘, respectively. At stall (see Fig. 9a), the separation at the SuS is not yet complete despite the elevated AoA, 16.3∘. The curves indicate the effect of stall delay due to the blade rotation, as discussed hereafter.
The GF configurations cause an expansion of the pressure differences between the PrS and the SuS, Δcp, along the complete chord length and regarding all OPs. This effect is particularly visible in terms of the aft loading towards the TE at 0.5 < x < 0.9. The increased circulation due to the GF applications is reflected by Δcp, as reported by Storms and Jang (1994) based on the clean NACA 4412 airfoil (thmax= 12.0 %c, Re= 2.0×10⁶).
In order to quantify the results, the cp distribution is transformed into the local lift curve based on Eq. (5). The required AoAs are adopted from Sect. 3.1 so that the lift coefficients combine the results of both the wake velocity and the pressure measurements.
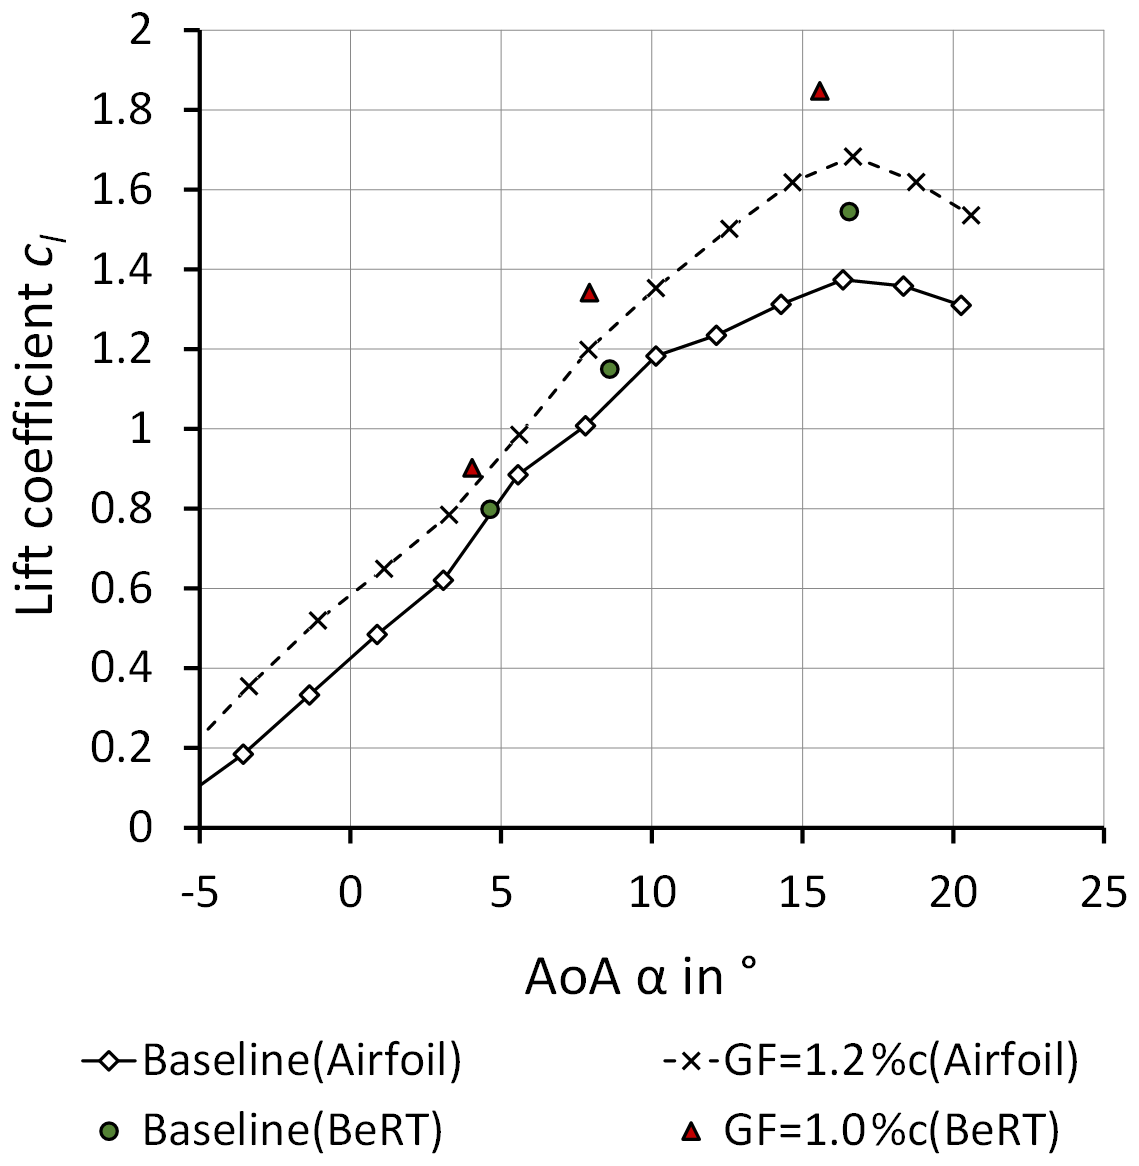
Figure 11Lift coefficients of the Clark-Y airfoil including Gurney flap, reproduced and modified from Kheir-Aldeen (2014).
Figure 10a and b depict the lift coefficients of both the tripped and the clean cases. Starting from the baseline, the tripped case shows smaller cl at 4∘ < α < 5∘ because of the forced BL transition at the LE. At 8∘ < α < 9∘, this is not the case anymore, while in the stall region, 15∘ < α < 17∘, the ZZ tape appears to develop a beneficial effect on the lift performance. This phenomenon is probably caused by the tripped and more turbulent BL that remains attached until it is closer to the TE. In the clean case, however, the less energetic BL separates earlier, thus leading to smaller cl at elevated AoA. This observation is confirmed by comparable airfoil experiments on the FX 63-137 airfoil section (thmax= 13.7 %c, Re= 2.0×10⁵) using ZZ tape with a thickness of 0.75 mm (Holst et al., 2016). Despite the decrease in the prestall, the lift coefficients are found at a similar level in the poststall region.
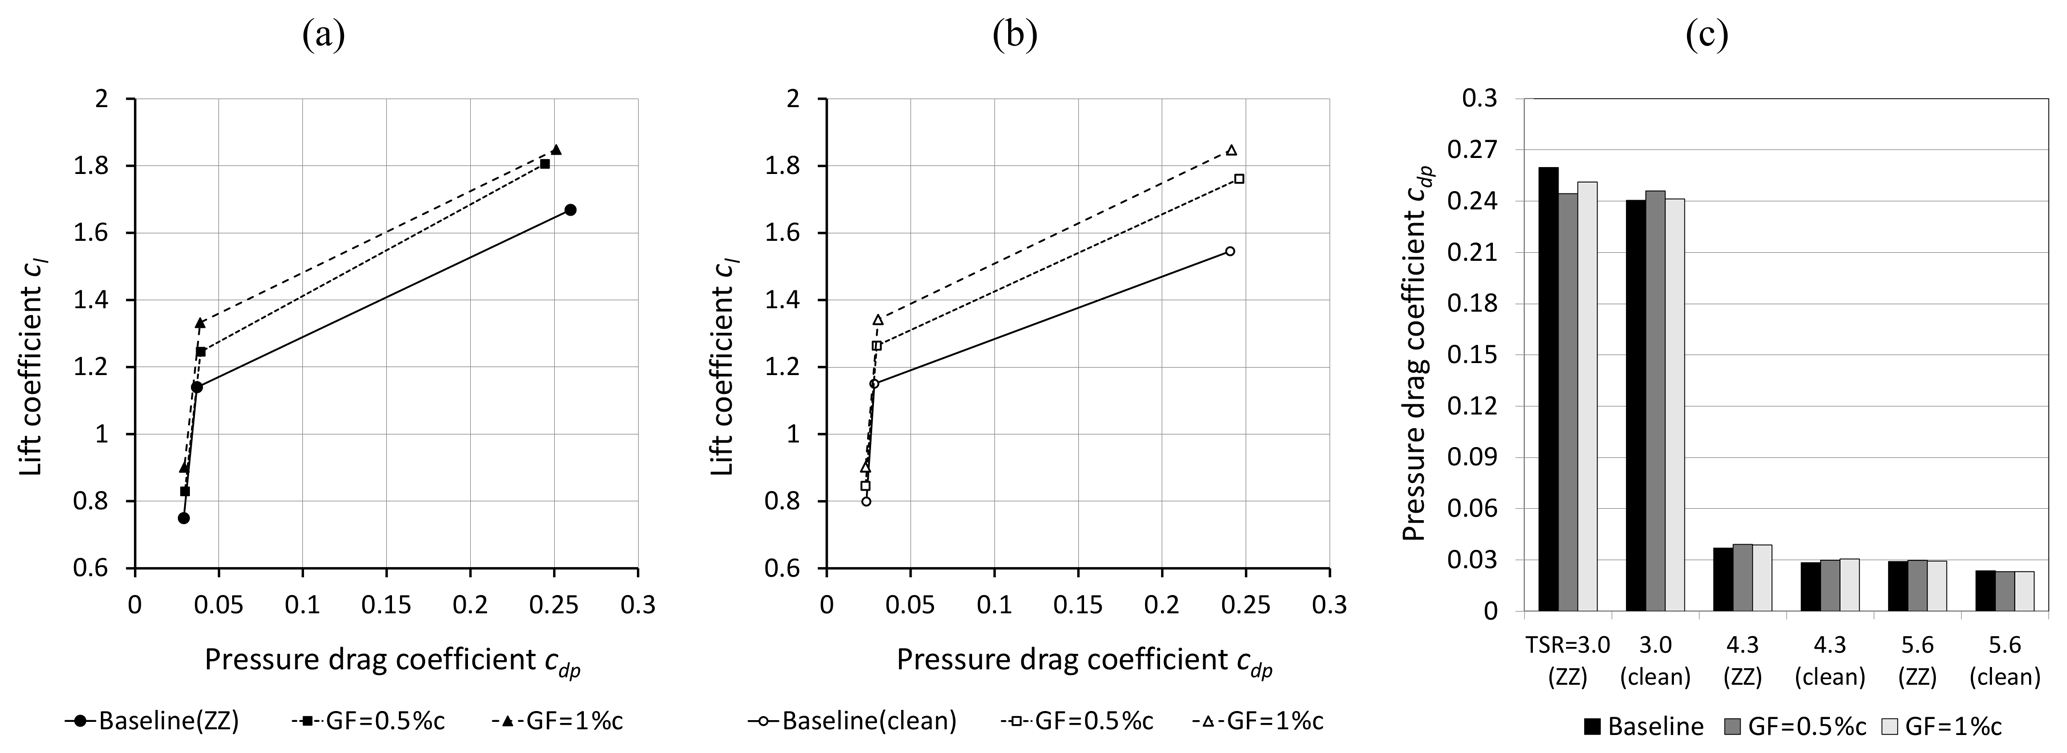
Figure 12Lift over pressure drag coefficients at r= 0.45R and φ = 270∘. (a) Tripped case. (b) Clean case. (c) Pressure drag coefficients in relation to the corresponding baseline.

Figure 13Flapwise and edgewise root bending moments in the tripped case. (a) TSR = 3.0. (b) TSR = 4.3. (c) TSR = 5.6.
Looking at the GF configurations, the cl performance in the tripped case is at a similar or even higher level considering the complete AoA range, 4∘ < α < 17∘. Hence, forced LE transition does not neutralize or mitigate the GF effect. In fact, the GF configurations appear to alleviate the adverse effects of forced LE transition by improving the local cl performance. Figure 10c highlights the relative lift increase, Δcl, between the GF and the corresponding baseline configurations. At rated conditions, TSR = 4.3, 0.11 or 9.3 %, and 0.19 or 16.9 %, illustrating the main characteristic of retrofit GFs: the considerable lift increase.
The level of both cl,baseline and is in agreement with comparable wind tunnel experiments based on a similar Clark-Y airfoil section, as depicted in Fig. 11.
Figure 11 compares the lift coefficients of the clean Clark-Y airfoil section (thmax= 14.0 %c, Re = 2.1×10⁵, GF = 1.2 %c) and the clean Clark-Y blade element of the BeRT (thmax= 11.9 %c, Re = 2.5×10⁵, GF = 1.0 %c). The results demonstrate similarities for both the baseline and the GF configurations. The elevated cl in the case of the BeRT are due to the thinner Clark-Y blade element. At cl,max, the blade performance is furthermore characterized by the radial flow due to the blade rotation causing stall delay. This behavior is in agreement with experiments on the field rotor at the Delft University of Technology. Van Rooij and Timmer (2003) report a significant shift of cl,max compared to 2D airfoil simulations.
For completeness, the lift over the pressure drag coefficients (Eq. 6) is displayed as an indicator of the drag performance. It is reiterated that cdp < cd, as previously discussed in Sect. 2.3.2.
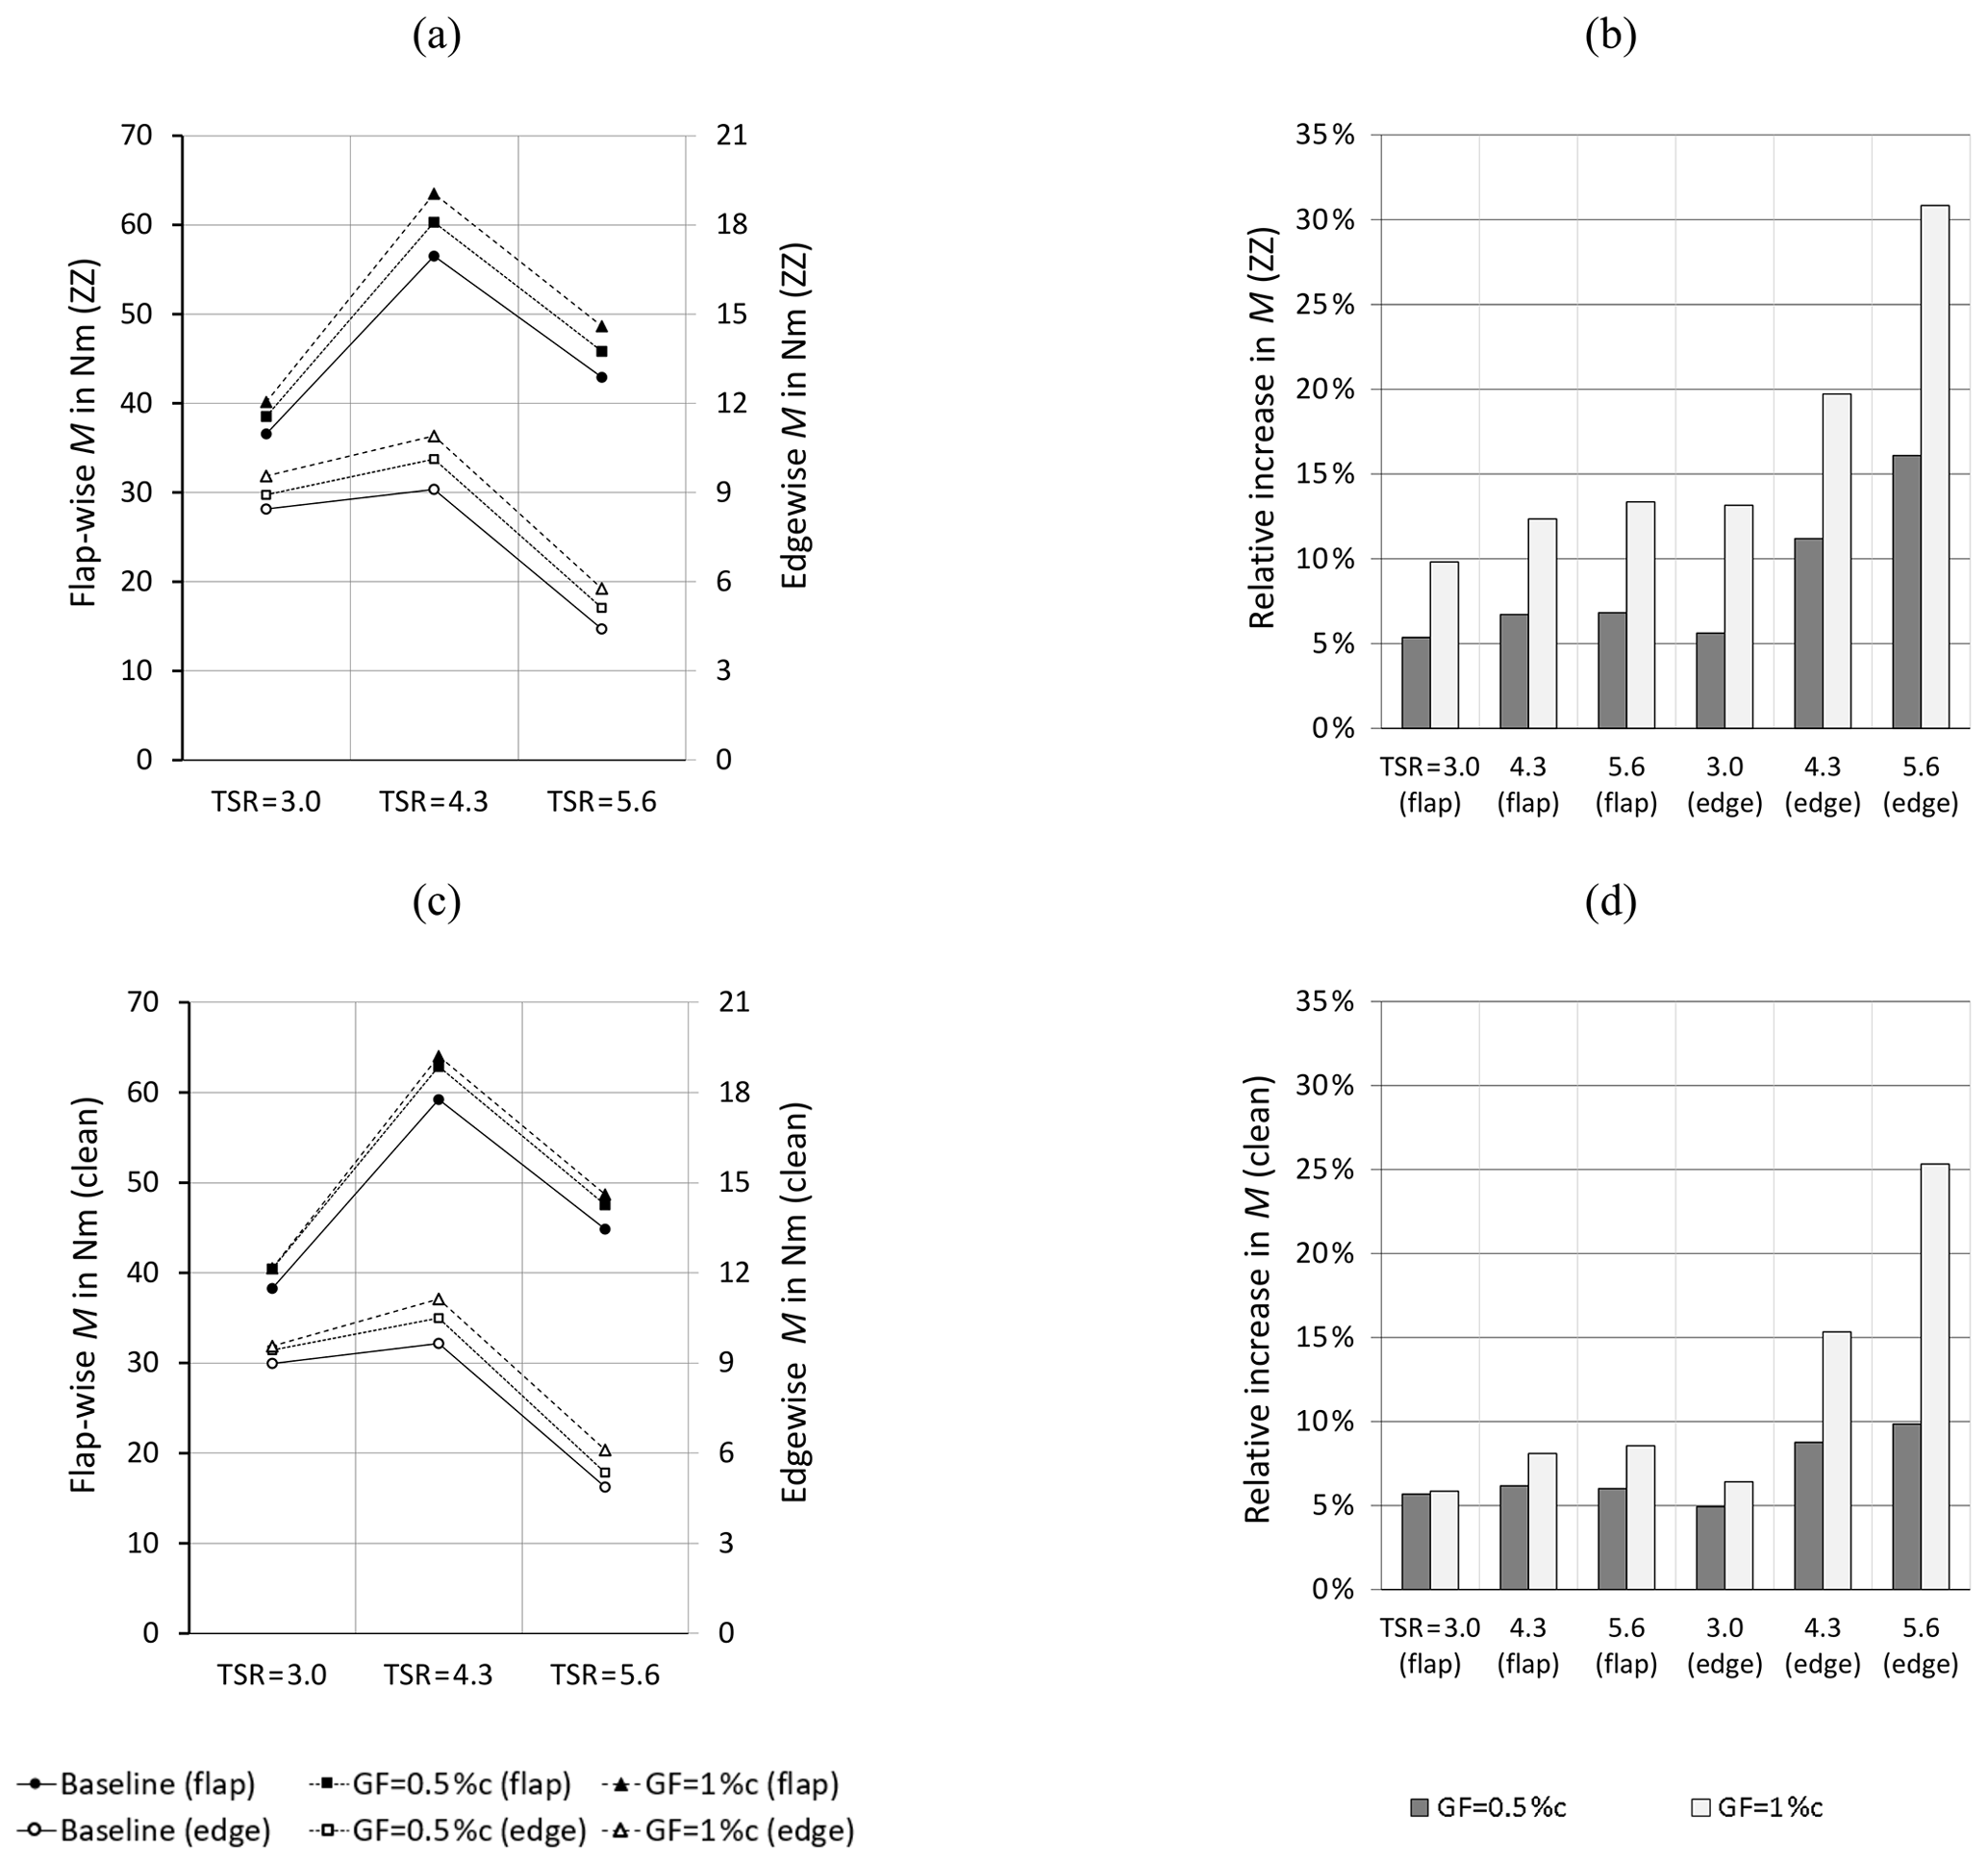
Figure 14Flapwise (flap) and edgewise (edge) root bending moments. (a) Tripped case. (b) Relative increase to tripped baseline. (c) Clean case. (d) Relative increase to clean baseline.
Figure 12a and b illustrate the dependency of cdp on the OP, reaching values of 0.024 < cdp,prestall < 0.04 and 0.25. In general, the baseline results are comparable to the clean S809 airfoil (thmax= 21.0 %c, Re = 3.0×10⁵) that is used for the NREL Phase VI test turbine (Hand et al., 2001). Figure 12c visualizes the increase in cdp in the tripped case due to the implementation of the ZZ tape. The GF configurations, on the other hand, influence the cdp values in a less noticeable way.
After evaluating one area of the midspan blade region, the impact of GFs over the complete blade span is presented in Sect. 3.3.
3.3 Root bending moments
The integration of the aerodynamic loads, i.e., the lift and the drag forces acting along the blade span, yields the RBMs. The in-plane or edgewise RBMs are proportional to the rotor torque and thus the mechanical power output. They are directly related to the out-of-plane or flapwise RBMs, which are proportional to the rotor thrust and thus the structural loads (Hansen, 2015).
Figure 13 displays the aerodynamic RBMs that are recorded over one blade revolution in the form of 36 phase-locked blade positions. The impact of the GF configurations is registered as an overall increase in both the flapwise and the edgewise RBMs. In order to quantify and to discuss the results, the RBMs are presented as average values for both the tripped and the clean cases.
The results of Fig. 14a confirm the increment of the average RBMs in relation to the GF height in accordance with Fig. 13. In the clean case, the overall trend is similar to the tripped case considering all OPs (see Fig. 14c). This means that the impact of the Gurney flaps, previously quantified in terms of the local lift coefficients, is now registered in the form of increased RBMs in both the flapwise and the edgewise direction.
In Fig. 14b, the performance of the GF configurations is quantified in relation to the tripped baseline. At rated conditions, the average increase in the flapwise RBMs amounts to 3.8 Nm or 6.7 % and to 7.0 Nm or 12.4 %. At the same time, the edgewise RBMs are enhanced by 1.0 Nm or 11.2 % and 1.8 Nm or 19.7 %. In the clean case (see Fig. 14d), the overall trend is similar though less pronounced. In both cases, the GF configurations generate performance improvements regarding the rotor torque, albeit at the expense of the inherent increase in the rotor thrust.
Overall, the results reinforce the observation that GFs are more effective in relation to the tripped compared to the clean baseline. Looking at the relative increase shown in Fig. 14b and d, the GF configurations appear to alleviate the effects of forced LE transition, especially on the edgewise RBMs, as previously discussed in Sect. 3.2 with respect to the local lift performance.
The aerodynamic impact of Gurney flaps is investigated on the rotor blades of the Berlin Research Turbine. The test matrix consists of the clean and the tripped baseline cases as well as two GF configurations of 0.5 %c and 1.0 %c. Three measurement methods are applied, including 3D ultrasonic anemometry, surface pressure taps, and strain gauges.
The baseline measurements confirm the influence of the prevailing wind tunnel blockage. At rated conditions, TSR = 4.3, and in the midspan blade region, the axial wake velocity is approximately double in comparison to ideal free-flow conditions without wind tunnel walls. The corresponding angle of attack is elevated in comparison to the optimum blade design and amounts to αexp= 8.8∘ rather than αopt= 5.0∘.
The impact of the Gurney flaps is registered regarding all blade configurations and operation points. In the tripped case and at rated conditions, the axial wake velocities are reduced, and the angles of attack are decreased by 0.5∘ and 0.9∘. At the same time, the local lift coefficients are enhanced by Δc 0.11 or 9.3 % and 0.19 or 16.9 %, which is the main characteristic of Gurney flaps. The effect of the aerodynamic loads over the complete blade span is analyzed by means of the root bending moments. The average increase in the out-of-plane direction amounts to 3.8 Nm or 6.7 % and to 7.0 Nm or 12.4 %. Simultaneously, the in-plane bending moments are elevated by 1.0 Nm or 11.2 % and 1.8 Nm or 19.7 %. Hence, decreasing angles of attack and increasing lift coefficients appear to be correlated with the enhancement of both the rotor torque and the thrust. Overall, the aerodynamic effect is found to be more pronounced in the tripped case compared to the clean case.
The experimental results demonstrate the potential of retrofit Gurney flaps to improve the rotor blade performance in the following ways:
-
decreasing angles of attack to a level that is closer to the optimum blade operation;
-
elevated lift forces compensating for the adverse effects of forced leading-edge transition.
In summary, Gurney flaps are considered a passive flow-control device worth investigating for the use on horizontal-axis wind turbines of different sizes. However, the design of the Gurney flap height in relation to the local boundary layer thickness is crucial in order to achieve performance improvements while avoiding detrimental effects such as additional drag forces. Future research is required to quantify the impact of Gurney flaps on dynamic loads, surface roughness, and the power output of rotor blades that operate in open-field conditions and at high Reynolds numbers.
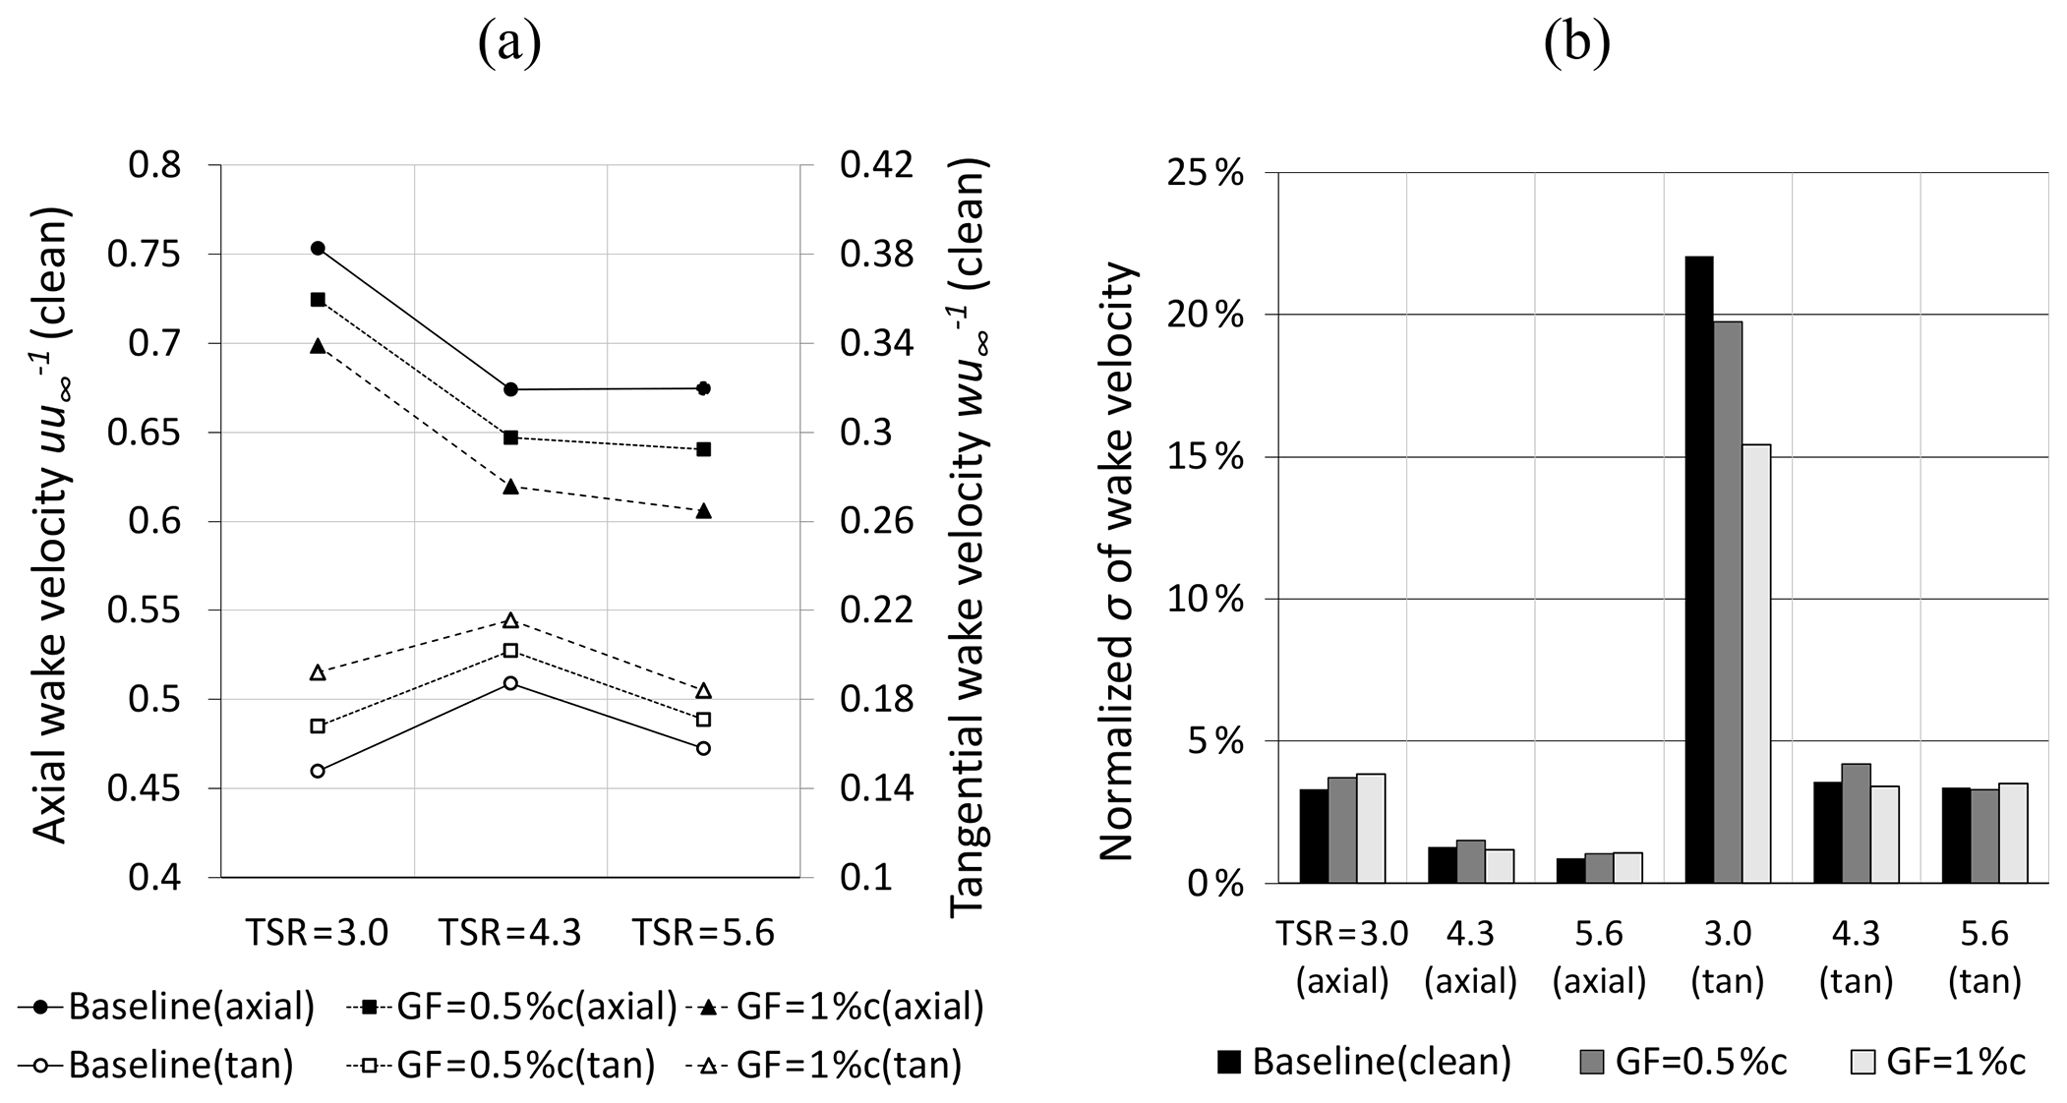
Figure A1Clean case at r= 0.56R and φ= 270∘. (a) Axial and tangential (tan) wake velocity normalized by the inflow velocity. (b) Standard deviation of the wake velocity normalized by the average wake velocity.
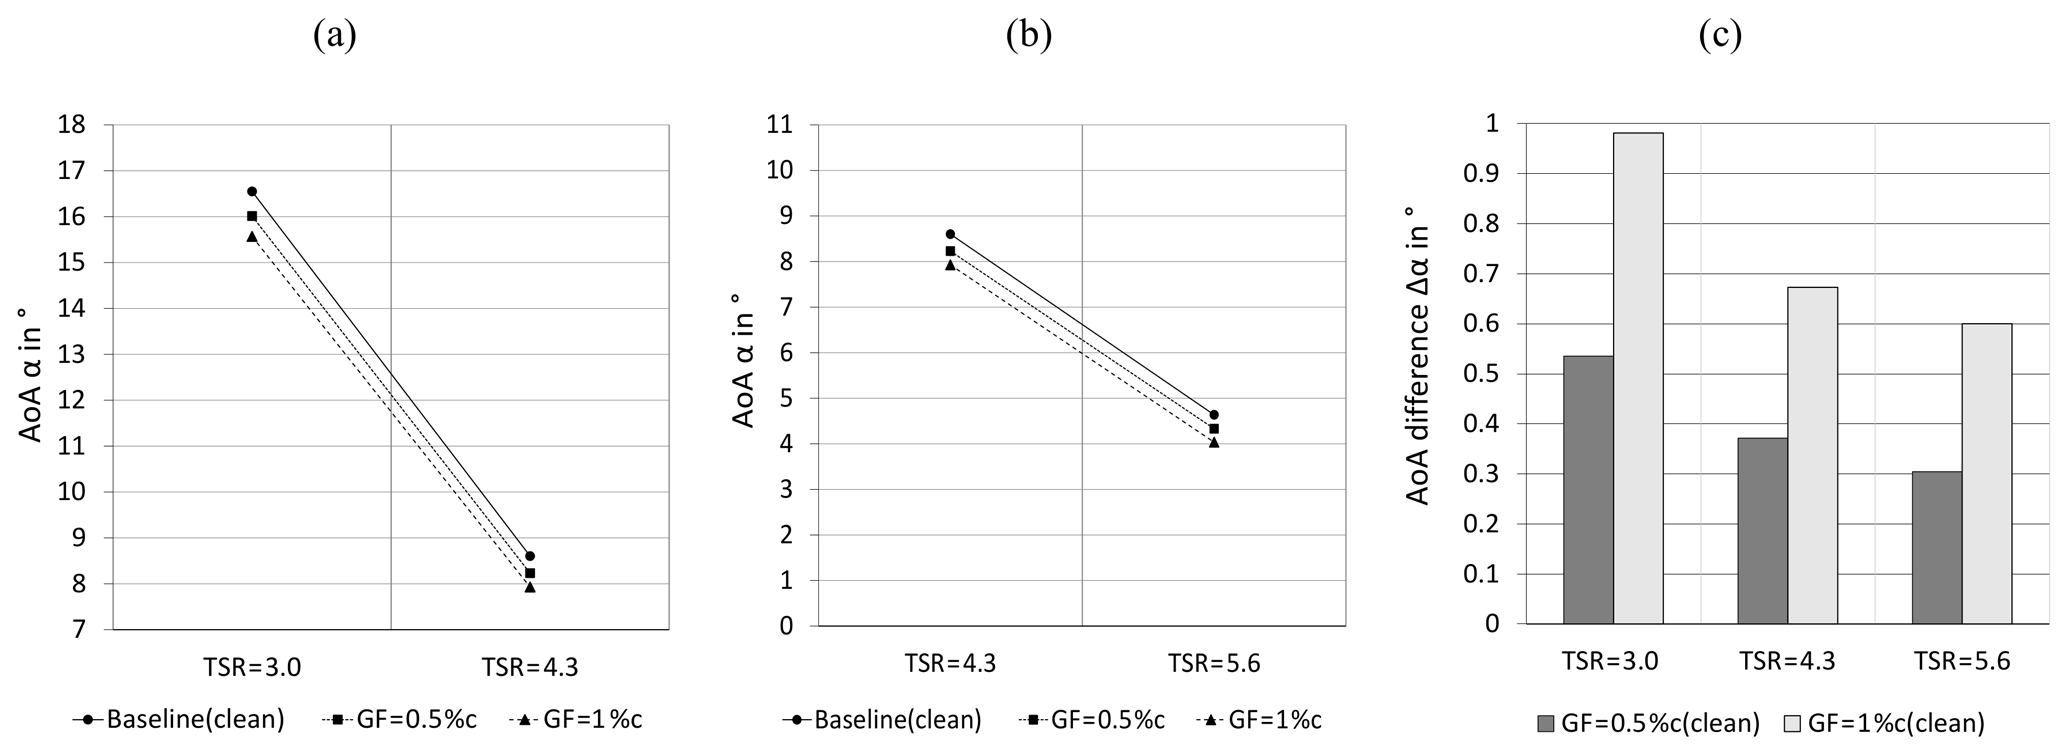
Figure A2Angles of attack in the clean case at r= 0.56R and φ= 270∘. (a) Stall and rated conditions. (b) Rated and feather conditions. (c) AoA difference between Gurney flap configuration and the baseline.
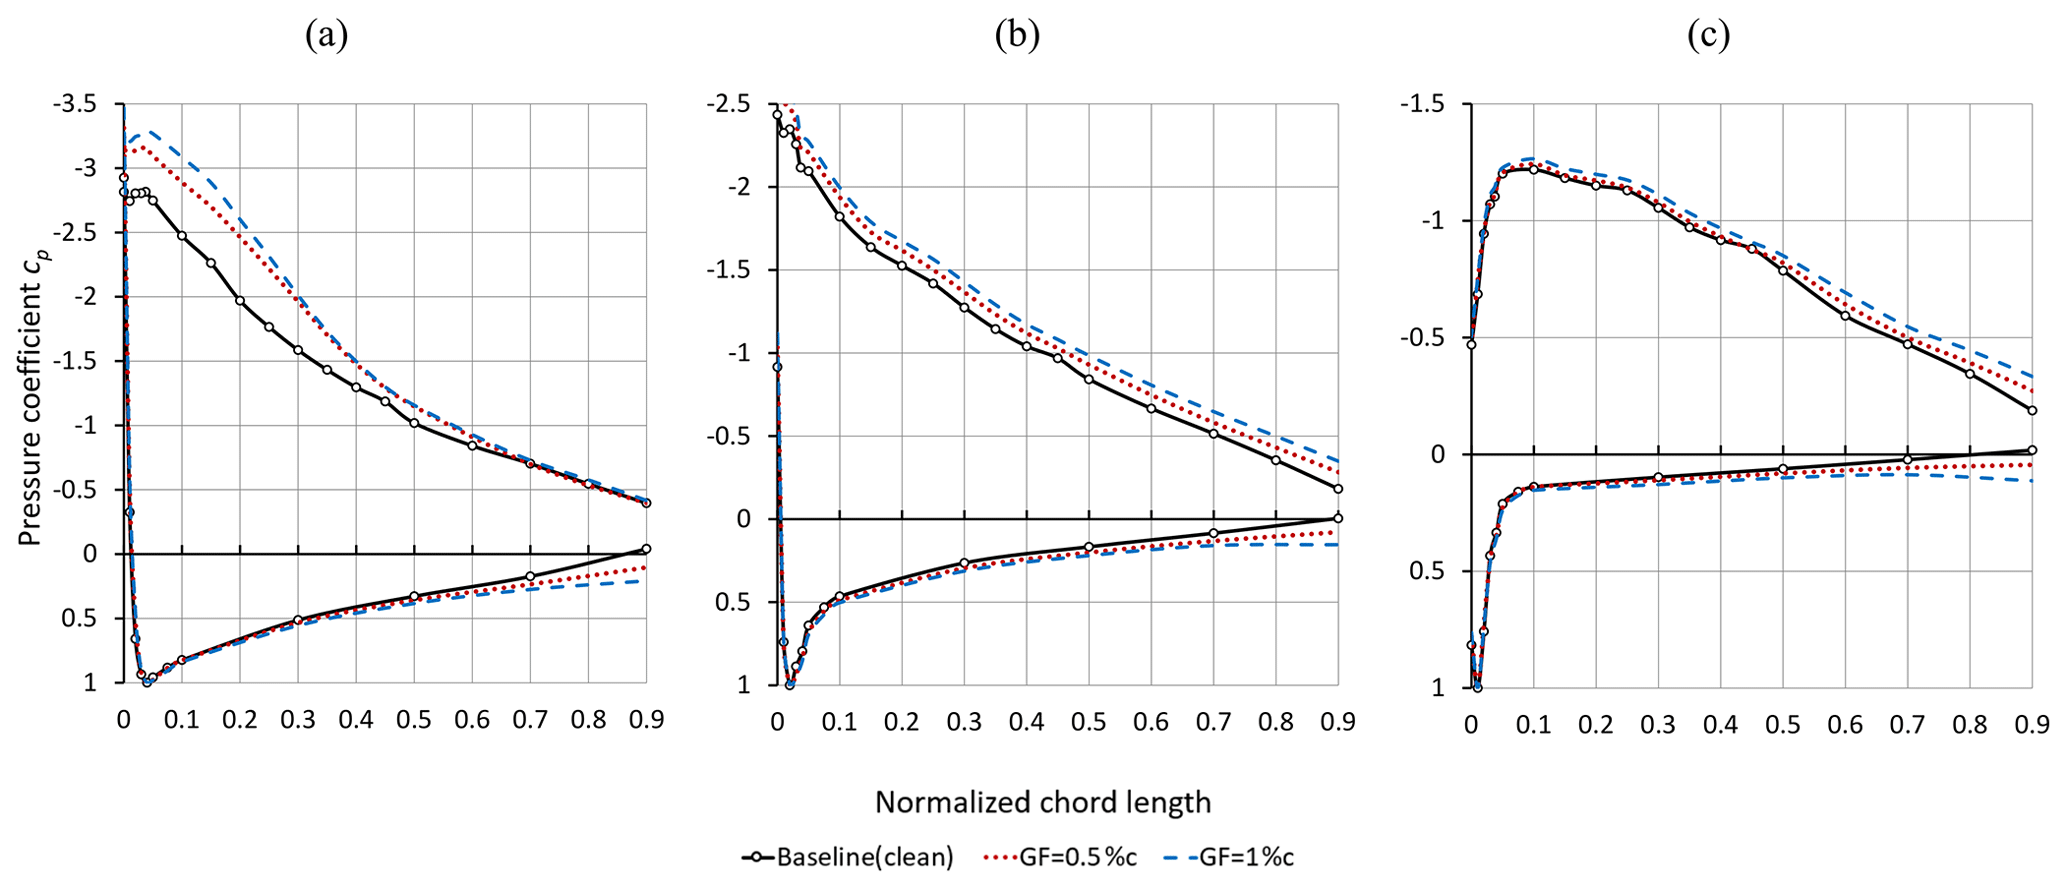
Figure A3Pressure coefficients in the clean case with respect to different scales at r= 0.45R and φ= 270∘. (a) TSR = 3.0. (b) TSR = 4.3. (c) TSR = 5.6.

Figure A4Flapwise and edgewise root bending moments in the clean case. (a) TSR = 3.0. (b) TSR = 4.3. (c) TSR = 5.6.
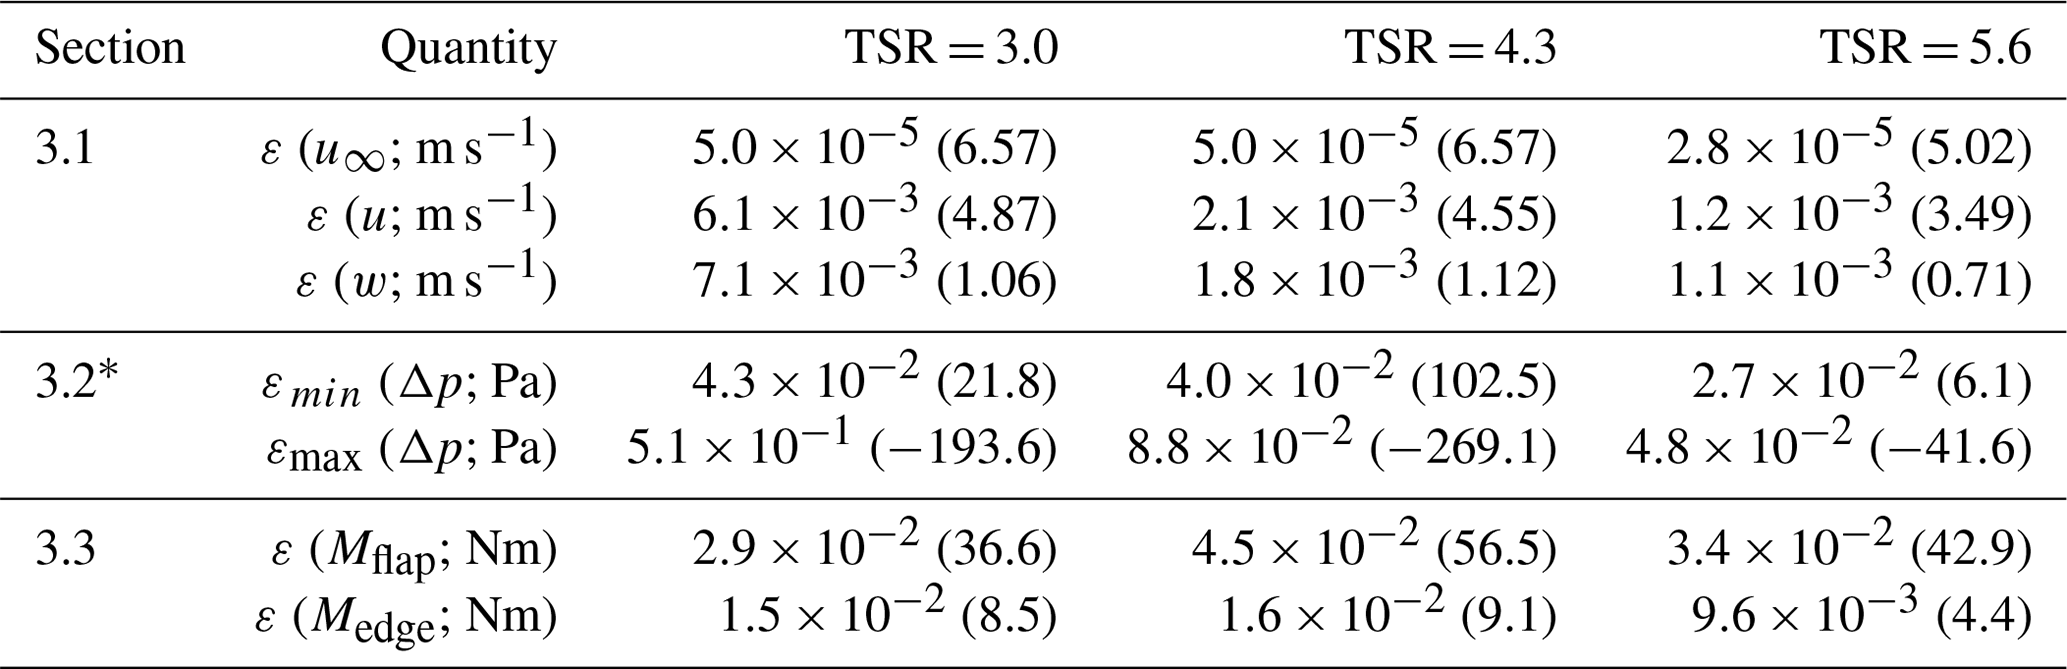
The experimental uncertainty of the raw results is expressed by means of the standard deviation,
where n is the number of samples, and refers to the average result. The values of σ are rounded up conservatively and are considered representative for both tripped and clean baseline cases as well as the GF configurations.
As expected, the scatter of both the velocity and the pressure data depends on the OP; i.e., it is higher at stall (TSR = 3.0; see Table B1). Looking at the RBMs, however, the experimental uncertainty of σ (Mflap) and σ (Medge) is influenced by the structural impact of the rotational frequency that the SGs register simultaneously to the aerodynamic forces. Overall, the standard deviation is not significantly influenced by either of the GF configurations.
Table B1Standard deviation and reference values in brackets.
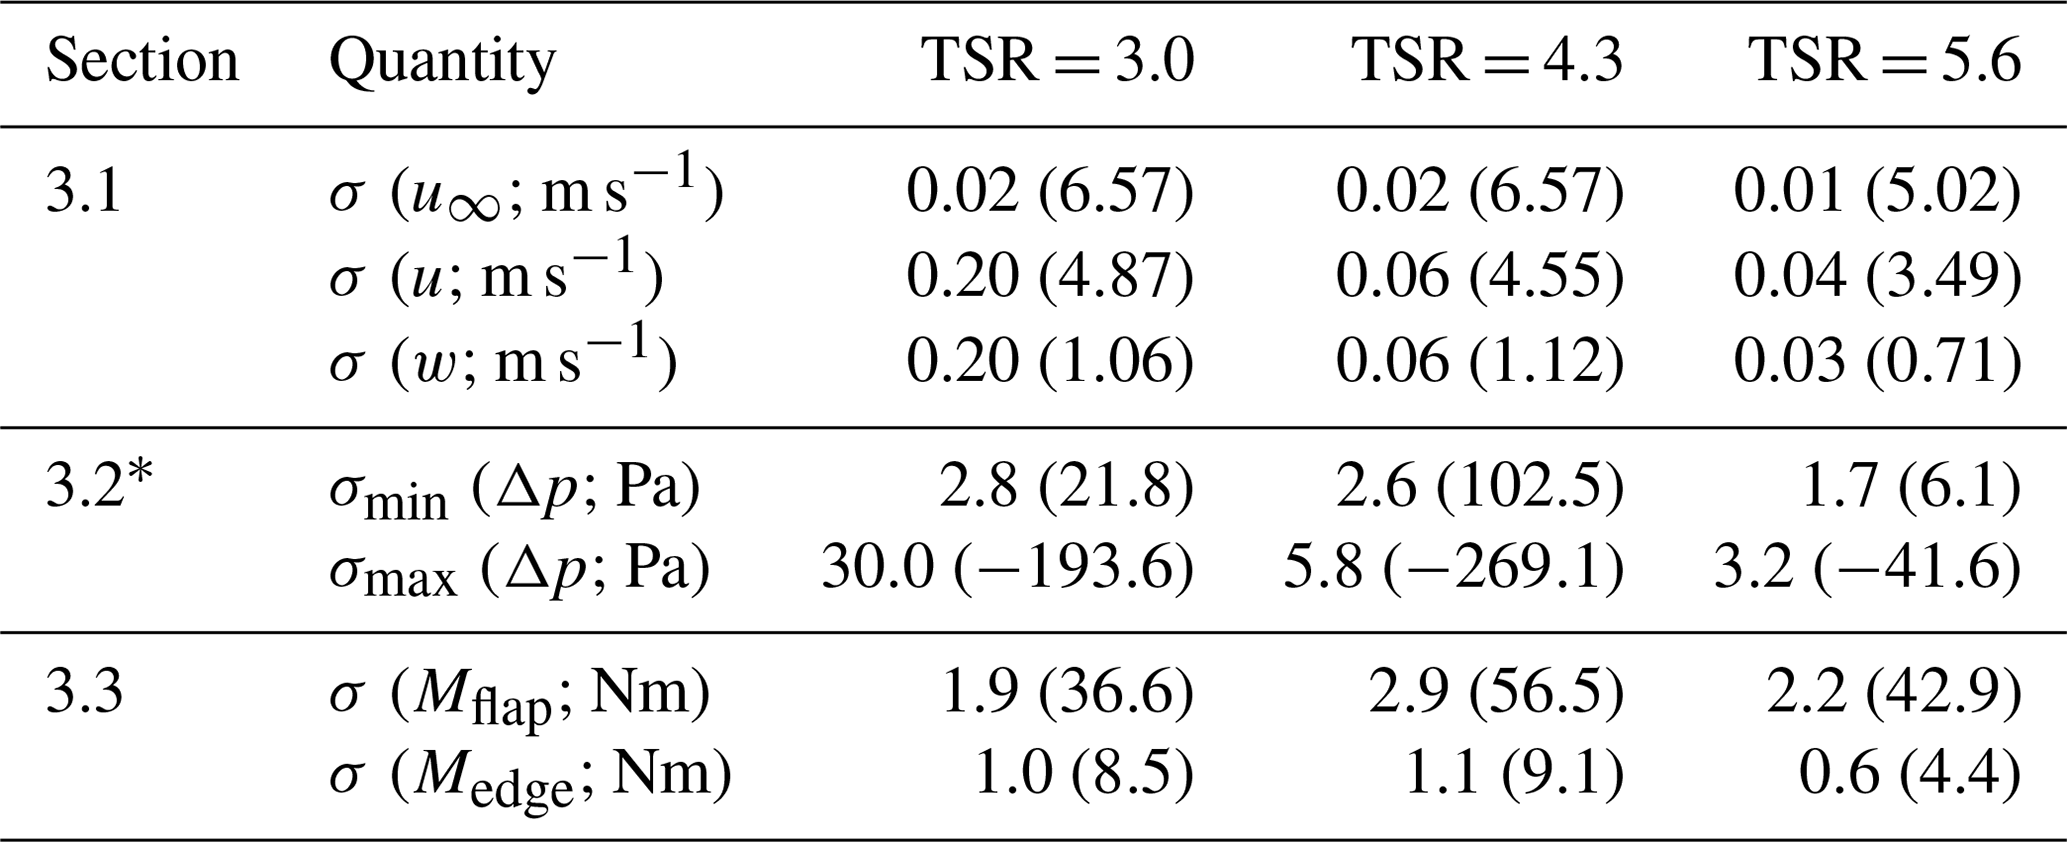
* Minimum and maximum standard deviation of pressure taps.
Table B2The 95 % confidence interval and reference values in brackets.
* Minimum and maximum confidence interval of pressure taps.
Subsequently, the 95 % confidence interval or so-called random error is computed with
where t is the Student's t distribution (Barlow et al., 1999).
The values of the 95 % confidence interval (see Table B2), are significantly smaller compared to those of the standard deviation (Table B1). The reason is the relatively large number of samples: in terms of the wake velocities, u and w, and per azimuthal angle in the remaining cases. Hence, the presented average results are contained by a reasonably small confidence interval.
Measurement data and results can be provided by contacting the corresponding author.
JA performed the wind tunnel experiments together with RSV counting on the support of all coauthors. JA processed the data and prepared the manuscript with the support of MM and RSV, both of whom contributed with important comments and suggestions to all sections of the paper.
The authors declare that they have no conflict of interest.
This article is part of the special issue “Wind Energy Science Conference 2019”. It is a result of the Wind Energy Science Conference 2019, Cork, Ireland, 17–20 June 2019.
The authors would like to acknowledge the constant support of the BeRT project by the researchers and the technicians of the Hermann-Föttinger Institut at the Technische Universität Berlin. The authors also appreciate the technical support of SMART BLADE GmbH. Rodrigo Soto-Valle would like to thank ANID PFCHA/Becas Chile-DAAD/2016-91645539 for the support. Marinos Manolesos would like to acknowledge the contribution of the EPSRC Supergen ORE Hub Early Career Researcher Research Fund.
This open-access publication was funded
by Technische Universität Berlin.
This paper was edited by Mingming Zhang and reviewed by Athanasios Barlas, Galih Bangga, and two anonymous referees.
Alber, J., Pechlivanoglou, G., Paschereit, C. O., Twele, J., and Weinzierl, G.: Parametric Investigation of Gurney Flaps for the Use on Wind Turbine Blades, in: Proceedings of the ASME Turbo Expo 2017, Turbomachinery Technical Conference and Exposition, Volume 9: Oil and Gas Applications, Supercritical CO2 Power Cycles, Wind Energy, Charlotte, North Carolina, USA, Paper GT2017-64475, https://doi.org/10.1115/GT2017-64475, June, 2017.
Bak, C., Zahle, F., Bitsche, R., Kim, T., Yde, A., Henriksen, L. C., Natarajan, A., and Hansen, M.: Description of the DTU 10 MW Reference Wind Turbine, Technical University of Denmark, DTU Wind Energy Report-I-0092, Denmark, June, 2013.
Barlow, J. B., Rae, W. H., and Pope, A.: Low-Speed Wind Tunnel Testing, John Wiley & Sons, 3rd edition, USA, https://doi.org/10.2514/2.633, 1999.
Bartholomay, S., Fruck, W. L., Pechlivanoglou, G., Nayeri, C. N., and Paschereit, C. O.: Reproducible Inflow Modifications for a Wind Tunnel Mounted Research HAWT, in: Proceedings of the ASME Turbo Expo 2017, Turbomachinery Technical Conference and Exposition, Volume 9: Oil and Gas Applications, Supercritical CO2 Power Cycles, Wind Energy, Charlotte, North Carolina, USA, Paper GT2017-64364, https://doi.org/10.1115/GT2017-64364, June, 2017.
Bartholomay, S., Marten, D., Martínez, M. S., Alber, J., Pechlivanoglou, G., Nayeri, C. N., Paschereit, C. O., Klein, A. C., Lutz, T., and Krämer, E.: Cross-Talk Compensation for Blade Root Flap- and Edgewise Moments on an Experimental Research Wind Turbine and Comparison to Numerical Results, in: Proceedings of the ASME Turbo Expo 2018, Turbomachinery Technical Conference and Exposition, Volume 9: Oil and Gas Applications, Supercritical CO2 Power Cycles, Wind Energy, Oslo, Norway, Paper GT2018-76977, https://doi.org/10.1115/GT2018-76977, June, 2018.
Bechert, D. W., Meyer, R., and Hage, W.: Drag reduction of airfoils with miniflaps – Can we learn from dragonflies?, AIAA Fluids 2000 Conference and Exhibit, Denver, USA, Paper 2000-2315, https://doi.org/10.2514/6.2000-2315, June, 2000.
Burton, T., Jenkins, N., Sharpe, D., and Bossanyi, E.: Wind Energy Handbook, 2nd edition, John Wiley & Sons Ltd, West Sussex, UK, https://doi.org/10.1002/9781119992714.ch7, 2011.
Cuerva, A., Tejero, Sanz-Andrés, A., and Navarro, J.: On multiple-path sonic anemometer measurement theory, Exp. Fluids, 34, 345–357, https://doi.org/10.1007/s00348-002-0565-x, 2003.
Drela, M.: XFOIL: An Analysis and Design System for Low Reynolds Number Airfoils, in: Mueller, T. J.: Low Reynolds Number Aerodynamics, Lecture Notes in Engineering, vol 54. Springer, Berlin, Heidelberg, https://doi.org/10.1007/978-3-642-84010-4_1, 1989.
Fuglsang, P., Antoniou, I., Sørensen, N., Aagaard, M., and Helge, A.: Validation of a wind tunnel testing facility for blade surface pressure measurements, Forskningscenter Risoe, Risoe-R, No. 981(EN), Denmark, 1998.
Giguère, P., Lemayt, J., and Dumas, G.: Gurney flap effects and scaling for low-speed airfoils, in: 13th AIAA Applied Aerodynamics Conference, San Diego, USA, Paper 1995-1881-CP, https://doi.org/10.2514/6.1995-1881, 19–25 June, 1995.
Gruschwitz, E. and Schrenk, O.: A simple method for increasing the lift of airplane wings by means of flaps, National Advisory Committee, N.A.C.A. Technical Memorandum, No. 714, Washington, USA, 1933.
Hand, M., Simms, D., Fingersh, L., Jager, D., Cotrell, J., Schreck, S., and Larwood, S.: Unsteady Aerodynamics Experiment Phase VI: Wind Tunnel Test Configurations and Available Data Campaigns, National Renewable Energy, NREL/TP-500-29955, USA, https://doi.org/10.2172/15000240, December, 2001.
Hansen, M. O. L.: Aerodynamics of Wind Turbines, 3rd edition, Earthscan from Routledge, Taylor & Francis Group, London, UK, https://doi.org/10.4324/9781315769981, 2015.
Herráez, I., Daniele, E., and Schepers, J. G.: Extraction of the wake induction and angle of attack on rotating wind turbine blades from PIV and CFD results, Wind Energ. Sci., 3, 1–9, https://doi.org/10.5194/wes-3-1-2018, 2018.
Holst, D., Pechlivanoglou, G., Kohlrausch, C. T., Nayeri, C. N., and Paschereit, C. O.: sHAWT Design: Airfoil Aerodynamics Under the Influence of Roughness, in: Proceedings of the ASME Turbo Expo 2016, Turbomachinery Technical Conference and Exposition, Volume 9: Oil and Gas Applications, Supercritical CO2 Power Cycles, Wind Energy, Seoul, South Korea, Paper GT2016-56377, https://doi.org/10.1115/GT2016-56377, June, 2016.
Houghton, E. L., Carpenter, P. W., Collicott, S. H., and Valentine, D. T.: Aerodynamics for Engineering Students, 6th edition, Elsevier Ltd., Oxford, UK, https://doi.org/10.1016/C2009-0-63882-4, 2013.
Kentfield, J.: The Influence of Free-Stream Turbulence Intensity on the Performance of Gurney-Flap Equipped Wind-Turbine Blades, Wind Engineering, 1996.
Kheir-Aldeen, M. and Hamid, A.: Experimental Study to the Effect of Gurney Flap on the Clark Y-14 Airfoil Wing Model, International Journal of Innovation and Scientific Research, 2014.
Klein, A. C., Bartholomay, S., Marten, D., Lutz, T., Pechlivanoglou, G., Nayeri, C. N., Paschereit, C. O., and Krämer, E.: About the suitability of different numerical methods to reproduce model wind turbine measurements in a wind tunnel with a high blockage ratio, Wind Energ. Sci., 3, 439–460, https://doi.org/10.5194/wes-3-439-2018, 2018.
Liebeck, R. H.: Design of Subsonic Airfoils for High Lift, in: 9th AIAA Fluid and Plasma Dynamics Conference, Vol. 15, No. 9, Paper 76-406, San Diego, USA, https://doi.org/10.2514/3.58406, 1978.
Marten, D., Wendler, J., Pechlivanoglou, G., Nayeri, C. N., and Paschereit, C. O.: Development and Application of a Simulation Tool for Vertical and Horizontal Axis Wind Turbines, in: Proceedings of the ASME Turbo Expo 2013, Turbine Technical Conference and Exposition, Volume 8: Supercritical CO2 Power Cycles, Wind Energy, San Antonio, Texas, USA, Paper GT2013-94979, https://doi.org/10.1115/GT2013-94979, June, 2013.
Mueller-Vahl, H., Pechlivanoglou, G., Nayeri, C. N., and Paschereit, C. O.: Vortex Generators for Wind Turbine Blades: A combined Wind Tunnel and Wind Turbine Parametric Study, in: Proceedings of the ASME Turbo Expo 2012, Turbine Technical Conference and Exposition, Volume 6: Oil and Gas Applications, Wind Energy, Copenhagen, Denmark, Paper GT2012-69197, https://doi.org/10.1115/GT2012-69197, June, 2012.
Pechlivanoglou, G., Fuehr, S., Nayeri, C. N., and Paschereit, C. O.: The Effect of Distributed Roughness on the Power Performance of Wind Turbines, in: Proceedings of the ASME Turbo Expo 2010, Power for Land, Sea, and Air, Volume 5: Industrial and Cogeneration, Microturbines and Small Turbomachinery, Oil and Gas Applications, Wind Turbine Technology, Glasgow, UK, Paper GT2010-23258, https://doi.org/10.1115/GT2010-23258, June, 2010.
Pechlivanoglou, G., Philippidis T. P., Vey, S., Eisele, O., Nayeri, C. N. and Paschereit, C. O.: Vortex Generators for Wind Turbine Blades: Wind Tunnel Tests, Field Simulations and Structural Analysis, ASME Turbo Expo, RZGM2013-34, 2013.
Schatz, M., Günther, B., and Thiele, F.: Numerical Simulation of the Unsteady Wake behind Gurney-Flaps, available at: https://www.cfd.tu-berlin.de/research/flowcontrol/gurneys_en/ (last access: 24 September 2020), 2004a.
Schatz, M., Günther, B., and Thiele, F.: Computational modelling of the unsteady wake behind Gurney-flaps, in: 2nd AIAA Flow Control Conference Portland, Oregon, USA, Paper 2004-2417, https://doi.org/10.2514/6.2004-2417, June, 2004b.
Snel, H., Schepers, J. G., and Siccama, N. B.: MEXICO Project: The Database and Results of Data Processing and Interpretation, in: 47th AIAA Aerospace Sciences Meeting including The New Horizons Forum and Aerospace Exposition, Orlando, Florida, Paper 2009-1217, https://doi.org/10.2514/6.2009-1217, January, 2009.
Soto-Valle, R., Bartholomay, S., Alber, J., Manolesos, M., Nayeri, C. N., and Paschereit, C. O.: Determination of the Angle of Attack on a Research Wind Turbine Rotor Blade Using Surface Pressure Measurements, Wind Energ. Sci. Discuss., https://doi.org/10.5194/wes-2020-35, in review, 2020.
Storms, B. L. and Jang, C. S.: Lift Enhancement of an Airfoil Using a Gurney Flap and Vortex Generators, in: 31st AIAA Aerospace Sciences Meeting, Journal of Aircraft, Volume 31, Number 3, Paper 93-0647, Reno, Nevada, USA, https://doi.org/10.2514/3.46528, May, 1994.
van Rooij, R. P. J. O. M. and Timmer, W. A.: Roughness Sensitivity Considerations for Thick Rotor Blade Airfoils, AIAA Paper 2003-0350, https://doi.org/10.2514/6.2003-350, 2003.
Vestas: Lift production with Vortex Generators and Gurney Flaps, available at: https://www.vestas.com/en/campaignsites/aerodynamicupgrades/home, last access: 12 September 2020.
Vey, S., Marten, D., Pechlivanoglou, G., Nayeri, C., and Paschereit, C. O.: Experimental and Numerical Investigations of a Small Research Wind Turbine, in: 33rd AIAA Applied Aerodynamics Conference, Paper 2015-3392, Dallas, Texas, USA, https://doi.org/10.2514/6.2015-3392, June, 2015.
Weber, F.I., Durgin, W. W., and Iohari, H.: Circulation measurements about a rapidly pitching airfoil using an ultrasonic system, in: AIAA Fluid Dynamics Conference, San Diego, CA, USA, Paper 1995-2269, https://doi.org/10.2514/6.1995-2269, June, 1995.
Wilcox, B. J., White, E. B., and Maniaci, D. C.: Roughness Sensitivity Comparisons of Wind Turbine Blade Sections, Sandia Report, SAND2017-11288, https://doi.org/10.2172/1404826, 2017.
Zhang, Y., van Zuijlen, A., and van Bussel, G.: The MEXICO rotor aerodynamic loads prediction: ZigZag tape effects and laminar-turbulent transition modeling in CFD, J. Wind. Eng. Ind. Aerod., 168, 152–163, https://doi.org/10.1016/j.jweia.2017.06.002, 2017.