the Creative Commons Attribution 4.0 License.
the Creative Commons Attribution 4.0 License.
 | 28 May 2020
A novel rotor blade fatigue test setup with elliptical biaxial resonant excitation
David Melcher
Moritz Bätge
Sebastian Neßlinger
The full-scale fatigue test of rotor blades is an important and complex part of the development of new wind turbines. It is often done for certification according to the current IEC (2014) and DNV GL AS (2015) standards. Typically, a new blade design is tested by separate uniaxial fatigue tests in both main directions of the blade, i.e. flapwise and lead lag. These tests are time-consuming and rather expensive due to the high number of load cycles required, up to 5 million. Therefore, it is important to run the test as efficiently as possible. During fatigue testing, the rotor blade is excited at or near its resonant frequency. The trend for new rotor blade designs is toward longer blades, leading to a significant drop in their natural frequencies and a corresponding increase in test time. To reduce the total test time, a novel test method aims to combine the two consecutive uniaxial fatigue tests into one biaxial test. The biaxial test excites the blade in both directions at the same time and at the same frequency, resulting in an elliptical deflection path of the blade axis. Using elliptical loading, the counting of damage equivalent load cycles is simplified in comparison to biaxial tests with multiple frequencies. In addition, the maximum loads in both main directions remain separated, while off-axis loading is introduced. To achieve such a test, specific load elements need to be arranged so as to equalize the natural frequencies of the test setup for both test directions. This is accomplished by adding stiffness or inertial effects in a specific direction.
This work describes a new method to design suitable test setups. A parameterized finite element (FE) model of the test with beam elements for the blade represents the test setup. A harmonic analysis on the FE model can identify the load distribution and the test conditions of a specific test setup within seconds. An optimization algorithm that varies parameters of the model and searches for the optimal setup is then applied to the analysis. This approach allows the efficient determination of a test setup, suited to the predefined requirements. The method is validated by applying it to three different test scenarios for a modern rotor blade: (a) state-of-the-art uniaxial setups, (b) uniaxial setups including springs and (c) a biaxial setup. In conclusion, the resulting setups are evaluated in terms of test quality and efficiency.
- Article
(2301 KB) - Full-text XML
- BibTeX
- EndNote


Rotor blades of wind turbines are exposed to very high fatigue loading over their usual lifetime of 20 years in the field. Hence, their reliability and structural integrity are very important, from both an economic and a safety perspective. When a new rotor blade design is developed, it needs to be certified before it can go into operation. The design and certification of wind turbine rotor blades is performed according to the current IEC (2014) and DNV GL AS (2015) standards. One essential part of the certification process is full-scale fatigue testing. These tests are performed to validate the calculations and assumptions made in the design models, by applying damage-equivalent loads to the blade. Typically, two consecutive tests are done, in which the blade is separately loaded in the two main directions, i.e. flapwise and lead lag. A drawback of these unidirectional tests is that the loads introduced into the blade do not necessarily represent the loading the blade will experience under field conditions, as Rosemeier et al. (2018) have shown.
The following requirements are considered in fatigue testing: a target bending moment distribution, derived from the design requirements, needs to be matched or exceeded everywhere within the area of interest, while keeping the exceedance as small as possible in order to avoid unrealistic failures. If a section of the blade is overloaded, it can be damaged before the rest of the blade has been fully tested. In order to safely proceed with testing, this damage needs to be repaired, which can lead to prolonged testing times. Besides the required load distribution, a high test frequency is desired to reduce the total testing time. The energy consumption of the test is another important boundary condition. Moreover, the introduction of high local shear forces to the blade should be avoided.
A state-of-the-art fatigue test setup involves the application of different load elements, i.e. actuators and masses, along the span of the blade, while the root of the rotor blade is attached to a test block. The actuators excite the blade at or near the corresponding system resonant frequency, while the masses are attached to the blade to tune the bending moment distribution. Forcing the blade to oscillate at a frequency significantly outside the resonant frequency leads to high shear forces at the load introduction and high energy consumption by the test.
Attempts have been made to improve these uniaxial full-scale fatigue tests. Lee and Park (2016) for example used an algorithm to optimize the overloading by determining the optimal mass distribution, actuator position and excitation frequencies. Similarly, Zhang et al. (2018) evaluated a different optimization algorithm and included the position of the blade tip cut-off as a design variable. Eder et al. (2017) proposed a uniaxial multi-frequency approach to replicate the actual spatial damage distribution of the blade more realistically.
Combining the two uniaxial tests into one biaxial test, which involves exciting the blade in both directions at the same time, is an approach to save testing time. It also has the potential to emulate the comprehensive damage along the blade's circumference (Heijdra et al., 2013). Exciting the blade at two different resonant frequencies, which equates to a random phase biaxial fatigue test, has been the subject of research for a number of years (White, 2004; White et al., 2005; Greaves et al., 2012; Snowberg et al., 2014). Another approach for biaxial testing is phase-locked excitation, where the excitation frequencies in the flapwise and lead-lag directions have a specific ratio, e.g. 1:1 or 1:2 (White et al., 2011). Heijdra et al. (2013) proposed exciting the flapwise mode in its natural frequency while forcing the lead-lag motion in the same frequency to obtain a 1:1 ratio. A method to achieve the desired frequency ratio while exciting both directions in resonance is to tune both natural frequencies independently using the concept of virtual masses (Post et al., 2016). These elements are connected to the blade in such a manner that they only add or subtract inertia in one specific direction.
This work focuses on the phase-locked resonant biaxial excitation with a frequency ratio of 1:1. Each cross section along the blade axis thus follows an ellipse, as depicted in Fig. 1b. This simplifies the counting of damage-equivalent load cycles when compared to biaxial tests with multiple different frequencies. Virtual masses are used to adjust the natural frequencies so as to be equal or very close to each other, i.e. raising the flapwise and/or lowering the lead-lag natural frequency, as Post et al. (2016) suggested. Rather than using negative virtual masses to remove inertia from the system, our approach uses spring elements instead to add stiffness. Adding stiffness or removing inertia at a specific position has a similar physical effect on the natural frequencies of the system. The result is a test setup as illustrated in Fig. 1a. Unlike Post et al. (2016), who simulated the two test directions independently, this work aims to consider the coupling of the two directions. Instead of two separate two-dimensional simulations, one three-dimensional simulation is performed. It is thus possible to consider the coupling of multiple load and deflection directions. Here, the virtual masses and spring elements are not just applied in the global flapwise or lead-lag direction but also tilted around the blade axis as described below. The method elaborated in the following was developed to optimize these biaxial fatigue test setups. Thus, it is used to identify which load element needs to be placed where along the blade, in order to generate a fatigue test that satisfies all test requirements as efficiently as possible.
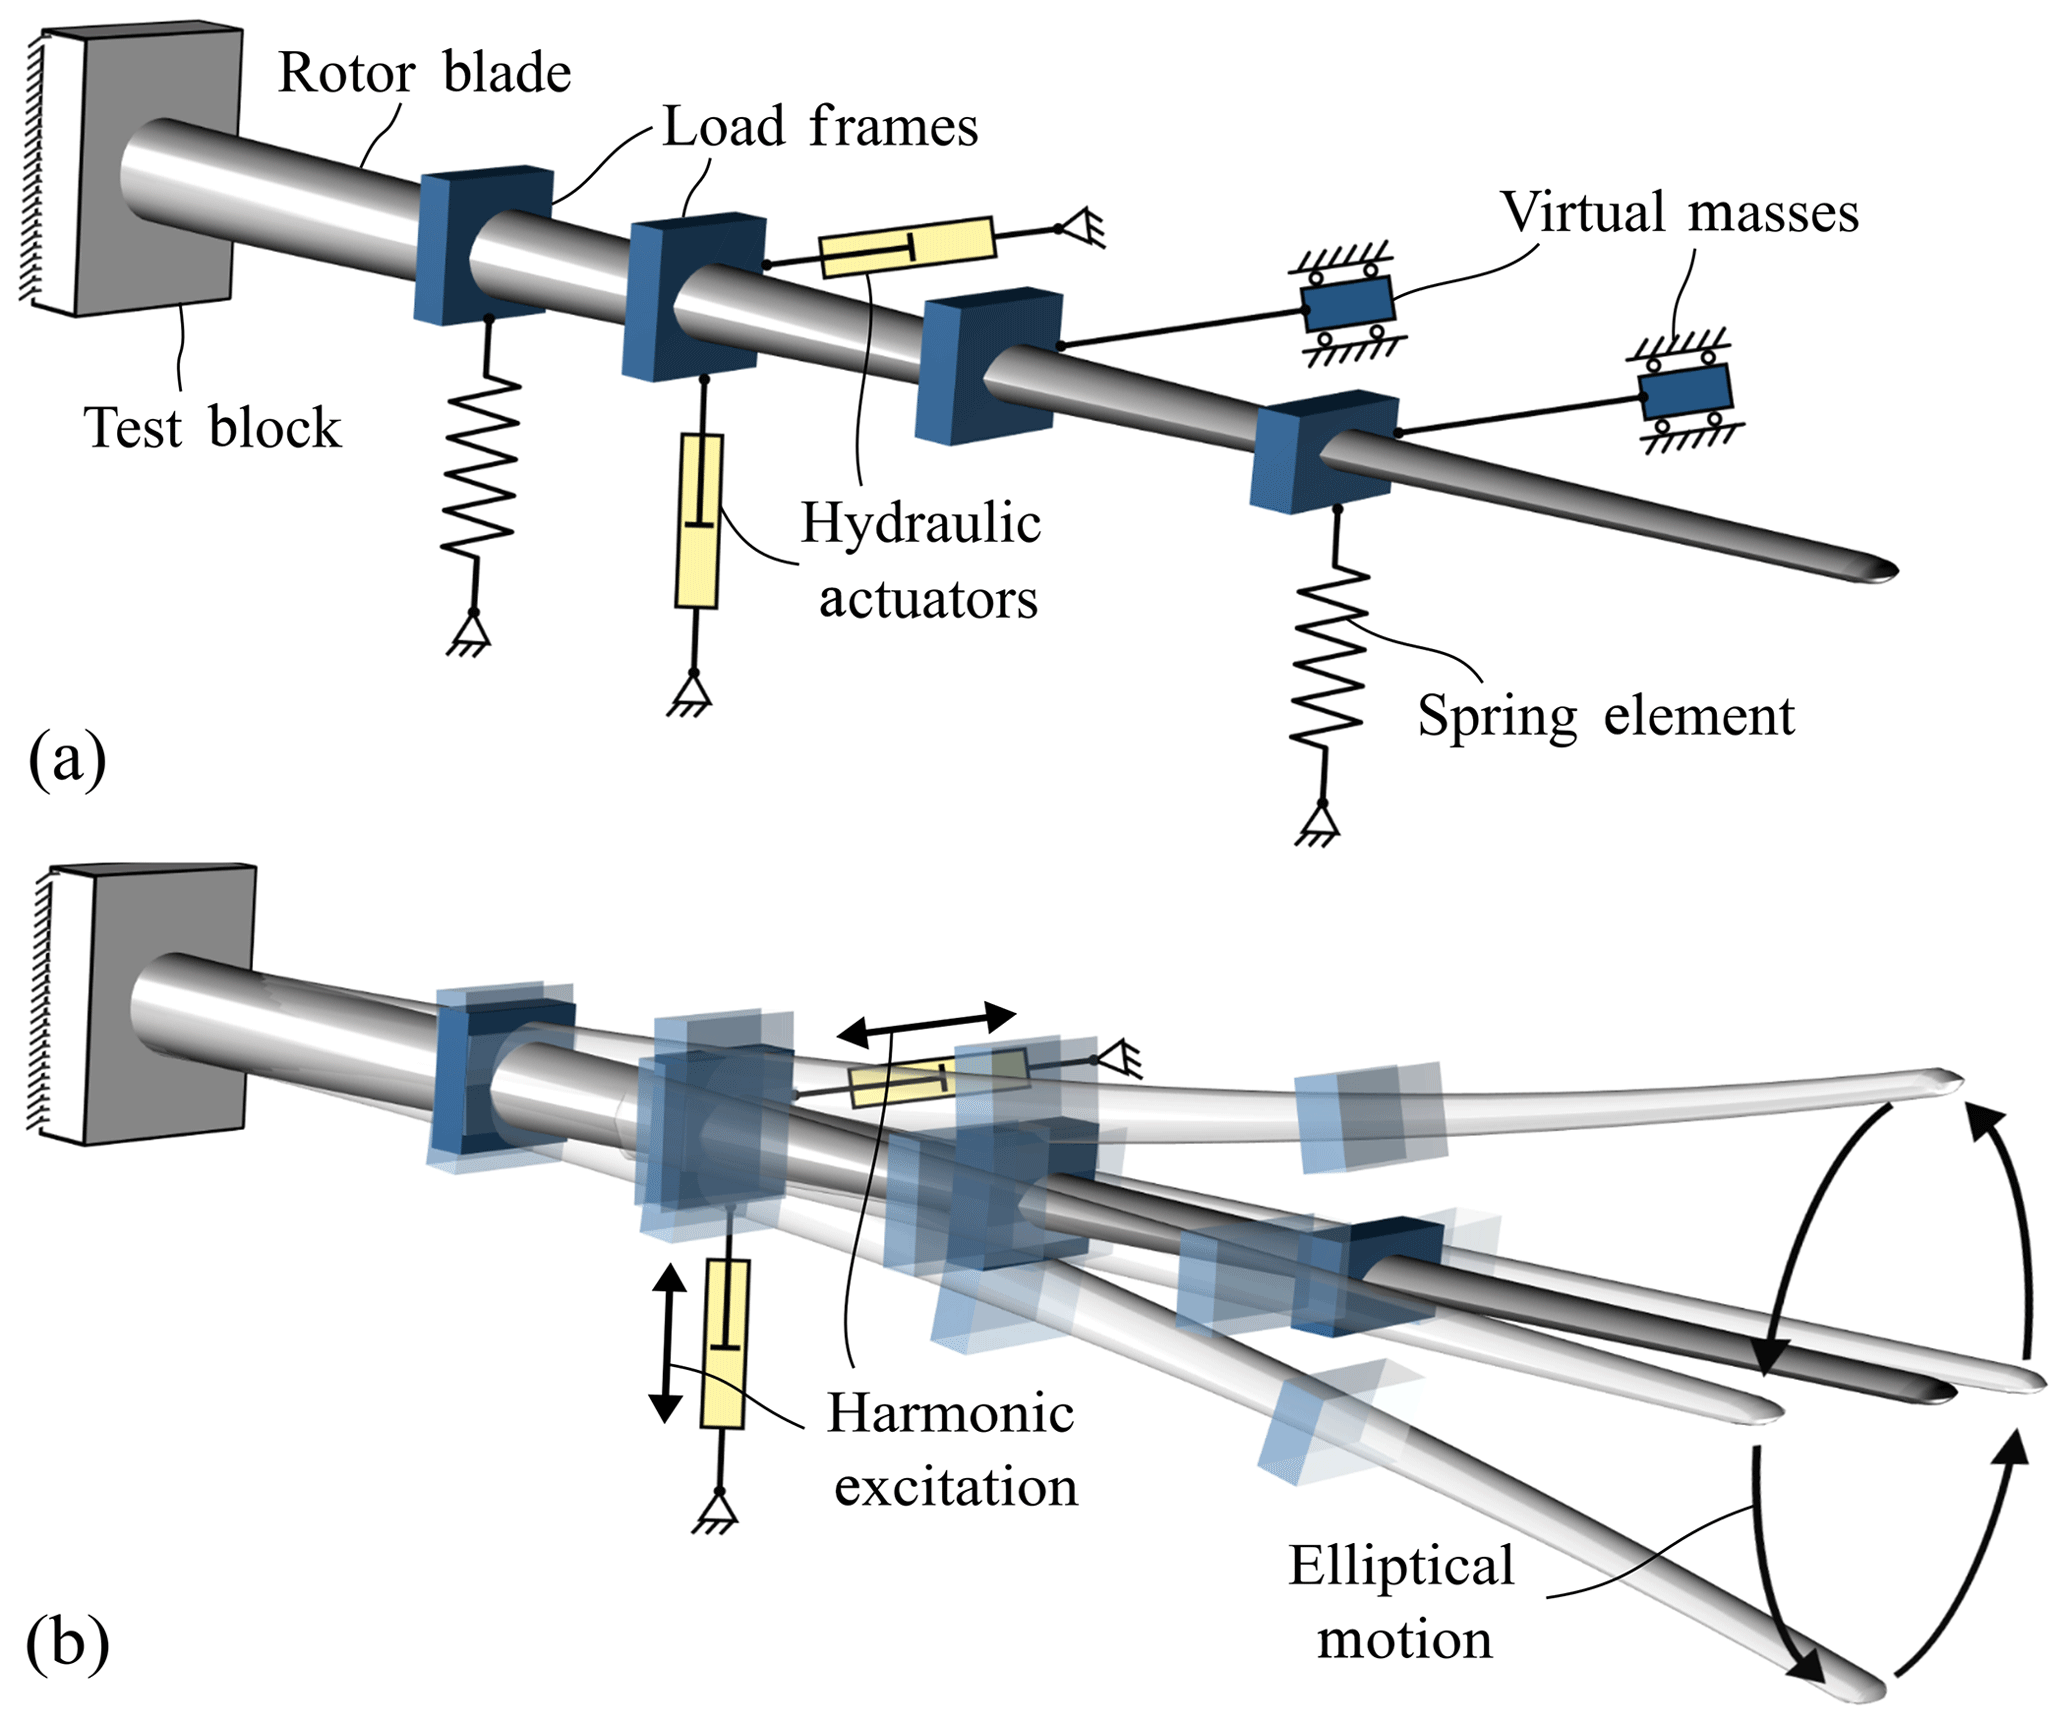
Figure 1Biaxial fatigue test: (a) schematic of test setup and (b) elliptical resonant excitation and resulting displacement.
To find a suitable test setup for either biaxial or uniaxial fatigue tests, it is necessary to evaluate any given setup. A parameterized FE simulation tool was developed in ANSYS APDL to do so. Using specific design parameters, any desired test setup can be modelled with FE elements. Moreover, the tool runs various analyses (modal and harmonic) on the model to evaluate the properties of the given setup. This process is described in the following subsections.
2.1 Test setup modelling
The rotor blade is modelled using beam elements that are based on the Timoshenko beam theory. The properties of these beam elements take into account coupling terms between different generalized strains and loads as they occur in composite structures. These properties, which are represented by mass matrices and fully populated 6×6 stiffness matrices, are derived from preceding analyses of multiple different cross sections along the blade.
The model of the blade is constrained at the root in all degrees of freedom to generate a cantilever beam setup. The loading elements, which are controlled by various parameters, are then attached to the beam elements as described below. Damper elements representing the aerodynamic drag that occurs during testing are also attached in the model.
2.1.1 Loading elements
Masses attached to the blade by means of load frames are applied directly to the beam model using point mass elements.
The load elements, which are designed to affect either the first flapwise or the first lead-lag frequency, can be virtual masses or spring elements. The virtual masses are modelled as mass elements that are connected to the beam elements using rigid-body elements. They are constrained as shown in Fig. 2a. The springs are modelled using linear spring elements.
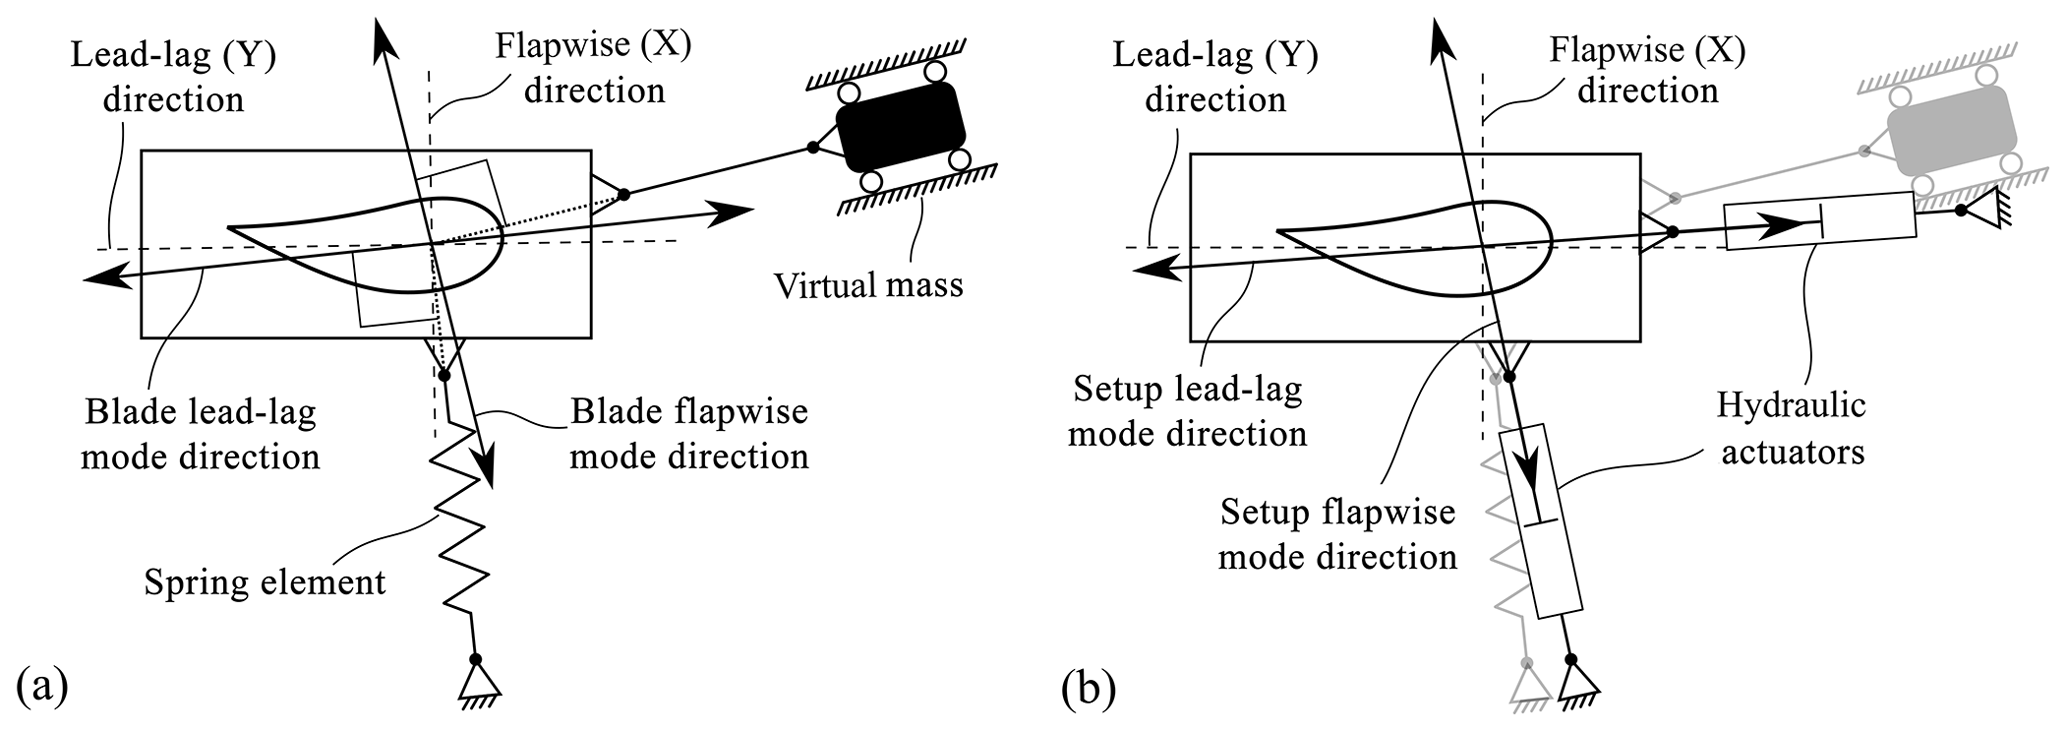
Figure 2Angle for application of load elements: (a) passive elements according to blade mode shape and (b) actuators according to setup mode shape.
These load elements must be attached in a specific direction; as a rotor blade oscillates in one of its first mode shapes, the direction of displacement is not necessarily aligned with the main directions of the blade. Additionally, the direction of a single mode shape changes along the length of the blade by a few degrees, meaning every cross section may oscillate in a slightly different direction. The first flapwise and lead-lag mode shape directions are not perpendicular to each other. The effect of a flapwise element on the lead-lag natural frequency and vice versa shall be minimized. Hence, it was found that the elements need to be attached so as to be perpendicular to the mode shape of the rotor blades, which is not to be affected. This is shown in Fig. 2a for one representative cross section, where a spring is applied in the flapwise direction and a virtual mass in the lead-lag direction.
The mode shapes of the test setup including springs and masses differ from those of the bare blade. As the hydraulic actuators are intended to excite the test setup with the lowest possible energy consumption, they need to be attached in line with the direction of these new mode shapes. This is visualized for a biaxial test in Fig. 2b. For a uniaxial test, only one cylinder is attached in the respective direction.
For the biaxial test, the elliptical motion of the blade consists of two harmonic oscillations, one in the flapwise direction and one in the lead-lag direction, with a phase shift. This phase shift defines the tilt of the ellipse around the pitch axis and the width of the ellipse. With a phase shift of 90∘ the ellipse is not tilted, meaning the extreme loads in one main direction do not overlap with the extreme loads of the other direction, but rather with their mean value. This phase shift needs to be adjusted during testing. If both hydraulic actuators are attached at the same position along the blade length, the phase shift between the flapwise and lead-lag motion is directly dependent on the actuator phase shift. Otherwise a complex controller system would be needed, since the phase of motion varies along the blade length and the phase shift would then also depend on the blade properties. Therefore, the actuators are kept at the same position in this work.
As the hydraulic actuators may not be in line with the main directions of the blade and may not be perpendicular to each other, a skew coordinate system can be derived from their orientation as shown in Fig. 3.
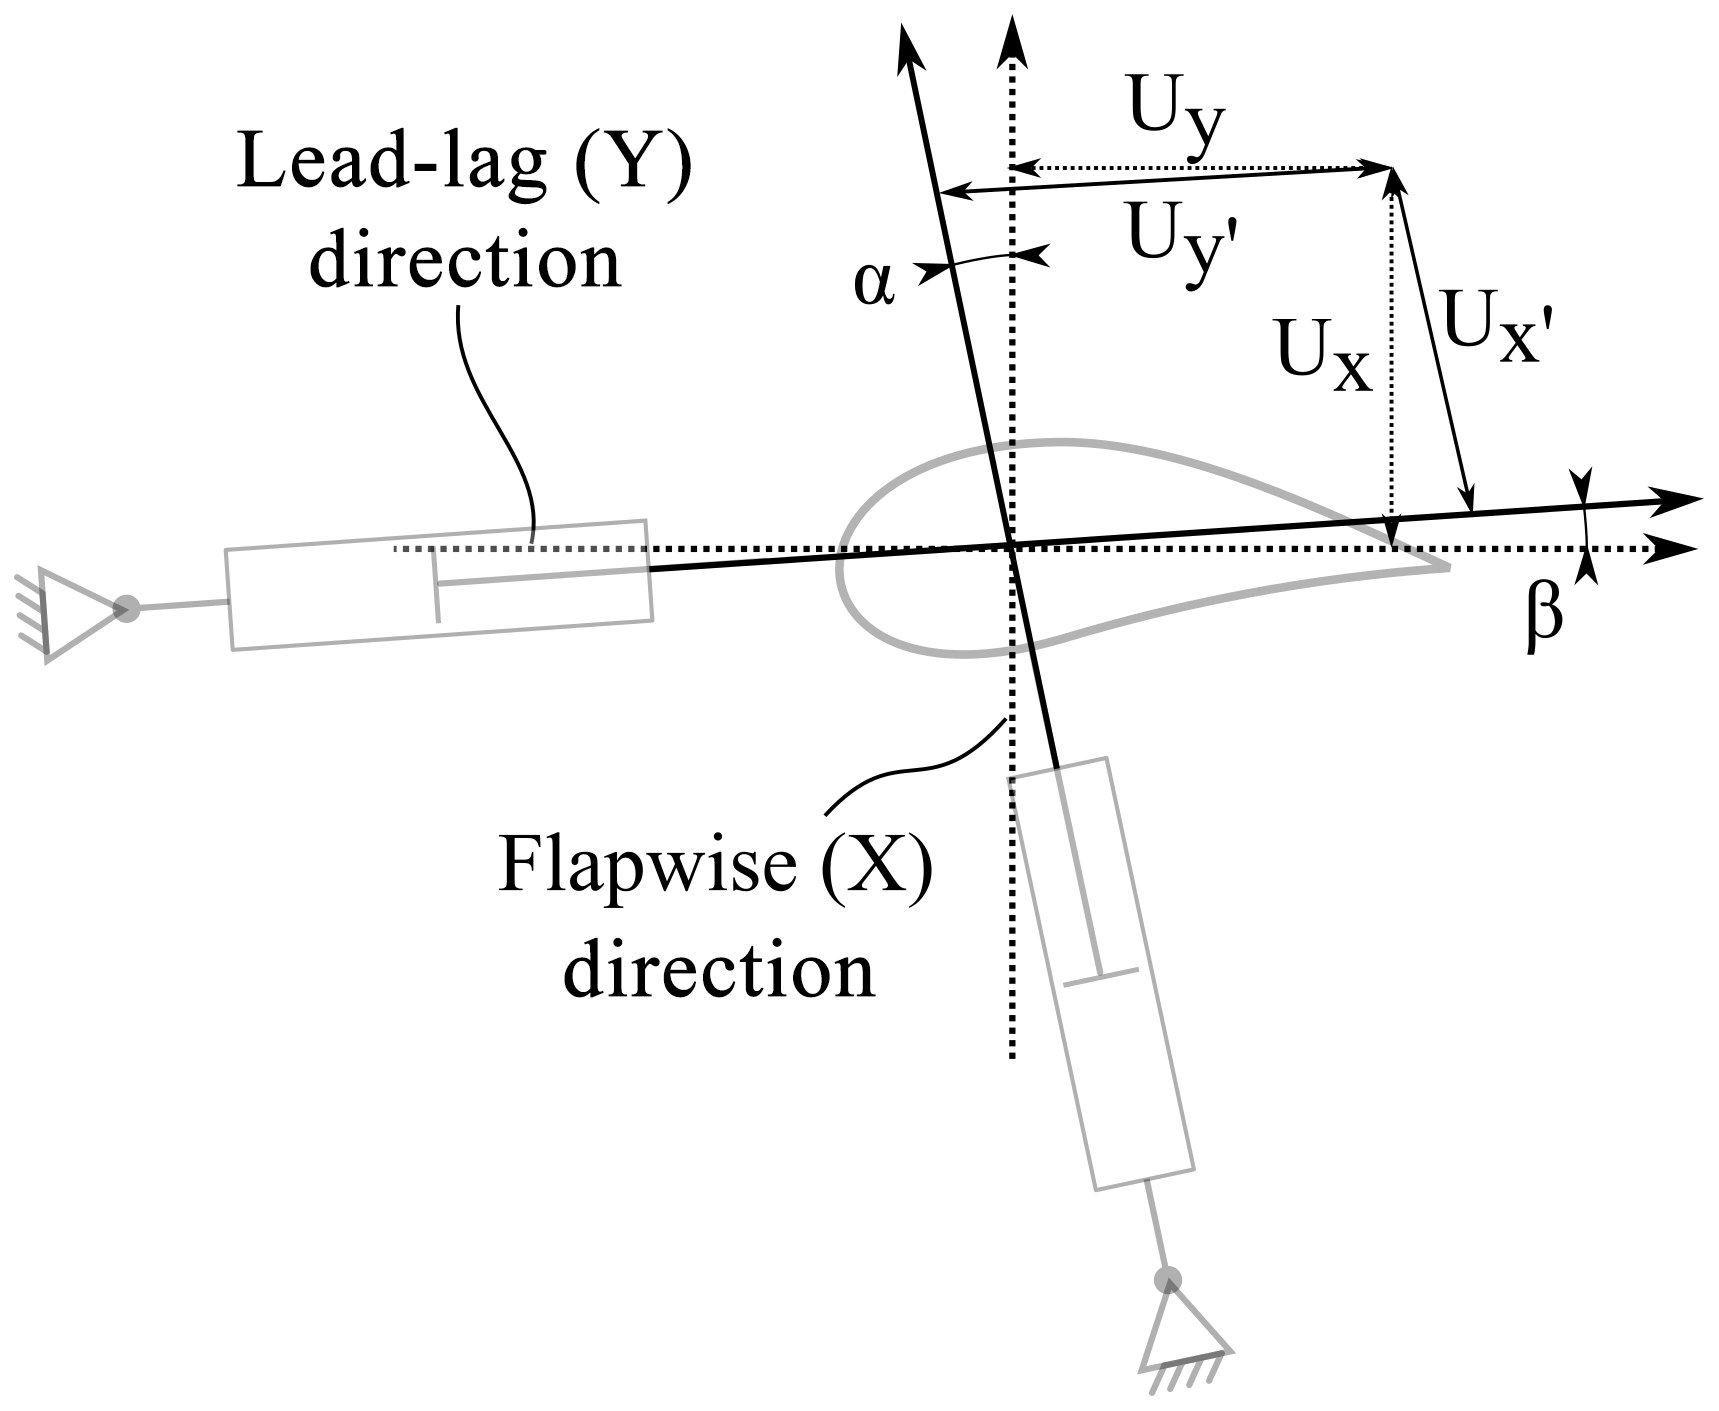
In order to find the correct displacement excitation for the actuators, the desired blade motion, including the phase shift, must be converted to the skew coordinate system using Eqs. (1) and (2).
Here Ux and Uy are the deflection values in the blade coordinate system, and and are the values in the actuator coordinate system. In the real test, the angle of incidence of the actuators will change constantly as the blade follows the elliptical motion. This will result in a constantly changing skew coordinate system with moving origin. The longer the actuators are, the smaller the change in angle becomes. As harmonic simulations cannot consider non-linear effects, this phenomenon has been omitted at this stage of the setup definition.
2.1.2 Aerodynamic damping
The aerodynamic damping is modelled using linear damping elements. At each beam element of the blade, two dampers are applied: one in the flapwise direction and one in the lead-lag direction. In the simulation, each damper applies a force to the blade which is proportional to the velocity in the corresponding direction.
The aerodynamic drag force, which corresponds to the damping force, is non-linear and can be computed using Eq. (3).
Here FD is the drag force, ρ is the density of the air, A is the area perpendicular to the motion, CD is the drag coefficient and v is the velocity.
To achieve the same energy dissipation with the linear damping elements as the aerodynamic drag would induce, the damping constant Cd,lin for each element is adjusted accordingly. The theoretical formula for the energy due to aerodynamic drag within one cycle of harmonic oscillation, Edrag, is shown in Eq. (4). The formula for the energy of a linear damper, Edamp, is given in Eq. (5). Equating Edrag and Edamp allows the required damping constant to be derived as shown in Eq. (6).
Here f is the oscillation frequency and is the displacement amplitude.
The drag coefficient CD used in the simulation was taken from the investigations by Greaves (2020), who derived a dependency for the drag coefficient of the displacement amplitude and the aerofoil shape.
2.2 Simulation sequence
Once the test setup is modelled, including load elements and dampers, the simulation tool runs several consecutive analyses to evaluate the given setup. This sequence is summarized in Fig. 4. Since the damping constants depend on the test frequency and the displacement amplitude, they initially set to zero, as these variables are unknown at the beginning of the analysis. The first analysis is a modal analysis to find the natural frequencies of the test setup. The outputs are then used to find the excitation frequency for the test. For a uniaxial test, the natural frequency of the first mode in the corresponding direction is used directly as the test frequency. For a biaxial test, the mean value between the first flapwise and the first lead-lag frequency is used as the forced excitation frequency. Hence, any given test setup can be evaluated regardless of the ratio between the natural frequencies.
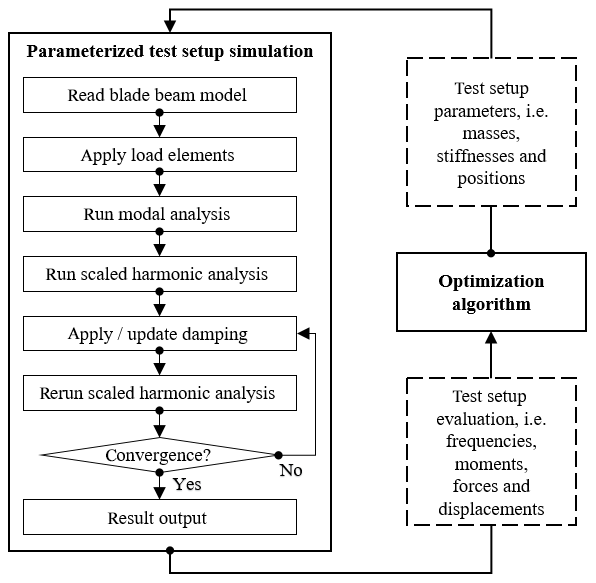
The test is then simulated using a harmonic simulation with a small initial actuator displacement as the excitation. The harmonic simulation is then evaluated and scaled by a specific factor. This scaling factor is calculated to ensure that the test bending moment within the entire area of interest matches, or is higher than, the target bending moment to meet test requirements. In the biaxial case, the excitations of both actuators are applied simultaneously. Separate scaling factors are hereby applied to the flapwise and lead-lag displacements, which are converted to actuator excitations using Eqs. (1) and (2) before repeating the harmonic simulation.
At this stage of the simulation, the test frequency and a preliminary displacement amplitude are known. These are then used to update the damping constants of the damper elements; the harmonic analysis is then repeated. This iterative process of updating the damping and the scaled harmonic analysis is repeated until convergence is achieved. This concludes the simulation and the results of the last harmonic analysis are used to evaluate the given setup.
The major advantage of using harmonic analyses in the simulation process is the short processing time. It takes only a few seconds, enabling the computation of a multitude of different test setups. A transient simulation of the test, which considers non-linear damping and non-linear geometric effects, such as angular changes of load introduction elements, requires about 100 times more processing time. A comparison of transient and harmonic simulations yielded a difference of less than 3 % in loading amplitudes within the area of interest. Hence, the harmonic results are sufficiently precise. Nevertheless, the final test setup needs to be checked by a transient simulation.
The process described in the section above can be used to evaluate any given test setup. To find a suitable setup, different options need to be evaluated and compared. By varying the design parameters and evaluating the influence of these changes, an optimal test setup can be found using an optimization algorithm, as described in the following. This workflow is visualized in Fig. 4.
3.1 Problem formulation
The setups in this work are optimized to maximize the test frequency, i.e. shortest test time. This is done while keeping the ratio between test and target bending moment distribution within an allowable range. Within the area of interest the ratio must be above 1 to achieve the required load. To avoid overloading, an upper limit of 5 % for flapwise and 10 % for lead-lag loading was used. Introduction of high local shear force by the load elements needs to be avoided, and the stroke amplitude of the actuator needs to be kept at a reasonable level. The design parameters that can be changed by the optimization are the mass or stiffness values of the load elements at specific defined positions along the blade. These can be attached in the flapwise or the lead-lag direction for the respective uniaxial test and in both directions for biaxial tests. Furthermore, the position of the actuators can be changed between the defined positions. For the optimization of the biaxial test, another constraint is introduced. In order for the excitation to be in resonance, the first flapwise and lead-lag natural frequencies need to be the same or close to each other. Hence, a limit of 5 % deviation between the first flapwise and lead-lag natural frequencies is used.
This leads to the problem formulation in Eq. (7), on which all the optimizations are based.
3.2 Boundary conditions
Further assumptions and boundary conditions are applied for the simulations and the optimizations; the load frames that are needed to connect the load elements to the blade, as well as the spring elements, are assumed to be without mass.
At each position, for each main direction, the optimization can use either a mass or a spring element. It is not possible to use both at the same position for the same direction, as they would simply cancel each other out.
If a parameter set defines virtual masses in both the flapwise and lead-lag directions at the same position, the smaller mass is attached directly to the blade as load frame mass, which acts in all directions. The larger mass is reduced to the difference between the previously defined masses, as this value still needs to act in one direction.
For the uniaxial setups, no virtual masses are allowed at all, as the natural frequencies of the blade do not need to be modified separately. Masses are instead applied as load frame masses. Springs for uniaxial testing are also only allowed in the respective test direction to raise the corresponding natural frequency.
3.3 Case study rotor blade
In this work, a modern industrial rotor blade more than 60 m long is used to demonstrate the method developed1. The target bending moment distribution is given, and the area of interest is defined to be between 14 % and 55 % of the blade length. In this instance, the customer had previously defined the area of interest. Prior to testing, the blade tip was cut off at 90 % of the blade length to reduce aerodynamic damping. The uniaxial tests are designed for 2.5 million load cycles in the flapwise direction and 5.0 million cycles in the lead-lag direction.
As the biaxial test is performed elliptically, the same number of load cycles is required for both test directions. Therefore, the required number of load cycles for the biaxial test is defined as 5.0 million and the target load level for the flapwise direction is reduced to 94.25 % of the uniaxial load level. This is done according to the international standard IEC-61400-23.
The possible positions for the load introduction are given in Table 1. These positions are defined in the test specification and thus are assumed to be appropriate for this purpose, and not to include critical regions of the blade. Other positions may contain critical areas, which need to be tested and must not be disturbed by load introduction equipment. Table 1 also contains the maximum spring element stiffness and the maximum mass at the corresponding position. These values are used to constrain the design space of the optimizations.
Table 1Load positions and boundary conditions for load element.
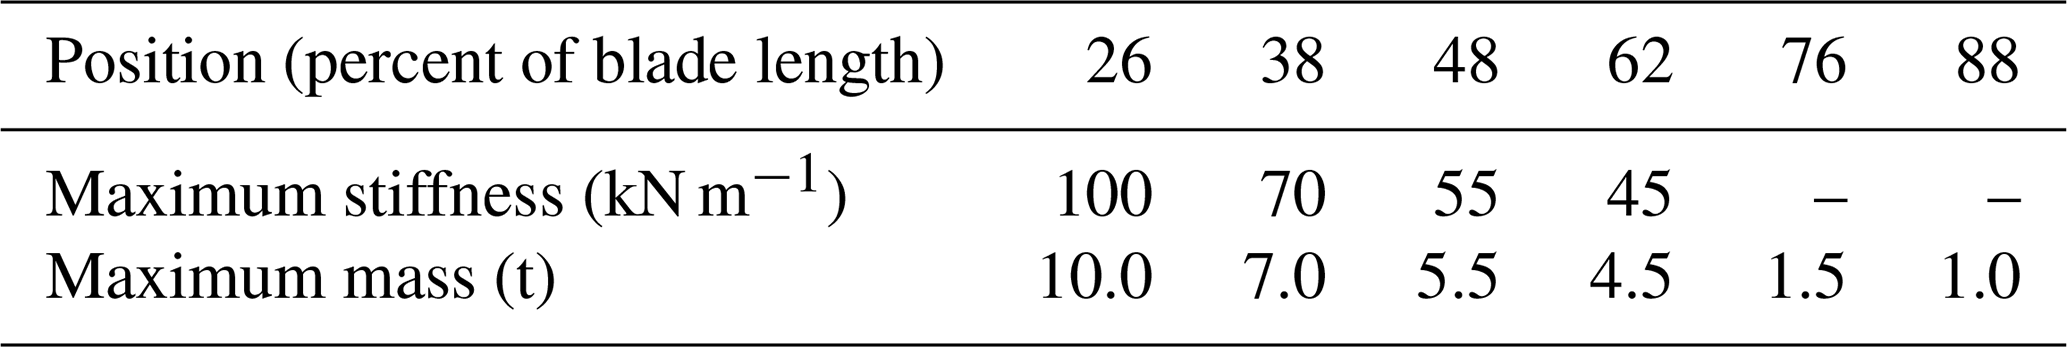
In the optimization for this blade, virtual masses or spring elements were only allowed up to the load position at 62 % of the blade length. At 76 % and 88 % of the blade length, only load frame masses directly attached to the blade were permitted. At these positions, the deflection of the blade is too high to reasonably consider virtual masses or spring elements.
3.4 Case study optimizations
The method described was used to generate three different test setups, including two state-of-the-art uniaxial setups for separate flapwise and lead-lag tests, which were used as a baseline in the comparison. The uniaxial setups were then optimized again, allowing springs to accelerate the tests. Additionally, one biaxial setup was generated using springs and virtual masses. Finding a suitable biaxial setup was much more challenging for the optimizer in terms of computational effort, as there were more constraints to consider and more design parameters to change. The final setups generated by the optimizer were subsequently evaluated with non-linear transient analyses, to check whether non-linearities resulted in outcomes which were different to those of the fast harmonic simulation. These showed only minor differences for the given test setups.
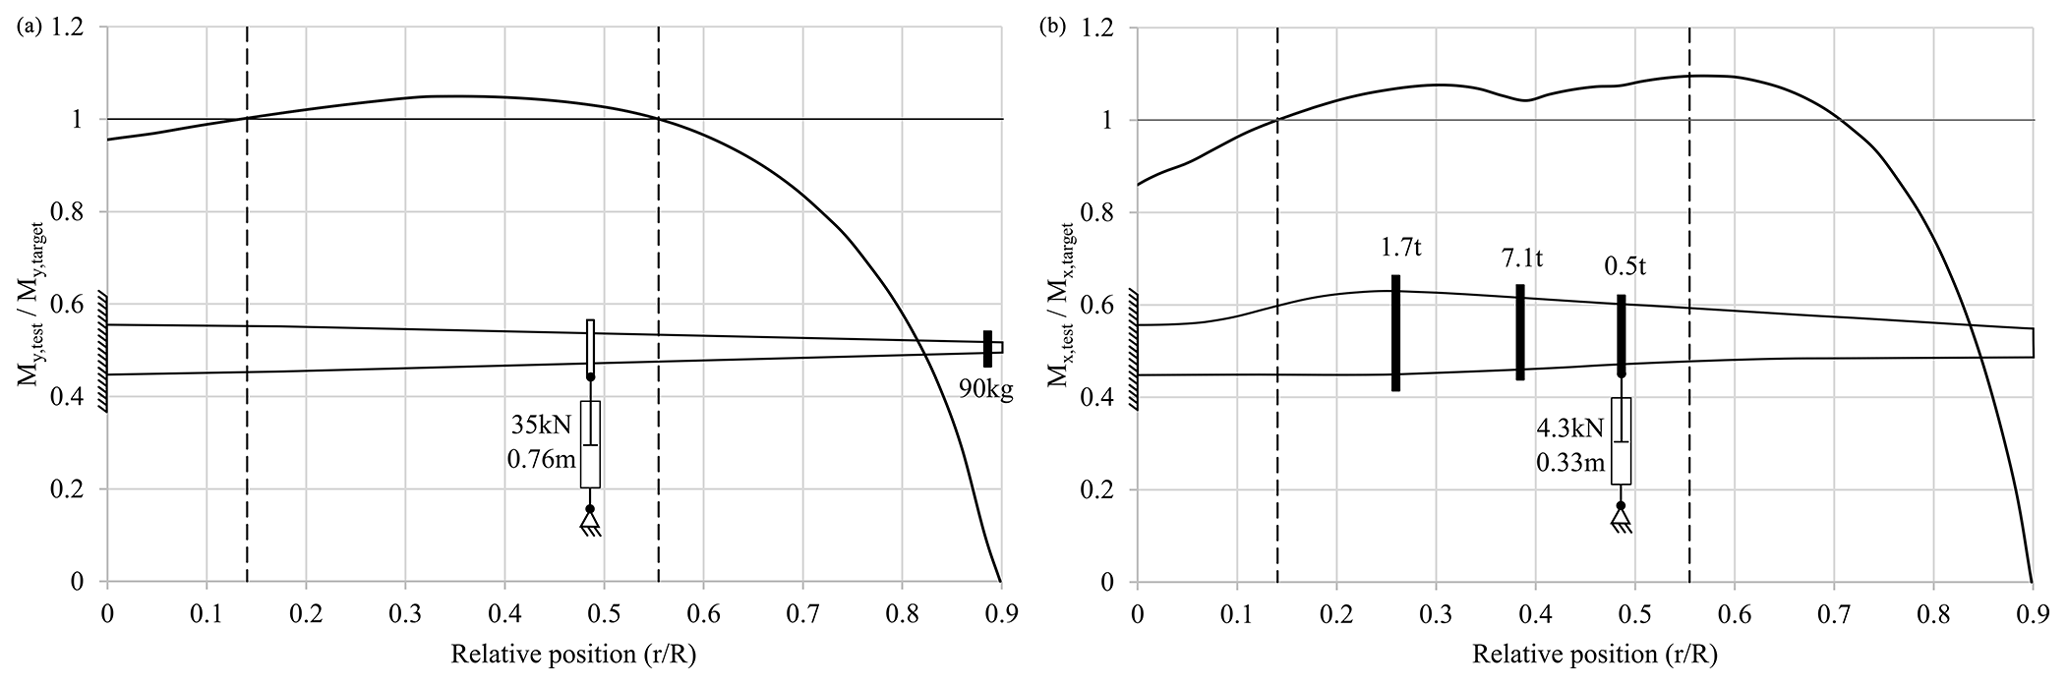
Figure 5Schematic of uniaxial test setups and test/target load ratio in flapwise (a) and lead-lag (b) directions.
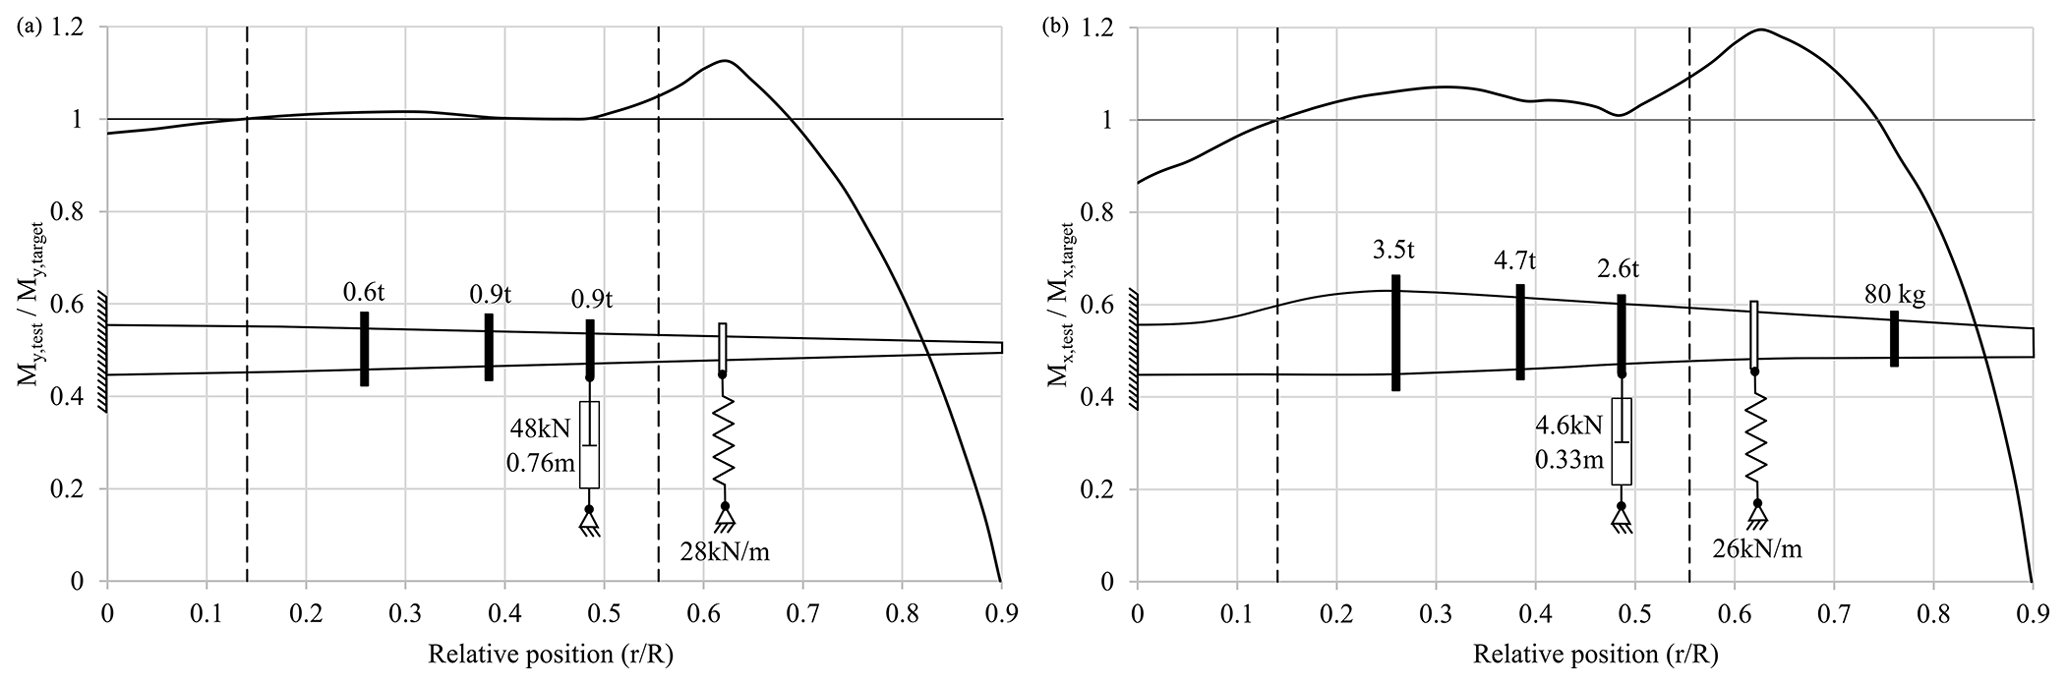
Figure 6Schematic of setups with springs and test/target load ratio in flapwise (a) and lead-lag (b) directions.
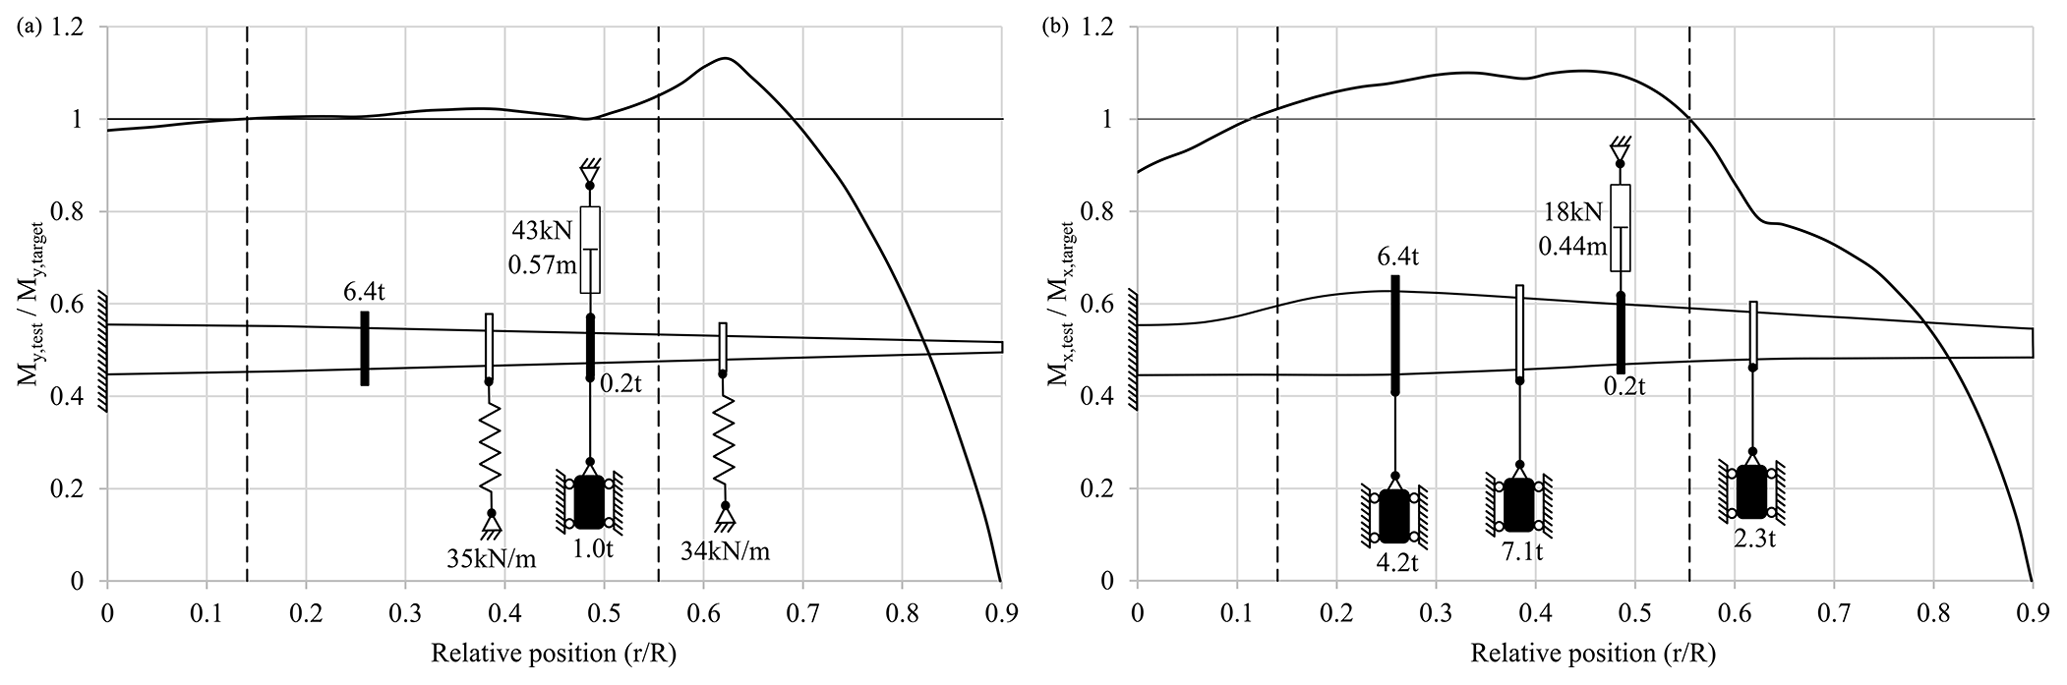
Figure 7Schematic of biaxial setup and test/target load ratio in flapwise (a) and lead-lag (b) directions.
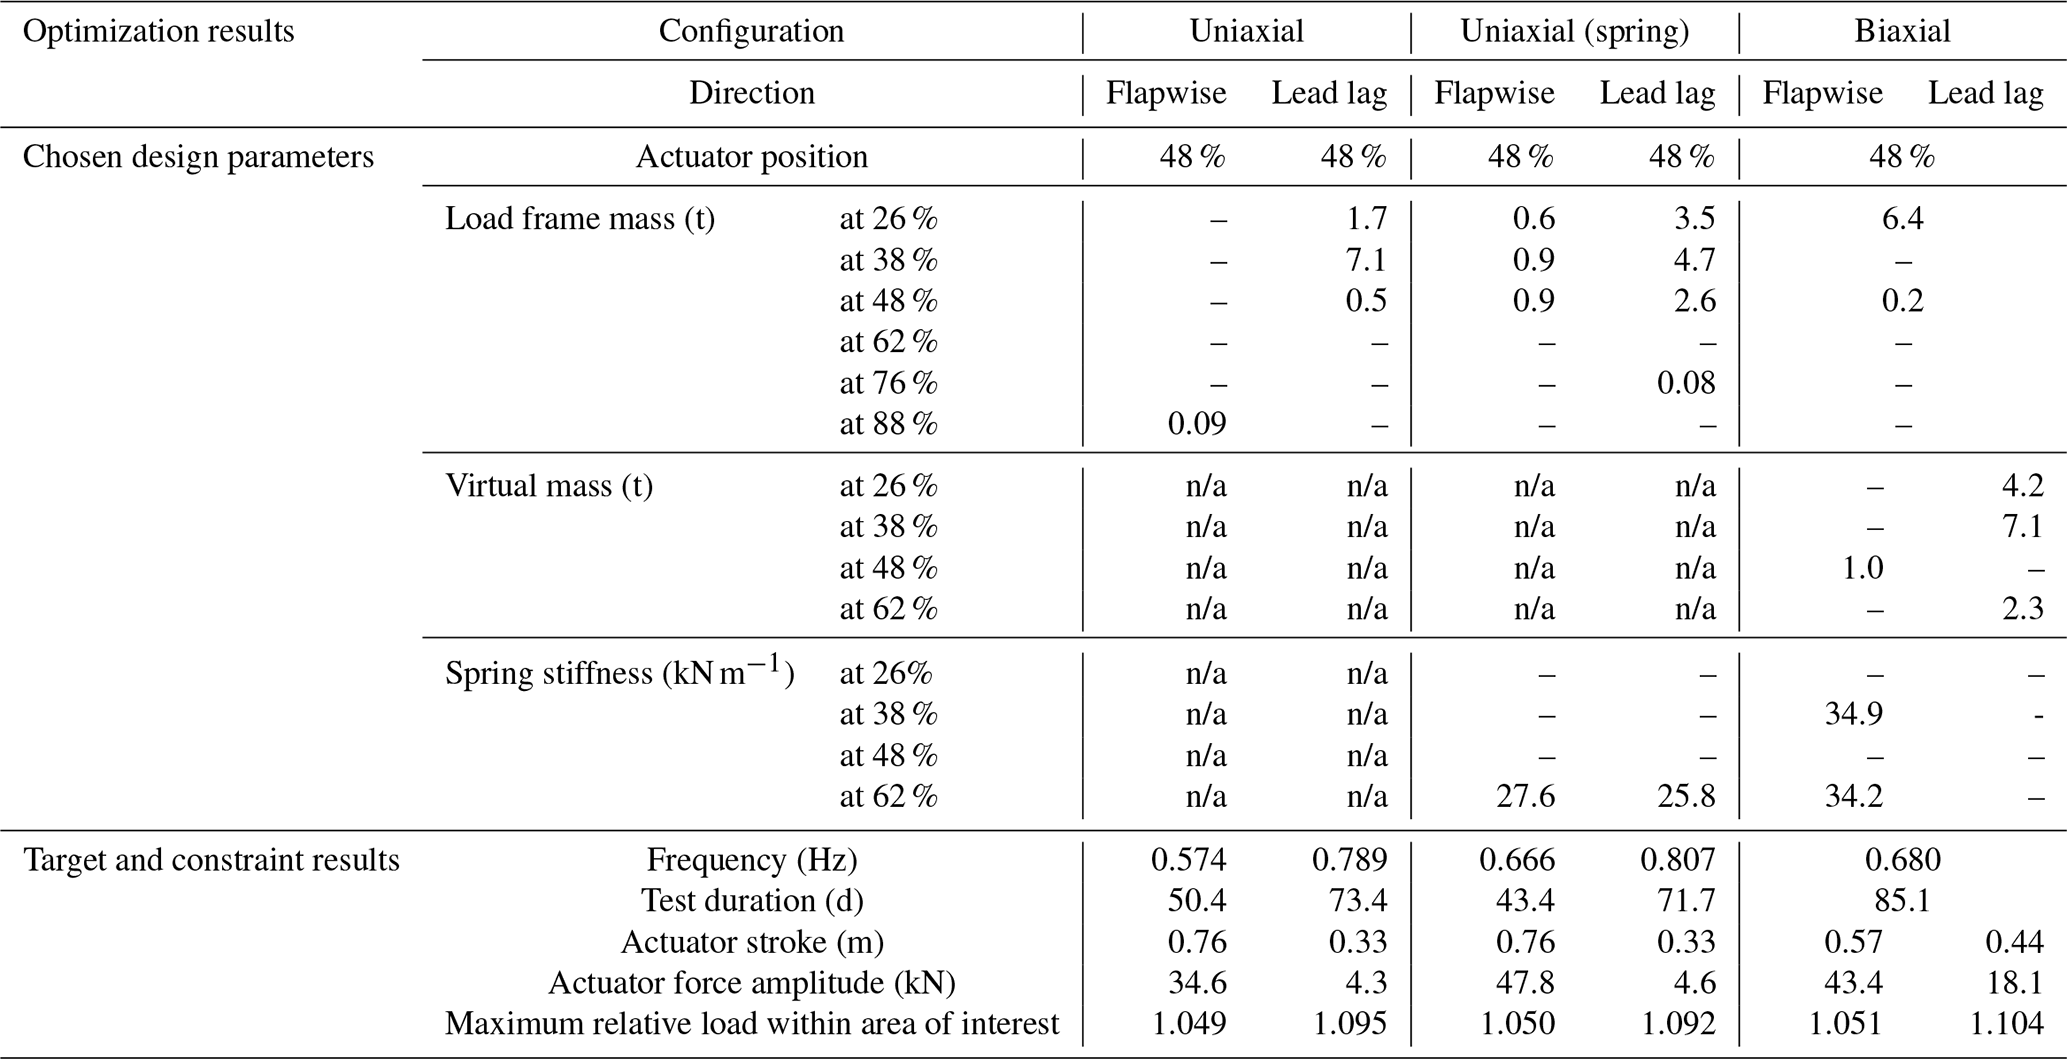
Figures 5 to 7 show the schematics of the setups that were found by the different optimization runs. In addition, the corresponding ratio between the actual moment distribution and the target distribution (flapwise direction: ; lead-lag direction: ) plotted against the normalized position along the rotor blade (r∕R) is shown. The borders of the area of interest are marked with dashed lines. Table 2 summarizes the design parameters chosen and corresponding results of the setups found. For all setups, the actuator was positioned at the third load frame at 48 % of the blade length. This appears to be the position at which actuator force and stroke are balanced. Further outboard the stroke becomes too large, while further inboard the forces are too large, particularly in the flapwise direction. The optimizer used only a small number of springs and otherwise favoured masses for the uniaxial setups, even when springs were permitted at the first four load frame positions. Additional springs would have a negative effect on the moment distribution.
4.1 Comparison
A comparison of the load distribution of the different test setups, as seen in Fig. 8, shows that the solutions with springs exhibit higher overloads outside the area of interest, where this is permitted. This is due to the stiff springs which are attached outboard of the test area at 62 % of the blade length to raise the eigenfrequency as much as possible. For the flapwise setup, this is seen in both uniaxial and biaxial tests. For the lead-lag direction, it is only seen for the uniaxial test, as the lead-lag eigenfrequency for the biaxial test had to be lowered to match the flapwise frequency. The overloaded area around 62 % of the blade length would have to be further examined by the blade designer before testing in order to check if the design safety factors are high enough to withstand these loads. Otherwise, consideration should be given to reinforcing this part of the blade in order to prevent damage and obviate the need for expensive repairs during testing. It may also be possible to spread the spring force over two separate springs that are close to each other, but at different cross sections. Using springs which are less stiff could also be a possibility but would lead to lower frequencies and longer test times.

Figure 8Test load distribution relative to target load for different test setups in flapwise (a) and lead-lag (b) directions.
The biaxial setup also exceeds the allowed lead-lag load by 0.4 % at around 45 % of the blade length, as the optimizer was unable to find a better solution. As this is still very close to the allowable range, the overload is considered to be acceptable.
Overall, the test quality in terms of load distribution within the area of interest is similar and reasonable for all test setups.
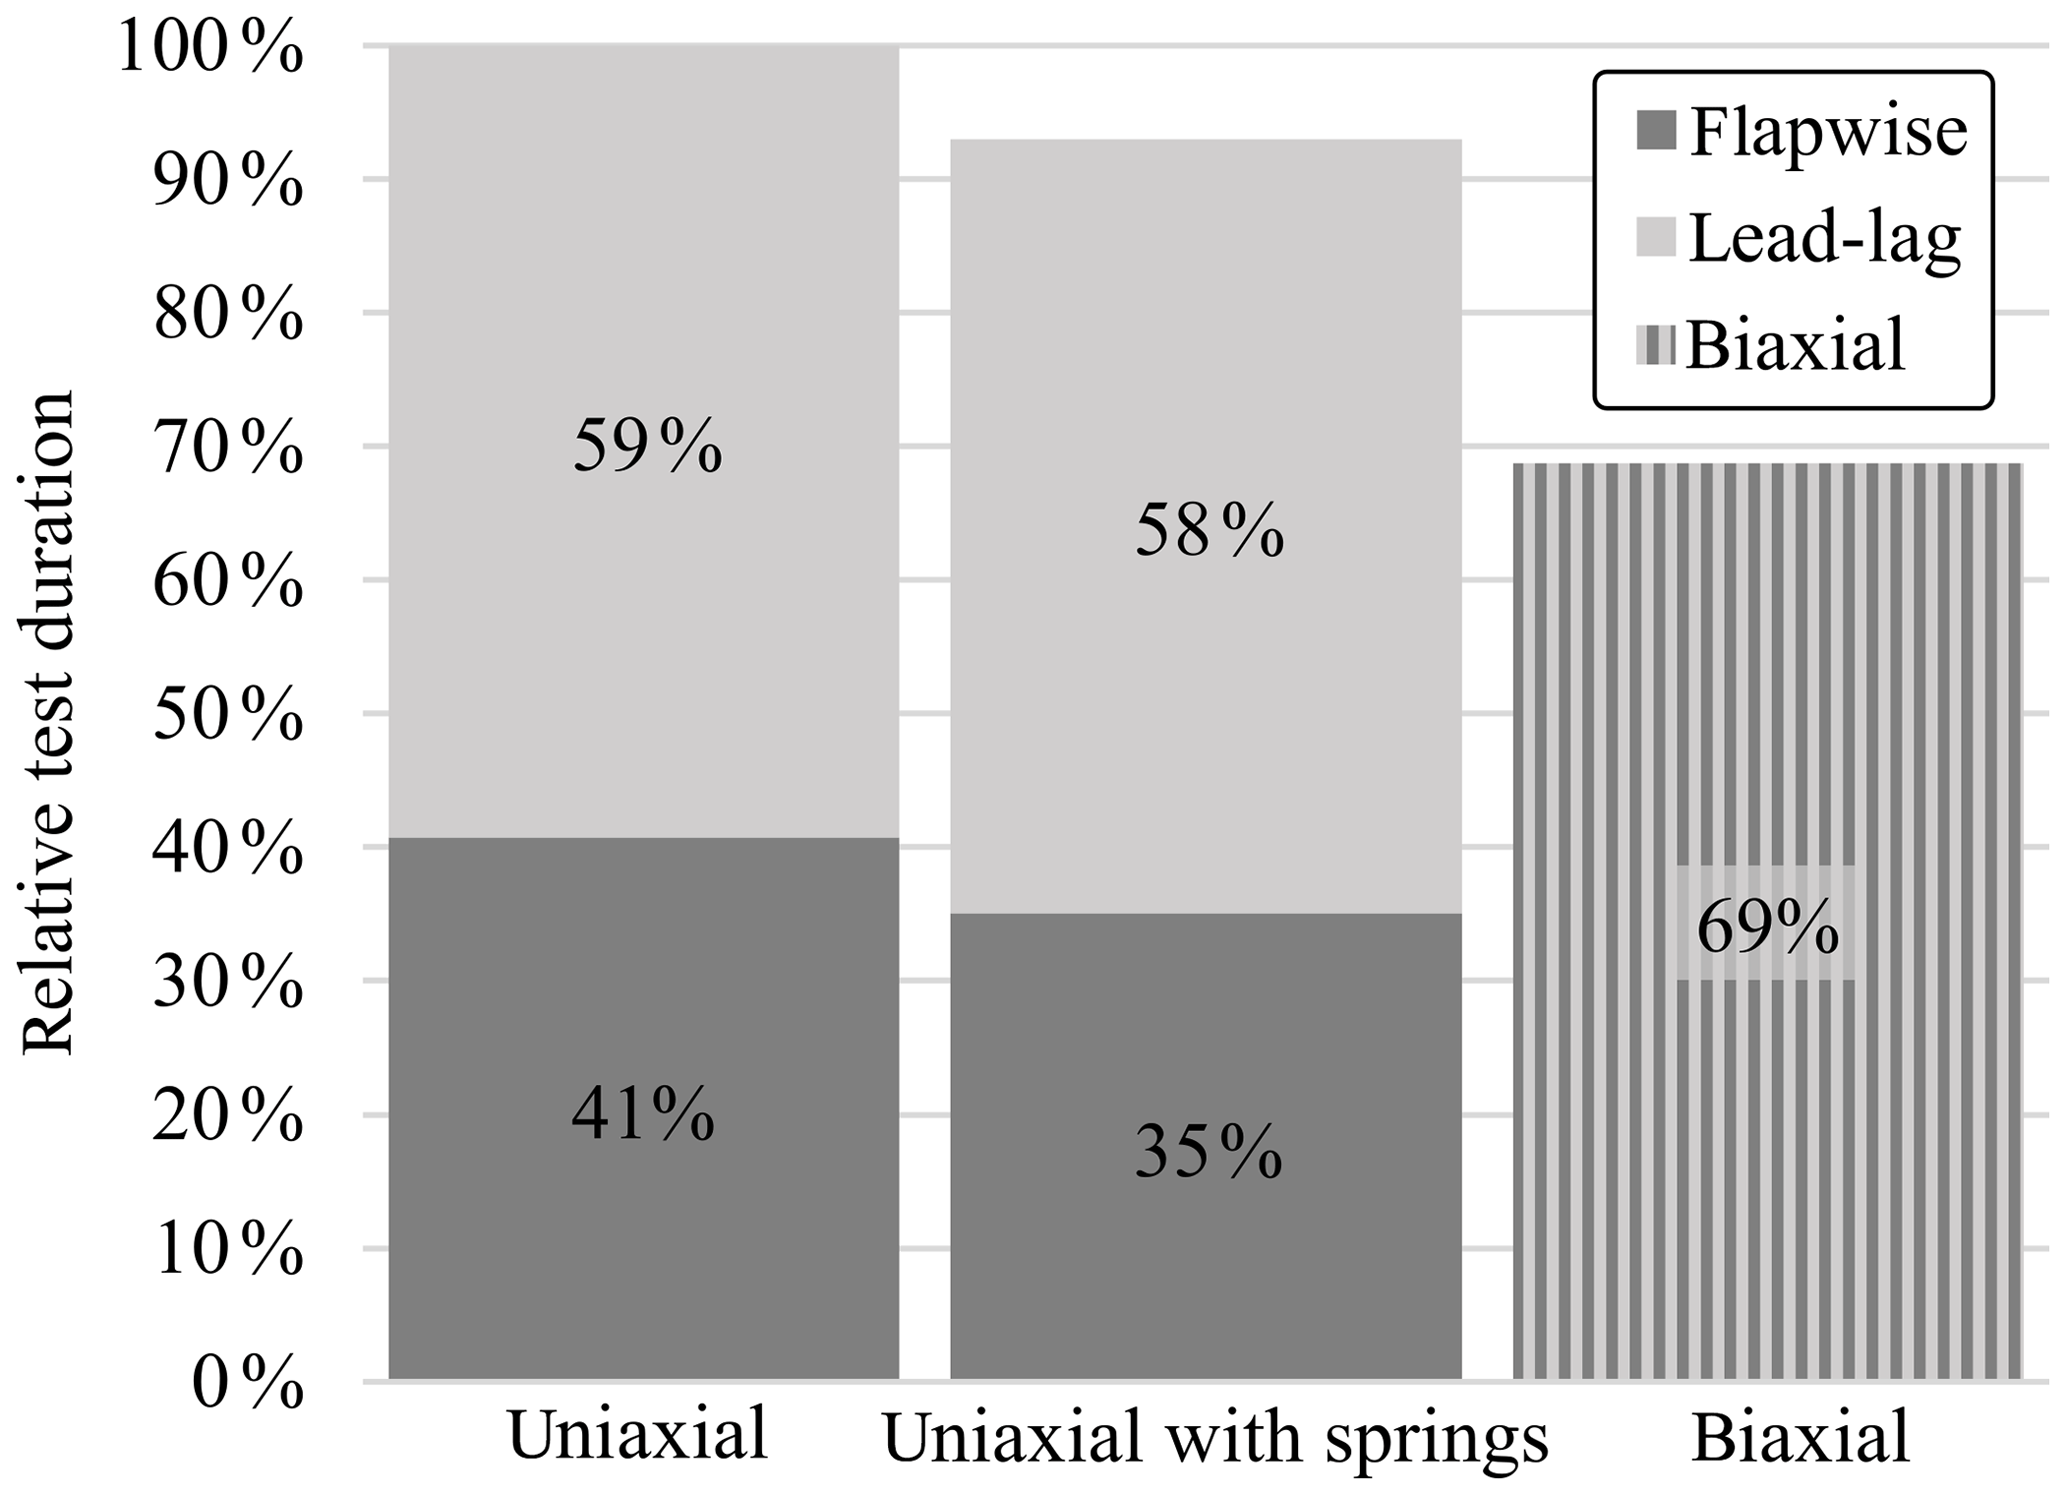
A comparison of the time required for the tests using the different setups is shown in Fig. 9. The test times shown only take into account the active testing time; setup, inspections and trial runs are not considered. They are derived from the test frequency and the required number of cycles. The total time required by both consecutive uniaxial tests without springs is used as the baseline reference for the comparison, i.e. 100 %. As the uniaxial lead-lag test needs twice as many cycles as the uniaxial flapwise test, it requires more time, even though the frequency is higher. When adding springs to the uniaxial tests, it is possible to reduce the total test time by 7 %. Changing to biaxial tests can save an additional 24 % of test time compared to the uniaxial test with springs.
This paper has presented an optimization scheme to find test setups for fatigue testing of wind turbine blades. Virtual masses and spring elements were implemented to tune the dynamic response of the test system. A case study was undertaken on a representative blade. Results show that the optimization method described is suitable to find both uniaxial and biaxial test setups.
For uniaxial test setups without spring elements, the optimization yielded results that satisfy all given boundary conditions in terms of required load distribution and local shear forces, yielding test frequencies of 0.57 Hz (flapwise) and 0.79 Hz (lead-lag direction). Compared to test setups that were defined manually, this is already an improvement in terms of testing time and overloading.
Furthermore, it was shown that an elliptical biaxial blade fatigue test using virtual masses and spring elements can save approximately 30 % of testing time relative to consecutive state-of-the-art uniaxial fatigue tests.
As the results show, for the flapwise test direction in particular, the required excitation forces are near the specified limit of 50 kN. This is due to the high aerodynamic damping resulting from the flapwise motion. Combining the biaxial test with aerodynamic fairings, as proposed by Pan et al. (2017), may reduce the damping and less force would then be needed.
Another approach to reduce the damping is to cut off more of the blade tip and combine biaxial with segmented testing. A further benefit of this would be the reduction in mass, thus raising natural frequencies and accelerating the test even further. In addition, the first flapwise and lead-lag natural frequencies of the root segment are closer to each other than those of the whole blade. Thus, fewer virtual elements may be needed to move the natural frequencies closer together to achieve elliptical biaxial testing.
Further future work includes extending the comparison of test loading and target loading in the flapwise and lead-lag directions to off-axis directions. This will show how much closer to the field conditions the loading applied in biaxial testing is compared to that in uniaxial tests.
The data that support the findings of this research are not publicly available due to confidentiality constraints.
DM, BM and SN conceptualized and defined the requirements for the method developed. BM supervised the work. DM developed the model code and performed the simulations. DM prepared the manuscript with contributions from all co-authors.
The authors declare that they have no conflict of interest.
This article is part of the special issue “Wind Energy Science Conference 2019”. It is a result of the Wind Energy Science Conference 2019, Cork, Ireland, 17–20 June 2019.
We acknowledge the support within the Future Concept Fatigue Strength of Rotor Blades project granted by the German Federal Ministry for Economic Affairs and Energy (BMWi) (0325939) and the Senator for Economic Affairs, Labour and Europe of the Free Hanseatic City of Bremen within the ERDF programme Bremen 2014–2020 (201/PF_IWES_ZK_Phase I/2017).
This research has been supported by the German Federal Ministry for Economic Affairs and Energy (grant no. 0325939) and the Senator for Economic Affairs, Labour and Europe of the Free Hanseatic City of Bremen within the ERDF programme Bremen 2014–2020 (grant no. 201/PF_IWES_ZK_Phase I/2017).
This paper was edited by Gerard J. W. van Bussel and reviewed by Peter Greaves and Nathan Post.
DNV GL AS: DNVGL-ST-0376 – Rotor blades for wind turbines, available at: https://rules.dnvgl.com/docs/pdf/DNVGL/ST/2015-12/DNVGL-ST-0376.pdf (last access: 7 June 2019), 2015.
Eder, M. A., Belloni, F., Tesauro, A., and Hanis, T.: A multi-frequency fatigue testing method for wind turbine rotor blades, J. Sound Vib., 388, 123–140, https://doi.org/10.1016/j.jsv.2016.10.032, 2017.
Greaves, P. R.: Wind Turbine Blade Fatigue Test Drag Coefficient CFD, ORE Catapult, https://doi.org/10.13140/RG.2.2.24839.01441, 2020.
Greaves, P. R., Dominy, R. G., Ingram, G. L., Long, H., and Court, R.: Evaluation of dual-axis fatigue testing of large wind turbine blades, P. I. Mech. Eng. C-J. Mec., 226, 1693–1704, https://doi.org/10.1177/0954406211428013, 2012.
Heijdra, J., Borst, M., and Van Delft, D.: Wind turbine blade structural performance testing, in: Advances in Wind Turbine Blade Design and Materials, Woodhead Publishing, Sawston, Cambridge, UK, https://doi.org/10.1533/9780857097286.3.432, 432–445, 2013.
IEC: IEC 61400-23 – Wind Turbines Part 23: Full-scale structural testing of rotor blades, International Electrotechnical Commission, Geneva, Switzerland, 2014.
Lee, H. G. and Park, J.-S.: Optimization of resonance-type fatigue testing for a full-scale wind turbine blade, Wind Energy, 19, 371–380, https://doi.org/10.1002/we.1837, 2016.
Pan, Z., Wu, J., Sun, Y., and Jian, L.: Effects of aerodynamic fairing on full scale blade fatigue test, IOP Conf. Series: Mat. Sc. and Eng., 207, 012083, https://doi.org/10.1088/1757-899X/207/1/012083, 2017.
Post, N. and Bürkner, F.: Fatigue Test Design: Scenarios for Biaxial Fatigue Testing of a 60-Meter Wind Turbine Blade, Tech. rep., National Renewable Energy Laboratory, Golden, CO, USA, https://doi.org/10.2172/1271941, 2016.
Rosemeier, M., Basters, G., and Antoniou, A.: Benefits of subcomponent over full-scale blade testing elaborated on a trailing-edge bond line design validation, Wind Energ. Sci., 3, 163–172, https://doi.org/10.5194/wes-3-163-2018, 2018.
Snowberg, D., Dana, S., Hughes, S., and Berling, P.: Implementation of a Biaxial Resonant Fatigue Test Method on a Large Wind Turbine Blade, Tech. rep., National Renewable Energy Laboratory, Golden, CO, USA, https://doi.org/10.2172/1155105, 2014.
White, D.: New method for dual-axis fatigue testing of large wind turbine blades using resonance excitation and spectral loading, Tech. rep., National Renewable Energy Lab., Golden, CO, USA, https://doi.org/10.2172/15007390, 2004.
White, D., Musial, W., and Engberg, S.: Evaluation of the new B-REX fatigue testing system for multi-megawatt wind turbine blades, in: Proceeding, ASME/AIAA Wind Energy Symposium, 10–13 January 2005, Reno, NV, USA, https://doi.org/10.2514/6.2005-199, 2005.
White, D., Desmond, M., Gowharji, W., Beckwith, J. A., and Meierjurgen, K.: Development of a dual-axis phase-locked resonant excitation test method for fatigue testing of wind turbine blades, in: ASME 2011 International Mechanical Engineering Congress & Exposition, 11–17 November 2011, Denver, Colorado, USA, https://doi.org/10.1115/IMECE2011-63724, 2011.
Zhang, J. Shi, K., and Liao, C.: Improved particle swarm optimization of designing resonance fatigue tests for large-scale wind turbine blades, J. Renew. Sustain. Energ., 10, 053303, https://doi.org/10.1063/1.5018227, 2018.
Detailed information on the blade cannot be provided due to confidentiality constraints.