the Creative Commons Attribution 4.0 License.
the Creative Commons Attribution 4.0 License.
 | 16 Jun 2020
Experimental investigation of aerodynamic characteristics of bat carcasses after collision with a wind turbine
Shivendra Prakash
Corey D. Markfort
A large number of bat fatalities have been reported in wind energy facilities in different regions globally. Wind farm operators are required to monitor bat fatalities by conducting carcass surveys at wind farms. A previous study implemented the ballistics model to characterize the carcass fall zone distributions after a bat is struck by turbine blades. The ballistics model considers the aerodynamic drag force term, which is dependent upon the carcass drag coefficient. The bat carcass drag coefficient is highly uncertain; no measurement of it is available. This paper introduces a methodology for bat carcass drag coefficient estimation. Field investigation at Macksburg wind farm resulted in the discovery of three bat species: the hoary bat (Lasiurus cinereus), eastern red bat (Lasiurus borealis), and evening bat (Nycticeius humeralis). Carcass drop experiments were performed from a dropping platform at finite height, and carcass position time series data were recorded using a high-speed camera. Falling carcasses were subjected to aerodynamic drag and gravitational forces. Carcasses were observed to undergo rotation, often rotating around multiple axes simultaneously, as well as lateral translation. The complex fall dynamics, along with drop from a limited height, prohibit the carcasses from attaining terminal velocity. Under this limitation, the drag coefficient is estimated by fitting a ballistics model to the measured velocity. Multivariable optimization was performed to fit the ballistics model to the measured velocity resulting, in an optimized estimate of the drag coefficient. A sensitivity analysis demonstrated significant variation in the drag coefficient with a small change in initial position, highlighting the chaotic nature of carcass fall dynamics. Based on the limited sample, the bat carcass drag coefficient and terminal velocity were found to be between 0.70–1.23 and 6.63–17.57 m s−1, respectively. The maximum distance carcasses are predicted to fall after impact with a typical utility-scale onshore wind turbine was computed using a 2-D ballistics model. Based on the range of drag coefficients found in this study, hoary and evening bats are estimated to fall within the rotor plane up to a maximum distance of 92 and 62 m, respectively, from the wind turbine tower. The ballistics model of carcasses after being struck by wind turbine blades can be used to obtain fall distributions for bats, guide carcass survey efforts, and correct survey data for limited or unsearched areas.
- Article
(1100 KB) - Full-text XML
-
Supplement
(607 KB) - BibTeX
- EndNote


Carbon emissions and subsequent climate change have motivated nations across the globe to develop energy sources and alternatives to fossil fuels, including wind energy. As a result, global wind energy production is continuously increasing with an average growth rate of 25 % yr−1 and a 69 % increase in wind energy estimated globally in 2018 and 2019 (US Energy Information Administration, 2018). Although wind energy is a renewable energy source, the vast development of wind facilities presents a threat to wildlife, especially to bats (Loss et al., 2013; Smallwood, 2013; Erickson et al., 2014). Wind power development causes indirect impacts through alteration and loss of bats' habitat due to construction, installation, and operation of wind turbines (Kuvlesky et al., 2007). A more direct impact of wind energy is that there are thousands of annual bat fatalities caused by the collision of flying bats with the spinning blades (Orloff and Flannery, 1992; Kunz et al., 2007; Arnett et al., 2010; Hayes, 2013; Smallwood, 2013). Lindeboom et al. (2011) investigated the ecological effects of an operational offshore wind farm in the Netherlands and identified bird collision with moving blades as a significant impact. In fact, bat mortality has been reported at every wind energy facility studied (GAO, 2005; Kingsley and Whittam, 2005; Kunz et al., 2007; National Research Council, 2007; Kuvlesky et al., 2007; Arnett et al., 2016).
Several studies have applied different methods to estimate the number of bats killed at wind energy facilities in the United States. Using model and survey data, Kunz et al. (2007) estimated there to be 33 000–111 000 annual bat fatalities at wind energy facilities. Cryan (2011) estimated annual bat fatalities to be 450 000 in North America based on a bat fatality rate of 11.60 bats MW−1 yr−1. While Smallwood (2013) estimated that 888 000 bats were killed in the United States in 2012, Hayes (2013) concluded that, in 2012, over 600 000 bats are likely to have died in the United States as a result of direct interactions with wind turbines. Since many bat species give birth to only 1 pup yr−1, and bats have high mortality rates during the first year of their life (O'Shea et al., 2004; Hallam and Federico, 2009), the estimated numbers of annual bat fatalities are considered to be significant. Van Kuik et al. (2016) concluded that bird and bat collision with rotating blades is one of the significant negative impacts of wind farm projects and emphasized biodiversity protection in identifying the ecological and economical challenges. It is not possible to prevent all bat deaths caused by wind turbines. However, bats on the United States Fish and Wildlife Service's (USFWS) Threatened and Endangered Species list must be monitored, and wind energy facilities must be permitted to ensure that allowable mortality rates, or so-called take, are not exceeded.
The USFWS requires wind farm operators to perform carcass surveys within a specified radius around wind turbines to estimate bat take. However, guidance for the prescribed search radius around turbines is based on limited data. This could result in surveys conducted where bats are unlikely to be found, or limited search areas could cause bat carcasses that land outside the survey area to be missed. Turbine operators need a reliable method to guide survey efforts and determine the appropriate extent of surveys, targeting only areas where bat carcasses are likely to be found around the turbines. A technically defensible survey is critical to help operators determine whether wind turbines adversely affect listed species and to evaluate project impacts.
Figure 1 shows a schematic of the three-blade horizontal axis turbine with associated components including the tower, hub, rotor blades, and rotor-swept area. The vertical distance from the ground to the turbine hub is called the hub height. In Fig. 1, three rotor blades are denoted in gray and the dotted red periphery indicates the rotor-swept area.

Only a few studies, including Arnett (2005) and Smallwood and Thelander (2005), have estimated the fall zone for birds and bats to guide carcass search area. Osborn et al. (2000) quantified the search area by dropping carcasses from the nacelle and the upper and lower bounds of the rotor-swept area on days with brisk wind. However, this method did not consider the effect of impact with rotating blades on the carcass fall trajectory. Gauthreaux (1996) suggested that the search area should be circular, with a minimum radius proportional to the height of the turbine. He suggested the search area to be within 70 m of a wind turbine. Thelander and Rugge (2000) found the average fall distance of birds to be 20.20 m, with 75 % of birds falling less than 30 m away from the tower. It is not clear whether some of these studies have bias in search radius estimates due to insufficient search zones. Smallwood (2007) mentioned that an inadequate search radius could cause bias in the carcass survey data.
Huso and Dalthorp (2014) proposed polynomial logistic regression models of relative carcass density as a function of distance from the nearest turbine. The study considered the carcass search locations at several turbine sites in Philadelphia: 15 turbines at Locust Ridge in 2010 and 22 and 15 turbines at Casselman in 2008 and 2011, respectively. The best-fit logistic model of carcass densities was found to be cubic for Casselman and linear for Locust Ridge. This study limited the search area for bat carcasses to 80 m. If the bat carcasses landed beyond the 80 m distance, the surveyor missed those bat carcasses.
Additionally, investigators have applied physics-based models for estimating the trajectory of objects thrown from turbine blades, including ice fragments and parts of broken blades. Biswas et al. (2011) used a ballistics model to estimate the trajectories and landing zones of ice fragments thrown from wind turbine blades. They considered a turbine with 45 m long blades and a hub height of 100 m and found ice fragments could travel up to 350 m from the base of the turbine. Sarlak and Sørensen (2015) investigated the trajectories of thrown objects from a 2.3 MW horizontal axis wind turbine upon blade failure. They found that under normal operating conditions, the blade fragments can land between 100 and 500 m, depending on their size. Both studies solved the equations describing the physics of ballistics using the fourth-order Runge–Kutta (RK4) numerical scheme.
Hull and Muir (2010) (referred to as HM10) utilized ballistics theory to propose a model to estimate the fall zone of different-sized bird and bat carcasses struck by different-sized turbines. The two-dimensional (2-D) ballistics model describes the trajectory of bat carcasses within the rotor plane by relating the variation in fall velocity to the net resultant forces on a carcass, which include gravitational and aerodynamic drag forces. HM10 also employed the RK4 method to numerically integrate the ballistics model and determine the position and velocity of the carcass relative to the turbine base at each time step. They assumed bats are incapacitated after being struck by a blade and therefore unable to affect their fall trajectory. They also assumed carcasses would be stationary in the rotor plane before being hit by the blade and therefore did not account for any initial precollision velocity. They also assumed calm conditions with no turbulence, resulting in no wind drift effects on the carcasses' fall trajectory, and they assumed an equal likelihood of strike anywhere in the rotor-swept area. They modeled a carcass as a tumbling object, allowing the projected area and drag coefficient (Cd) to change randomly during the fall. They performed simulations assuming a coefficient of restitution (e) of zero. The coefficient of restitution is a factor that determines the fraction of energy transferred from the turbine blade to the bat carcass. It is defined as the ratio between the restoration and deformation impulses in a direction normal to the plane of contact. The factor incorporates effects of bat orientation at the moment of strike and contact time of a bat with a turbine blade. The value of e varies between e=0, representing a fully inelastic collision, to e=1, representing a fully elastic collision. Finally, HM10 proposed a simple multiple linear regression model considering hub height and rotor radius as input variables to estimate the carcass search radius. The maximum distance a bat carcass falls away from the base of a turbine after collision with a rotating blade is governed by a number of factors, but arguably the most uncertain are the carcass aerodynamic characteristics. To compute the drag force, HM10 assumed a standard drag model proportional to the carcass fall speed squared. The proportionality constant Cd for bat carcasses was assumed to be 1 and to randomly vary between 0.875–1.125. The drag coefficient is a measure of the effectiveness of a streamlined object in reducing the fluid resistance faced by the object motion. A low drag coefficient means that the streamlined shape of an object enables it to move easily through the ambient fluid due to minimum resistance, whereas a high drag coefficient implies the poor streamlining of the object, causing high resistance to motion. There is little guidance available for the appropriate drag coefficient Cd when modeling the ballistics of bats, particularly for carcasses of different species. Norberg (1976) proposed a Cd range of 0.40–1.20 for a flying long-eared bat. But this is only applicable for live bats. HM10 indicated that little evidence exists to understand the aerodynamic characteristics of injured birds and bats. Hedenström and Liechti (2001) estimated Cd of passerine birds by measuring their terminal dive speed. They stated that some passerine birds terminate their migration by diving abruptly toward the ground before landing. They measured dive trajectories by tracking birds with radar. They maintained a tracking time long enough to allow the diving birds to attain terminal velocity and estimated the drag coefficient by balancing drag force with the weight of the bird. Based on measurements for 39 cases of diving birds, the drag coefficient was estimated to be 0.37±0.13. Haider and Levenspiel (1989) argued that the terminal velocity, rather than the drag coefficient, may be of ultimate interest. The benefit of terminal velocity as a metric for aerodynamic characteristics is that the projected area does not need to be characterized.
Given the lack of available measurements of Cd for bat carcasses and the large range of previously reported values, which are limited to a specific species of live bats and birds, modeled carcass fall zone distribution and maximum fall distance remain highly uncertain. Reliable estimates of Cd for individual species with different mass, size, and shape are needed to accurately model carcass fall trajectories and to determine the maximum fall distance. The main objective of the present study is to estimate the drag coefficient of bat carcasses using ballistics theory with data collected from bat carcass drop experiments. For the first time, fresh carcasses were dropped and tracked using high-speed cameras. The measured time vs. position data with well-known physics describing ballistics were used to obtain the first direct estimates for a range of bats commonly impacted by wind turbines.
The following sections are organized as follows: the experimental methodology presents the research design for estimation of the carcass drag coefficient, the description of the ballistics model, the experimental setup, data acquisition, limitations of the measured data, and the Cd estimation algorithm (details are discussed in the Supplement). Following the methodology section, we present results for the estimated drag coefficients and terminal velocity. We briefly explore the fall zone histograms according to HM10 to demonstrate the sensitivity of fall distances to the choice of drag coefficient. Finally, we present a summary and conclusions from the study.
2.1 Research design for drag coefficient estimation
The following methodology was employed to determine drag coefficients for bat carcasses:
-
Collect fresh bat carcasses representing a range of species, and perform carcass drop experiments to acquire the time vs. position data during each fall.
-
Evaluate whether the carcasses attain terminal velocity during the fall. If a carcass attains terminal velocity, calculate the drag coefficient by equating the drag force to the carcass weight.
-
If carcasses do not attain terminal velocity, estimate the carcass drag coefficient by fitting the ballistics model to the measured velocity.
2.2 Ballistics model description
Motion of falling bodies can be described physically based on projectile and ballistics models. The projectile motion of an inertial particle only considers the influence of gravity on the fall trajectory and neglects aerodynamic drag. An analytical solution of projectile motion can easily be obtained and applied to evaluate trajectories. However, drag can significantly alter the particle trajectory, and therefore, a more realistic description of motion follows the ballistics model, which incorporates the quadratic drag model to account for the effect of fluid resistance. A simplified, 2-D version of the ballistics model was employed by HM10, solving the following set of equations describing the ballistics motion for velocity and acceleration of a bat carcass:
where mp is carcass mass, Ap is carcass projected area, Cd is carcass drag coefficient, uf is the fluid velocity vector, up is the carcass velocity vector, xp is the fall position vector of a carcass with respect to the turbine base, ρf is the fluid density, and g is the gravitational acceleration vector. The equations of motion described here are coupled nonlinear equations. The analytical solution of a one-dimensional (1-D) ballistics model for an isotropic object falling from rest under quiescent-flow conditions can be obtained. For any object falling in a vertical direction (z) from rest in quiescent flow, Eq. (1) can be rewritten in the following form (upward: +; downward: −):
By integrating Eq. (2), the analytical expression for carcass instantaneous velocity (w(t)) with zero initial velocity (w at ) can be expressed as
where is the terminal velocity attained by the carcass under dynamic equilibrium conditions, and w(t) is the instantaneous velocity. By integrating Eq. (3) with respect to time, the analytical solution for carcass instantaneous position, z(t), can be obtained as
where z0 is the carcass drop height at time t=0.
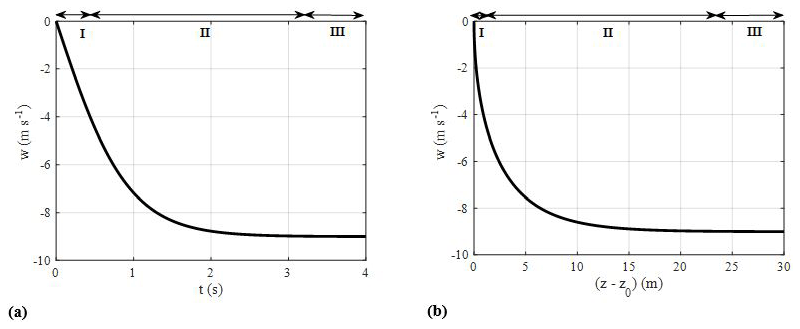
Figure 2(a) Ballistics fall curves illustrating three fall phases (I, II, and III) and (b) velocity variation with position relative to the drop height z0.
Figure 2a represents the time vs. velocity plot obtained from the analytical solution of the ballistics model (Eq. 3) by considering the mean values of mp=14 g, Ap=28 cm2, and Cd=1 for bat carcasses from HM10. The acceleration curve in Fig. 2a shows that a falling carcass undergoes three phases.
- I.
Initial projectile phase. In this phase, the carcass starts from rest, gaining a small magnitude of velocity entirely due to the force of gravity. As a result, the resistive drag force is negligible compared to the gravitational force. This stage of fall is represented by Phase I in Fig. 2a, highlighting that the net acceleration is nearly constant.
- II.
Transition phase. In this phase, the resistive drag force gains more strength because of an increase in velocity and eventually equals the gravitational force to attain the terminal velocity. The transition phase represents fall dynamics when both gravity and drag forces are important in determining the net acceleration. Graphically, it can be seen in Phase II in Fig. 2a, where the velocity asymptotically transitions between the gravity-dominant phase and the terminal-velocity phase. The magnitude of the resistive drag force is dependent on the empirical drag coefficient (Cd) of bat carcasses.
- III.
Terminal velocity phase. In this phase, the carcass attains terminal velocity as the drag force equals the gravitational force. The terminal velocity of this particular bat carcass (from HM10) is found to be 9 m s−1. This feature in Fig. 2a is evident by the leveling off of the curve (Phase III) when the carcass velocity becomes constant during the later stages of the fall.
A common approach for measuring the drag coefficient of an object is to drop the object, allow it to achieve terminal velocity, and then obtain the result by balancing drag force with gravitational force. Figure 2b shows the velocity variation with position for the initial drop height (z0) of zero. This gives an estimate of the height from which the carcass must be dropped to attain terminal velocity. Figure 2b shows that the dropped bat carcass attains a terminal velocity of 9 m s−1 after falling a distance of 24 m. This indicates that a drop experiment intended to compute the drag coefficient requires the carcass to be dropped from a height of approximately 30 m from the ground.
2.3 Experimental equipment, materials, and procedures
The ballistics model would be useful for guiding carcass surveys if it can accurately predict carcass fall trajectories. This can only be done if the aerodynamics of the carcasses are known. Given the lack of available Cd measurements for bat carcasses, carcass drop experiments were performed with specimens discovered at a wind farm using a high-speed camera. Biologists discovered three fresh bat carcasses of three species at the Macksburg wind farm in Iowa while conducting postconstruction surveys on the day of the experiment. They included the hoary bat (Lasiurus cinereus), eastern red bat (Lasiurus borealis), and evening bat (Nycticeius humeralis). The Macksburg wind farm consists of 52 Siemens SWT-2.3 MW wind turbines. The turbine rotor has a radius of 54 m and a hub height of 80 m. The mass, body length (excluding tail), and lateral body dimension of the bat carcasses were measured using an electronic weighing scale and a ruler. The body dimension measurements were used to compute the carcass projected area (Ap).
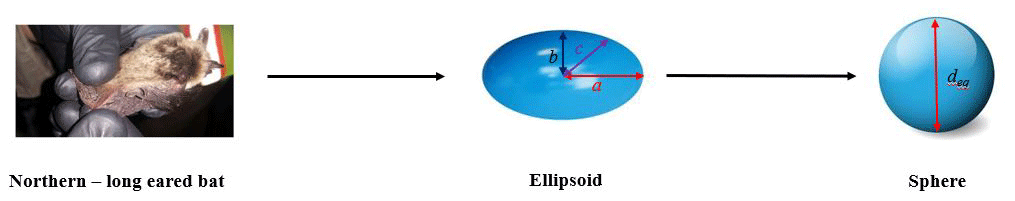
Figure 3Illustration of the simplified geometric representation of bats for the ballistics model. The image (WEST, Inc., 2016) is of a northern long-eared myotis.
Firstly, the irregularly shaped carcass was approximated as an ellipsoid (Fig. 3). The symbols a and b (=c) represent the dimensions along the ellipsoid semimajor and semiminor axis, respectively. The carcass projected area (Ap) was computed as , where deq is the equivalent diameter of the sphere having the same volume as that of the ellipsoid shaped bat of dimensions a, b, and c. Equating the volume of a sphere (left-hand side) with an ellipsoid (right-hand side) in Eq. (5) gives an equivalent diameter (Eq. 6). The wings of the bat are assumed to be folded and flush with the body during the fall as observed from the high-speed images of the carcass drop experiments, which as a result eliminates a source of uncertainty in the projected area computation. It is possible that the wing may be severely broken when it is struck by the blade, and therefore this simplification may not be applicable in all carcass fall cases.
Table 1 lists the mass, body dimensions, equivalent diameter, and projected area of bat carcasses discovered on the day of the experiments. The range of bat carcass mass and size is represented by a large, medium, and small bat. The hoary bat was the largest with, a significantly larger mass and area than the others, whereas the evening bat was the lightest and smallest bat.
Table 1Physical properties of freshly discovered bat carcasses.
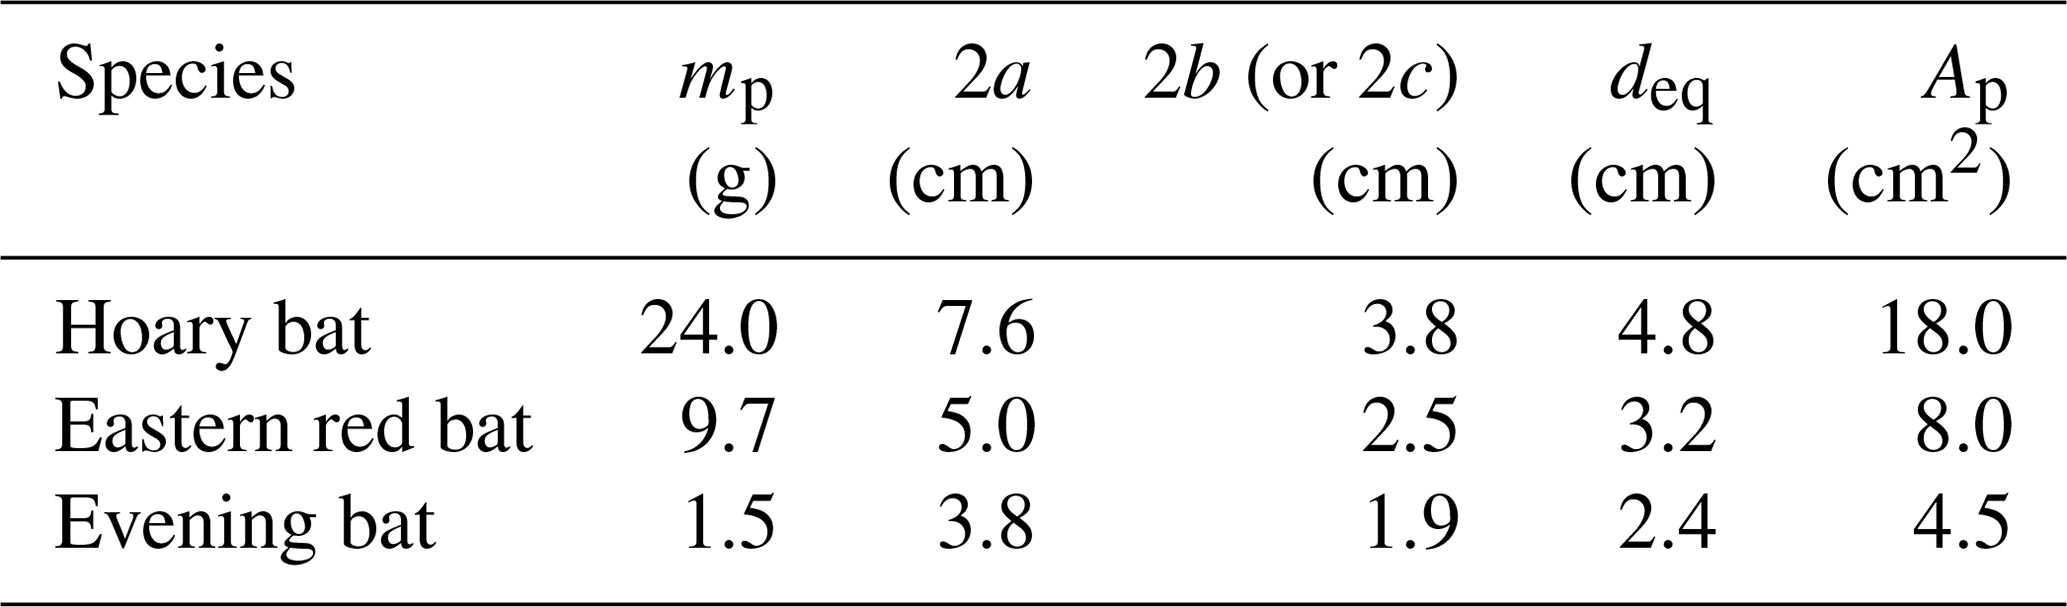
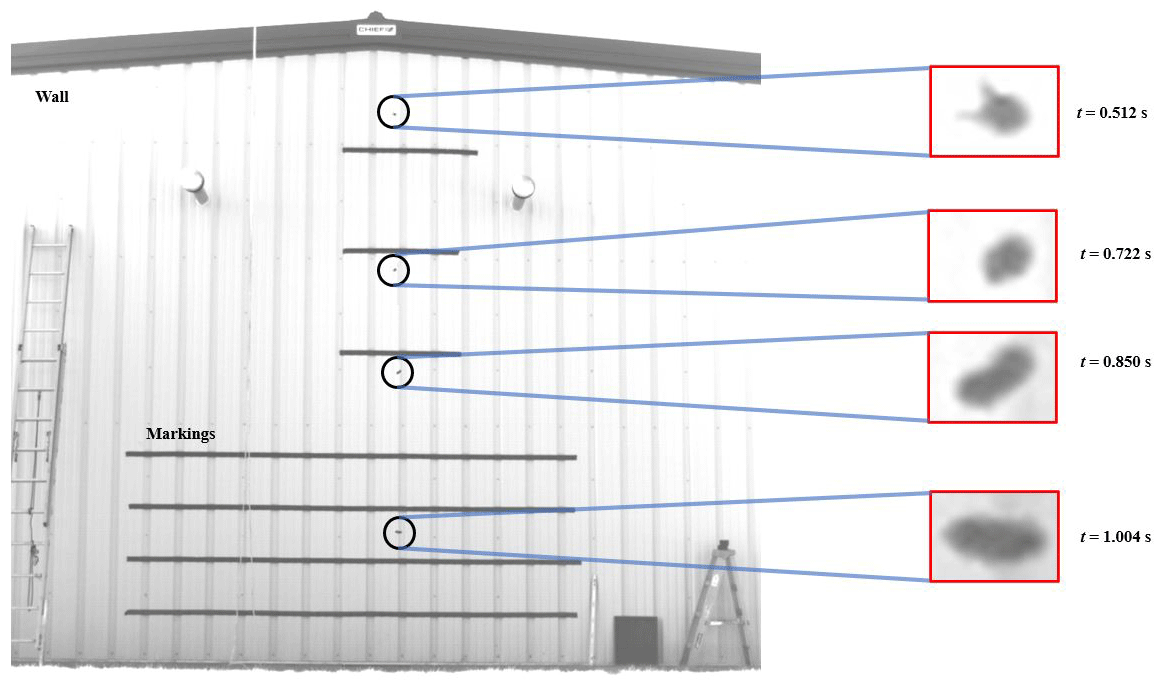
Figure 4Composite image illustrating an example carcass drop experiment (drop test 1 for the hoary bat).
Figure 4 shows an annotated composite image of the bat carcass drop experiment, showing a carcass at four instances. Freshly collected carcasses were dropped in front of a 6.30 m high wall on the leeward side of a building to achieve approximately quiescent or no wind conditions. For each species, two experiments were performed and recorded using a high-speed camera to extract the time series of carcass position. The wall was marked using horizontal strips of tape over a total distance of 4.50 m. A schematic of the side view of the experimental setup is shown in Fig. 5. The figure includes an illustration of various experiment components, including the location of the wall with markings, the location of the camera and its field of view, and the position of the dropping platform. The carcass drop tests were performed from a dropping platform located 1 m in front of the wall (y2 in Fig. 5). A high-speed camera (NX4, S2 model) from Integrated Design Tools, Inc. (IDT), Pasadena, California, was used to record the carcass drop experiments. The camera was mounted on a tripod positioned at a distance of 18 m from the wall (y1+y2, as shown in Fig. 5). The array size of the images acquired by the camera was 1024 pixels×1024 pixels. Black tape markings on the wall were precisely spaced as shown and were used to calibrate the images to determine the size of a single pixel. It was determined that the pixel resolution was 7.10 mm. The camera was set to record at 500 frames s−1, giving a temporal resolution of 0.002 s.
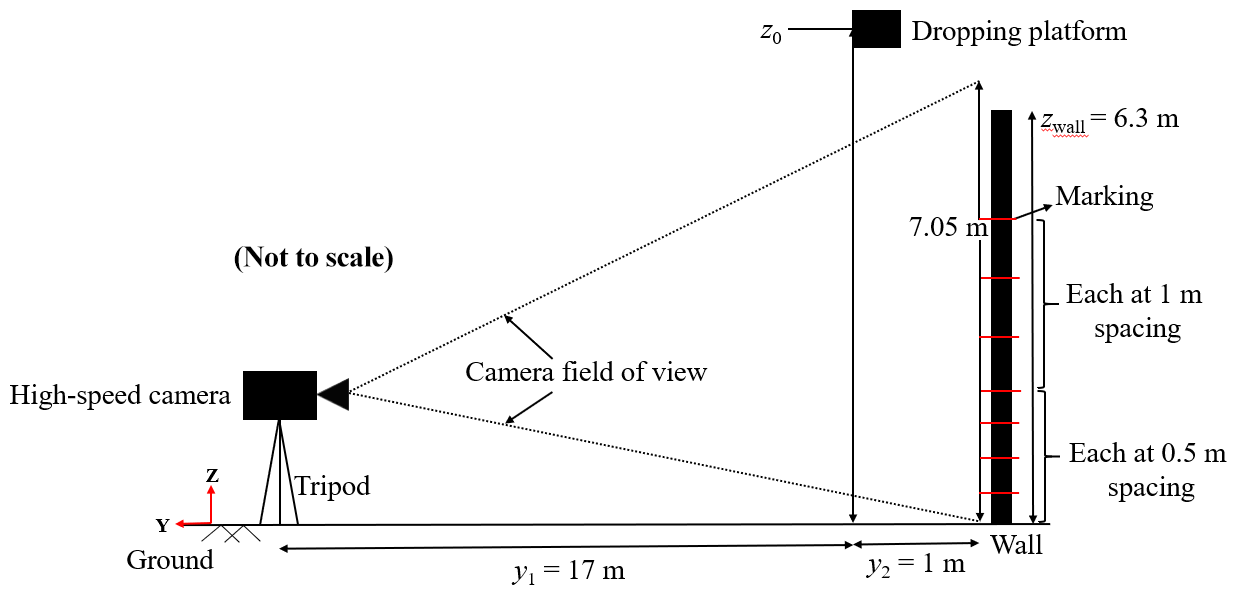
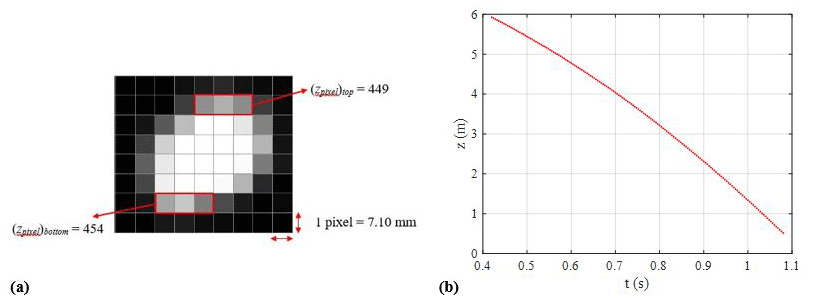
Figure 6(a) Example of a position measurement for the hoary bat and (b) plotted measurements of time vs. position.
The images obtained from the high-speed video recording were used to determine the vertical position (z) of the bat carcass at a specific instant. Bat carcasses are irregularly shaped and have a finite size. Motion Studio X64 software, which includes applications for the operation of the IDT high-speed digital cameras, was used to extract the carcass pixel information from each image frame containing a falling carcass. For example, Fig. 6a shows a cropped image recorded at t=0.722 s of drop test 1 for the hoary bat carcass. The position of the carcass is measured by determining the location of the center of the carcass image. In this example, we can see the top and bottom of the carcass in the image and determine the corresponding pixel coordinates, i. e., (zpixel)top and (zpixel)bottom. The values of (zpixel)top and (zpixel)bottom were found to be 449 and 454 pixels, respectively (see Fig. 6a). The centroid is found to be at 451.50 pixels. Applying the image calibration of 7.10 mm per pixel gives the carcass position with respect to the ground (z=3.86 m). This procedure was carried out for each carcass image recorded during the carcass drop experiment. The internal timer of the camera provided a timestamp for each image, which was used with the position data to generate a time vs. position time series. With a time resolution of Δt=0.004 s, a plot of time vs. height is shown for test 1 for the hoary bat (Fig. 6b).
2.4 Velocity (w) estimates from measured position (z)
The time vs. position data obtained from high-speed imaging were used to calculate the fall velocity (w) using the central-differencing numerical scheme (Chapra and Canale, 2010). The numerical scheme for determining vertical velocity (w) at the ith time instant is given by
where z(i−1) and z(i+1) represent the carcass position at times (i−1) and (i+1), respectively. Figure 7 shows the velocity computations obtained by applying the central-differencing scheme to the measured position data. The falling objects reach their terminal velocity, wt, when the force of gravity is balanced by the aerodynamic drag force. However, because of the limited drop height, none of the carcasses attained terminal velocity during the experiments as the data points of the measured velocity lie nowhere close to the terminal velocity region shown in Fig. 7. Since the bat carcasses did not achieve terminal velocity during the experiments, it is not possible to calculate Cd by equating the drag force with the gravitational force. However, with the assumption of terminal velocity attainment at the end of the carcass fall trajectory, the drag and gravitational force can be equated to each other in order to compute carcass Cd. The instantaneous velocity estimate at the end of a particular carcass drop experiment and corresponding Cd for the three discovered species are mentioned in Table 2.
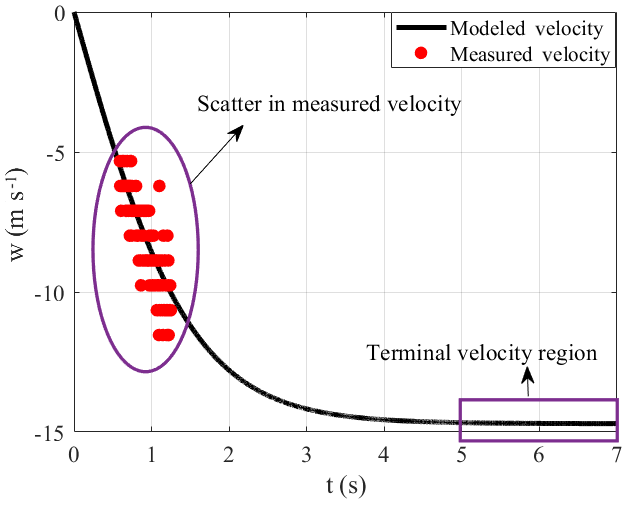
Table 2Drag coefficient computed from the terminal velocity assumption.

Next, we compare the Cd results in Table 2 to estimates of the drag coefficient Cd obtained by fitting the ballistics model to the fall velocity data. However, as seen in Fig. 7, the velocity computed from the measured position at a temporal resolution of 0.004 s exhibits significant scatter. Based on careful observation of measured velocity, one notices a stratification in the velocity values as the measured velocity only attains few selective values. The scatter in the velocity measurements needs to be eliminated by filtering the raw position data at an appropriate coarsening window (Δtc) to obtain a scatter-free measured velocity dataset.
The analysis of the high-speed video of the carcass drop experiments showed that horizontal carcasses movement is negligible except for in the case of the evening bat carcass, which experienced oscillating lateral translation with an amplitude on the order of 10 cm, or about 2.5 body lengths. Based on our observations, carcasses are assumed to fall along the vertical line at a distance y2 from the wall. Figure 4 highlights snapshots of the hoary bat carcass' numerous orientation features at different time instants. These characteristics emerge because of carcass shape asymmetry and change in the carcass' aerodynamics during the drop experiments from limited height, which ultimately prevents it from attaining the terminal velocity. The complex traits of the carcass fall dynamics can be averaged by selecting the measured position values over an appropriate filtering window (Δtc). The scatter in measured velocity is due to the carcass displacements, measured with the high-speed camera, being small compared to the spatial resolution of the camera. An improved analysis methodology is required to obtain robust estimates of the carcass drag coefficient.
Mann et al. (1999) and Ott and Mann (2000) proposed a refined methodology for determining the position of the particles occupying more than 1 pixel in the image, similar to the bat carcasses in the present study. This procedure demonstrated position estimation of particles in images with enhanced precision of 0.10–0.02 pixels by fitting a Gaussian function to the particle image based on grayscale intensity. This analysis methodology is recommended for high-precision position measurements from images. This approach was demonstrated for images of the first hoary bat drop experiment. The carcass position measurements obtained from the refined methodology were found to be similar to the measurements from the carcass' top and bottom pixel coordinates, with the difference being of the order of 1.50 pixels. The detailed procedure and results of fitting the Gaussian distribution to pixel coordinate and intensity measurements of the first hoary bat drop experiment images are presented in the Supplement.
2.5 Refined methodology for carcass drag coefficient estimation
The ballistics model defined by Eq. (1) is an initial value problem, where the initial condition for position (z0) and velocity (w0) is required to solve it analytically or numerically. Unfortunately, the carcass was dropped from a height above the field of view of the camera, and therefore it was not visible in the recorded images. Therefore, z0 and w0 could not be directly determined. The uncertainty of z0 and w0 generated two additional unknown variables. As discussed earlier in Sect. 2.4, the measured velocity data obtained with high-speed imaging have significant scatter, which needs to be filtered to obtain scatter-free velocity to fit the ballistics model and compute a robust estimate of Cd. This may be performed by employing a multivariable optimization. We demonstrate an approach to find the optimal resolution (Δtc) of the measured data, giving the best-fit to the ballistics model with optimized estimates of z0, w0, and Cd in the Supplement, which contains the step-by-step description of the proposed multivariable optimization algorithm.
The proposed Cd estimation algorithm based on multivariable optimization was applied to the measured velocity from the bat carcass drop experiments. The specific details of the optimization process are presented in the Supplement. Table 3 summarizes the optimal filtering window (Δtc), initial position (z0), drag coefficient (Cd), and terminal velocity (wt) obtained by applying the multivariable optimization algorithm to the measured velocity of the carcass drop experiments for the three bat species. On comparing Cd values from Tables 2 and 3, it is apparent that there are significant differences in Cd estimates of the hoary bat and the eastern red bat from the two approaches. This confirms that heavier carcasses had not attained terminal velocity at end of the carcass drop experiment, which if assumed would lead to overestimated values of Cd for these species. However, for the evening bat, Cd estimates from the two approaches were found to be comparable, indicating the possibility of the evening bat nearly reaching terminal velocity during the last stages of a fall when starting from a height of 7.20 m above the ground.
Table 3Optimal filtering window, initial position, drag coefficient, and terminal velocity.
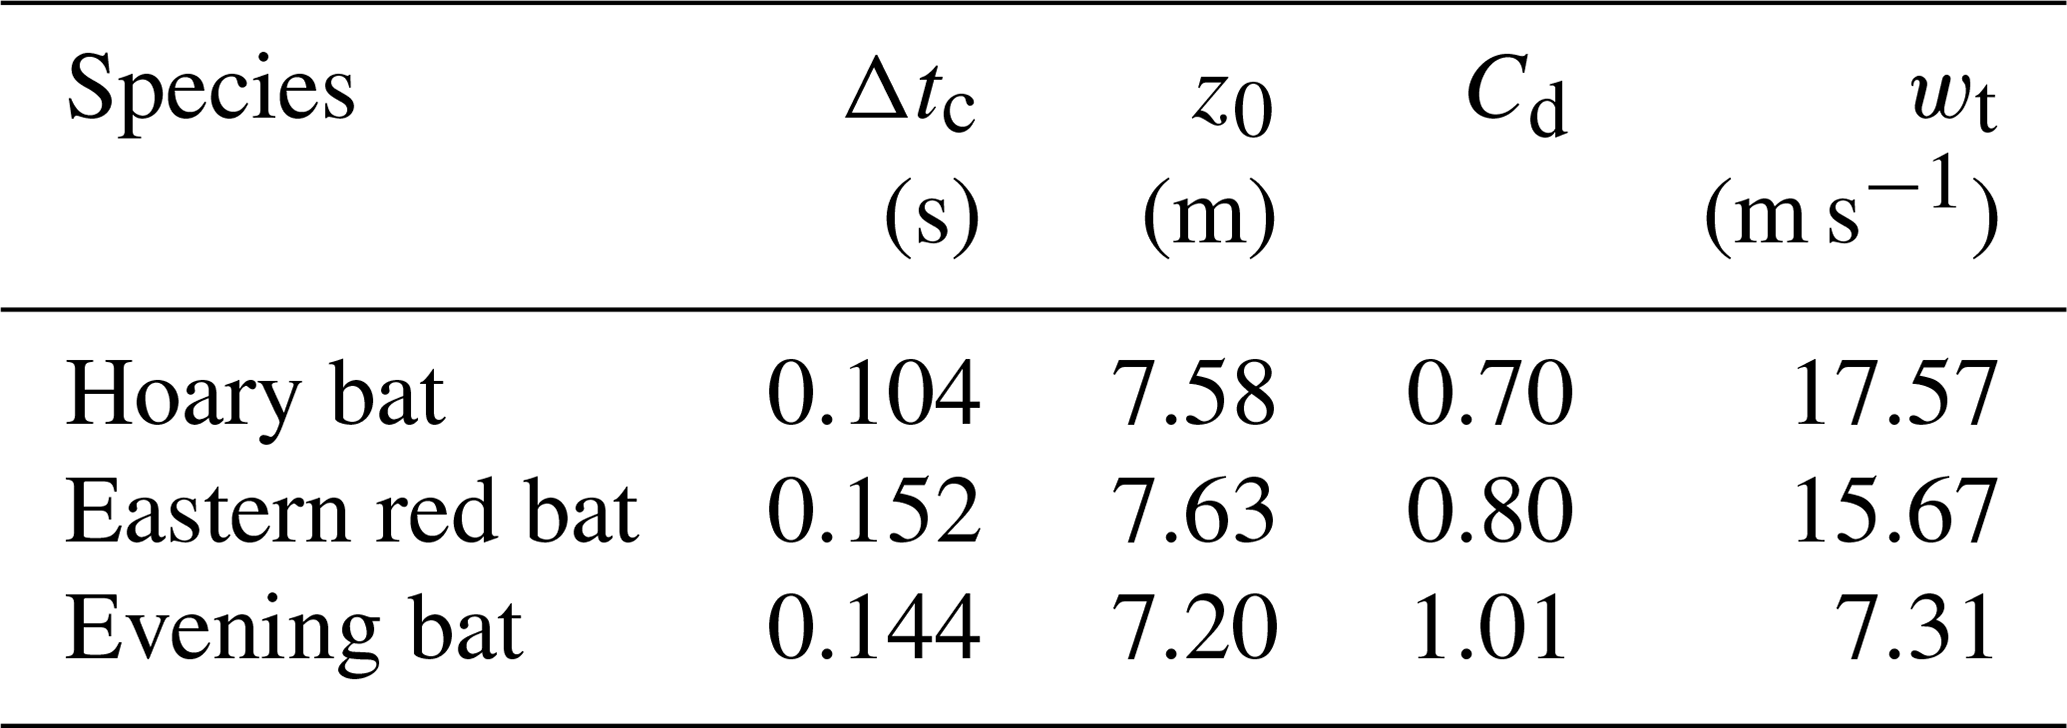

Figure 8Comparison of position (a–c) and velocity (d–f) of the analytical solution and measured data for carcass drop tests of three bat species.
The accuracy of optimal z0 and Cd was tested by comparing the measured velocity and position at the optimal filtering window, Δtc, to the analytical solution of velocity and position described by Eqs. (3) and (4), respectively. Figure 8 displays the comparison of experimental observations with the analytical solution for position (left) and velocity (right) for the hoary bat (top row), eastern red bat (middle row), and evening bat (bottom row). It is evident from the figure that the position and velocity measurements for optimum Δtc are in good agreement with the analytical solution of position and velocity, obtained by using the optimized z0 and Cd values.
The sensitivity of Cd with respect to z0 is evaluated by perturbing the optimized z0 by a small amount (±1 %) and determining the percentage variation in optimized Cd estimates (with the Δtc reported earlier). Table 4 presents the varied z0 values (column 2), corresponding Cd estimates (column 3), and the percentage of difference in Cd (column 4, considering optimized Cd in Sect. 3 as the reference) for each bat species.
Table 4Drag coefficient sensitivity with respect to initial position.
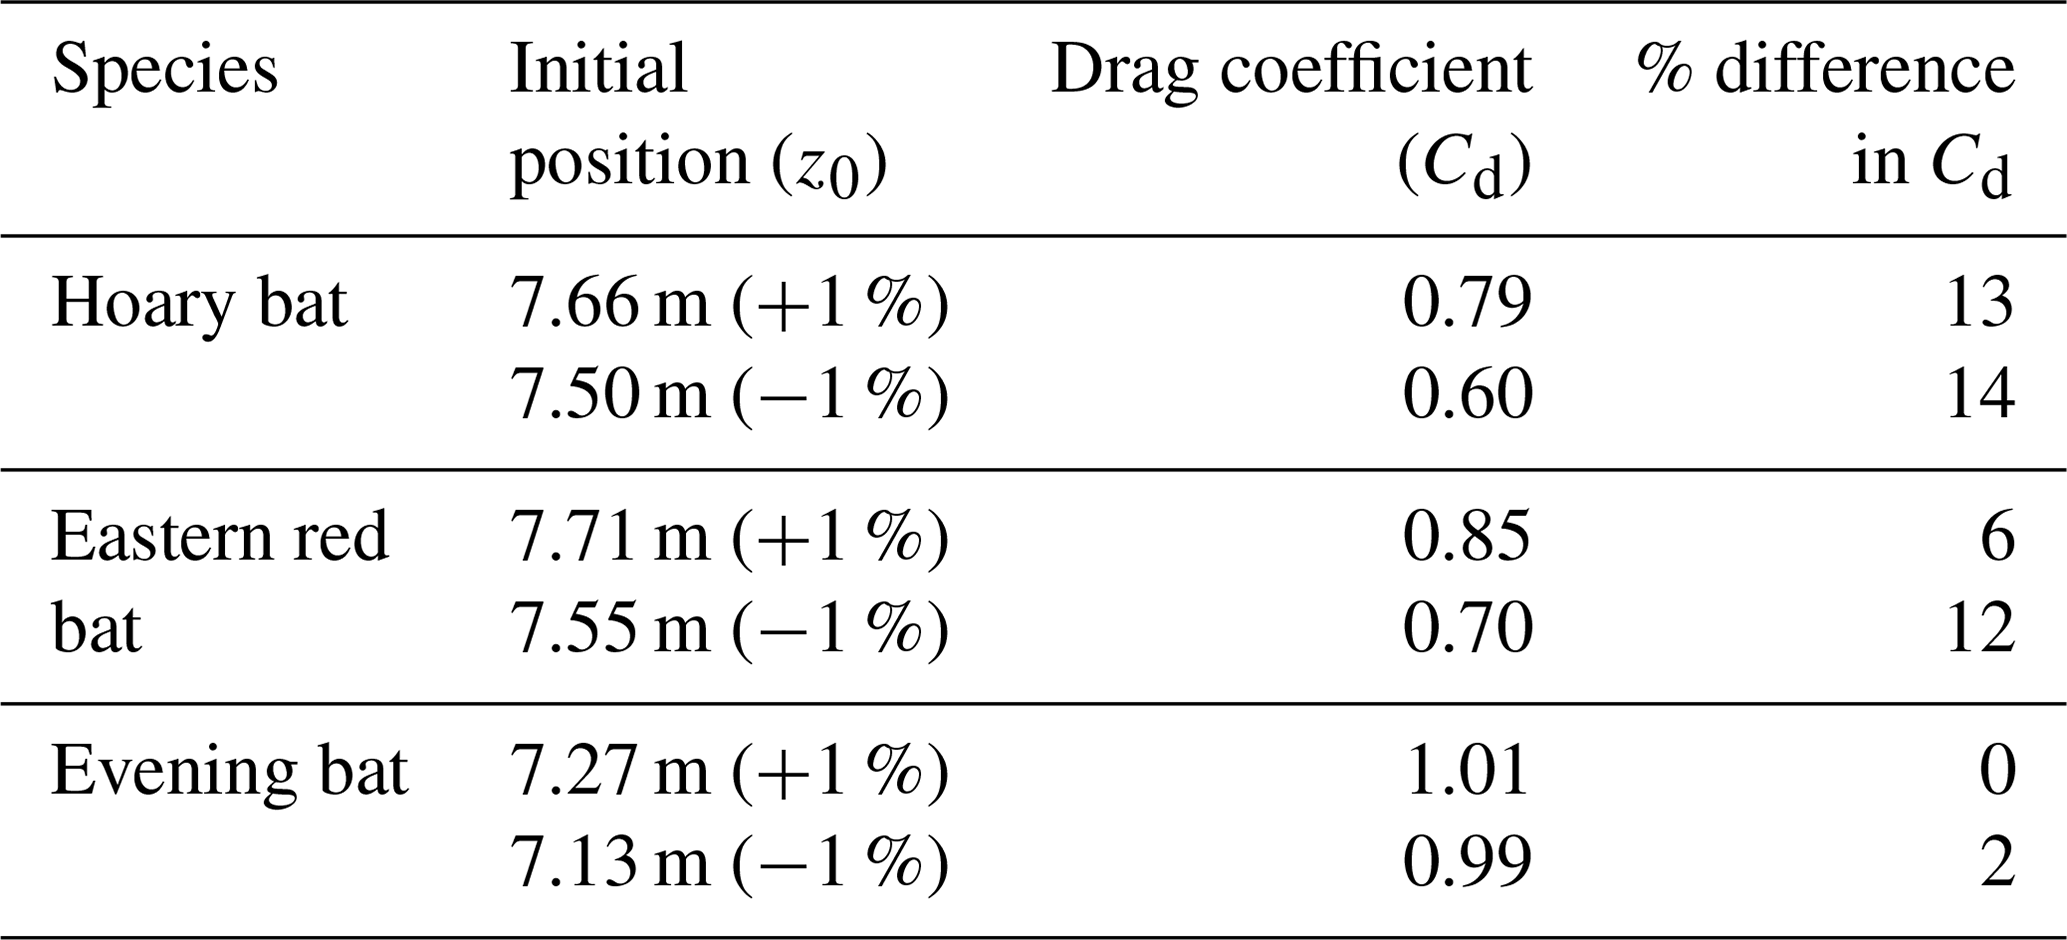
It is evident that for the hoary and eastern red bat, even a small error of 1 % in initial drop position can cause 6 %–14 % difference in Cd. This highlights the sensitivity of the analysis procedure, and it indicates the potential importance of the chaotic nature of carcass fall dynamics, particularly for the hoary and eastern red bat (heavy and large), when dropped from a limited height. However, in the case of the evening bat (light and small), the maximum percentage of change in Cd is only 2 % for a 1 % change in z0. It is an important finding as 1 % variation in z0 corresponds to approximately 7 cm, which is of the order of deq for the larger species. Depending on the initial orientation of the carcass at t=0, it is possible to have 1 % difference in z0, which may lead to significant differences in the estimated Cd of carcasses.
The range of Cd for the three species investigated in this study was determined by implementing the proposed Cd estimation algorithm. Table 5 summarizes the range of measured Cd and terminal velocities for the hoary bat, eastern red bat, and evening bat based on two drop experiments for each species. Overall, the range of Cd estimated for bat carcasses varied between 0.70 and 1.23. These Cd values found in the present study differ from the Cd range of 0.875–1.125 used by HM10, with a wider range of possible values. Considering the limited sample size, in the case of a large sampling of carcasses that include additional bat species, the range can be expected to be larger than that computed in the present study.
Table 5Sampled range of drag coefficients and terminal velocities for three species of bat carcasses.
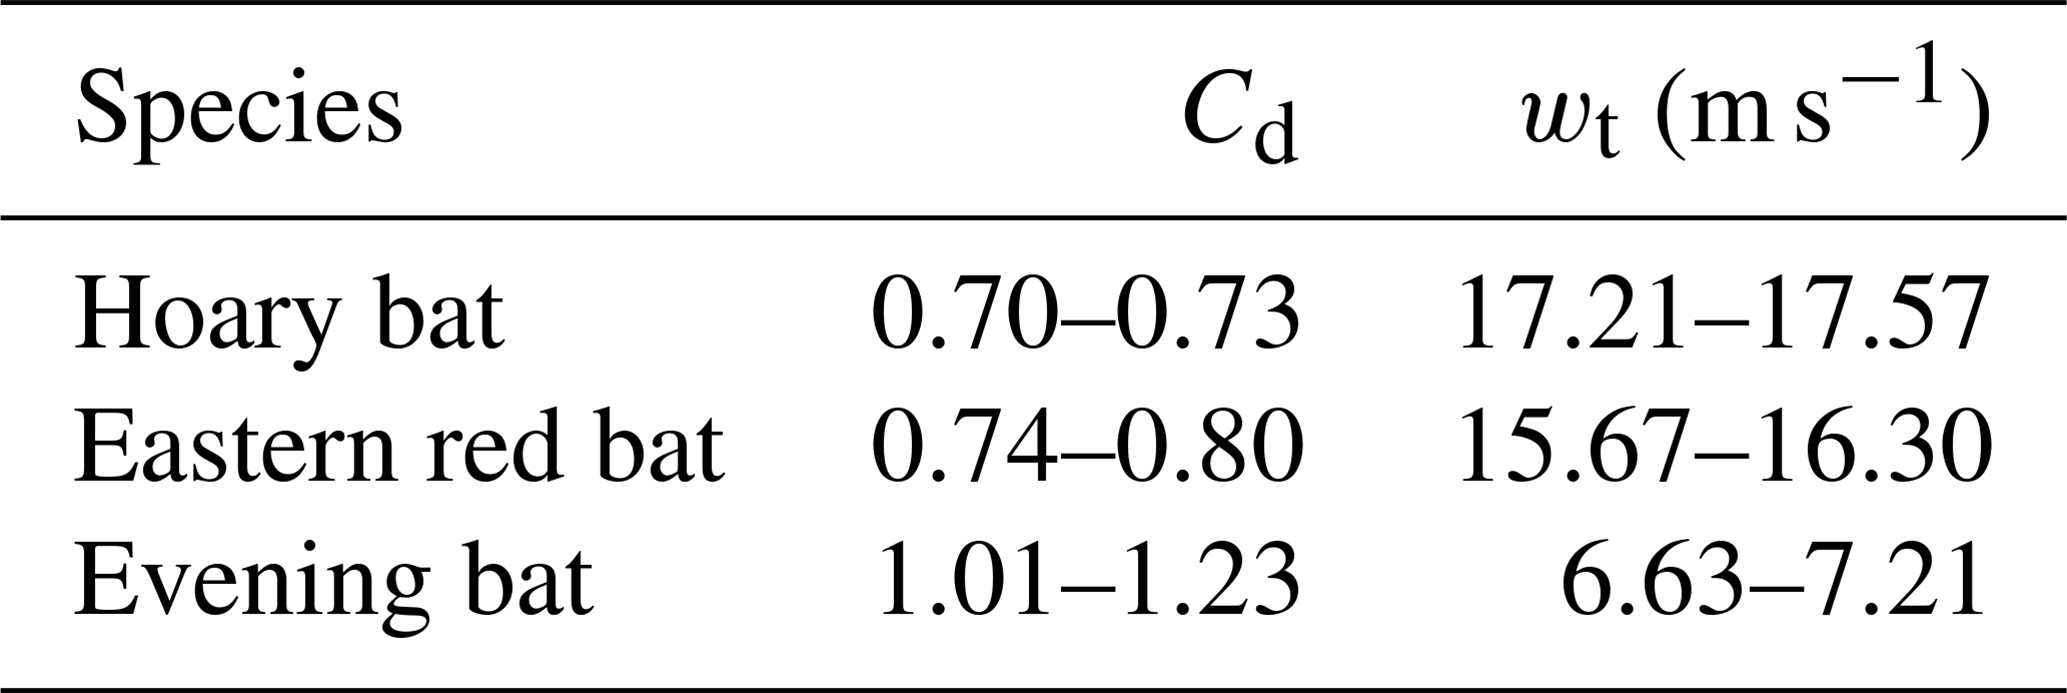

Figure 9Carcass fall distributions for (a) the hoary bat (Cd=0.70), (b) the hoary bat (Cd=1.23), (c) the evening bat (Cd=0.70), and (d) the evening bat (Cd=1.23).
The sensitivity of bat fall zone distributions in the rotor plane (according to the modeling approach of HM10) was tested with respect to carcass mass and its drag coefficient. The hoary and evening bat were selected for this exercise because they are the heaviest and lightest bats, respectively. Figure 9 shows fall zone distributions for the hoary bat (upper row) and evening bat (lower row) for the highest and lowest values of Cd range, respectively. The distributions were obtained by solving the 2-D ballistics trajectories in quiescent flow for bats assumed to be impacted by turbine blades within the rotor plane. However, there is no literature on the exact strike distribution of the bats in the rotor plane. Therefore, as a first approximation, bats were assumed to be distributed within the rotor plane at a radial resolution of 1 m and angular resolution of 5∘, resulting in approximately 4000 bat carcasses struck by the rotor. The coefficient of restitution (e) was assumed to be zero during the computations, which means a bat carcass attains the same velocity as the rotor at the point of impact, i. e., at the time of impact, the initial velocity of the bat relative to the blade is zero. In these simulations, the rotor radius is 54 m, hub height is 80 m, and the frequency of rotation of the turbine is 8.70 RPM.
It is evident from Fig. 9 that for the same mass (represented by species), the maximum in-plane fall distance (Xmax) varies significantly (18 % change) with Cd variation for the hoary bat. Increasing Cd results in smaller distance, Xmax, for the same mass, whereas decrease in mass leads to reduction in Xmax for the same Cd. Therefore, a heavy bat carcass with a lower Cd will attain a larger maximum fall distance (92 m), while a light bat carcass with a greater Cd will attain a lesser maximum fall distance (58 m). The sensitivity analysis shown in Fig. 9 demonstrates the significance of the drag coefficient in computing the upper bound of the maximum fall distance by the bat carcasses using the 2-D ballistics theory.
The goal of this research was to make the first measurements of the drag coefficient of bat carcasses. This data will allow for robust modeling of carcass fall distributions around wind turbines to guide carcass surveys. Fresh bat carcasses (hoary bat, eastern red bat, and evening bat) were discovered at the Macksburg wind farm, and carcass drop experiments were performed. Carcass fall trajectories were measured with high-speed video. Due to the complex fall dynamics of carcasses and limited drop height, the irregularly shaped carcasses did not reach terminal velocity. Therefore, Cd is estimated by finding the best fit of the ballistics model to the measured velocity data. An initial value problem, the ballistics model requires the initial position (z0) and velocity (w0), which cannot be accurately recorded. The measured velocity data had significant scatter due to the high temporal resolution of the video. An appropriate filtering window (Δtc) was evaluated to obtain scatter-free measurements to fit the ballistics model. To compute the unknowns mentioned above (Δtc,z0, w0, Cd), a multivariable optimization algorithm is proposed and implemented, yielding Cd measurements for the carcasses of the three bat species. The first measurements of the drag coefficient revealed a range of 0.70–1.23. The sensitivity of Cd with respect to z0 is tested by computing the percentage of change in Cd with 1 % change in z0. It was found for the hoary bat and the eastern red bat that even a small difference (∼7 cm) in z0 resulted in 6 %–14 % difference in Cd. This demonstrates high sensitivity in Cd estimates to drop height for bat carcasses dropped from within 10 m of the ground.
The range of the maximum fall zone for the hoary bat (heaviest) and evening bat (lightest) was investigated with a ballistics model, and the sensitivity of the bat carcass fall zone distributions based on the measured carcass mass and range of drag coefficient was determined. The hoary bat, assuming the smallest Cd (0.70), resulted in a maximum fall distance of m, whereas the evening bat, with the largest Cd (1.23), resulted in a maximum fall distance of m. This demonstrates that the relative effect of bat mass and carcass aerodynamics has a significant influence on maximum distance traveled by bats after being struck by a turbine blade.
The ballistics model framework proposed by HM10 generates a 1-D carcass fall zone distribution in the reference frame of the wind turbine rotor. In the future, the modeling framework can be extended by incorporating meteorological conditions such as wind speed and direction, resulting in a 2-D fall zone distribution to provide more realistic representation of the distribution of carcasses falling around the base of the turbine. The resulting distributions would provide useful information that can be compared to the carcass surveys to validate the ballistics model and guide search efforts. The model can also be used to generate results useful for correcting survey data for limited or unsearched areas, for example when carcass surveys are conducted only on highly visible gravel surfaces of access roads and turbine pads.
Data and code can be made available upon request from the corresponding author.
The supplement related to this article is available online at: https://doi.org/10.5194/wes-5-745-2020-supplement.
SP conducted the study as part of his doctoral research supervised by CDM. CDM conceptualized the research and acquired financial support and access to the equipment and facilities. SP conducted data analysis and produced final results, figures, and the original draft of this paper. SP and CDM collected the data, interpreted the analysis results, and reviewed and revised the final version of the manuscript.
The authors declare that they have no conflict of interest. The funders had no role in the study design, analysis of the data, decision to publish, or preparation of the manuscript.
The study was conducted with financial support from MidAmerican Energy Company (MEC) and with input from scientists at the United States Fish & Wildlife Service (USFWS) in support of the development of a Habitat Conservation Plan for wind energy facilities in Iowa. The authors are grateful to Jesse Leckband, Senior Environmental Analyst at MEC, for providing access to the wind farm facility and for procuring fresh bat carcasses for the experiments. We also thank Pablo Carrica, PhD, Professor of Mechanical Engineering and Research Engineer at IIHR – Hydroscience & Engineering, for help in collecting the data.
This research has been supported by the MidAmerican Energy Company.
This paper was edited by Jakob Mann and reviewed by Jakob Mann and one anonymous referee.
Arnett, E. B.: Relationship between bats and wind turbines in Pennsylvania and West Virginia: An assessment of fatality search protocols, patterns of fatality, and behavioral interactions with wind turbines, A Final report prepared for the Bats and Wind Energy Cooperative, Bat Conservation International, Austin, Texas, USA, 2005.
Arnett, E. B., Huso, M. M. P., Hayes, J. P., and Schirmacher, M.: Effectiveness of changing wind turbine cut-in speed to reduce bat fatalities at wind facilities, An annual report submitted to the Bats and Wind Energy Cooperative and the Pennsylvania Game Commission, Bat Conservation International, Austin, Texas, USA, 2010.
Arnett, E. B., Baerwald, E. F., Mathews, F., Rodrigues, L., Rodríguez-Durán, A., Rydell, J., Villegas-Patraca, R., and Voigt, C. C.: Impacts of wind energy development on bats: a global perspective, in: Bats in the Anthropocene: Conservation of bats in a changing world, Springer International Publishing AG, Cham, Switzerland, 295–323, https://doi.org/10.1007/978-3-319-25220-9_11, 2016.
Biswas, S., Taylor, P., and Salmon, J.: A model for ice throw trajectories from wind turbines, Wind Energy, 15, 889–901, https://doi.org/10.1002/we.519, 2011.
Chapra, S. C. and Canale, R. P.: Numerical methods for engineers, 6th edn., McGraw-Hill, New York, USA, 2010.
Cryan, P. M.: Wind turbines as landscape impediments to the migratory connectivity of bats, Environmental Law, 41, 355–370, 2011.
Erickson, W. P., Wolfe, M. M., Bay, K. J., Johnson, D. H., and Gehring, J. L.: A comprehensive analysis of small-passerine fatalities from collision with turbine at wind energy facilities, PLoS ONE, 9, e107491, https://doi.org/10.1371/journal.pone.0107491, 2014.
GAO (Government Accountability Office): Wind Power: Impacts on wildlife and government responsibilities for regulating development and protecting wildlife, GAO–05–9006, Washington, DC, USA, 2005.
Gauthreaux, S. A.: Suggested practices for monitoring bird populations, movements and mortality in wind resource areas, in: Proceedings of National Avian-Wind Power Planning Meeting II, 20–22 September 1995, Palm Springs, California, USA, prepared for the Avian Subcommittee of the National Wind Coordination Committee by RESOLVE Inc., Washington, DC, USA, 1996.
Haider, A. and Levenspiel, O.: Drag coefficient and terminal velocity of spherical and nonspherical particles, Powder Technology, 58, 63–70, https://doi.org/10.1016/0032-5910(89)80008-7, 1989.
Hallam, T. G. and Federico, P.: Applications of dynamic population models to bats, in: Ecological and behavioral methods for the study of bats, edited by: Kunz T. H. and Parsons, S., 2nd edn., Johns Hopkins University Press, Baltimore, Maryland, USA, 177–194, 2009.
Hayes, M. A.: Bats killed in large number of United States wind energy facilities, BioScience, 63, 975–979, https://doi.org/10.1525/bio.2013.63.12.10, 2013.
Hedenström, A. and Liechti, F.: Field estimates of body drag coefficient on the basis of dives in passerine birds, J. Exp. Biol., 204, 1167–1175, 2001.
Hull, C. L. and Muir, S.: Search areas for monitoring bird and bat carcasses at wind farms using a Monte-Carlo model, Aust. J. Environ. Manage., 17, 77–87, https://doi.org/10.1080/14486563.2010.9725253, 2010.
Huso, M. M. P. and Dalthorp, D.: Accounting for unsearched areas in estimating wind turbine-caused fatality, J. Wildlife Manage., 78, 347–358, https://doi.org/10.1002/jwmg.663, 2014.
Kingsley, A. and Whittam, B.: Wind turbines and birds: A background review for environmental assessment, Prepared by Bird Studies Canada for Environment Canada/Canadian Wildlife Service, available at: https://tethys.pnnl.gov/sites/default/files/publications/Kingsley-2005.pdf (last access: 20 May 2019), 2005.
Kunz, T. H., Arnett, E. B., Erickson, W. P., Hoar, A. R., Johnson, G. D., Larkin, R. P., Strickland, M. D., Thresher, R. W., and Tuttle, M. D.: Ecological impacts of wind energy development on bats: questions, research needs, and hypotheses, Front. Ecol. Environ., 5, 315–324, https://doi.org/10.1890/1540-9295(2007)5[315:EIOWED]2.0.CO;2, 2007.
Kuvlesky, W. P., Brennan, L. A., Morrison, M. L., Bodyston, K. K., Ballard, B. M., and Bryant, F. C.: Wind energy development and wildlife conservation: challenges and opportunities, J. Wildlife Manage., 71, 2487–2498, https://doi.org/10.2193/2007-248, 2007.
Lindeboom, H. J., Kouwenhoven, H. J., Bergman, M. J. N., Bouma, S., Brasseur, S., Daan, R., Fijn, R. C., de Haan, D., Dirksen, S., van Hal, R., Hille Ris Lambers, R., ter Hofstede, R., Krijgsveld, K. L., Leopold, M., and Scheidat, M.: Short-term ecological effects of an offshore wind farm in the Dutch coastal zone; a compilation, Environ. Res. Lett., 6, 035101, https://doi.org/10.1088/1748-9326/6/3/035101, 2011.
Loss, S. R., Will, T. and Marra, P. P.: Estimation of bird collision mortality at wind facilities in the contiguous United States, Biol. Conserv., 168, 201–209, https://doi.org/10.1016/j.biocon.2013.10.007, 2013.
Mann, J., Ott, S., and Andersen, J. S.: Experimental study of relative, turbulent diffusion, Denmark, Forskningscenter Risoe. Risoe – R, No. 1036 (EN), available at: https://backend.orbit.dtu.dk/ws/files/7729726/ris_r_1036.pdf (last access: 1 March 2020), 1999.
National Research Council: Environmental impacts of wind-energy projects, The National Academies Press, Washington, DC, USA, https://doi.org/10.17226/11935, 2007.
Norberg, U. M.: Aerodynamics, kinematics, and energetics of horizontal flapping flight in the long-eared bat Plecotus auritus, J. Exp. Biol., 65, 179–212, 1976.
Orloff, S. G. and Flannery, A.: Wind turbine effects on avian activity, habitat use, and mortality in Altamont Pass and Solano County wind resources areas: 1989–1991, A report prepared by BioSystems Analysis, Inc. for the California Energy Commission, 1–199, available at: https://tethys.pnnl.gov/sites/default/files/publications/Orloff-1992.pdf (last access: 5 March 2020), 1992.
Osborn, R. G., Higgins, K. F., Usgaard, R. E., Dieter, C. D., and Neiger, R. D.: Bird mortality associated with wind turbines at the Buffalo Ridge wind resource area, Minnesota, Am. Midl. Nat., 143, 41–52, available at: https://www.jstor.org/stable/3082982 (last access: 29 May 2019), 2000.
O'Shea T. J., Ellison L. E., and Stanley T. R.: Survival estimation in bats: historic overview, critical appraisal, and suggestions for new approaches, 297–336, in: Sampling Rare or Elusive Species: Concepts, Designs, and Techniques for Estimating Population Parameters, edited by: Thompson W. L., Island Press, available at: http://citeseerx.ist.psu.edu/viewdoc/download?doi=10.1.1.552.3192&rep=rep1&type=pdf (last access: 8 March 2020), 2004.
Ott, S. and Mann, J.: An experimental investigation of the relative diffusion of particle pairs in three-dimensional turbulent flow, J. Fluid Mech., 422, 207–223, https://doi.org/10.1017/S0022112000001658, 2000.
Sarlak, H. and Sørensen, J. N.: Characterization of blade throw from a 2.3 MW horizontal axis wind turbine upon failure, AIAA Sci Tech, 53rd AIAA Aerospace Sciences Meeting, 5–9 January 2015, Kissimmee, Florida, USA, 2015.
Smallwood, K. S.: Estimating wind-turbine caused bird mortality, J. Wildlife Manage., 71, 2781–2791, https://doi.org/10.2193/2007-006, 2007.
Smallwood, K. S.: Comparing bird and bat fatality-rate estimates among North American wind-energy projects, Wildlife Soc. B, 37, 19–33, https://doi.org/10.1002/wsb.260, 2013.
Smallwood, K. S. and Thelander, C. G.: Bird mortality at the Altamont Pass Wind Resource Area, Final report to the California Energy Commission, Public Interest Energy Research – Environmental Area, 500–01–019, BioResource Consultants, Ojai, California, USA, 2005.
Thelander, C. G. and Rugge, L.: Avian risk behavior and fatalities at the Altamont Wind Resource Area, NREL/SR–500–27545, National Renewable Energy Laboratory, Golden, Colorado, USA, 2000.
US Energy Information Administration: Renewables and Carbon dioxide emissions, available at: http://www.eia.gov/forecasts/steo/report/renew_co2.cfm (last access: 7 January 2020), 2018.
van Kuik, G. A. M., Peinke, J., Nijssen, R., Lekou, D., Mann, J., Sørensen, J. N., Ferreira, C., van Wingerden, J. W., Schlipf, D., Gebraad, P., Polinder, H., Abrahamsen, A., van Bussel, G. J. W., Sørensen, J. D., Tavner, P., Bottasso, C. L., Muskulus, M., Matha, D., Lindeboom, H. J., Degraer, S., Kramer, O., Lehnhoff, S., Sonnenschein, M., Sørensen, P. E., Künneke, R. W., Morthorst, P. E., and Skytte, K.: Long-term research challenges in wind energy – a research agenda by the European Academy of Wind Energy, Wind Energ. Sci., 1, 1–39, https://doi.org/10.5194/wes-1-1-2016, 2016.
WEST, Inc.: 2015 Northern long-eared bat fall migration study, prepared for MidAmerican Energy Company, Urbandale, Iowa, USA, 2016.
- Abstract
- Introduction and review
- Methodology
- Results
- Sensitivity of estimated drag coefficient to initial drop height
- Sensitivity of carcass fall zone distributions to carcass mass and drag coefficient
- Summary and conclusions
- Code and data availability
- Author contributions
- Competing interests
- Acknowledgements
- Financial support
- Review statement
- References
- Supplement