the Creative Commons Attribution 4.0 License.
the Creative Commons Attribution 4.0 License.
 | 14 Jan 2020
Hurricane eyewall winds and structural response of wind turbines
Amber Kapoor
Slimane Ouakka
Sanjay R. Arwade
Julie K. Lundquist
Matthew A. Lackner
Andrew T. Myers
Rochelle P. Worsnop
George H. Bryan
This paper describes the analysis of a wind turbine and support structure subject to simulated hurricane wind fields. The hurricane wind fields, which result from a large eddy simulation of a hurricane, exhibit features such as very high gust factors (>1.7), rapid direction changes (30∘ in 30 s), and substantial veer. Wind fields including these features have not previously been used in an analysis of a wind turbine, and their effect on structural loads may be an important driver of enhanced design considerations. With a focus on blade root loads and tower base loads, the simulations show that these features of hurricane wind fields can lead to loads that are substantially in excess of those that would be predicted if wind fields with equally high mean wind speeds but without the associated direction change and veer were used in the analysis. This result, if further verified for a range of hurricane and tropical storm simulations, should provide an impetus for revisiting design standards.
- Article
(6225 KB) - Full-text XML
- BibTeX
- EndNote


Activity related to offshore wind energy development continues to accelerate along the US East Coast. For example, the Massachusetts legislature recently proposed doubling the Massachusetts offshore wind energy commitment to 3200 MW (Massachusetts HR 2018), and a public price was tentatively set for the first 800 MW of offshore wind energy capacity in Massachusetts, an important step in the process of developing offshore wind farms. Awareness of potential hurricane risk to offshore wind farms along the US East Coast is high, and with potentially thousands of offshore wind turbines to be constructed over the coming decades, the quantification of this risk is crucial to ensure the safety, availability, and reliability of this important energy source.
Analytic models of hurricane wind fields (e.g., Holland, 1980; Holland et al., 2010), based on interpolations between sparse observations, have been useful for informing offshore wind design specifications (Tarp-Johansen and Clausen, 2006; Hallowell et al., 2018). However, these models cannot capture certain nonstationary features of hurricane eyewalls. Recent advances in observations (Stern et al., 2016; Wingo and Knupp, 2016; Wurman and Kosiba, 2018) and in hurricane simulation capabilities (Worsnop et al., 2017a; Wu et al., 2018) allow for the identification of sub-kilometer-scale features of hurricane wind fields, e.g., organized turbulent structures such as mesovortices, that may create significant and unforeseen loads on offshore wind turbines. Many of these characteristics are extremely difficult to measure during actual storms because they occur in or near the eyewall of the hurricane where wind speeds are extremely high and observations are difficult to make. Observation of the distribution and lifetime of these mesovortices may also require simultaneous measurement of wind speed and direction over spatial domains measured in the tens of kilometers.
The limited set of observations can be augmented through the use of large eddy simulations (LESs) that resolve these turbulent structures. LESs of hurricane wind fields can provide insight into organized structures within the hurricane eyewall, such as convective cells and transient large eddies. By using LESs, the energy-producing scales of three-dimensional atmospheric turbulence should be explicitly resolved, while finer scales of turbulence are parameterized by a subgrid-scale model. Reducing the grid size of an LES allows more of the three-dimensional turbulence to be resolved (i.e., computed directly) rather than parameterized through the subgrid-scale turbulence model. As a result, the maximum instantaneous wind speed in organized structures in the eyewall produced in these LESs tends to be highly sensitive to the resolution of the simulation (Rotunno et al., 2009).
The LES of Zhu (2008) investigated hurricane dynamics driven by realistic mesoscale weather forcing, with the finest horizontal resolution at 100 m in the innermost domain. This domain only comprised a small region of the inner core of the hurricane. The idealized simulations of Rotunno et al. (2009), at 62 m horizontal resolution, indicated very strong mesovortices with maximum instantaneous wind speeds of 120 m s−1. Green and Zhang (2015) explored how model resolution and the representation of the boundary layer affect the development of mesovortices and other fine-scale structures in the hurricane boundary layer, with some simulations as fine as 111 m horizontal resolution. They also suggest that the resolution of their simulations affected the size of the large eddy circulations, implying that finer resolution was required for convergence to a “true LES.” Worsnop et al. (2017a) simulated an idealized Category 5 hurricane with 32 m horizontal resolution using the Cloud Model I (CM1) of Bryan et al. (2016). Similar CM1 hurricane simulations with 62 m horizontal grid spacing were validated with observations of turbulence spectra by Worsnop et al. (2017b). Finally, the 37 m nested LESs of Wu et al. (2018) replicated tornadic structures within the eyewall of Typhoon Matsa.
Since industrial-scale offshore wind energy development along the US East Coast began to be discussed seriously, a series of studies have sought to quantify the degree of risk posed to offshore wind farms by hurricanes. These studies have included attempts to identify appropriate structural performance levels and nonlinear structural analysis methods for offshore wind structures (Wei et al., 2014, 2016), multihazard risk analyses (Hallowell et al., 2018; Kim and Manuel, 2016; Mardfekri and Gardoni, 2015; Valamanesh et al., 2015, 2016), and analysis of wind–structure interaction (Amirinia and Jung, 2017). On the whole, these studies have shown that hurricane winds can indeed pose important risks to offshore wind turbines but that such risk can be mitigated by appropriate design approaches. None of these studies, however, have incorporated the kind of high-resolution characterizations of hurricane wind fields that were described by Worsnop et al. (2017a). Therefore, while a substantial body of literature already exists related to the overall exposure of US East Coast offshore wind farms to hurricanes, this paper advances the state of knowledge by assessing the impact of specific and intense hurricane wind field characteristics that have not yet been considered.
Here, we analyze winds and turbulence from an LES of an idealized Category 5 hurricane using Cloud Model 1 (CM1), a three-dimensional, non-hydrostatic, nonlinear, time-dependent numerical model designed for idealized studies of atmospheric phenomena (Bryan and Rotunno, 2009a). These simulations have been used to identify wind field characteristics, such as gust factors, spatial coherence, velocity spectrum, shear profile, direction change, and veer (Worsnop et al., 2017a), that may be important drivers of offshore wind turbine response. We expand upon previous work by providing these wind characteristics to the wind field simulator TurbSim (Jonkman and Buhl Jr., 2009) and evaluating TurbSim's performance against LESs. TurbSim generates simulated wind fields representative of several of the characteristics identified in the LESs. Finally, the effects of this flow on a wind turbine are simulated using the DTU 10 MW reference wind turbine (Bak et al., 2013), which is a three-bladed, upwind, variable-speed turbine with a rotor diameter of 178 m and a 119 m hub height. This turbine is represented in FAST, a coupled aero–hydro–servo–elastic code developed by the National Renewable Energy Laboratory (Jonkman and Buhl Jr., 2005). Sim et al. (2012) used a similar procedure of defining FAST input by LESs to establish guidelines on the spatial and temporal resolution needed to ensure accurate estimates of wind turbine response to turbulent wind fields. Their simulations used the NREL 5 MW reference turbine and did not consider hurricane wind fields.
The Category 5 storm simulation used to develop the wind fields used in this paper is a severe storm, stronger than any likely to directly affect the US Atlantic coast from the Carolinas northward. Therefore, it is emphasized that the primary purpose of this paper is not to establish that a Category 5 hurricane imposes large loads on offshore wind structures, but rather that hurricanes contain wind field characteristics that are not currently considered in design and that may exacerbate loading in unexpected ways. In fact, it is unlikely that design codes should require resistance to a Category 5 storm since such a storm is so unlikely for most proposed wind energy areas.
The remainder of the paper is organized into three sections. First, the characteristics of the LES hurricane wind fields are described in Sect. 2. Next, the simulation of representative wind fields using TurbSim is described in Sect. 3. Finally, the results of the FAST analysis are introduced to quantify the effect of hurricane wind fields on blade and tower structural demands in Sect. 4.
This section describes a statistical characterization and analysis of a large eddy simulation (LES) of an idealized Category 5 hurricane using Cloud Model 1 (CM1) (Bryan and Rotunno, 2009b), described in detail in Worsnop et al. (2017a). The characteristics of the simulated hurricane are based on Hurricane Felix, which made landfall in southern Mexico after traveling westward across the southern Caribbean in 2007. Although some of the characteristics of the hurricane were derived from Hurricane Felix, the results can be taken as representative of relatively small Category 5 storms. The outer simulation domain of 3000 km × 3000 km × 25 km includes the complete hurricane, including the eyewall and rainbands. To resolve turbulent motions in the eye and eyewall, an inner fine-mesh domain of 80 km × 80 km × 3 km uses horizontal grid spacing of 31.25 m and vertical grid spacing of 15.625 m. The model time step is 0.1875 s; 4 h after initialization, a steady state is achieved, and a subsequent 10 min of output is archived. For simplicity, the hurricane is specified to have zero translational velocity. In this paper, a subset of the complete simulation data is analyzed that covers a domain of 60 km × 60 km × 508 m using virtual towers with horizontal spacing of 1 km × 1 km. This domain encompasses the eyewall (the most intense part of the storm) and provides sufficient resolution to characterize the features of hurricane wind fields that are most likely to pose a danger to offshore wind energy installations.
The features of the LES wind field are analyzed in the rest of this section, with the goal of providing representative characterizations of the wind field for subsequent use in wind turbine simulations. The wind field statistics and features quantified over the 10 min reference period are wind speed time history statistics up to 4th order, 3 s gusts and gust factors, wind shear profile, 10 and 30 s wind direction change, and veer (change in the wind direction with respect to height). The remainder of the paper focuses on the effect of mean wind speed, veer, and direction change or misalignment on turbine loads. These characteristics have been selected from the richer set of parameters available from the LESs to most closely mimic, in the authors' experience, the parameters most often treated as primary in typical design-level analysis.
2.1 Overall wind speeds and selection of included grid points
The simulated hurricane includes the quiescent eye, the turbulent eyewalls, and the outer rainbands as seen in the averaged horizontal wind speed over the full 10 min simulation at the elevation (117.19 m) closest to the DTU turbine hub height of 119 m (Fig. 1). The eye of the hurricane, within which the wind speeds are low, extends to a radius R of approximately 10 km. The maximum mean wind speed of approximately 90 m s−1 occurs at a radius of approximately 12 km and then decreases as the distance from the eye increases. For subsequent analysis and input for turbine simulations, the LES wind fields are characterized at discrete radii from the hurricane center: 10 km (inner edge of the eyewall for this hurricane); 12 km (the radius of maximum mean wind speed for this hurricane); 15 km (approximate outer edge of the eyewall for this hurricane); and 20 km (well outside the eyewall for this hurricane).
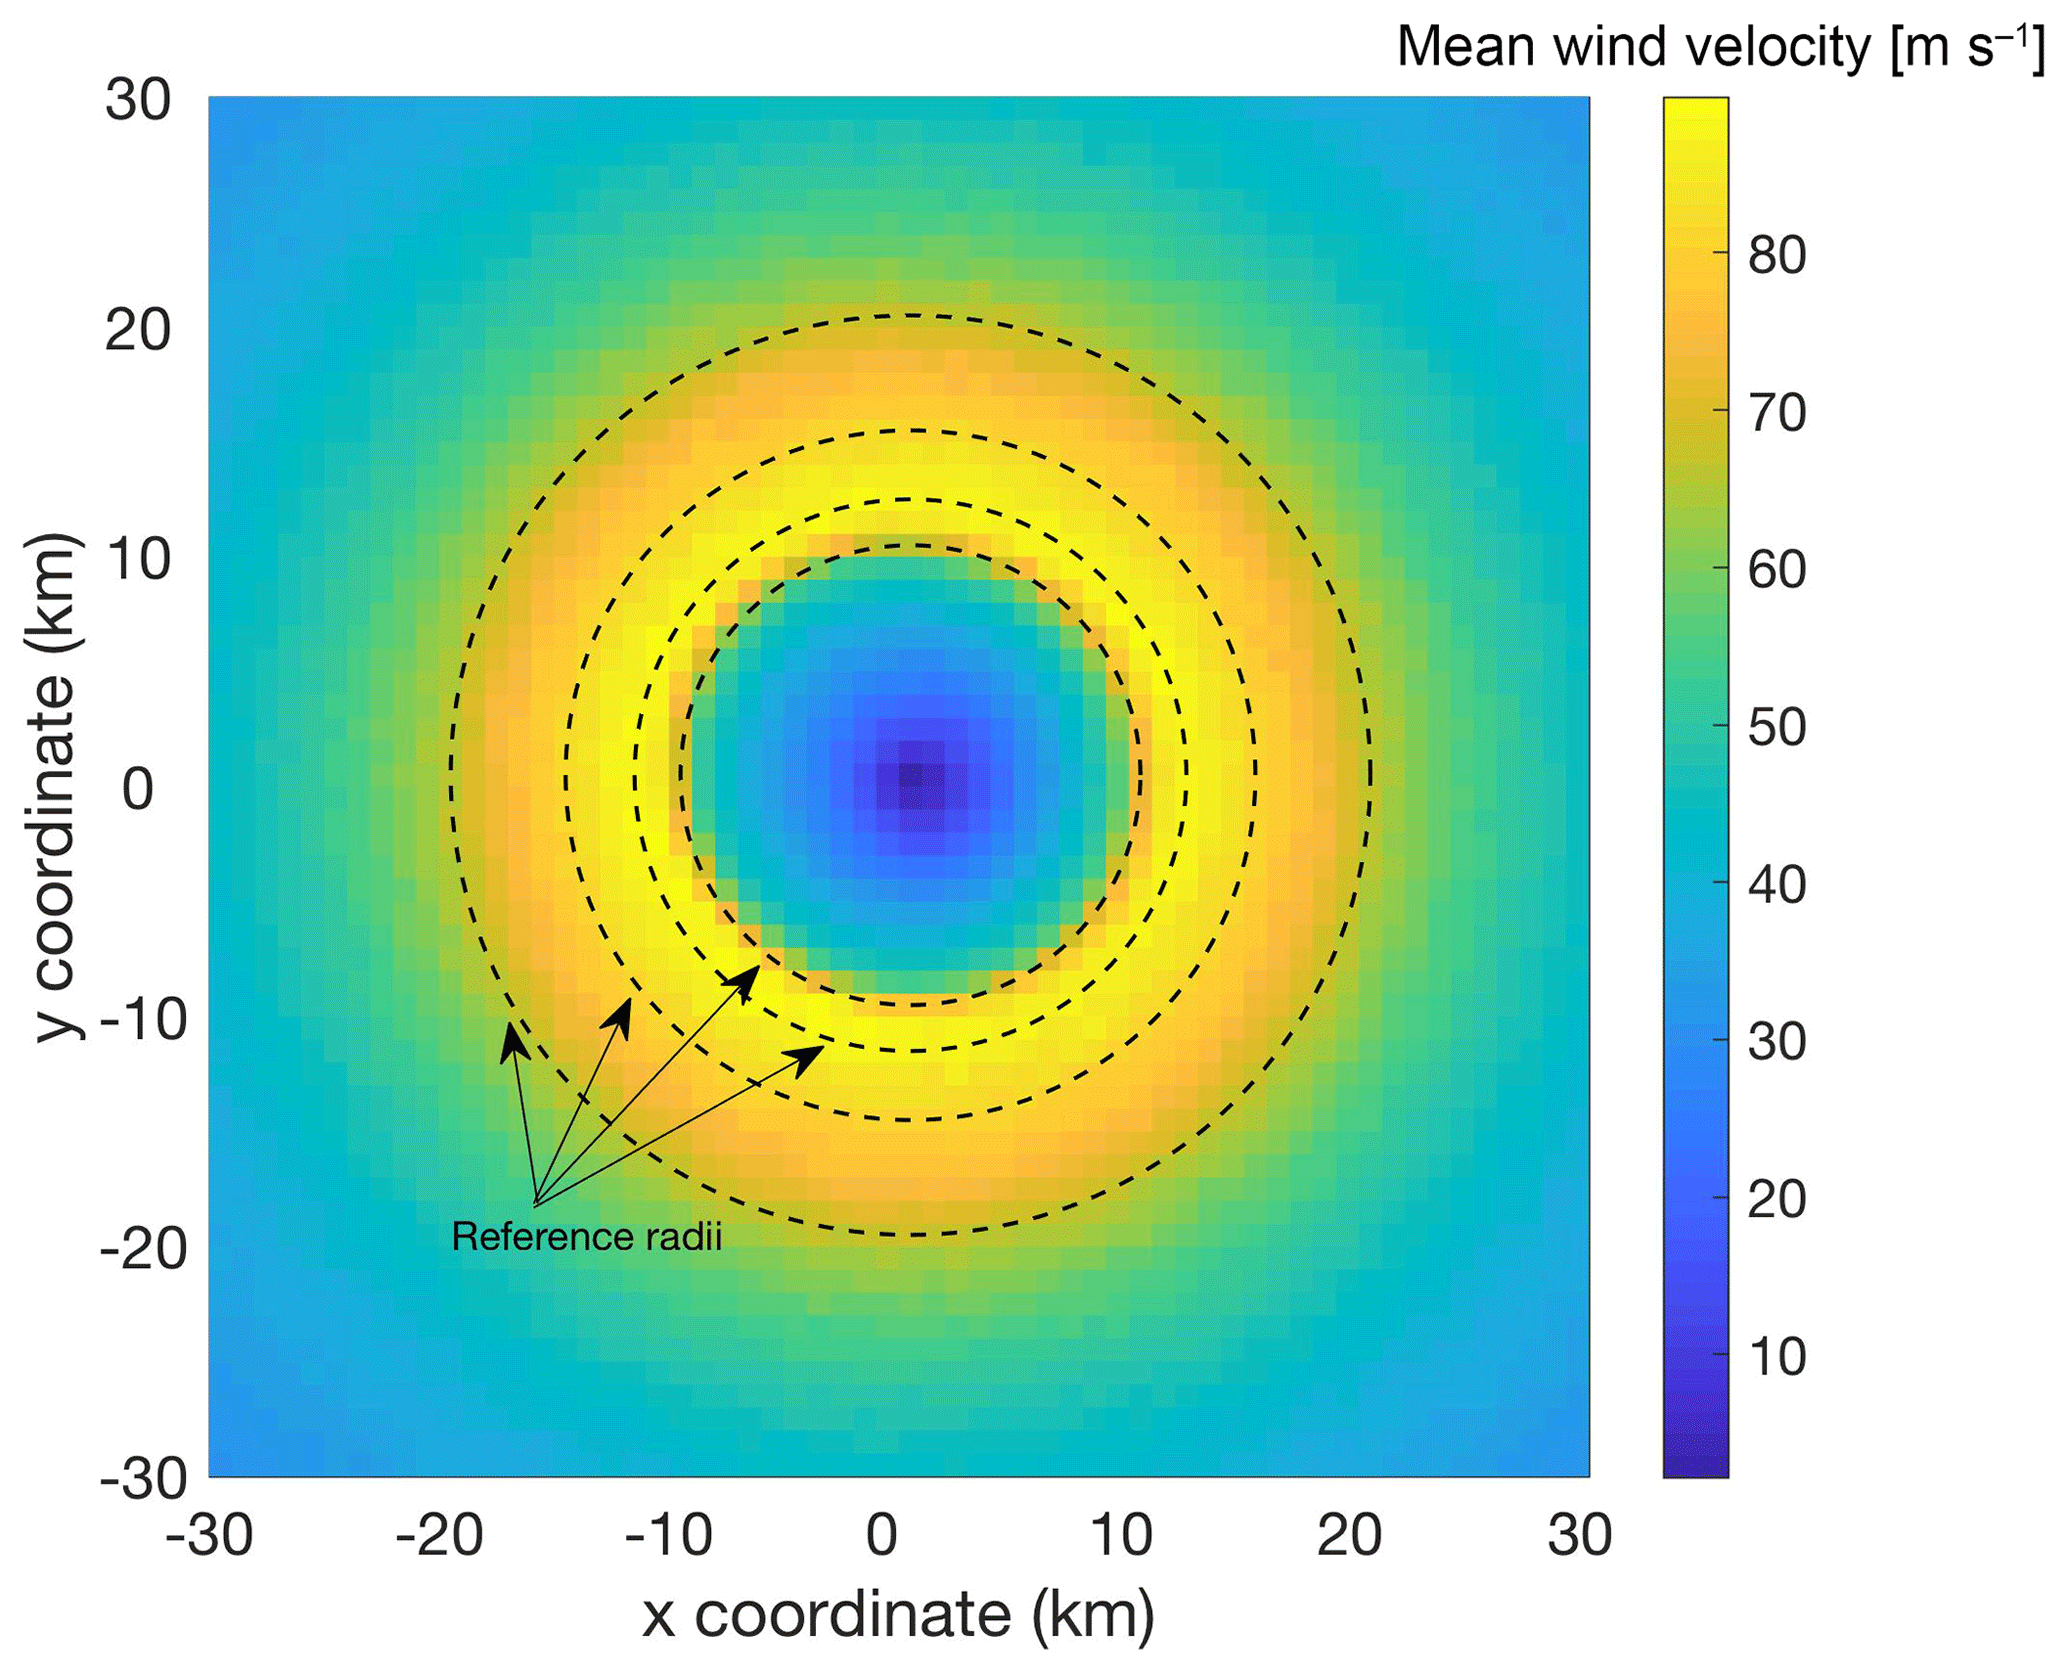
Figure 1Mean horizontal wind speed near the DTU turbine hub height of 119 m for the entire 10 min simulation on a 1 km × 1 km grid. The four dashed circles represent the reference radii of 10, 12, 15, and 20 km.
For each discrete reference radius, multiple points in the LES domain are considered to increase the sample size for generating relevant statistics. Any grid point within ±100 m of a reference radius is considered to be associated with that radius (Fig. 2); a larger envelope could incorporate too large of a range of changing wind fields, especially within the eyewall. This approach yields 28 points at radii of 10 and 12 km, 20 points at 15 km, and 40 points at 20 km. Points of interest include the hub height and the bottom and top of the rotor disk or, more specifically, the grid point elevations closest to those elevations for the DTU turbine (117.19, 39.06, and 210.94 m, respectively).
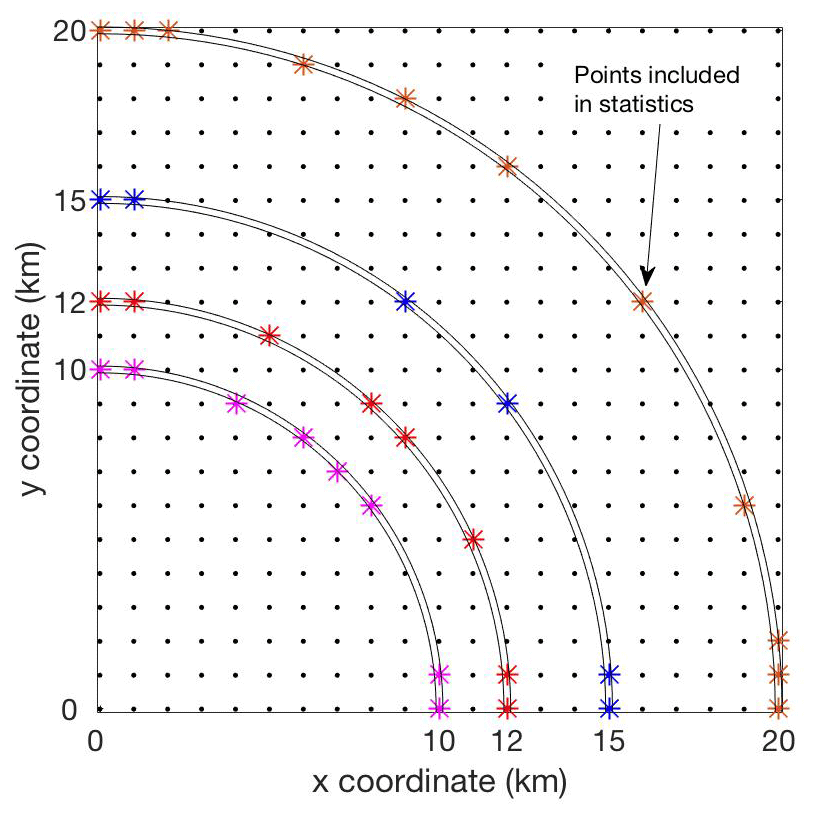
Figure 2Virtual towers (black circles) in one quadrant of the LES domain horizontally spaced at 1 km resolution. Selected virtual towers are included in the analysis when they are within 100 m of the reference radii: 10 km (magenta), 12 km (red), 15 km (blue), and 20 km (orange). Reference radii are measured from the hurricane center.
2.2 Wind speed gusts
The 3 s gust is defined in the design requirements by the IEC (2009) as the peak 3 s average wind speed within a 10 min interval. Associated with the gust is the gust factor, defined as the ratio of the maximum 3 s gust to the local mean wind speed (IEC, 2009). The maximum gust considered by the IEC design requirements for a Class I turbine is 70 m s−1 with a 50 m s−1 mean wind speed at the hub height, corresponding to a gust factor of 1.4. During Typhoon Maemi in Japan, peak gusts of 74 m s−1 were measured when the mean wind speed was only 38 m s−1, corresponding to a gust factor of 1.95, much higher than that considered by the IEC (Ishihara et al., 2005). Typhoon Maemi caused significant damage to all the wind turbines in an onshore coastal wind farm, underscoring the importance of revisiting gust factor specifications. Similarly, two onshore wind farms in Puerto Rico (Santa Isabel and Punta Lima) were affected by hurricane Maria in 2017, a Category 4 hurricane at landfall. Santa Isabel missed the eyewall of the hurricane and survived relatively intact, while Punta Lima, which had a direct eyewall hit, experienced destructive damage (Gallucci, 2018; Kelley, 2017; Rocky Mountain Institute, 2017).
Gusts in the LESs exceed those considered by the IEC, which is expected since the simulated storm is Category 5 with mean wind speeds larger than those considered in the IEC design requirements. The maximum gust factor in the simulated hurricane, outside the quiescent zone within the eye, is approximately 1.7, substantially in excess of the IEC-recommended gust factor or 1.4. These results, along with a more detailed discussion of the wind speed and gust features of the simulated storm, are available in Worsnop et al. (2017a).
2.3 Change in wind direction and veer
Wind direction is also an important consideration in evaluating the effects of hurricanes on offshore wind turbines. Large wind direction changes can be particularly critical for wind turbines during extreme events because a loss of connection to the grid prevents wind turbines from being able to yaw into the wind direction or because the wind direction changes too rapidly for even a functioning yaw control system to accommodate. For example, simulations performed by the authors indicate a yaw rate of 1.0–1.3∘ s−1for the NREL 5MW reference turbine. The design specifications in IEC 61400-3 (IEC, 2009) require a turbine in the parked condition during a storm to consider two loading conditions relevant to wind direction changes. The first (Design Load Case 6.1) is loading from a misalignment between the wind direction and the rotor plane of ±15∘, if using the steady extreme wind model, or of ±8∘ if using the turbulent extreme wind model. The second (Design Load Case 6.2) is loading from misalignments of ±180∘: this corresponds to a situation in which a turbine has lost control of the rotor orientation due to power loss. The first condition is considered a normal event and has a load factor of 1.35 (the factor by which loads are increased to help ensure safety), while the second condition is considered an abnormal event and has a load factor of 1.10. A practical way to contextualize the results of this study is to compare the wind direction changes in the LES wind field to the magnitudes of misalignment considered by the IEC during conditions when rotor control is maintained and when it is lost.
Worsnop et al. (2017a) provide distributions of the 10 and 30 s maximum direction change at hub height at a range of radii from the storm center. At radii outside the quiescent zone, the mean maximum direction change ranges from approximately 15 to 20∘, and the maximum direction changes approach 35∘. To illustrate the character of the wind direction in time, Fig. 3 shows 10 min time series of the maximum direction change over periods of 10 and 30 s at radii of 10, 12, 15, and 20 km. The direction changes exhibit very rapid fluctuations, and the maximum values approach 30∘ for both the 10 and 30 s periods at 10 and 20 km radii. Rapid wind direction changes of that magnitude at such high wind speeds are likely to be difficult for even a functioning yaw control system to manage.
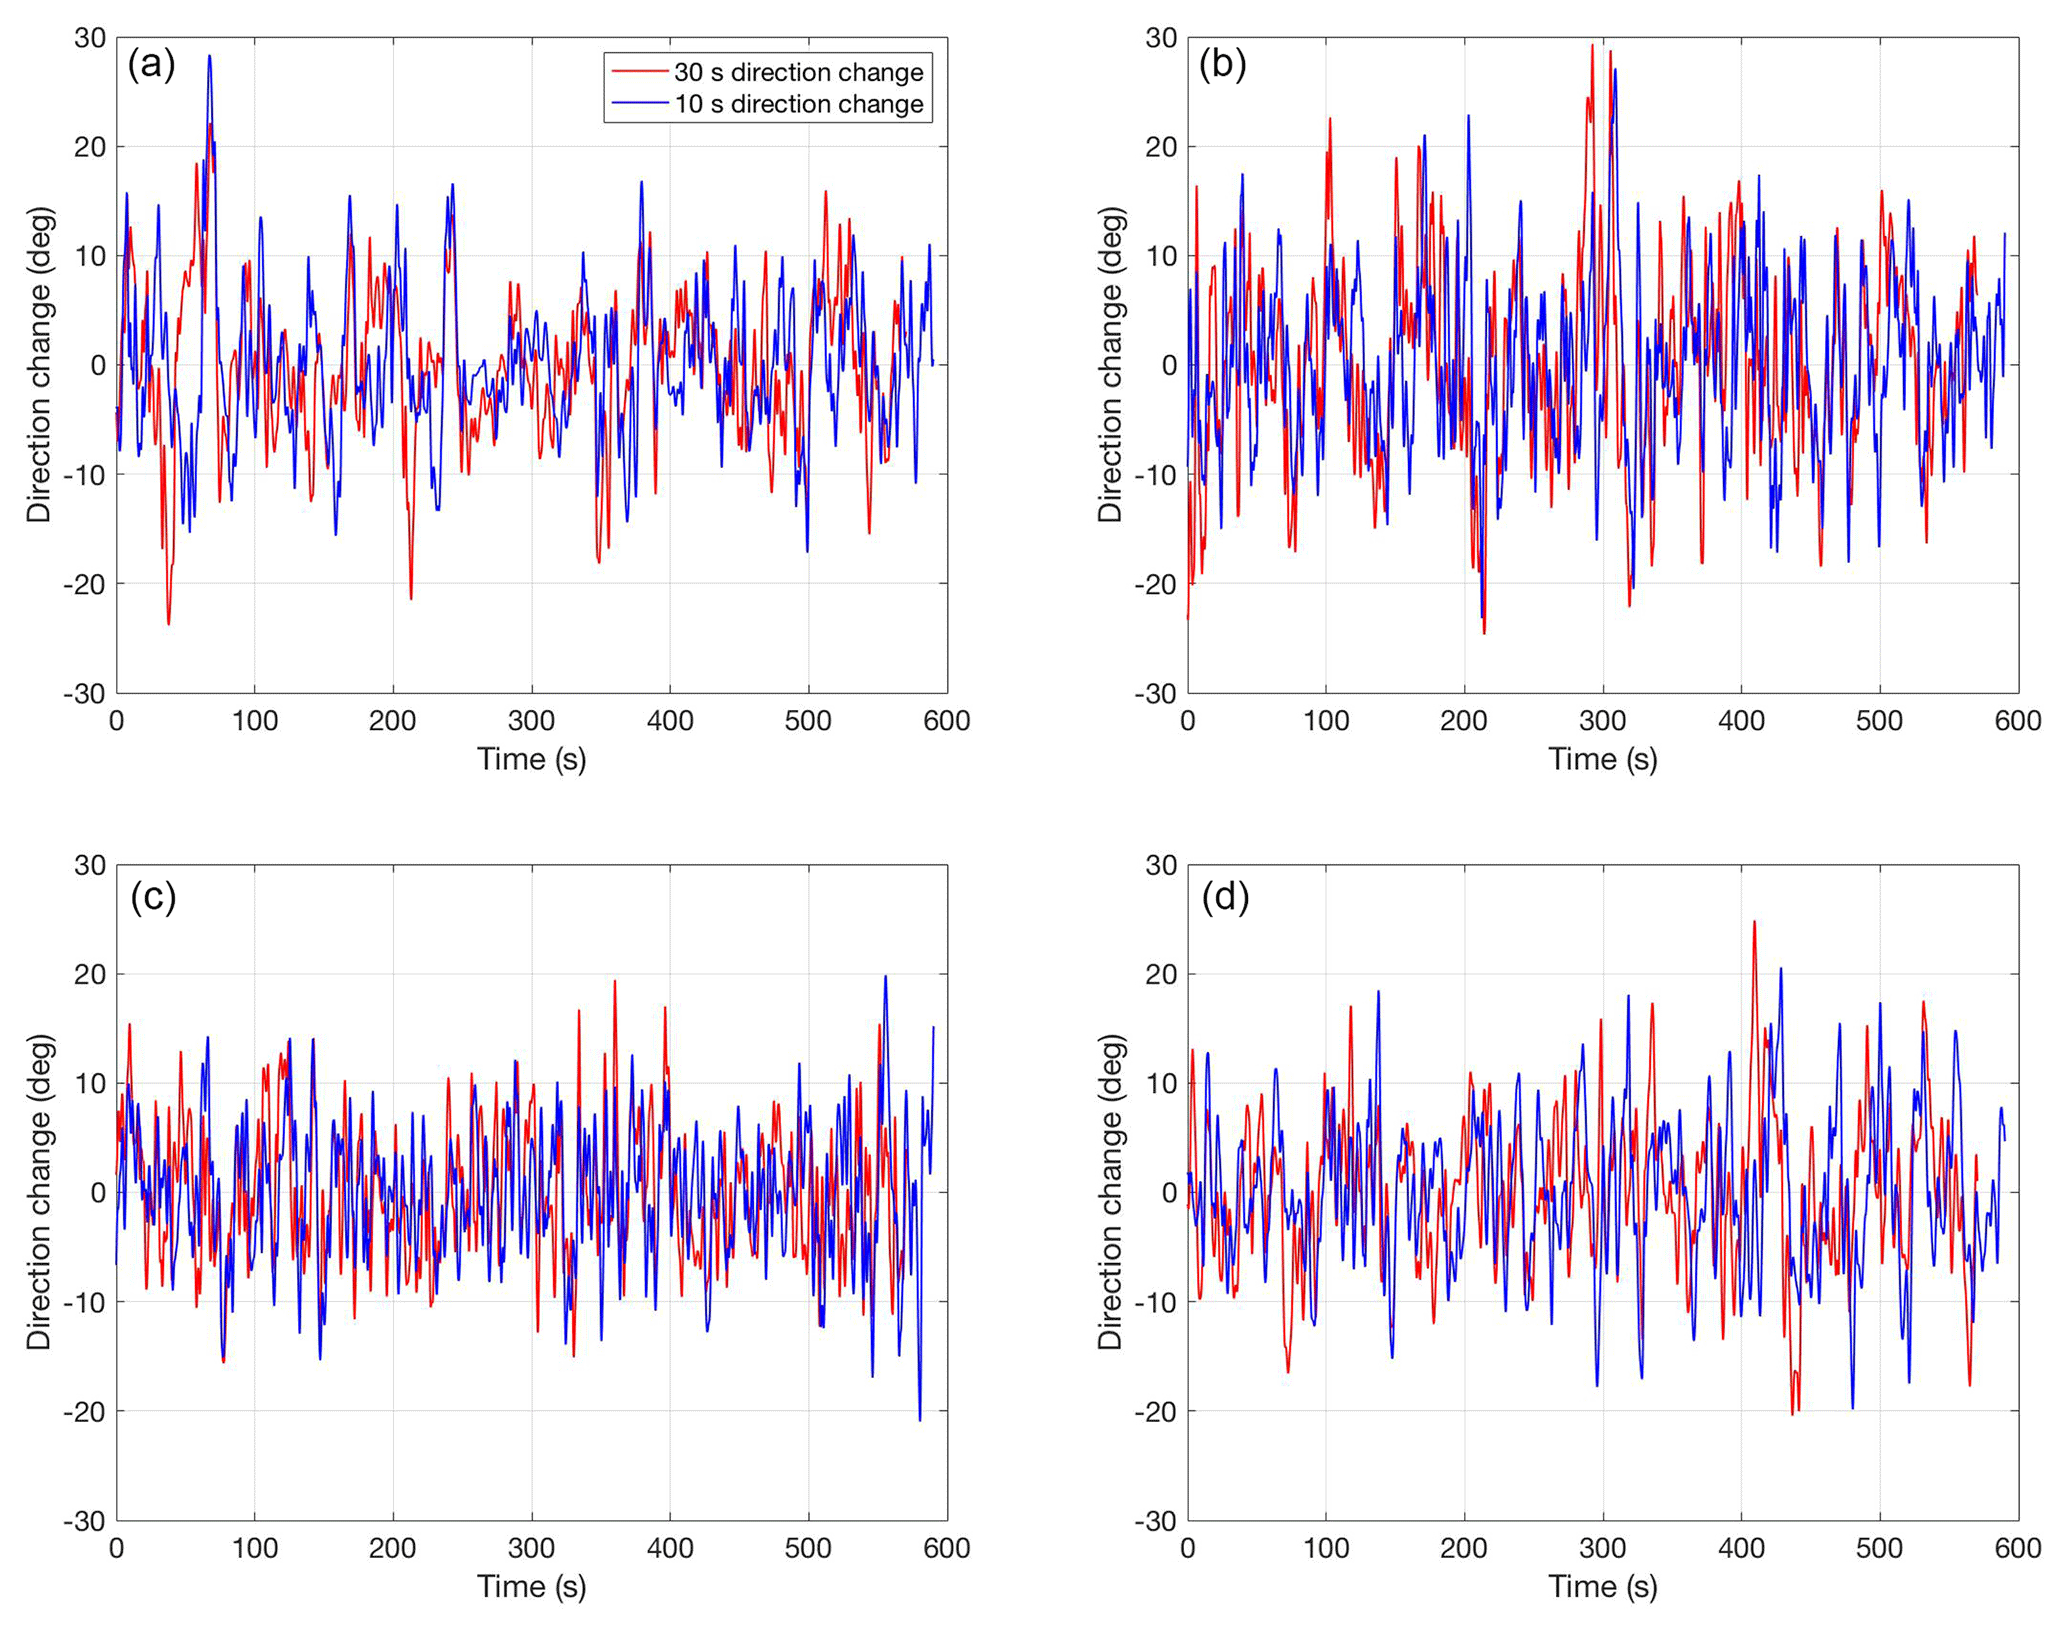
Figure 3Time series of maximum wind direction change at various radii (R) of the hurricane at hub height: (a) inner edge of eyewall R=10 km, (b) within eyewall R=12 km, (c) outer edge of eyewall R=15 km, and (d) outside the eyewall R=20 km. The red and blue lines represent the maximum wind direction change over moving intervals of 30 s (red) and 10 s (blue).
In addition to direction change over time at hub height, wind direction can also vary across a vertical profile at the same time instant. This vertical variation in direction, called veer, is next characterized for the simulated hurricane wind fields. Although numerous onshore observations of veer indicate its prevalence, especially at night, and veer associated with nocturnal low-level jets has been implicated in damage to onshore wind turbines (Kelley et al., 2006) and in affecting turbine power production (Vanderwende and Lundquist, 2012), veer is not currently considered in wind turbine design specifications, either onshore or offshore. Veer may cause additional demand on the blades since the rotor is only yawed and feathered relative to a single wind direction, usually sensed at the nacelle (Giebel and Gryning, 2004).
To characterize the veer quantitatively, four reference veer profiles are defined using the wind direction at the LES grid points closest to the hub height, rotor top, and rotor bottom elevations of the DTU reference wind turbine (117.19, 210.94, 39.06 m). The profiles (INC, DEC, VEE, INV) are defined according to the wind directions at the top of the rotor disk θtop, the hub height θhub, and the bottom of the rotor disk θbot, as shown in Table 1, and every instant of the simulation time histories is categorized into one of these profiles. Table 1 also shows the frequency of occurrence of each of the veer shapes and shows that INC, one of the monotonically varying veer profiles, dominates. Different veer profiles may induce different load conditions on the blades, rotor, and tower.
Table 1Percentage occurrence of the four different veer profiles at each reference radius.

Although the wind directions at the rotor top, hub height, and rotor bottom define the overall shape of the veer profile, the LESs provide the wind direction at a series of vertical points spaced at 15.625 m. The actual change in wind direction vertically across the rotor disk may be nonlinear (Fig. 4) as seen by the profiles with maximum veer within each profile type at each radius. The veer magnitude is defined as
Direction changes of over 30∘ between the top and bottom of the rotor can occur within the hurricane boundary layer, particularly in the eyewall region.
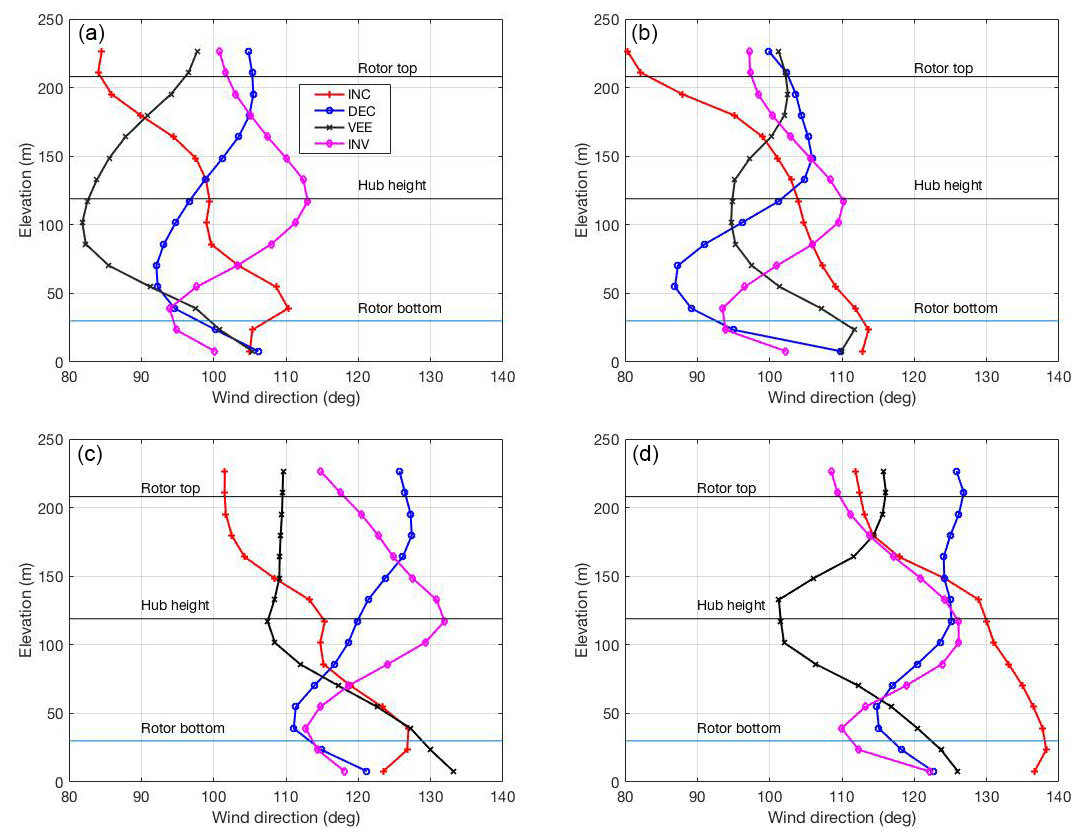
Figure 4Maximum instantaneous veer profile for the four profile shapes at four radii from the hurricane center: (a) internal eyewall boundary R=10 km, (b) within eyewall R=12 km, (c) outer edge of eyewall R=15 km, and (d) outside the eyewall R=20 km. The hub height and rotor top and bottom of the DTU reference turbine, at elevations of 119, 208, and 30 m, respectively, are indicated with horizontal lines.
3.1 TurbSim inputs
To simulate a wind turbine in FAST subjected to hurricane wind conditions, TurbSimv2 is used to generate wind input files that are compatible with FAST and that capture the key characteristics of the wind fields produced by the LESs. TurbSim is a full-field, turbulent wind simulator developed by the National Renewable Energy Laboratory (Jonkman and Buhl Jr., 2005). Using statistics from the LES data at each of the four radii defined in Sect. 2, wind input files representing the wind field at each radius are generated. Each wind input file is 1 h long, consistent with IEC standards for wind turbine structural design and load calculations (IEC, 2009).
TurbSim requires inputs of mean reference wind speed and turbulence intensity at the turbine's hub height, spectrum (Kaimal in this case), wind shear profile, wind veer profile, and coherence exponent (applied to Eq. 18 in Jonkman and Buhl Jr., 2009). Given these parameters, TurbSim models turbulence as a Gaussian process with no skewness and kurtosis equal to 3, while the turbulence in the LES wind field can be non-Gaussian (see, e.g., Schoettler et al., 2017, for a further discussion of the impact of wind field non-Gaussianity).
3.2 TurbSim and LES data comparisons
The mean reference wind speed and turbulence intensity were determined using the LES data at a height nearest the hub height at z=117.19 m. Skewness and kurtosis are not TurbSim input parameters, and therefore comparison between the values of skewness and kurtosis indicate the goodness of fit of the marginal distribution of the TurbSim wind fields relative to those in the LESs.
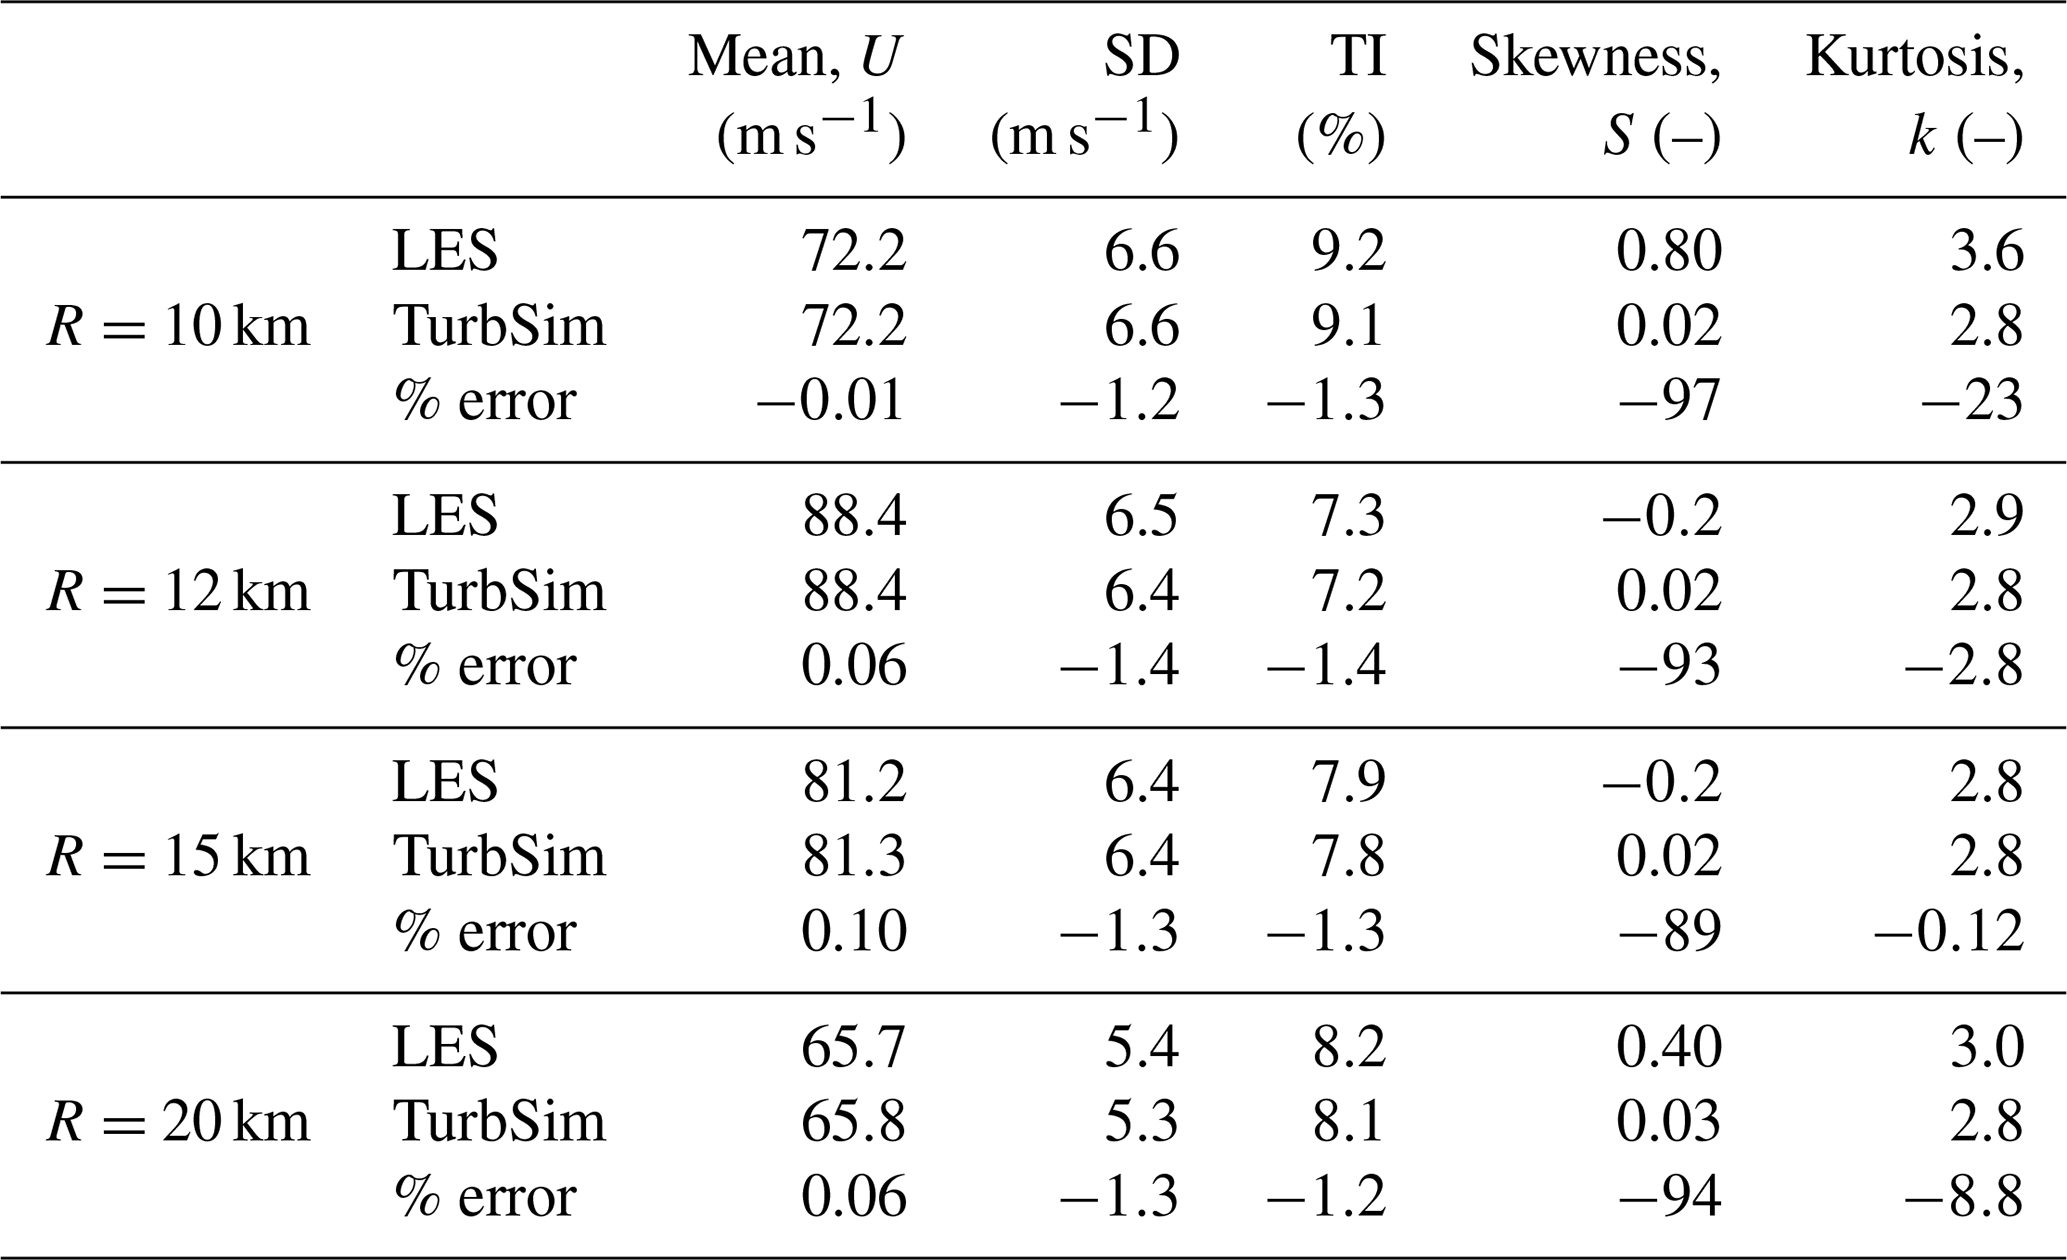
While the mean, turbulence intensity, and kurtosis of the two wind fields match almost exactly, the largest differences appear in the skewness (Table 2). (The mean and turbulence intensity should match since these two values are prescribed to TurbSim.) TurbSim assumes normally distributed turbulence statistics, and thus the skewness is nearly zero in all cases. The LES wind field has small but non-negligible skewness, resulting in large percentage differences between the two sets of wind files, though the absolute differences are small. Note that identical turbulence intensity has been applied to all three components of the wind field. To the authors' knowledge this is common practice in the design and analysis of offshore wind turbines. Further study of the possibility of turbulence intensity differences in the component wind directions would be a worthwhile contribution. Using the inputs as described, TurbSim did not replicate the gust factors observed in the LES data, with the TurbSim gust factors reaching a maximum of 1.3, significantly lower than observed in the LES data. Generating more intense gusts in TurbSim would require increasing the turbulence intensity or modifying the distribution of the wind speed, and such approaches should be developed in further work.
The wind shear profiles from LES and TurbSim are indistinguishable (Fig. 5). The wind shear profile for each radii was specified using the mean horizontal wind speed from LES for all grid cells between the top and bottom of the rotor disk. These shear profiles were then specified in TurbSim's User-Defined Profile, available in TurbSimv2. In both cases, the profile at the 10 km radius deviates from a standard power-law profile.
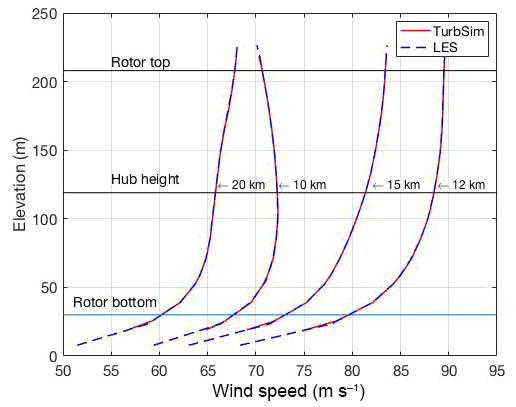
Figure 5Wind shear profile: the mean wind shear profile at R=10, 12, 15, and 20 km for both the LES and TurbSim wind field simulations. For reference, the three horizontal lines indicate the top and bottom of the rotor disk at 208 and 30 m, respectively, and the hub height at 119 m.
Two cases were considered for the wind veer profile: a baseline case with no veer and a case with veer. The veer profiles are specified in the TurbSim input file. In the “no-veer” case, the wind direction is 0∘ at all heights. In the veer case, at each radii, the four veer profiles shown in Fig. 4 are specified. As in the case of wind shear, the LES and TurbSim veer profiles match exactly and are thus not shown here. It should be noted that the veer profiles selected are worst-case instantaneous veer profiles from the 10 min simulation. Instantaneous veer profiles may overestimate the veer that drives structural response due to timescales associated with structural response to direction change. In the absence of consensus on how to average veer profiles to establish design veer profiles, the instantaneous worst case has been used here with the caveat that results may overestimate the impact of veer on structural response.
The power spectral density compares well between LES and TurbSim (Fig. 6). The hub height wind speed power spectral density created by TurbSim is modeled with a Kaimal spectrum. The temporal resolution of the LES data and the implicit subgrid-scale filter cause the power to fall off at high frequencies more quickly than the TurbSim data. Aside from this expected difference, the plots show a reasonable agreement between the two datasets at all four radii. While it is possible to specify a user-defined spectrum in TurbSim, the Kaimal spectrum was selected as a model to not make the simulations overly storm-specific, to mitigate the effects of temporal resolution in creating artifacts such as high-frequency roll-off in the spectra and to mimic what the authors understand to be standard practice in design and analysis. Furthermore, as with the turbulence intensities, transverse components of the wind field have been assumed to have the same spectral form.
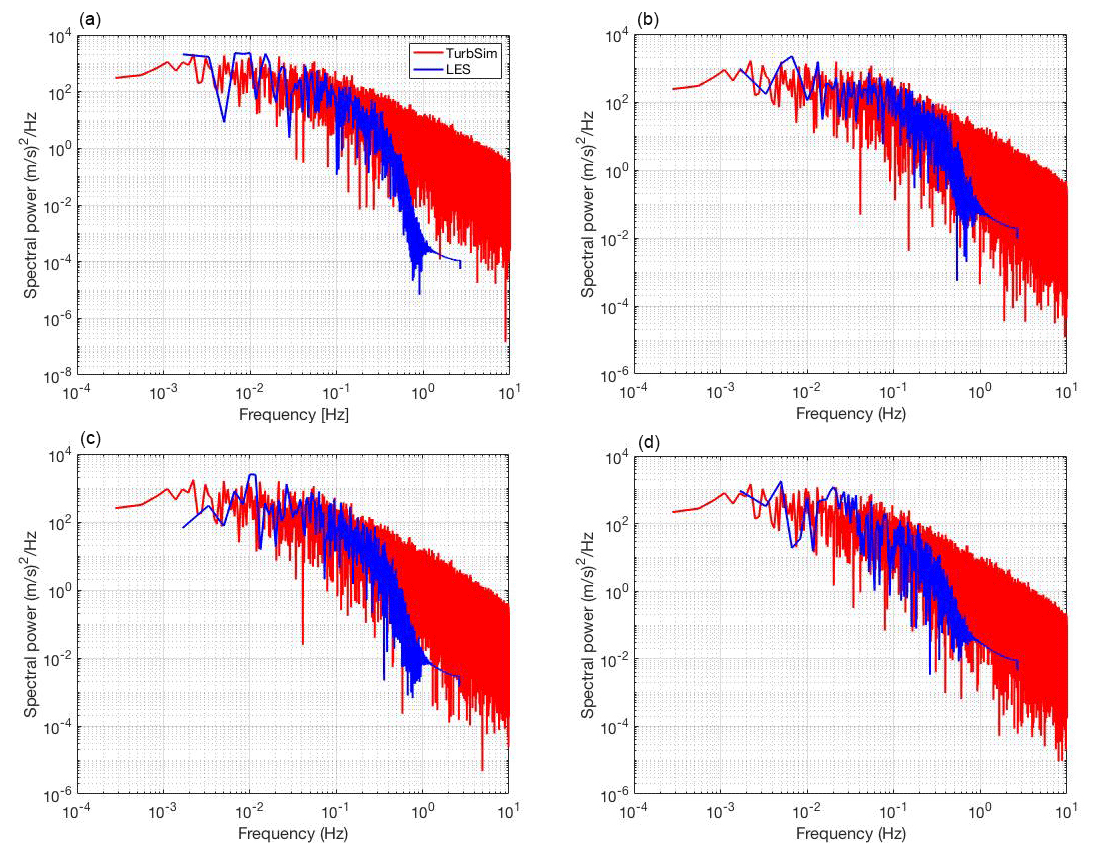
Figure 6Power spectral density comparisons of the LES and TurbSim 10 min wind field simulations at hub height at four different radii from the hurricane center.
The coherence exponent controls the degree of spatial coherence between neighboring points as a function of distance between points (Jonkman and Buhl Jr., 2009). Coherence in the hurricane boundary layer may persist at larger horizontal separations than seen in non-hurricane boundary layers (Worsnop et al., 2017b). In TurbSim, the vertical coherence of the wind speed is defined for the x, y, and z components of wind individually by
where r is the vertical distance between points i and j, f is the cyclic frequency, CohExp is the coherence exponent input parameter, zm and are the mean height and wind speed of points i and j, and a and b are the spatial coherence decrement and offset parameter for the component of the wind speed under consideration. The CohExp parameter provides primary control in the TurbSim input files and has been selected as the only coherence fitting parameter in the name of simplicity.
The appropriate value for the coherence exponent was evaluated by calculating the correlation coefficient between the hub height wind speed time series and the wind speed time series at all other heights in the LES data. Recall that the vertical spacing between grid points in the LES data is 15.6 m. The option for setting the coherence exponent value was limited by the TurbSim software. Through a process of trial and error, a single coherence exponent of 0.85 was selected for all locations for consistency between simulations, which is near the maximum allowable value of 1.0. This selection represents a significant increase in coherence compared to the default value of 0.0, but previous work indicates that the hurricane boundary layer likely contains coherent structures such as roll vortices that would increase the coherence of the flow (Worsnop et al., 2017b).
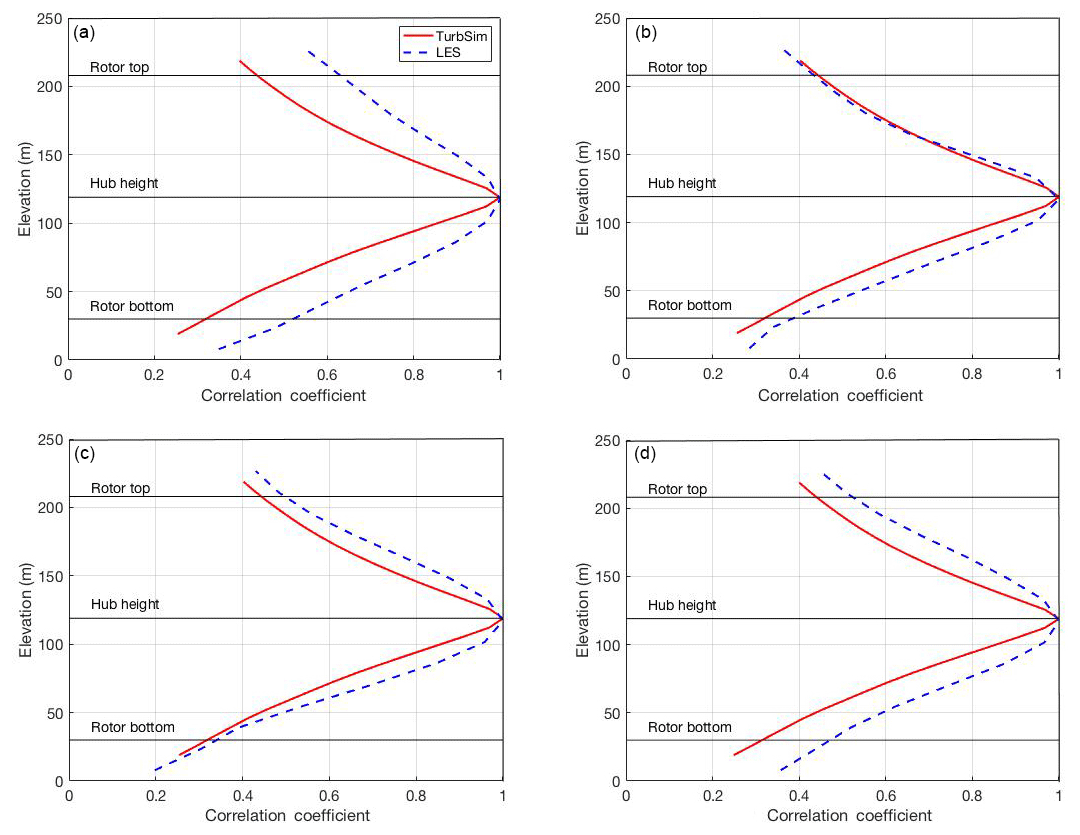
Figure 7Profiles of the correlation coefficient between the 10 min horizontal wind speed time series at each elevation and the 10 min horizontal wind speed time series at hub height for TurbSim (red) and LES (blue dashed) simulations at four different radii from the hurricane center.
As the coherence exponent increases, the correlation between the wind speed time series at spatially separated points also increases, increasing the variance of the total blade load and therefore the maximum load. The LES data tend to have higher spatial correlation in the vertical direction than the TurbSim data (Fig. 7). However, the default TurbSim coherence exponent of 0.0 causes poorer agreement as the vertical correlation within the TurbSim data drops off even more rapidly with distance than is seen in the LES data. Capturing the spatial coherence of the wind field to the greatest degree possible is important for estimating structural response because wind fields with longer-range coherence would be expected to generate greater variability in structural loads. This difference occurs because the blades act as lengthwise integrators of the local aerodynamic forces.
Table 3Wind field characteristics for the suite of simulation cases (n/a: not applicable).
4.1 FAST simulations
Four cases were considered for each of the four radii: baseline hurricane winds (BASE), hurricane winds with veer (VEER), misaligned hurricane winds (MISAL), and, for comparison, winds at rated power (RATED). The BASE case represents an idling turbine with a wind field corresponding to the mean wind speed and turbulence intensity from the LES but without any veer or direction change. The VEER case considers the largest-magnitude veer case as described in Sect. 3 with the veer profile applied at 1 m vertical increments. The MISAL case considers the baseline wind with a yawed turbine to evaluate the impact of rapid direction change. The degree of yaw misalignment is determined for each location based on the maximum 10 s direction change described in Sect. 2. Yaw misalignment may occur if the wind changes direction more quickly than the yaw controller can adjust the nacelle. Since mean wind direction cannot vary temporally in FAST–TurbSim, yaw misalignment has been used as a surrogate for the effects of rapid direction change. For these three cases (BASE, VEER, and MISAL), the turbine blades are pitched to feather, the rotor is set to idle, and the generator is turned off. For the RATED case, an operational turbine is simulated. The rated wind speed case considers the turbine operating in conditions with a mean wind speed of 11.4 m s−1, a turbulence intensity of 10 %, power-law exponent of 0.1, and a coherence exponent of 0.0. The blade pitch and generator controllers are active during simulations, induction is disabled for idling cases, and aerodynamic loads on the tower are included. A 1 h simulation of the turbine response was performed for each wind field case. This record was then subdivided into six 10 min intervals, and the maximum turbine response was extracted for each 10 min interval. Table 3 summarizes the wind field characteristics for the full set of simulation cases, and the following tables provide the average of the six maximum responses of the 10 min simulation intervals. Subdividing a 1 h simulation into 10 min intervals introduces a minor correlation between the 10 min intervals, but since the timescales associated with turbulence are very small compared to the 10 min analysis interval, this effect is negligible. This procedure mitigates the need to allow transients to dissipate for each 10 min simulation and provides the ability to estimate variability across simulations.
4.2 Maximum turbine structural loads
When the BASE, VEER, or MISAL cases are applied to the turbine, the tower demands in the side-to-side (SS) direction and the blade demands in the rotor plane increase compared to the RATED case. The tower demands in the fore–aft (FA) direction and the blade demands out of the rotor plane are either reduced or do not increase significantly because the nonrated wind cases have the blades pitched to feather, reducing the impact of the wind in those directions. The MISAL wind causes the largest increase in loads, followed by VEER, then BASE. The increased loads due to wind misalignment and veer emphasize the importance of considering misalignment and veer when evaluating turbine structural response (Tables 4 through 8).
Table 4Maxima of blade and tower structural response to the BASE hurricane wind case. The scale factor (SF) indicates the magnitude of response relative to RATED. Numerical values of the scale factors are not provided when not appropriate (for blade deflections the blade is oriented differently in RATED, and the scaling of FA–SS tower base moment ratios is not a meaningful measure of response).
Table 5Maxima of blade and tower structural response to the VEER case. The scale factor (SF) indicates the magnitude of response relative to RATED. Cells highlighted in gray indicate values that exceed the Eurocode strength basis value for the tower (5.4×10⁵ kNm) or the 18 m deflection limit on the blade tip. Numerical values of the scale factors are not provided when not appropriate (for blade deflections the blade is oriented differently in the rated case, and the scaling of FA ∕ SS tower base moment ratios is not a meaningful measure of response).
Table 6Maxima of blade and tower structural response to the VEER case. The scale factor (SF) indicates the magnitude of response relative to BASE. Cells highlighted in gray indicate values that exceed the Eurocode strength basis value for the tower (5.4×10⁵ kNm) or the 18 m deflection limit on the blade tip. Numerical values of the scale factors are not provided when not appropriate (for blade deflections the blade is oriented differently in the rated case, and the scaling of FA ∕ SS tower base moment ratios is not a meaningful measure of response).
Table 7Maxima of blade and tower structural response to the MISAL case. The scale factor (SF) indicates the magnitude of response relative to RATED. Cells highlighted in gray indicate values that exceed the Eurocode strength basis value for the tower (5.4×10⁵ kNm) or the 18 m deflection limit on the blade tip. Numerical values of the scale factors are not provided when not appropriate (for blade deflections the blade is oriented differently in the rated case, and the scaling of FA ∕ SS tower base moment ratios is not a meaningful measure of response).

Table 8Maxima of blade and tower structural response to MISAL case. Scale factor (SF) indicates magnitude of response relative to BASE. Cells highlighted in gray indicate values that exceed Eurocode strength basis value for the tower (5.4×10⁵ kNm) or the 18 m deflection limit on the blade tip. Numerical values of scale factors are not provided when not appropriate (for blade deflections the blade is oriented differently in the rated case and scaling of FA ∕ SS tower base moment ratios is not a meaningful measure of response).

Hurricane wind field characteristics such as VEER and MISAL cause substantial increases in certain turbine (blade and tower) loads when compared to BASE and RATED cases (Tables 4 through 8). The BASE loads are presented as scale factors relative to the RATED loads in Table 4. The VEER loads appear as scale factors of RATED in Table 5 and scaled to BASE in Table 6. The MISAL loads appear as scale factors of RATED in Table 7 and scaled to BASE in Table 8.
The design of the DTU 10 MW turbine is specified by Bak et al. (2013). The base cross section of the tower is a hollow steel tube with a diameter of 8.3 m and a thickness of 38 mm. For a section with this geometry and with Imperfection Quality Class B, Eurocode (2007) (EN 1993 1–6) prescribes a flexural strength of 74 % of the yield moment. For the DTU 10 MW turbine tower, which is made with S355 steel with a yield stress of 355 MPa, the flexural strength of this section per Eurocode is 5.4×5 kNm. The 18 m blade deflection limit is a rounded limit based on the 18.3 m tower clearance in the DTU 10 MW turbine (Bak et al., 2013).
For selected loads, the BASE loads surpass those of the RATED case. While the BASE out-of-plane blade loads in Table 4 are less than the RATED loads, the in-plane values exceed what is expected of rated operation. Similarly, the side-to-side tower BASE moment increase is approximately 3 times greater than the fore–aft moment increase. However, the side-to-side moment for the RATED case is a factor of 10 lower than the fore–aft moment, so the resultant moment for the BASE cases is around 2 times the moment for RATED. The simulated storm is a Category 5, and therefore increased loads relative to RATED are expected.
When including veer in the wind speed profile, loads increase. The loads for the VEER case in Tables 5 and 6 follow a similar trend as the BASE case; however, the veer causes the load increases to be substantially higher, especially in the side-to-side and in-plane directions. The introduction of veer causes all side-to-side, in-plane, and resultant loads to exceed the RATED loads. When compared to the BASE case, the resultant tower base moment in VEER is nearly the same or slightly greater. The resultant blade root bending moment for VEER was on average 3.5 times greater than even the BASE case and 1.75 greater than RATED. Veer has a significant effect on blade deflections and blade root moments since a blade can be pitched to only a single angle, and that angle cannot correspond to a feathered state when wind direction changes along the length of the blade.
The misaligned wind causes even greater load increases than the VEER case and does so for both the blades and the tower. Only the out-of-plane tip deflection is still lower than that of the RATED case. The in-plane tip deflection is around 20 times greater than the RATED in-plane tip deflection, reaching 50 m at a radial position of 12 km. This is a physically unrealistic tip deflection beyond the modeling and simulation capabilities of FAST–ElastoDyn as used in this study. The numerical magnitudes of the tip deflections should therefore not be taken as quantitatively meaningful, but rather as an indication that large blade deflections, of potential structural concern, are occurring during the loading. The side-to-side tower base moment also shows substantially higher results with, a moment 90 times greater than rated at a radial position of 10 km. When presented as a scale factor applied to the BASE case, the impact of potential yaw misalignment is particularly apparent with an increase on average for every load assessed. The resultant blade root bending moment is approximately 6 times that of the BASE case and 5 times greater than the RATED case, while the resultant tower base moment is approximately 2.5 times greater than the BASE case and 5.5 times greater than the RATED case.
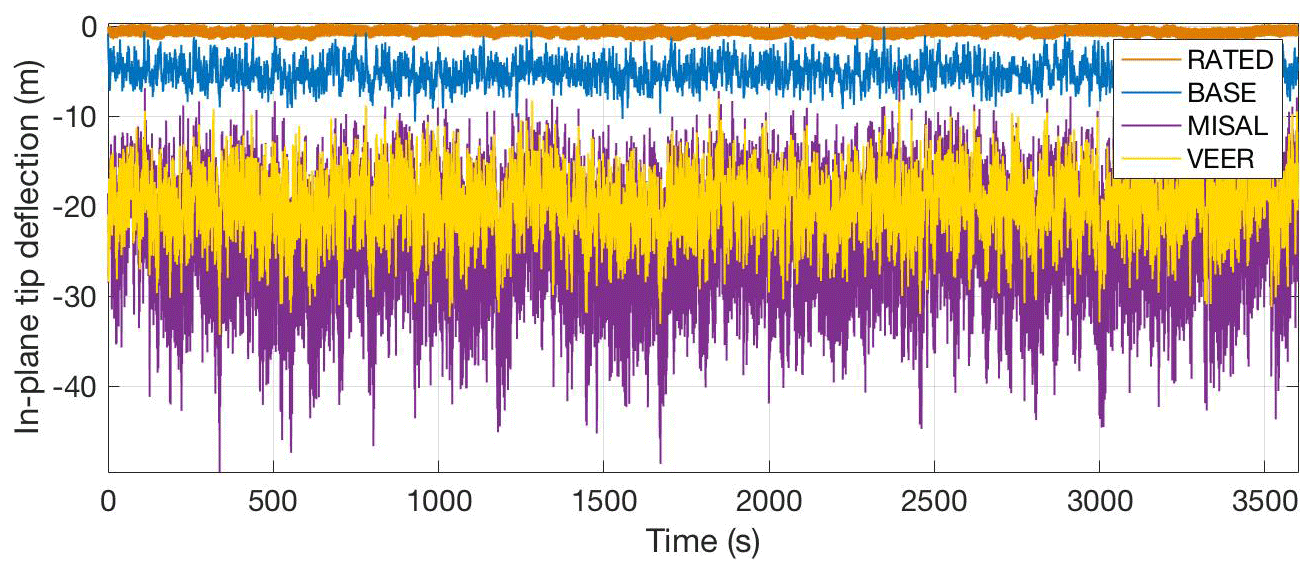
Figure 8Time series of in-plane blade tip deflection for turbine simulations at a radial position of 12 km with rated wind (RATED), baseline wind (BASE), wind with veer (VEER), and misaligned wind (MISAL).
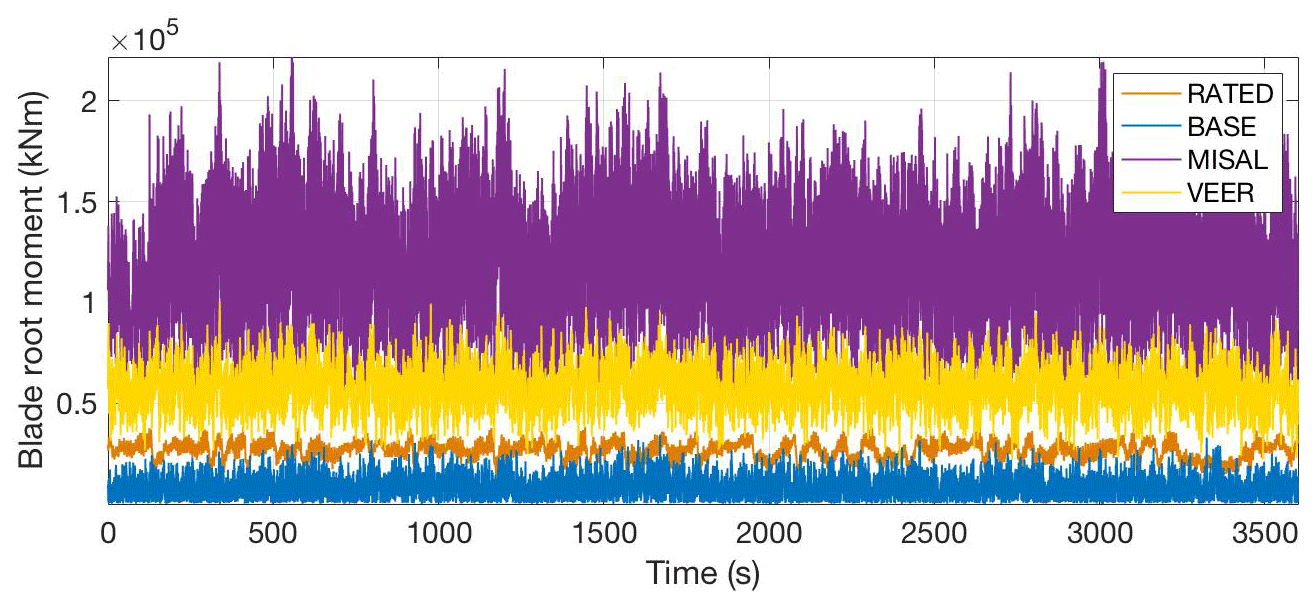
Figure 9Time series of the resultant moment at the blade root for turbine simulations at a radial position of 12 km with rated wind (RATED), baseline wind (BASE), wind with veer (VEER), and misaligned wind (MISAL).
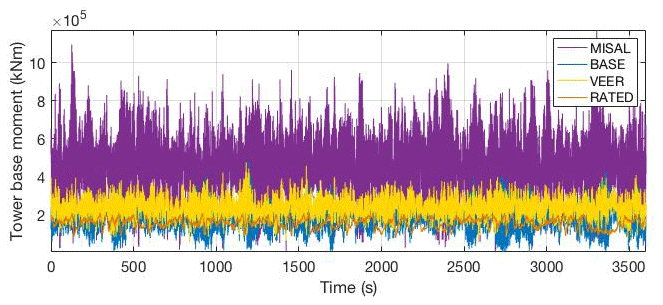
Figure 10Time series of tower base resultant moment for turbine simulations at a radial position of 12 km with rated wind (RATED), baseline wind (BASE), wind with veer (VEER), and misaligned wind (MISAL).
4.3 Time series of select turbine structural loads at R=12 km
Time series provide an indication of how the load histories vary under the different wind cases with more detail than the maximum responses given in the preceding tables (Figs. 8–10). The 12 km radius, within the eyewall, has the highest mean wind speed and shows the greatest variation in loads as the wind changes. The misaligned flow (MISAL) causes the largest standard deviation and mean for in-plane tip deflection (purple line in Fig. 8), blade root resultant moment (purple line in Fig. 9), and tower base resultant moment (purple line in Fig. 10). The VEER case causes a greater mean than RATED for all three loads presented but a similar standard deviation for the tower base resultant moment. As presented above, the BASE wind (blue lines in Figs. 8–10) causes an increase in in-plane tip deflection and tower base resultant moment compared to RATED, but the mean and maximum blade root resultant moment decrease for BASE, while the standard deviation increases.
With the expansion of offshore wind off the US East Coast, critical questions emerge regarding hurricane-induced loads on offshore wind turbines. Given the paucity of high-rate observations of winds and turbulence offshore in turbine rotor altitudes, we have integrated atmospheric large eddy simulations (LESs) of an idealized Category 5 hurricane with the CM1 into the engineering wind field simulator TurbSim to estimate loads on a 10 MW turbine using FAST. In particular, we evaluate how turbine and tower structures respond to flows characteristic of the hurricane boundary layer, particularly the eyewall, such as high wind speeds, veer in wind profiles, and rapid wind direction changes.
TurbSim wind fields can represent the mean wind speed, turbulence intensity, power spectra, veer, coherence, and direction change (represented as yaw misalignment) as they were calculated in CM1's LES of a Category 5 hurricane. Significant veer across the rotor disk (approximately 30∘) and rapid direction changes at hub height (up to 30∘ in 10 s) occur in the LESs. Further, the hurricane boundary layer appears to impose a much stronger spatial coherence than is normally assumed, perhaps due to coherent structures in the eyewall. Simulations show that veer and direction change can dramatically increase loads on the blades and tower, in some cases by factors of 5 or more. In general, veer primarily increases blade loads, while rapid direction changes at hub height amplify both blade and tower loads. Hurricane loads on wind turbines may therefore exceed those loads predicted when hurricane wind fields are simulated without the inclusion of veer and rapid direction change. Yaw misalignment cases are specified in design standards such as IEC 61400-3, but for normal operating cases the magnitude of the misalignment is only 8 or 15∘ depending on the corresponding wind model. The results of this paper, however, show that much larger misalignments may occur due to rapid wind direction changes.
The loads calculated here should motivate further investigation into how the hurricane boundary layer affects wind turbines. This Category 5 storm, even though small in size compared to many Category 5 storms, represents an environmental scenario far more severe than could credibly affect the vast majority of wind energy areas. Simulations of weaker hurricanes, which would be more frequently expected, must assess more likely risks to large-scale deployments of wind turbines. Also needed are assessments of the likelihood of these conditions in order to dictate design conditions as part of a probabilistic design basis.
Refinements to the LES would also provide insight. The LESs are conducted assuming that the hurricane is over open ocean. The onshore version of the DTU 10 MW turbine is used along with these offshore wind fields to isolate the effect of hurricane wind field characteristics in the absence of other structural loading from waves. These LESs are not coupled with a wave model and therefore do not explicitly model wave effects. Without wind–wave coupling, such simulations cannot provide information regarding the sea state in the hurricane. Such coupling is needed to explore how the hurricane atmospheric and oceanic boundary layers would affect the entire turbine and support structures such as monopiles, jackets, and floating platforms and mooring systems. The work presented herein has demonstrated that the hurricane boundary layer can adversely affect offshore wind turbines and motivates subsequent examination with further refinements.
Data are available at https://github.com/alkapoor/Hurricane-LES-and-Turbine-data.git (Kapoor, 2020).
JKL, RPW, and GHB performed the LESs and data analysis as cited. AK, SO, SRA, MAL, and ATM performed the structural analysis of the wind turbine and generated the representative wind fields. All authors participated in preparing the paper.
The authors declare that they have no conflict of interest.
The views expressed in the article do not necessarily represent the views of the DOE or the US Government. The US Government retains and the publisher, by accepting the article for publication, acknowledges that the US Government retains a nonexclusive, paid-up, irrevocable, worldwide license to publish or reproduce the published form of this work, or allow others to do so, for US Government purposes.
The authors acknowledge high-performance computing support from Yellowstone (ark:/85065/d7wd3xhc) provided by the National Center for Atmospheric Research's Computational and Information Systems Laboratory and sponsored by the National Science Foundation. This work was authored, in part, by the National Renewable Energy Laboratory, operated by the Alliance for Sustainable Energy, LLC, for the US Department of Energy (DOE), and funding was provided by the US Department of Energy Office of Energy Efficiency and Renewable Energy Wind Energy Technologies Office.
This research has been supported by the US National Science Foundation (grant nos. CMMI-1552559 and CMMI-1234656), the University of Bologna (grant prot. no. 1067 tit. III cl.12), and the National Renewable Energy Laboratory, operated by the Alliance for Sustainable Energy, LLC, for the US Department of Energy (DOE; contract no. DE-AC36-08GO28308).
This paper was edited by Johan Meyers and reviewed by two anonymous referees.
Amirinia, G. and Jung, S.: Buffeting response analysis of o shore wind turbines subjected to hurricanes, Ocean Eng., 141, 1–11, 2017.
Bak, C., Zahle, F., Bitsche, R., Kim, T., Yde, A., Henriksen, L. C., Natarajan, A., and Hansen, M. H.: Description of the DTU 10 MW reference wind turbine, Report-I-0092 5, DTU Wind Energy, Kongen Lyngby, Denmark, 2013.
Bryan, G. H. and Rotunno, R.: The Maximum Intensity of Tropical Cyclones in Axisymmetric Numerical Model Simulations, Mon. Weather Rev., 137, 1770–1789, https://doi.org/10.1175/2008MWR2709.1, 2009a.
Bryan, G. H. and Rotunno, R.: The Maximum Intensity of Tropical Cyclones in Axisymmetric Numerical Model Simulations, Mon. Weather Rev., 137, 1770–1789, https://doi.org/10.1175/2008MWR2709.1, 2009b.
Bryan, G. H., Worsnop, R. P., Lundquist, J. K., and Zhang, J. A.: A Simple Method for Simulating Wind Profiles in the Boundary Layer of Tropical Cyclones, Bound.-Lay. Meteorol., 162, 475–502, https://doi.org/10.1007/s10546-016-0207-0, 2016.
Eurocode, C. E. N.: 3-Design of steel structures – Part 1–6: strength and stability of shell structures, ECCS 2008, European Committee for Standardization (CEN), Brussels, 2007.
Gallucci, M.: Rebuilding Puerto Rico's Power Grid: The Inside Story, IEEE Spectr., available at: https://spectrum.ieee.org/energy/policy/rebuilding-puerto-ricos-power-grid-the-inside-story (last access: 16 December 2019), 2018.
Giebel, G. and Gryning, S. E.: Shear and Stability in High Met Masts, and How WAsP Treats It, in: WEA Spec. Top. Conf. Sci. Mak. Torque Wind, Neth. Euro Wind Energy Assoc., Delft, 8 pp., 2004.
Green, B. W. and Zhang, F.: Numerical simulations of Hurricane Katrina (2005) in the turbulent gray zone, J. Adv. Model. Earth Syst., 7, 142–161, https://doi.org/10.1002/2014MS000399, 2015.
Hallowell, S. T., Myers, A. T., Arwade, S. R., Pang, W., Rawal, P., Hines, E. M., Hajjar, J. F., Qiao, C., Valamanesh, V., Wei, K., Carswell, W., and Fontana, C. M.: Hurricane risk assessment of offshore wind turbines, Renew. Energy, 125, 234–249, https://doi.org/10.1016/j.renene.2018.02.090, 2018.
Holland, G. J.: An Analytic Model of the Wind and Pressure Profiles in Hurricanes, Mon. Weather Rev., 108, 1212–1218, https://doi.org/10.1175/1520-0493(1980)108<1212:AAMOTW>2.0.CO;2, 1980.
Holland, G. J., Belanger, J. I., and Fritz, A.: A Revised Model for Radial Profiles of Hurricane Winds, Mon. Weather Rev., 138, 4393–4401, https://doi.org/10.1175/2010MWR3317.1, 2010.
IEC: IEC 61400/61401 Wind Turbines part 3: Design Requirements for Offshore Wind Turbines, Geneva, Switzerland, 2009.
Ishihara, T., Yamaguchi, A., Takahara, K., and Matsuura, S.: An Analysis of Damaged Wind Turbines by Typhoon Maemi in 2003, 6th Asian Pacific Conference on Wind Engineering, Seoul, South Korea, 1413–1428, 2005.
Jonkman, J. B. and Buhl Jr., M.: TurbSim user's guide, NREL, Golden, CO USA, 2009.
Jonkman, J. M. and Buhl Jr., M.: FAST User's Guide, National Renewable Energy Lab., Golden, CO, USA, available at: http://wind.nrel.gov/public/bjonkman/TestPage/FAST.pdf (last access: 16 December 2019), 2005.
Kapoor, A.: LES wind files and offshore turbine response files for Category 5 hurricane, available at: https://github.com/alkapoor/Hurricane-LES-and-Turbine-data, last access: 8 January 2020.
Kelley, N. D., Jonkman, B. J., and Scott, G. N.: The Great Plains Turbulence Environment: Its Origins, Impact, and Simulation – 40176.pdf, National Renewable Energy Lab., available at: http://www.nrel.gov/docs/fy07osti/40176.pdf (last access: 10 February 2017), 2006.
Kelley, P.: Renewables can help Puerto Rico keep its lights on, Wind AWEA Blog, available at: https://www.aweablog.org/renewables-can-help-puerto-rico-keep-lights/ (last access: 16 December 2019), 2017.
Kim, E. and Manuel, L.: Hurricane risk assessment for offshore wind plants, Wind Eng., 40, 261–269, https://doi.org/10.1177/0309524X16645482, 2016.
Mardfekri, M. and Gardoni, P.: Multi-hazard reliability assessment of offshore wind turbines: Multi-hazard reliability assessment of offshore wind turbines, Wind Energy, 18, 1433–1450, https://doi.org/10.1002/we.1768, 2015.
Rocky Mountain Institute: Post-Hurricane Renewables Opportunity in Puerto Rico, Rocky Mountain Institute, Basalt, CO, USA, 2017.
Rotunno, R., Chen, Y., Wang, W., Davis, C., Dudhia, J., and Holland, G. J.: Large-Eddy Simulation of an Idealized Tropical Cyclone, B. Am. Meteorol. Soc., 90, 1783–1788, https://doi.org/10.1175/2009BAMS2884.1, 2009.
Schoettler, J., Reinke, N., Hölling, A., Whale, J., Peinke, J., and Hölling, M.: On the impact of non-Gaussian wind statistics on wind turbines – an experimental approach, Wind Energ. Sci., 2, 1–13, https://doi.org/10.5194/wes-2-1-2017, 2017.
Sim, C., Basu, S., Manuel, L., Sim, C., Basu, S., and Manuel, L.: On Space-Time Resolution of Inflow Representations for Wind Turbine Loads Analysis, Energies, 5, 2071–2092, https://doi.org/10.3390/en5072071, 2012.
Stern, D. P., Bryan, G. H., and Aberson, S. D.: Extreme Low-Level Updrafts and Wind Speeds Measured by Dropsondes in Tropical Cyclones, Mon. Weather Rev., 144, 2177–2204, https://doi.org/10.1175/MWR-D-15-0313.1, 2016.
Tarp-Johansen, N. J. and Clausen N.-E.: Design of Wind Turbines in Typhoon area: A first study of Structural Safety of Wind Turbines in Typhoon prone areas, EC-ASEAN Energy Study, available at: https://backend.orbit.dtu.dk/ws/portalfiles/portal/6453834/02_Design_of_wind_turbines_in_typhoon_area.pdf (last access: 16 December 2019), 2006.
Valamanesh, V., Myers, A. T., and Arwade, S. R.: Multivariate analysis of extreme metocean conditions for offshore wind turbines, Struct. Saf., 55, 60–69, https://doi.org/10.1016/j.strusafe.2015.03.002, 2015.
Valamanesh, V., Myers, A. T., Arwade, S. R., Hajjar, J. F., Hines, E., and Pang, W.: Wind-wave prediction equations for probabilistic offshore hurricane hazard analysis, Nat. Hazards, 83, 541–562, https://doi.org/10.1007/s11069-016-2331-z, 2016.
Vanderwende, B. J. and Lundquist, J. K.: The modification of wind turbine performance by statistically distinct atmospheric regimes, Environ. Res. Lett., 7, 034035, https://doi.org/10.1088/1748-9326/7/3/034035, 2012.
Wei, K., Arwade, S. R., and Myers, A. T.: Incremental wind-wave analysis of the structural capacity of offshore wind turbine support structures under extreme loading, Eng. Struct., 79, 58–69, https://doi.org/10.1016/j.engstruct.2014.08.010, 2014.
Wei, K., Arwade, S. R., Myers, A. T., Hallowell, S., Hajjar, J. F., Hines, E. M., and Pang, W.: Toward performance-based evaluation for offshore wind turbine jacket support structures, Renew. Energy, 97, 709–721, https://doi.org/10.1016/j.renene.2016.06.028, 2016.
Wingo, S. M. and Knupp, K. R.: Kinematic Structure of Mesovortices in the Eyewall of Hurricane Ike (2008) Derived from Ground-Based Dual-Doppler Analysis, Mon. Weather Rev., 144, 4245–4263, https://doi.org/10.1175/MWR-D-16-0085.1, 2016.
Worsnop, R. P., Lundquist, J. K., Bryan, G. H., Damiani, R., and Musial, W.: Gusts and shear within hurricane eyewalls can exceed offshore wind turbine design standards, Geophys. Res. Lett., 44, 2017GL073537, https://doi.org/10.1002/2017GL073537, 2017a.
Worsnop, R. P., Bryan, G. H., Lundquist, J. K., and Zhang, J. A.: Using Large-Eddy Simulations to Define Spectral and Coherence Characteristics of the Hurricane Boundary Layer for Wind-Energy Applications, Bound.-Lay. Meteorol., 165, 55–86, https://doi.org/10.1007/s10546-017-0266-x, 2017b.
Wu, L., Liu, Q., and Li, Y.: Prevalence of tornado-scale vortices in the tropical cyclone eyewall, P. Natl. Acad. Sci. USA, 115, 8307–8310, https://doi.org/10.1073/pnas.1807217115, 2018.
Wurman, J. and Kosiba, K.: The Role of Small-Scale Vortices in Enhancing Surface Winds and Damage in Hurricane Harvey (2017), Mon. Weather Rev., 146, 713–722, https://doi.org/10.1175/MWR-D-17-0327.1, 2018.
Zhu, P.: Simulation and parameterization of the turbulent transport in the hurricane boundary layer by large eddies, J. Geophys. Res.-Atmos., 113, D17104, https://doi.org/10.1029/2007JD009643, 2008.
- Abstract
- Introduction
- Hurricane wind field characteristics
- Generating hurricane wind fields in TurbSim
- Structural effects of hurricane winds on wind turbines
- Conclusions
- Data availability
- Author contributions
- Competing interests
- Disclaimer
- Acknowledgements
- Financial support
- Review statement
- References