the Creative Commons Attribution 4.0 License.
the Creative Commons Attribution 4.0 License.
 | 14 Jul 2020
Assessment of a rotor blade extension retrofit as a supplement to the lifetime extension of wind turbines
Malo Rosemeier
Matthias Saathoff
The potential lifetime of wind turbine components is usually not fully utilized as the site conditions are less severe than assumed in the turbine design. Operators of wind farms can make use of the excess fatigue budget to increase the energy yield and thus decrease the levelized cost of energy (LCoE). To achieve this, the lifetime of the turbine can be extended until the fatigue budget is exhausted. Alternatively, a rotor blade extension (RBE) is an option to increase the energy yield of a wind turbine. An RBE increases the blade length and thus the swept area and the energy yield. An RBE also increases the loads on the turbine, however. Higher fatigue loads in turn reduce the fatigue budget of a turbine. This study investigates whether the use of an RBE is advantageous compared with a sole lifetime extension (LTE). As the use case, a commercial 1.5 MW turbine located in northern Germany was investigated. Aeroservoelastic multibody load simulations and simplified static load simulations were verified with each other. These simulations revealed the loads to determine the fatigue budget of the turbine components. Since the blade became the critical component when a certain RBE length was exceeded, the blade was subjected to a structural fatigue analysis. The fatigue analysis focused on the trailing-edge bond line which became critical when lead–lag loads increased with blade length. Finally, the energy production gains due to LTE and RBE were assessed. For the use case turbine, this study revealed an LTE of 8.7 years after a design life of 20 years with an additional energy yield of 43.5 %. Moreover, the extension of the 34 m blade with an RBE length of 0.8 m further increased the yield by 2.3 %.
- Article
(4686 KB) - Full-text XML
- BibTeX
- EndNote


Wind turbine operators are faced with a decision of how to handle their wind turbines once their certified lifetime has been reached. Common options are dismantling, repowering, or a lifetime extension (LTE) of the turbine (Ziegler et al., 2018). Both the technical and the economic aspects have to be taken into account for this decision. While dismantling the turbine is generally to be avoided, the decision on repowering versus LTE depends especially on the provision of subsidies, as well as of building regulations.
Older turbines were designed according to general wind conditions that were reflected by wind turbine classes according to IEC (1999) or by local standards, such as DIBt (1993), which used even broader classifications. Classified turbines have been placed at sites at which the wind conditions have been less severe than assumed during design. While these turbines have been exposed to lower loads, the energy yield has also been lower. This situation opens up more possibilities of further utilizing the turbine components after their design lifetime.
This study investigates the feasibility of a rotor blade extension (RBE) as a retrofit solution installed early in the turbine lifetime to supplement an LTE. Both options are aimed at increasing the total energy production of the turbine during its lifetime and hence at decreasing the levelized cost of energy (LCoE).
An RBE increases the energy production by increasing the swept area of the turbine. The loads on the rotor blade and the turbine are increased as well, however. Load mitigation strategies need to be employed to limit the ultimate loads on the turbine (Fischer and Shan, 2013). Such strategies can change the turbine controls, such as peak shaving (Ceyhan and Grasso, 2014) or the reduction in the cut-out wind speed. Another strategy can be to introduce a geometric sweep in the RBE (Larwood et al., 2014). Other design requirements for a turbine with an RBE are to avoid resonance due to a lower blade eigenfrequency, collision with the tower due to a longer blade length, and increase in aerodynamic noise because of a higher tip–speed ratio. Moreover, lightning protection or anti-icing systems could be integrated. As this study focuses on the fatigue loads relevant to LTE, methods for the reduction of ultimate loads were not considered.
The driving loads for the assessment of an LTE and an RBE are the fatigue loads. The lead–lag fatigue loads in particular are mostly generated by gravity loads on the blade during each revolution. Hence, increased lead–lag loads are inevitable as a consequence of the blade tip mass added by an RBE. The increase in lead–lag fatigue loads can be critical for the initiation of tunneling cracks in the adhesive bond line at the trailing edge, which can be initiated early in the turbine lifetime and may propagate into the blade structure (Rosemeier et al., 2019). Therefore, the fatigue stress exposure of the trailing edge was analyzed as a function of the increase in blade length. From this analysis it was assessed how the blade and turbine remaining lifetimes reduce depending on the RBE length on the one hand and how the energy yield of the turbine increases on the other. Other structural blade elements were not considered in this paper.
The design loads were obtained from a simplified simulation that takes into account static aerodynamic flapwise mean loads superimposed with alternating lead–lag gravity loads. The results of the static simulation were verified with the results of an aeroelastic multibody simulation. The use case investigated for this study was a 1.5 MW Südwind S70 wind turbine. The turbine was installed in 2003 in the Bremervörde-Iselersheim wind farm located in northern Germany (PNE WIND AG, 2003). The turbine uses SSP34-type rotor blades with a length of 34 m (Clysters, 2003).
In analogy with the concept of extending already-operating blades with an RBE, Christenson et al. (2012), for example, propose a modular concept which has a baseline blade whose length can be extended by extender blade tips of different lengths. The extension can be tailored to maximize energy yield on each given site. If a blade is designed to have a modular tip, many different connection concepts exist, such as support rods that couple the blade and tip portion (Santiago and Segovia, 2012), a load-carrying structure of blade and tip that are structurally connected by spar bridges (Bech and Hibbard, 2011; Hibbard, 2011a, b), or beams. Zahle et al. (2018) investigated the aerodynamic performance of the shape of a tip extension. If the blade was not designed to be modular but is to receive a tip segment or extension, most of the concepts require the modification of the root segment of the blade, e.g., by cutting away a whole blade segment (Merzhaeuser, 2015). In other concepts, the leading- and trailing-edge shell parts are removed to allow a connection with the load-carrying structure (Lemos and Savii, 2014). In this work, the RBE concept proposed by Wilkens (2016) was taken into account. This seems most applicable as a retrofit solution since the concept does not require the structure of the existing blade to be modified.
To the authors' knowledge, this work is the first time the impact of an RBE on the total lifetime including LTE with respect to the maximization in energy yield has been presented in the internationally available literature published in English.
This paper is structured as follows: Sect. 2 describes the design of the RBE in detail. Section 3 explains the methods of load simulation, stress, and damage analysis. Section 4 presents the results of the load simulation verification, the damage analysis, and the fatigue budget calculation. Moreover, the energy production gain is presented for different scenarios. Section 5 discusses the fidelity of the two load simulation methods, the method of damage equivalent load comparison, and the assessment of LTE and RBE. Finally, a conclusion summarizes the findings of this study.
A 1.5 MW turbine was selected for the use case scenario in this work. An RBE was designed for this use case turbine. As per the design requirement the blade structure was not allowed to be altered; i.e., the blade tip was not allowed to be cut up. Therefore, the concept of extending already-operating blades at the tip with an overlapping RBE was investigated. The concept (Fig. 1) was proposed by Wilkens (2016).
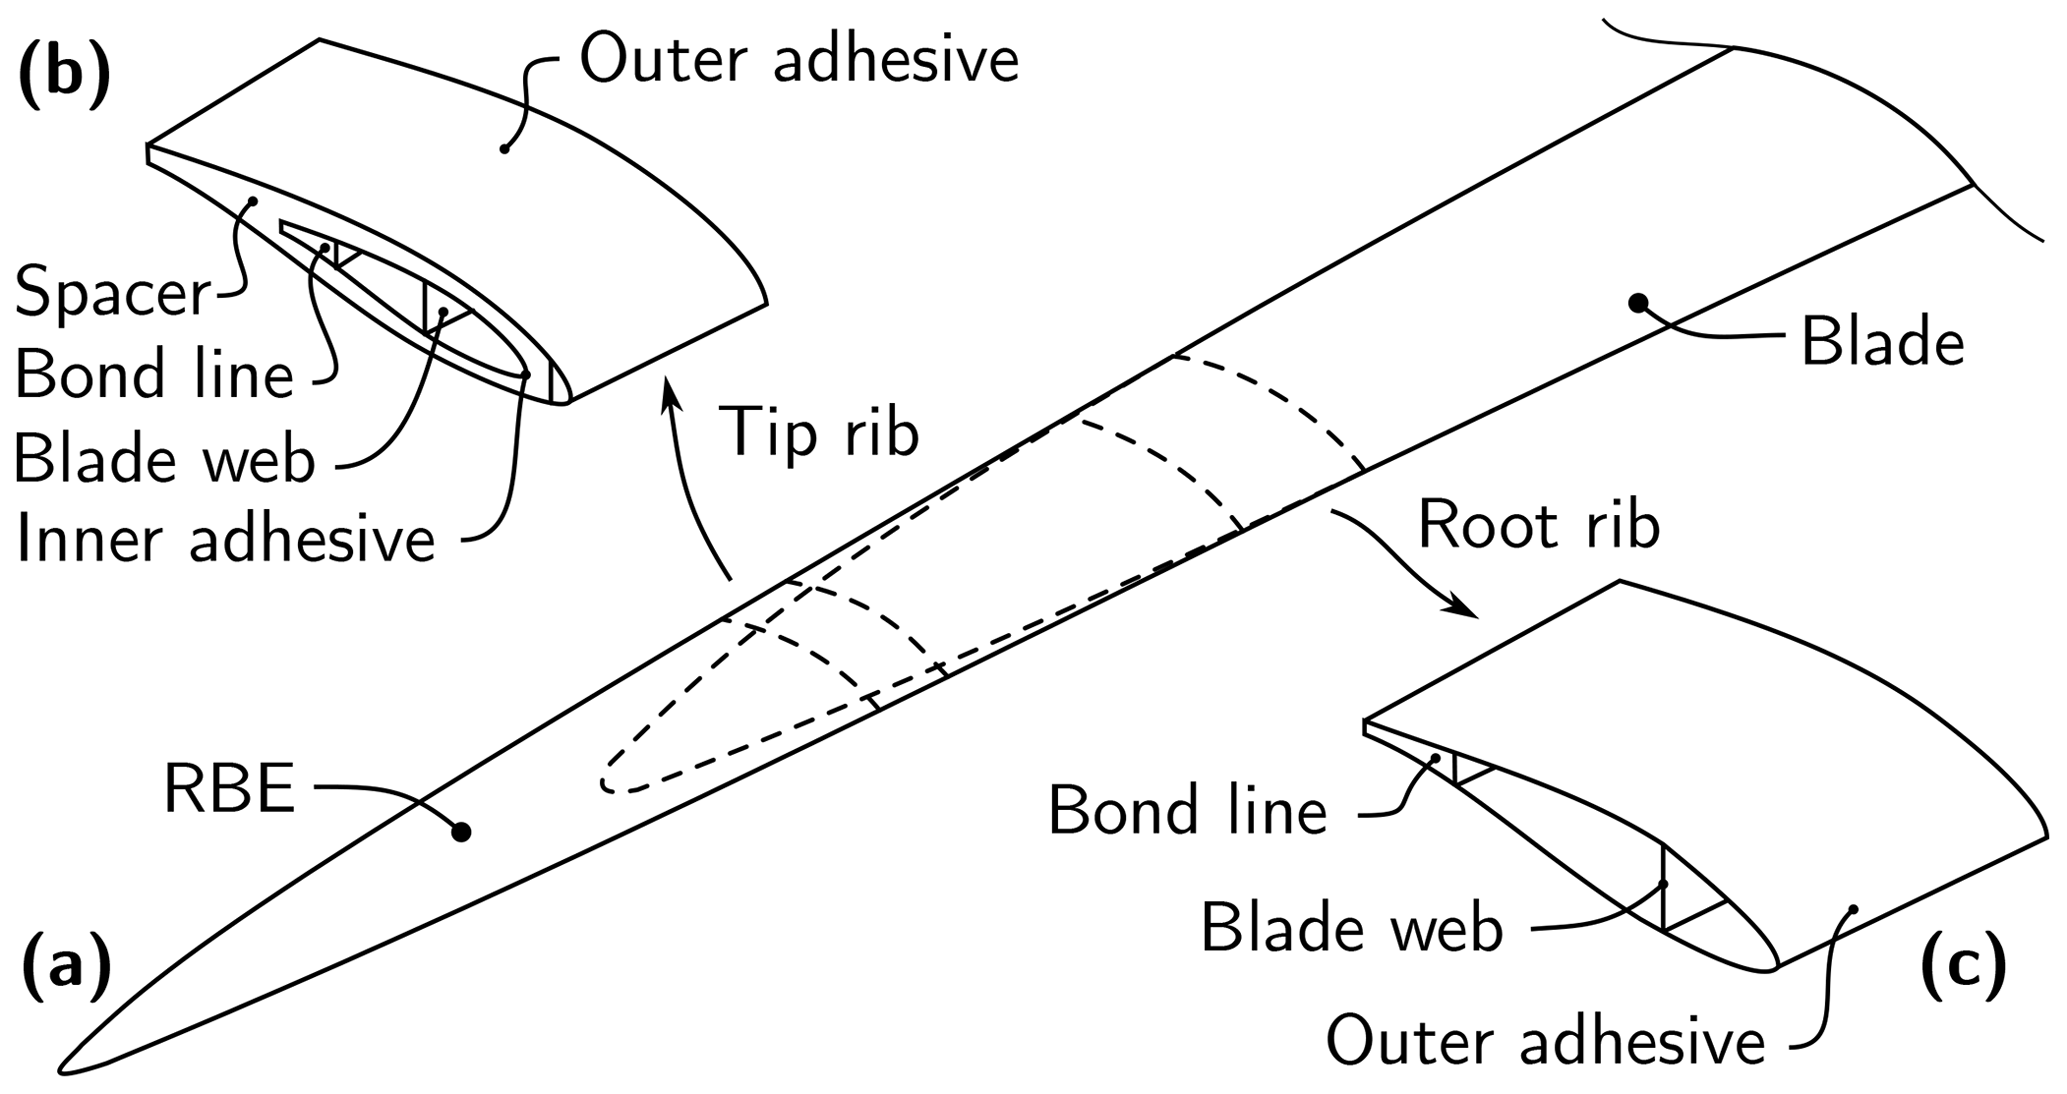
Figure 1Design concept of a rotor blade extension. (a) Assembly of blade and extension (RBE), (b) tipward bonding connection (Tip rib), and (c) rootward bonding connection (Root rib).
The RBE consists of two half shells that are pulled over an existing blade and fixed to it with adhesive. A rib located at the original blade tip is used as a second support. A web is added to the RBE to transfer the shear loading. The lightning protection system of the original blade passes through the blade tip of the root segment into the RBE. A lightning receptor is required at the tip of the RBE. Moreover, an outlet hole for water was considered in the RBE. This design is beneficial compared with designs containing support rods because no holes need to be drilled through the skin of the blade structure. Moreover, the RBE could potentially be dismantled with relatively little effort. Furthermore, the root blade segment remains unmodified.
The RBE is mounted on-site on the turbine without dismantling the entire rotor (Fig. 2). For the design of the RBE, site-specific manufacturing circumstances have to be considered. These circumstances entail the rotor position, i.e., the blade tip, pointing downwards to the ground, as well as environmental influences such as the temperature during the tempering of adhesive bond lines using heating mats.
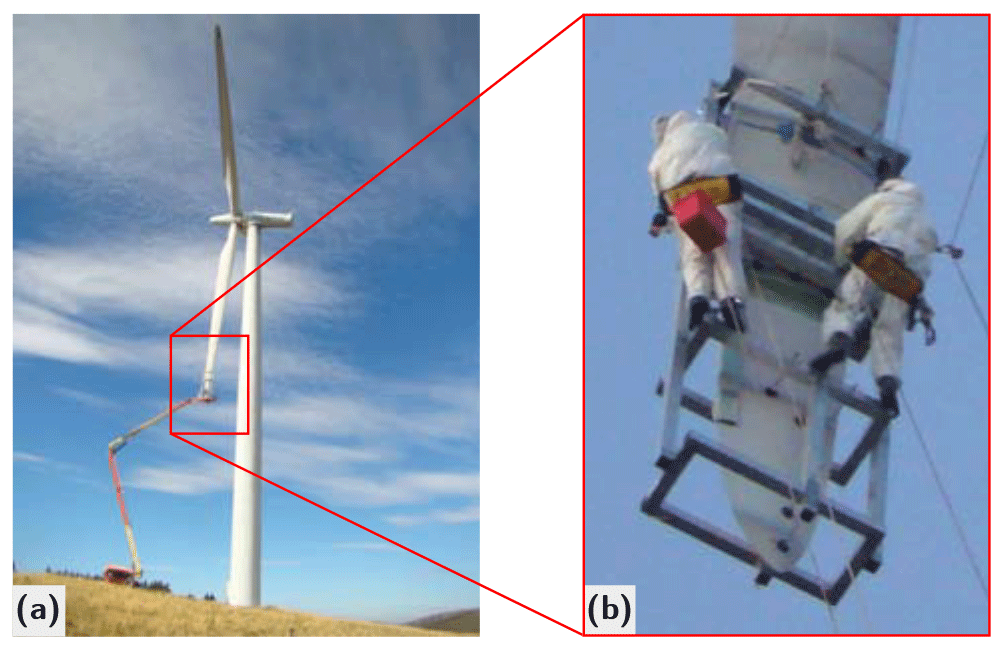
Figure 2Siemens Bonus 1.5 MW turbine (a) and on-site mounting of an RBE (b; Energiekontor, 2016).
In this work, the length of the RBE was parametrically increased to investigate its impact on AEP, fatigue budget, turbine dynamics, and tower clearance.
The LTE assessment of all wind turbine components was performed by comparing design loads to site-specific loads. This assessment used the loads from an aeroservoelastic load simulation. In addition, a simplified static load simulation was performed to evaluate the loads on the trailing edge of the blade. The two types of load simulations were conducted for different lengths of the RBE. A structural model of the rotor blade was used to evaluate the fatigue damage in the blade.
3.1 Static load simulation
The procedure of the static load simulation conducted in this work has been described by Rosemeier et al. (2018). The description of the method that focuses on the estimation of life cycles is presented in this work.
The lead–lag fatigue load cycles are calculated on the basis of the rotor revolutions in the design lifetime of the blade. The number of revolutions N that a blade is subjected to during its design life T is estimated.
The rotation frequency is defined as a function of the wind speed:
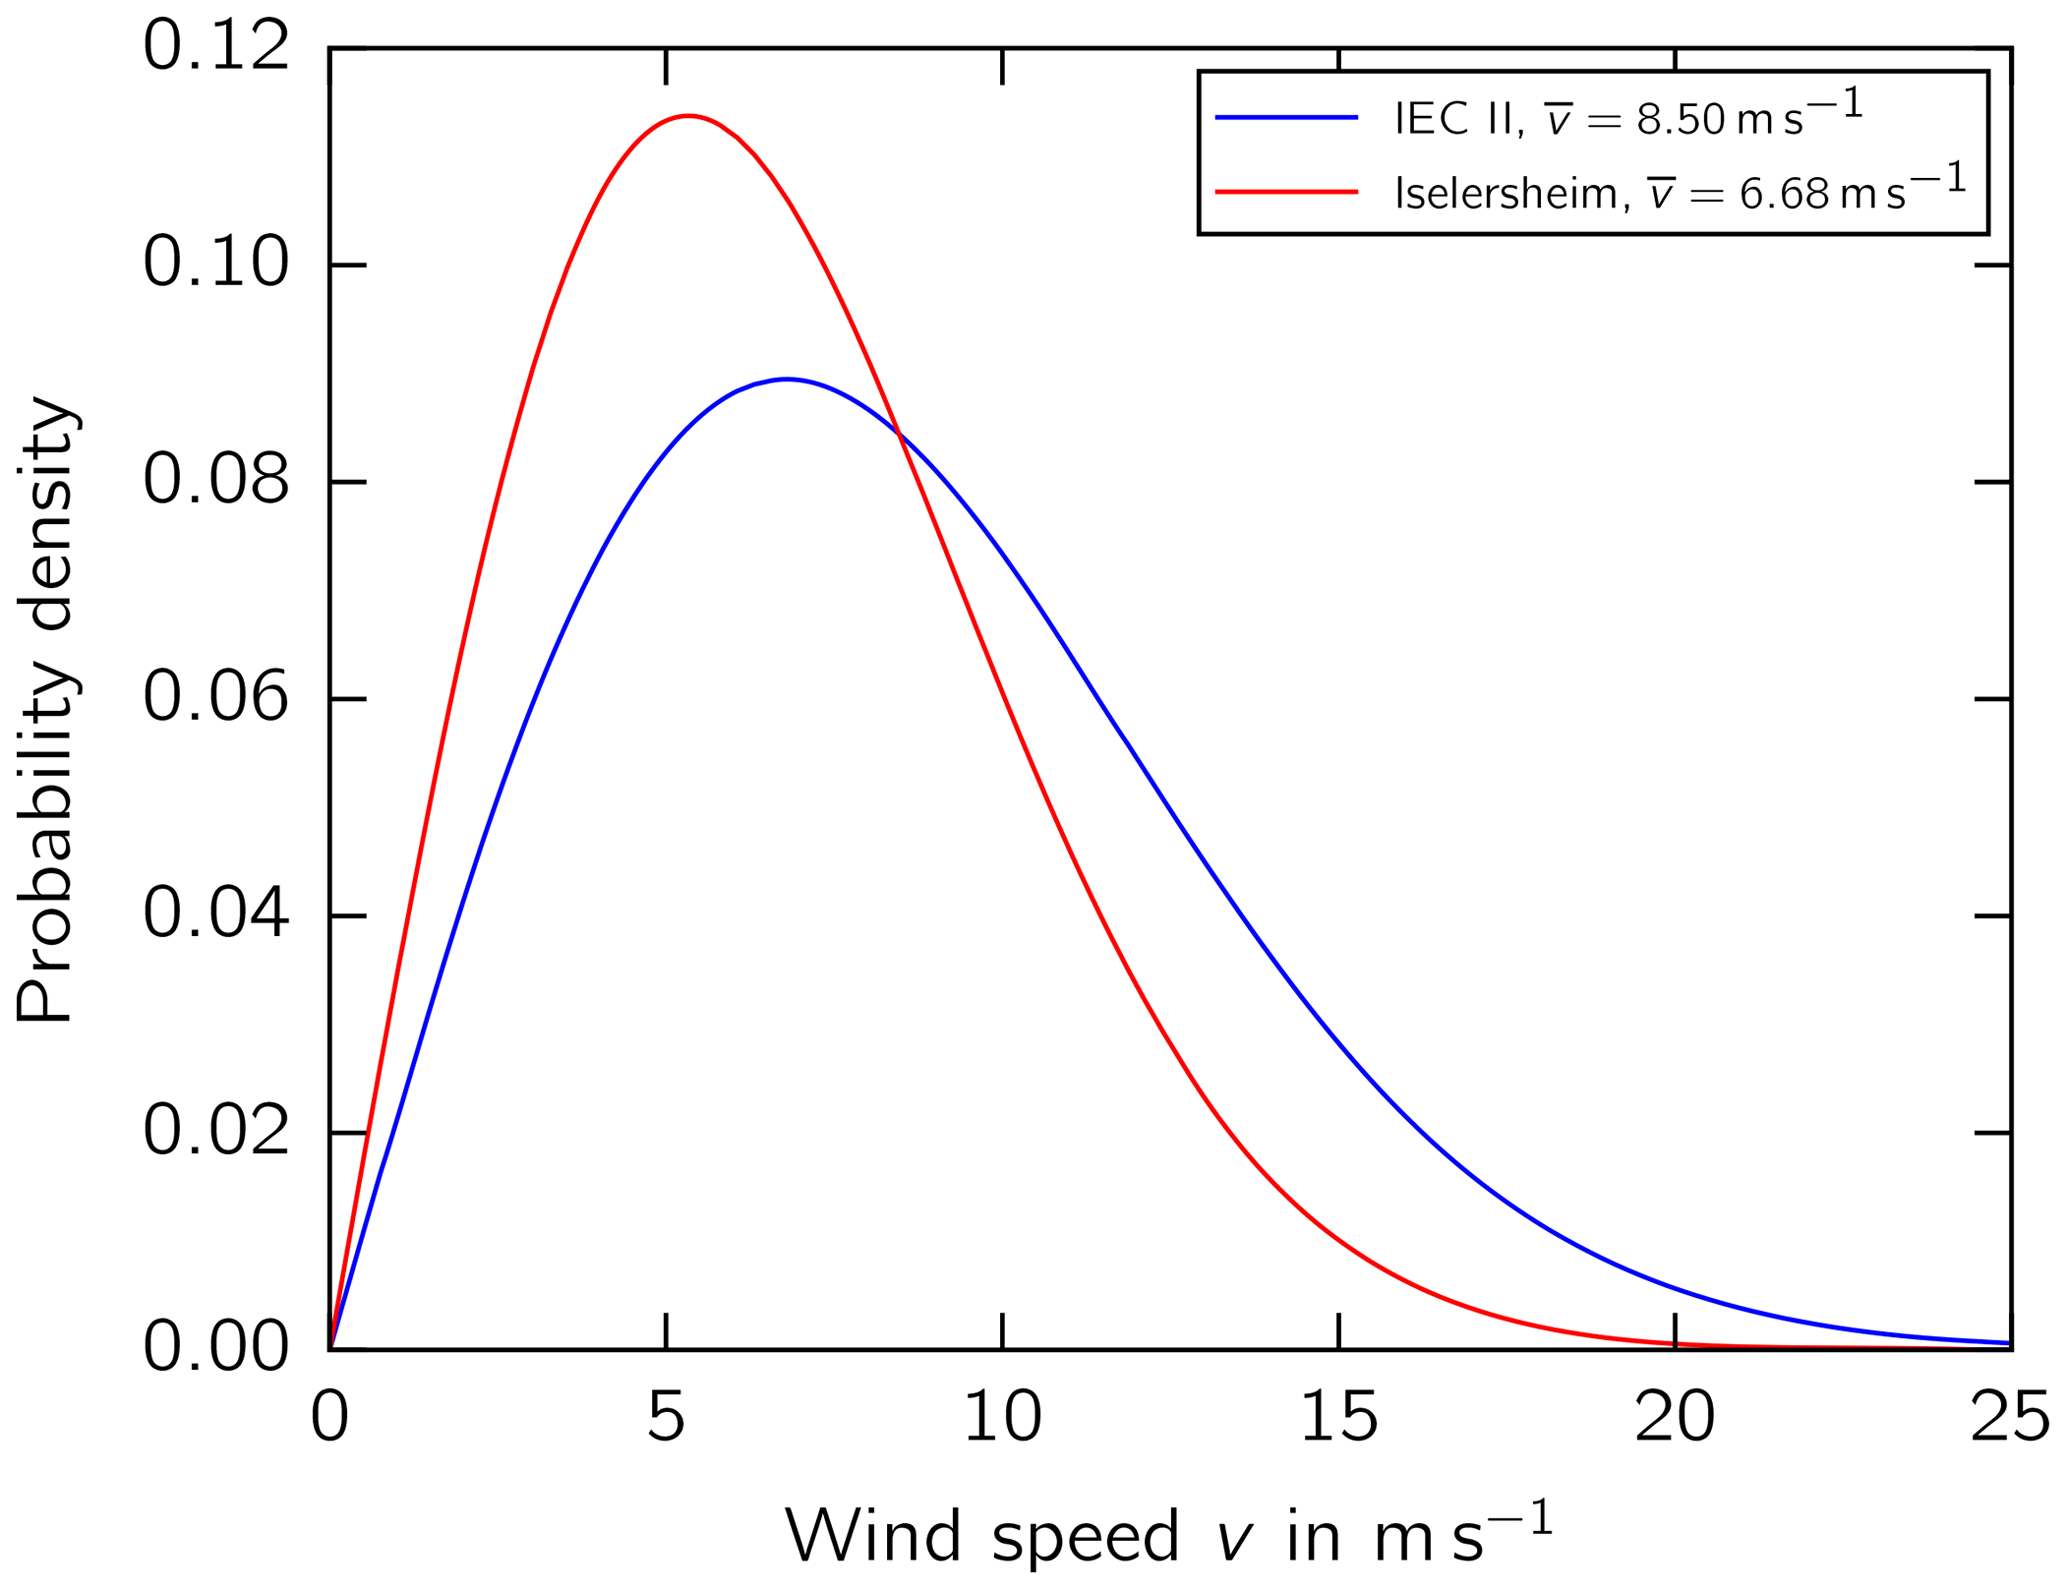
where s−1 and the optimum tip–speed ratio λopt is a function of the pitch angle θ. The wind speed probability density distribution is defined as a Rayleigh distribution (Gasch and Twele, 2011):
where is the average wind speed at hub height. The lead–lag revolutions and thus the cycles n are now determined by calculating the integral of the product of the probability density (Eq. 2) and the frequency as a function of the wind speed (Eq. 1):
In a next step the load cycles can be binned for a discretization of every Δv to categorize the cycles according to wind speeds:
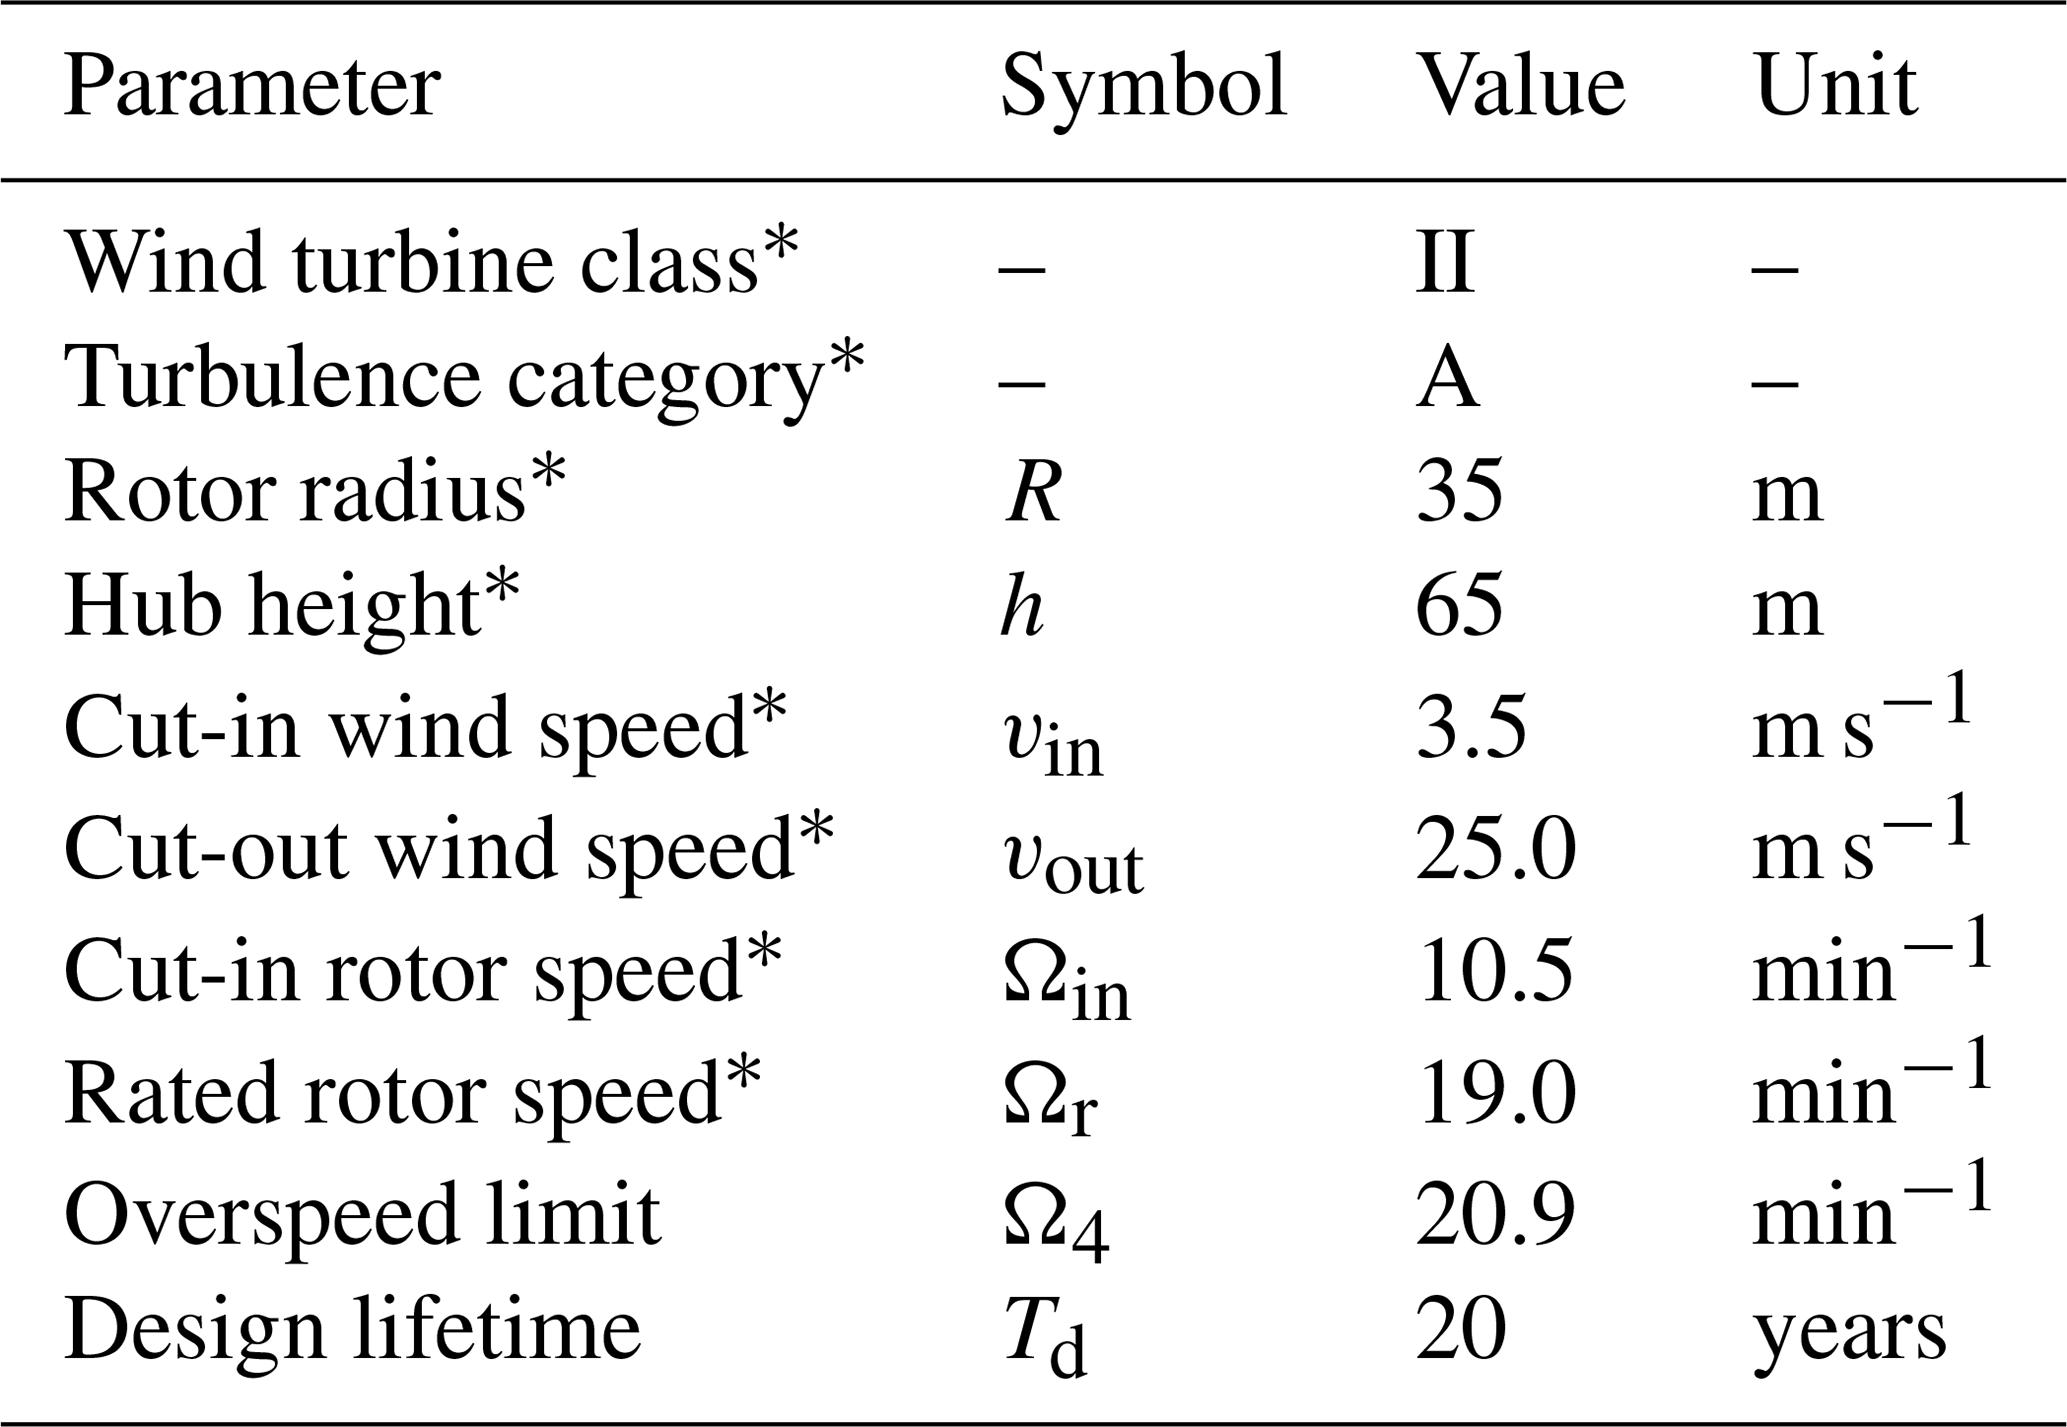
The lead–lag revolutions of the SSP34 during its lifetime were estimated for the site conditions at Bremervörde-Iselersheim (Fig. 3). Cut-in vin and cut-out wind speed vout, minimum nmin and maximum rotational speed nmax, hub height h, radius R, and wind turbine class were obtained from a wind farm offer for sale (Becker, 2015). The design lifetime was assumed to be 20 years. A summary of turbine parameters is presented in Table 1.
The simplified load calculation was performed to calculate the loads on the trailing-edge bond line. In the simplified load calculation, static mean flapwise aerodynamic loads for 12 wind speed bins were superposed with the alternating lead–lag gravity loads due to the rotor revolution. The blade pitch angle was taken into account in the calculations.
A beam model implemented in APDL (Ansys Parametric Design Language; Swanson, 2014) was assembled with a fully populated cross-section stiffness matrix determined by the BEam Cross section Analysis Software (BECAS; Blasques and Stolpe, 2012). The blade parametrization and input generation were conducted using workflows from the FUSED-Wind framework (Zahle et al., 2015). The BEM-based aerodynamic rotor simulator CCBlade (Ning, 2014) was used and populated with airfoil polars determined by RFOIL, an extension of XFOIL (Drela, 1989) including rotational effects (Bosschers, 1996).
At operating wind speeds in the partial load regime of the turbine, a pitch angle working point of was assumed. At wind speeds close to and above vr, however, the blade was pitched along its lengthwise axis toward the feather position.
3.2 Aeroelastic load simulation
The use case turbine was modeled in the multibody dynamics simulation software MSC ADAMS (Automated Dynamic Analysis of Mechanical Systems; Orleanda, 2013). The models of the tower and the rotor blades were created using a finite element (FE) preprocessor.
For the rotor blades, the distribution of mass and bending and torsional stiffness along the blade span was considered using the shear center, center of gravity, and elastic center for each cross section. From the detailed FE model, modal bodies for use in ADAMS were derived using constraint and fixed boundary modes in conjunction with the Craig–Bampton method (Craig and Bampton, 1968). A total of 24 modes, including rigid body modes, were included as degrees of freedom in the ADAMS blade models. AeroDyn (Moriarty and Hansen, 2005) calculated the aerodynamic loads taking the aeroelastic coupling with the modal bodies into account. TurbSim (Jonkman, 2009) generated the turbulent wind field.
For the tower structure, a stiff-stiff tower design was modeled. The first eigenfrequency of the tower was tuned to 0.38 Hz, corresponding to 1.2 times the rated rotor speed Ωr. For the pitch and generator torque controls, generic PI controllers were used. The maximum pitch speed was set to 7∘ s−1. A second-order lag element with a corner frequency of 1.2 Hz and a damping ratio of δ=0.8 was used to model the pitch actuator. The generator torque controller was set to run the turbine at the optimum tip–speed ratio in partial power production.
As the load case for the fatigue limit state, DLC 1.2 according to IEC 61400-1 (IEC, 2010) was considered. The load simulations were conducted for the design and the site conditions. The two simulations used the same random seeds in the wind field generation in order to provide comparability between the load sets. In the extrapolation of the fatigue loads to the turbine lifetime, the probabilities for wind speeds lower than vin were added to the lowest-wind-speed bin and the probabilities for wind speeds higher than vout were added to the highest-wind-speed bin. The availability of the turbine was assumed to be 100 %.
3.3 Fatigue budget analysis
The fatigue budget of relevant turbine components was evaluated at the different wind sites on the one hand and for different RBE lengths on the other. Hence, a stress-based damage analysis was conducted for the rotor blade structure and a damage-equivalent-load-based analysis for the other turbine components.
3.3.1 Blade structure
An Euler–Bernoulli (Euler, 1744) beam model of the blade was used to determine the longitudinal stress due to external loading of the critical component, i.e., the adhesive material along the trailing-edge bond line. Superscript m indicates the mean, and superscript a indicates the amplitude.
On the basis of the formulation by Puck (1996), the internal loading of a material is expressed in terms of stress exposure e, also referred to as effort. The effort is defined as the ambient stress σ over the permissible stress (fracture resistance), which is here the tensile strength Rt:
The individual materials of a rotor blade, i.e., adhesive, resin, and glass fiber, can be considered to be isotropic.
Assuming that a symmetric constant life diagram (Sutherland, 1999) is applicable for an isotropic material (Krimmer et al., 2016), the permissible cycle number to failure Ni for a given load collective i, with a mean stress exposure and a stress exposure amplitude , is derived from
This means that the cycle number is directly related to the mean stress exposure, the stress exposure amplitude, and the material-dependent negative inverse S–N curve exponent m.
Assuming that the damage accumulation according to Palmgren (1924) and Miner (1945) can be applied, the accumulated damage of i effective load collective increments is calculated as
where ni represents the actual load cycle number of a load collective increment. The fatigue stress exposure is then defined as
The fatigue budget or remaining lifetime is defined as
where Td denotes the design life of the turbine.
The method of load and resistance factor design (ISO, 1998) was applied for the fatigue analysis of the blade. To this end, the characteristic strength Rt was divided by the partial material reduction factor for the ultimate limit state and for the fatigue limit state according to DNV GL AS (2015). Besides the base factor of γm0=1.2, the reduction factor contains partial reduction factors which take into consideration the criticality of the failure mode (γmc=1.08) and the effect of the long-term degradation of the epoxy (, ), as well as the accuracy of the analysis methods (γm4=1.2). Temperature effects (γm2) were neglected since the blade operation under extreme conditions was not considered.
The blade material properties for this study were obtained experimentally and have been presented by Rosemeier et al. (2019). The adhesive material in the trailing-edge bond line was attributed with a Young's modulus of 3.42 GPa, a characteristic strength of Rt=37.48 MP, and a negative inverse S–N curve exponent of m=11.66. Moreover, a constant thermal residual stress exposure of (Rosemeier et al., 2020) was added to the mean stress exposure em.
Furthermore, for the static load simulation case, a load factor of γf=1.25 was multiplied with the stress exposure amplitude to take into account the inaccuracy of the load simulation. For the aeroelastic load simulation case, the load factor was γf=1.0.
For the integrity analysis according to DNV GL AS (2015), Eq. (6) can be written with load and reduction factors as
From the static load simulation, mean and amplitude loads were extracted at each wind speed bin. These load spectra were used to calculate stress spectra, the damage Eq. (7), and subsequently the fatigue stress exposure Eq. (8).
From the aeroelastic load simulation, time series of each blade cross section were extracted at each wind speed bin. Initially, the beam model was solved for unit load cases. Thereafter, the load time series were used to determine strain time series along the trailing edge. A rainflow-counting algorithm (Madsen et al., 1990) reduced the time series to range–mean matrices, which were used to calculate the damage Eq. (7) and subsequently the fatigue stress exposure Eq. (8).
3.3.2 Turbine components
The fatigue budget analysis of the relevant components, i.e., blade root, blade bolts, hub, shaft, main frame, tower top and bottom, and foundation, was conducted on the basis of a damage equivalent load amplitude (DEL) as proposed by DNV GL AS (2016) and Bundesverband WindEnergie (2017). The approach entails a comparison between the replication of loads assumed in the design of the turbine and the loads resulting from the actual site conditions without knowledge of the geometry of the components. It is assumed that the fatigue budget of all components is fully utilized under design conditions. Since the geometry of the components is unknown, it is further assumed that the relationship between fatigue stresses and DELs is linear.
The loads for the design and site situation were obtained with an aeroelastic simulation, as described above. After rainflow counting the moment histories, the DEL for each turbine component was obtained according to Hayman (2012) as
where denotes the moment amplitude of the ith load collective and Neq the number of equivalent cycles to failure. The Goodman correction for the mean moment influence was neglected in this study. Considering a relative comparison between the DEL under site conditions and under design conditions , the relative fatigue damage was obtained as follows:
See also Appendix A for the derivation of Eq. (12). The fatigue budget was then obtained with Eq. (9).

4.1 Loads
The results of the two simulation approaches, i.e., the static and the aeroelastic load simulation, were benchmarked with each other.
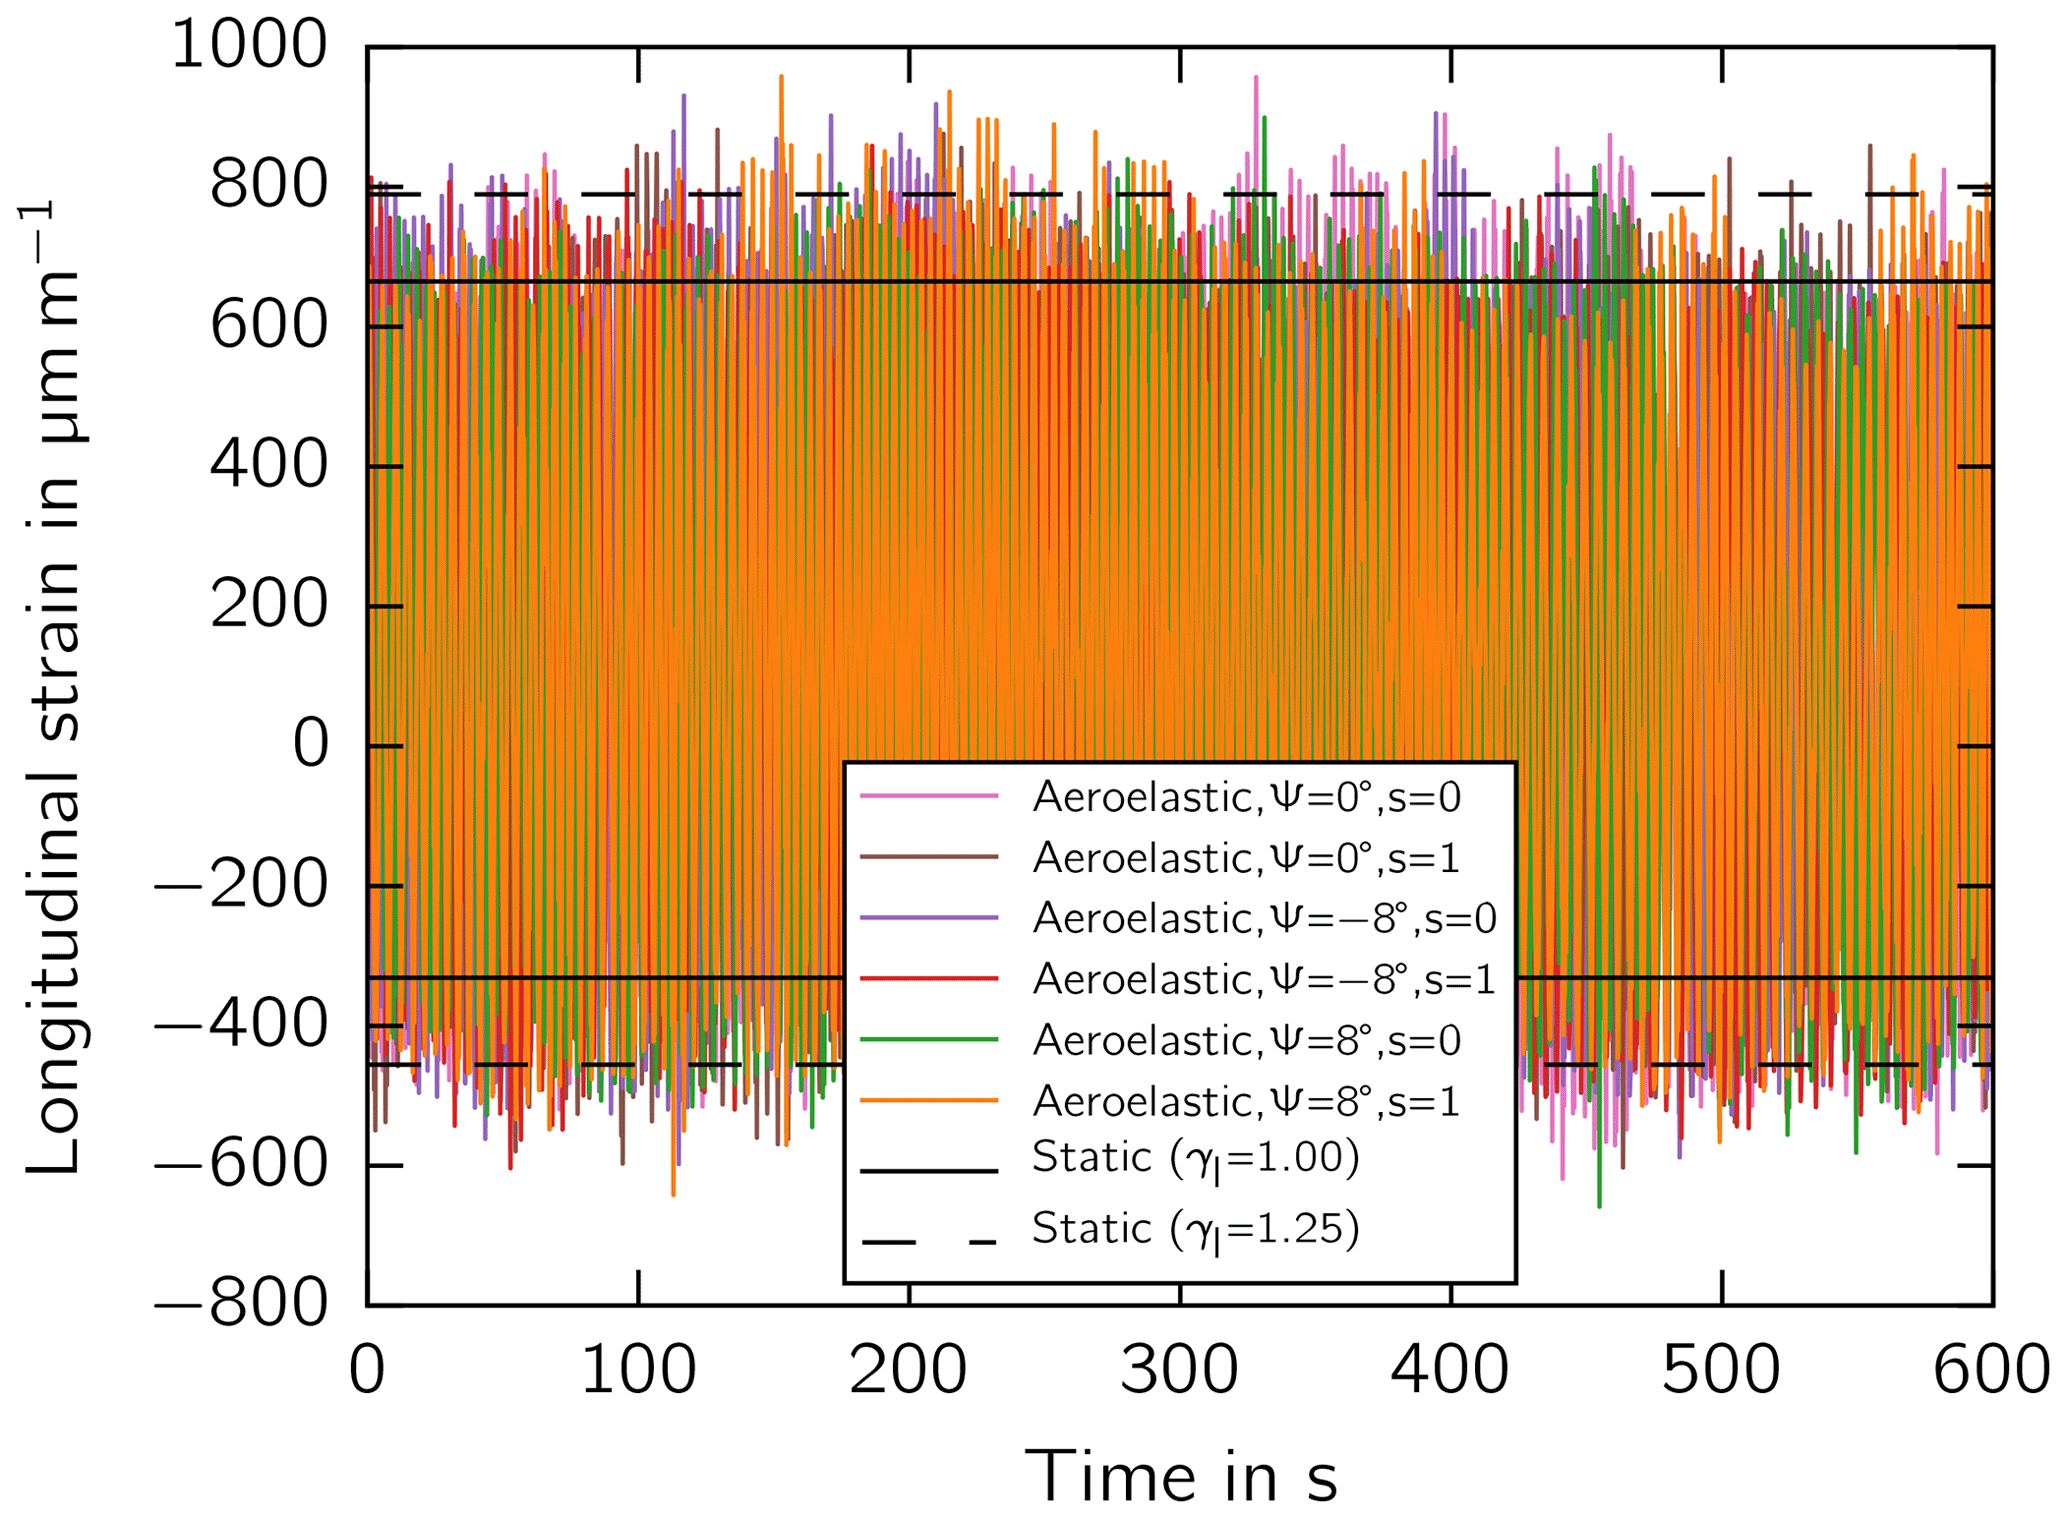
First, the bending moment history of the aeroelastic simulation was compared with the minimum and maximum moments of the static simulation. Figure 4 illustrates the moment history of the cross section close to maximum chord at z=10.2 m for the wind speed of v=9 m s−1 by way of example. The lead–lag moment Mlead−lag range is in good agreement over the whole operating range from cut-in to cut-out wind speed. The flapwise mean moment Mflap over time is in good agreement over the whole operating range as well. However, the fluctuating flapwise mean and amplitude moments were not captured by the static simulation.
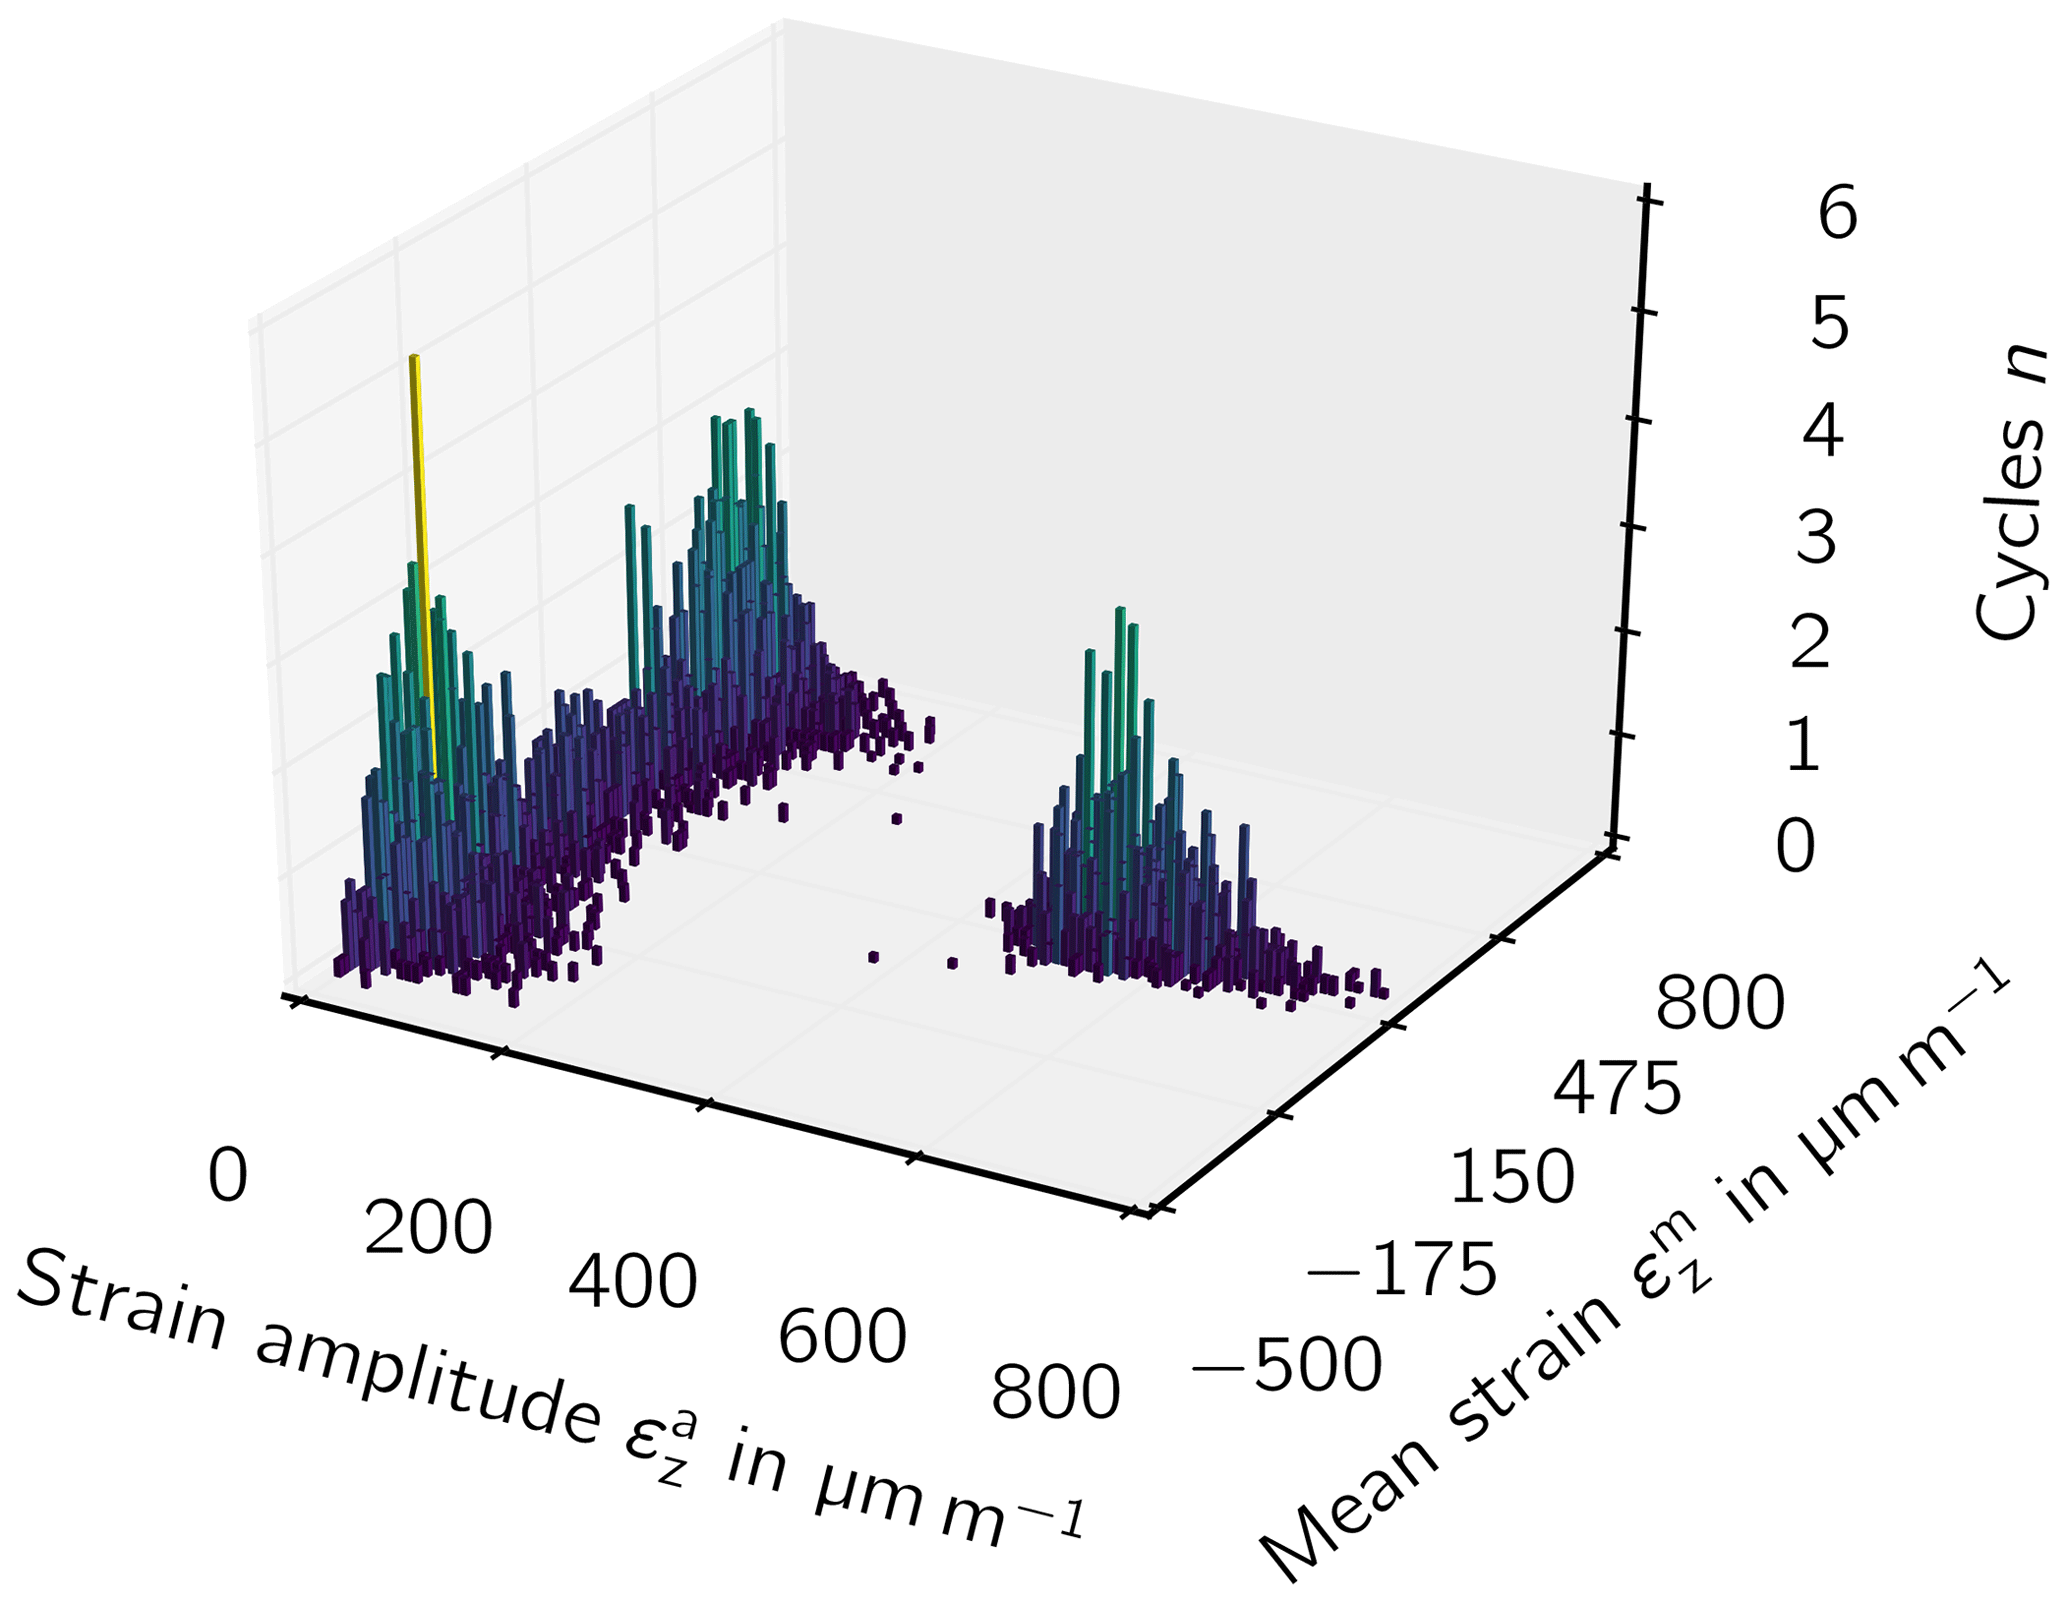
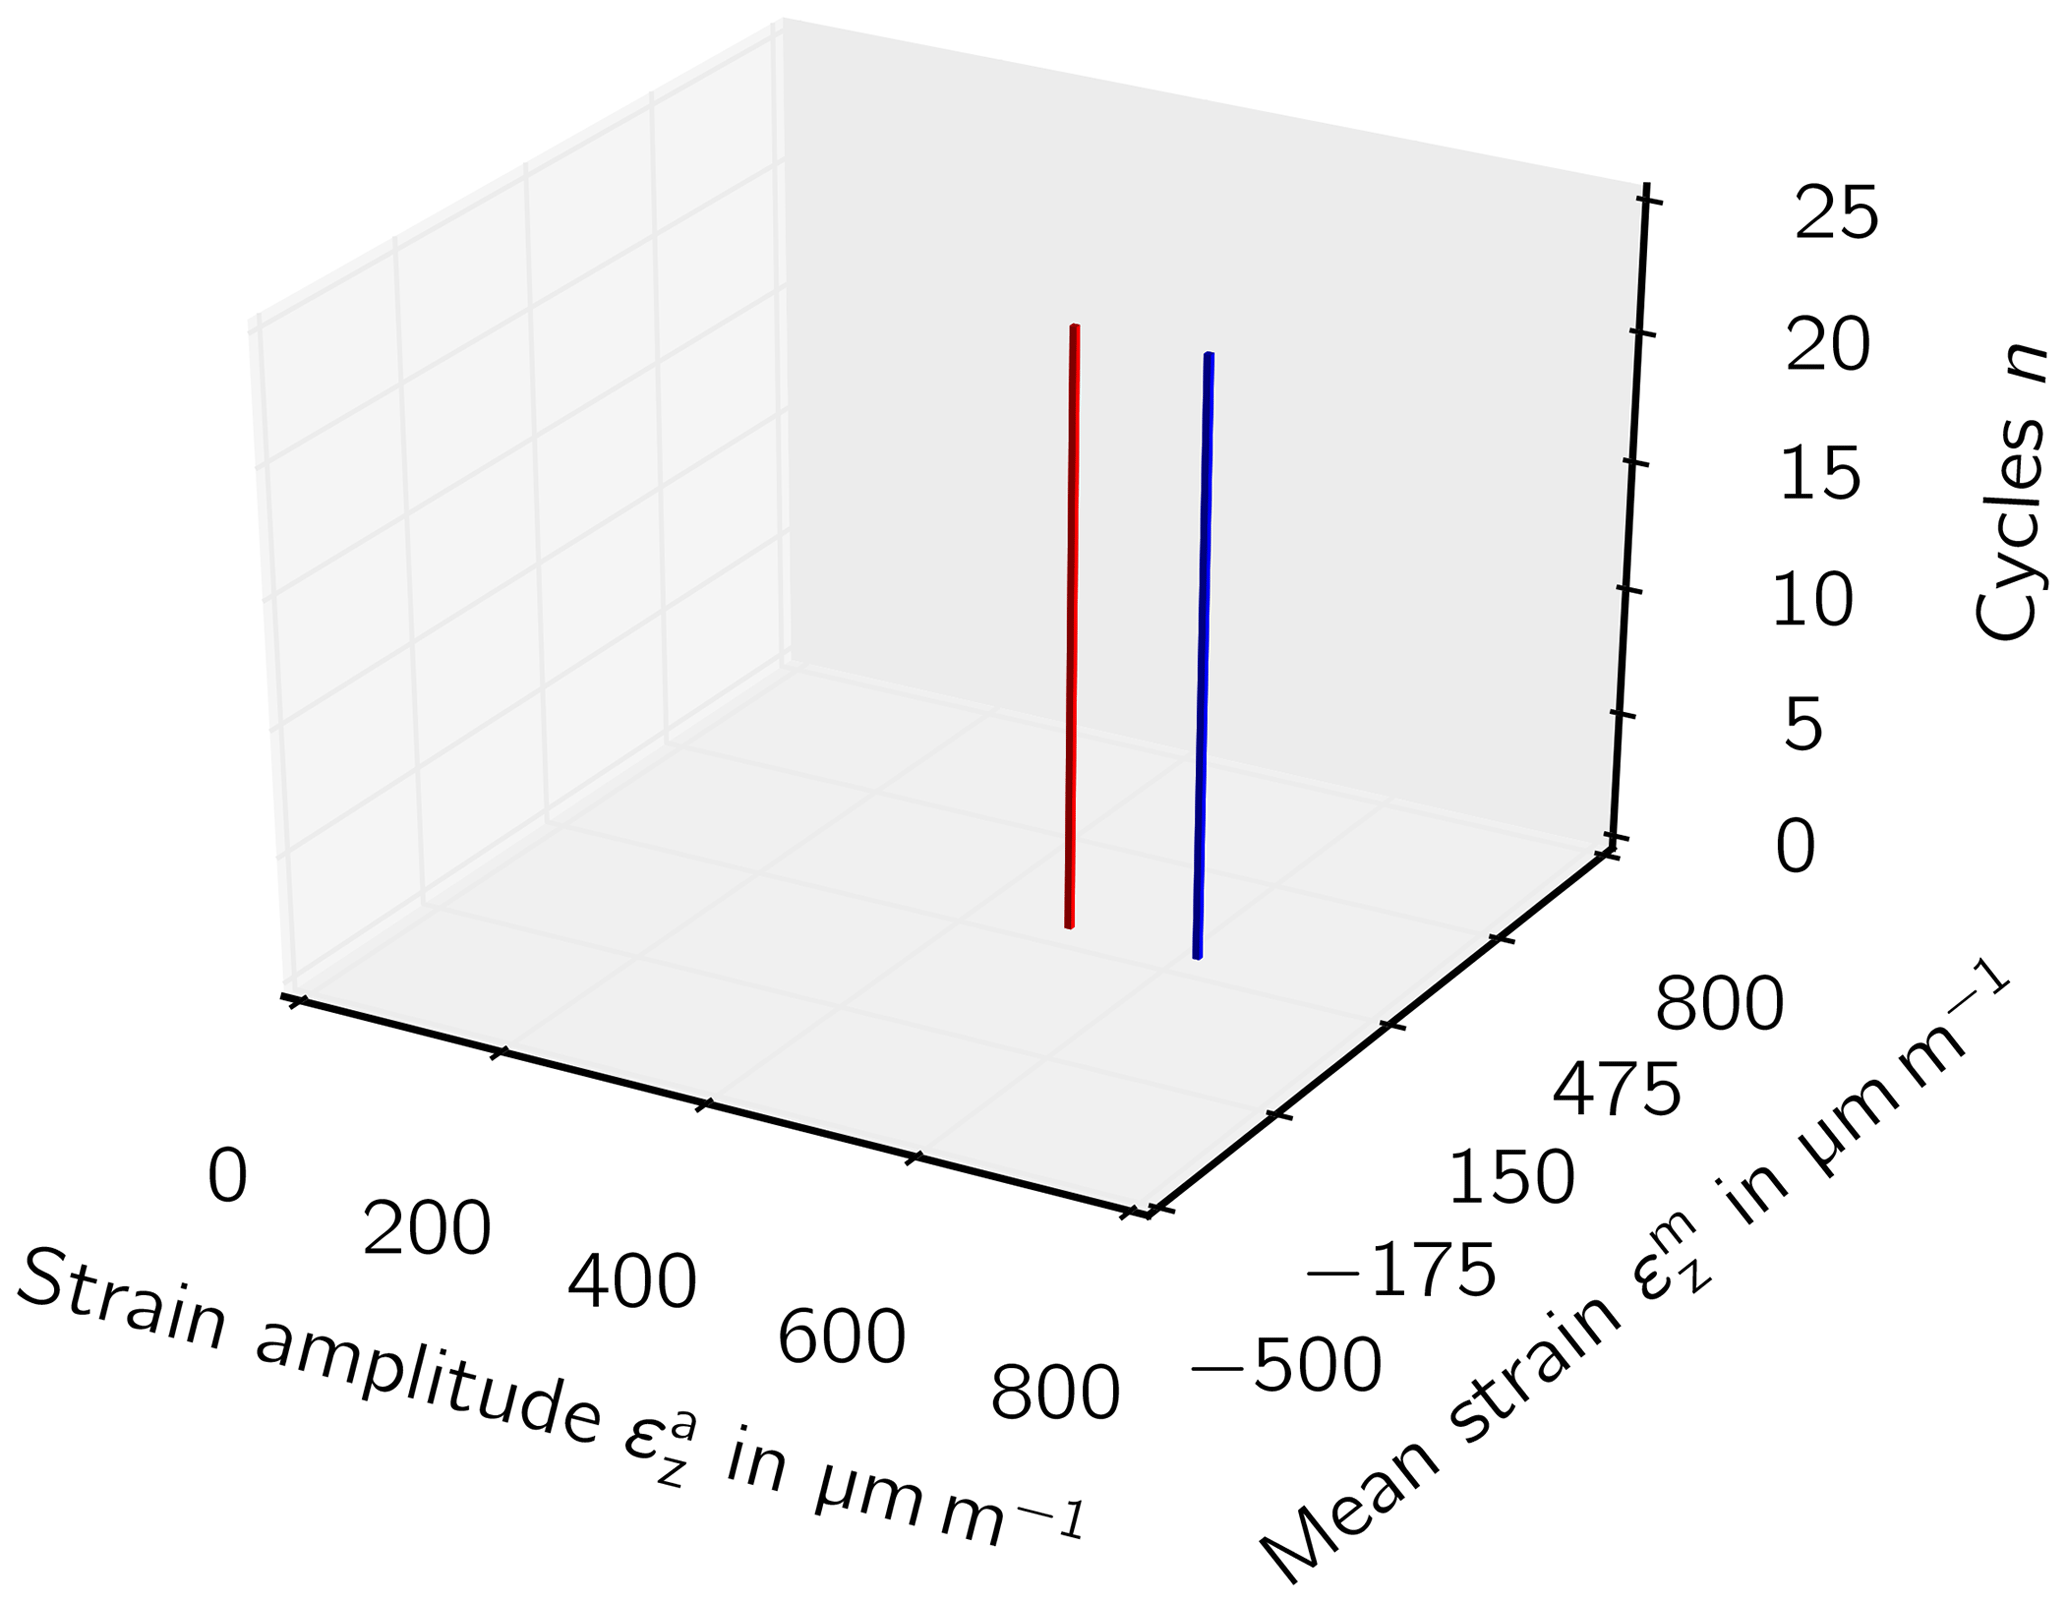
Figure 7Markov matrix of a 600 s static simulation at z=10.2 m and v=9 m s−1. The red bar stands for a load factor of γl=1.0 and the blue bar for γl=1.25.
Second, the strain history in the trailing edge is illustrated in Fig. 5. At the root (z=0 m), maximum chord (z=10.2 m), and outboards (z=20.4 m), the strain mean and amplitude are in good agreement in the partial load regime when an additional load factor γl=1.25 was introduced and multiplied with the strain amplitude (Eq. 10). In the full load regime above rated wind speed, however, the strain amplitude was not captured outboard by the static simulation, although the mean value was captured well.
Moreover, the rainflow-counted strain history of the aeroelastic and static simulation is presented as a Markov matrix in Figs. 6 and 7, respectively. The bar with the largest damage impact was observed in the two simulations (red bar for static simulation) at a mean strain of µm m−1 and a strain amplitude of µm m−1. Other bars with lower, and higher strain amplitudes in the aeroelastic simulation were covered by the blue bar in the static simulation, which includes the load factor of γl=1.25.
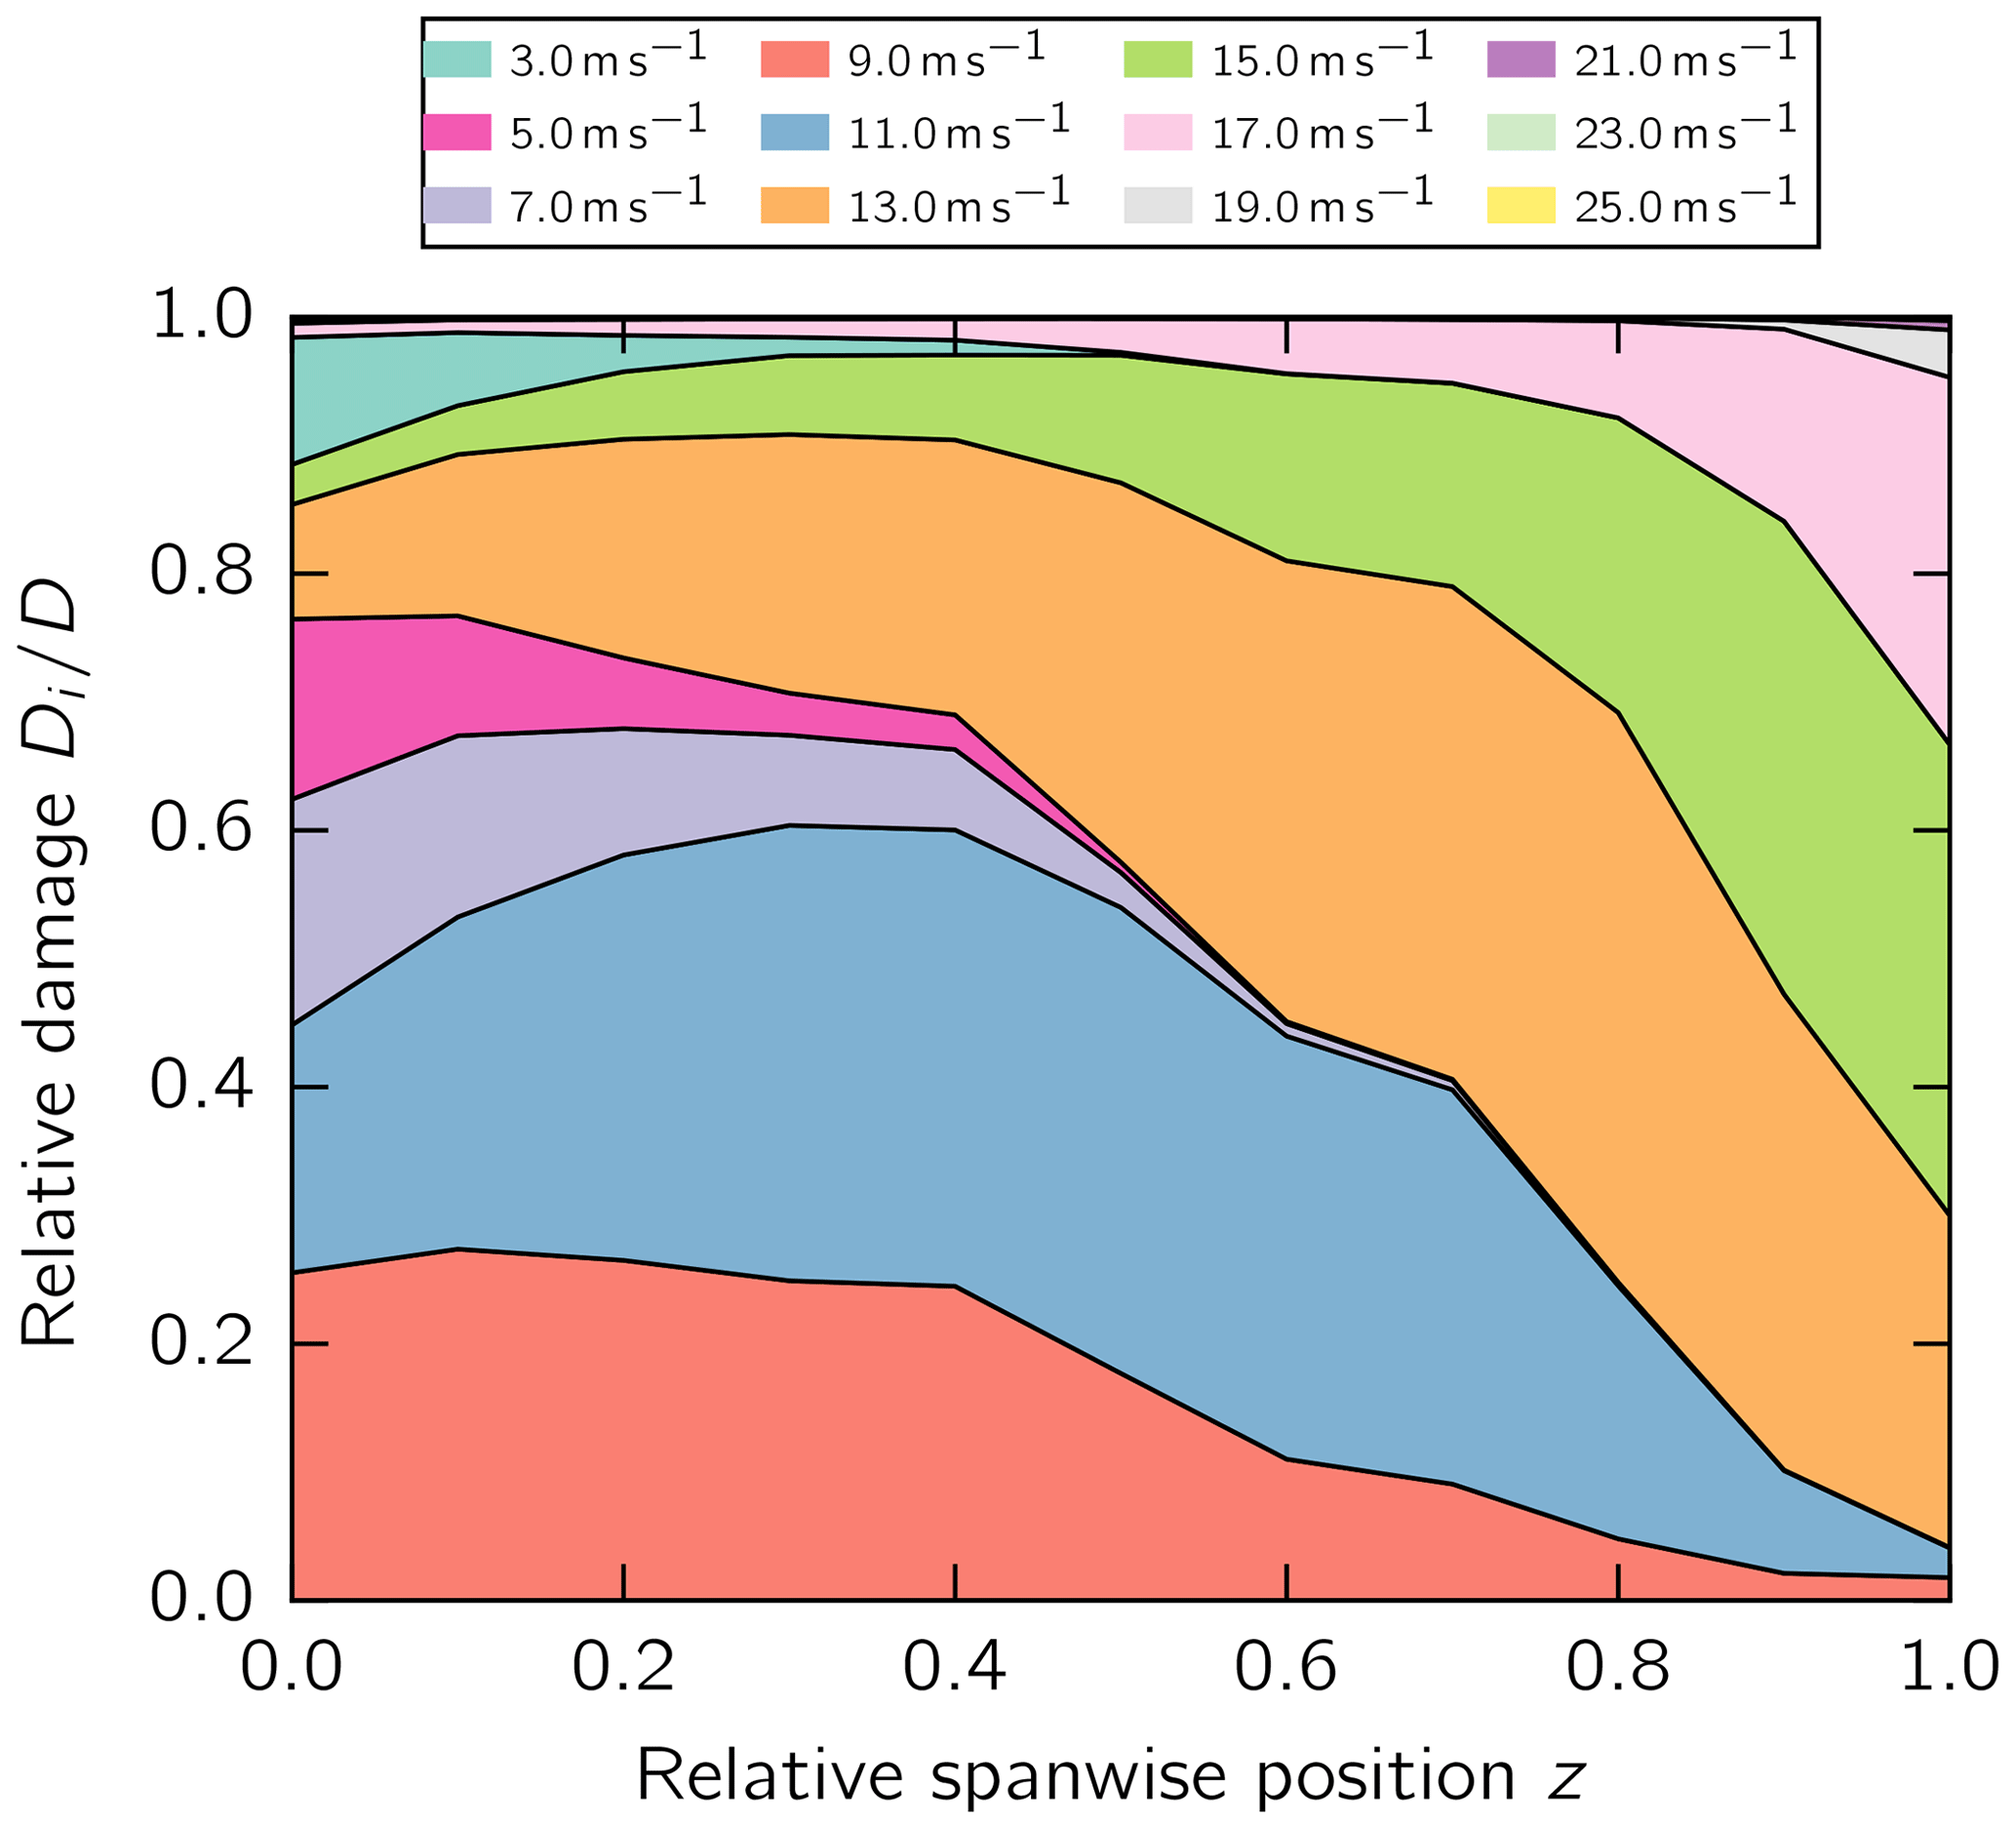
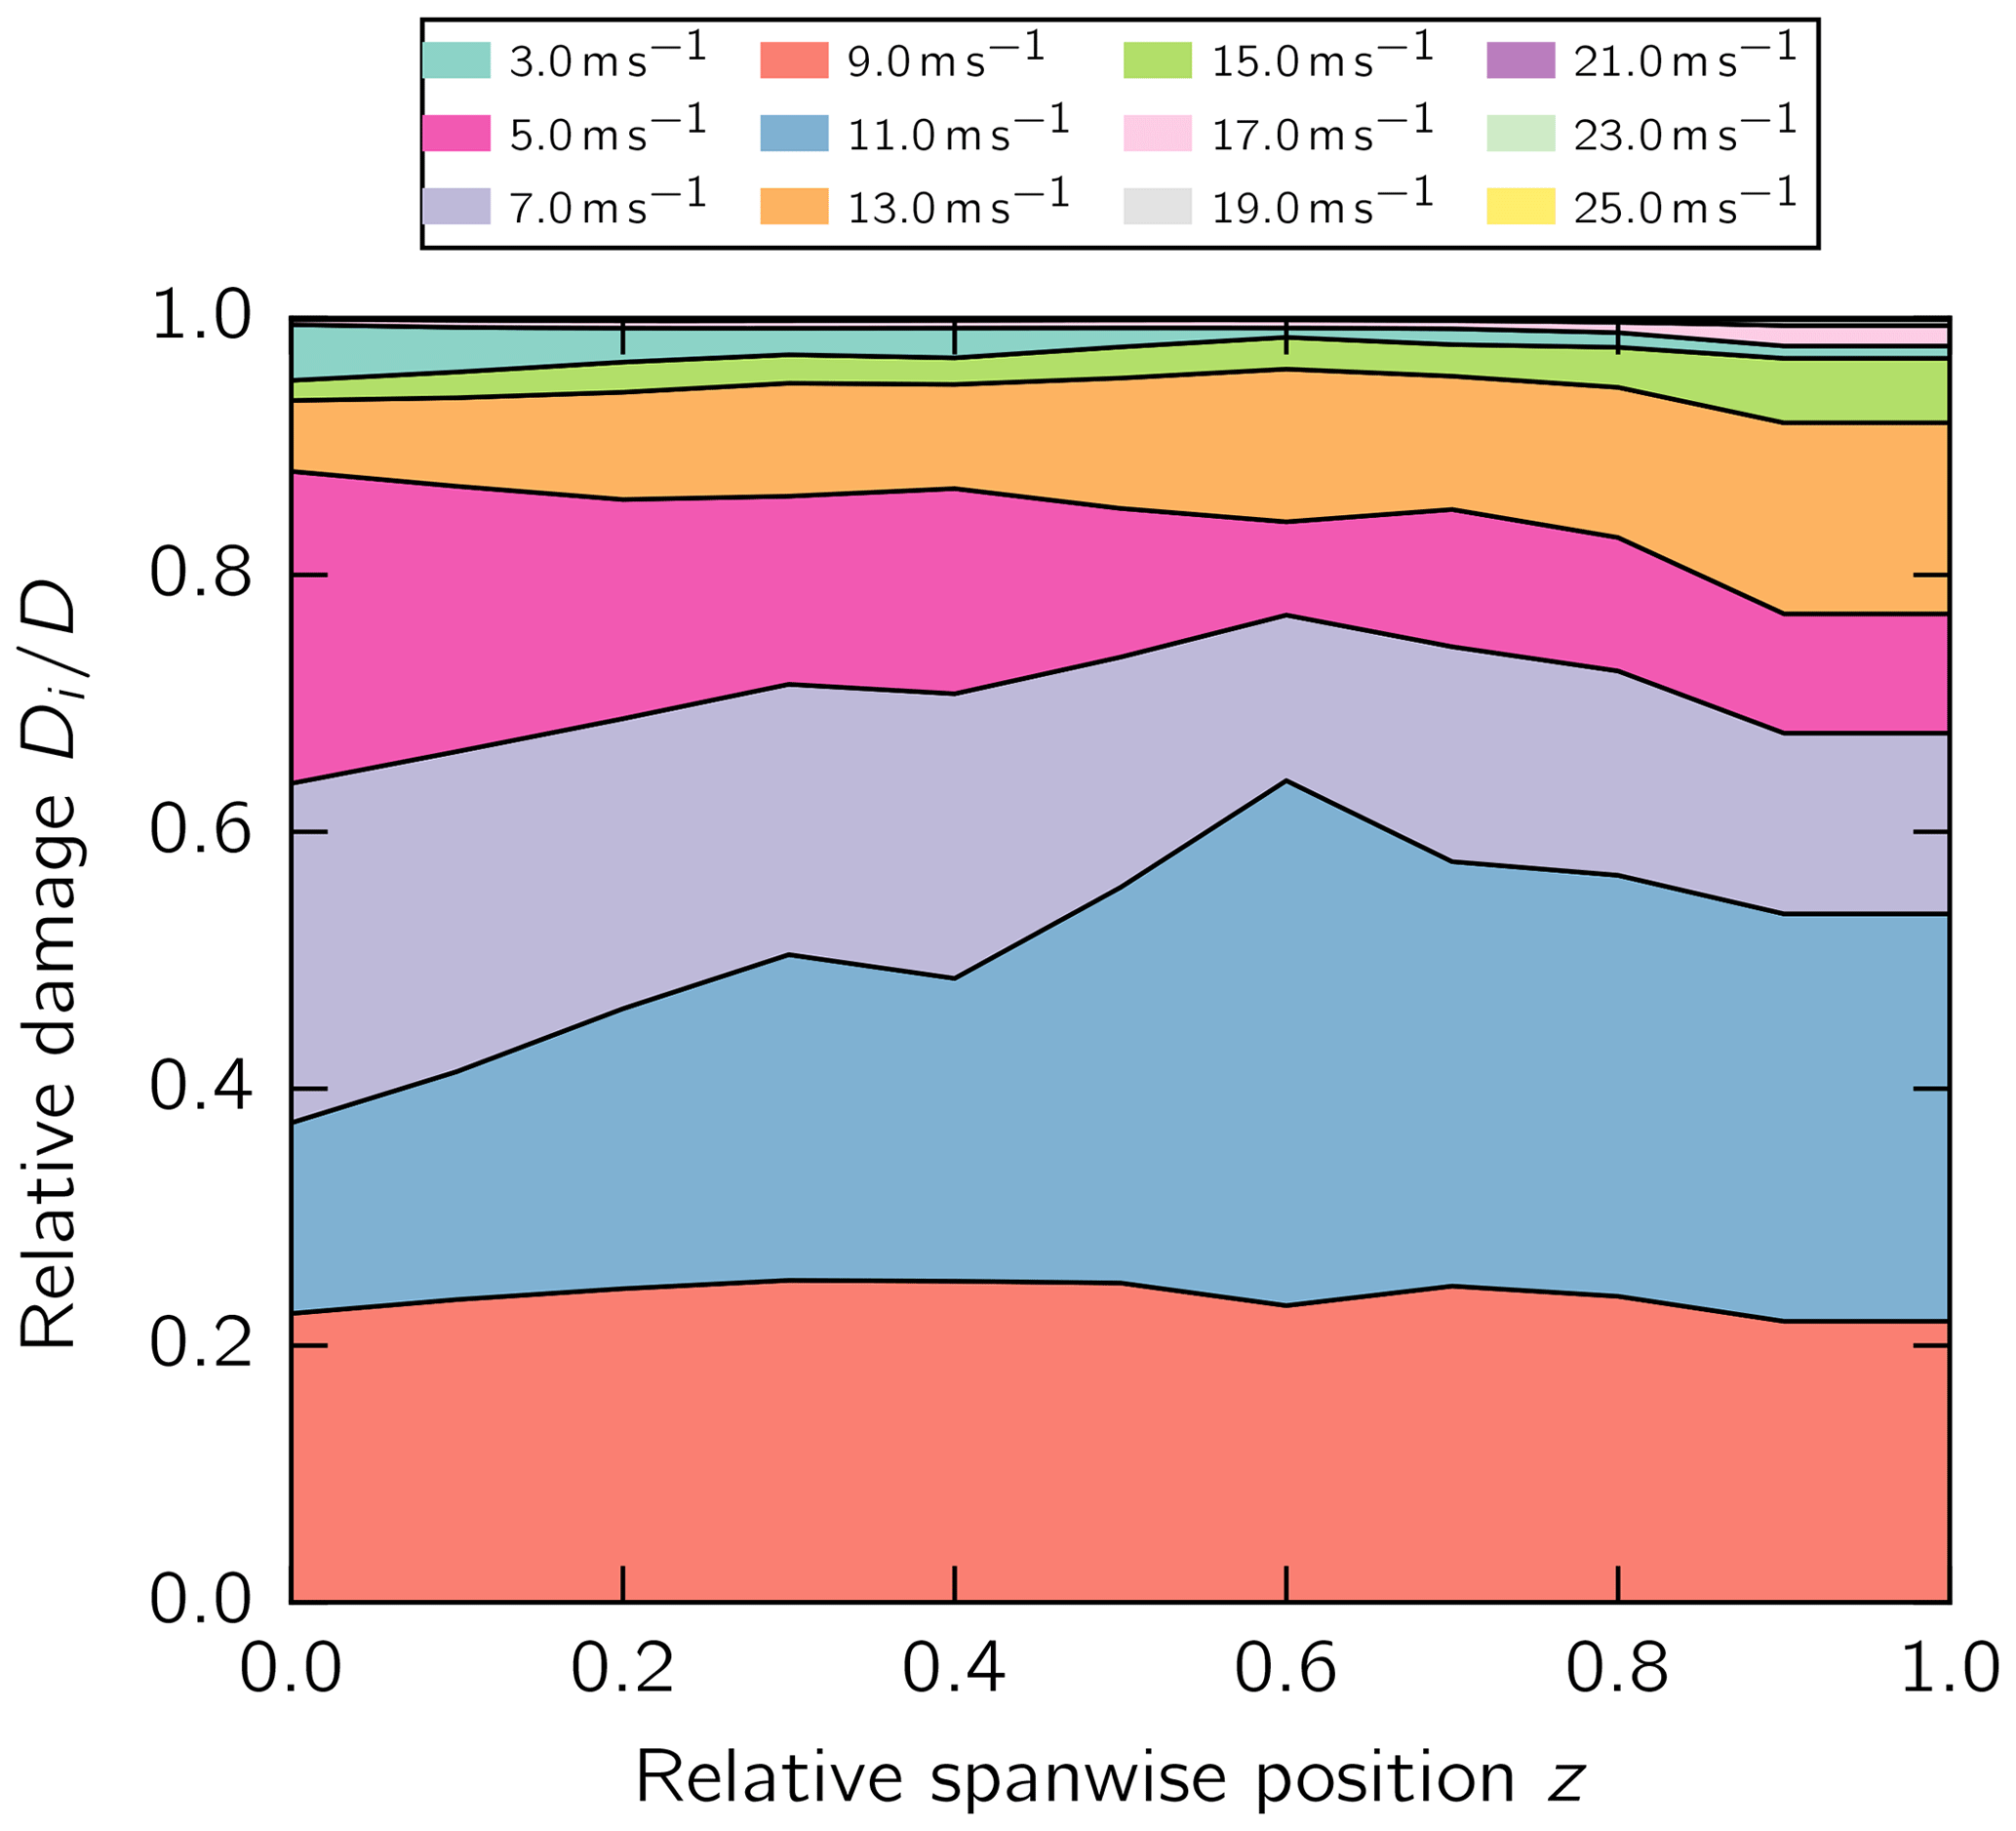
Third, the relative damage impact of each wind speed Di, which corresponds to one load collective, on the accumulated damage D in the adhesive layer along the blade span is presented for the aeroelastic and static simulation in Figs. 8 and 9, respectively. The relative damage of a load collective and the accumulated damage were calculated with Eq. (7). This graph indicates the most damaging turbine conditions for the adhesive layer. In the two simulation approaches, the wind speeds from 5 to 11 m s−1 make major contributions of similar proportions to the damage at the root. The fractions in the static simulation stay more or less constant along the blade length. In contrast, the fractions in the aeroelastic simulation shift toward the tip toward larger wind speeds, i.e., 13 to 17 m s−1.
Fourth, the stress exposure along the blade span is illustrated in Fig. 10. The trend of the two simulations is in good agreement. The maximum stress exposure was observed at maximum chord. The stress exposure of the static simulation captured the damage of the aeroelastic simulation up to z=13.6 m or 40 % of the blade span when the load factor γl=1.25 was used. Above 40 % of the blade span, the stress exposure yielded by the static simulation is far too optimistic.
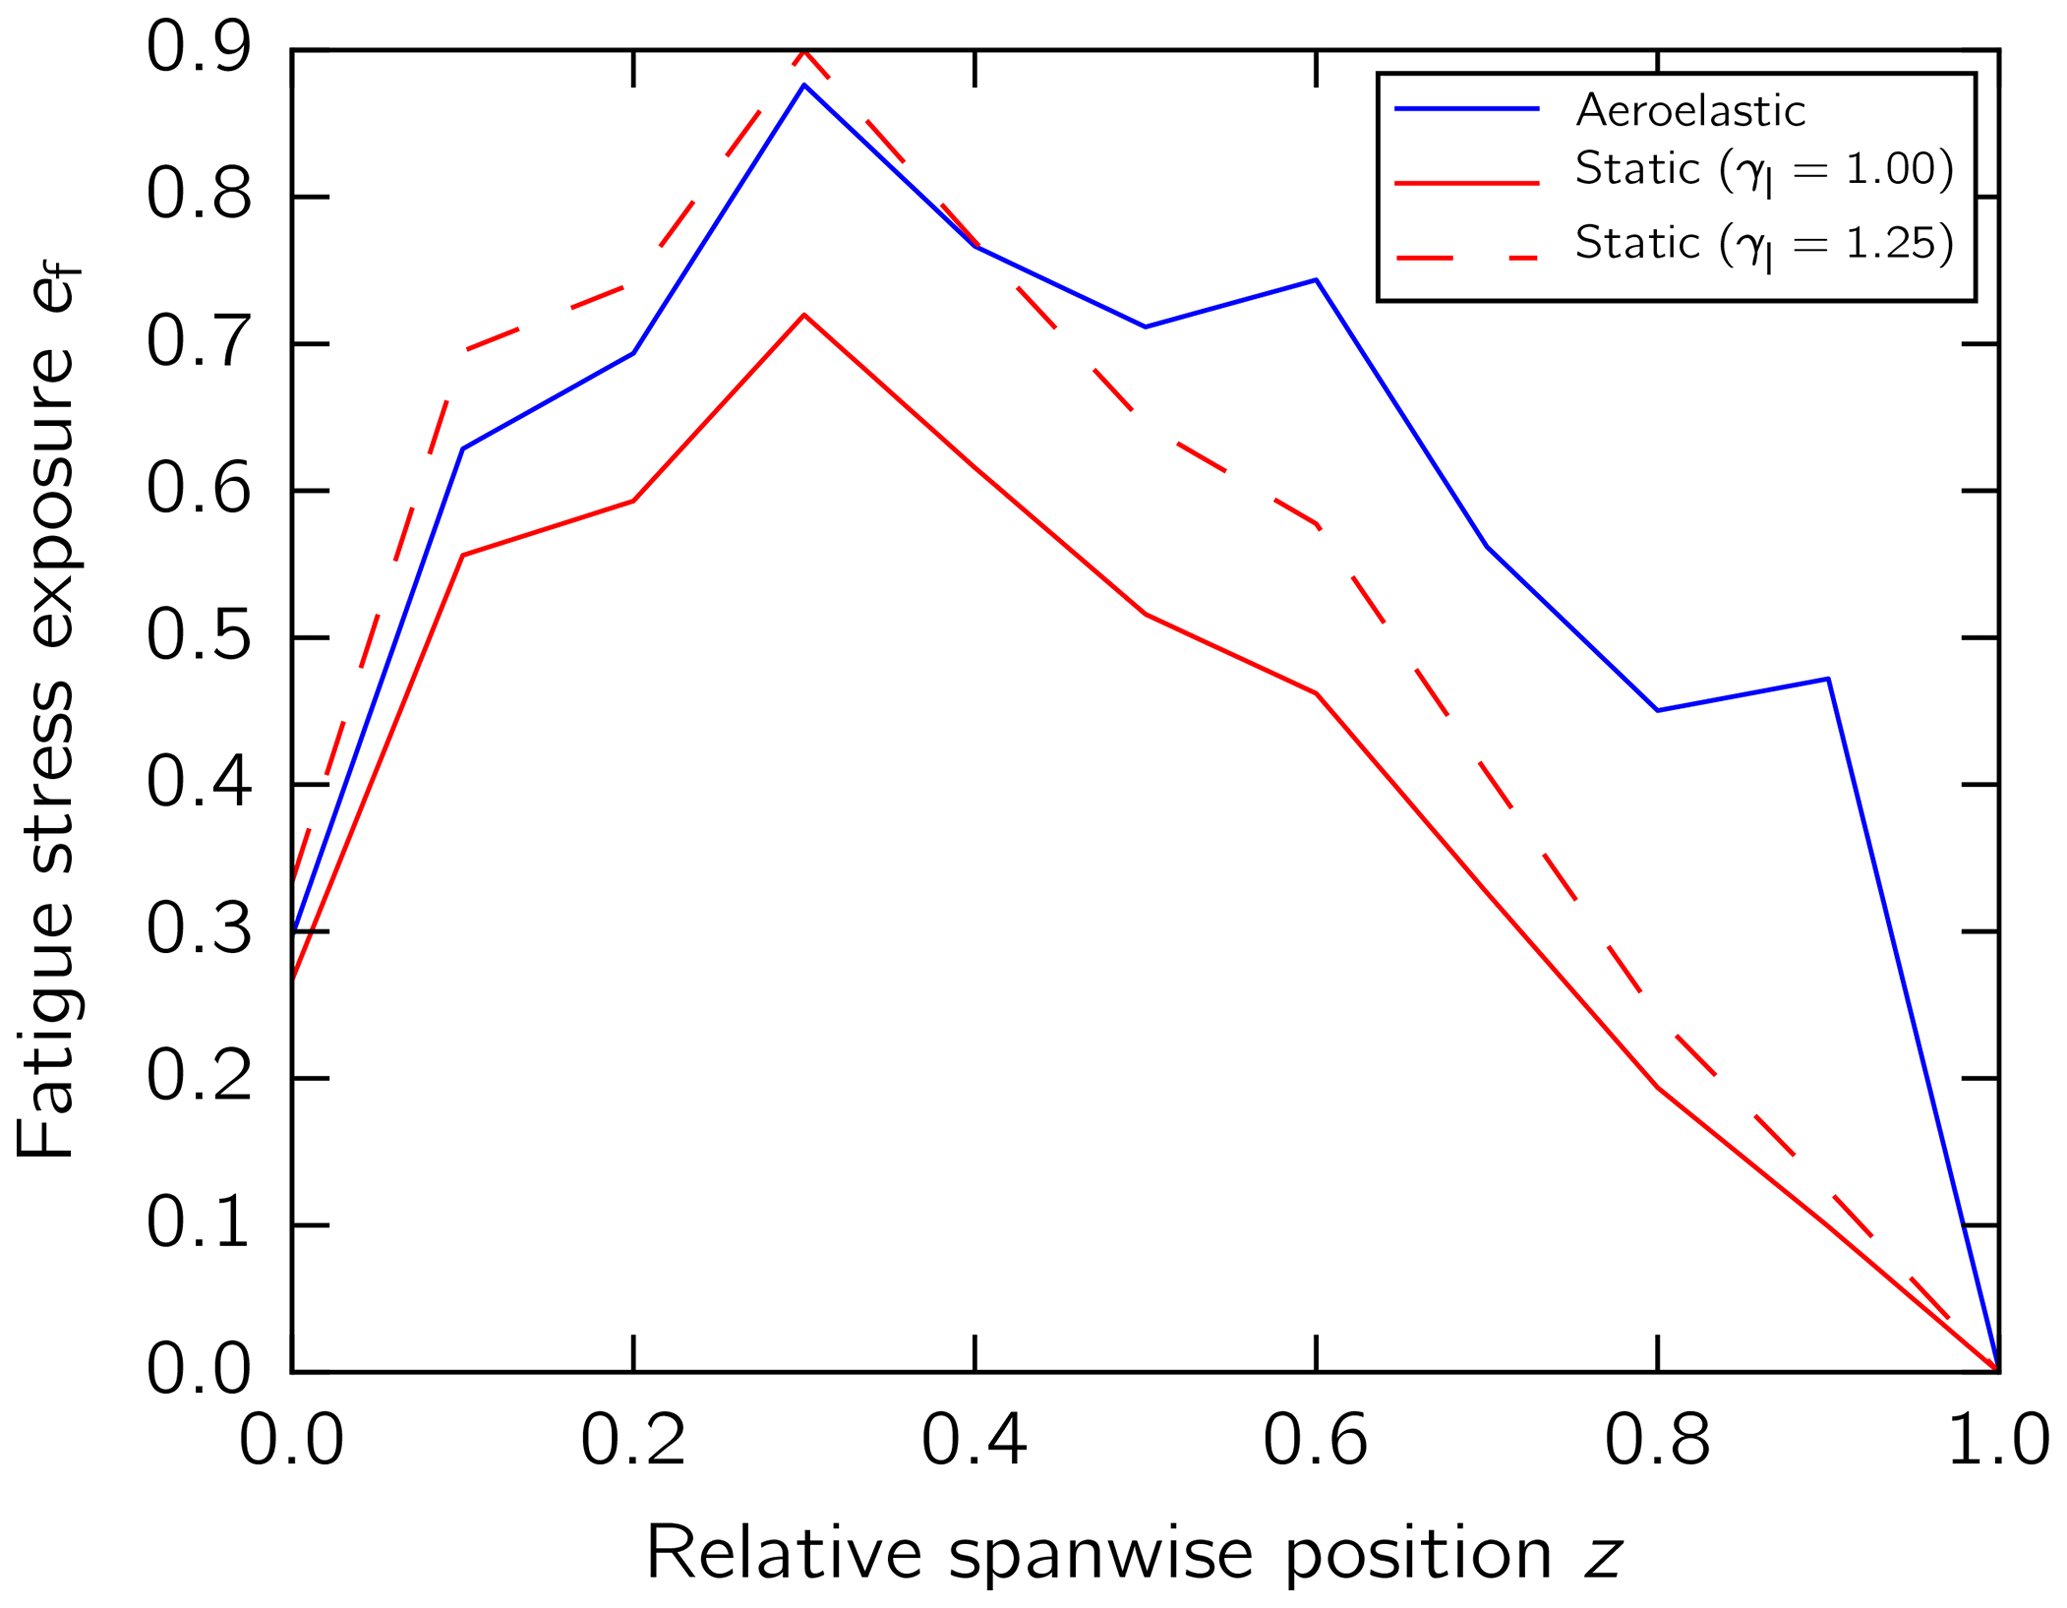
Figure 10Fatigue stress exposure along the trailing-edge bond line obtained with the two simulations.
4.2 Serviceability
When the RBE length is increased, the serviceability limit state of the turbine needs to be considered. The blade tip-to-tower clearance must remain large enough, and resonance as a result of changing eigenfrequencies must be avoided.
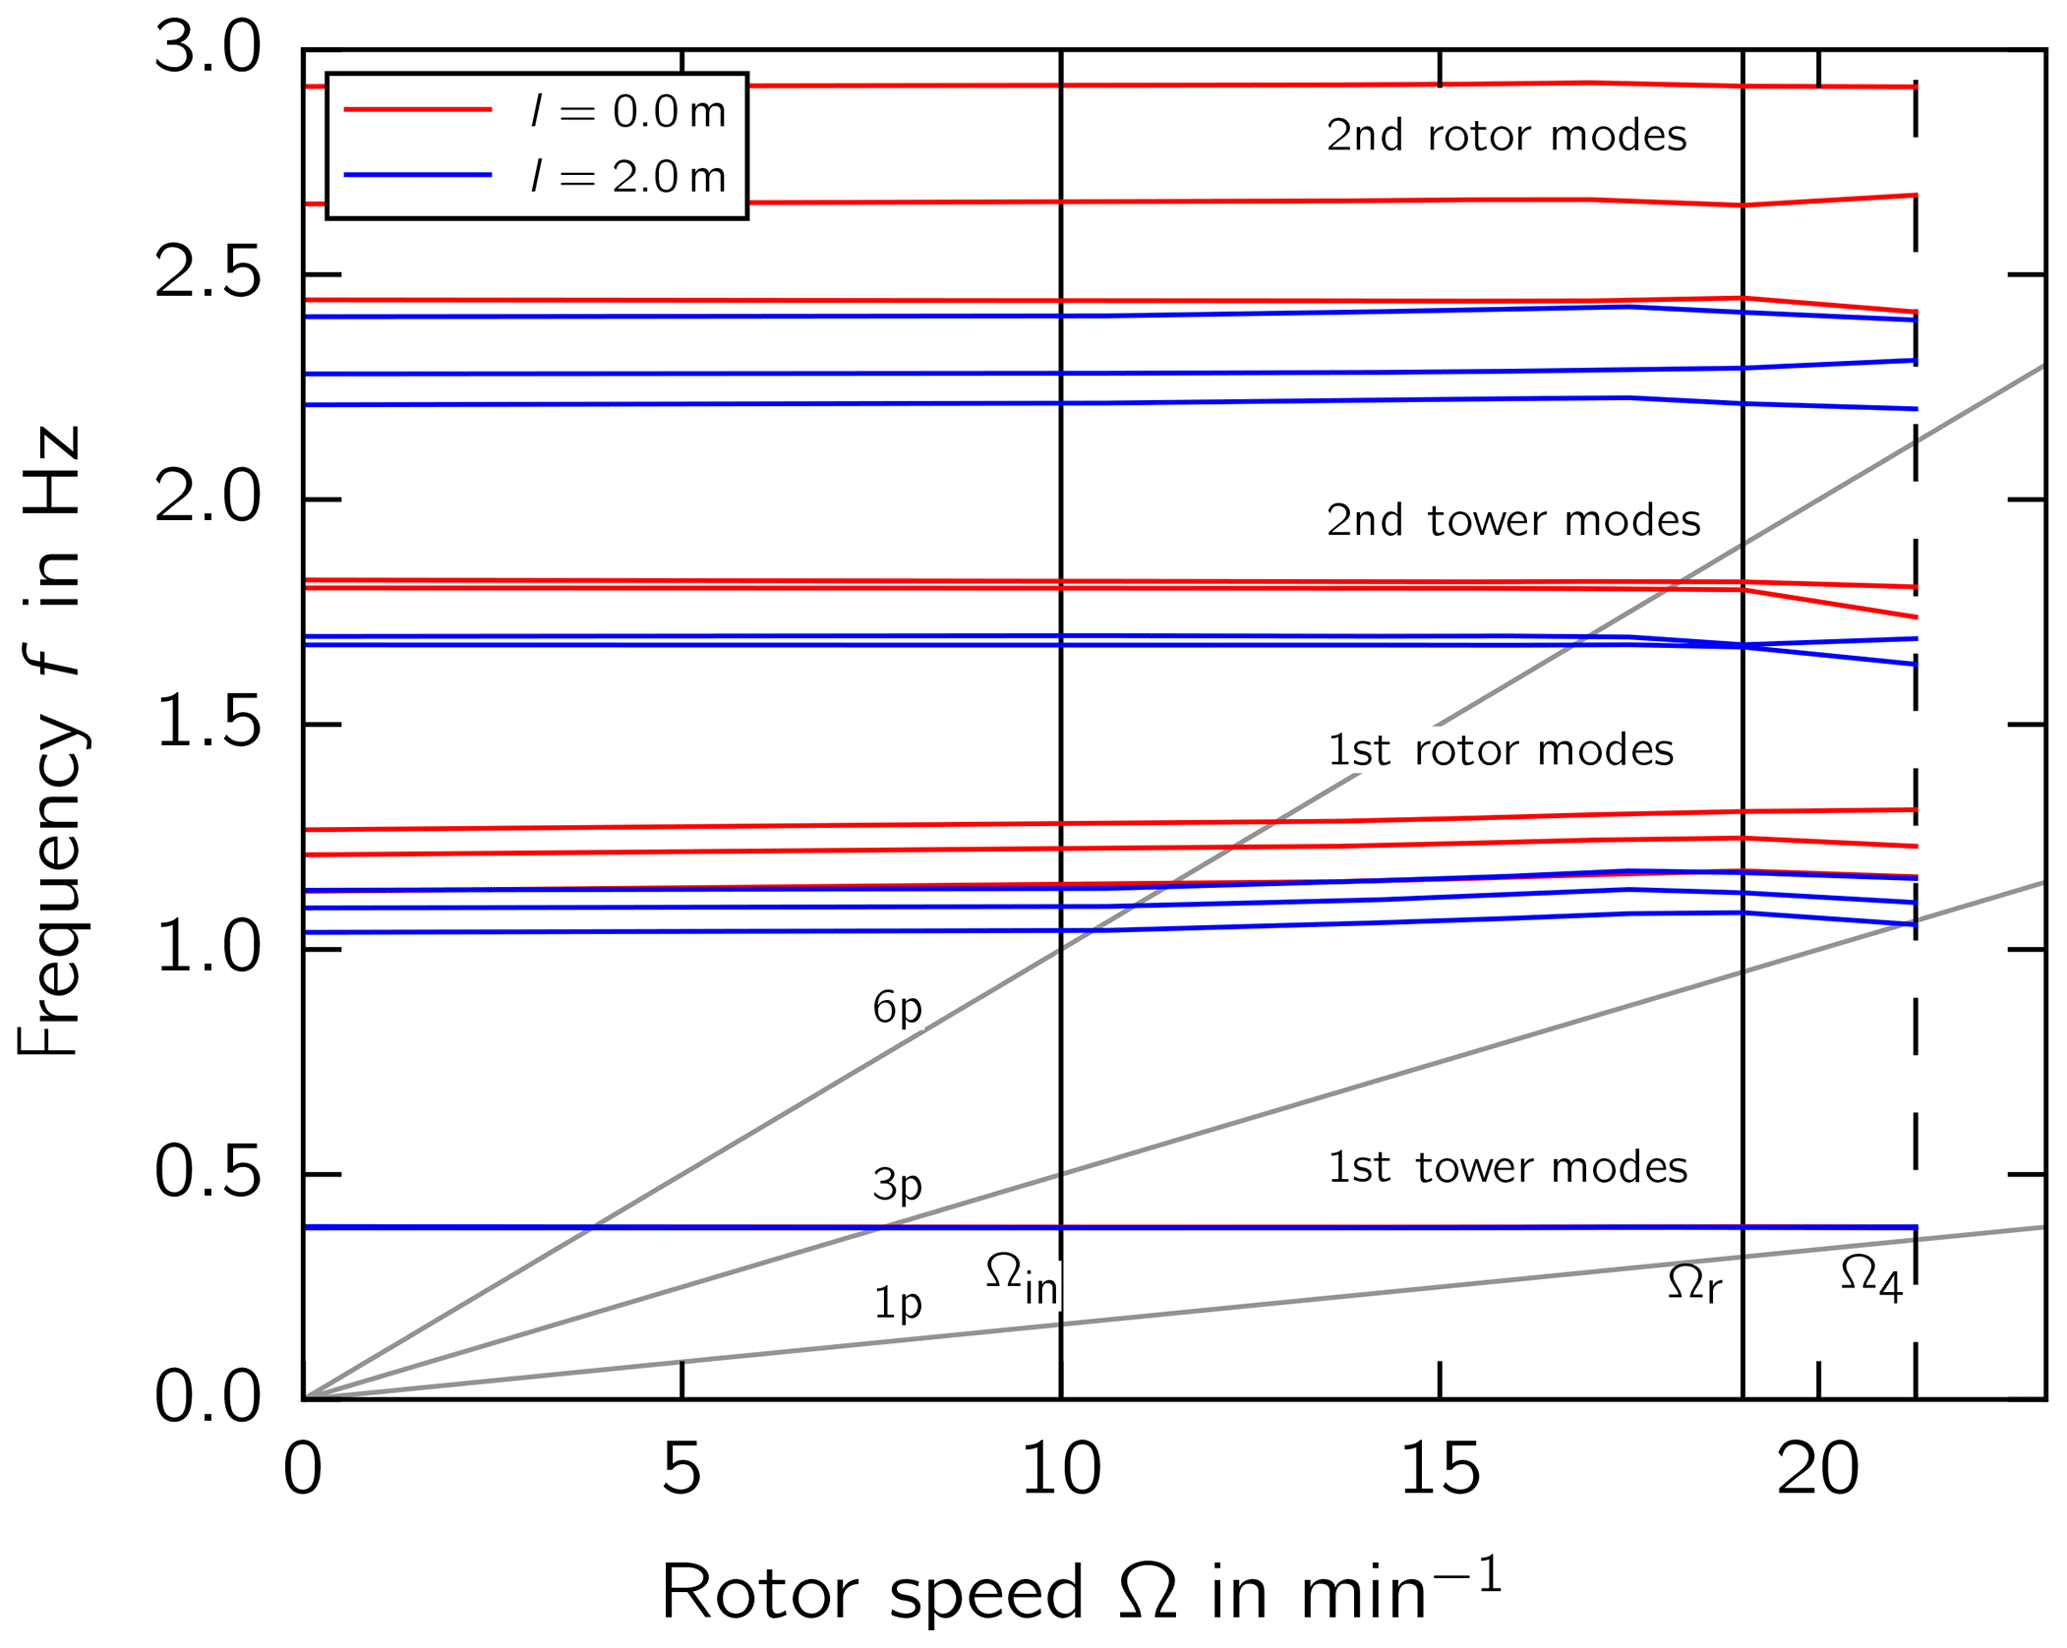
The Campbell diagram (Fig. 11) illustrates that the first eigenfrequencies of the rotor and the second eigenfrequencies of the tower decrease because of the added RBE mass and increased mass inertia of the rotor. At an RBE length of l=2 m, the eigenfrequencies of the first rotor modes approach the excitation frequency of 3 p, which represents the 3-fold rotor speed under overspeed conditions. If resonance were allowed to occur between the rotor modes and the 3 p excitation, loads could increase significantly.
The tip-to-tower clearance δ resulting from increasing tip deflections out of the rotor plane toward the tower uflap is shown in relation to the total blade length in Table 2. The deflections are obtained as extreme values from normal production load cases.

Neither an extrapolation to the 50-year value nor the extreme turbulence model is applied as would be required by IEC (2010). Thus the results only give an indication of how the RBE affects the deflections. The clearance is decreased by up to 10.4 % in the case where l=1.5 m. The relative deviations are, however, expected to be smaller if an analysis in accordance with the requirements of IEC (2010) is carried out. The results of such an analysis should be compared to the design assumptions to assess whether the turbine design allows for the decrease in clearance.
4.3 Fatigue stress exposure in blade structure
The static simulation revealed the loads for the fatigue analysis of the blade.
The fatigue stress exposure is plotted along the blade span for different RBE lengths (Fig. 12). The stress exposure increases along the entire length of the blade as the length of the RBE increases. We observed an increase in stress exposure at the second-to-last spanwise location before z=34 m where the RBE is attached to the blade tip. That is, the mass and aerodynamic loads increased nonlinearly with the RBE lengths. The maximum in fatigue stress exposure was observed at maximum chord (z=10.2 m) for all RBE lengths. The stress exposure increase in the outboard blade area is not large enough to exceed the stress exposure at maximum chord. Hence, the inboard remains critical and determines the total lifetime of the blade.
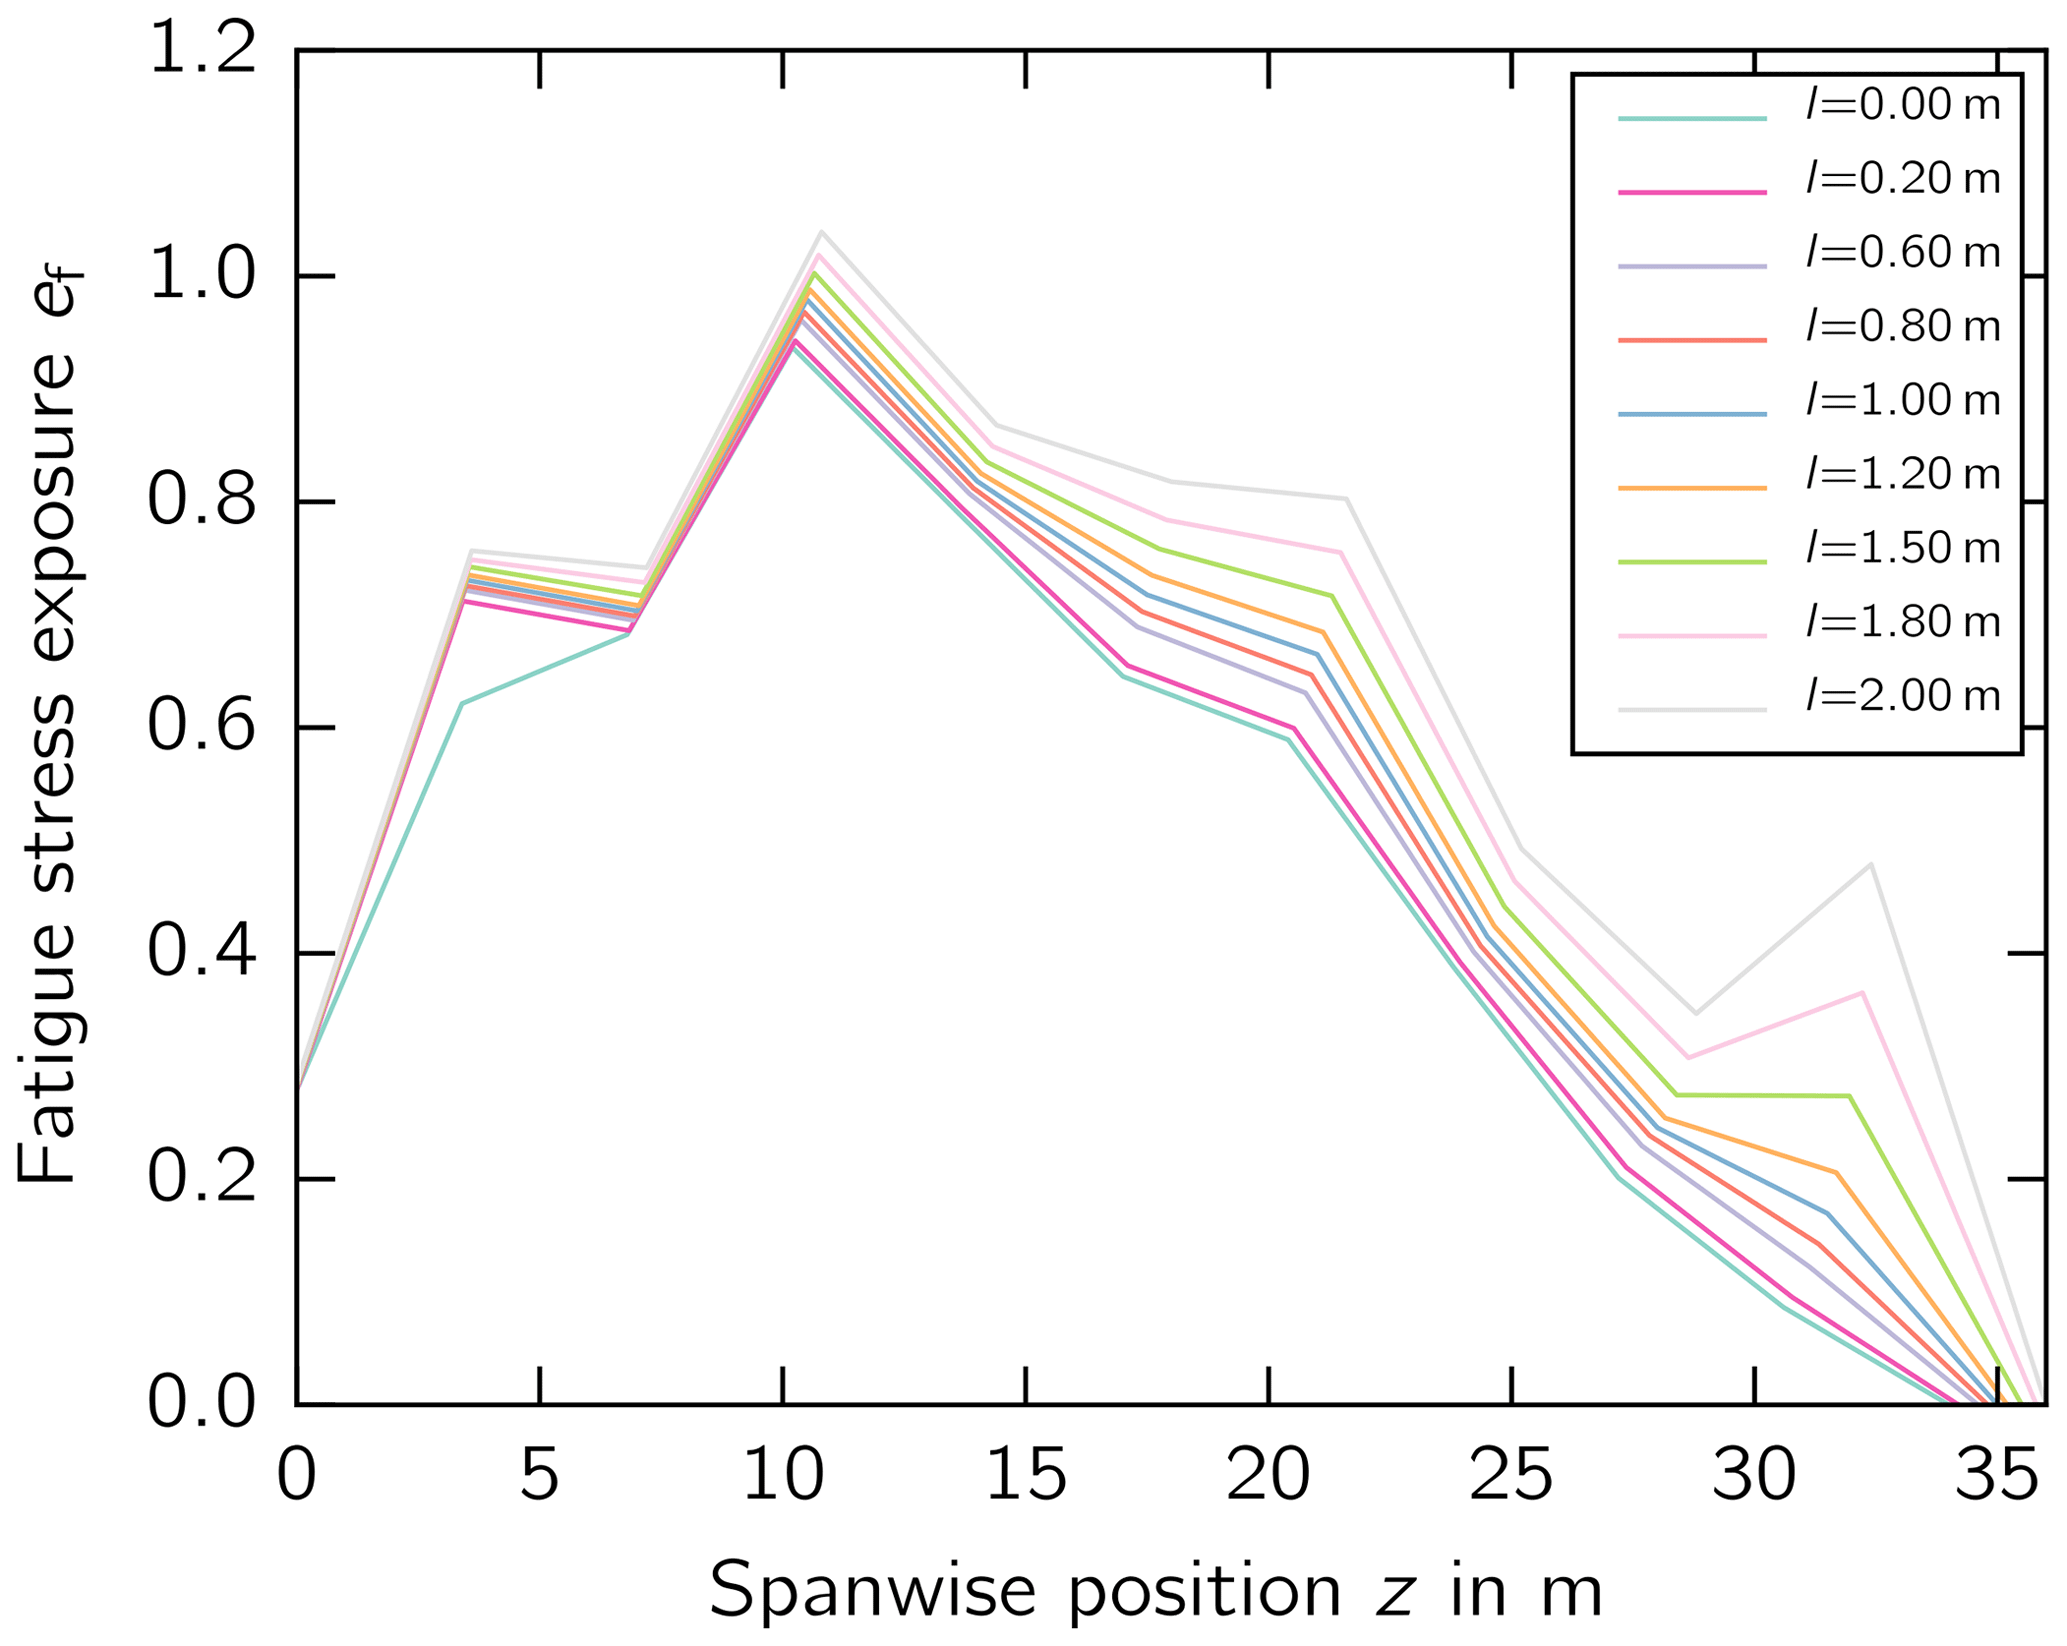
Figure 12Stress exposure along the trailing-edge bond line for different blade extension lengths obtained with the static simulation.
4.4 Fatigue budget of turbine components
Considering the blade without RBE, Eq. (9) yields a fatigue budget of TLTE=22.8 years at maximum chord (z=10.2 m) of the blade after Td=20 years of operation. The fatigue budget of the blade Bl decreases as the length of the RBE l increases. This is indicated by the blue bars in Fig. 13.
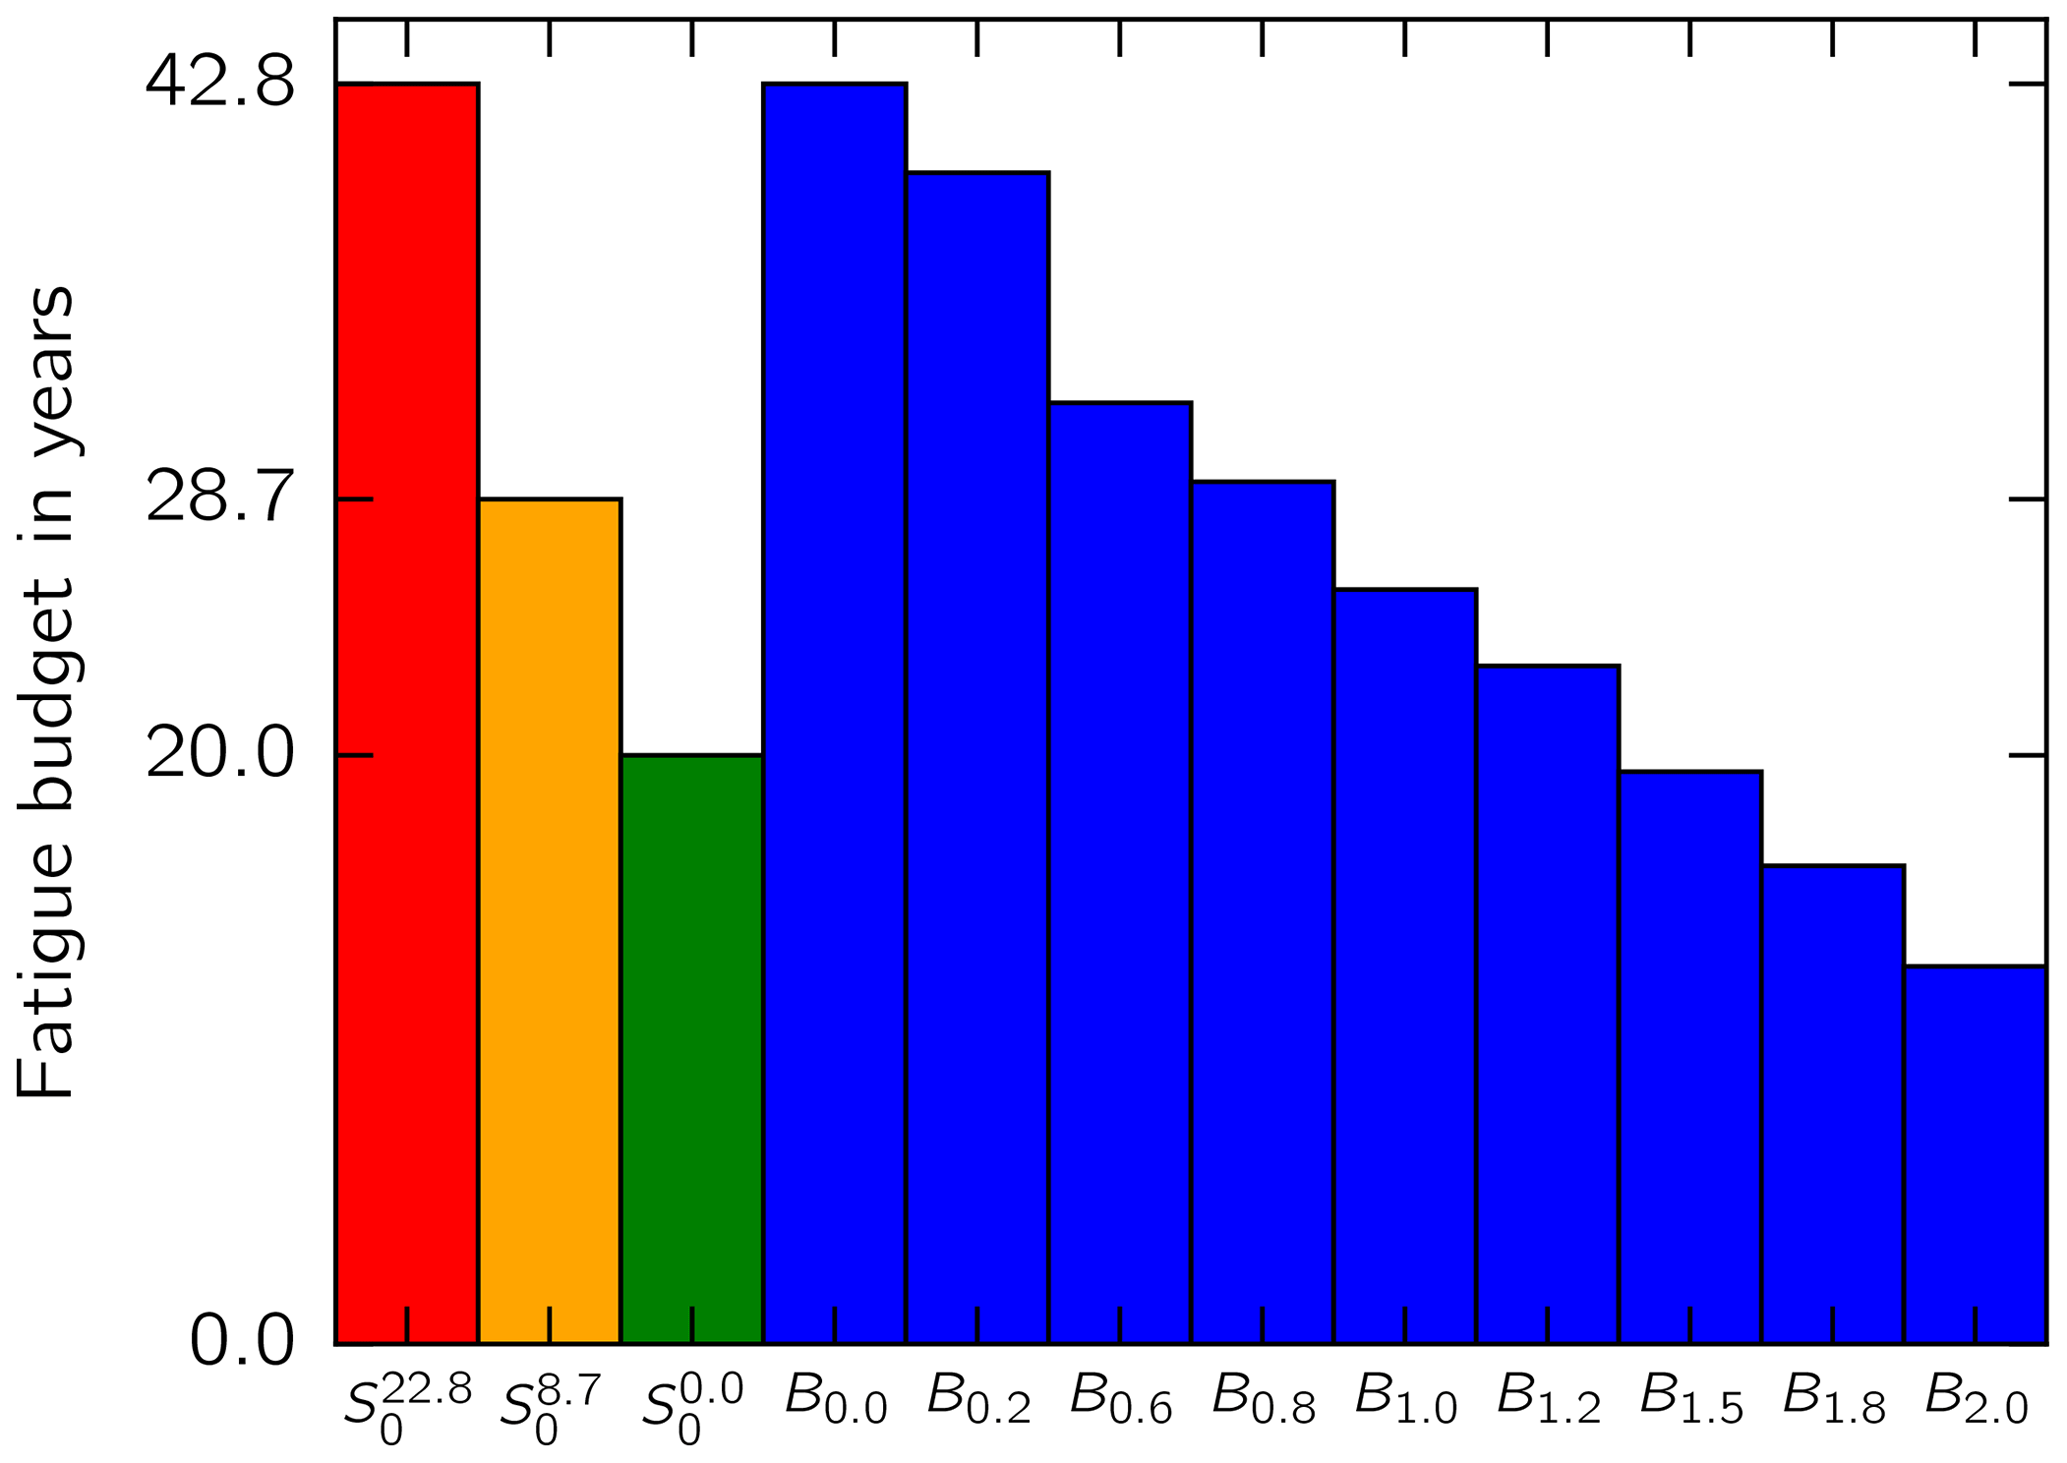
Figure 13Fatigue budget for the critical turbine component S0 without RBE and for the blade Bl with different RBE lengths.
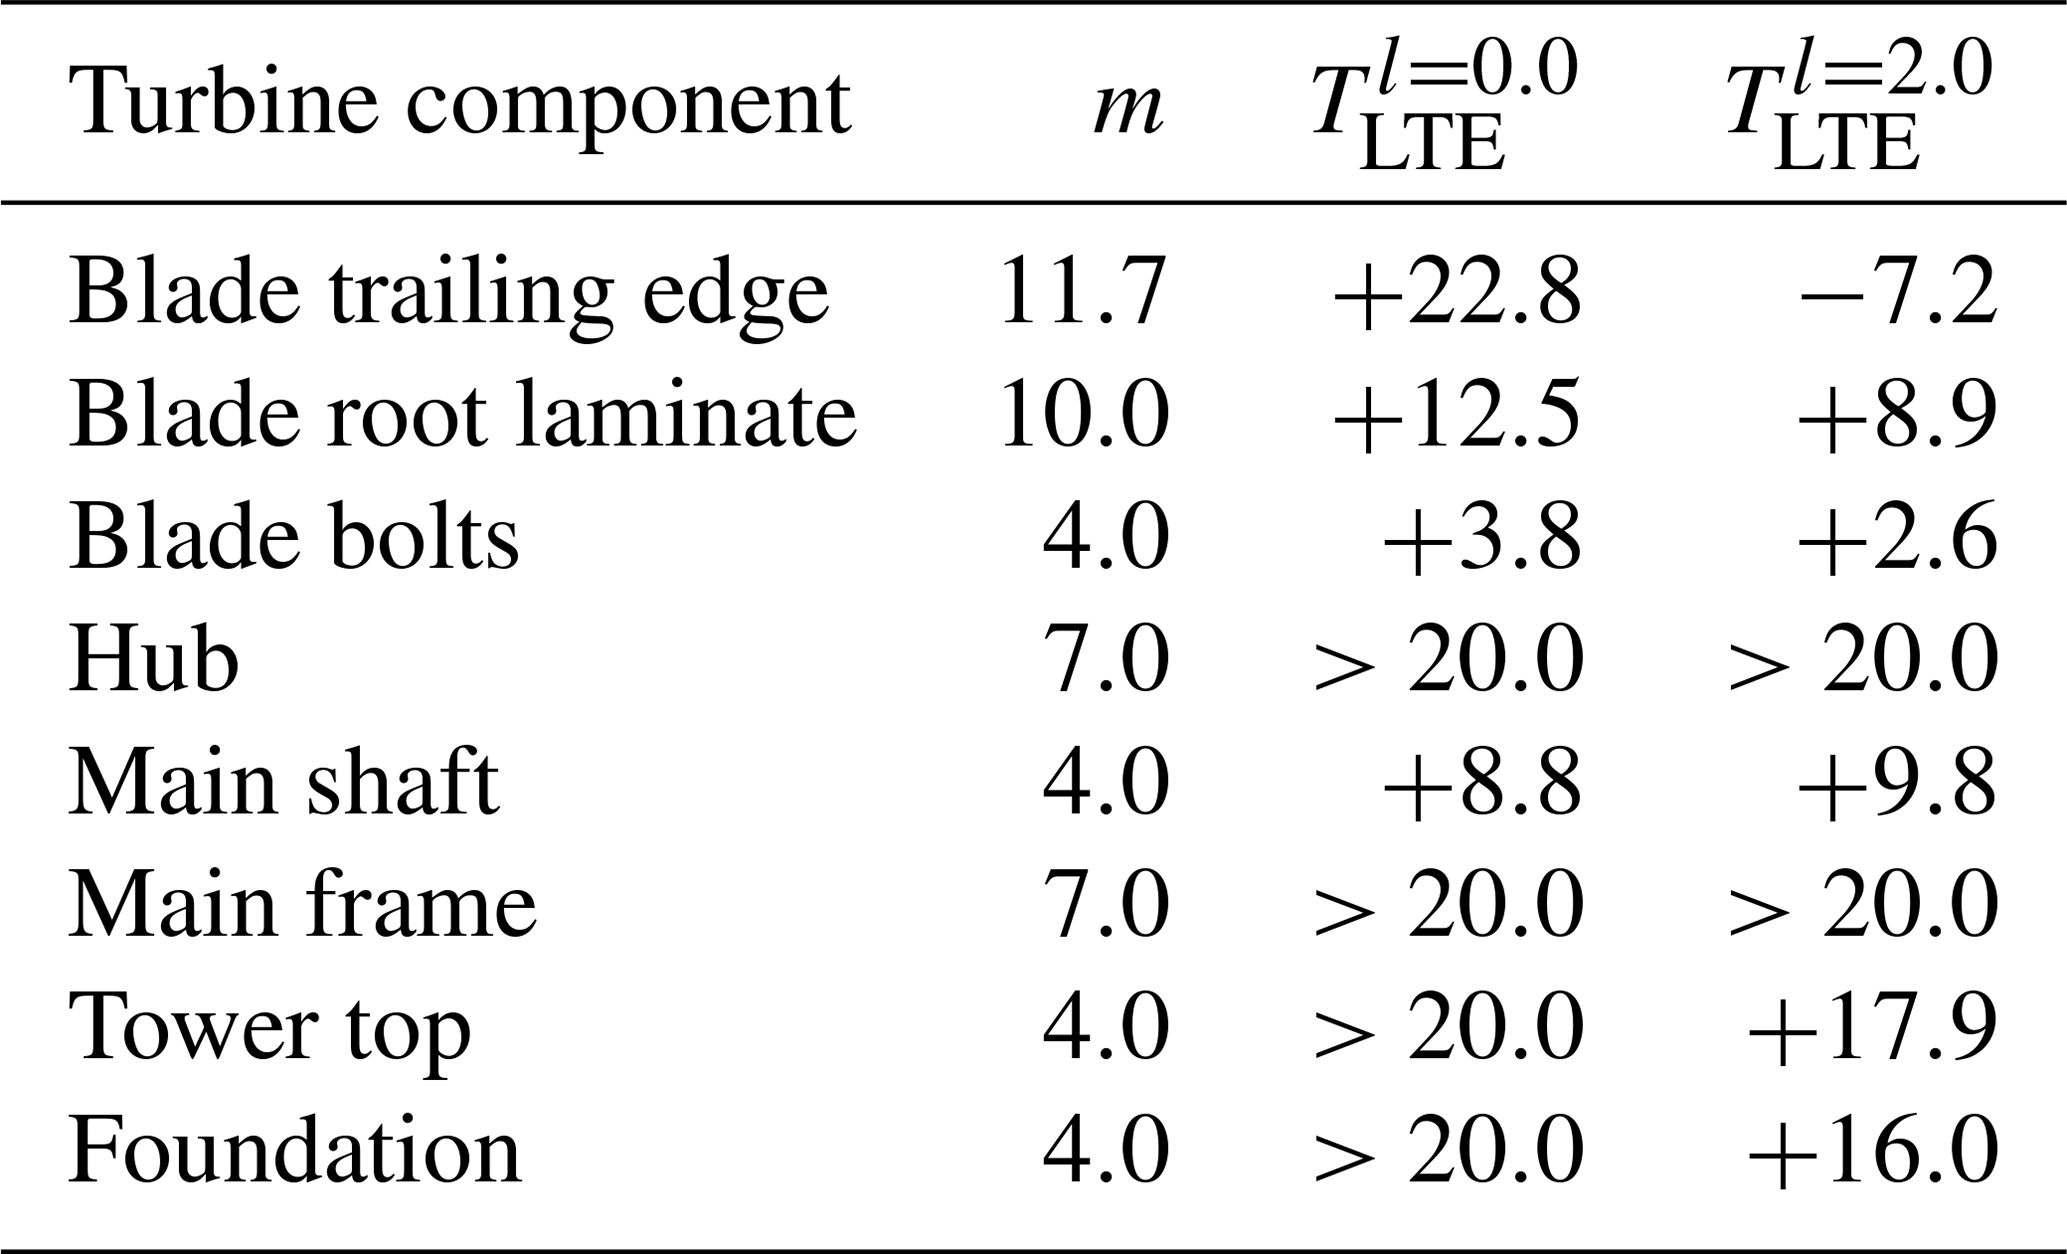
The fatigue budget or remaining lifetime of all other turbine components (Table 3) was determined on the basis of a relative DEL comparison using Eq. (12). For l=0.0 m, the most critical components are the blade bolts, which can be replaced after 3.9 years. The next most critical component is the rotor shaft with a fatigue budget of TLTE=8.7 years. For l=2.0 m, the order of critical components remains the same. Surprisingly, D is smaller for l=2.0 m than for l=0.0 m for the rotor shaft. This observation can be explained by the fact that the fatigue loads on the shaft are governed by aerodynamic effects rather than gravity or inertia loads. The relative deviation in D is 3.3 %, and the corresponding relative deviation in terms of loads is 0.8 %. This difference results from the slightly different rotor speeds and positions in the stochastic wind fields and can be regarded as insignificant in the scope of this study.
4.5 Lifetime extension scenarios
The red, orange, and green bars in Fig. 13 take into account the fatigue budget of the critical turbine component for the three scenarios, respectively.
The red bar represents a scenario in which no RBE is considered and the fatigue budget of the turbine, e.g., the shaft S, equals the fatigue budget of the rotor blade B: . In such a scenario, the fatigue budget of the turbine solely depends on the fatigue budget of the blade.
The green bar represents a scenario in which the fatigue budget of any component other than the blade limits the lifetime of the turbine: TLTE=0 years. This scenario represents a design site that fully utilizes the fatigue budget of the turbine.
The orange bar represents the actual scenario of our use case turbine. Herein, the fatigue budget of the shaft limits the turbine life to years. In this case, the fatigue budget of the blade without RBE is larger than the fatigue budget of the entire turbine: B0.0>S8.7. Hence, the fatigue budget gap between the blade and the shaft can be utilized by increasing the RBE length l until Bl=S8.7.
The latter scenario assumes that the blade with RBE does not reduce the fatigue budget of the shaft due to increased loads. As discussed before, the difference in fatigue damage in the shaft as a result of increased RBE length is negligible, so S8.7 can be assumed to be constant. The fatigue budgets of other components, such as the tower, however, are affected to a larger degree but remain uncritical since the fatigue budget is TLTE>20 years.
4.6 Energy production
The energy production as a function of the RBE length is expressed as
where AEPl represents the annual energy production of a rotor with RBE length l. The energy production EPref that a turbine without RBE and without LTE would yield after a design life of Td is expressed by simplifying Eq. (13) to
The change in energy production as a function of the RBE length EPl relative to the energy production EPref of the turbine without RBE and without LTE is plotted in Fig. 14 for the three scenarios.
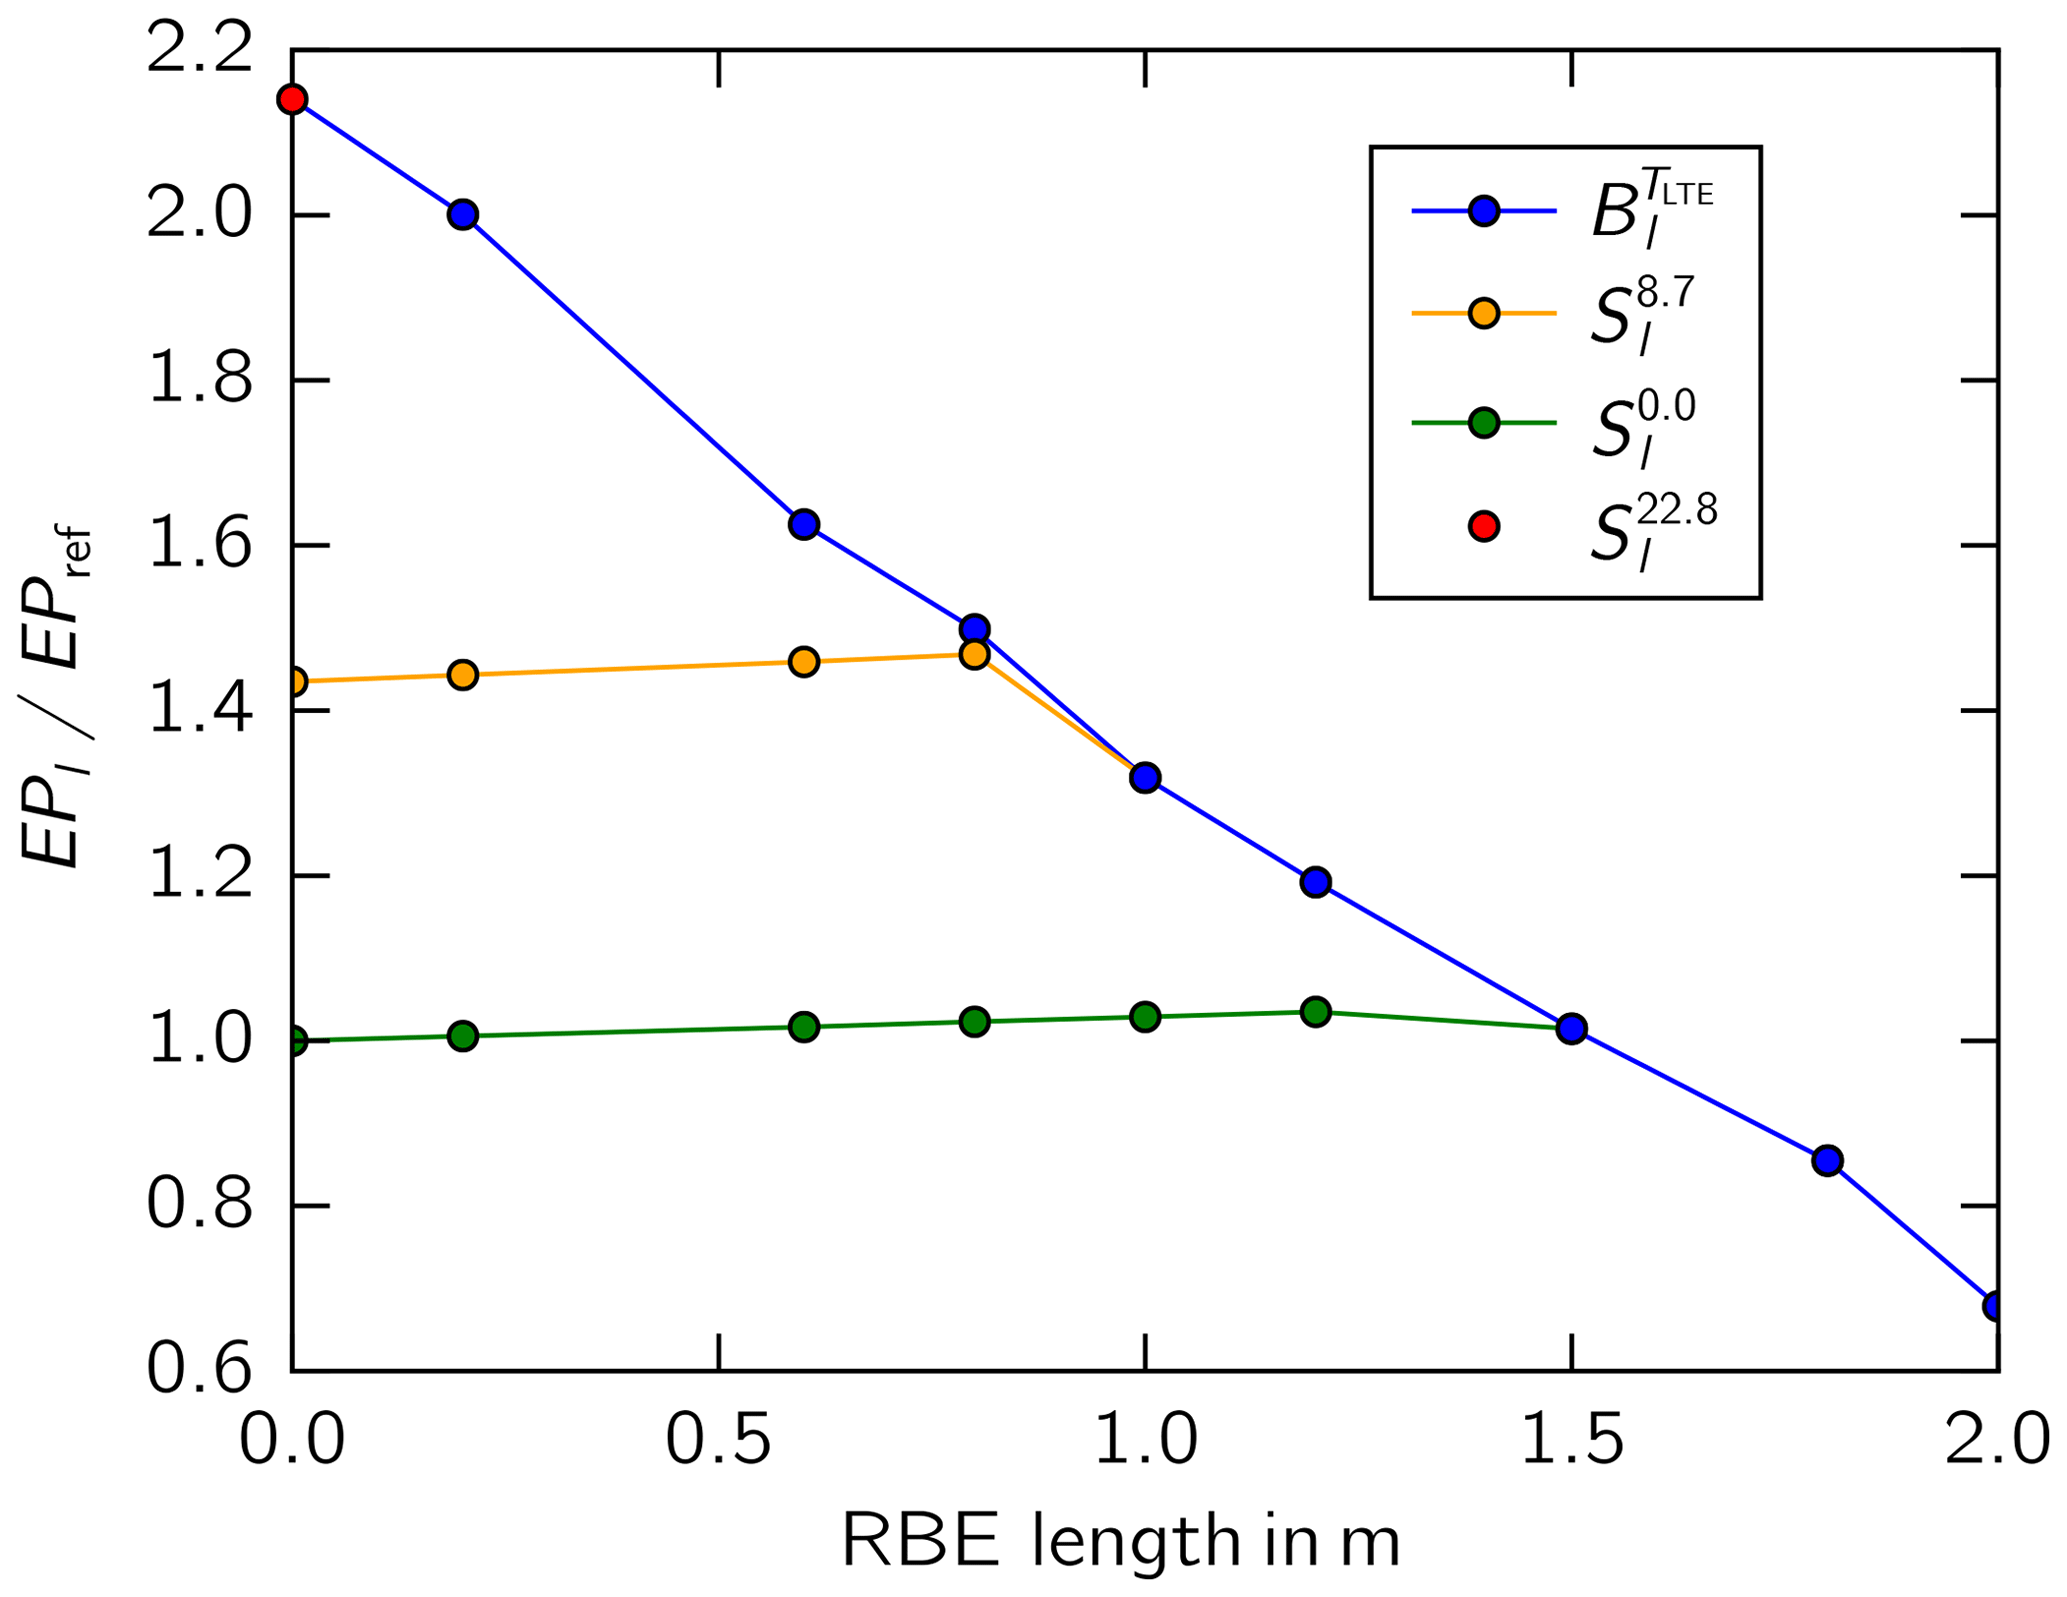
Figure 14Relative energy production increase as function of blade length. Three scenarios shown.
Again, red (here a red dot) indicates a scenario in which the blade limits the fatigue budget of the turbine. For any RBE length, the energy production loss caused by the smaller turbine fatigue budget outweighs the gains caused by an increase in the swept rotor area (blue curve). When only an LTE of TLTE=22.8 years is considered, the energy production is increased by 214.0 %. Given that the full TLTE is utilized, an increase in relative energy production by increasing the RBE length is not feasible in this scenario.
The orange line represents our use case. In this scenario, the RBE length can be increased until Bl=S8.7. When Bl>S8.7, the energy production increases linearly with swept rotor area. Above the critical length of l=0.8 m, the fatigue budget of the blade is critical and thus smaller than the fatigue budget of the shaft: . Here, the relative energy production follows the scenario of the blue curve. With a lifetime extension of TLTE=8.7 years plus an RBE length of l=0.8 m, the energy production is increased by 46.8 %. It is assumed here that the RBE is mounted at the beginning of the turbine life. A later installation of the RBE will decrease the energy production gain.
The green curve represents the scenario in which the fatigue budget of any component other than the blade limits the lifetime of the turbine: TLTE=0 years. In this scenario, the RBE length can be increased until Bl=S0.0. Above the critical length of l=1.2 m, the fatigue budget of the blade is critical. When solely the RBE length is increased, the energy production is increased by 3.5 %.
5.1 Fidelity of load simulation
The static simulation was verified for analyses of the trailing edge in the inboard blade region at up to 40 % of the blade length when an additional load factor of γl=1.25 was multiplied with the strain amplitude. In the outboard region, aerodynamic effects dominate the damage. These effects were not taken into account in the static simulation. Thus, we recommend the use of loads obtained from an aeroelastic simulation for fatigue damage calculations in the outboard blade region.
5.2 Method of relative damage equivalent load comparison
A relatively detailed damage analysis of turbine components, as conducted for the blade structure in this study, is not possible in most cases since design information is not available because it is confidential or it simply does not exist anymore. Therefore, the reverse engineering of the turbine and the method of relative damage equivalent load comparison is the obvious approach for the LTE calculation.
The relative DEL comparison is expected to yield conservative results. However, if more design information about the geometry and materials, especially for critical turbine components such as the blade bolts, blade root, and shaft, were available, a more reliable assessment of the lifetime extension would be possible.
5.3 Lifetime extension of use case turbine
A lifetime extension is feasible every time the site conditions are subjected to a lower average wind speed than the design conditions. The extended lifetime depends on the fatigue budget of the critical turbine component. When economical, it is feasible to replace critical components, e.g., blade bolts, in order to extend the lifetime.
Considering our use case, the energy production gain solely with an LTE is 43.5 % (Fig. 14). This LTE gain is relatively large compared to the additional energy production gain with an RBE of 2.3 %. We point out that the requirements for operation and maintenance and thus the effort is higher during the extended life.
5.4 Rotor blade extension retrofit for use case turbine
Considering our use case where any component other than the blade is driving the LTE, the RBE increases the energy production by 2.3 % on top of the energy gain resulting from an LTE (43.5 %), as explained above. In this case, the RBE can be increased up to a length at which the blade itself becomes the critical turbine component for the turbine lifetime. This length is interpreted as the optimum RBE length. Above the optimum length, fatigue budget losses outweigh any energy production gains. Our use case scenario shows that, for a 34 m blade, an RBE length of 0.8 m is most advantageous (Fig. 14).
The optimum RBE length obtained is within the boundaries defined by a serviceability limit state analysis which yielded a maximum RBE length of l=2.0 m for turbine resonance and a length of l>2.0 m for tower clearance.
We point out that the additional yield due to an RBE needs to cover the costs for the design, manufacturing, and installation of the RBE.
The static simulation was verified with an aeroelastic simulation which is applicable to structural analyses of the trailing edge in the inboard blade region at up to 40 % of the blade length.
A lifetime extension is feasible every time the site conditions are subjected to a lower average wind speed than the design conditions. The extended lifetime depends on the fatigue budget of the critical turbine component.
Considering our use case, the energy production gain solely with an LTE is 43.5 %. On top of the energy gain produced by an LTE, the RBE further increases the energy production by 2.3 %. For the 1.5 MW turbine in our use case, an RBE length of 0.8 m was most advantageous for the 34 m blade. The length obtained was within the limits for turbine resonance and tower clearance.
When the mean stress is neglected, Eq. (6) can be written with Eq. (5) as
When Eq. (A1) is inserted into Eq. (7), the damage is obtained as
Assuming that the fatigue damage is fully utilized under design conditions, i.e., Dd≡1, the ratio of the fatigue damage caused by site conditions and design conditions is obtained with
Assuming a linear relationship between moment amplitude and stress amplitude , Eq. (A3) can be written as
which is analogous to the ratio of damage equivalent loads according to Eq. (11) caused by site conditions to those caused by design conditions as expressed in Eq. (12).
The data presented in the figures are available at https://doi.org/10.5281/zenodo.3823309 (Rosemeier and Saathoff, 2020).
MR conducted the static load simulations and the fatigue analysis of the rotor blade. MS modeled the use case turbine and its controller, conducted the aeroelastic load simulations, and carried out the fatigue analysis of the turbine components. The two authors assessed the rotor blade extension retrofit and the lifetime extension of the turbine together.
The authors declare that they have no conflict of interest.
This article is part of the special issue “Wind Energy Science Conference 2019”. It is a result of the Wind Energy Science Conference 2019, Cork, Ireland, 17–20 June 2019.
We acknowledge the support of P. E. Concepts GmbH. Moreover, we would like to thank SSP Technology A/S for providing the geometry, the laminate plan, and the material properties for the wind turbine blade model for this research.
This research has been supported by the Bundesministerium für Wirtschaft und Energie within the SmartBlades2 project (grant no. 0324032B).
This paper was edited by Raimund Rolfes and reviewed by two anonymous referees.
Bech, A. and Hibbard, P.: A sectional blade, Vestas Wind Systems AS, Randers SV, Denmark, available at: https://worldwide.espacenet.com/patent/search?q=pn%3DUS2011158788A1 (last access: 9 July 2020), 2011. a
Becker, O.: 9x SÜDWIND S70/1500 kW – For Sale, available at: https://windturbines-marketplace.com (last access: 6 August 2016), 2015. a, b
Blasques, J. P. and Stolpe, M.: Multi-material topology optimization of laminated composite beam cross sections, Composite Structures, 94, 3278–3289, https://doi.org/10.1016/j.compstruct.2012.05.002, 2012. a
Bosschers, J.: Modelling of rotational effects with a 2-D viscous-inviscid interaction code, NLR Contract Report CR, 96521, NLR – Netherlands Aerospace Centre, Amsterdam, the Netherlands, 1996. a
Bundesverband WindEnergie: Basic Principles for Performing an Assessment and Verification of the Lifetime Extension of Onshore Wind Energy Converters (BPW), 2nd fully revised and expanded edition, Bundesverband WindEnergie e.V., Berlin, Germany, available at: https://www.wind-energie.de/fileadmin/redaktion/dokumente/publikationen-oeffentlich/arbeitskreise/weiterbetrieb/Grundsaetze_Weiterbetrieb_04.2017_V6.3_final.pdf (last access: 1 May 2020), 2017. a
Ceyhan, Ö. and Grasso, F.: Investigation of Wind Turbine Rotor Concepts for Offshore Wind Farms, J. Phys. Conf. Ser., 524, 012032, https://doi.org/10.1088/1742-6596/524/1/012032, 2014. a
Christenson, L., Glenn, B., Kils, O., Gates, R., and Nemila, T.: Method for site specific energy capture optimization through modular rotor blade tip extension, Clipper Windpower, Inc., Cedar Rapids, IA, USA, available at: https://worldwide.espacenet.com/patent/search?q=pn%3DUS2012093627A1 (last access: 9 July 2020), 2012. a
Clysters, K.: Plambeck setzt neue Rotorblätter von SSP Technology A/S ein, available at: http://w3.windmesse.de/windenergie/news/378-plambeck-setzt-neue-rotorblatter-von-ssp-technology-a-s-ein (last access: 7 October 2016), 2003. a
Craig Jr., R. R. and Bampton, M. C.: Coupling of substructures for dynamic analyses, AIAA Journal, 6, 1313–1319, 1968. a
DIBt: Richtlinie für Windkraftanlagen, Deutsches Institut für Bautechnik, Berlin, Germany, 1993. a
DNV GL AS: DNVGL-ST-0376 – Rotor blades for wind turbines, available at: https://rules.dnvgl.com/docs/pdf/DNVGL/ST/2015-12/DNVGL-ST-0376.pdf (last access: 15 June 2016), 2015. a, b
DNV GL AS: DNVGL-ST-0262 – Lifetime extension of wind turbines, https://rules.dnvgl.com/docs/pdf/DNVGL/ST/2016-03/DNVGL-ST-0262.pdf (last access: 26 November 2019), 2016. a
Drela, M.: XFOIL: An Analysis and Design System for Low Reynolds Number Airfoils, in: Low Reynolds Number Aerodynamics, edited by: Mueller, T. J., Springer, Berlin, Heidelberg, Germany, 1–12, https://doi.org/10.1007/978-3-642-84010-4_1, 1989. a
Energiekontor: Rotor Blade Extension by EnergieKontor, available at: https://www.rotorbladeextension.com (last access: 1 May 2020), 2016. a
Euler, L.: Methodus inveniendi lineas curvas maximi minimive propietate gaudentes, Additamentum I, De curvis elasticis, Bousqet & Socios, Lausanne, Geneva, Switzerland, 1744. a
Fischer, B. and Shan, M.: A survey on control methods for the mitigation of tower loads (Project report 01/104256), Tech. rep., Fraunhofer Institute for Wind Energy and Energy Systems Technology, IWES, available at: http://publica.fraunhofer.de/documents/N-272191.html (last access: 9 July 2020), 2013. a
Gasch, R. and Twele, J.: Wind Power Plants: Fundamentals, Design, Construction and Operation, Springer, https://doi.org/10.1007/978-3-642-22938-1, 2011. a
Hayman, G. J.: MLife Theory Manual for Version 1.00, National Renewable Energy Laboratory, Golden, CO, USA, 2012. a
Hibbard, P.: Wind turbine blade, Vestas Wind Systems AS, Randers SV, Denmark, available at: https://worldwide.espacenet.com/patent/search?q=pn%3DUS2011081247A1 (last access: 9 July 2020), 2011a. a
Hibbard, P.: Wind turbine blade, Vestas Wind Systems AS, Randers SV, Denmark, available at: https://worldwide.espacenet.com/patent/search?q=pn%3DUS2011081248A1 (last access: 9 July 2020), 2011b. a
IEC: IEC 61400-1 – Wind Turbines Part 1: Design Requirements for Wind Turbines, 2nd edn., International Electrotechnical Commission, Geneva, Switzerland, 1999. a
IEC: IEC 61400-1 – Wind Turbines Part 1: Design Requirements for Wind Turbines, 3rd edn., International Electrotechnical Commission, Geneva, Switzerland, 2010. a, b, c
ISO: ISO 2394 – General principles on reliability for structures, International Organization for Standardization, Geneva, Switzerland, 1998. a
Jonkman, B. J.: TurbSim user's guide: Version 1.50, Tech. rep., National Renewable Energy Laboratory (NREL), Golden, CO, USA, 2009. a
Krimmer, A., Leifheit, R., and Bardenhagen, A.: Assessment of quasi-static and fatigue performance of uni-directionally fibre reinforced polymers on the basis of matrix effort, in: 6th EASN International Conference on Innovation in European Aeronautics Research, 18–21 October 2016, Porto, Portugal, 2016. a
Larwood, S., Van Dam, C., and Schow, D.: Design studies of swept wind turbine blades, Renew. Energ., 71, 563–571, 2014. a
Lemos, P. and Savii, R.: Aerogenerator blade tip segment and method of assembly, Tecsis Technologia a Systemas Avancados S.A., Brazil, available at: https://worldwide.espacenet.com/patent/search?q=pn%3DUS2014286780A1 (last access: 9 July 2020), 2014. a
Madsen, P., Dekker, J., Thor, S., McAnulty, K., Matthies, H., and Thresher, R.: Recommended practices for wind turbine testing, 3. Fatigue Loads, 2nd edn., Tech. rep., International Energy Agency Programme for Research and Development on Wind Energy Conversion Systems, available at: https://community.ieawind.org/HigherLogic/System/DownloadDocumentFile.ashx?DocumentFileKey=0e44f1f5-54c0-0051-8f8c-e2212f51e26a&forceDialog=0 (last access: 2 May 2019), 1990. a
Merzhaeuser, T.: Wind blade tip joint, General Electric Company, Schenectady, NY, USA, available at: https://worldwide.espacenet.com/patent/search?q=pn%3DUS2015369211A1 (last access: 9 July 2020), 2015. a
Miner, M. A.: Cumulative damage in fatigue, J. Appl. Mech., 12, A159–A164, 1945. a
Moriarty, P. J. and Hansen, A. C.: AeroDyn theory manual, Tech. rep., National Renewable Energy Laboratory (NREL), Golden, CO, USA, 2005. a
Ning, S. A.: A simple solution method for the blade element momentum equations with guaranteed convergence, Wind Energy, 17, 1327–1345, https://doi.org/10.1002/we.1636, 2014. a
Orleanda, N. V.: ADAMS, version 2013.2, MSC Software Corporation, Santa Ana, CA, USA, 2013. a
Palmgren, A.: Die Lebensdauer von Kugellagern, Z. Ver. Dtsch. Ing., 68, 339–341, 1924. a
PNE WIND AG: http://www.pnewind.com/unternehmen/referenzen/ (last access: 7 October 2016), 2003. a
Puck, A.: Festigkeitsanalyse von Faser-Matrix-Laminaten: Modelle für die Praxis, Hanser, Munich, Germany, 1996. a
Rosemeier, M. and Saathoff, M.: Supplemental Material to Journal Article “Assessment of a rotor blade extension retrofit as a supplement to the lifetime extension of wind turbines”, Zenodo, https://doi.org/10.5281/zenodo.3823309, 2020. a
Rosemeier, M., Basters, G., and Antoniou, A.: Benefits of subcomponent over full-scale blade testing elaborated on a trailing-edge bond line design validation, Wind Energ. Sci., 3, 163–172, https://doi.org/10.5194/wes-3-163-2018, 2018. a
Rosemeier, M., Krimmer, A., Bardenhagen, A., and Antoniou, A.: Tunneling Crack Initiation in Trailing-Edge Bond Lines of Wind-Turbine Blades, AIAA J., 57, 5462–5474, https://doi.org/10.2514/1.J058179, 2019. a, b
Rosemeier, M., Krimmer, A., and Antoniou, A.: Development of thermal residual stresses during manufacture of wind turbine blades, J. Phys. Conf. Ser., 1452, 012060, https://doi.org/10.1088/1742-6596/1452/1/012060, 2020. a
Santiago, P. L. B. and Segovia, E. Y.: Systems and methods of assembling a rotor blade extension for use in a wind turbine, General Electric Company, Schenectady, NY, USA, available at: https://worldwide.espacenet.com/patent/search?q=pn%3DUS8328516B2 (last access: 9 July 2020), 2012. a
Sutherland, H.: On the Fatigue Analysis of Wind Turbines, Tech. rep., Sandia National Laboratories, Albuquerque, NM, USA, https://doi.org/10.2172/9460, 1999. a
Swanson, J. A.: ANSYS Mechanical APDL, version 15.0, ANSYS, Inc., Canonsburg, PA, USA, 2014. a
Wilkens, B.: Rotorblatt mit Blattspitzenverlängerung für eine Windenergieanlage, Energiekontor AG, Bremen, Germany, available at: https://worldwide.espacenet.com/patent/search?q=pn%3DEP2182203B2 (last access: 9 July 2020), 2016. a, b
Zahle, F., Réthoré, P.-E., Graf, P., Dykes, K., and Ning, A.: FUSED-Wind v0.1.0, Zenodo, https://doi.org/10.5281/zenodo.13899, 2015. a
Zahle, F., Sørensen, N. N., McWilliam, M. K., and Barlas, A.: Computational fluid dynamics-based surrogate optimization of a wind turbine blade tip extension for maximising energy production, J. Phys. Conf. Ser., 1037, 042013, https://doi.org/10.1088/1742-6596/1037/4/042013, 2018. a
Ziegler, L., Gonzalez, E., Rubert, T., Smolka, U., and Melero, J. J.: Lifetime extension of onshore wind turbines: A review covering Germany, Spain, Denmark, and the UK, Renew. Sust. Energ. Rev., 82, 1261–1271, https://doi.org/10.1016/j.rser.2017.09.100, 2018. a