the Creative Commons Attribution 4.0 License.
the Creative Commons Attribution 4.0 License.
 | 03 Aug 2020
Brief communication: Nowcasting of precipitation for leading-edge-erosion-safe mode
Charlotte Bay Hasager
Hans-Jürgen Kirtzel
Poul Hummelshøj
Leading-edge erosion (LEE) of wind turbine blades is caused by the impact of hydrometeors, which appear in a solid or liquid phase. A reduction in the wind turbine blades' tip speed during defined precipitation events can mitigate LEE. To apply such an erosion-safe mode, a precipitation nowcast is required. Theoretical considerations indicate that the time a raindrop needs to fall to the ground is sufficient to reduce the tip speed. Furthermore, it is described that a compact, vertically pointing radar that measures rain at different heights with a sufficiently high spatio-temporal resolution can nowcast rain for an erosion-safe mode.
- Article
(214 KB) - Full-text XML
- BibTeX
- EndNote


Leading-edge erosion caused by precipitation impinging on blades with high tip speed results in rougher blades and a loss in annual energy production. According to Chen et al. (2019), the most expensive and most time-consuming process within maintenance of wind turbines is blade repair. Durable leading-edge coatings are not yet available (Herring et al., 2019).
Bech et al. (2018) propose to reduce the tip speed during severe precipitation events to mitigate the effect of impacting hydrometeors on the leading edge. They present five different erosion-safe modes in which the tip speed of 90 m s−1 is reduced depending on the rain intensity (RI). For RI ≥20 mm h−1 the tip speed is reduced to between 20 and 35 m s−1, for RI ≥10 mm h−1 between 10 and 25 m s−1, and for RI ≥5 mm h−1 down to 20 m s−1. These erosion-safe modes lead to an increase in the expected lifetime, from 1.6 years up to 107 years, assuming a specific rain climate. Furthermore, they investigate the influence of the turbine control during intense rain events on the annual energy production (AEP). The calculated AEP values range from negligible reductions to significant increases. These calculations are based on the assumption that the time of reduced tip speed is 3 times longer than the actual time with RI above the mentioned thresholds. The suggested erosion-safe modes combine wind and precipitation measurements with a damage model. The damage model itself describes the erosion rate in relation to rain parameters (e.g. kinetic energy or accumulated amount of rain) and is based on laboratory measurements. Hasager et al. (2020) find higher erosion rates at coastal stations than inland stations in Denmark due to more intense rain events with high wind speeds at these locations. Furthermore, they show an increase in profit when the tip speed is reduced to 60 m s−1 or lower in case RI exceeds 1 mm h−1.
The method of erosion-safe mode control is only possible to implement based on adequate precipitation nowcasting at the minute to second scale. To limit the power production loss it is important to reduce the tip speed as early as possible, for as long as needed and for as short a time as possible.
Nowcasting of rain characteristics for leading-edge-erosion-safe mode control based on radar and Doppler lidar is a brand-new topic in wind energy. The proposed precipitation nowcasting for erosion-safe mode has similarity to short-term forecasting for power production based on ground-based remote sensing technologies like dual-Doppler radar (Valldecabres et al., 2018a) and long-range scanning lidar at the minute scale (Valldecabres et al., 2018b). Lidar-assisted yaw control, wake steering and induction control at the minute to second scale observed from turbine-mounted lidars (Würth et al., 2019) are also comparable to precipitation nowcasting.
Radars are traditional instruments for precipitation observations, while coherent Doppler lidar is novel in relation to rain (Aoki et al., 2016; Sjöholm and Mikkelsen, 2018). This brief communication focuses on the radar-based precipitation nowcasting for erosion-safe mode.
The time until a hydrometeor hits the ground is governed by three parameters: distance between cloud base height and the ground as well as the type and size of the hydrometeor, which determine the resulting fall velocity.
The distance between the cloud base height and the ground depends mainly on the location, the storm type and the related cloud type. It can vary between a few hundred to some thousands of metres. Depending on the storm type and the related growth mechanisms of cloud droplets, hydrometeors falling out of the cloud are liquid (drizzle, rain) or solid (snow, graupel, hail). Solid hydrometeors start to melt when they pass the 0 ∘C isotherm, which is the upper boundary of the melting layer. In weather radar measurements this layer is identified by high reflectivity values and is therefore called the bright band. Thurai and Iguchi (2000) present a season- and latitude-dependent distribution of the bright-band height for stratiform events based on satellite measurements, where the bright-band height is the height with the highest reflectivity value. They find large seasonal variations in the bright-band height for higher latitudes. Furthermore, they show that the 0 ∘C isotherm from Recommendation ITU-R P.839-1 is usually 500 m or less above the bright-band height. According to an updated version, P.839-4, the mean annual 0 ∘C isotherm is around 2000 m above sea level for Denmark (International Telecommunication Union, 2013). This distance leads to a bright-band height of about 1500 m, which can be taken as a rough approximation for the distance a raindrop falls until it reaches the ground. The bright-band height in Denmark varies from about 3500 m in summer to 0 m in winter (Rashpal S. Gill, Danish Meteorological Institute, personal communication, 2019).
Rain consists of different raindrop sizes due to collision-induced break-up and coalescence of raindrops. In general, a single raindrop has a diameter of between 0.1 and 8 mm, although raindrops with a diameter of 10 mm have been observed in relation to tropical clouds (Jones et al., 2010). Small drops up to around 1 mm are spherical, while larger drops have the shape of a flattened sphere. However, raindrops with a diameter of above 6 mm are rare as they break up due to their flattened shape and the related hydrodynamic instability or due to collision with another raindrop. Bringi et al. (2003) compare raindrop size distributions (DSDs) from different climates. They find a mass-weighted mean diameter (Dm) of between 1.50 and 1.75 mm for convective storm types in maritime-like environments and slightly larger Dm, between 2.00 and 2.75 mm, for continental-like environments. For stratiform storms they report Dm values of between 1.25 and 1.75 mm but no clear distinction between different environments. These Dm variations show that, besides location-dependent influences, raindrop formation processes related to specific storm types play a major role in determining the DSD.
Besides its shape, the fall velocity of a hydrometeor is controlled by three forces: gravity, buoyancy and the aerodynamic drag force. The fall velocity of a raindrop in still air, called the terminal fall velocity, increases with the drop diameter. This velocity increase is approximately linear for small sizes and non-linear for large sizes. One of the most used empirical equations to calculate the fall velocity of raindrops is based on investigations from Atlas et al. (1973). However, this equation does not take into account the altitude dependence of the fall speed due to the reduced aerodynamic drag force with decreasing air density and increasing altitude. Jones et al. (2010) provide an equation considering a density ratio factor compared to the standard atmosphere to consider this altitude-dependent change. Raindrops might not achieve terminal fall velocity during (heavy) rain because the collision-induced break-up and coalescence of drops cause repetitive increases and decreases in the fall velocity (Jones et al., 2010). Furthermore, as rain consists of different drop sizes, there will always be raindrops that are faster and slower.
Assuming a raindrop with a diameter of 1.5 mm, its terminal velocity is around 5 m s−1 according to the equation of Atlas et al. (1973). Considering a rain height of 1500 m, the raindrop needs 300 s (5 min) to fall to the ground. This time can be used to decelerate the tip speed of the wind turbine blades to reduce the impact energy by the drop and therefore the erosion of the leading edges. For comparison, a larger raindrop with a diameter of 2.5 mm has a terminal velocity of around 7 m s−1 and needs 214 s (3.6 min) for the same distance.
Solid hydrometeors have different properties than raindrops. This difference results in different fall properties and impact behaviours on the leading edge of the wind turbine blade. The impact of hail and graupel causes more damage compared to rain. The focus of this publication is on the nowcasting of rain as hail and graupel are less frequent (Macdonald et al., 2016), and snow is not relevant.
Operational nowcasting provided by national weather services like Integrated Nowcasting through Comprehensive Analysis (Haiden et al., 2011) combines available observations from weather stations, weather radars and satellites with forecasts of numerical weather prediction models. They provide values of precipitation amount and type in addition to other parameters in real time. However, in offshore environments, where enhanced leading-edge erosion is observed, observations from weather stations are usually not available. C- and S-band weather radars that are operated nationally and usually installed onshore cover large areas, including many offshore wind farms, with a temporal resolution of ≥5 min. However, some notable disadvantages of these weather radars for a nowcast of precipitation for offshore wind farms are as follows:
-
Partial beam filling. The precipitation does not completely fill the scanned volume because it increases with increasing distance from the radar. This condition can lead to an underestimation of RI.
-
Overshooting. The height of the radar beam is above the precipitation because the height of the radar beam increases due to the scan elevation angle and the curvature of the earth. This condition can lead to an underestimation of RI or even failure to detect precipitation.
-
Clutter caused by wind farms. Reflections produced by wind farm infrastructure wrongly indicate precipitation.
These and other limitations like anomalous propagation of the radar beam can be detected, but for some cases a correction is difficult (e.g. beam filling). This situation leads to some uncertainty in the precipitation parameters. Locally installed sensors measuring vertical profiles of precipitation are therefore an interesting option for nowcasting using the described time difference between the detection and impact of raindrops. Takahashi (1990) presents the Precipitation Particle Image Sensor (PPIS). Like a radiosonde, this sensor measures the precipitation at a certain height while ascending through the atmosphere. In contrast, vertically pointing radars provide continuous precipitation measurements at different altitudes at the same time.
An example for a ground-based vertically pointing radar is the Micro Rain Radar (MRR) from METEK. It is a compact, 24 GHz (K-band), frequency-modulated continuous-wave (FM-CW) Doppler radar with a parabola antenna pointing vertically (Peters et al., 2002). The latest model, MRR-PRO, has a vertical resolution of >10 m and can provide an averaged Doppler spectrum of the hydrometeors in ≥1 s; i.e. a Doppler spectrum of roughly 10 m for each second is available.
In case of rain, the first moment of the measured Doppler spectra allows the estimation of the fall velocity of the raindrops via the Doppler velocity. Based on the calculated fall velocity, the raindrop size can be estimated using the previously mentioned relationship between these two parameters inversely. The availability of the raindrop size and fall velocity allows the calculation of further rain parameters like the rain reflectivity and RI (assuming Rayleigh approximation) for different heights. These calculations assume that only raindrops and no solid hydrometeors or a mix of both (i.e. sleet) backscatter the signal.
Figure 1 shows the temporal and vertical evolution of the radar reflectivity, fall velocity and RI of an event in December 2019 in Plymouth (United Kingdom) measured with an MRR-PRO. This MRR-PRO provided data every 10 s up to 3200 m above ground. The high values of the derived parameters reflectivity and RI between 2000 and 1600 m indicate a melting layer. Below this layer, precipitation falls as rain, and RI close to the ground is above 5 mm h−1 for several consecutive minutes. Rain that was registered at the lower boundary of the melting layer, for example at 17:34 local time, arrived around 2 min later at the height of a turbine hub (approximately 100 m above ground). This time difference is shorter than the expected time based on the above calculations. One reason is the reduced air density and therefore reduced aerodynamic drag at higher altitudes, which lead to higher fall velocities. Additionally, because of break-up and coalescence processes, the actual fall velocity can differ from the terminal fall velocity with velocities even above terminal fall velocity (Montero-Martínez et al., 2009). Nevertheless, in principle, the measured time difference would enable the erosion-safe mode control to reduce the tip speed of the wind turbine blades in due time when observing a rain event with light or moderate RI.
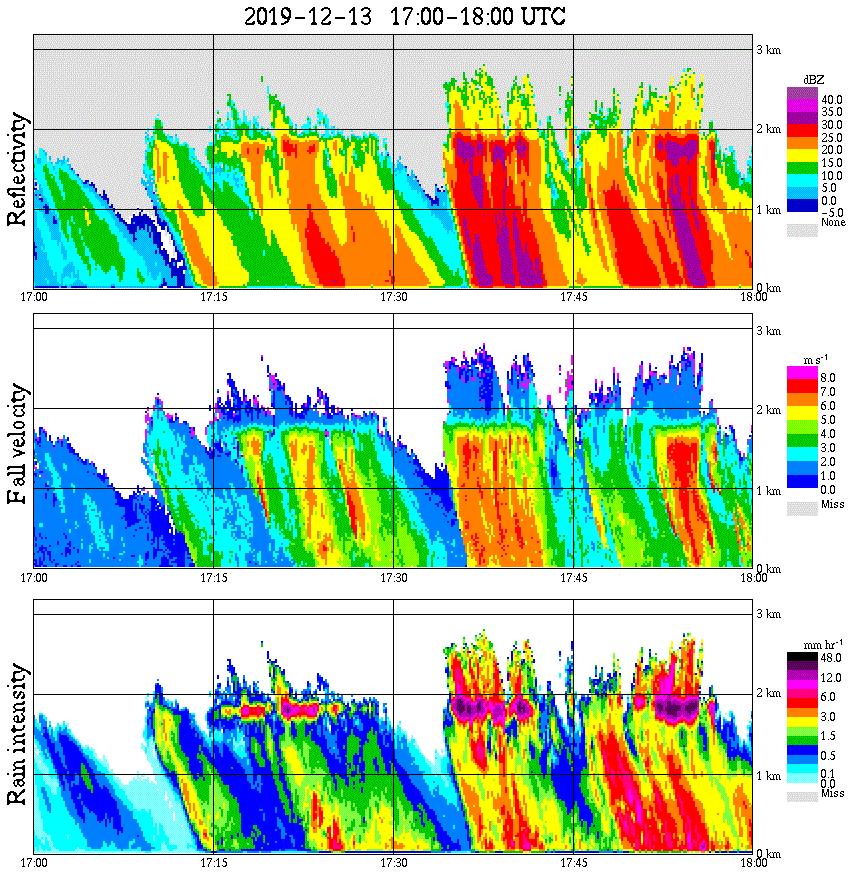
Figure 1Radar reflectivity (dBz), fall velocity of raindrops (m s−1) and rain intensity (mm h−1) based on Micro Rain Radar measurements in Plymouth (United Kingdom). The vertical axis describes the vertical distance from the sensor and the horizontal axis the time (UTC).
Although the tip speed may have already been reduced when observing heavy or violent rain events (RI >10 mm h−1) following the suggested RI thresholds from Bech et al. (2018) or Hasager et al. (2020) for applying an erosion-safe mode, it is still important to measure events with such a high RI. Adirosi et al. (2016) observe an increase in the median volume diameter of raindrops from 1.25 mm at 1050 m above ground level (a.g.l.) to 2.07 mm at 105 m a.g.l. during the convection phase of a rain event with high RI. This increase is probably due to coalescence and drop sorting. Therefore, it is possible that the RI at the wind turbine is higher than measured at some distance for the nowcast. The nowcast would not be as effective unless measurements closer to the wind turbine were included to check for such an increase. As larger drops fall faster, the time for reducing the tip speed in due time is shorter.
Nevertheless, an advantage of the MRR is that the height information of the melting layer can also help to identify the risk of blade icing, especially in cold climates. Furthermore, the MRR measurements are not disturbed by the flow around the sensor in contrast to in situ sensors like disdrometers (Testik and Rahman, 2016). However, in events with notable vertical wind (e.g. thunderstorms), the calculated RI based on the MRR-PRO raw data includes some error as still air is assumed. The radar beam of the MRR-PRO is attenuated more strongly at greater heights (>1 km) during violent RI compared to C- or S-band radar beams. The path-integrated attenuation (PIA) parameter of the MRR-PRO contains this information and can help to identify violent rain events.
The automatic detection of solid hydrometeors with the MRR is still challenging as these precipitation types have different fall properties than rain. However, they can be detected by the synopsis of different rain parameters provided by the MRR.
Erosion-safe mode needs, like other parameters in wind turbine controlling, a nowcasting with high temporal and spatial resolution. Theoretical investigations showed that it takes a raindrop around 5 min (or less) to cover the distance between the melting layer and the ground. If the raindrop is detected when it starts to fall, this time difference is sufficient to enable erosion-safe mode with reduced tip speed. Vertical precipitation profiles can be obtained using vertically pointing radars. For example, the Micro Rain Radar (MRR) from METEK points strictly vertically and measures Doppler spectra up to 3 km with a resolution of >10 m. Due to the high temporal resolution, the Doppler spectra and the related rain parameters are updated frequently and can be used for nowcasting. Using a vertically pointing radar also allows the height and temporal evolution of a possible present melting layer and solid hydrometeors to be captured. Based on these reflections it is possible to measure and nowcast rain where vertical precipitation profiles with a high spatio-temporal resolution are essential. This nowcasting technique can be applied onshore and offshore. Future work includes the combination of vertically pointing radar measurements and damage models to improve erosion-safe mode models and their operational use.
All necessary research data and references have been included in the paper.
AMT developed and discussed the concept and wrote main parts of the text. CBH discussed the concept and wrote and edited the text. HJK discussed the concept and edited the text. PH discussed the concept and edited the text.
The author Hans-Jürgen Kirtzel is employed by the private company METEK GmbH, and author Poul Hummelshøj is employed by the private company METEK Nordic ApS. The companies develop, produce and sell the Micro Rain Radar (MRR). The authors declare that they have no other known competing financial interests or personal relationships that could have appeared to influence the work reported in this paper.
We thank Chris Kidd (University of Maryland, NASA) for providing us with the measurement example of the Micro Rain Radar installed at the Plymouth Marine Laboratory, where Tim Smyth is responsible for the observations. This work is part of the project EROSION (http://www.rain-erosion.dk; last access 13 January 2020). We thank the two anonymous reviewers for their comments.
This research has been supported by the Innovation Fund Denmark (grant no. 6154-00018B).
This paper was edited by Rebecca Barthelmie and reviewed by two anonymous referees.
Adirosi, E., Baldini, L., Roberto, N., Gatlin, P., and Tokay, A.: Improvement of vertical profiles of raindrop size distribution from micro rain radar using 2D video disdrometer measurements, Atmos. Res., 169, 404–415, https://doi.org/10.1016/j.atmosres.2015.07.002, 2016.
Aoki, M., Iwai, H., Nakagawa, K., Ishii, S., and Mizutani, K.: Measurements of Rainfall Velocity and Raindrop Size Distribution Using Coherent Doppler Lidar, J. Atmos. Ocean. Tech., 33, 1949–1966, https://doi.org/10.1175/JTECH-D-15-0111.1, 2016.
Atlas, D., Srivastava, R. C., and Sekhon, R. S.: Doppler radar characteristics of precipitation at vertical incidence, Rev. Geophys., 11, 1–35, https://doi.org/10.1029/RG011i001p00001, 1973.
Bech, J. I., Hasager, C. B., and Bak, C.: Extending the life of wind turbine blade leading edges by reducing the tip speed during extreme precipitation events, Wind Energ. Sci., 3, 729–748, https://doi.org/10.5194/wes-3-729-2018, 2018.
Bringi, V. N., Chandrasekar, V., Hubbert, J., Gorgucci, E., Randeu, W. L., and Schoenhuber, M.: Raindrop Size Distribution in Different Climatic Regimes from Disdrometer and Dual-Polarized Radar Analysis, J. Atmos. Sci., 60, 354–365, https://doi.org/10.1175/1520-0469(2003)060<0354:RSDIDC>2.0.CO;2, 2003.
Chen, J., Wang, J., and Ni, A.: A review on rain erosion protection of wind turbine blades, J. Coat. Technol. Res., 16, 15–24, https://doi.org/10.1007/s11998-018-0134-8, 2019.
Haiden, T., Kann, A., Wittmann, C., Pistotnik, G., Bica, B., and Gruber, C.: The Integrated Nowcasting through Comprehensive Analysis (INCA) System and Its Validation over the Eastern Alpine Region, Weather Forecast., 26, 166–183, https://doi.org/10.1175/2010WAF2222451.1, 2011.
Hasager, C., Vejen, F., Bech, J. I., Skrzypiński, W. R., Tilg, A.-M., and Nielsen, M.: Assessment of the rain and wind climate with focus on wind turbine blade leading edge erosion rate and expected lifetime in Danish Seas, Renewable Energy, 149, 91–102, https://doi.org/10.1016/j.renene.2019.12.043, 2020.
Herring, R., Dyer, K., Martin, F., and Ward, C.: The increasing importance of leading edge erosion and a review of existing protection solutions, Renewable and Sustainable Energy Reviews, 115, 109382, https://doi.org/10.1016/j.rser.2019.109382, 2019.
International Telecommunication Union: Recommendation ITU-R P.839-4 – Rain height model for prediction methods, International Telecommunication Union (ITU), available at: http://www.itu.int/pub/R-REC/en (last access: 9 December 2019), 2013.
Jones, B. K., Saylor, J. R., and Testik, F. Y.: Raindrop morphodynamics, in: Geophysical Monograph Series, vol. 191, edited by: Testik, F. Y. and Gebremichael, M., 7–28, American Geophysical Union, Washington, D. C., 2010.
Macdonald, H., Infield, D., Nash, D. H., and Stack, M. M.: Mapping hail meteorological observations for prediction of erosion in wind turbines: UK hail meteorological observations, Wind Energy, 19, 777–784, https://doi.org/10.1002/we.1854, 2016.
Montero-Martínez, G., Kostinski, A. B., Shaw, R. A., and García-García, F.: Do all raindrops fall at terminal speed?, Geophys. Res. Lett., 36, L11818, https://doi.org/10.1029/2008GL037111, 2009.
Peters, G., Fischer, B., and Andersson, T.: Rain observations with a vertically looking Micro Rain Radar (MRR), Boreal Environ. Res., 7, 353–362, 2002.
Sjöholm, M. and Mikkelsen, T.: EROSION D3.1 Lidar tested versus disdrometer, Technical University of Denmark, available at: http://www.rain-erosion.dk/publication (last access: 14 January 2020), 2018.
Takahashi, T.: Near absence of lightning in torrential rainfall producing Micronesian thunderstorms, Geophys. Res. Lett., 17, 2381–2384, https://doi.org/10.1029/GL017i013p02381, 1990.
Testik, F. Y. and Rahman, M. K.: High-Speed Optical Disdrometer for Rainfall Microphysical Observations, J. Atmos. Ocean. Tech., 33, 231–243, https://doi.org/10.1175/JTECH-D-15-0098.1, 2016.
Thurai, M. and Iguchi, T.: Rain height information from TRMM precipitation radar, Electronics Letter, 36, 1059–1061, 2000.
Valldecabres, L., Nygaard, N., Vera-Tudela, L., von Bremen, L., and Kühn, M.: On the Use of Dual-Doppler Radar Measurements for Very Short-Term Wind Power Forecasts, Remote Sens., 10, 1701, https://doi.org/10.3390/rs10111701, 2018a.
Valldecabres, L., Peña, A., Courtney, M., von Bremen, L., and Kühn, M.: Very short-term forecast of near-coastal flow using scanning lidars, Wind Energy Science, 3, 313–327, https://doi.org/10.5194/wes-3-313-2018, 2018b.
Würth, I., Valldecabres, L., Simon, E., Möhrlen, C., Uzunoğlu, B., Gilbert, C., Giebel, G., Schlipf, D., and Kaifel, A.: Minute-Scale Forecasting of Wind Power – Results from the Collaborative Workshop of IEA Wind Task 32 and 36, Energies, 12, 712, https://doi.org/10.3390/en12040712, 2019.