the Creative Commons Attribution 4.0 License.
the Creative Commons Attribution 4.0 License.
 | 06 Oct 2021
Design procedures and experimental verification of an electro-thermal deicing system for wind turbines
David Getz
Jose Palacios
There has been a substantial growth in the wind energy power capacity worldwide, and icing difficulties have been encountered in cold climate locations. Rotor blade icing has been recognized as an issue, and solutions to mitigate accretion effects have been identified. Wind turbines are adapting helicopter rotor and propeller ice protection approaches to reduce aerodynamic performance degradation related to ice formation. Electro-thermal heating is one of the main technologies used to protect rotors from ice accretion, and it is one of the main technologies being considered to protect wind turbines. In this research, the design process required to develop an ice protection system for wind turbines is discussed. The design approach relies on modeling and experimental testing. Electro-thermal heater system testing was conducted at the Adverse Environment Rotor Test Stand at Penn State, where wind turbine representative airfoils protected with electro-thermal deicing were tested at representative centrifugal loads and flow speeds. The wind turbine sections tested were half-scale models of the 80 % span region of a generic 1.5 MW wind turbine blade. The icing cloud impact velocity was matched to that of a 1.5 MW wind turbine at full power production. Ice accretion modeling was performed to provide an initial estimate of the power density required to de-bond accreted ice at a set of icing conditions. Varying icing conditions were considered at −8 ∘C with liquid water contents of the cloud varying from 0.2 to 0.9 g/m3 and water droplets from 20 µm median volumetric diameter to 35 µm. Then, ice accretion thickness gradients along the span of the rotor blade for the icing conditions were collected experimentally. Given a pre-determined maximum power allocated for the deicing system, heating the entire blade was not possible. Heating zones were introduced along the span and the chord of the blade to provide the required power density needed to remove the accreted ice. The heating sequence for the zones started at the tip of the blade, to allow de-bonded ice to shed off along the span of the rotor blade. The continuity of the accreted ice along the blade span means that when using a portioned heating zone, ice could de-bond over that specific zone, but the ice formation could remain attached cohesively as it is connected to the ice on the adjacent inboard zone. To prevent such cohesive retention of de-bonded ice sections, the research determined the minimum ice thickness required to shed the accreted ice mass with the given amount of power availability. The experimentally determined minimum ice thickness for the varying types of ice accreted creates sufficient tensile forces due to centrifugal loads to break the cohesive ice forces between two adjacent heating zones. The experimental data were critical in the design of a time sequence controller that allows consecutive deicing of heating zones along the span of the wind turbine blade. Based on the experimental and modeling efforts, deicing a representative 1.5 MW wind turbine with a 100 kW power allocation required four sections along the blade span, with each heater section covering 17.8 % span and delivering a 2.48 W/in.2 (0.385 W/cm2) power density.
- Article
(17850 KB) - Full-text XML
-
Supplement
(867 KB) - BibTeX
- EndNote


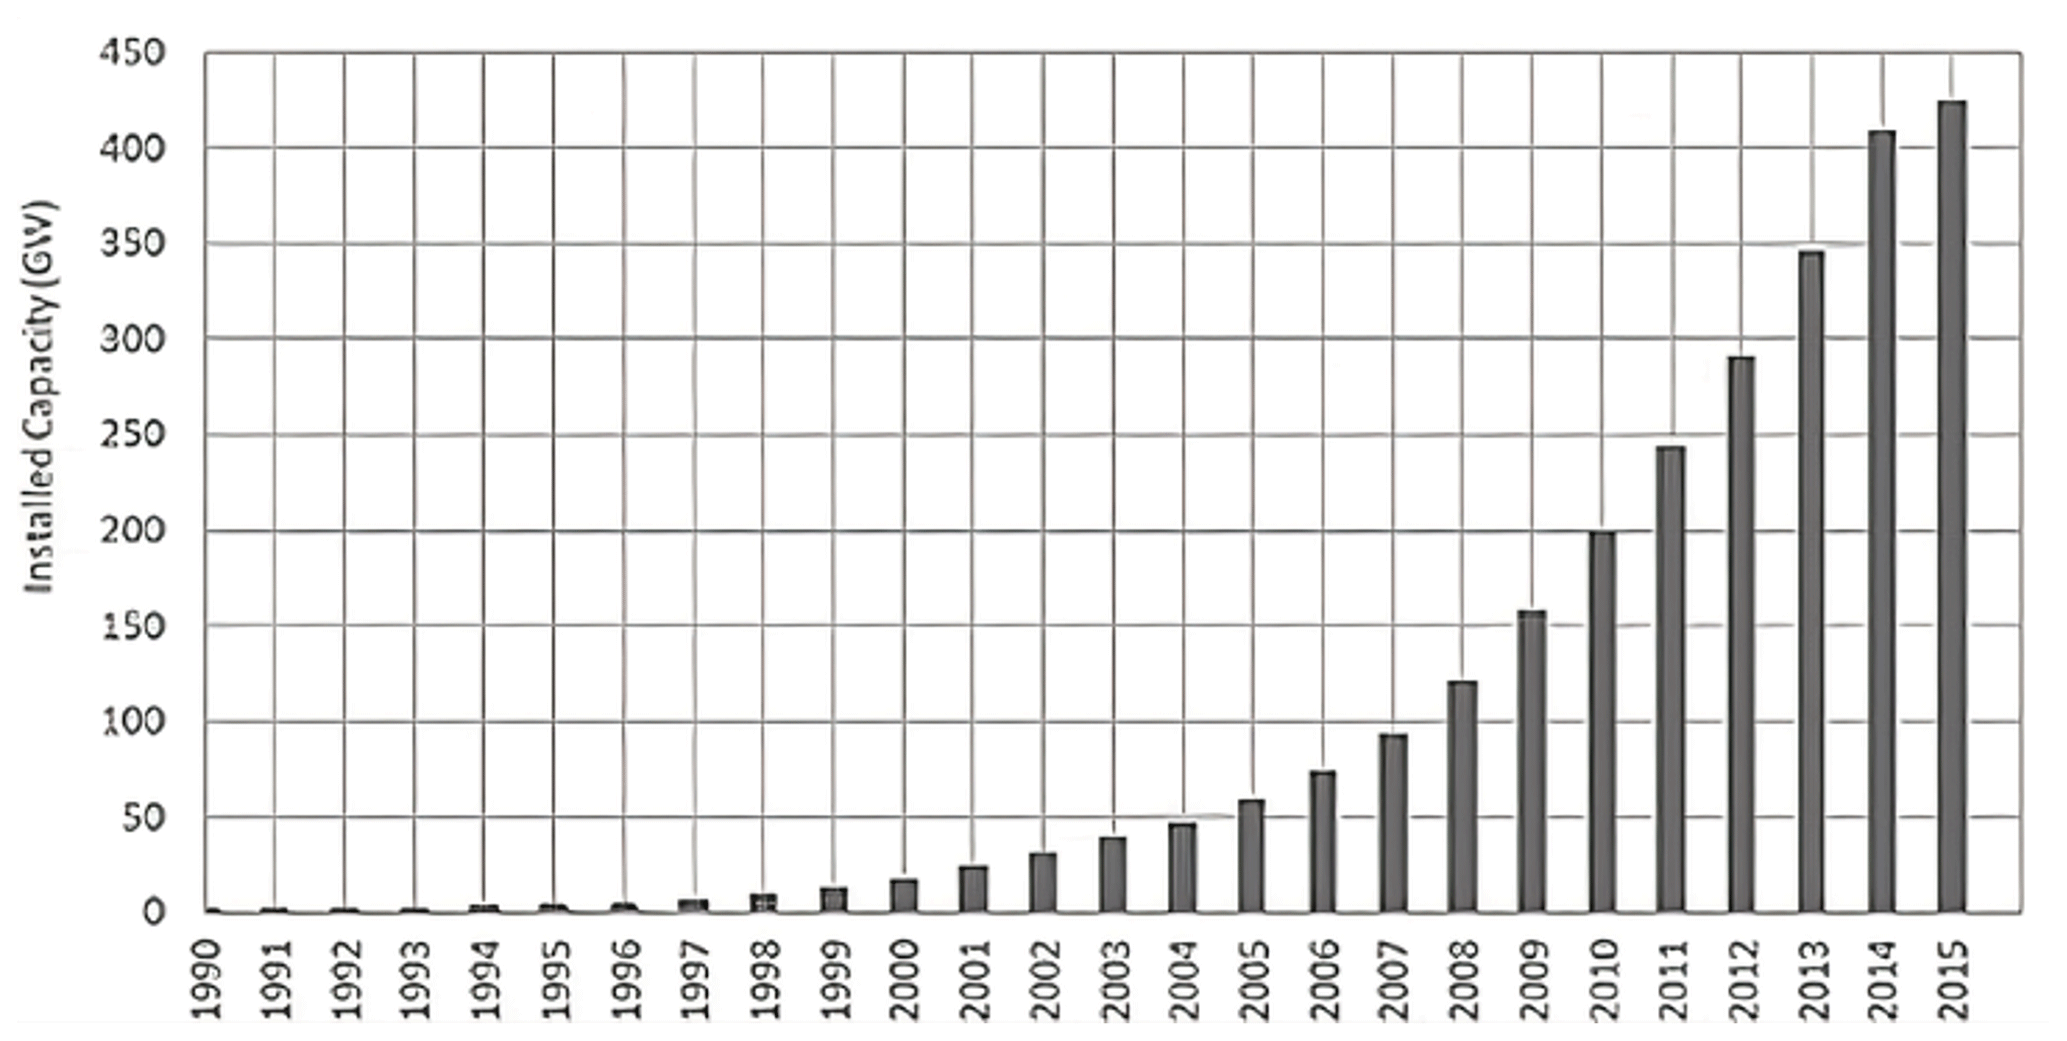
Conventional energy like coal, natural gas and oil has gradually become a source of concern due to its environmental impacts. Wind energy has been used to generate electric power for over 100 years, and the industry boomed during the oil crisis in the 1970s (Ackermann and Söder, 2002). In recent years, many developers have been investing in wind farms in cold climate regions away from populated areas, where higher air densities are typical. Among all the renewable sources, wind power has promising commercial prospects with the ability to produce large-scale electricity generation. The wind turbine power capacity installed from 1990 to 2015 is summarized in Fig. 1.
In 2009, the US had installed 10 GW with a total installed capacity of 40.2 GW. It is estimated that wind energy will generate 20 % of the US electricity in 2030. Currently, it produces 2 % of the nation's electricity (Global Wind Energy Council, 2011). In 2020, wind energy produced 8.42 % of electricity in the US (U.S Department of Energy, 2021). In 2010, China surpassed the US as the world's leader of wind power (Xu, 2010). This is no surprise considering China's installed capacity has doubled each year since 2006. The installed capacity of the leading wind power countries is demonstrated in Fig. 2.
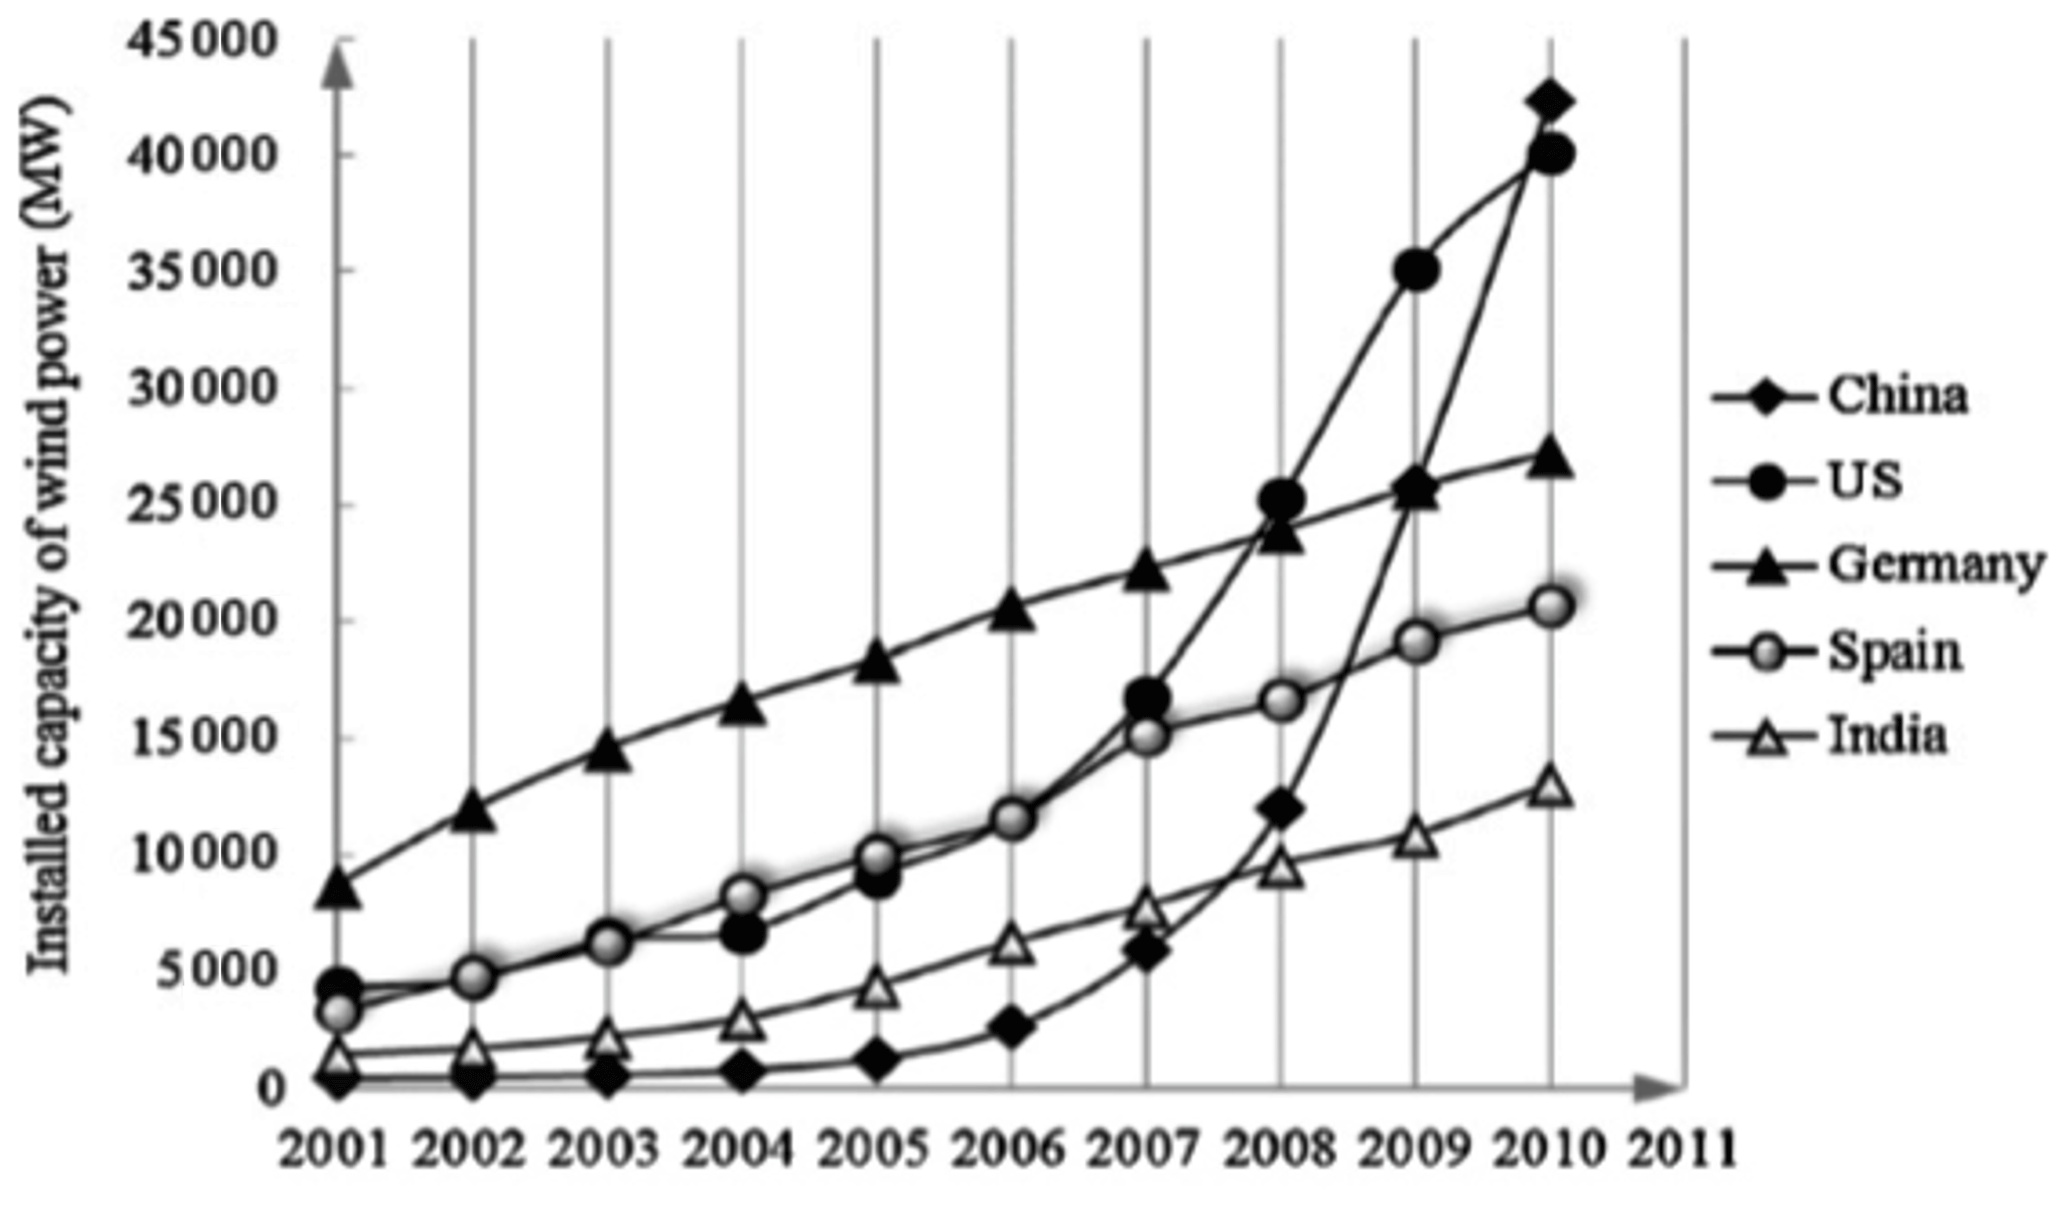
Figure 2Installed wind power capacity in leading countries (US, PR China, Germany, India and Spain; Global Wind Energy Council, 2011).
Most wind turbines experience hazardous icing events in cold climates, and the accumulation of ice on the wind turbine blade modifies the blade geometry and degrades the aerodynamic performance. The estimated loss of the total annual energy production (AEP) can be approximately 20 % (Lamraoui et al., 2014). Severe icing conditions cause rotational torque to decline to zero, and the turbine is forced to shut down. Wind turbines also stop under icing conditions that cause heavy vibrations, because these vibrations promote ice shedding, which can lead to imbalance forces that could damage the hub of the wind turbine and pose threats to the surrounding environment due to ballistic shedding events (Feng et al., 2012; Laakso et al., 2010; Hochart et al., 2008).
The ice accumulation problem is a complex phenomenon that combines various parameters. The shape of the ice and rate at which it accretes are dependent upon the atmospheric temperature, liquid water content of the cloud, impact velocity, water droplet size and accretion time. The water content of the cloud is defined by the liquid water content (LWC) in g/m3. The water droplet size in the cloud is characterized by the median volumetric diameter (MVD) in µm (Ruff and Berkowitz, 1990). The Federal Aviation Administration (FAA) has defined two icing envelopes in the Federal Aviation Regulations Part 25 and Part 29 Appendix C (2002) using the MVD, LWC and ambient temperature. Continuous icing proves to be less severe, because the liquid water content ranges from 0.06 to 0.8 g/m3, and the median value diameter of the droplets ranges from 10 to 40 µm. Typically, the LWC and MVD affect the thickness of the ice shape, while temperature and droplet impact velocity affect the surface roughness and adhesion strength of the ice. Icing envelopes for wind turbine regions have not been officially established.
Icing conditions on wind turbines have led to research in various anti-icing and deicing ice protection systems (IPSs). Anti-icing systems simply keep the rotor blades free from ice. Anti-icing systems consume massive amounts of power because they operate continuously and must protect large areas to prevent risks of water re-freezing in aft locations. Deicing systems allow thin layers of ice to accrete and then rely on centrifugal forces to assist with ice shedding. Deicing systems are less power expensive than anti-icing systems because they must only protect the ice accretion region within ice impingement limits. Also, since accreted ice acts as an insulator, the deicing system is not subjected to the high levels of convective cooling that an anti-icing system would encounter. IPSs attempt to minimize runback water from freezing on the aft section of the blade. In an anti-icing configuration, the re-freezing of runback water can be prevented by evaporating the ice interface created by the impingement of supercooled water droplets. In general, the evaporative mode for anti-icing systems requires about 5 times more energy to operate, rendering it too expensive for wind turbines.
The wind turbine industry has integrated ice mitigation techniques from the aviation industry. In addition to electro-thermal deicing, the aviation industry has used active ice protection systems and is working on developing passive techniques. Passive ice protection systems consist of coatings that are characterized by low ice adhesion strength. Passive ice-phobic coatings degrade under erosion conditions, which cause them to lose their ice-phobic properties. To date, a fully passive ice protection coating with application to the aviation industry does not exist. Some examples of active ice protection systems are hot-air injection, ultrasonic waves, electro-thermal heaters and pneumatic boots (Overmeyer et al., 2012; Martin and Putt, 1992; Flemming, 2003; Botura et al., 2005; Buschhorn et al., 2013).
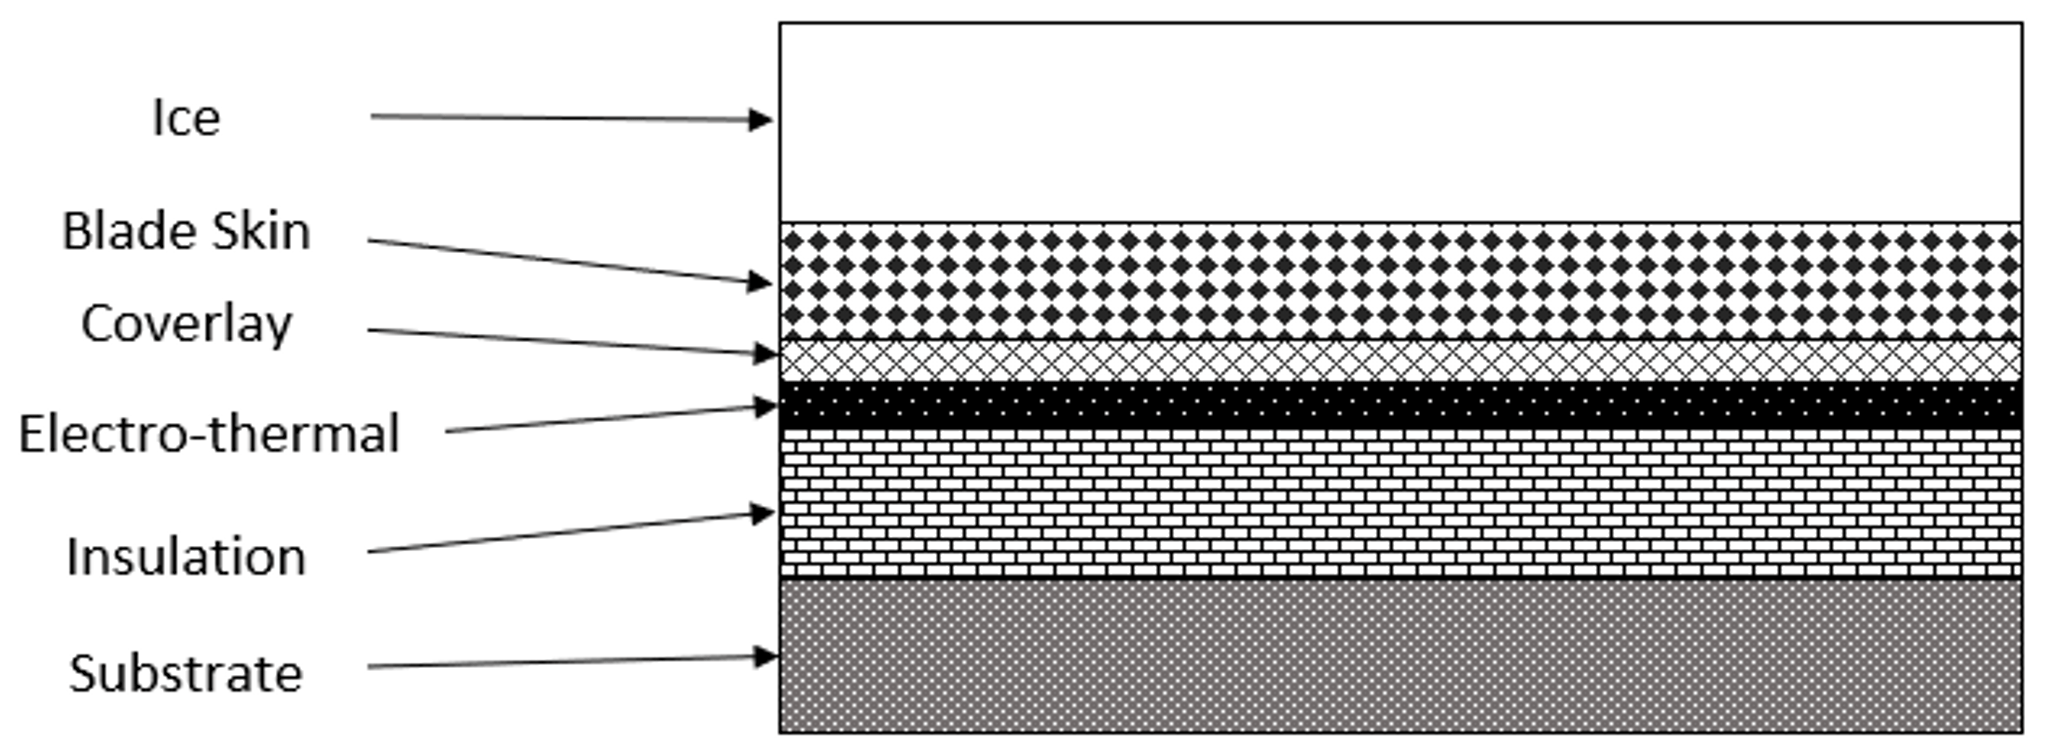
Electro-thermal ice protection systems are the most common IPSs used due to the simplicity. The system sends electrical current to resistive circuits, which convert electrical energy into thermal energy. These resistive circuits are known as the heating elements. These heating elements are typically adhered underneath the blade skin and coverlay. A simplified schematic of the layers is displayed in Fig. 3. Coverlay is a material laminated to insulate the copper conductor. The blade skin is the layer of protection used to prevent surface erosion. The thermal energy converted from electrical energy in the heating elements travels through the layers via conduction.
With latitude coordinates like Canada, electro-thermal ice protection systems are used in Pori and Olostunturi, Finland. Between 1999 and 2001, Pori's IPS was mainly used for public safety, and its power consumption was 1 % of the annual production. In extreme events, the IPS used a maximum of 6 % nominal power. In Olostunturi, the IPS used 3.6 % of the annual production (Laakso et al., 2010).
This paper concentrates on the design process of an electro-thermal deicing heater configuration for wind turbines. The conducted research relies on experimental data obtained for an electro-thermal deicing IPS to determine heater zones and required ice accretion times to promote ice shedding with assistance of centrifugal loads which must overcome cohesive forces between the accreted ice in adjacent heater zones.
The research introduces designed guidelines and testing approaches needed for the design of an electro-thermal deicing IPS for wind turbines. The design process begins with predicted values of power density requirements and then relies on experimental results to verify and quantify critical parameters such as ice accretion rates, minimum power densities and required loads to promote cohesive failure between adjacent zones. Representative icing conditions were selected and guided by Federal Aviation Administration Regulations, Appendix C icing conditions typical of aircraft environments. The goal of the ice protection research for wind turbines is to develop methodology to design such deicing systems. A generic 1.5 MW wind turbine is used to describe the design process. Power limitations on the wind turbine (100 kW) were set as a priority. Shedding times were also enforced (30 s from the initialization of the heaters).
The following tasks are pursued to develop an electro-thermal deicing system design methodology.
- a.
The ice accretion thickness rate must be quantified for several icing conditions to develop a time controller for the heaters. In the field, ice thickness sensors should be used to determine the ice accretion rate. In this research, the ice accretion rate to the scaled blades tested at varying conditions was used to describe the design process of a potential heater controller.
- b.
The minimum ice thickness needed to promote effective ice shedding by overcoming cohesive bonding between span-wise zones must be experimentally quantified. The quantification of the cohesive ice adhesion strength of varying types of ice is experimentally accomplished in this research by accreting representative ice shapes.
- c.
Lastly, power density variations must be explored to quantify the change in shedding times and to enforce the maximum shed time of 30 s, effectively minimizing power density and energy requirements.
The paper first introduces the experimental set-up and testing methodology, to then provide results on the abovementioned objectives.
3.1 Facility overview
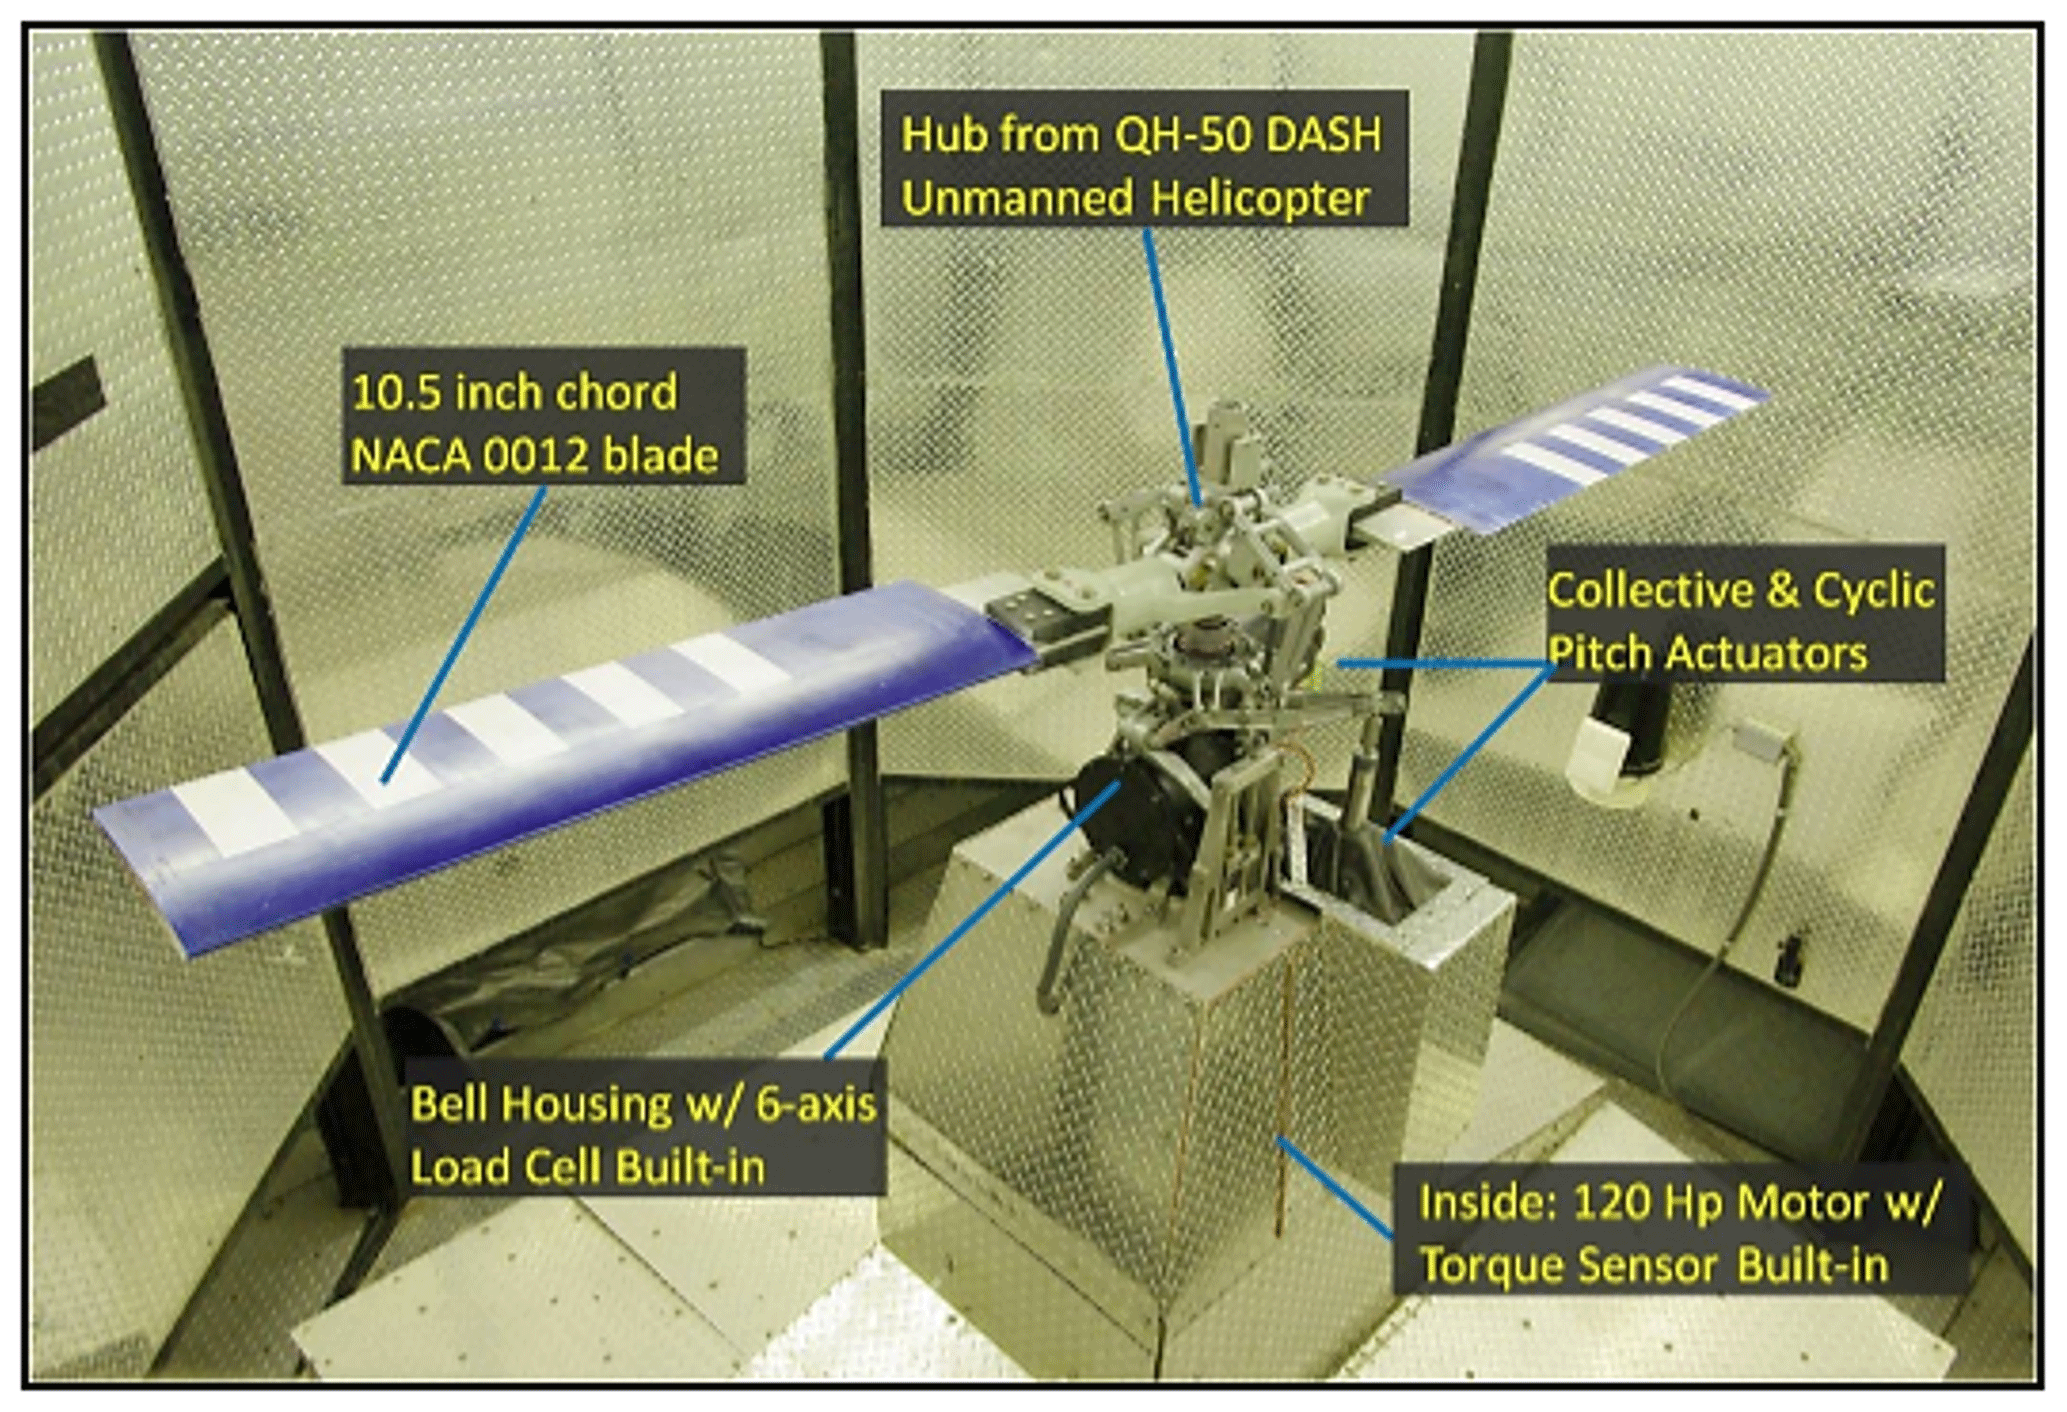
The Adverse Environment Rotor Test Stand (AERTS) was designed and constructed at the Vertical Lift Research Center of Excellence at The Pennsylvania State University (Palacios et al., 2012). A photograph of the facility equipped with NACA 0012 test blades is exhibited in Fig. 4. This photograph shows the QH-50 DASH Hub, 125 HP motor with a built-in torque sensor, Bell Housing with six-axis load cell, and the collective/cyclic pitch actuators. The hub was donated by the Gyrodyne Helicopter Historical Foundation. The QH-50D is a co-axial UAV designed for the navy in the early 1950s. The test stand is surrounded by an octagonal ballistic wall. The surrounding walls of the freezer have dimensions of 6 m × 6 m × 3.5 m.
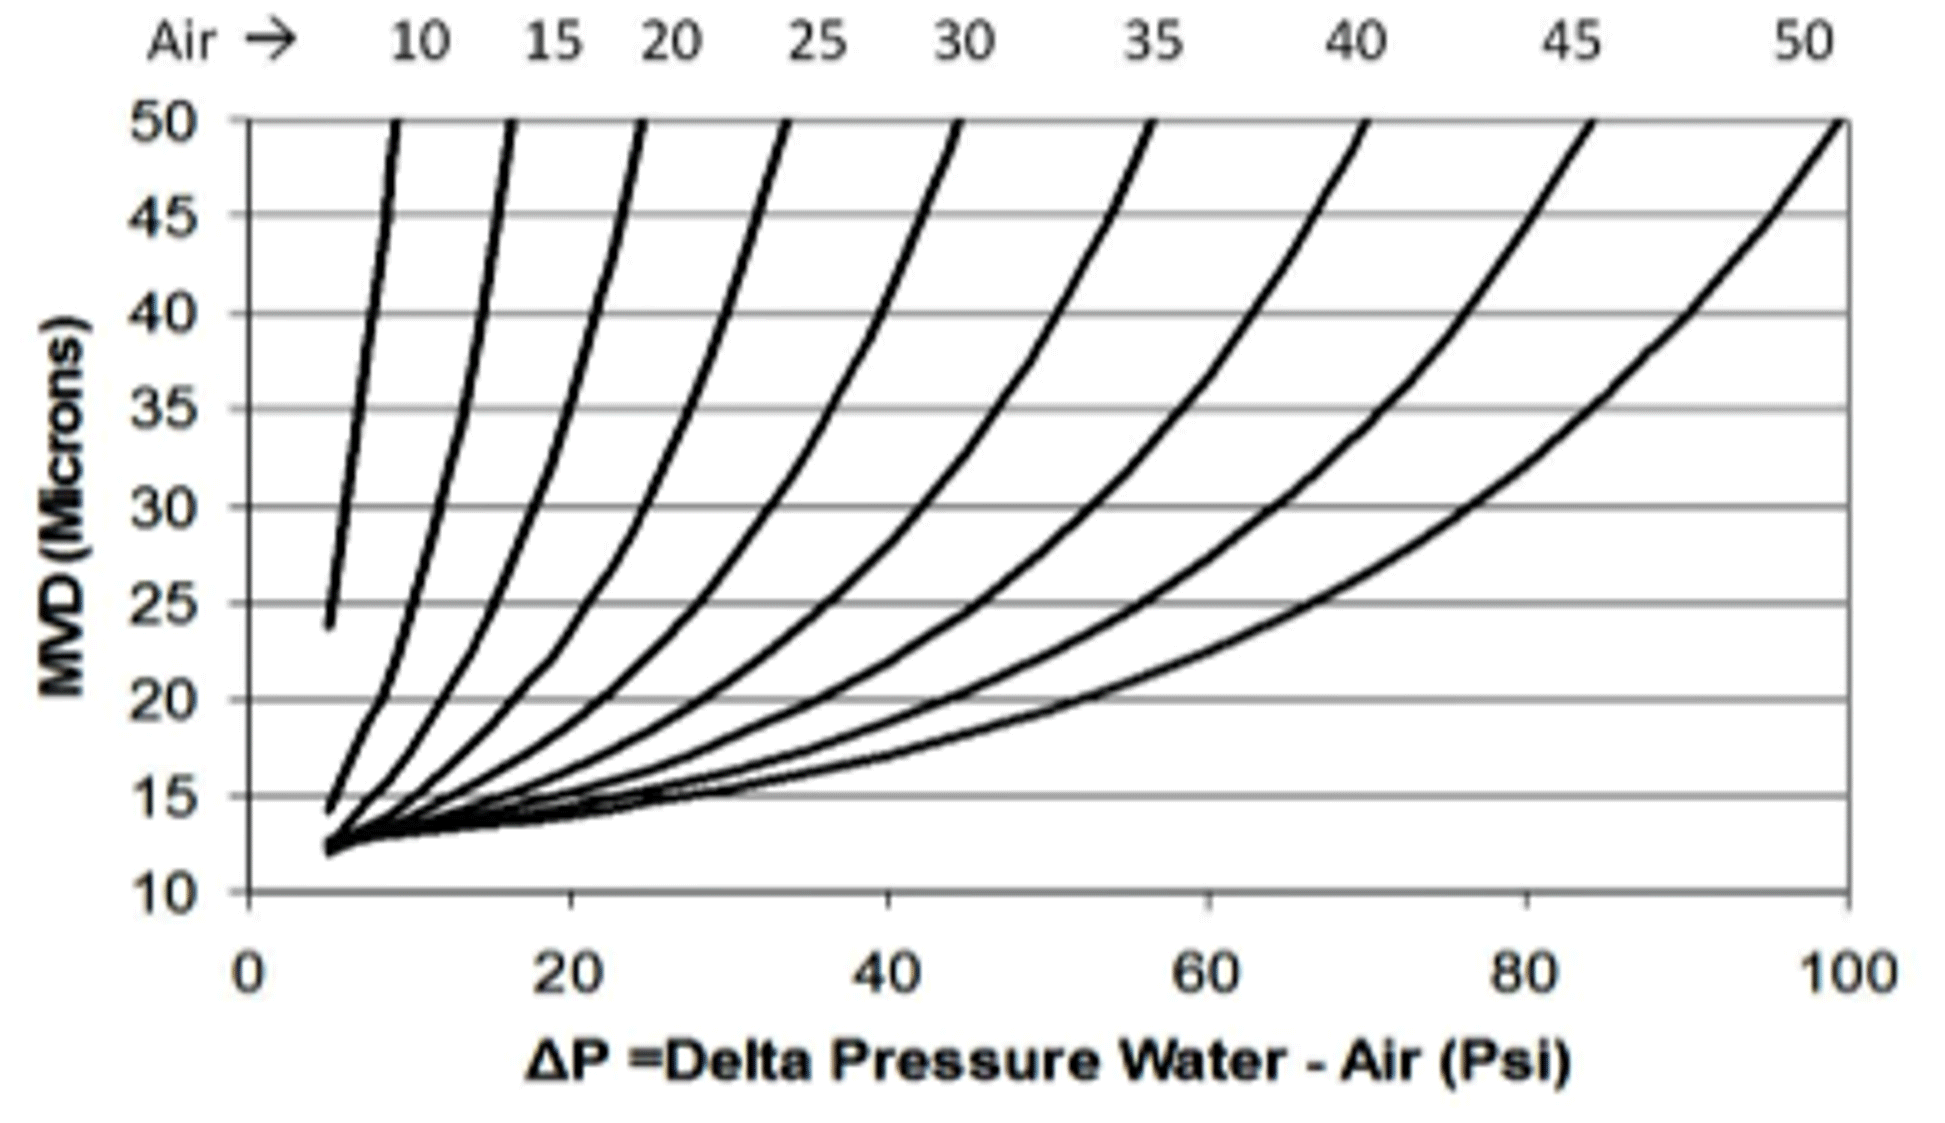
The chamber is cooled by a 10 HP compressor–evaporator system with controllable temperatures between −25 and 0 ∘C. The rotor can achieve RPMs up to 1600. The six-axis load cell measures forces and moments, while the torque sensor monitors the torque provided from the motor. The standard icing nozzles are donated by the NASA Icing Research Tunnel and are installed on the ceiling of the chamber. The nozzles are arranged in two concentric rings containing five nozzles on the inner ring and 10 nozzles on the outer ring. The nozzle system operates by aerosolizing water droplets with a combination of air and water at precise pressures (Ide and Oldenburg, 2001). The nozzle calibration curve is presented in Fig. 5, which depicts the MVD of the droplet on the y axis in microns and air pressure differential on the x axis in pounds per square inch.
3.2 Blade configuration
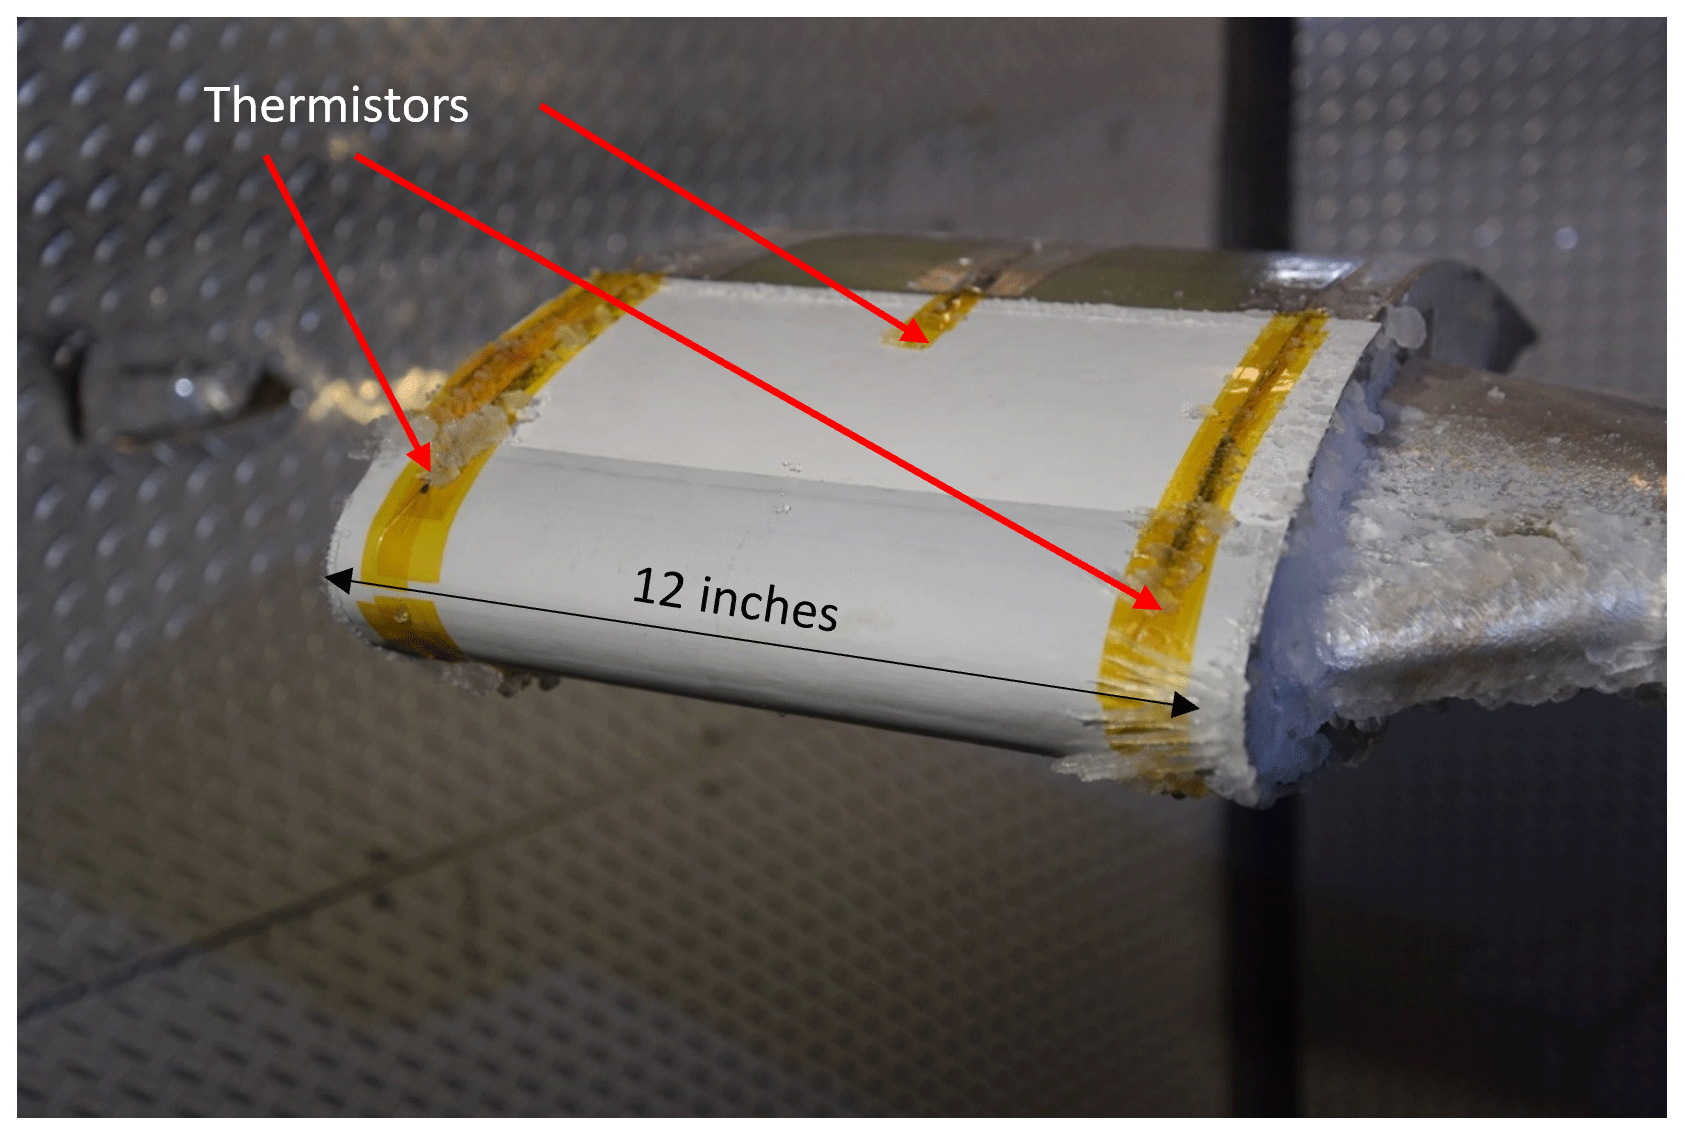
The deicing design procedure presented for a wind turbine needs to have a testing blade that is representative of that of wind turbine configurations. The selection of the blade shape was done based on the work conducted by Blasco et al. (2017), who conducted detailed aerodynamic analysis to ensure that the selected scaled bade sections would be representative of a 1.5 MW wind turbine blade. A full-scale chord section would easily fit in the testing facility. A scaled wind turbine airfoil section of a full-scale representative 1.5 MW turbine was used during testing. The airfoil at the tip of the rotor blade tested has a 72.4 cm (28.5 in.) chord with a span of 30.48 cm (12 in.). This airfoil represented a half-scale shape with respect to a representative 1.5 MW wind turbine section at 80 % span as described by Blasco et al. (2017). The DU 93-W-210 airfoil with the carrier blade amounts to a 139.7 cm (55 in.) total span to the rotation axis. The physical dimensions of the rotor test blade are illustrated in Fig. 6 (Blasco et al., 2017; Han and Palacios, 2013). All rotor blade tests were conducted at 0∘ angle of attack (AoA). Figure 7 is a photograph of the test blade. The leading edge of the heating elements is protected by an erosion tape with thermistors underneath. The span width of the heaters is slightly oversized in efforts to prevent ice bridging.

3.3 Testing methodology
Starting with the premise that an electrothermal deicing system can delaminate accreted ice, the capability to remove de-bonded ice by centrifugal forces must be assessed. Unlike propellers or helicopter blades, the RPM of wind turbines (and therefore the centrifugal forces) is of a lesser value. Ice removal via ice layer delamination occurs before the ice cohesive strength of the ice (span direction) exceeds the stress created by centrifugal forces acting on the de-bonded ice. In further detail, when an outboard heater section is turned on such that an ice layer zone is delaminated, this delaminated ice section could remain attached to the non-delaminated in-board ice layer due to its cohesion in the span direction. For this reason, quantifying the cohesive strength of ice is critical. The type of ice accreted influences its cohesive strength. Reproducing representative types of ice (rime vs. glaze for example) is required to quantify cohesive stresses for such ice.
The testing presented in this paper uses half-scale airfoils. If full-scale wind turbine representative conditions would be created on a half-scale airfoil, the ice shapes (and type of ice) accreted would not be representative of a full-scale blade. Matching ice shapes are needed to quantify cohesive ice strength. Ice accreted to the half-scale airfoil must mimic the ice shape accreted to the full-scale blade. Ice scaling laws provided by Bond et al. (2004) allow the reproduction of ice shapes of full-scale airfoils on scaled airfoils by varying the icing conditions to account for the changes in the collection efficiency of the scaled airfoil. Icing scaling laws modify the ice accretion time, the water droplet size, the liquid water content of the cloud and the environment temperature to ensure matching ice shapes. The applicability of these scaling laws to rotor blades was experimentally demonstrated by Palacios et al. (2012) in the AERTS chamber. Scaling laws require scaling of the droplet size, the liquid water content of the cloud, the impact velocity and the temperature. It must be mentioned that icing envelopes for wind turbines are not available to the authors' knowledge. The ice shapes selected for this research follow low-altitude aircraft icing representative shapes. It is not the goal of the effort to match ice shapes with respect to a specific wind turbine, but rather to provide guidelines for the design of electro-thermal ice protection systems, which require experimental quantification of ice cohesive failure for the varying types of ice accreted to the turbine.
With representative ice shapes and types of ice on the half-scale tested airfoil, ice cohesion strength can be measured. For a given ice thickness of ice with a measurable cross-sectional area, it is the force required to break this ice under centrifugal forces and be measured. The ratio of the applied force over the cross-sectional area of the ice is the cohesive stress.
The next step is to provide representative centrifugal loads to remove the de-bonded ice. Since the ice shapes are scaled, the mass of the accreted ice is also reduced with respect to the full-scale blade. To experimentally generate comparable centrifugal loads on the accreted ice, the testing RPM during shedding must be increased to match the centrifugal loading of the selected full-scale blade. Note that the RPM required to generate scaled ice shapes and the RPM needed to match centrifugal loads are not the same. Therefore, once ice is accreted at impact velocities required for the accretion of representative ice, the RPM is increased to match centrifugal loads during the deicing process.
The RPM of the AERTS truncated rotor was adjusted to match the centrifugal loads of the full-scale wind turbine at varying span locations. The specific cloud conditions are described in the next section. A cloud density of 0.917 g/cm3 was selected for testing. The density value was selected as it is included in the FAR Appendix C icing envelope, and it is also representative of that seen on wind turbines. It must be noted that FAR Appendix C icing envelopes were developed for aircraft, and their applicability to wind turbine icing is an estimation in lieu of wind turbine icing envelopes currently unavailable. Water content conditions used are typical of glaze ice condition that can be reproduced in other facilities, such as the NASA Glenn Icing Research Tunnel (Vargas et al., 2005).
In summary, the proposed testing method first requires scaling the icing conditions to provide representative ice shapes on the half-scale blade used compared to the full-scale blade (in an attempt to test representative types of ice and shapes). Secondly, reproduced the centrifugal forces on the accreted ice of the half-scale blade must match those of a full-scale wind turbine, requiring a different RPM than that used to accrete the ice.
To calculate the required RPM to match centrifugal loads of a full-scale wind turbine, the mass of the ice shape had to be quantified. Firstly, the cross-sectional area of the ice shapes was photographed after each test. A metal hot plate was used to smoothly cut any three-dimensional ice features at the tip of the blade. A perpendicular plane against the 2D ice shape was obtained. The photograph contained a scale used to digitize the image (process described by Schneeberger et al., 2018). The estimated cross-sectional area of the accreted ice was quantified. An example of this digitalization approach is shown in Fig. 8.
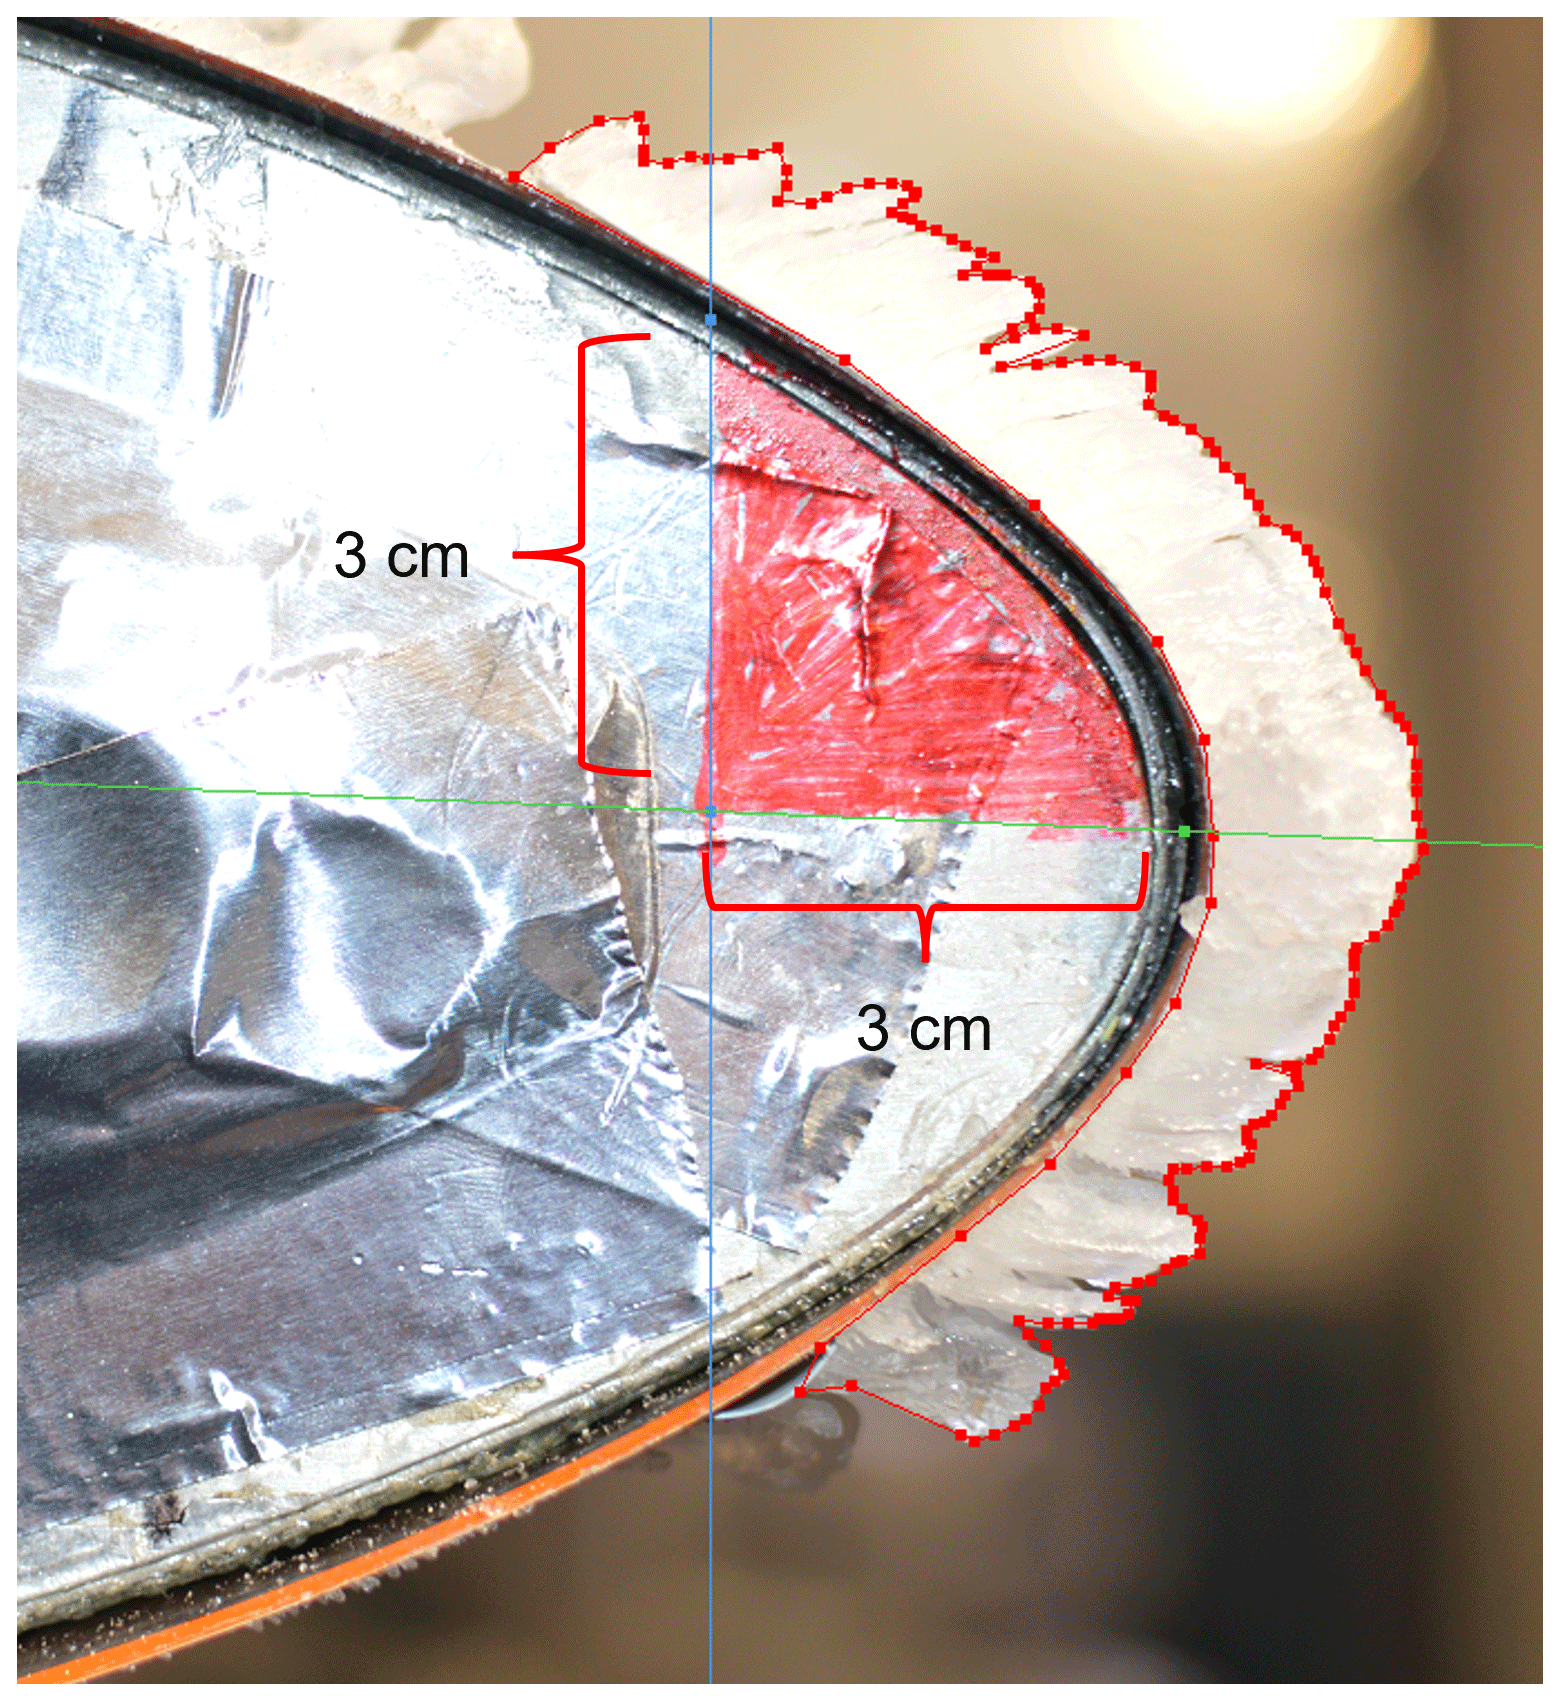
In this picture, the x and y axes (legs of leading-edge right triangle colored in red) are 3 cm in length. The estimated ice area of the polygon for the specific test shown is 10.86 cm2, and the perimeter of the selected 2D ice area is 29.89 cm. Secondly, given density and the length of the protected airfoil (30.48 cm), the estimated ice mass is 303.54 g. The assumed ice masses were calculated for these experiments as per Eqs. (1) and (2).
The centrifugal forces on the wind turbine and the AERTS facility were equated for a given span location on the full-scale blade. Then the appropriate rotational velocity parameter for the AERTS facility was obtained. Equations (3)–(5) summarize the process.
3.3.1 Other assumptions
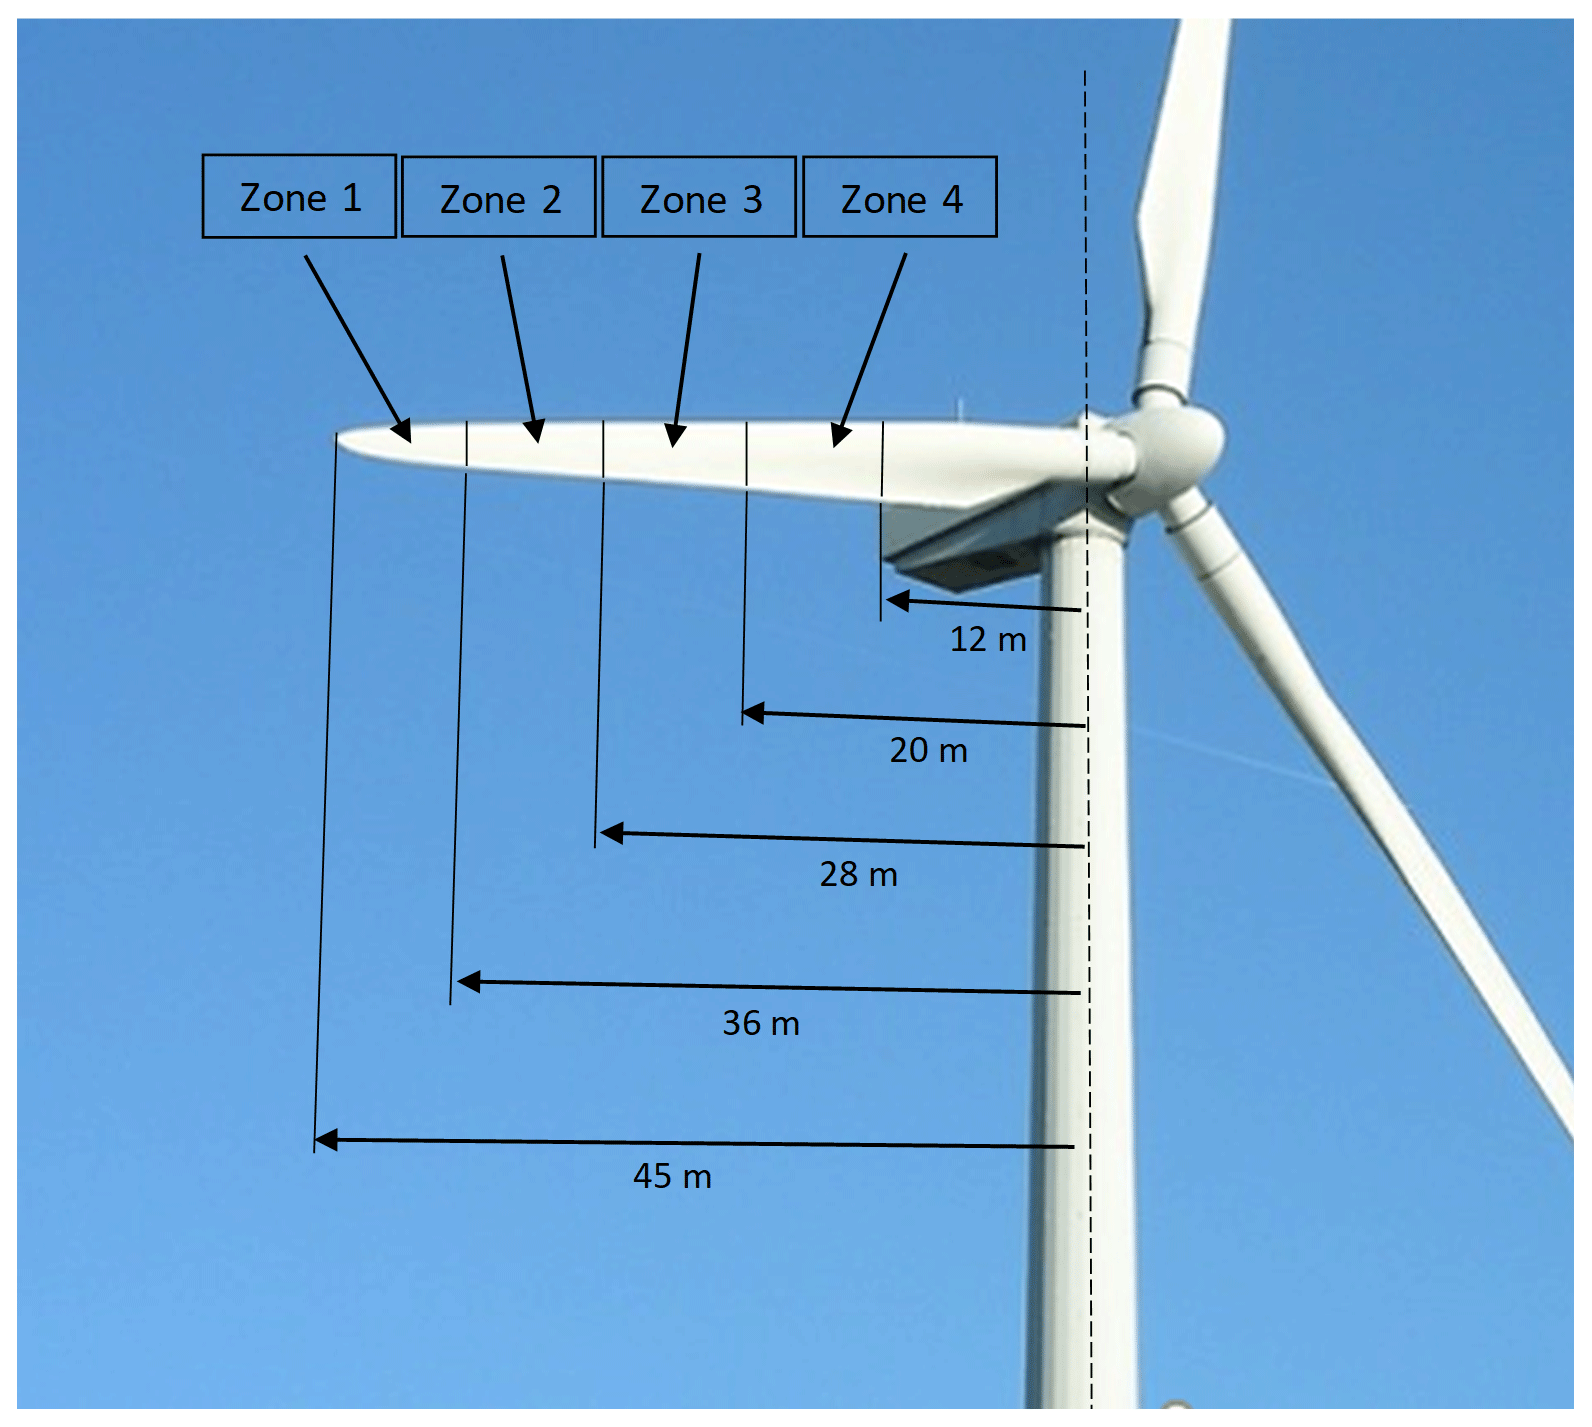
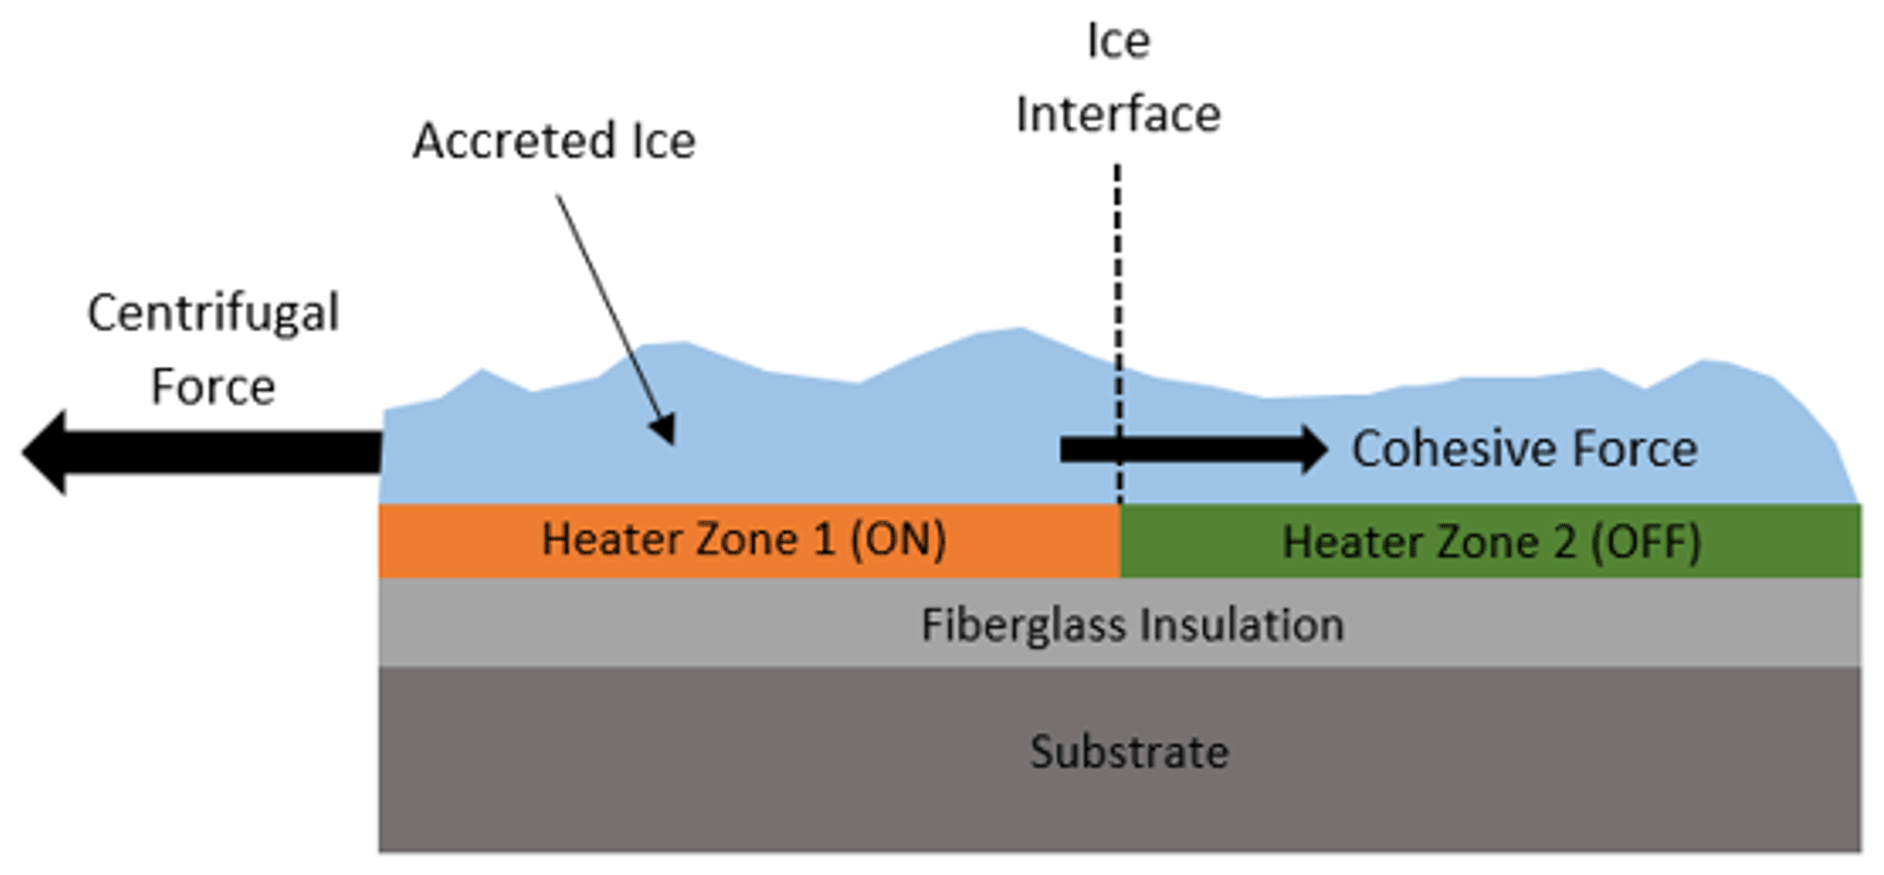
The IPS heater configuration must be designed in the scope of operator requirements and restrictions. Assumptions were made in the design effort presented in this paper. The maximum allowed power for the IPS is set to 100 kW. As will be shown, the power limitation makes it impossible to protect the entire leading-edge surface of the blades, forcing us to partition the deicing system to ensure that sufficient power densities are available. Such partitions further justified the need for quantification of the cohesive strength of the accreted ice as described in prior sections. Based on initial LEWICE models, each turbine blade had to have four span-wise heater sections beginning at 26.7 % span from the root of the rotor blade and ending at 97.7 % span. The span percentages chosen for experimental representation correspond to the beginning of each heater section. A schematic of the heater zones is illustrated in Fig. 9. These span partitions allow cohesive bonding of ice between zones to play a role in the ice shedding events. The cohesion strength of the ice exceeds the centrifugal forces to shed accreted ice at a critical ice mass for a given cohesion area. Therefore, a minimal ice thickness (mass to be exact as it is linearly related to the load) exists to promote ice shedding (minimum ice thickness such that centrifugal loads are enough to exceed the cohesion strength between zones). Selecting the inner-most span location of each heater section as the point to calculate centrifugal loads for an ice shape is a conservative approach to ensure that the force generated at the inner location of the heater zone is enough to overcome cohesive forces. The load acting on the accreted ice is a distributed load that increases linearly span-wise. A schematic of the cohesive force opposing the centrifugal force is shown in Fig. 10.
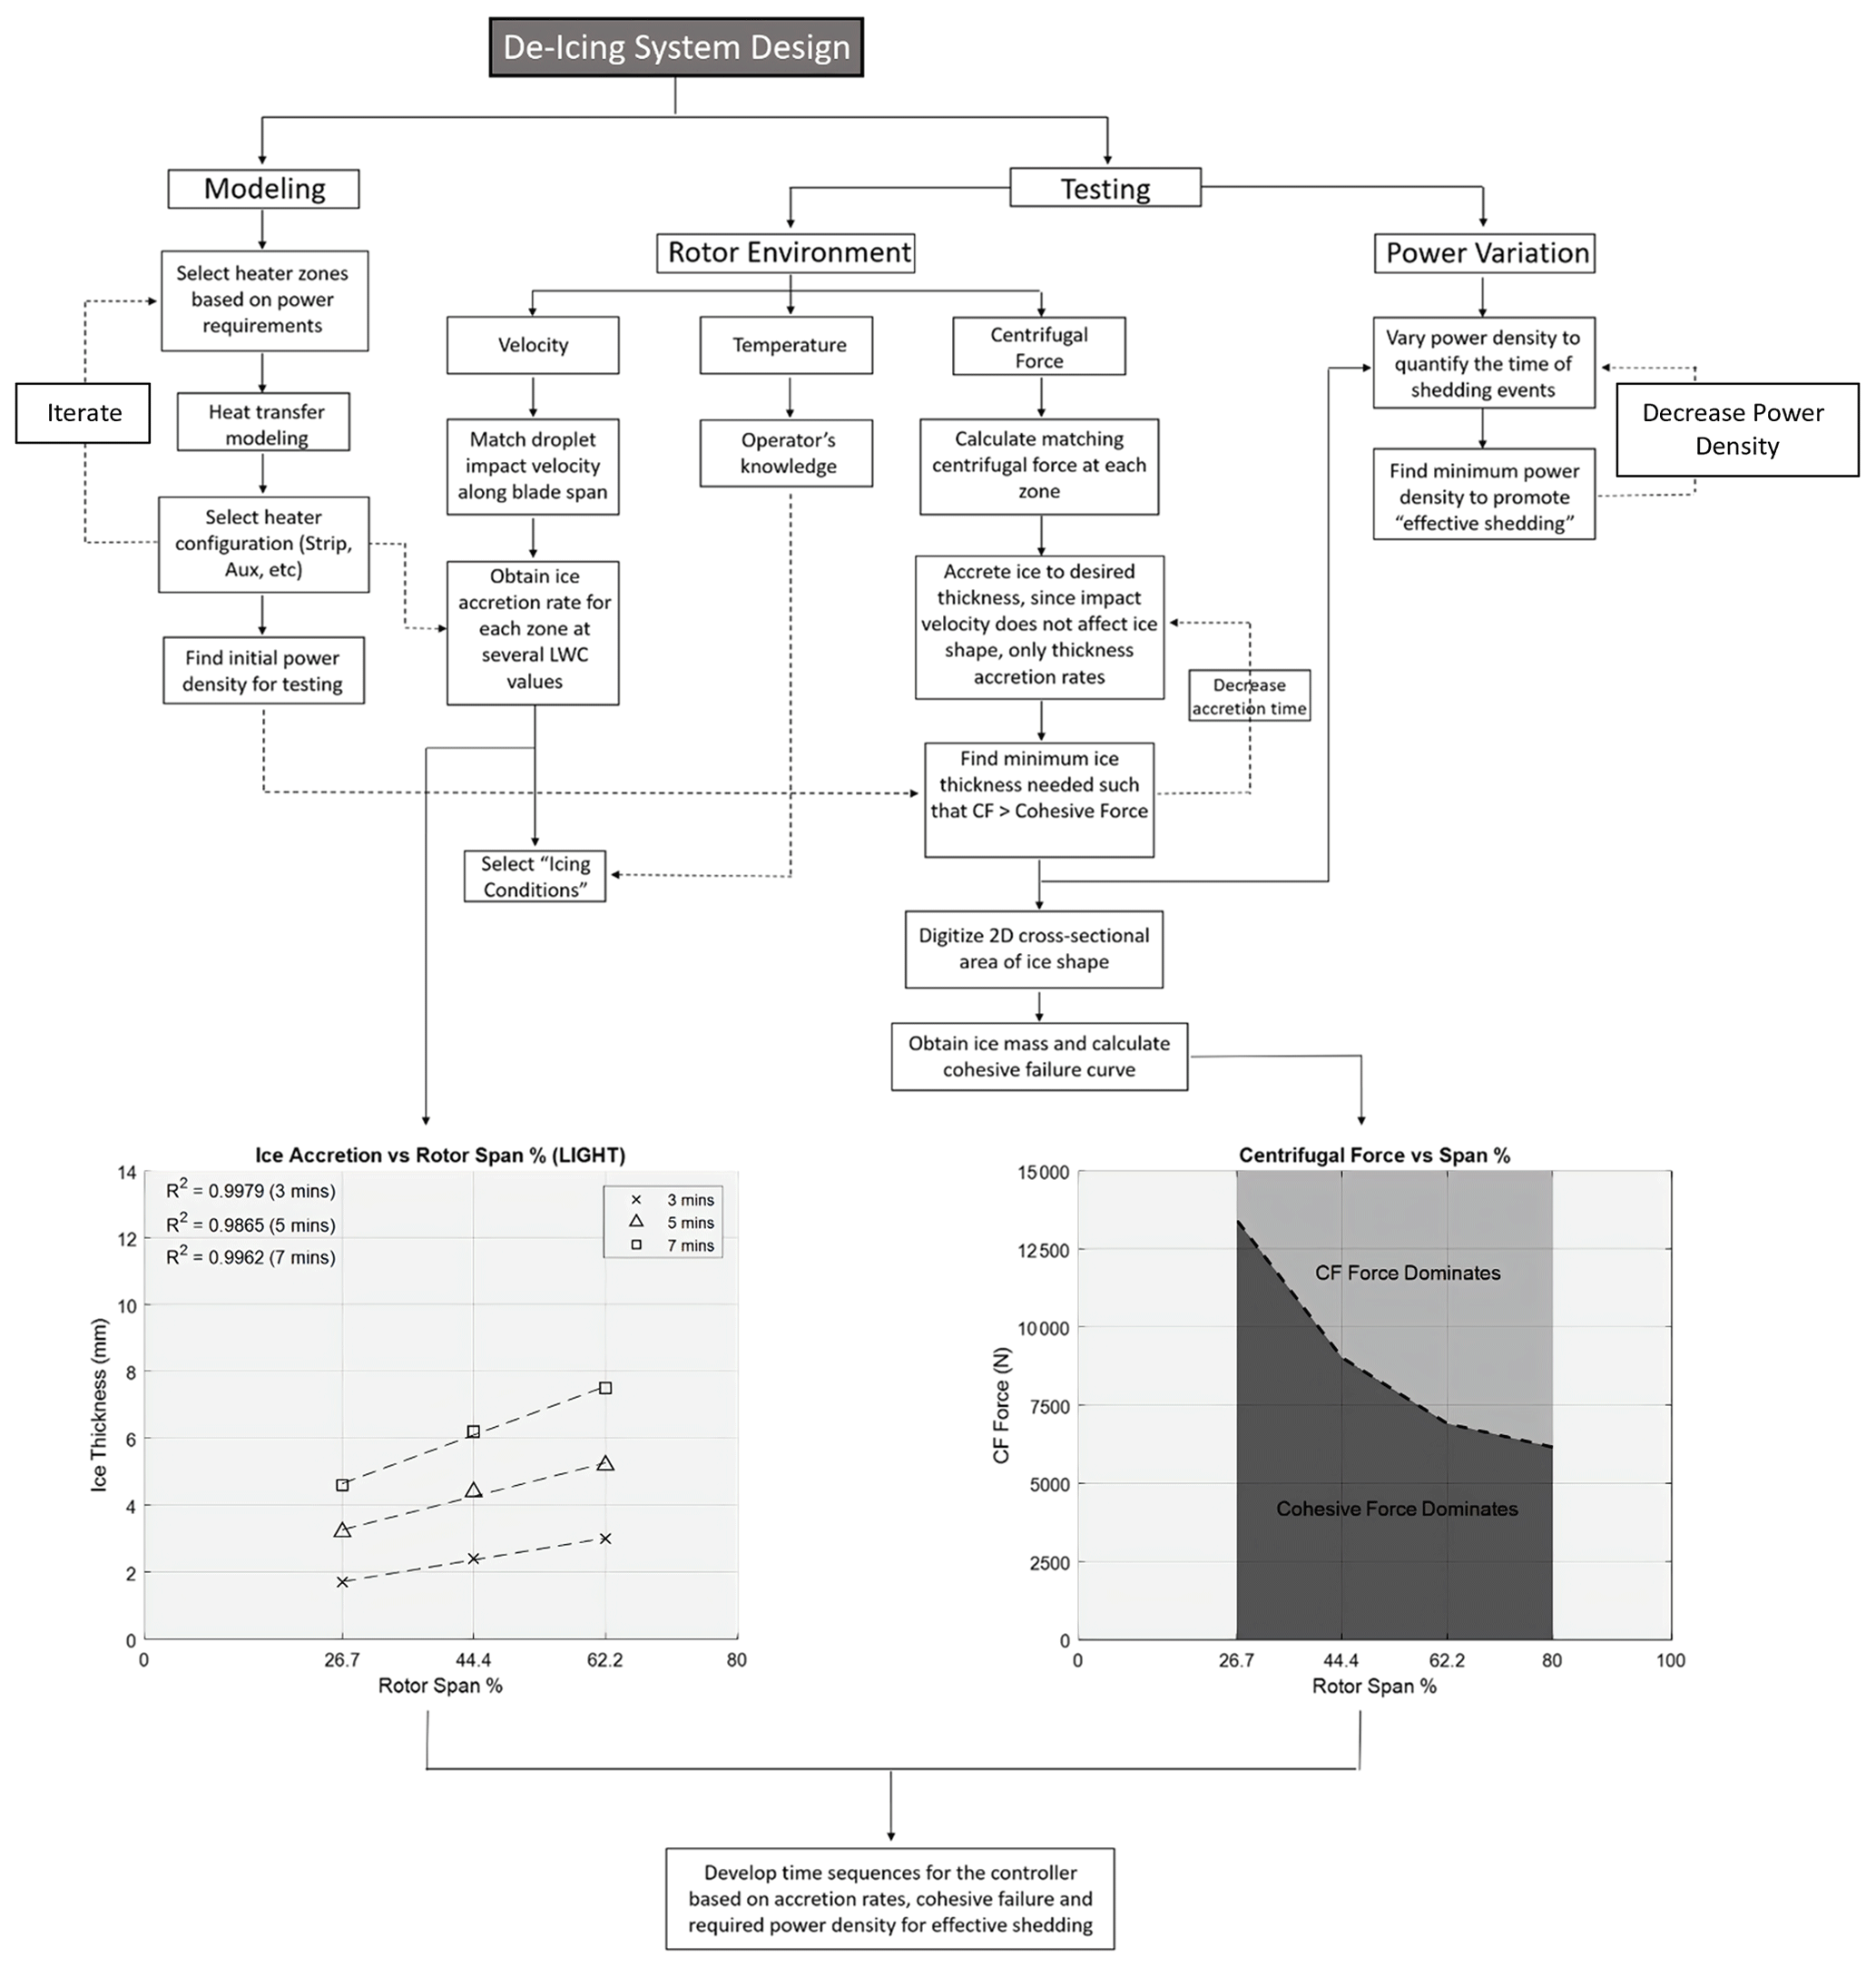
Several key parameters must be considered during the design phase of an ice protection system. A flowchart summarizing the design process for a deicing ice protection system is shown in Fig. 11. Utilizing an analytical heat transfer modeling software allowed us to establish an initial power density requirement. Based on this requirement, partition zones can be identified. The dimensions of the heater zones must be selected and modeled based on the maximum power availability reserved for the heating system. The heater configuration can be optimized by performing iterations in the modeling phase to find the lowest initial power density. This power density is then used in experimental efforts to find the minimum ice thickness needed for effective shedding, for a desired heating time (less than 30 s is used in this document) and including the effects of zone-to-zone cohesion.
Prior to testing, the 2D heater configuration was modeled in LEWICE, a NASA-developed ice accretion prediction software (Wright, 2008). The modeling results were used to obtain an initial prediction of the capability of varying power densities of the electro-thermal heaters to prevent ice accretion.
The testing phase is categorized by “rotor environment” and “power variation” experiments. To conduct these tests, the testing temperature in the cooling chamber is selected first. Rotor environment testing begins by matching the droplet impact velocity to that of the full-scale blade along the span of the rotor blade. It must be noted that icing scaling laws that modified that droplet size, liquid water content, accretion time and temperature were applied in an attempt to obtain representative ice shapes. It must also be noted that the ice accretion rate on a half-scale airfoil shape will differ from that of a full-scale airfoil, as the collection efficiency of the bodies is different. These initial tests identify the ice accretion rate for a half-scale airfoil along the span of the rotor blade for various LWC values at representative droplet impact velocities. The accretion rate to the full-scale configuration would be slower than that of the half-scale tested, but it provides a conservative estimation of the heating sequences required to de-bond the selected ice shapes.
The environment temperature provides knowledge of expected accretion rates for a given icing condition. Temperature and LWC inputs to the controller are used to select the appropriate time sequence to the heaters as the accretion rate is known, allowing ice to grow to a desired minimum thickness.
Once representative ice has formed to the half-scale airfoil, the centrifugal force acting on the ice shape must match the centrifugal force of the full-scale rotor blade span at each heater zone location. By matching ice loads, these experiments will investigate the boundary of cohesive failure between heater zones. If the ice thickness is too small, the cohesive force of the ice will dominate centrifugal forces, even if the ice–surface interface on the airfoil is melted. Therefore, there exists a minimum centrifugal force required to effectively shed the ice layer from the rotor blade (or ice mass for a given RPM).
During these tests, ice is accreted to a desired thickness. Then the rotor stand spins to the appropriate RPM that matches the full-scale centrifugal load of the inner-zone location of the heater and delivers the selected power density to the heater obtained in the modeling phase. If the ice layer sheds in less than the allocated heating time (30 s), the next test will decrease the accretion time, which decreases the ice mass. The objective is to find the minimum ice thickness needed for “effective” shedding at each heater zone location. After the minimum thicknesses are found, the 2D cross-sectional area of ice is digitized to obtain the ice mass and calculate the centrifugal force.
The final set of experiments introduce power variation to the heaters. These experiments quantify the time of the shedding events as power density is decreased.
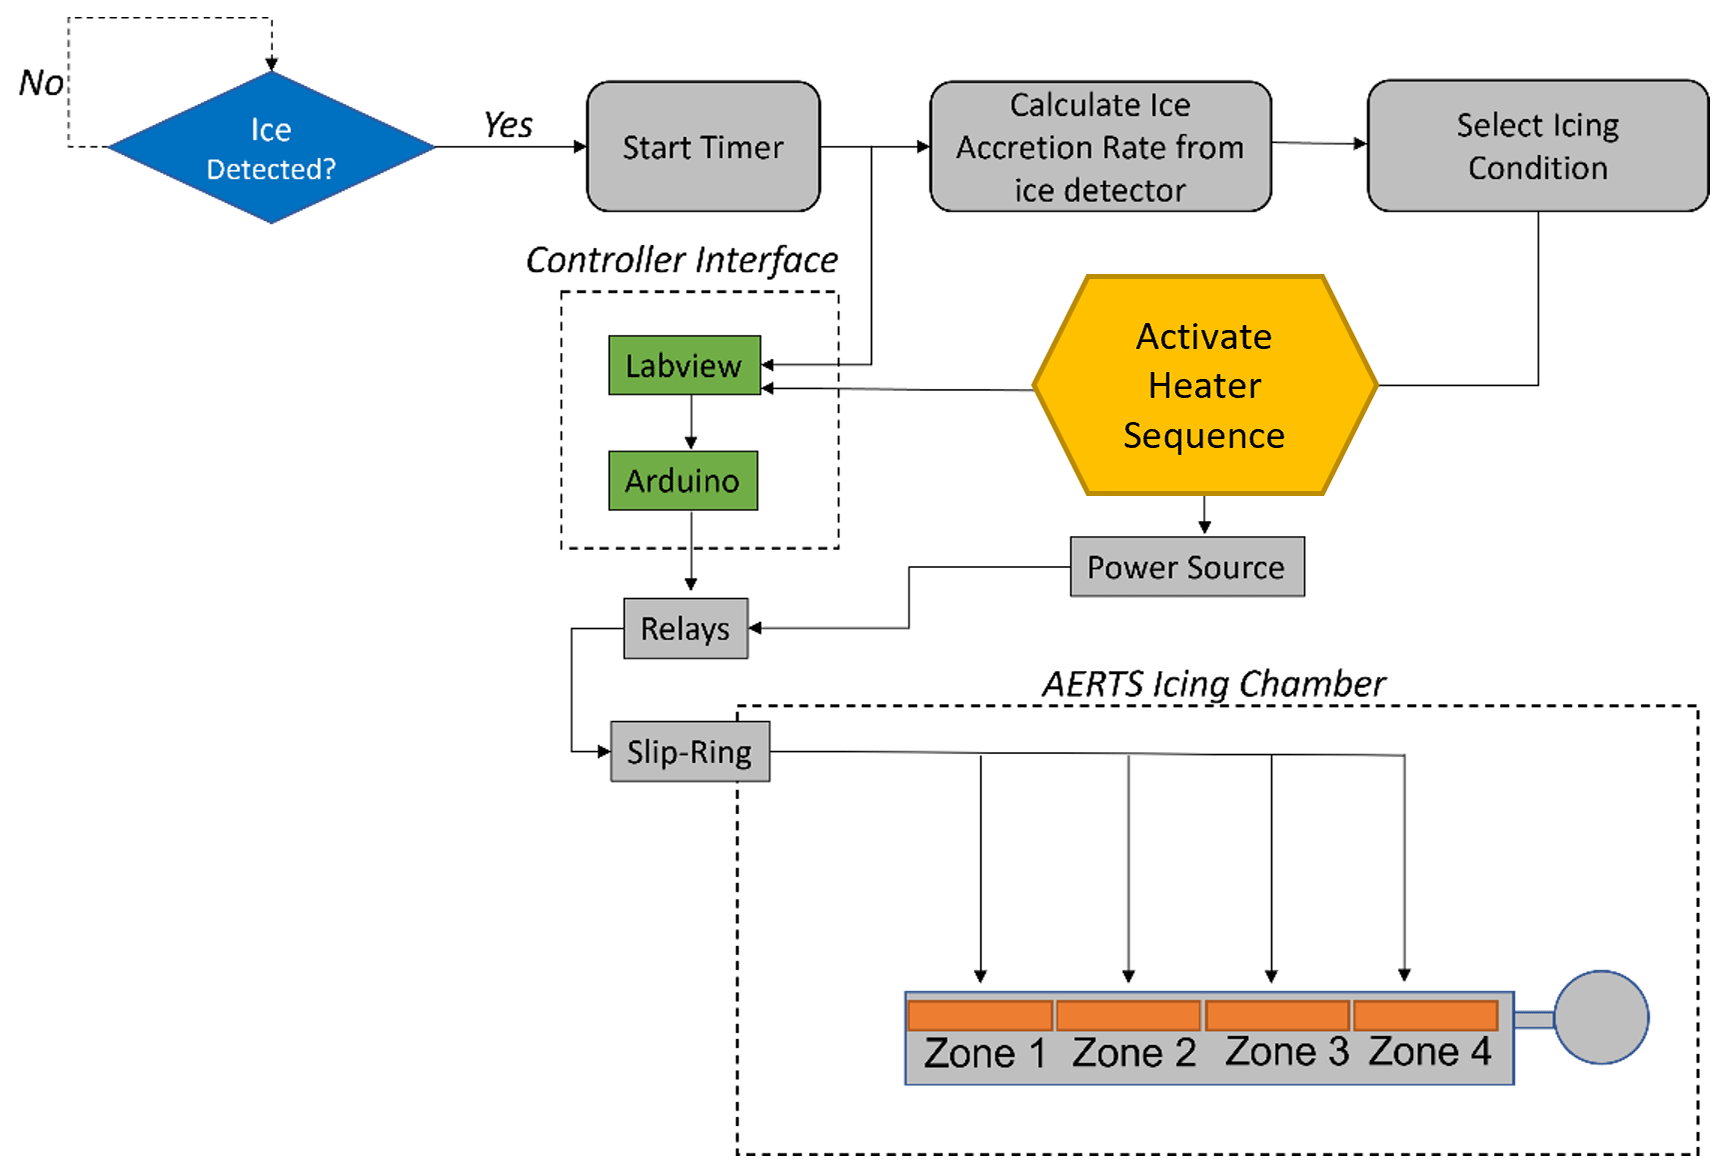
Lastly, the information gathered through this design process produces the capability to design time sequences for each icing condition explored. The time sequences are used by the controller after ice is detected at a given icing condition. As an example of implementation, once ice is detected by ice accretion sensors, a timer begins, and the ice thickness detector will read a thickness after 1 min (Liu et al., 2017). The ice accretion rate will determine the icing condition, and the appropriate heater sequence is activated. Details on the steps taken to design the heater controller sequence are described in detail in the next sections. Note that in this research, the ice accretion rates used to demonstrate the design process were those of the half-scale airfoil and not those of a full-scale configuration. In the field, an ice thickness detection system would be required to estimate the ice accretion rate.
5.1 Ice accretion thickness
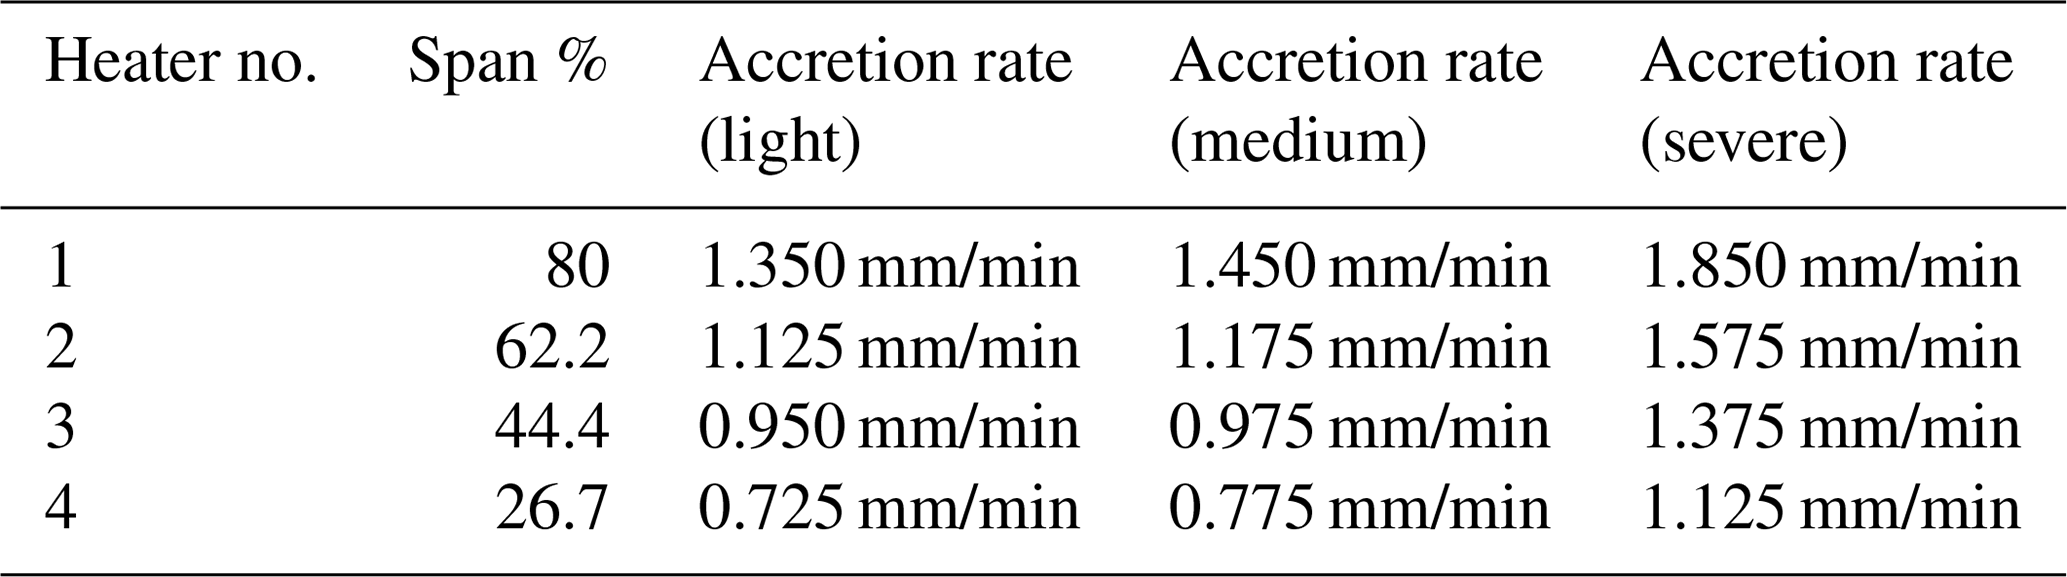
The objective of these tests was to find the ice accretion rate (slope of ice thickness over time) along the span of the rotor blade at three different icing conditions for the half-scale airfoil. Data from these experiments play a role in the design of the deicing time sequence controller. A light icing condition was triggered by a 0.2 g/m3 LWC and 20 µm MVD at a temperature of −8 ∘C. A medium icing condition consisted of a 0.4 g/m3 LWC and 20 µm MVD at −8 ∘C. Lastly, the 0.9 g/m3 and 35 µm MVD combination was selected for the severe icing condition. The free-stream velocity of the rotor section is summarized in Table 1. The nomenclature for the icing conditions is used throughout the deicing experiments and results.
It must be noted that the tapering and twist of production blades were ignored in this research. To develop a design procedure to design electrothermal ice protection systems for wind turbines, twist, blade AoA, taper variables and the collection efficiency reduction of a full-scale blade were ignored.
The RPM used in AERTS during ice accretion must represent the water droplet impact velocity on the wind turbine to ensure similar ice shapes and type of ice. For this study, convective cooling plays a major role in the initial stages of ice accretion. The RPM correlation in AERTS that represents the impact velocity at a chosen span percentage of a wind turbine was therefore calculated. After spinning up to the appropriate RPM, the icing cloud was turned on for three different durations: 3, 5 and 7 min. The three icing durations would experience the light, medium and severe icing conditions. The key parameters for this set of experiments are shown in Table 1.

Ice accretion testing was performed at all speeds. Note the impact velocity is linear with RPM, while the centrifugal loads are square of the RPM. Therefore, once the desired ice shape was accreted, the RPM was reduced to match centrifugal loads of the full-scale span location.
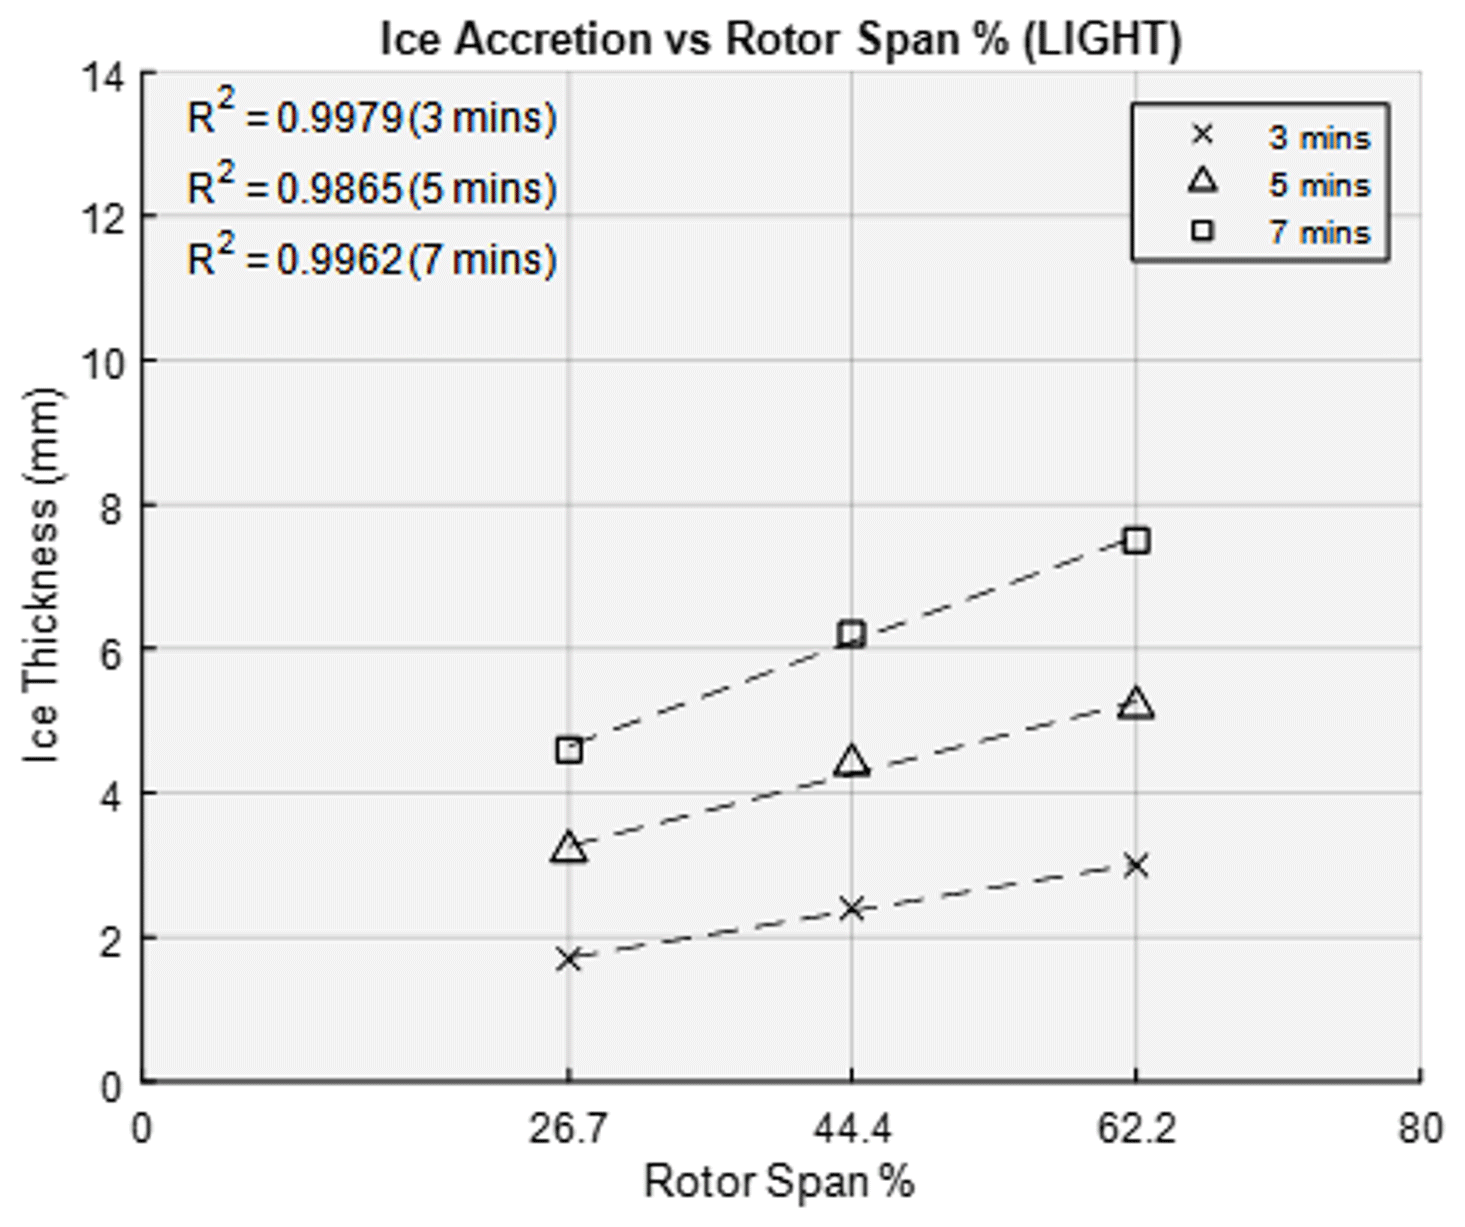
The data produced from this research, as expected for the idealized blade conditions (0 AoA, no twist, not taper), found a linear ice accretion along the span of the rotor blade. If the onset of the ice accretion is known, then the accretion rate delivers the capability to know the thickness at each span-wise heater location at any future time. The ice thickness at span percentages outside of the range, 26.7 % to 62.2 %, can be extrapolated from the data trend. The ice accretion for 3, 5 and 7 min at light icing conditions is shown in Fig. 12. The ice thickness for medium and severe icing conditions are presented in Figs. 13 and 14, respectively. The experimental measurements are used to obtain the ice accretion rate at each zone location.
In practice, an ice detection system would be required to identify the initial presence of ice on the rotor blades. After a selected time period, the ice detection sensor can measure the ice thickness, and the controller interface can calculate the ice accretion rate (Liu et al., 2017). This ice accretion rate determines the severity of the icing conditions and activates the appropriate heater sequence. The accretion rates for each zone in all the icing conditions is presented in Table 2. Interpolation between these icing conditions is possible.


It will be shown in the next section that unfortunately 80 % span deicing tests were not tested in the AERTS facility due to the potential rotor imbalance on the test stand at such RPM. At 67.86 m/s tip speeds (521 RPM), both blades would need to shed simultaneously, or the force imbalance would become too large for the rotor stand.
5.2 Minimum ice thickness for shedding – ice cohesion prevention
It is critical that the ice mass sheds in a timely manner before it becomes a hazard to the infrastructure of the wind turbine or the surroundings. Also, the allowed accreted ice mass must not produce high aerodynamic performance degradation. The following test cases identify the minimum ice thicknesses needed to promote ice shedding at each heater section. The span percentage at the origin of each heater section was selected to calculate the effective centrifugal force acting on the accreted ice. Cohesive bridging was investigated as the ice mass decreased. For shedding to occur, once the ice has de-bonded from the surface due to heating, the adhesion strength of the ice bridging surface between zones must be less than the centrifugal force pulling on the ice mass in the span-wise direction. If the ice mass is too small, the tensile adhesion strength will dominate over the centrifugal force, creating the inability to shed ice as it will remain attached to the most inner ice section that has not been de-bonded. Table 3 presents the parameters for these experiments.
Table 3Properties for minimum ice thickness shedding experiments.
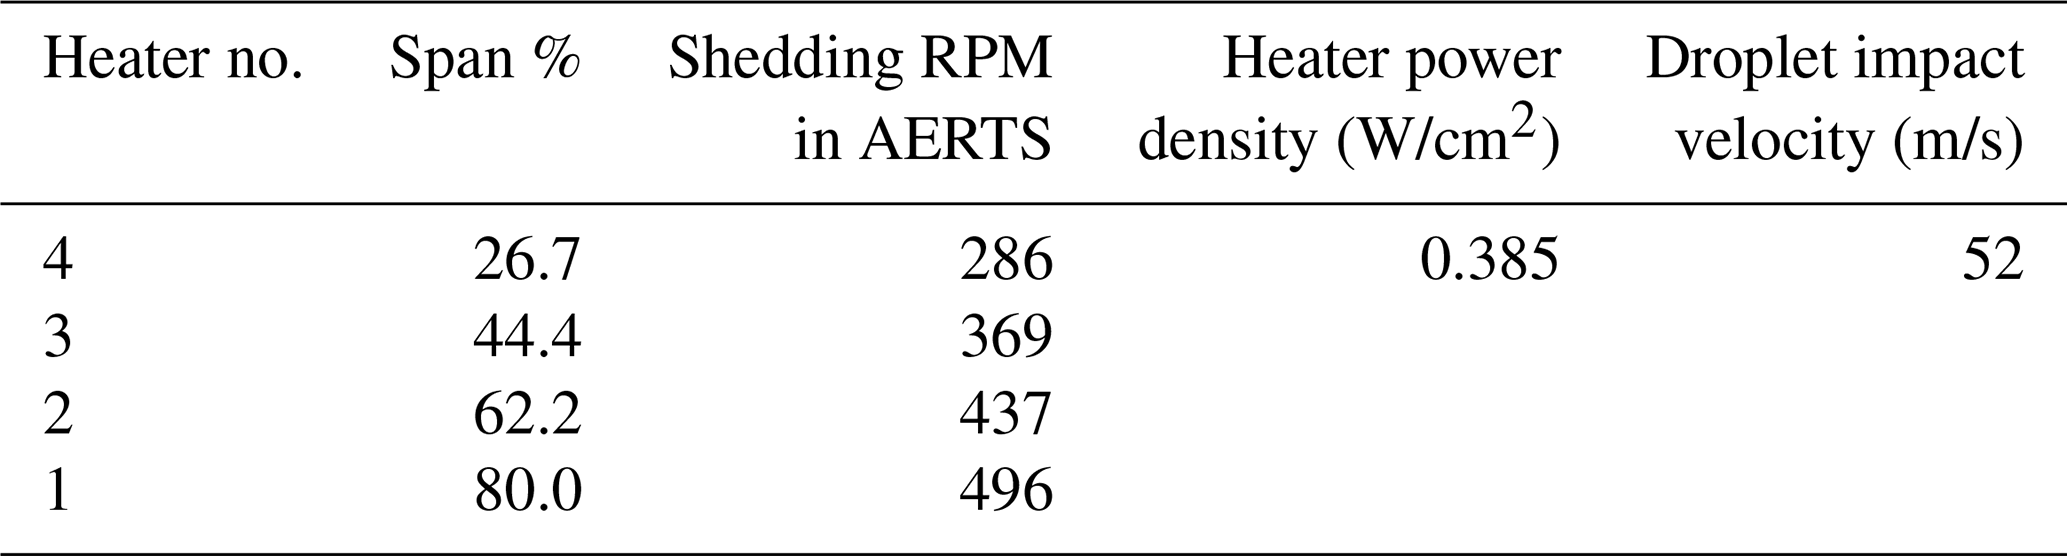
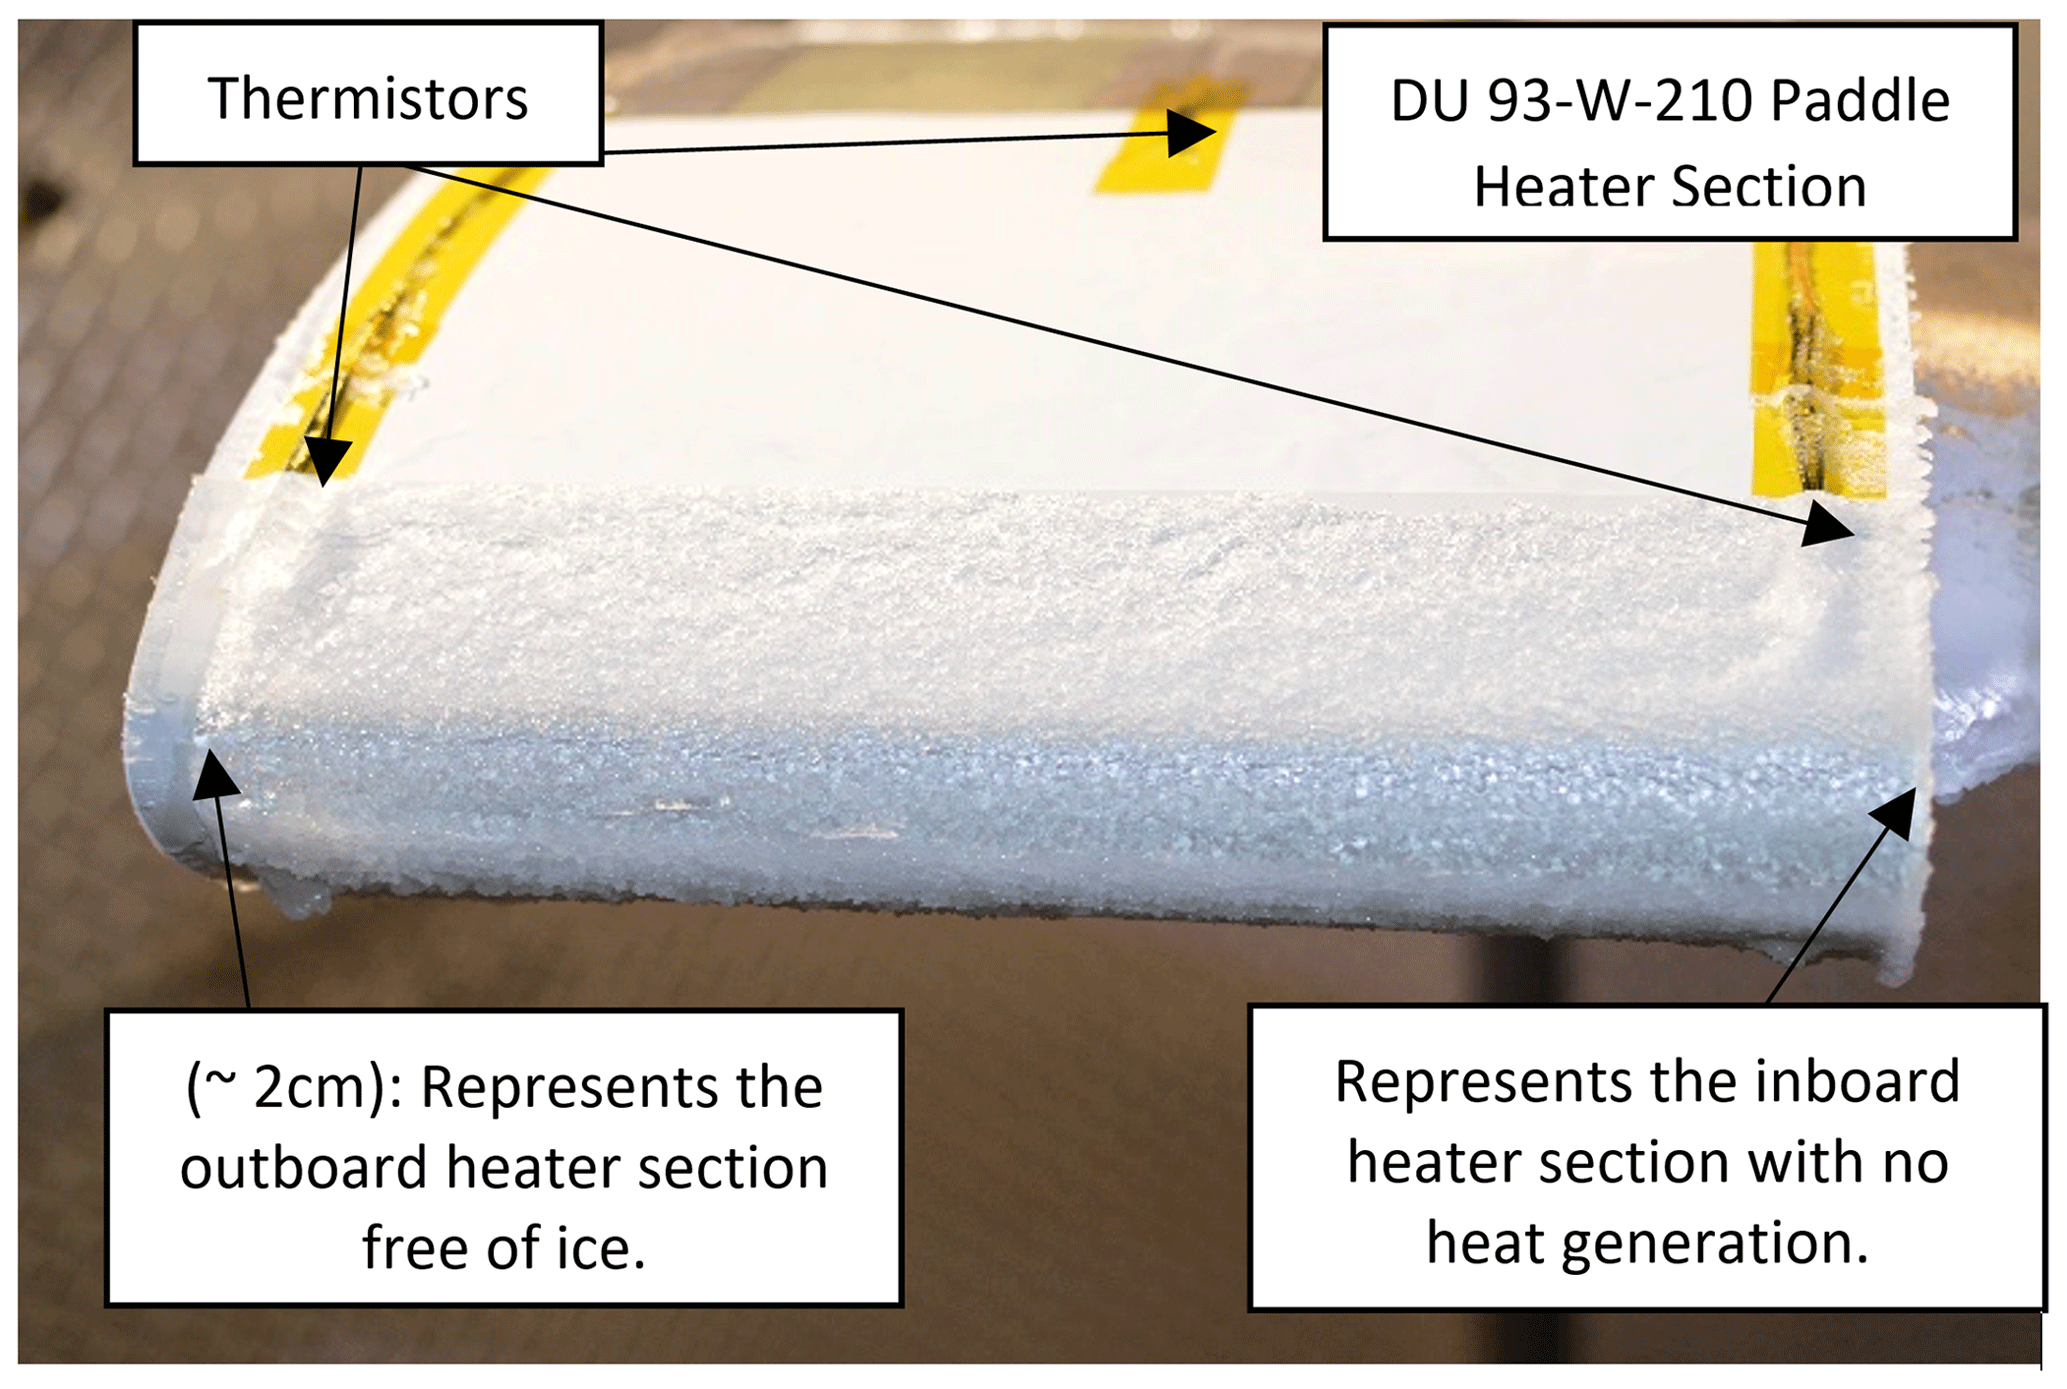
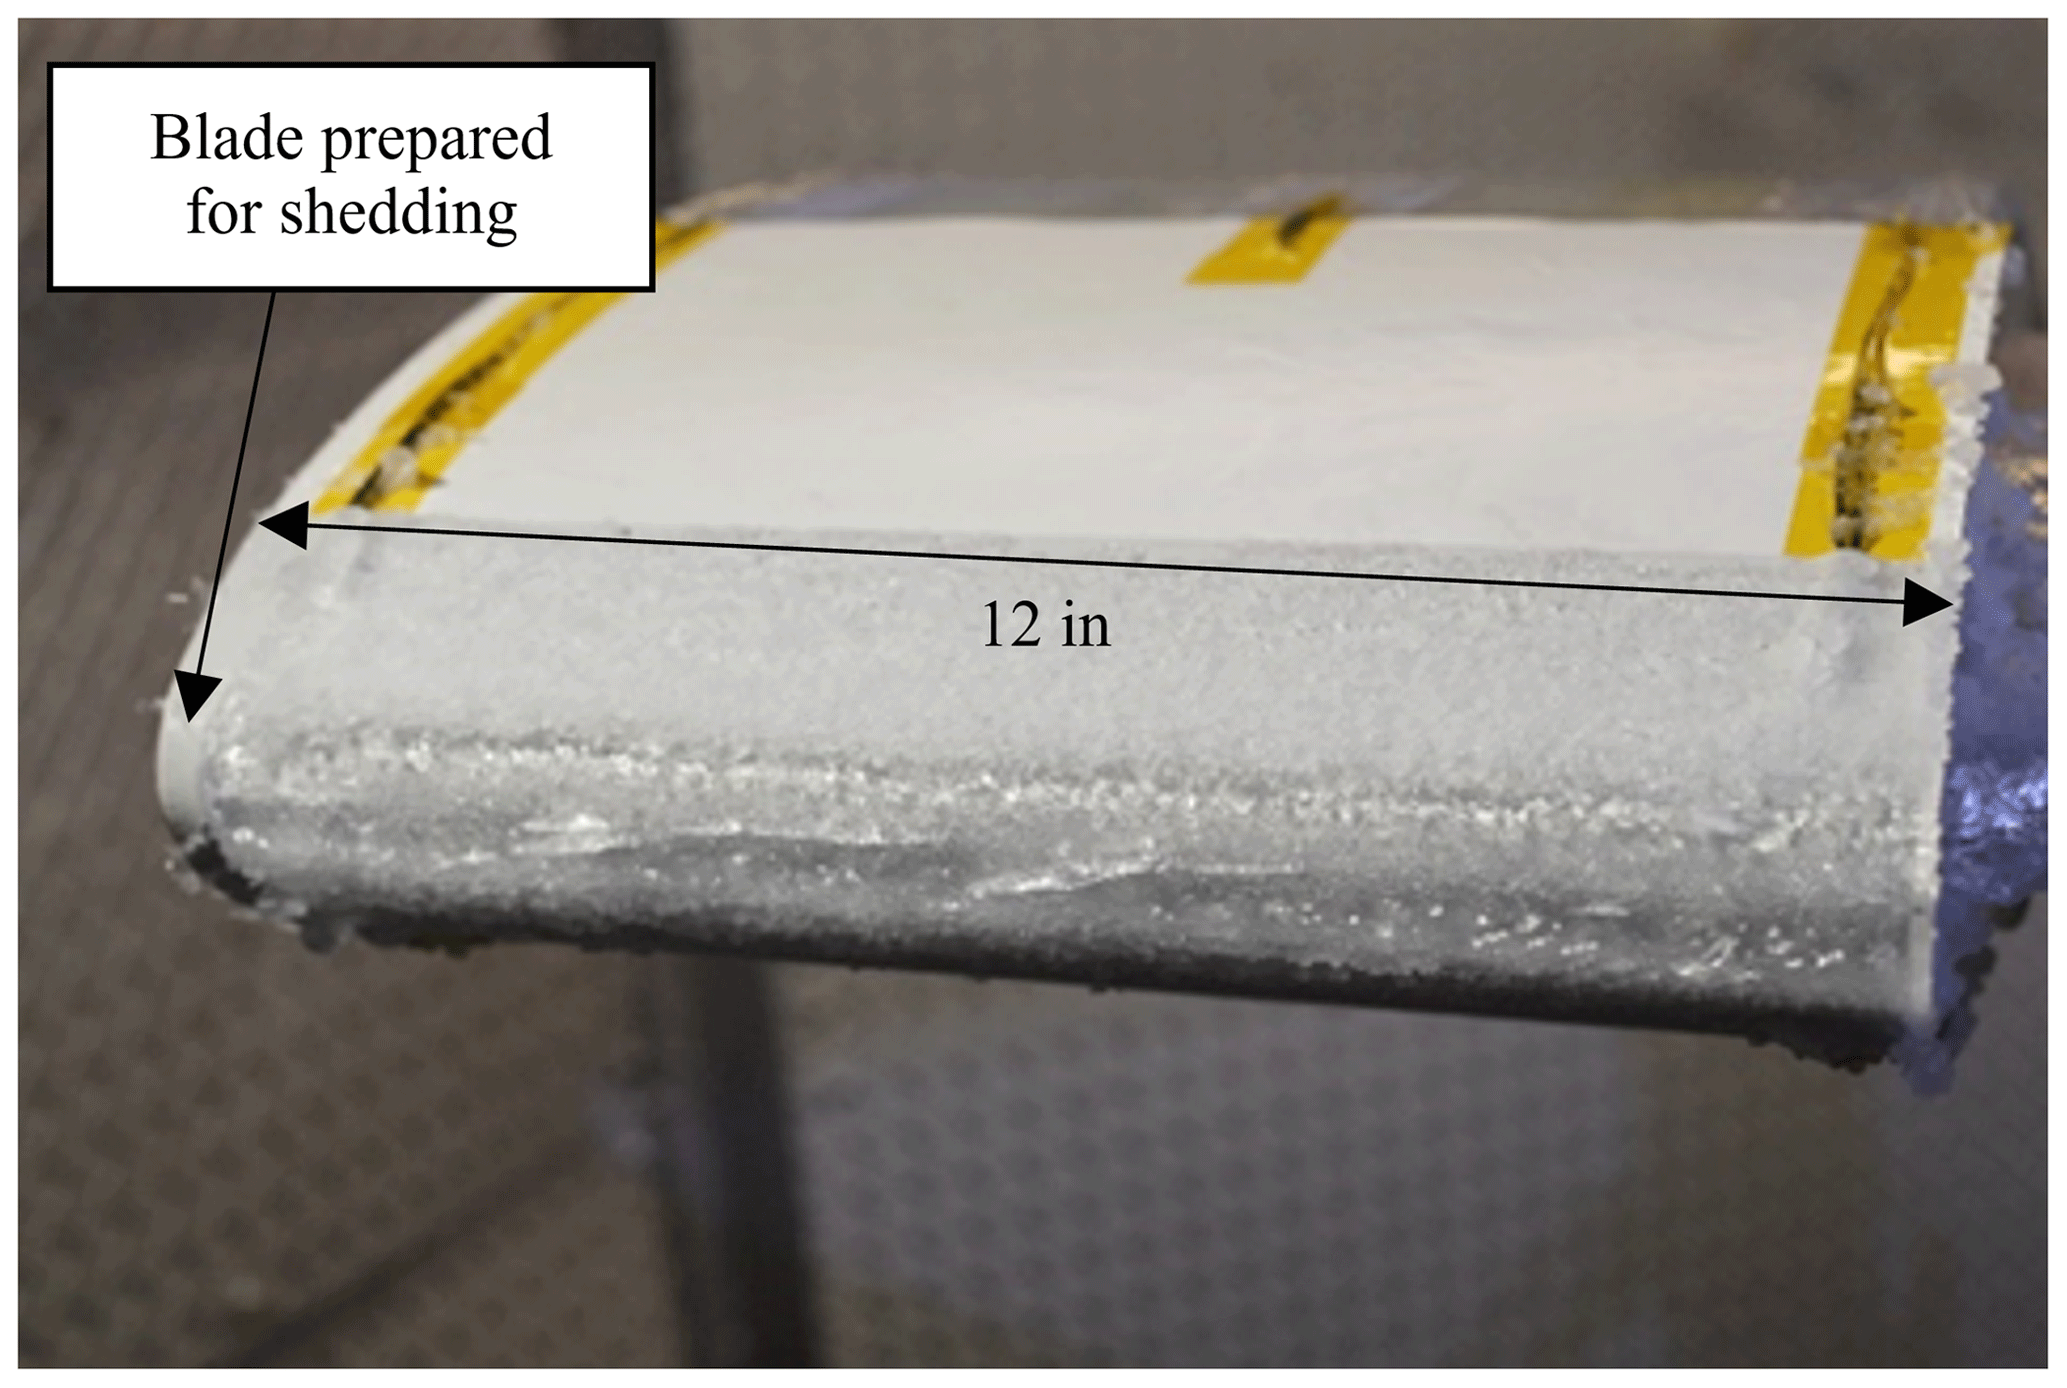
Each test case accreted ice at −8 ∘C and an impact velocity of 52 m/s (400 RPM in AERTS), deeming the ice accretion rate constant through each icing condition. The impact velocity mostly affects the ice shape and has small effects on the heat transfer once ice is accreted (ice acts as an insulator). The increase in velocity for inner sections with respect to what is expected on a full-scale blade (26.7 % and 44.4 %) simply means that the accretion rate was increased since the ice accumulation parameter is linearly dependent on LWC and time (Anderson, 1994; Rocco et al., 2016) and does not have any effects on the capability of the heaters to melt the ice interface. It must be noted that the ice shape could deviate slightly from those accreted at representative span velocities (due to collection efficiency differences between half-scale and full-scale airfoils), but ultimately, only the ice mass is of importance for this study. After the test blade accreted an ice shape for a predetermined time, a hot plate was used to remove the tip ice shapes of the paddle blade to create a smooth plane on the edge. Photographs of the cross-sectional area of the ice shape were obtained. After the photograph was taken, the ice on the outer edges of the heater at the tip was removed to ensure the ice mass was free to shed. This represented the outboard heater section on the full-scale turbine that was free of ice. This step had to be done due to the lack of heat production above the outer copper bus bar in the heating element. The copper bus bars, lacking heat generation, were embedded in the heater layer and reside on the inner and outer edge of the heater section. Therefore, the inner section of the heater represented the adjacent inboard heater section on the full-scale wind turbine that has no heat generation. This procedure was repeated for the light, medium and severe icing conditions. Figure 15 is a front-view schematic that illustrates the cohesive attachment of the inboard section representative of the full-scale turbine. This procedure experimentally evaluated the cohesive forces of the ice bridging the heater sections. Figures 16 and 17 show the process for ice removal on the outer edge of the heater section representing the outboard heater section free of ice on the full-scale turbine.

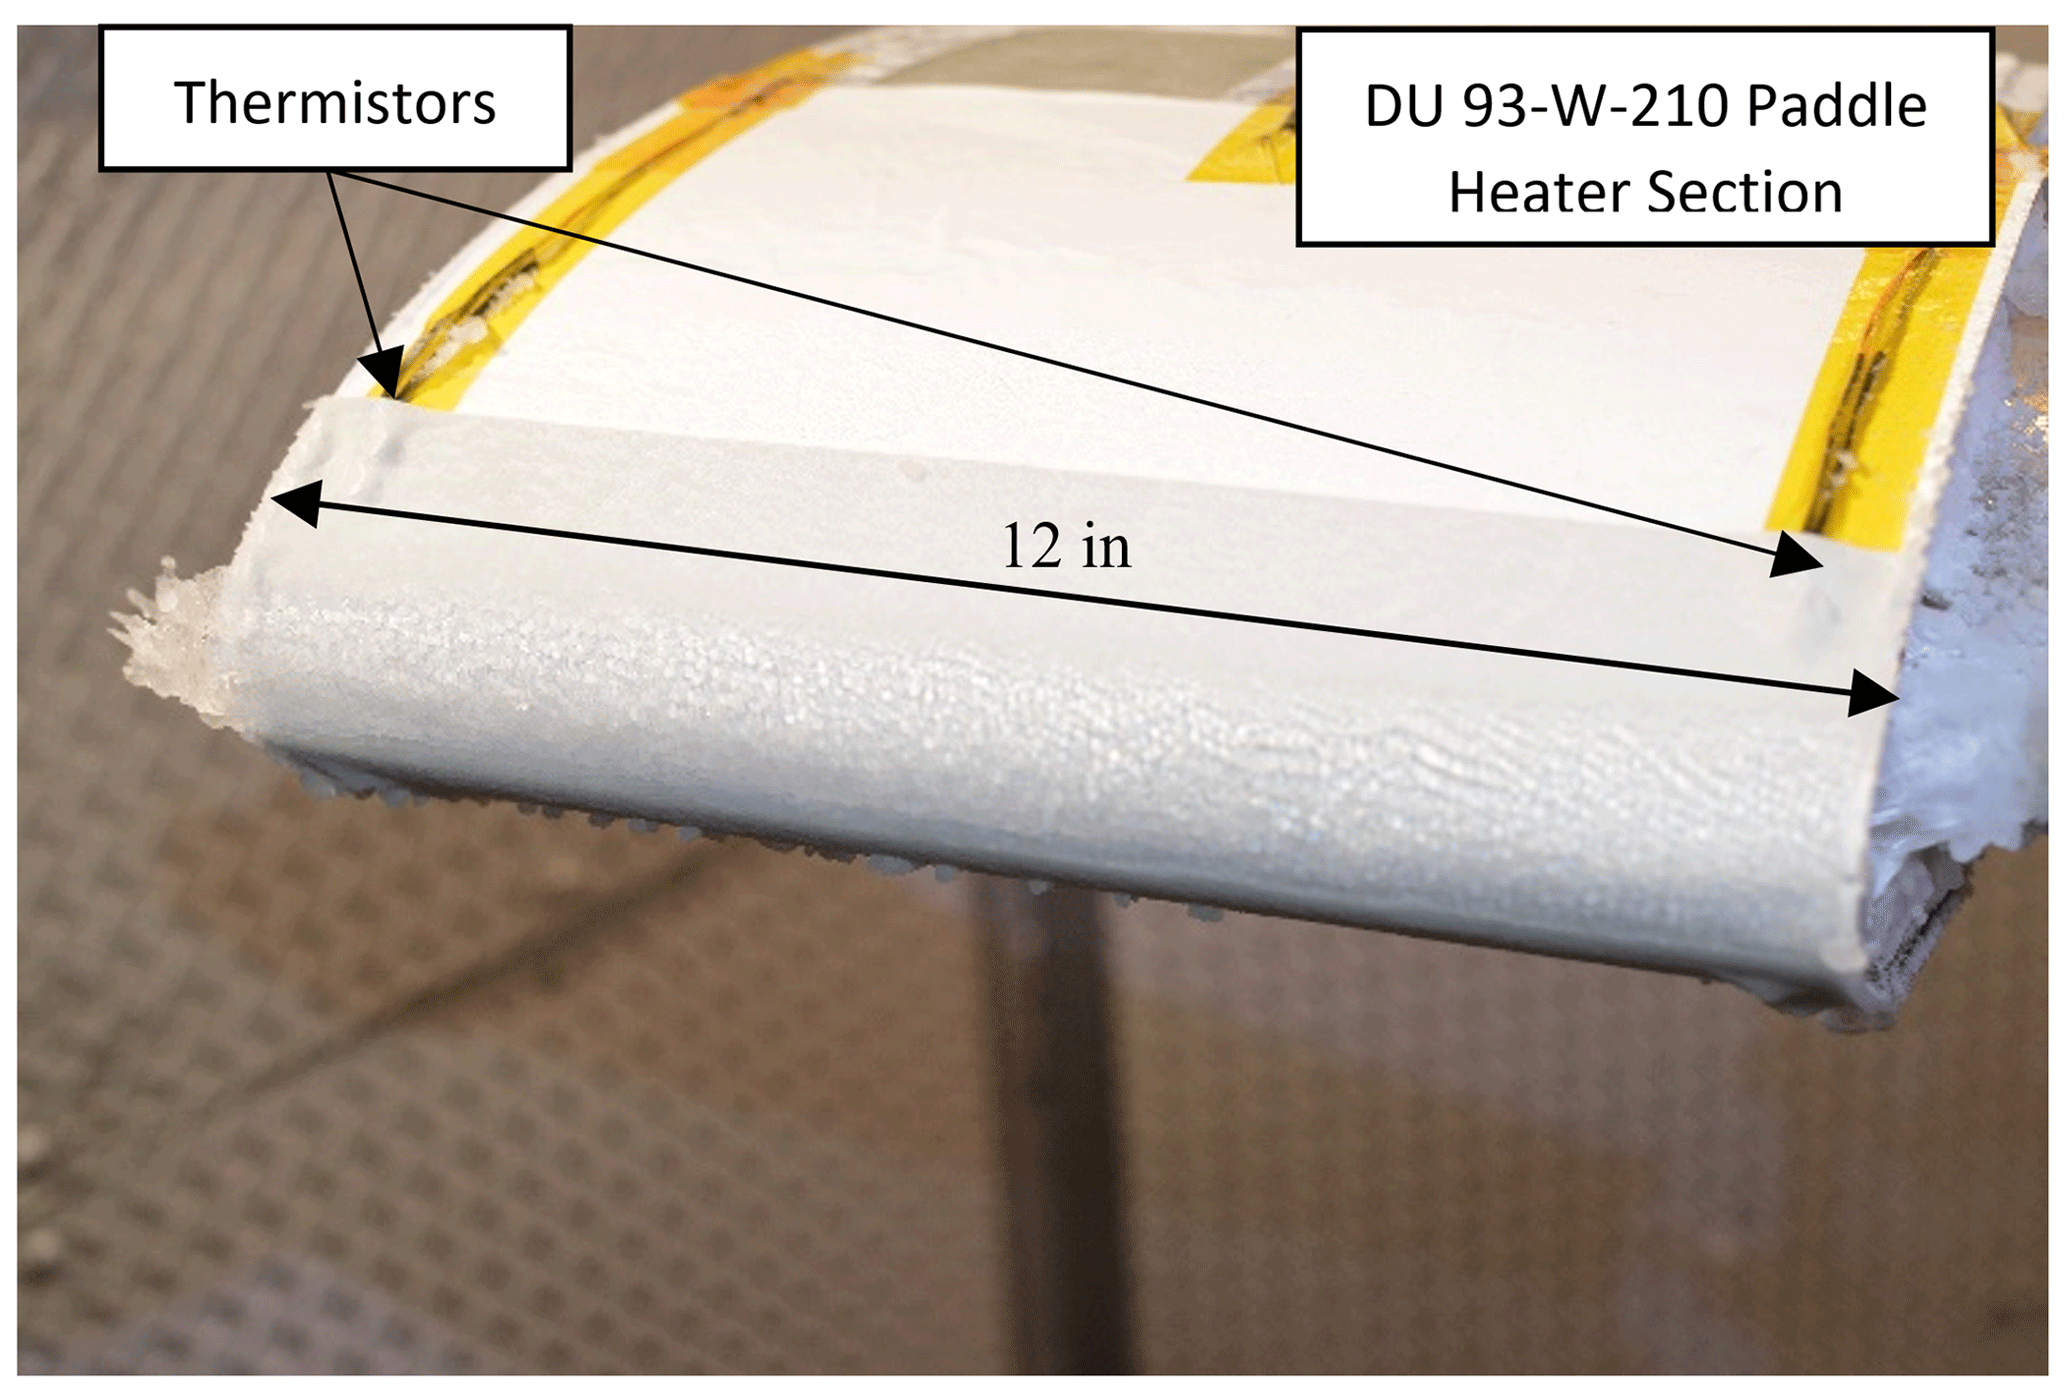
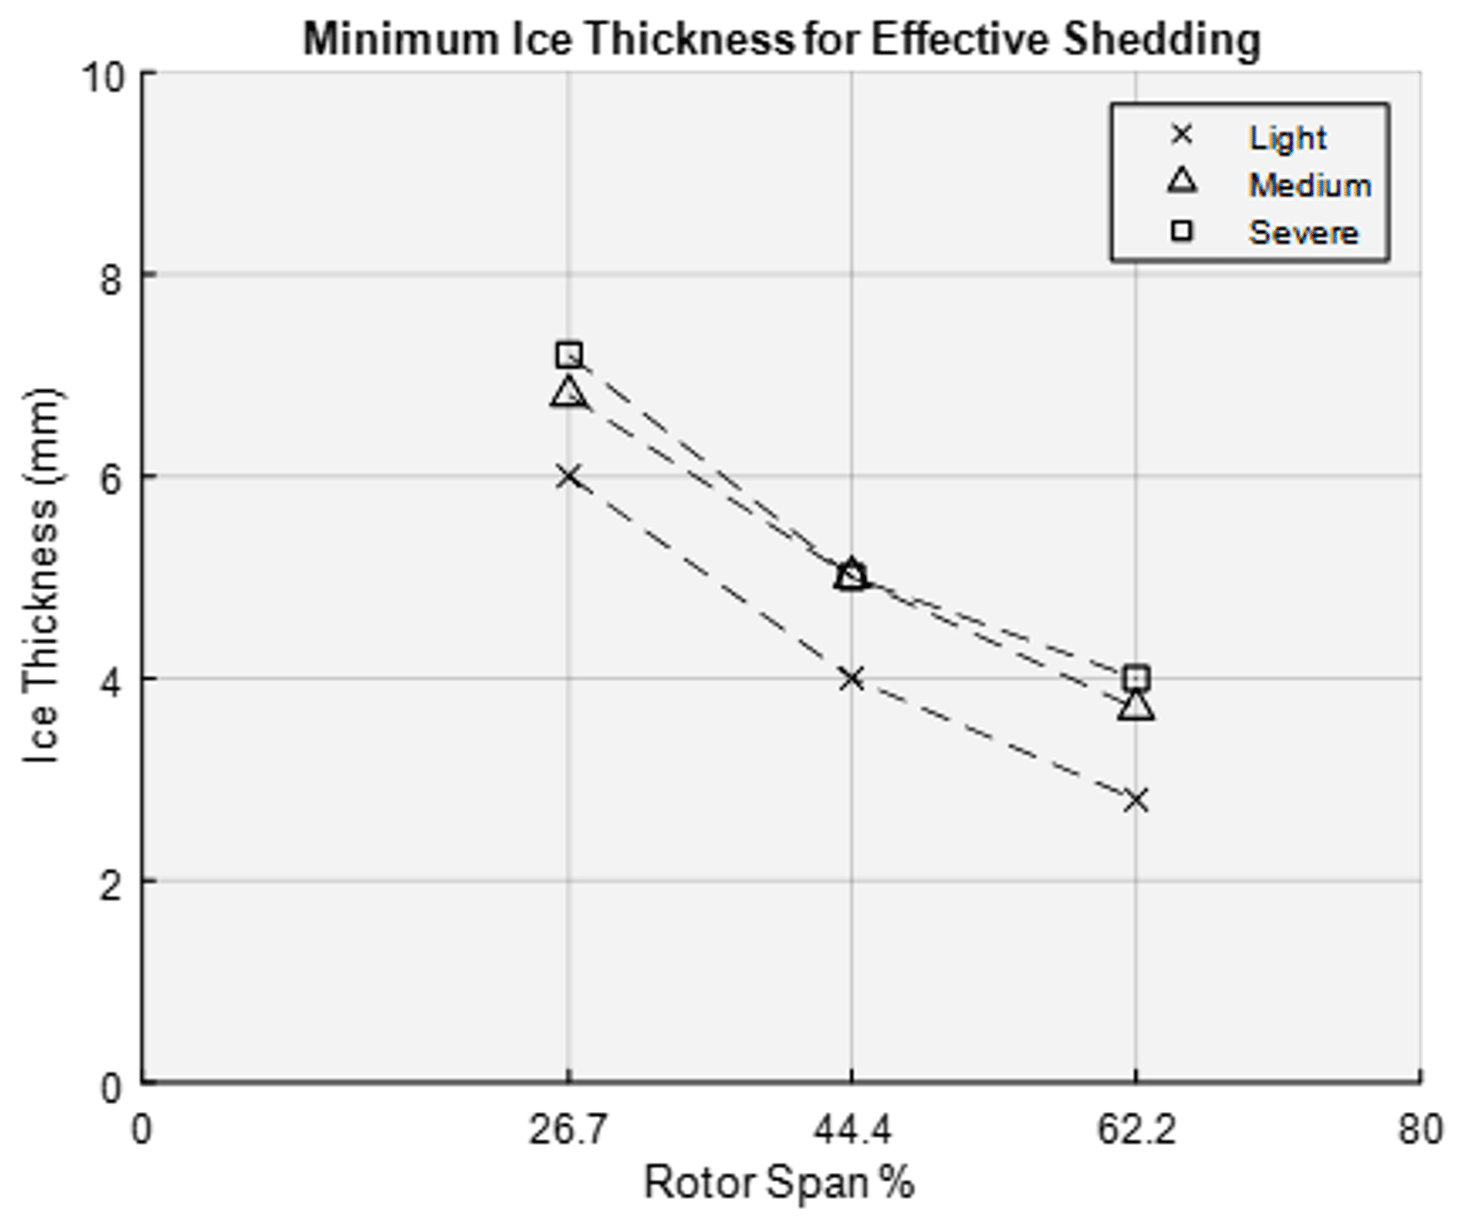
After the rotor test blade is prepared for shedding, the rotor stand spun up to the appropriate centrifugal force representative of the full-scale blade span percentage of interest. When the rotor stand reached the desired RPM, the heaters were activated and delivered a 0.385 W/cm2 power density, which is the maximum available due to power restrictions on the full-scale wind turbine (corresponding to 100 kW and a partition of four zones per blade). The time limit for effective ice shedding was set to 30 s. If the ice mass shed within 30 s, the following test case will accrete ice for a shorter duration of time, decreasing the thickness and mass of the ice. This process was conducted until the minimum ice thickness was found for each heater section. After the test was completed and the data were saved, the rotor blades were cleaned in preparation for the next test with reduced ice mass. An example of a 7 mm ice shape at −8 ∘C obtained in the medium icing conditions prepared for shedding is shown in Fig. 18. Figure 19 is a photograph of a successful shedding event after 23 s for the 26.7 % span heater zone (innermost heater zone on the full-scale wind turbine). The data trends for these tests are presented in Fig. 20.
The minimum ice thicknesses experimentally determined for the light icing conditions at the 26.7 %, 44.4 % and 62.2 % spans were 6 mm, 4 and 2.8 mm, respectively. The average shedding time between both rotor blades for these tests were 24, 25 and 28 s. For the medium icing conditions, the minimum ice thicknesses were 6.8, 5 and 3.7 mm, respectively. The average shedding times for these cases were 25, 25 and 23 s. Lastly, the minimum ice thicknesses for the severe icing conditions were 7.2, 5 and 4 mm, respectively. The ice shedding times for these tests were 30, 24 and 20 s.
The minimum thicknesses along the span of the wind turbine blade for the severe icing conditions should be considered for the design of the controller. This is a conservative approach, because the smallest variation in ice mass could allow the ice tensile adhesion strength to dominate over the centrifugal forces. In this situation, the ice shape stays attached to the airfoil as the electro-thermal heaters melt the ice interface on the surface. The ice becomes an insulator and continues to accrete ice on the leading edge. It is imperative to keep these ice thicknesses at a minimum for the safety of the surrounding environment on the wind farms and a reduction of aerodynamic degradation.
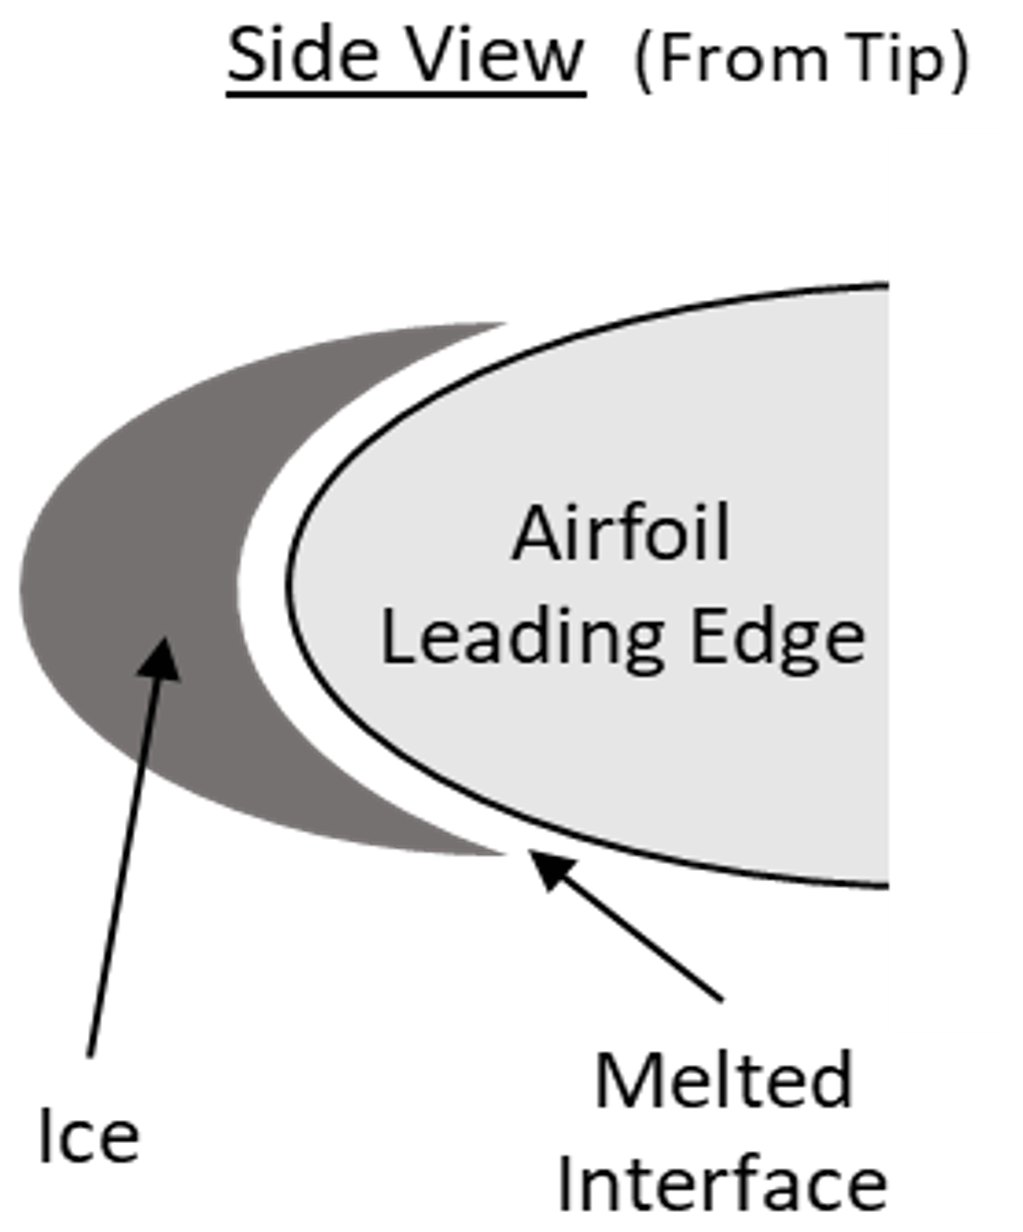
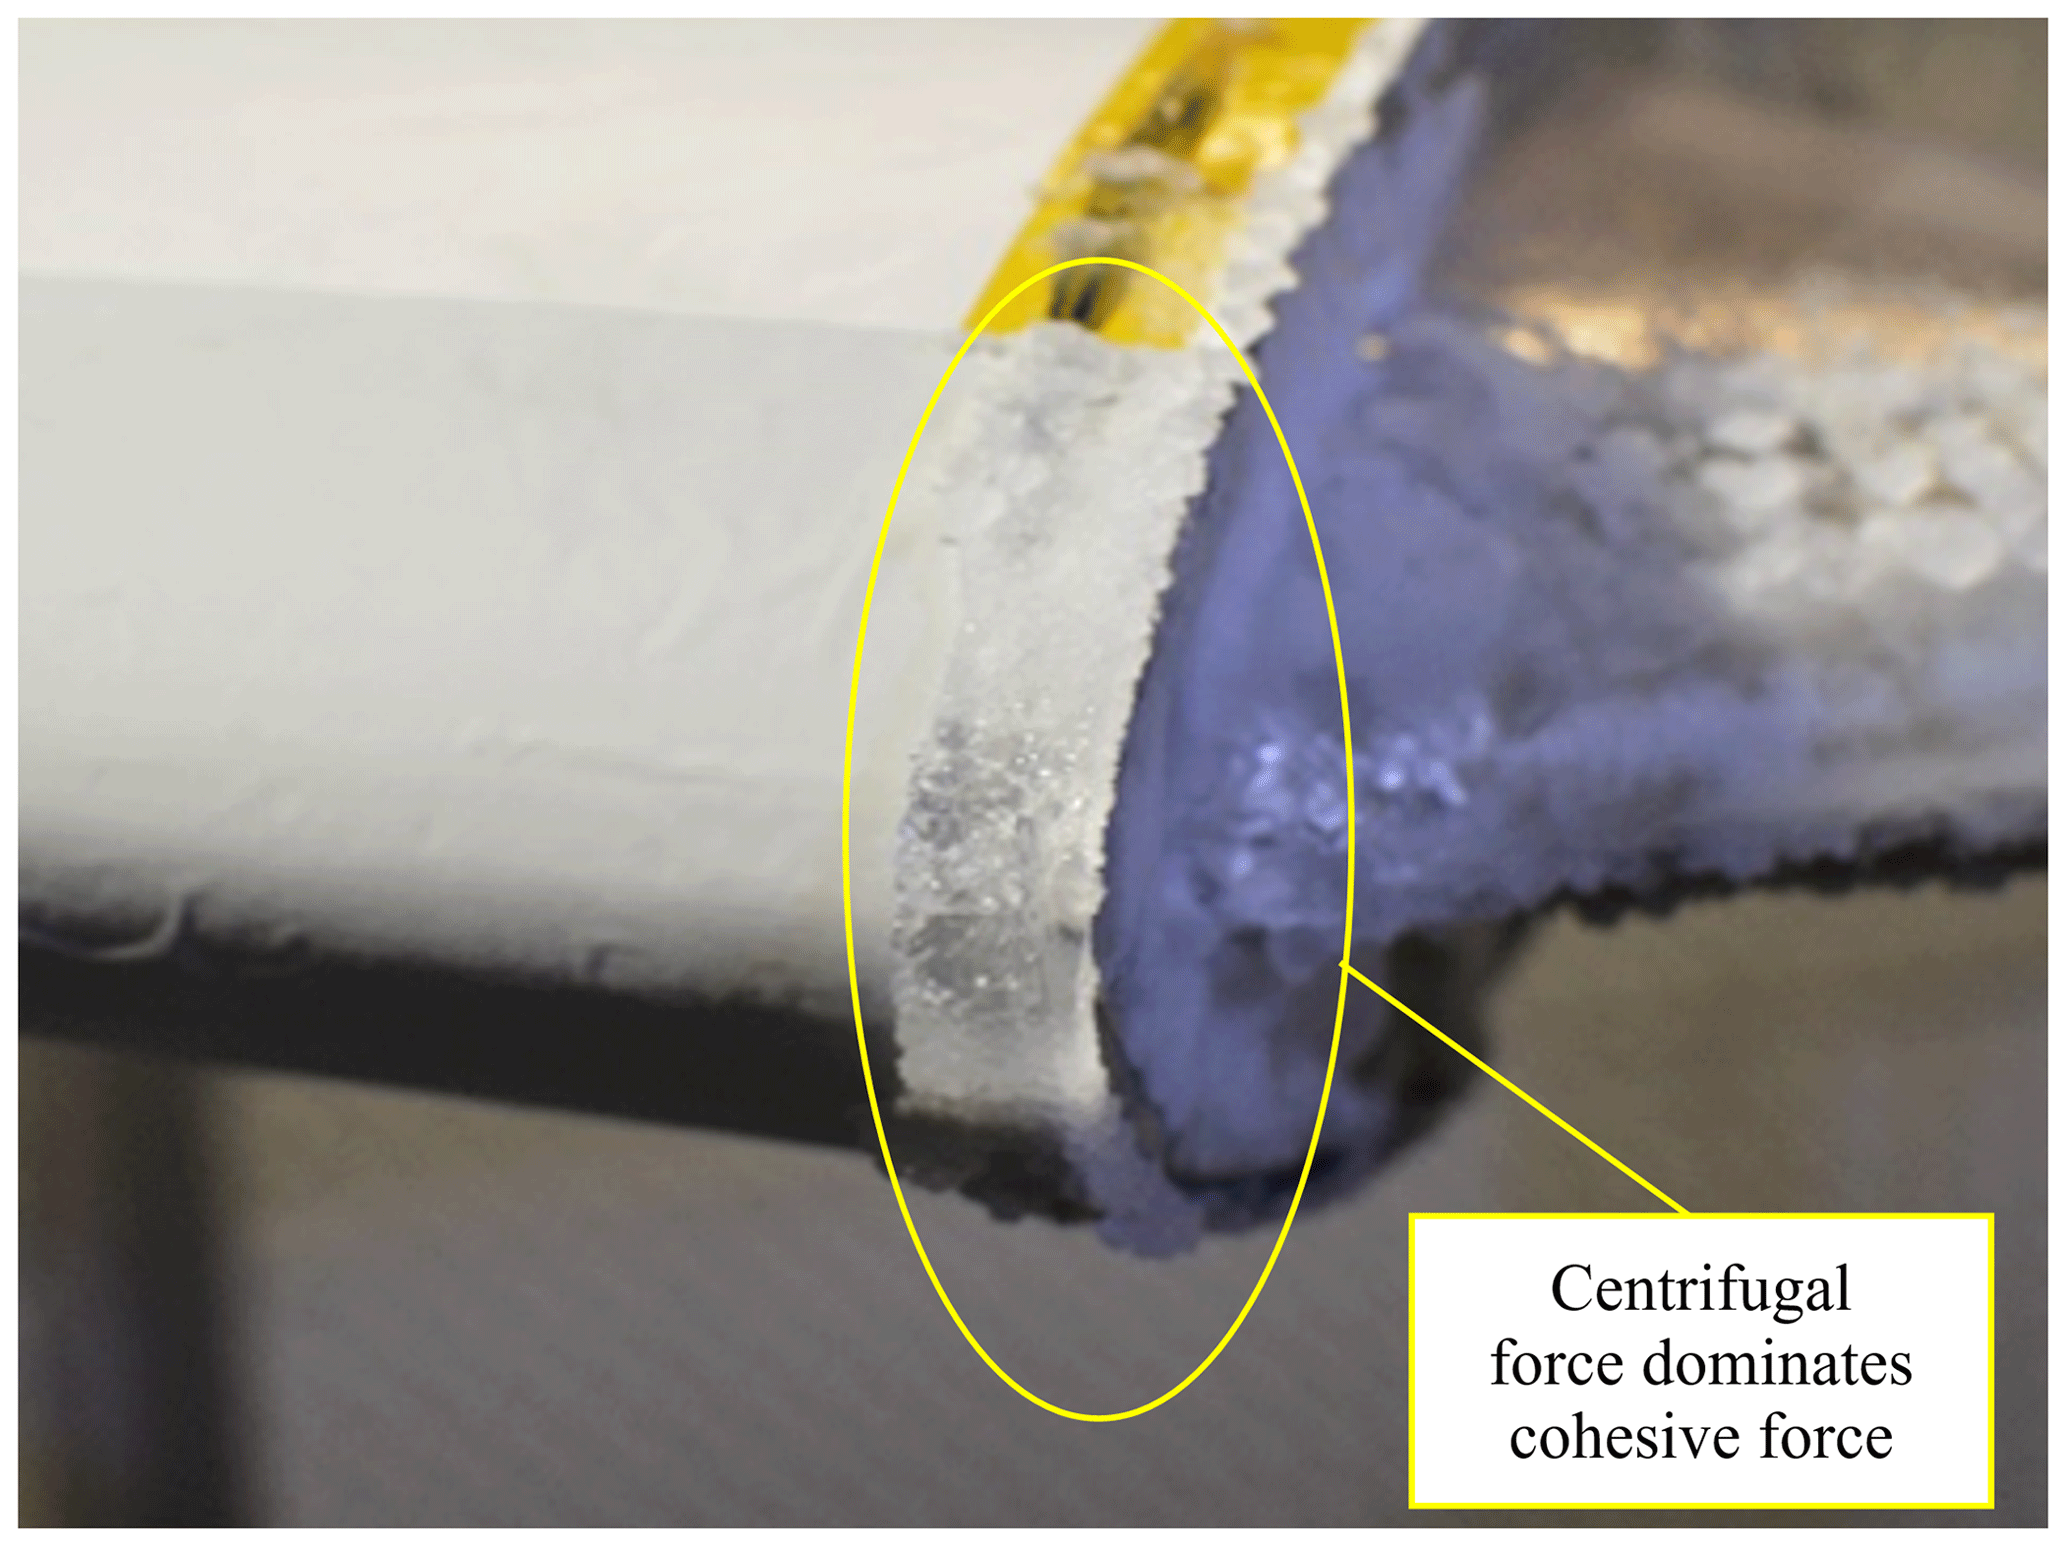
This cohesive “holding” event of a de-bonded ice zone happened multiple times during the experiments. The following photographs are from a test case demonstrating the failure to shed and the success of the ice tensile adhesion strength over the centrifugal forces. A side-view schematic from the tip of the melted interface experienced from cohesive bonding is shown in Fig. 21. The melted interface after delivering a 0.385 W/cm2 power density from the heaters for 180 s and failing to shed is shown in Fig. 22. This is an example of the ice mass not reaching the critical value to successfully produce cohesive failure. As stated earlier, on the inboard section of the heater zone, there is a lack of heat generation on purpose to simulate the cohesive forces in the testing environment. This represents full-scale bridging effects from zone to zone in the field.
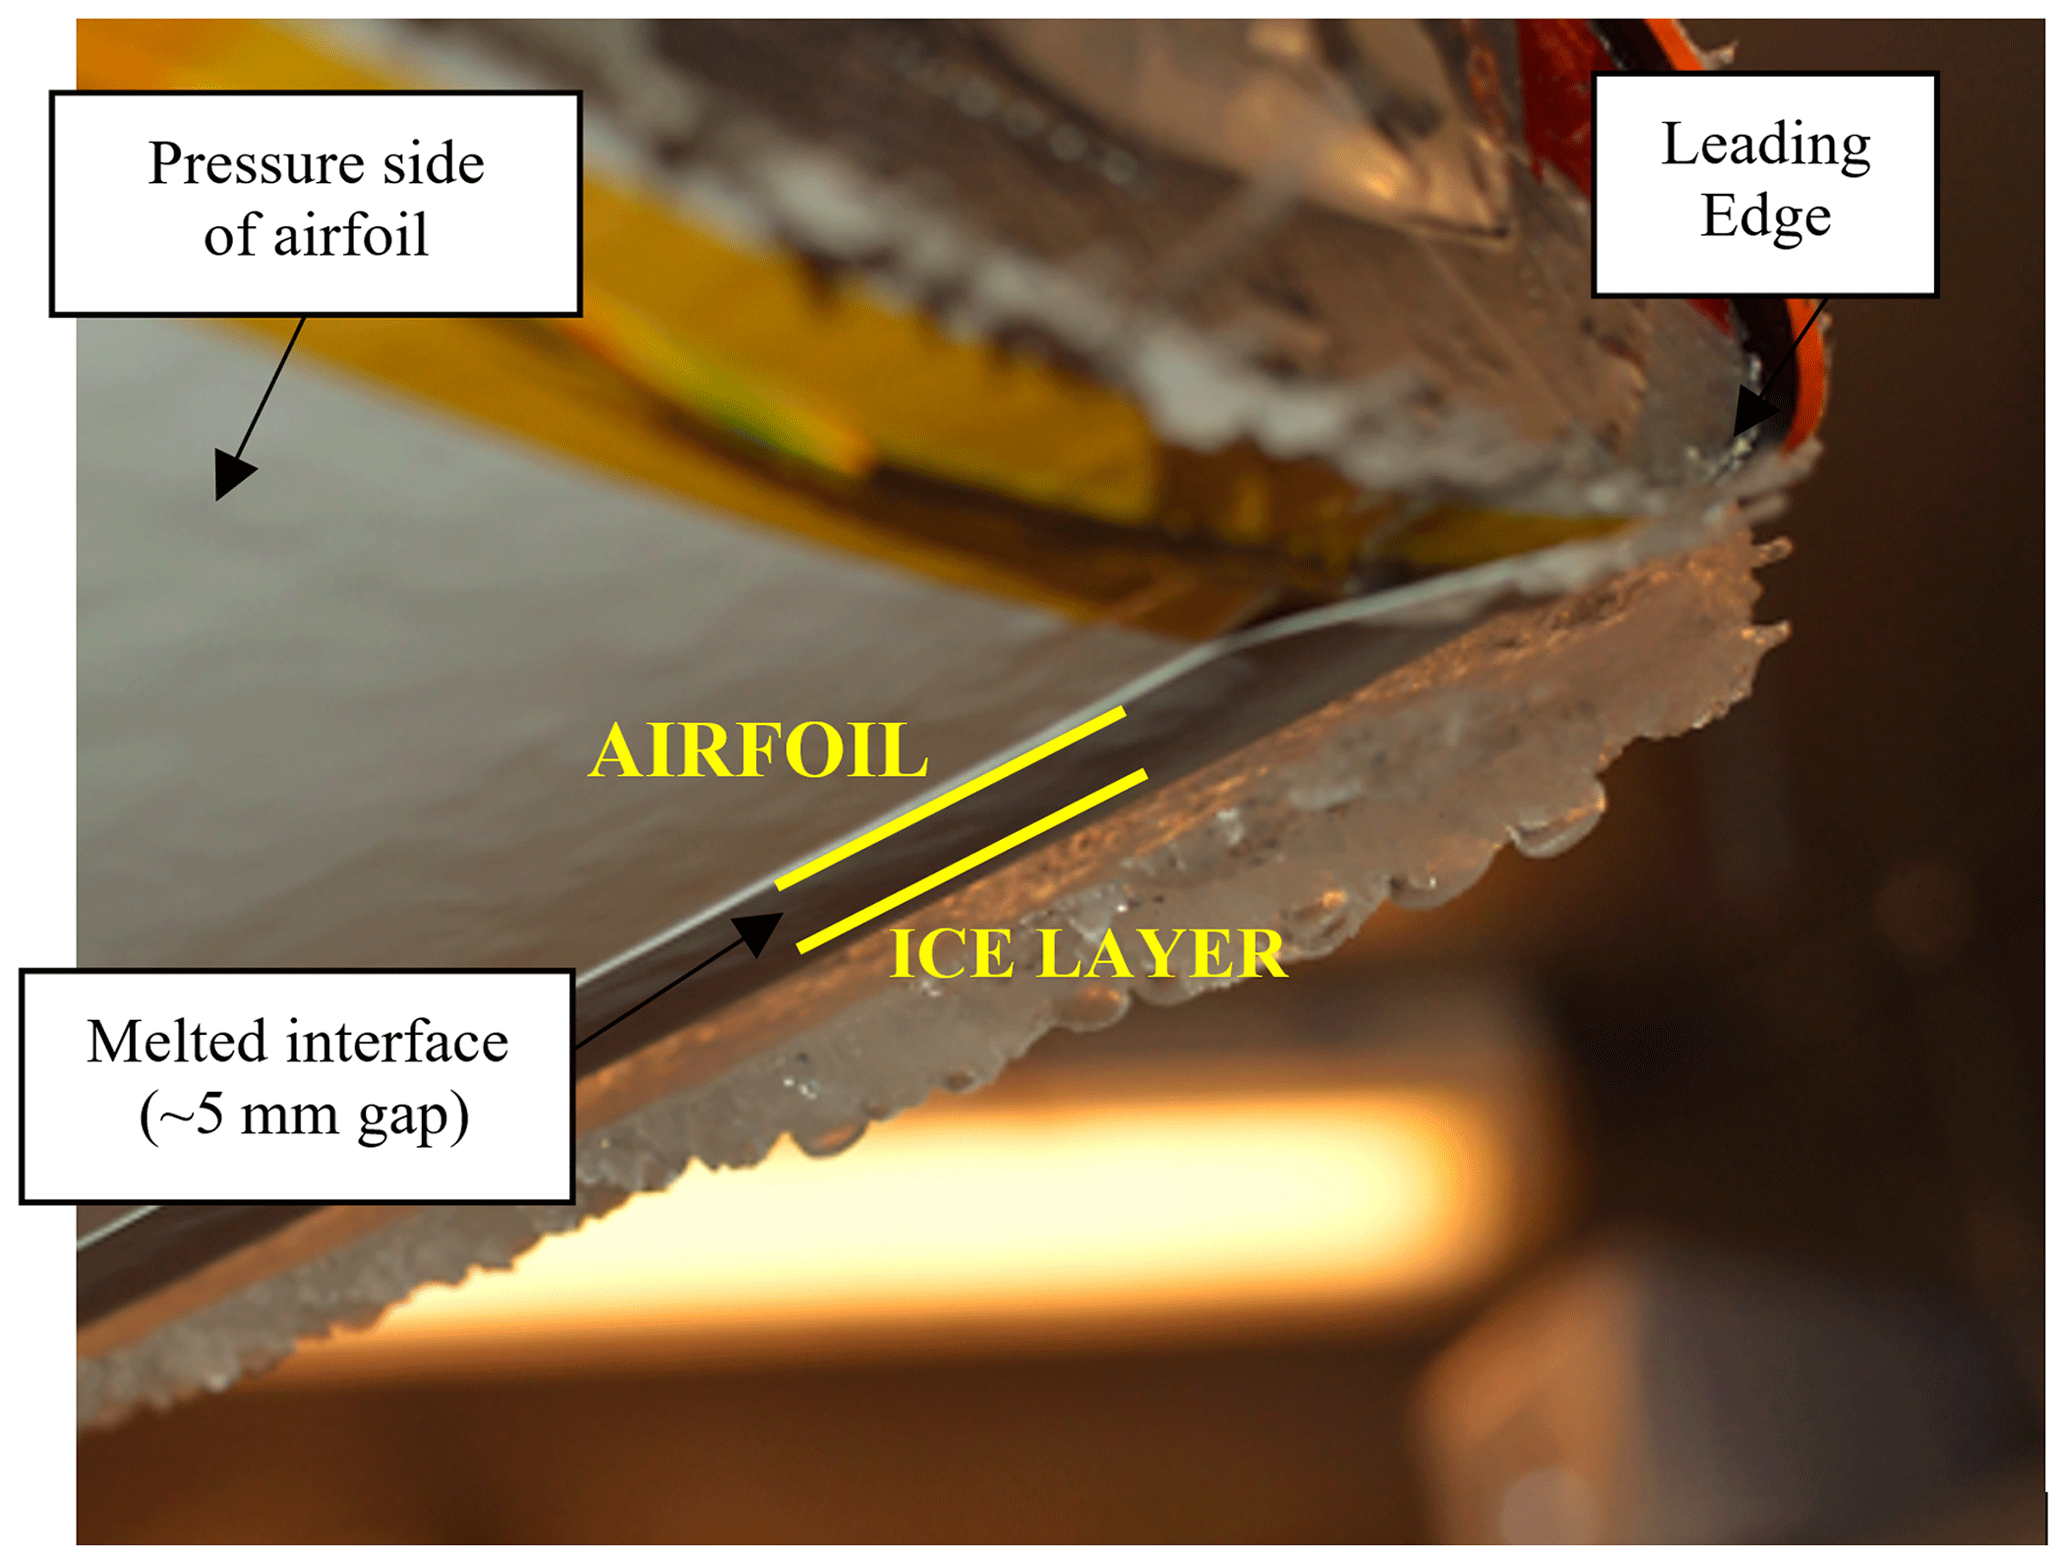
Figure 22Melted interface between ice and airfoil leading to cohesive bonding and failure to shed.
The minimum ice thicknesses along the span for the severe icing condition were used to determine the cohesive failure curve. The cross-sectional area of the ice shape was photographed and digitized to obtain the 2D area, as stated earlier. The ice mass was used to calculate the centrifugal force at each heater span location. This data curve represents the minimum centrifugal force needed to exceed the ice cohesive force. If the ice thickness (mass) exceeds the boundary, centrifugal forces will dominate the cohesive forces. The boundary curve is presented in Fig. 23.

5.3 Power density variation
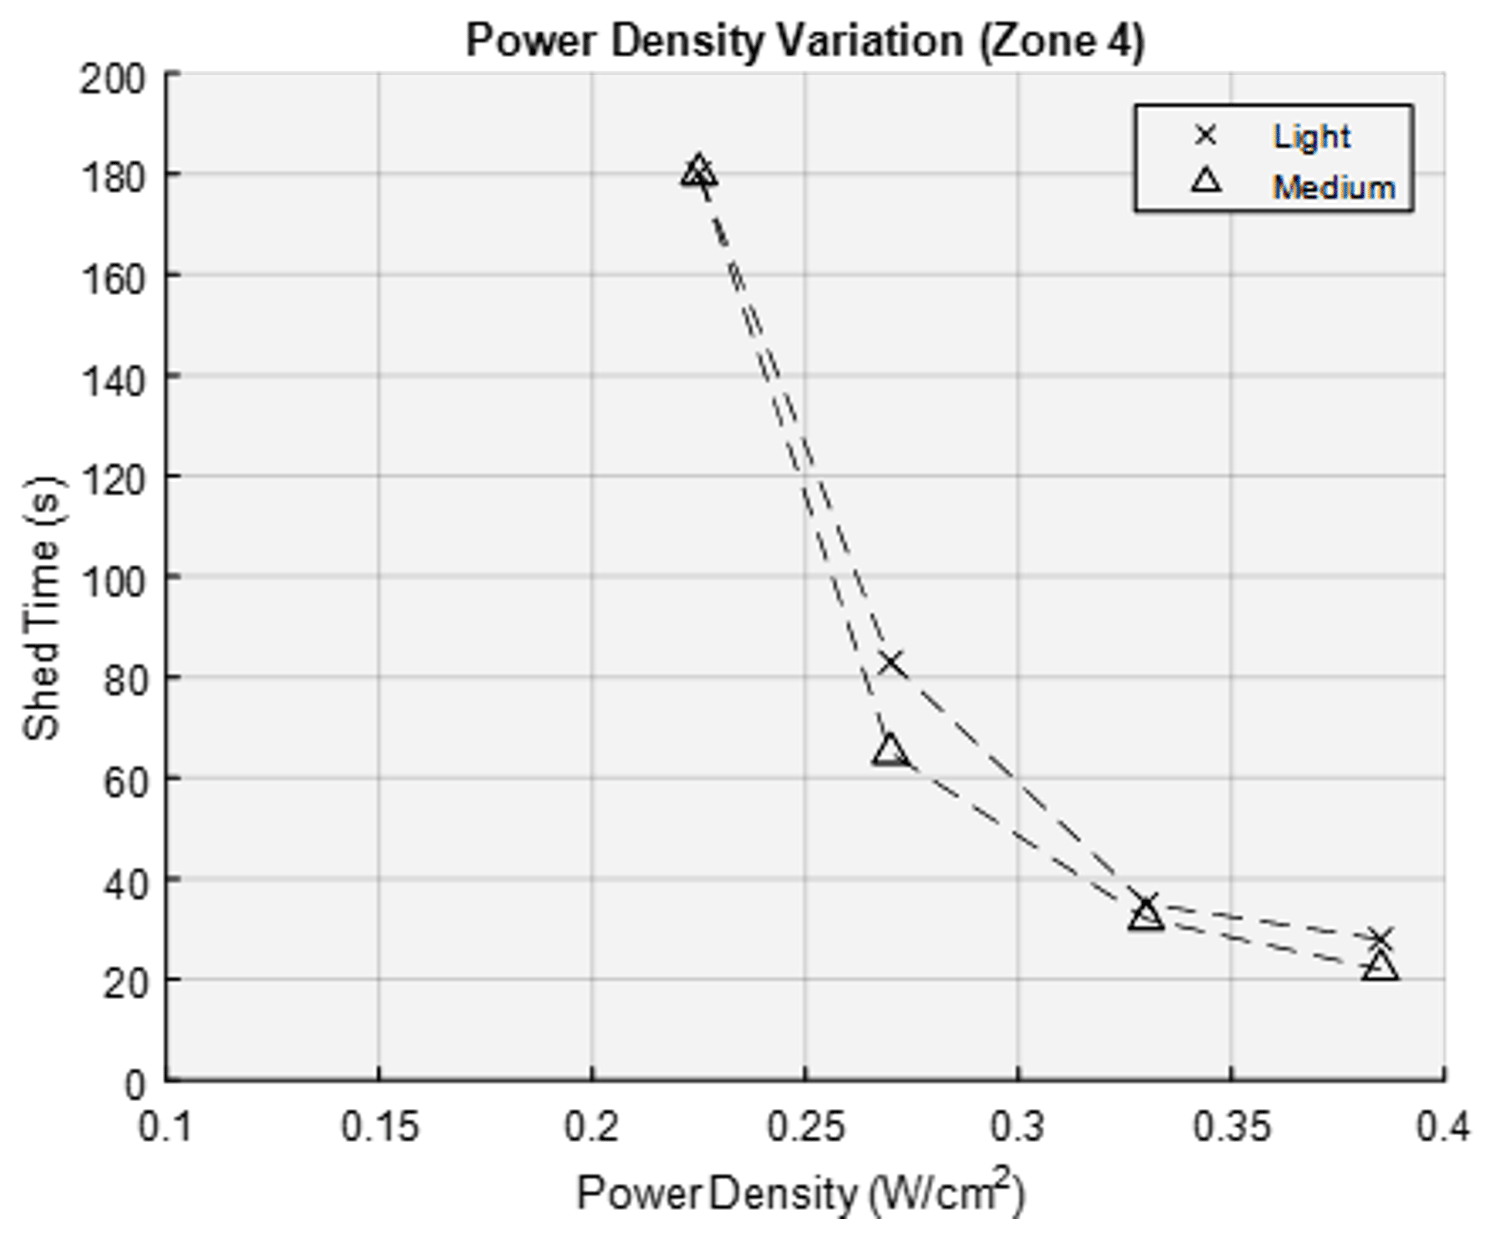
The last set of experimental tests was conducted to determine the minimum power density needed to de-bond the accreted ice within the allocated heating time. Variations in power density delivered to the electro-thermal heater zones were investigated. These experiments were performed for the minimum thickness needed to prevent cohesion between icing zones and were analyzed for each span-wise heater zone. The objective was to quantify the required shedding times for reduced power densities at the found minimum ice thickness. As stated in the previous section, effective ice shedding means the shedding event occurred within 30 s. Each test case accreted ice at a water droplet impact velocity of 52 m/s, which corresponds to 400 RPM in the AERTS facility. After the minimum thickness was accreted, the icing cloud was turned off and the rotor stand spun down. The same ice removal technique as stated earlier was conducted to eliminate the last inch of ice from the tip, span-wise (region over the bus bar used to power the heater). The rotor stand spun up to the desired RPM that corresponded to the centrifugal force at the heater zone being tested. When the matching centrifugal force was achieved, power was delivered to the electro-thermal heaters at a selected power density. The maximum available power density given the maximum power available for the heating system (100 kW), 0.385 W/cm2, was the initial value before decreasing power density for the latter test cases. The ice shedding times were quantified and recorded for the light and medium icing conditions. Once again, the light icing condition pertains to a 0.2 g/m3 LWC and 20 µm MVD at −8 ∘C. The medium icing conditions are a 0.4 g/m3 LWC and 20 µm MVD at −8 ∘C. The parameters of the test matrix for the power variation experiments are shown in Table 4.

The test cases for the innermost heater zone, heater 4, accreted an average of 6 mm of ice on the leading edge in light icing conditions. For the 0.385, 0.33, 0.27 and 0.225 W/cm2 power densities, the average shedding times were 28, 35, 83 and > 180 s, respectively. The test cases for heater 4 on average accreted a 7 mm ice thickness on the leading edge in medium icing conditions. For the 0.385, 0.33, 0.27 and 0.225 W/cm2 power densities, the average shedding times were 22, 42, 65 and > 180 s, respectively. The data trend for the innermost heating section, zone 4, is shown in Fig. 24.
The test cases for heater zone 3 accreted an average ice thickness of 4 mm on the leading edge in light icing conditions. For the 0.385, 0.33, 0.27 and 0.225 W/cm2 power densities, the average shedding times were 25, 48, 88 and > 180 s, respectively. Test cases in the medium icing conditions accumulated an average ice thickness of 5 mm. For the 0.385, 0.33, 0.27 and 0.225 W/cm2 power densities, the average shedding times were 25, 38, 82 and > 180 s, respectively. The data trend for heater zone 3 is shown in Fig. 25.

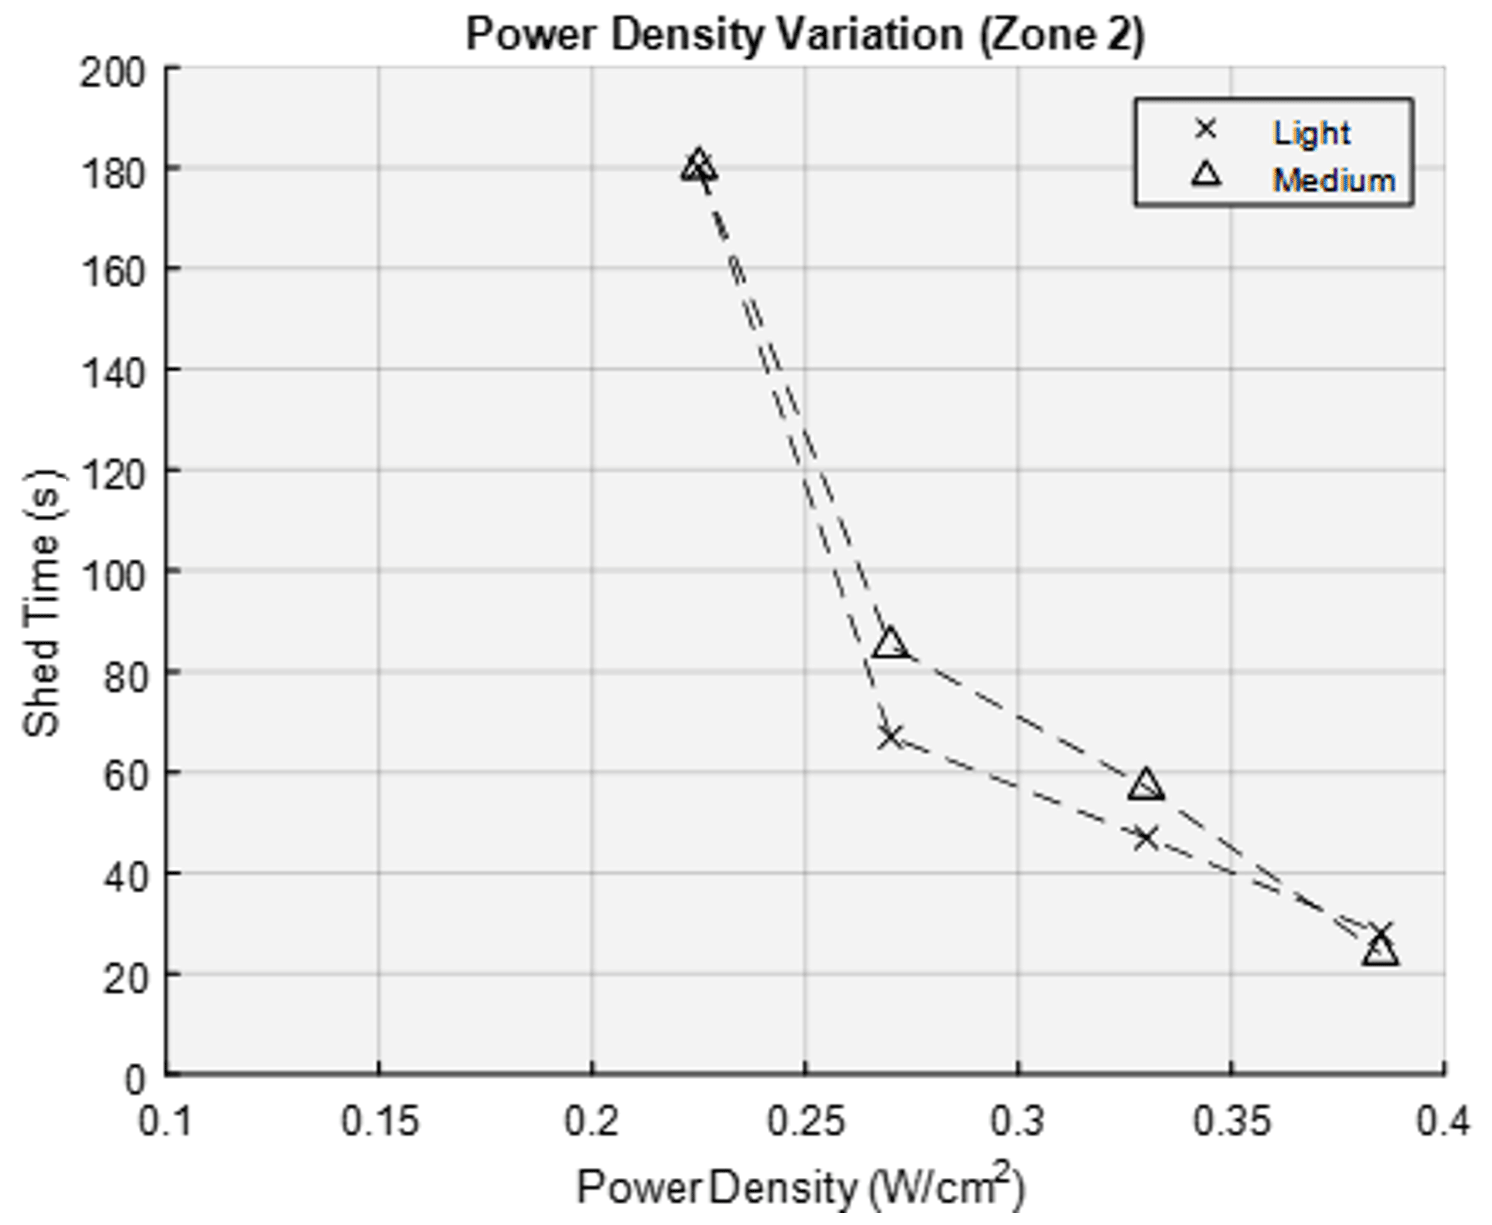
Lastly, heater zone 2 accreted 3 mm of ice on the leading edge for light icing conditions. For the 0.385, 0.33, 0.27 and 0.225 W/cm2 power densities, the average shedding times were 28, 47, 67 and > 180 s, respectively. Test cases in the medium icing conditions accreted an average ice thickness of 3.7 mm. For the 0.385, 0.33, 0.27 and 0.225 W/cm2 power densities, the average shedding times were 24, 57, 85 and > 180 s, respectively. The power variation data trend is presented in Fig. 26.
The data show a parabolic trend confirming that the variation in power density plays a critical role in the heat transfer physics. Small changes in power density can result in shedding times above the “effective shedding” requirement. Therefore, the maximum power available on the 1.5 MW wind turbine established for the parametric design is needed for the deicing ice protection system to perform in varying icing conditions given the heating zones selected.
The controller is dependent upon the ice accretion rates, found in Table 2, and the minimum ice thickness required for effective shedding. A crucial hardware for the integration of the system is an ice detection sensor. It was not the aim of this research to explore the capabilities of suitable ice detection sensors. The controller interface needs to know when ice is initially present and the ice thickness after a selected time. These two steps are needed for identifying the icing condition, since the ice accretion rate determines the icing condition experienced. Each icing condition has a repeatable time sequence operation to deice the rotor blades and minimize aerodynamic penalties. The time sequence incorporates the minimum ice thickness needed to ensure the ice accretion reaches that critical value to overcome cohesive forces. The controller time sequences for light, medium and severe icing conditions are presented in Figs. 27–29, respectively. The controller operations are illustrated as a flowchart in Fig. 30.
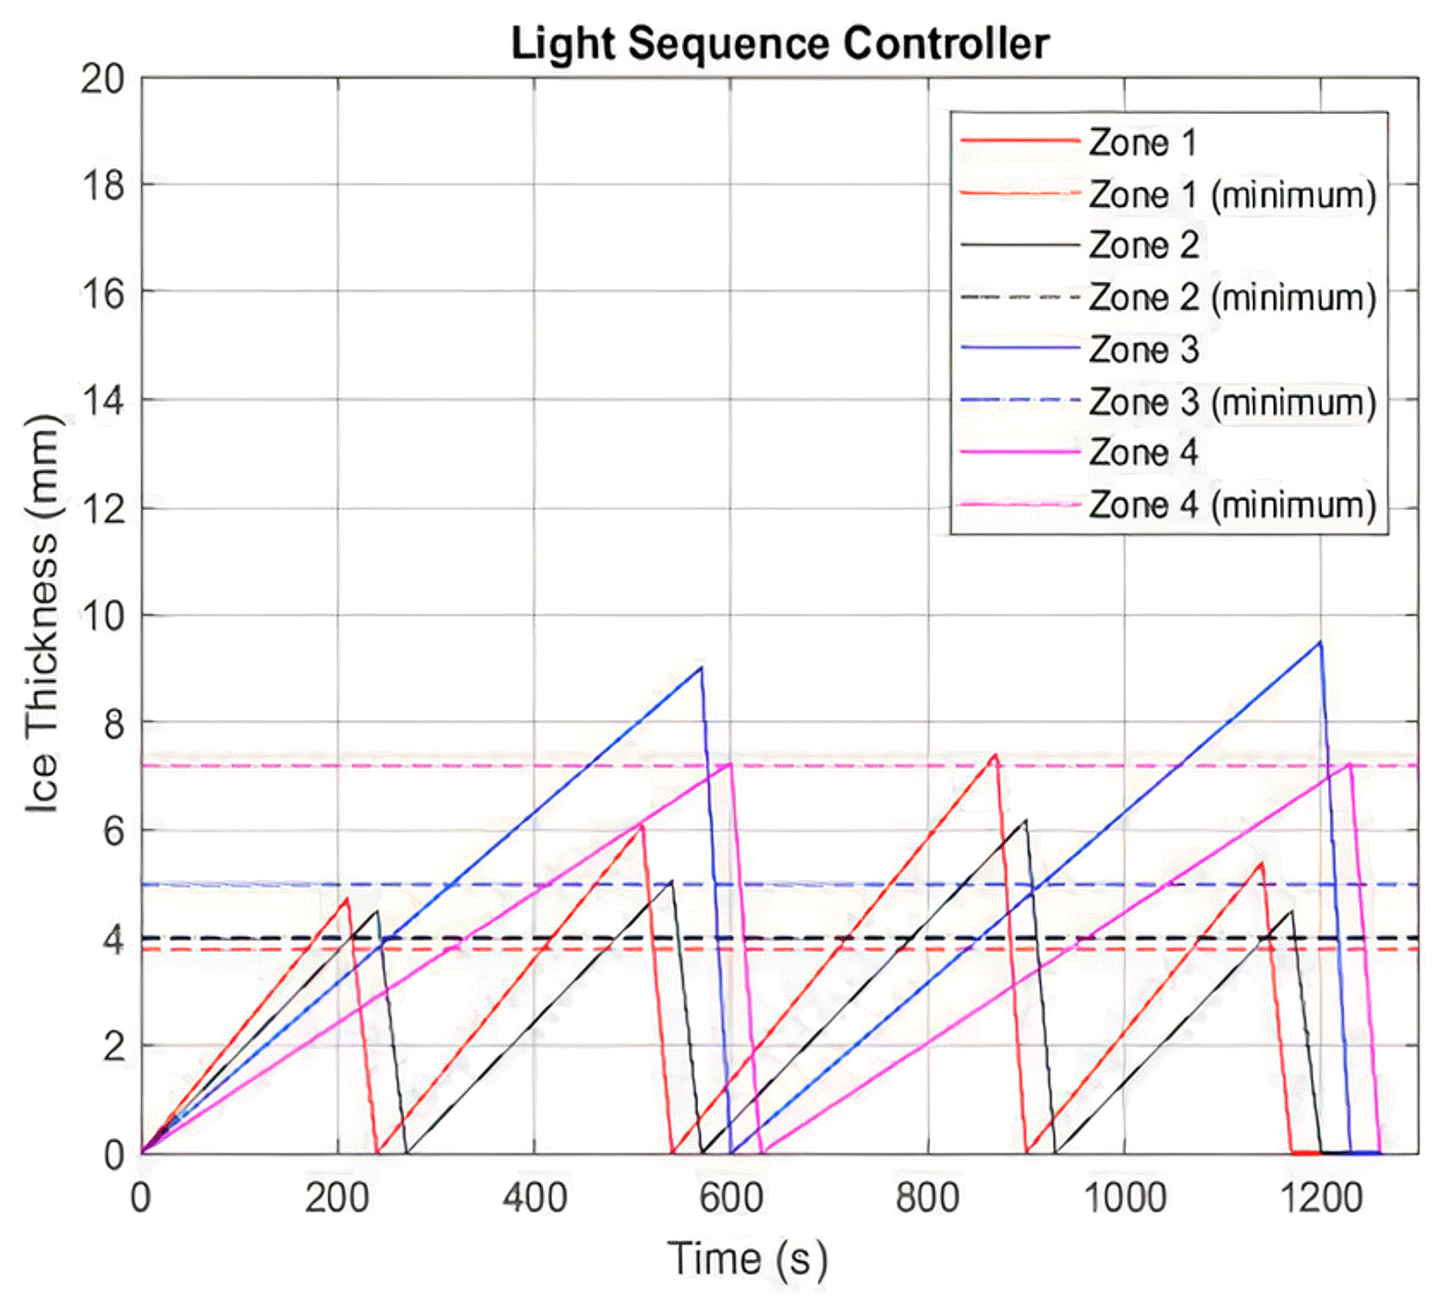
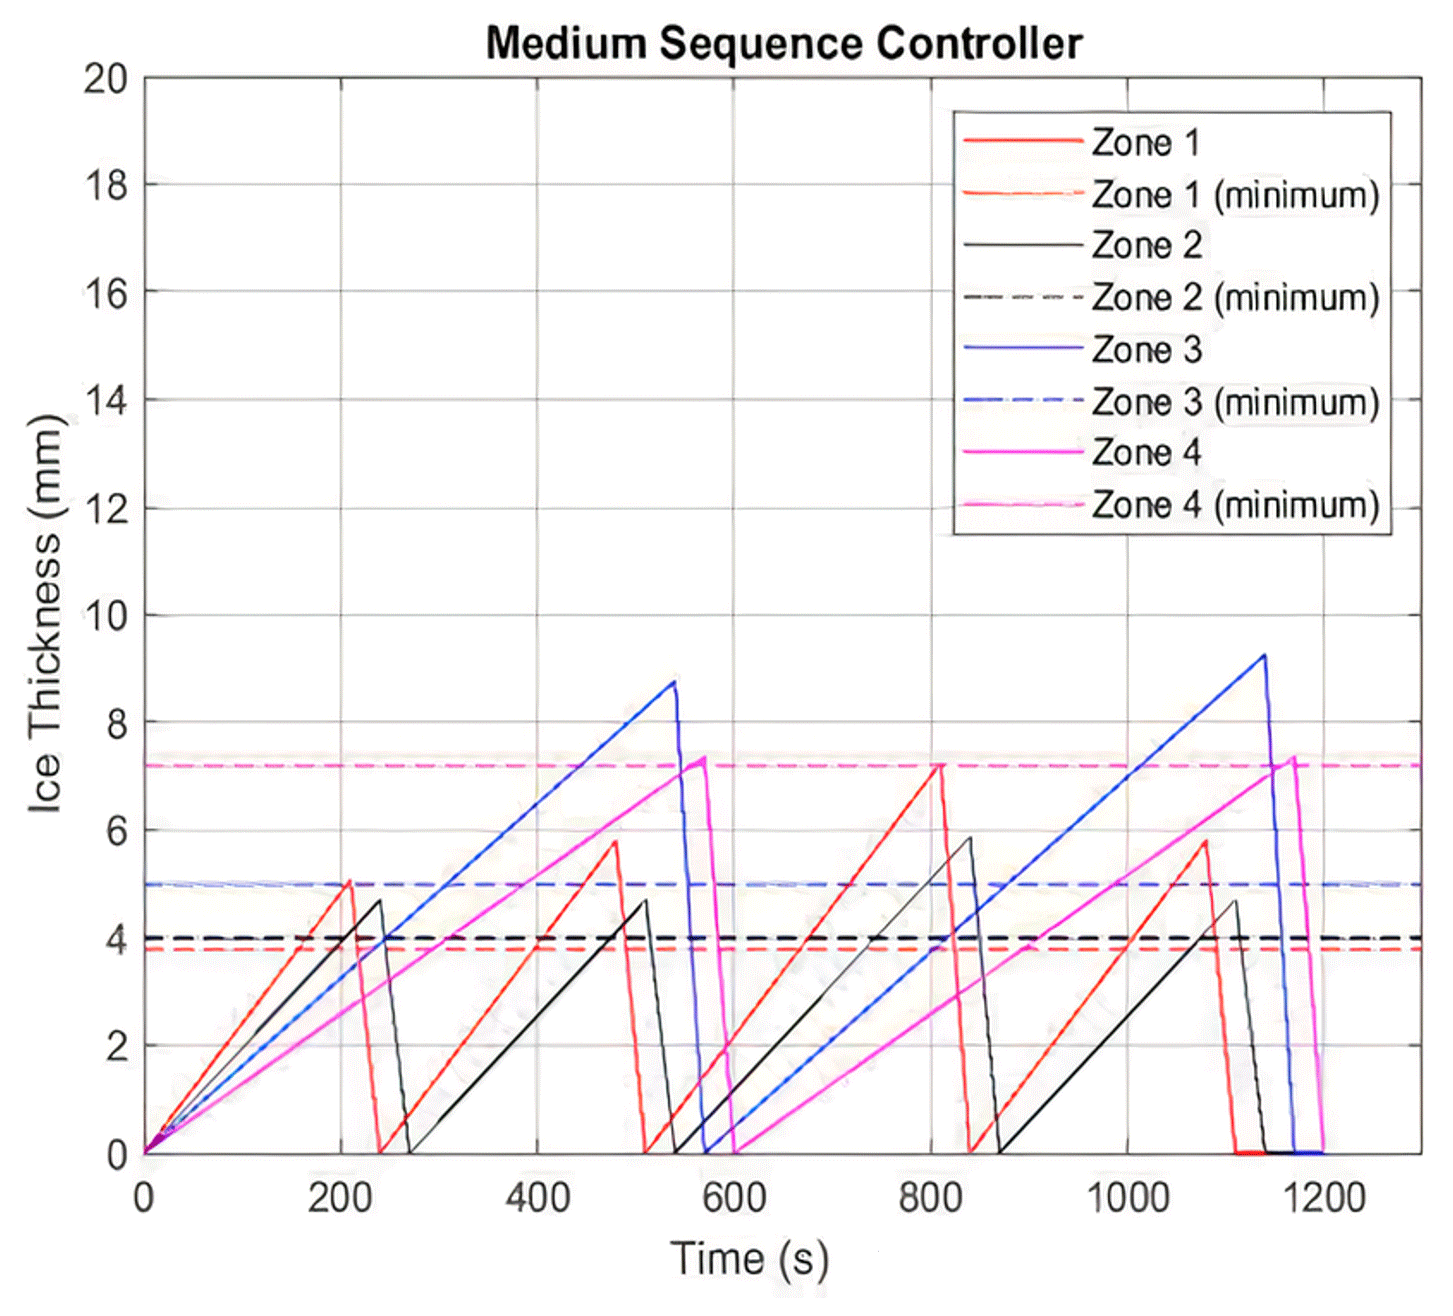
The horizontal lines represent the minimum ice thicknesses for each heater zone needed to produce cohesive failure. The slope of each line represents the ice accretion rate (mm/s) found experimentally at each zone. When the ice thickness for each zone exceeds the critical thickness value, the centrifugal force on the ice mass will dominate the ice cohesion force with the adjacent heater zone. The downward slope after the peak for each zone represents the effective shedding requirement of 30 s.
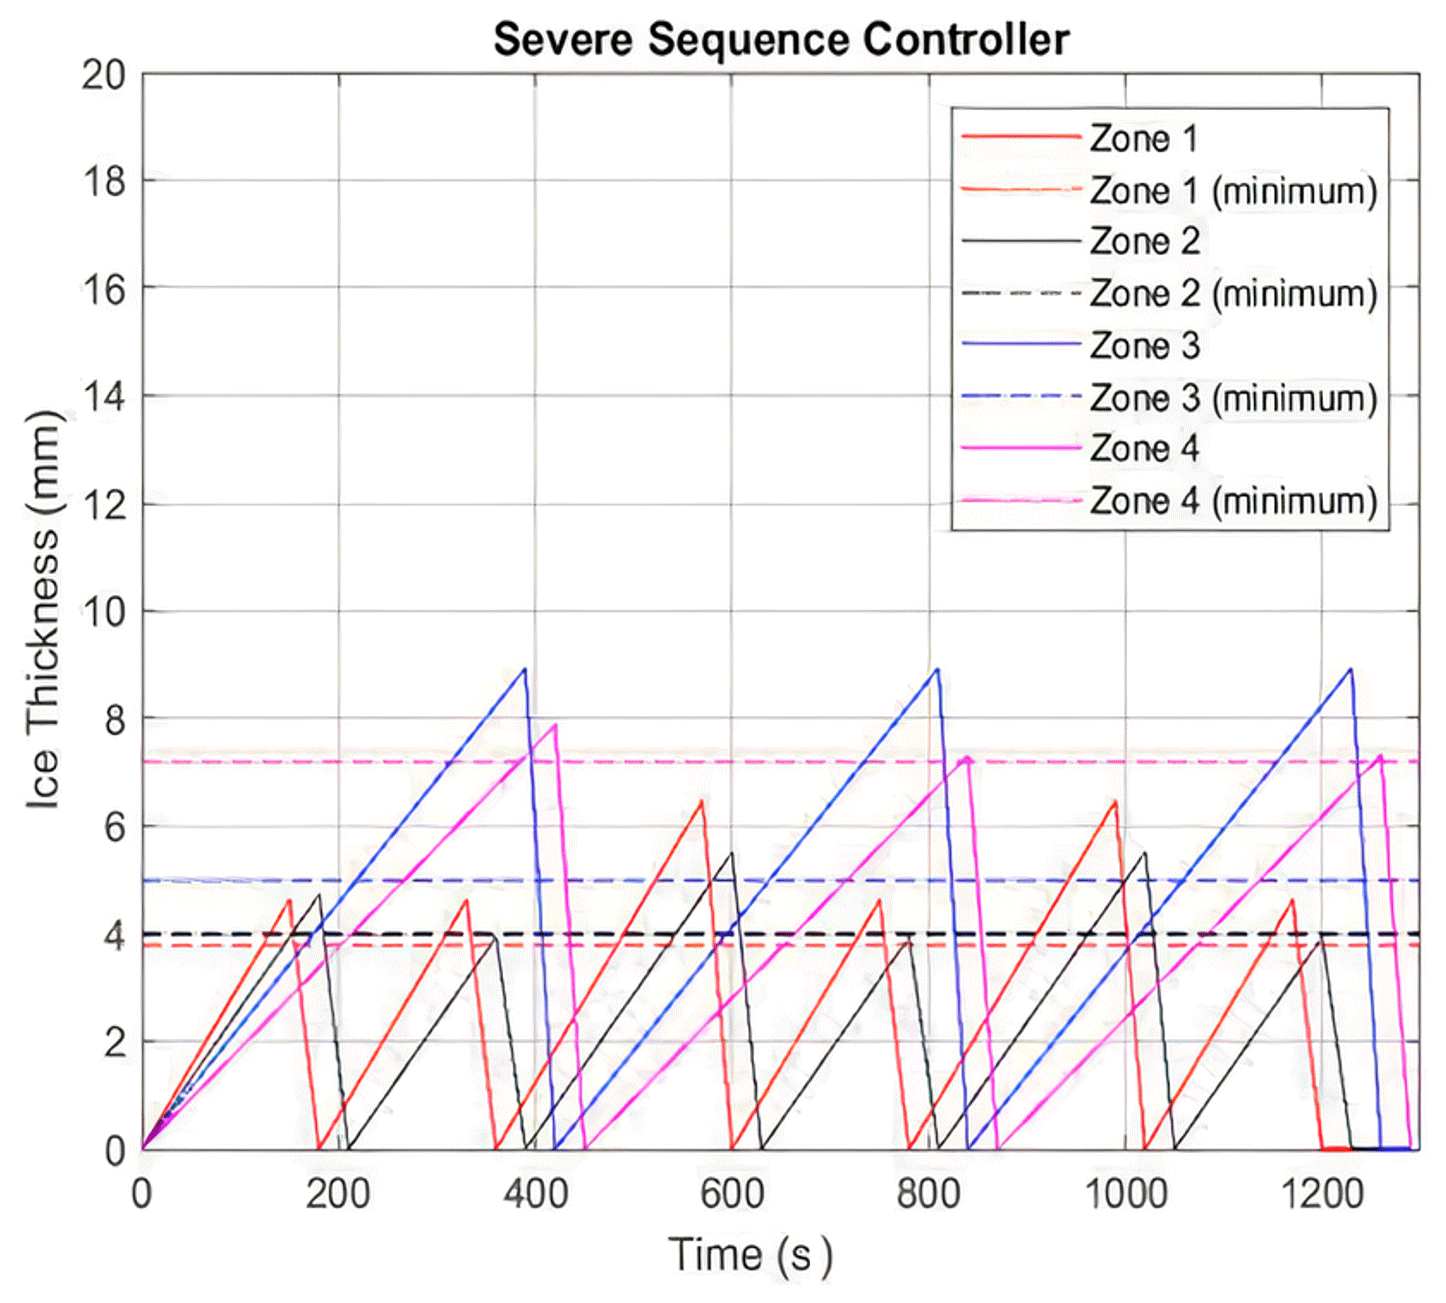
The most inboard zone, heater 4, has the smallest accretion rate and the longest time duration to reach the critical thickness value. Heater zone 3 must sacrifice aerodynamic performance to allocate the proper time to produce a shedding event for zone 4, because zone 3 must shed prior to and be ice-free before zone 4 is activated.
Knowing ice thickness rates ensures that the controller does not attempt to deice when the ice thickness has not reached a critical ice thickness. If ice sensors are not available, a conservative approach could be to turn on the heaters for a time sequence corresponding to the light icing condition, which allows more time for ice to accrete. Such an approach would introduce aerodynamic penalties for the medium and severe icing conditions, as the ice thickness accreted will exceed the minimum thickness required for shedding.
The wind turbine industry is rapidly expanding, and there is a need for an effective and low-power ice protection system. An electro-thermal heater system design procedure for a representative 1.5 MW wind turbine is described. The procedure relies on experimental data to perform the following.
-
Obtain the ice accretion slope along the span of the wind turbine blade utilizing the DU 93-W-210 airfoils for representative icing conditions. This process should rely on ice thickness sensors in the field such that the controller can determine suitable heating times to prevent ice cohesion between zones.
-
Determine the minimum thickness needed to effectively shed ice without cohesive bonding between heater zones, while delivering a 0.385 W/cm2 power density to the electro-thermal heaters (or the maximum power density available on the turbine for the ice protection system).
-
Explore the time variation in ice shedding by decreasing the power density to the electro-thermal heater to attempt to lower power delivery to the zones.
-
Design a time sequence controller based on ice accretion rates for varying icing conditions to minimize ice accretion mass and aerodynamic penalties and further reduce the potential of ice cohesion between zones.
The ice accretion rates for the selected icing conditions ranged from 0.725 to 1.850 mm/min on the tested airfoil, and these rates where used in lieu of an ice thickness sensor for the demonstration of the design process. Light icing conditions were created using clouds at −8 ∘C with a 0.2 g/m3 liquid water content (LWC) and water droplets of 20 µm median volumetric diameter (MVD). Medium icing condition clouds had a LWC of 0.4 g/m3 and 20 µm MVD, also at −8 ∘C. Severe icing conditions had an LWC of 0.9 g/m3 and 35 µm MVD at −8 ∘C. The minimum thicknesses for each heater zone beginning with the outboard section were 3.8, 4.0, 5.0 and 7.2 mm. These values were obtained experimentally and represent the full-scale ice de-bonding of a heating zone, which overcomes cohesive bonding of adjacent ice regions. The accreted ice thickness must reach these values at each heater zone to ensure the centrifugal force overcomes the ice cohesion force between zones. For the design of the controller, an effective shedding time limit was imposed. With a 0.385 W/cm2 heater power density, each zone was required to shed the minimum ice thickness within 30 s. The power density was then varied to lower values to measure the time discrepancy between shedding events. It was found that lower power densities are not suitable for the proposed configuration.
Accreting a required thickness of ice to eliminate cohesive bonding, but also keeping the ice mass that shed to a minimum for the surrounding safety, aerodynamic degradation reduction and reduction of potential imbalance forces are critical. Understanding what type of weather conditions the wind turbine experiences at its location throughout the annual season is imperative, specifically knowing the ice accretion rate at a given icing condition. Current modeling tools provide a starting point to design such deicing systems, but given the uncertainties of ice accretion to wind turbines, variations in heater performance and blade manufacturing schemes (affecting heat transfer), experimental testing procedures are suggested in this paper for the design of deicing systems for wind turbines, specifically the quantification of minimal ice mass required to promote ice detachment from inboard ice layers that have not been de-bonded. Future experiments should incorporate a test rig with multiple heater zones to effectively test for a full system performance, including integration of an ice detection sensor. The characterization of the ice accretion rate to full-scale airfoils is also required.
The research was successful groundwork for the design of a deicing ice protection system. Using ice thickness measurements allows for the design of a time sequence algorithm for varying icing conditions and minimizing ice accretion mass. If the ice accretion rate per time is known, the type of icing condition can be approximated, and that appropriate heater sequence timing can be interpolated.
| ACS | Cross-sectional area of accreted ice shape |
| CFAERTS | Centrifugal force experience in AERTS |
| CFWT | Centrifugal force experienced on the wind turbine |
| LAERTS | Span-wise length of the heater test section in AERTS |
| LWT | Span-wise length of the heater section on the wind turbine |
| mAERTS | Ice mass on the heater test section in AERTS |
| mWT | Ice mass on the heater section of the wind turbine |
| ρ | Density of glazed ice in g/cm3 |
| ΩAERTS | Rotational velocity of the rotor blade in AERTS facility |
| ΩWT | Rotational velocity on the wind turbine rotor blade |
| rAERTS | Radius from axis of rotation to center of heater section |
| rWT | Radius from axis of rotation to beginning of heater section |
LEWICE (a NASA software) was used to model ice accretion and heat transfer on the heated airfoils. LEWICE can be requested at https://software.nasa.gov/software/LEW-18573-1 (NASA Glenn Icing Brach, 2021).
The provided data sheets contain all the raw data collected during all testing phases, including icing conditions, power densities provided to the heaters, and ice shedding times. The files (in the Supplement) contain test matrices for the four different entries into the icing chamber (Phase I to Phase IV).
The supplement related to this article is available online at: https://doi.org/10.5194/wes-6-1291-2021-supplement.
DG conducted all testing and processed all the data. DG also wrote the first draft of the document. JP developed all the testing techniques, conceived the design methodology and collaborated with DG on the analysis of the data. JP also edited the final version of the document.
The authors declare that they have no conflict of interest.
Publisher’s note: Copernicus Publications remains neutral with regard to jurisdictional claims in published maps and institutional affiliations.
The work explored was funded by DuPont under a contract with The Pennsylvania State University Aerospace Department. The authors would like to thank Matthew Manelis and Clinton Miley from Dupont for the collaboration during this rewarding research effort.
This research has been supported by DuPont (grant no. 47HH0).
This paper was edited by Alessandro Croce and reviewed by Alberto Guardone, Francesco Caccia and one anonymous referee.
Ackerman, T. and and Söder, L.: An overview of wind energy status, Renewable and sustainable Energy Reviews, 6, 67–127, https://doi.org/10.1016/S1364-0321(02)00008-4, 2002.
Anderson, D. N.: Rime, Mixed and Glaze-Ice Evaluations of Three Scaling Laws, NASA Lewis Research Center, https://doi.org/10.2514/6.1994-718, 10 January 1994.
Blasco, P., Palacios, J., and Schmitz, S.: Effect of Icing Roughness on Wind Turbine Power Production, Wind Energy Journal, 20, 601–617, https://doi.org/10.1002/we.2026, 2017.
Bond, T. and Anderson, D.: Manual of Scaling Methods, NASA Technical Report, NASA/CR-2004-212875, NASA document ID 20040042486, available at: https://ntrs.nasa.gov/citations/20040042486 (last access: May 2020), 2004.
Botura, G., Sweet, D., and Flosdorf, D.: Development and Demonstration of Low Power Electrothermal De-icing System, Reno, NV: 43rd AIAA Aerospace Sciences Meeting and Exhibit, AIAA 2005-1460, https://doi.org/10.2514/6.2005-1460, 2005.
Buschhorn, S., Kessler, S., Lachman-Senesh, N., Gavin, J., and Thomas, G.: Electro thermal Icing Protection of Aero surfaces using Conductive Polymer Nanocomposites, Boston, AIAA 2013-1729, https://doi.org/10.2514/6.2013-1729, 2013.
Federal Aviation Regulation Part 25: “Airworthiness Standards: Transport Category Airplanes” and Part 29 “Airworthiness Standards: Transport Category Rotorcraft”, FAA, Washington DC, Document DOT/FAA/AR-00/30, 2002.
Feng, F., Li, S., Li, Y., and Tian, W.: Numerical simulation on the aerodynamic effects of blade icing on small scale Straight-bladed VAWT, Physcs. Proc., 24, 774–780, https://doi.org/10.1016/j.phpro.2012.02.115, 2012.
Flemming, R.: A History of Ice Protection System Development at Sikorsky Aircraft, FAA In-Flight Icing/Ground De-Icing International Conference and Exhibition, Chicago, IL, 2003-01-2092, https://doi.org/10.4271/2003-01-2092, 2003.
Han, Y. and Palacios, J.: Airfoil Performance Degradation Prediction based on Non-dimensional Icing Parameters, AIAA Journal, 51, 2570–2581, https://doi.org/10.2514/1.J052207, 2013.
Hochart, C., Fortin, G., and Perron, J.: Wind Turbine Performance under Icing Conditions, Wind Energ., 11, 319–333, https://doi.org/10.1002/we.258, 2008.
Ide, R. F. and Oldenburg, J. R.: Icing Cloud Calibration of the NASA Glenn Icing Research Tunnel, AIAA-20012-0234 and NASA/TM – 2001-210689, 39th Aerospace Sciences Meeting and Exhibit, https://doi.org/10.2514/6.2001-234, 2001.
Laakso, T., Holttinen, H., Ronsten, G., Tallhaug, L., Horbaty, R., Baring-Gould, I., Lacroix, A., Peltola, E., and Tammelin, B.: State-of-the-art of wind energy in cold climates, VTT working Papers, Vol. 152, available at: https://www.vttresearch.com/sites/default/files/pdf/workingpapers/2010/W152.pdf (last access: 12 September 2021), 2010.
Lamraoui, F., Fortin, G., Benoit, R., Perron, J., and Masson, C.: Atmospheric icing impact on wind turbine production, Cold Reg. Sci. Technol., 100, 36–49, https://doi.org/10.1016/j.coldregions.2013.12.008, 2014.
Liu, Y., Bond, L., and Hu, H.: Ultrasonic-Attenuation-Based Technique for Ice Characterization Pertinent to Aircraft Icing Phenomena, AIAA Journal, 55, 1602–1609, https://doi.org/10.2514/1.J055500, 2017.
Martin, C. and Putt, J.: Advanced Pneumatic Impulse Ice Protection System (PIIP) for Aircraft, J. Aircraft, 29, 714–716, https://doi.org/10.2514/3.46227, 1992.
NASA Glenn Icing Brach: LEWICE 3.2.3 Ice Accretion Software, available at: https://software.nasa.gov/software/LEW-18573-1, last access: September 2021.
Overmeyer, A., Smith, E., and Palacios, J.: Ultrasonic De-Icing Bondline Design and Rotor Ice Testing, AIAA J., 51, 2965–2976, https://doi.org/10.2514/1.J052601, 2012.
Palacios, J., Han, Y., Brouwers, E., and Smith, E.: Icing Environment Rotor Test Stand Liquid Water Content Measurement Procedures and Ice Shape Correlation, J. Am. Helicopter Soc., 57, 29–40, https://doi.org/10.4050/JAHS.57.022006, 2012.
Rocco, E., Han, Y., Palacios, J., and Kreeger, R.: Super-Cooled Large Ice Droplet Accretion Reproduction and Scaling Law Validation, AIAA Aviation, 8th AIAA Atmospheric and Space Environments Conference, https://doi.org/10.2514/6.2016-3279, 2016.
Ruff, G. and Berkowitz, B.: User's Manual for NASA Lewis Ice Accretion Prediction Code, NASA CR 185129, Document ID 19900011627, available at: https://ntrs.nasa.gov/citations/19900011627 (last access: 17 September 2021), 1990.
Schneeberger, G., Soltis, J., and Palacios, J.: Rotor Blade Shed Ice Length Prediction, J. Am. Helicopter Soc., 63, 1–8, https://doi.org/10.4050/JAHS.63.042009, 2018.
The Global Wind Energy Council: United States, available at: https://gwec.net/global-wind-report-2021/ (last access: 11 September 2021), 2011.
U.S. Department of Energy, Energy Information Administration: Electric Power Monthly with Data for March 2021, Technical Report, May 25, available at: https://www.eia.gov/electricity/monthly/, last access: May 2021.
Vargas, M., Broughton, H., Sims, J., Bleeze, B., and Gaines, V.: Local and Total Density Measurements in Ice Shapes, AIAA–2005–0657, https://doi.org/10.2514/1.23326, 2005.
Wind Power Report: 7th ed. London, ABS Energy Research, 2010.
Wright, W.: User's Manual for LEWICE Version 3.2, NASA/CR-2008-214255 and E-15537, Document ID: 20080048307, 2008.
Xu, J., He, D., and Zhao, X.: Status and prospects of Chinese wind energy, Energy, 35, 4439–4444, https://doi.org/10.1016/j.energy.2009.06.058, 2010.
- Abstract
- Introduction
- Objectives
- Experimental configuration
- Deicing IPS design overview
- Deicing IPS experiments
- Controller design
- Conclusions and future work
- Appendix A: Nomenclature
- Code availability
- Data availability
- Author contributions
- Competing interests
- Disclaimer
- Acknowledgements
- Financial support
- Review statement
- References
- Supplement