the Creative Commons Attribution 4.0 License.
the Creative Commons Attribution 4.0 License.
 | 02 Feb 2021
Redesign of an upwind rotor for a downwind configuration: design changes and cost evaluation
Leonardo Bergami
Frederik Zahle
David Robert Verelst
Within this work, an existing model of a Suzlon S111 2.1 MW turbine is used to estimate potential cost savings when the conventional upwind rotor concept is changed into a downwind rotor concept. A design framework is used to get realistic design updates for the upwind configuration, as well as two design updates for the downwind configuration, including a pure material cost out of the rotor blades and a new planform design. A full design load basis according to the standard has been used to evaluate the impact of the redesigns on the loads. A detailed cost model with load scaling is used to estimate the impact of the design changes on the turbine costs and the cost of energy. It is shown that generally lower blade mass of up to 5 % less than the upwind redesign can be achieved with the downwind configurations. Compared to an upwind baseline, the upwind redesign shows an estimated cost of energy reduction of 2.3 %, and the downwind designs achieve a maximum reduction of 1.3 %.
- Article
(706 KB) - Full-text XML
- BibTeX
- EndNote


Historically, the first wind turbines were dominantly downwind turbines, for which the rotor was placed behind the tower, as seen from the incoming wind. This turbine configuration was considered safer than the alternative upwind configuration with the rotor in front of the tower since the rotor blades would bend away from the tower under turbine operation. Early research, mainly by NASA and associated partners, compared the downwind rotor configuration with the upwind configuration. Glasgow et al. (1981) showed that the wake behind the tower caused significantly higher cyclic flapwise blade root loads in the downwind configuration compared to the loads of the upwind rotor configuration. However, neither for the flapwise mean blade root loads nor for the edgewise blade root loads could differences between the two configurations be shown.
Many residents living near early downwind wind turbines reported high noise levels and especially the high unsteadiness, a “thumping” sound being reported as a nuisance (Metzger and Klatte, 1981). The rotor blades passing through the tower wake caused high low-frequency noise and amplitude modulation. Measurements in an anechoic wind tunnel by Greene (1981) demonstrated that downwind rotors on a lattice tower radiated more noise than downwind rotors on a tubular tower due to the narrower and deeper tower wake. Upwind rotor configurations, on the other hand, were found to be significantly less noisy. Found to be overall advantageous, upwind rotor configurations dominated industrial applications, as well as the focus of research efforts during the 1990s and 2000s.
Cost-driven industrial designs prefer larger rotor areas to capture more energy. The rotor blades for modern-sized upwind wind turbines are designed under a constraint of maximum blade tip deflection to avoid a collision of the blades with the tower. Aiming to eliminate the tip deflection constraint for modern-sized wind turbines under normal operation, the downwind configuration is currently coming into research focus again.
Advances in wind turbine noise mitigation techniques since the 1980s, as well as airfoil design, could overcome the previously reported noise issues and bring them to an acceptable level. Reiso and Muskulus (2013) successfully eliminated the tower shadow effect on the fatigue loads by using a fairing. While the fairing is a rather costly device to implement, the study further showed the potential that fatigue loads can be significantly reduced by a reduced flapwise stiffness, alleviating loads by blade deformation.
Ning and Petch (2016) used an optimization framework to compare the levelized cost of energy (COE) of land-based upwind and downwind turbines. The study included turbines of different wind classes, rated power, and rotor diameter. Modest cost savings could be achieved for the downwind configuration compared to the upwind configuration for wind turbines of wind class III. Blade mass savings had to offset the higher tower cost originating from the increased tower bottom bending moment as the gravity overhanging moment of the rotor nacelle assembly coincides with the moment from the thrust force.
In a system-level design study for large rotors, Zalkind et al. (2019) showed that coned downwind rotors significantly reduce peak blade loads during operation but have a lower annual energy production (AEP) compared to a coned upwind configuration of the same size. While the group predicts larger main bearing peak loads for the downwind configuration related to blade length, mass, and cone angle, they suggest that the increased tower loads observed by other groups could be overcome by properly balancing the nacelle on the tower.
A reduced edgewise damping for a downwind configuration compared to an upwind configuration was identified by Wanke et al. (2019a), leading to significantly higher edgewise loads in the downwind configuration than in the upwind configuration. In a following study on a 2.1 MW turbine, Wanke et al. (2020) showed that large downwind cone angles could reduce the edgewise damping further as the out-of-plane contribution of the edgewise mode shapes is decreased. A significantly reduced tower torsional stiffness, on the other hand, e.g., a lattice tower configuration, would benefit the downwind configuration.
Aligning the blades with the loading direction of aerodynamic forces, gravity, and centrifugal force is an opportunity for the downwind configuration to significantly reduce flapwise bending loads, instead loading the blade in axial tension. Such a load distribution is achieved by adjusting the cone angle and blade prebend. These downwind rotors with so-called “load alignment” have been suggested as an option to reduce blade mass significantly, utilizing the large cone angles and downwind prebend from Loth et al. (2017) for a 13.2 MW wind turbine. The study also indicated mass savings compared to the conventional upwind rotor when the blade length is increased to compensate for energy production losses.
Bortolotti et al. (2019) used an optimization framework to compare the cost efficiency of an upwind configuration with a downwind configuration and a downwind configuration with “load alignment”. The analysis for a 10 MW turbine showed difficulties in reaching a more cost-efficient design for the downwind configurations than the conventional upwind configuration due to other component costs.
Downwind configurations with a passive wind direction alignment are often proposed. Such yaw systems could be cost efficient as they simplify the turbine control and reduce operation and maintenance costs as they could purely be used for cable unwinding. However, Wanke et al. (2019b) showed in an example of a 2.1 MW turbine with a tilted rotor that such systems align passively at high yaw angles for high wind speeds resulting in significant power loss. The study concluded that tilt angle, cone angle, and blade stiffness would need to be specifically designed for a free yawing downwind configuration. This would expose additional constraints on a downwind turbine design, while the benefit in terms of a cost-efficient turbine is questioned.
The cost-efficient design of wind turbines has been approached to an increasing extent by the use of optimization frameworks. Over the years, rotors designed for the maximum efficiency result in the most cost-efficient turbine designs have been questioned. Optimizing a conventional 10 MW upwind turbines for the lowest cost of energy, Bottasso et al. (2016) showed that designing the rotor for minimum cost instead of maximum annual energy production results in rotors with larger chord, higher thickness, and lower AEP. Higher absolute thickness could utilize higher stiffness with less material resulting in the lower cost compensating the AEP loss from the less efficient, thicker airfoils.
Lower rotor loads could potentially result in the possibility to increase the rotor length and therefore increase the overall power capture. This could be a more cost-efficient rotor than a traditional design approach also for upwind turbines. Bottasso et al. (2015) tried, therefore, to design a low-induction rotor for a 10 MW wind turbine with an optimization framework in which the blade shape was designed with the common aerodynamic parameters, such as chord, twist, and airfoil thickness. Their work showed that maximum AEP solutions might be achievable with low-induction rotors, but the minimum cost solutions might be different from the maximum AEP solutions. It was seen to be very dependent on the cost model if the higher AEP could pay for the increased rotor diameter.
Loenbaek et al. (2020) investigated design trends by an optimization of power capture based on 1D momentum theory. Their work indicated that the maximum power capture is achievable by a larger rotor diameter and operation at a lower power coefficient (Cp) than the maximum. For a conventional upwind turbine, this is achieved by so-called thrust clipping or peak shaving. The peak shaving is a control feature that reduces extreme flapwise loads and also increases the minimum blade tip to tower clearance in the upwind configuration while sacrificing AEP.
This paper shows how rotor design trends for a downwind configuration differ from design trends for an upwind rotor configuration due to differences in design loads inherent to the configuration. Full design load bases (DLBs) are calculated to evaluate the impact of the rotor design trends on the turbine loads, AEP, and estimated cost of energy. The work in this paper is based on the specific example of the commercial S111 2.1 MW turbine. A low-fidelity optimization tool is used to redesign the commercial rotor for an upwind and a downwind configuration, generating the aerodynamic planform and flap- and edgewise stiffness distribution. High-fidelity tools are used to generate inputs for load calculations, the full load base analysis, mass, and AEP calculations. An industrial grade cost-scaling model based on the load calculations is used to estimate the impact of the designs on the cost of energy. Analyzing the impact of the redesigned rotor on load and cost allows us to discuss the potential of a downwind rotor configuration compared to an upwind rotor configuration in greater detail. The discussion shows the impact of the cost structure and other design choices like the tubular tower influencing the potential of the downwind configuration in comparison to the upwind configuration. The results show that a pure rotor redesign will hardly achieve a lower cost of energy for the downwind configuration than for the upwind configuration for the specific chosen example turbine.
This work aims to compare design trends for an upwind configuration of an existing turbine with a downwind configuration from a cost and mass perspective. The chosen example turbine is the Suzlon S111 2.1 MW turbine, a commercial upwind turbine. The turbine is designed for wind class IIIA with glass fiber blades and a rotor diameter of 112 m on a 90 m tubular tower. The turbine is pitch-regulated with a variable speed generator. The shaft is tilted, the rotor is coned, and the blades are pre-bent. All three geometrical parameters increase the blade tip to tower clearance in the upwind configuration.
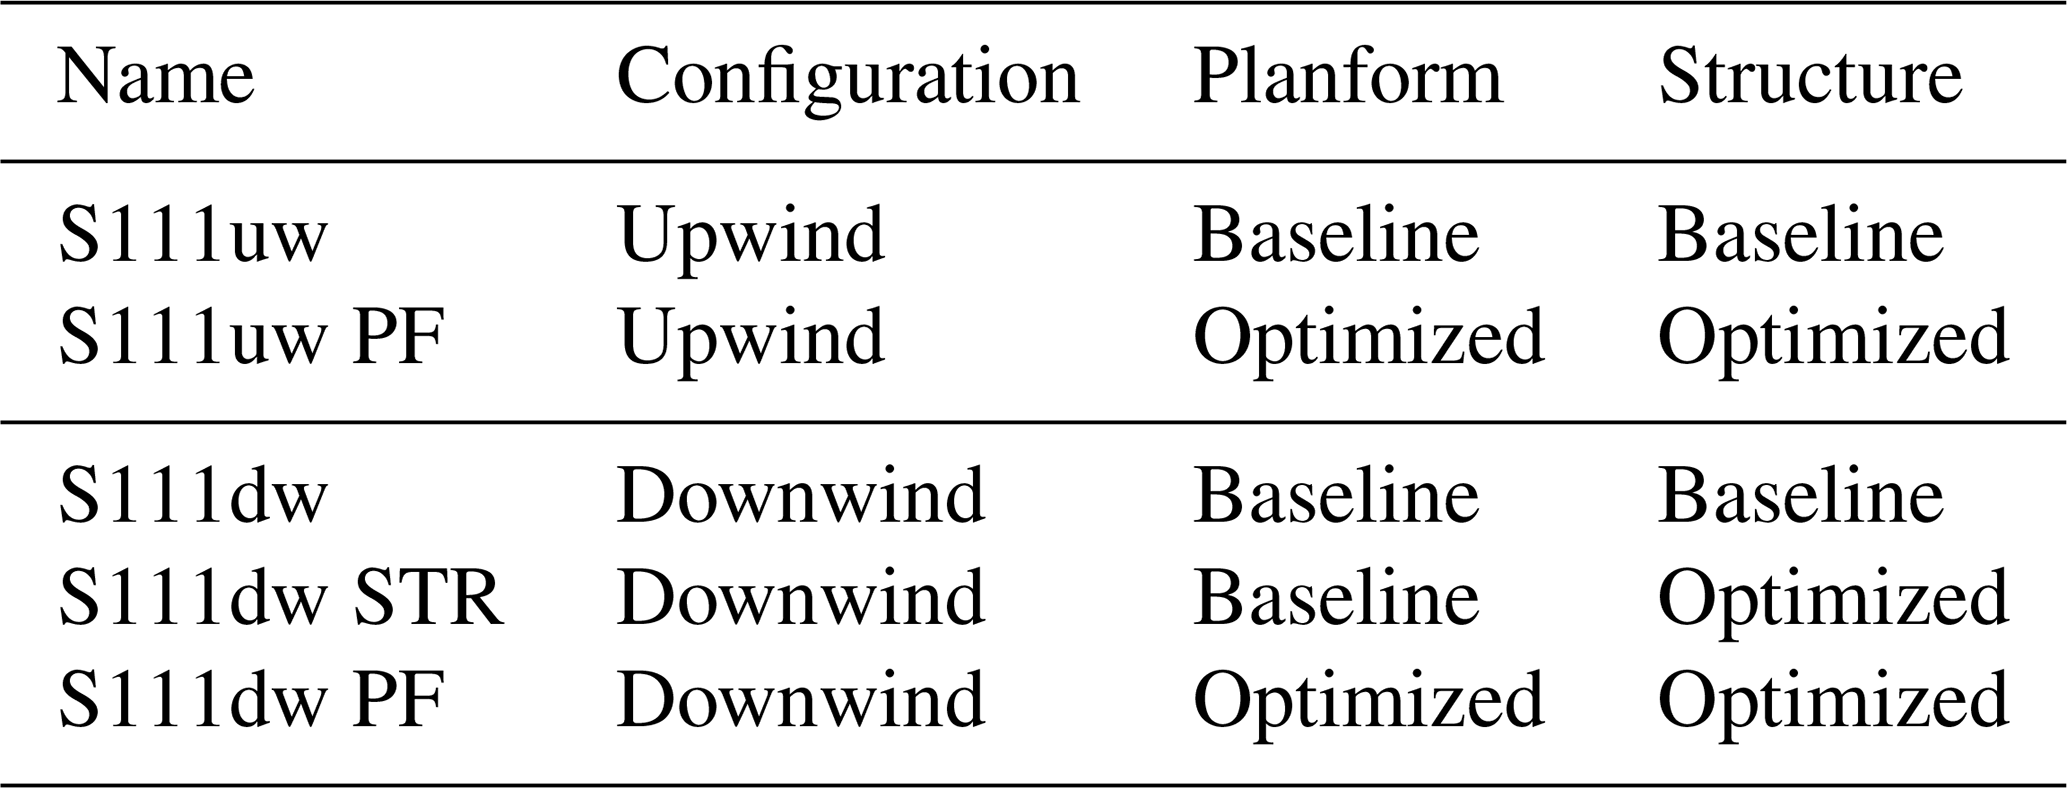
For this turbine, a new baseline rotor blade is defined, inspired by the commercial blade, which is adapted to the framework. For the baseline rotor, an upwind turbine configuration is generated, called S111uw. Additionally, a downwind baseline turbine configuration is defined with the baseline rotor called S111dw. The downwind configuration utilizes the same cone and tilt angle, both increasing blade tip to tower distance. Since the blade prebend of the rotor is towards the blade pressure side, the prebend decreases the blade tip to tower distance in the downwind configuration. Three rotor redesigns are made. For the upwind configuration, a blade planform and internal structural redesign is made. The design is called S111uw PF. For the downwind configuration, two scenarios are regarded. Firstly, a pure blade material reduction is performed, called S111dw STR. This corresponds to a configuration change from an existing upwind configuration into a downwind configuration while keeping the blade molds but saving blade material. Secondly, a blade planform and structure redesign in the same manner as for the upwind redesign is called S111dw PF. Table 1 shows a summary of the design configurations regarded, as well as the name indicators used throughout the study.
Table 1Turbine configurations regarded in design and cost estimation.
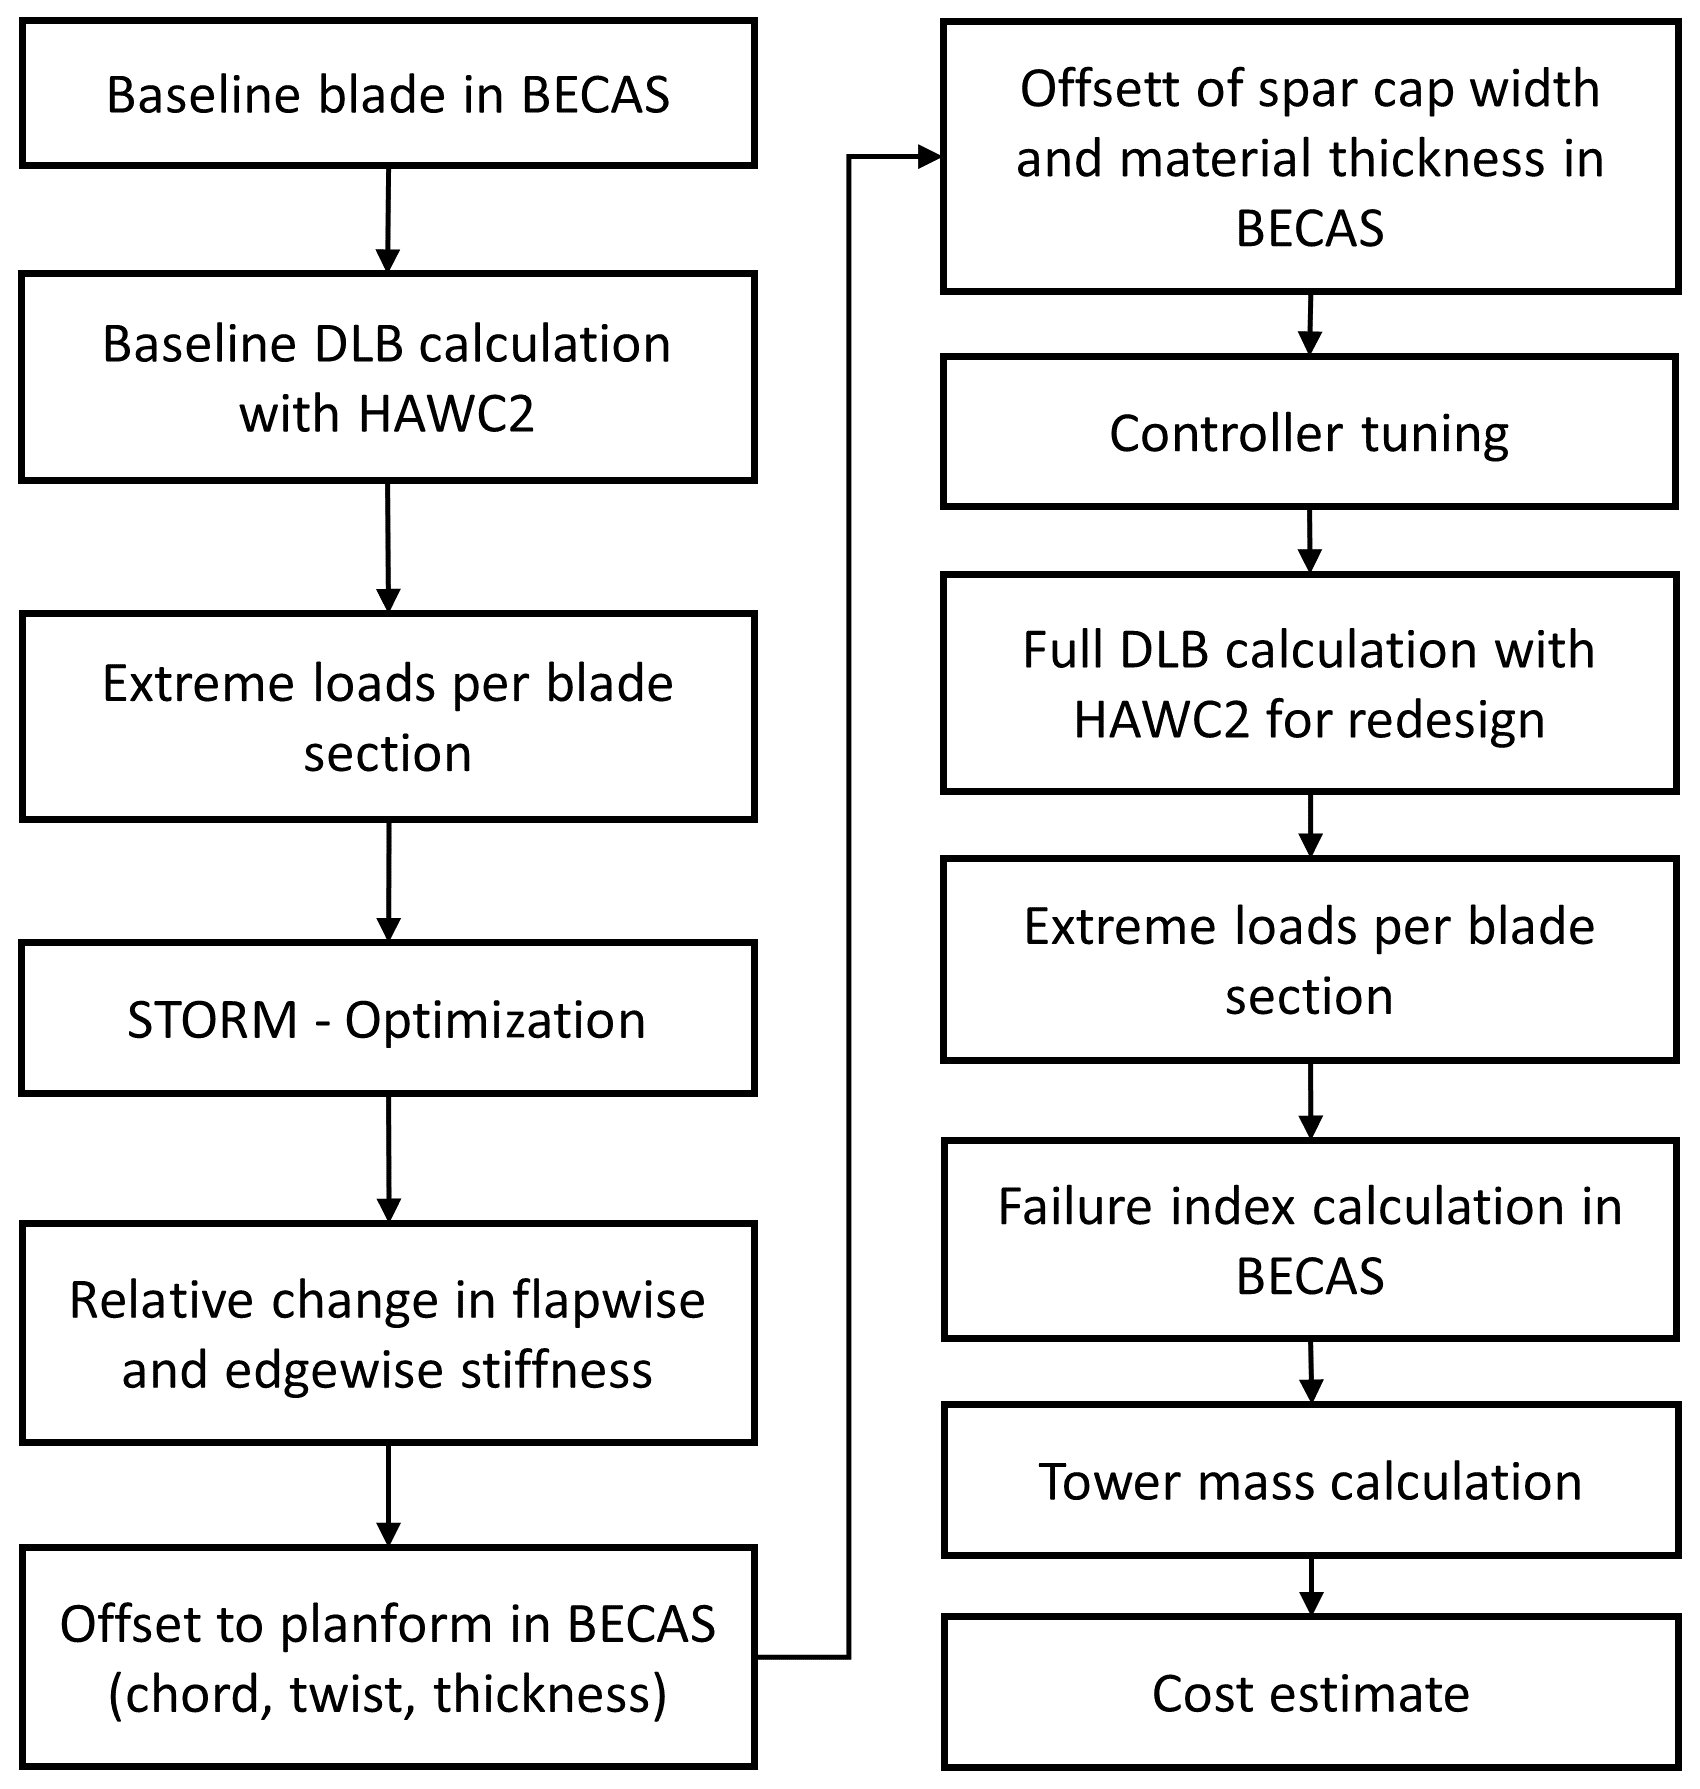
The rotor design procedure uses a low-fidelity optimization tool to create a blade planform and stiffness distribution. The planform and stiffness distribution are afterwards matched within the HAWTOpt2 framework (Zahle et al., 2015, 2016) to create a full HAWC2 (Madsen et al., 2020) setup for aeroelastic load calculations. The higher-fidelity tools are not used for optimization but exclusively for an evaluation of the design resulting from optimization with the low-fidelity tool. For all designs, a full design load basis is calculated. The loads are used to calculate the failure index of the blades and to evaluate if the redesigns are acceptable. From the tower loads, the required tower material is calculated. Finally, the costs of all five designs are calculated with a load and mass scaling cost model. This design procedure is conceptually outlined in Fig. 1.
2.1 Baseline blade in BECAS
The baseline blade is set up in BECAS (a 2D cross-sectional analysis tool; Blasques, 2011) as it is implemented in the HAWTOpt2 framework. This approach has several advantages. Firstly, through BECAS, it allows for having reasonable structural blade properties which can be directly exported as inputs for load simulations with HAWC2. Secondly, even though the HAWTOpt2 framework is not utilized for optimization, it allows us to parametrically modify the planform and structural dimensions of the baseline blade. Within the workflow of the framework, the structural properties are recalculated within BECAS and can be exported for load calculations.
The baseline blade is described according to the parameterization adopted in HAWTOpt2 (Zahle et al., 2016). To set up the baseline blade in BECAS, the planform geometry is directly loaded into the framework. From blade length, relative thickness, chord, twist, and the airfoil geometry, the blade surface is created as a 3D lofted surface. The chordwise position of the main structural regions, namely trailing edge caps, spar caps, shell panels, trailing edge, and leading edge are defined in 19 cross sections relative to the chord length. For each region, the positioning and material stacking is applied from blade lay-up plans.
For the baseline blade structural properties, total mass, static mass moment, and blade eigenfrequencies are compared to the commercial blade to assure the baseline is reasonable and fairly close to the commercial blade. The same has been done with turbine eigenfrequencies and damping, as well as the design-driving loads for blades, main bearing, and tower.
2.2 Design load basis and controller definition
Full design load bases are simulated with HAWC2 (version 12.7) according to the IEC standard 61400-1 Edition 3 (IEC, 2014). The interpretation of the design load basis by the Technical University of Denmark (DTU), described by Hansen et al. (2015), is used. For the downwind configuration, the load simulations are conducted with an inflow inclination angle of 0∘. The combination of positive flow inclination angle and turbine tilt was seen to be beneficial in downwind configurations by Wanke et al. (2019a). It is therefore assumed to be a more realistic scenario with relevant site conditions to simulate wind fields without an inclination angle for downwind configurations. The upwind configurations are subject to the inclination angle of 8∘, as required by IEC standard for upwind configurations.
The annual energy production (AEP) is calculated for all designs. It is calculated from the normal operation load case with six turbulence seeds for all configurations without inclination or yaw angle. The turbulence intensity follows the class A IEC standard.
For all load calculations, the controller setup from DTU (Hansen and Henriksen, 2013) is used in this study with two additional features. The controller is for pitch-regulated variable speed turbines with partial and full load regions. Optimal Cp tracking is used in the partial load region and a constant torque strategy in the full load region. The detailed description of the controller can be found in Hansen and Henriksen (2013), and the source code is freely available online (https://github.com/DTUWindEnergy/BasicDTUController, last access: 2 December 2019). The controller has been automatically tuned using a pole placement routine implemented in HAWCStab2 (Hansen, 2004), which is described in more detail by Tibalidi et al. (2014). Different events can be initiated from the main controller, such as start-up and shutdown or failure situations.
Start-up and shutdown pitch speed in the implemented routines of the DTU controller need different values for downwind configurations than comparable upwind configurations. The moment due to both thrust force and the gravity overhanging moment of the rotor nacelle assembly increases the tower bottom bending moment. Start-up routines, especially at high wind speeds, need to have a lower pitch speed in downwind configurations than the comparable upwind configurations. Shutdown routines, especially during gusts, have to be of faster pitch speed in the downwind configuration. Both adjustments have to be made to unload the tower bottom as the moment due to the thrust force is aligned with the overhanging rotor moment due to gravity. A faster pitch decrease in gust situations reduces overshoot in the thrust force due to the gust and therefore the tower base loads. During start-up, a slower pitch increase avoids a thrust overshoot and related high tower loads.
For a control routine that reflects an industrial controller, three failure scenarios are adapted. Firstly, the failure scenario of one blade getting stuck at a current pitch angle, which means that the pitch angle of one blade is kept constant at the current pitch angle at the time of failure. The deviation of the pitch angle from the set point initiates a stop routine of the turbine. Secondly, the pitch run away (design load case, dlc, 2.2p) is not included since the failure mode is prevented by the type of pitch actuators used. Thirdly, for the scenario of a parked turbine with high yaw errors, the wind field is interpreted as a wind direction change of 360∘ over 570 s.
To eliminate fault cases from the design-driving loads and to stay similar to an industrial controller, two additional control features are implemented as separate dynamic-link libraries manipulating the output or input from the controller to HAWC2 for practical reasons. The first addition is a thrust control aiming to reduce fluctuations of the thrust. The second addition is a conditional stop routine avoiding operations at high yaw errors and high wind speeds. The following explains the two additions in more detail.
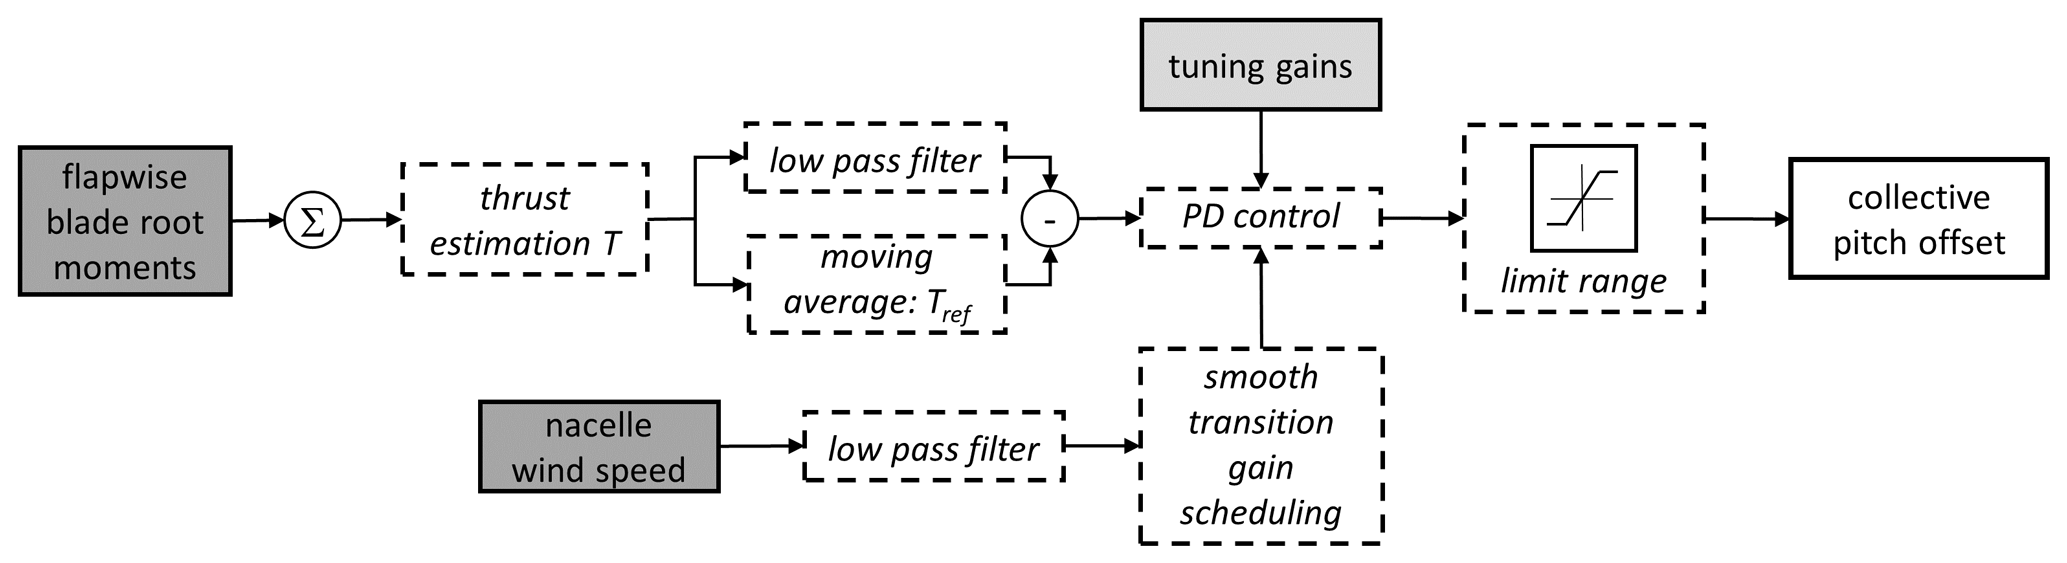
Figure 2 shows the thrust control feature. The thrust control uses the sum of the flapwise blade root moments to estimate the thrust T. On the one hand, the thrust signal is low-pass filtered, and, on the other hand, a reference thrust Tref is calculated as a moving average. A PD controller is used to generate a collective pitch offset under a range limitation. The pitch range is limited to avoid high loads from turbulence (lower limit) and high power losses (upper limit). The filtered wind speed of the nacelle anemometer is used for wind-speed-dependent gain scheduling to guarantee a smooth transition between active and non-active thrust control.
The conditional stopping routine triggers the turbine stop as soon as the filtered wind speed and the filtered wind direction are above a certain threshold. For practical reasons of implementation, the emergency stop is triggered.
2.3 STORM – optimization
The redesign of the rotor blades is performed using the in-house code STORM (Suzlon Turbine Optimization fRaMework). The code is aimed at fast conceptual rotor design optimization studies and couples steady aerodynamic AEP considerations with a simplified blade structural estimation. In the present study, it minimizes the blade mass under AEP constraints. The code, written in MATLAB, is organized as a nested optimization problem. The outer optimization loop controls the blade geometrical planform and minimizes the blade mass subject to linear constraints on the geometrical design variables, nonlinear constraints on minimum AEP, and feasibility of all the inner optimization problems (Eq. 1).
In this study, the blade geometry design variables are limited to four spline control points that set the thickness-over-chord (ToC) ratios in fixed points along the blade span. The geometry at the blade root is fixed up to the point of maximum chord for all configurations. For each iteration of the outer optimization loop, six steps are taken; they are described in the following sections and briefly consist of the following.
-
The blade ToC spline is defined from the control points (the four design variables).
-
The blade geometrical planform is outlined in terms of chord, twist, and thickness distribution. An inner optimization returns the chord distribution that minimizes the squared difference from a target axial induction distribution.
-
Steady operational loads and the power curve are retrieved from a standard steady blade element momentum (BEM) formulation. An inner optimization sets the pitch angle to maximize aerodynamic power, subject to limitation on maximum power, thrust, aerodynamic flapwise bending moment, and angle of attack (for stall considerations).
-
The steady BEM loads are scaled to extreme loads to be used in the structural optimization.
-
The blade structural properties are determined, solving a fast low-fidelity structural optimization problem. The blade structure is simplified to two symmetric glass fiber spar caps joined by an ellipse (Fig. 4). The inner optimization sets the thickness and width of the spar cap and the ellipse thicknesses to minimize the blade static mass moment, subject to constraints on maximum strain, maximum deflection, maximum linear buckling index, and design variable range.
-
Finally, the outer loop optimization objective function is evaluated. The estimated blade mass is here taken as an objective function, and minimum AEP output is enforced as a nonlinear constraint.
Figure 3 shows a flow chart of the nested optimization routine with the tool STORM. In the outer loop optimization, the pattern search uses the ToC distribution as a variable (Sect. 2.3.1). From those, the aerodynamic planform is calculated, e.g., chord and twist distribution (Sect. 2.3.2). A BEM code is used to calculate the loads over the operational range (Sect. 2.3.3), and a scaling approach is used to retrieve the extreme loads from the steady loads (Sect. 2.3.4). In an inner-gradient-based optimization with analytical gradients, the girder thickness, girder width, and shell thickness are found (Sect. 2.3.5) with the minimum mass as the optimization objective). It has been checked that the optimization algorithm has converged to the given tolerances. This nested optimization approach guarantees only that the optimum within each step of the loop is found. The solution is not necessarily the global optimum. However, using the same approach for both configurations allows us to investigate the design trends for the two turbine configurations. The following subsections describe the single blocks of Fig. 3 in more detail.
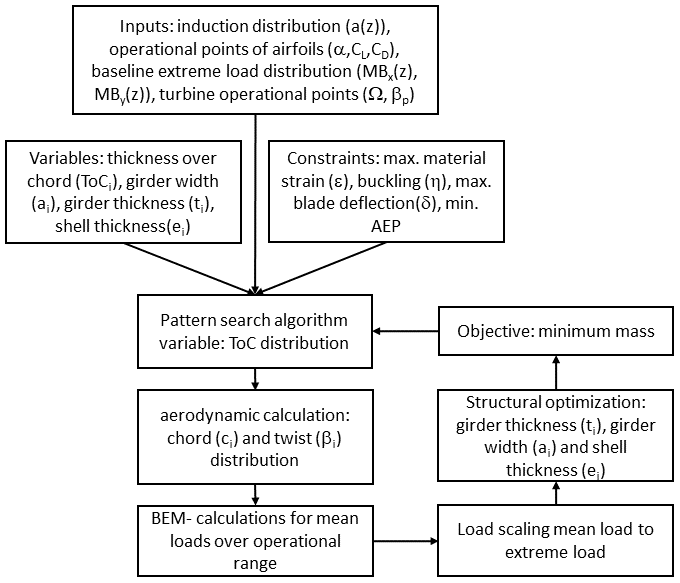
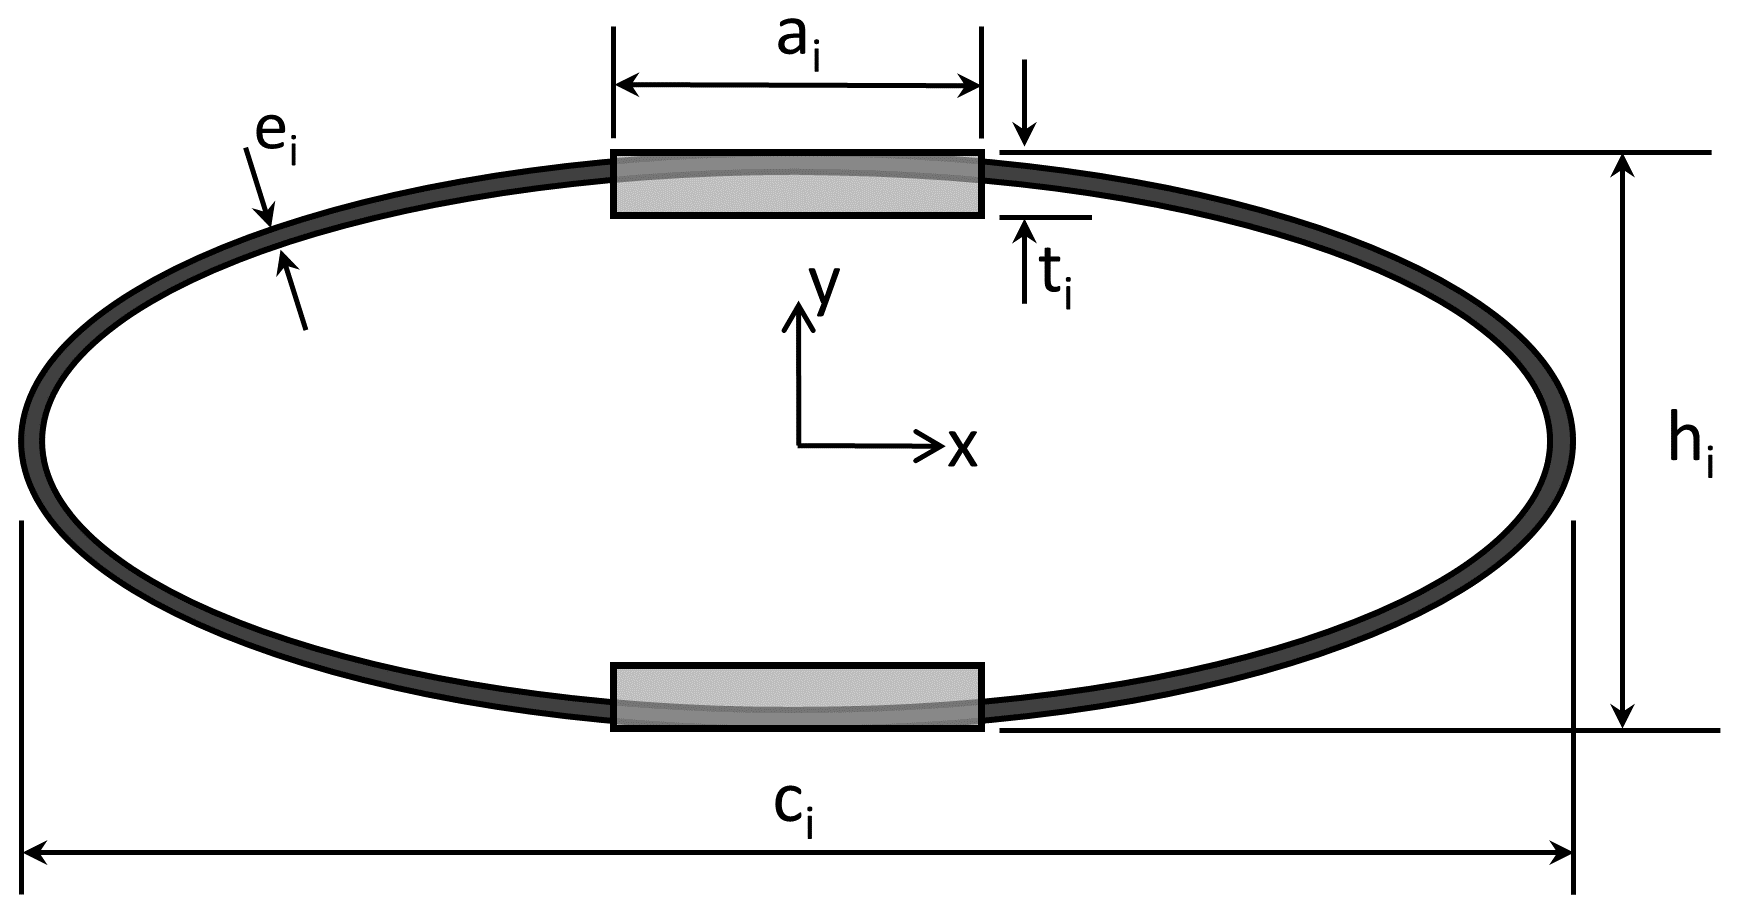
Figure 4Simplified model of the blade structure for each cross section, as applied in STORM. The section height h and chord length c are fixed with the blade geometry for each iteration. The structural optimization design variables are then for each section the spar caps thickness ti and width ai and the ellipse thickness ei.
2.3.1 Outer optimization loop
The outer optimization problem (Eq. 1) is solved using the MATLAB pattern search method (Kolda et al., 2006). The algorithm is set up to perform a complete search and pooling around the current point.
where m is the mass of the blade depending on the variables of spar cap width , spar cap height , the shell thickness , and the section height at each of the N cross sections. The constraints are a minimum AEP, a maximum blade deflection δ, a maximum strain ε, and a maximum buckling coefficient η. A list of all formula symbols can also be found in Table A1 in the Appendix.
The design variables are here the four thickness-over-chord (ToC) control point ratios. Linear constraints on the design variables are enforced to ensure that they are maintained within reasonable ranges and that monotonically decreasing values are selected from root to tip. The objective function for this problem consists of minimizing the estimated blade mass, subject to nonlinear constraints to reaching a minimum AEP output (as derived from the BEM steady power curves) and ensuring feasibility in all the inner optimization problems.
2.3.2 Blade geometrical planform
Once the iteration ToC control points are fixed, the ToC distribution along the blade span is outlined with a piecewise cubic Hermite interpolating polynomial. A wind speed in the below-rated variable speed range is chosen, and the target axial induction distribution for the blade at that wind speed is fixed as an input. Similarly, the angles of attack at which the airfoils are expected to operate at that wind speed point are also fixed. The target axial induction is kept according to the original commercial blade. It has been assumed that this is a typical induction distribution resulting from a commercial aerodynamic design process. It has been kept as the optimization tool is not capable of reflecting the complexity of fully variable induction, also regarding related concerns such as stability or stall margins.
With the given input set (ToC, target induction, target angle of attack) the blade geometry is then retrieved in terms of chord, twist angle, and thickness for each section along the blade span. The chord is retrieved by solving a set of independent minimization problems (Eq. 2), one for each section along the blade span. The optimization objective is to minimize the square error between the target axial induction for that section, the current induction, and function of chord, subject to a linear constraint on the minimum and maximum chord.
In the current iteration, the axial induction is retrieved from a steady BEM formulation, following Ning's implementation (Ning, 2014), in which the BEM convergence is solved by minimizing a residual function of the flow angle. Once the chord is fixed, the twist angle is simply set as the difference between the converged flow angle returned by the BEM and the input angle of attack for that section (minus eventually a chosen constant reference pitch angle).
2.3.3 Steady loads and power curves
Given the blade geometrical definition like from the step above, the steady power and loads curves are then determined running a standard steady BEM formulation (Hansen, 2008), sweeping wind speeds between cut-in and cut-out. From the steady power curve, the annual energy production (AEP) is retrieved, accounting for the chosen wind speed distribution.
The operational pitch angle at each wind speed is retrieved from a simple optimization loop, in which the objective is to maximize the aerodynamic power output, subject to constraints on maximum power (the aerodynamic rated power), maximum thrust force, maximum aerodynamic blade flapwise bending moment, and minimum “stall distance” (Eq. 3). The latter is defined as a minimum margin in degrees between the steady BEM angle of attack and the point of maximum lift for the corresponding airfoil; the constrained stall is only enforced for the outer 40 % of the blade span.
where β is the pitch angle, P is the aerodynamic power, T is the thrust force, and Mflap is the flapwise bending moment. The angle of attack is α, and αstall distance is the stall distance. In the case of this study, the constraint of maximum thrust and maximum aerodynamic flapwise bending moment are not active.
2.3.4 Loads scaling
The maximum aerodynamic steady flapwise bending moment is retrieved from the step above and is scaled up to an extreme load using a ratio retrieved from full DLB HAWC2 simulations of the baseline blade:
Mextreme baseline is the extreme load distribution of the baseline rotor extracted from full DLB simulations in HAWC2 for the baseline blade. The distribution is fitted with a fourth-order polynomial to ensure that it can be differentiated. Section forces are derived with the polynomial from the bending moments. The MBEM baseline moment is the corresponding maximum steady BEM model retrieved for the same baseline blade.
In the case of the downwind configuration, a second flapwise design load case for cut-out wind speed is considered as the minimum tower-blade clearance arises in different loading conditions. The load distribution for the maximum deflection towards the tower Mextreme deflection is thus scaled from the baseline loads at cut-out wind speed as
For the downwind configuration, a decrease in the loading results into a larger deflection towards the tower.
The edgewise loads remain unscaled as they are driven by the aerodynamic torque, as well as the gravity load.
To verify the load scaling approach, it has been checked that the tower clearance from dynamic HAWC2 simulations is captured reasonably well. Also the failure indices for each blade section have been checked to assure that also locally on the blade sections the approach captures the loads reasonably well. No direct comparison between the scaled loads and the dynamic loads from HAWC2 has been done.
2.3.5 Blade structural design
The simplified blade structural model is based on the work of Blasques and Stolpe (2012) and is also presented in the thesis work of Carstensen (2017) and Andersen (2018). The blade is described as a sequence of beam elements, each with a cross section simplified to the elements shown in Fig. 4. The main load-carrying structure is simplified as a symmetric girder with two glass reinforced plastic (GRP) spar caps connected by a GRP ellipse. The major axis of the ellipse is taken equal to the section chord and the distance between the spar caps taken equal to the section height, thus coupling the structural problem to the aerodynamic planform definition. The structural optimization problem has thus three design variables for each structural section i along the blade: the spar cap thickness ti and width ai and the ellipse thickness ei.
The load cases described in the previous section are applied to the finite beam element model, and the structural optimization aims at minimizing the blade static-mass moment, subject to constraints on the range of the design variables, maximum strain levels on caps and ellipses, maximum tip deflection for the deformed blade, and maximum buckling coefficient for a single spar cap. The structural optimization problem can be stated as
with the tip deflection for the deformed blade δ, the strain levels on caps and ellipses ε, and the buckling coefficient η.
The buckling coefficient is added to the optimization problem compared to the references. The buckling coefficient is calculated under the assumption of an orthotropic plate under compression load. The compression load Nz is obtained from the bending moment, assuming that the internal flapwise bending moment Mx can be distributed as two forces acting on one girder side as compression forces and on the other girder side as tension forces.
The buckling coefficient η is then obtained via
with the elastic modulus E, the Poisson ration ν, and the shear modulus G.
The optimization is solved with the Interior Point Optimizer, Ipopt (Wächter and Biegler, 2006), and analytical gradients are given for the objective and the constraint functions, thus speeding up the process considerably (Blasques and Stolpe, 2012). The solution returns a reliable estimate of the overall blade mass (and hence blade cost), which is here taken as the objective for the outer optimization loop.
2.4 Design evaluation
The optimized planform (chord, twist, and thickness distribution) and the changes in the structural geometry (spar cap width, thickness of the spar, and trailing edge caps) are applied in HAWTOpt2 according to the planform calculated by STORM. All thickness distributions are fitted by hand at five control points, and a spline fit is applied in between the control points. The HAWC2 inputs are extracted from HAWTOpt2, and a DLB is calculated for each redesign. From the DLB, the maximum load at each blade cross section is extracted. The failure index is calculated with BECAS for each cross section. The design is accepted if the failure index if is . The failure index calculated by BECAS is not used in the design process.
The DLB calculation is further used to calculate the tower wall thickness w for a tubular tower of the given outer wall diameter D. The tower is divided into 50 cross sections, and the outer diameter, as well as the load distribution, is varied linearly between tower top and tower bottom. Within a for loop, the wall thickness is increased until the stress σsteel reaches the allowed stress of the tower steel material.
where the bending moment M is the bending moment of the cross section, SF is the safety factor for steel material, and Wb is the section modulus calculated as
The iteration is done twice: once for the extreme loads and the according stress limit for steel and once for the lifetime equivalent load from the fatigue calculation and the fatigue stress limit for steel. From the two resulting wall thicknesses, the maximum thickness is picked for each cross section. Constant masses for the tower interior are added and kept the same as for the baseline. The new tower mass distribution, as well as the stiffness redistribution, does not enter the DLB calculations.
2.5 Cost estimation
The cost model used for the cost evaluation consists of costs that scale with the mass, such as tower and blade costs. For other components, the costs scale with a design-driving load or measure called cost driver (CD). The cost driver is scaled with a factor fCD to mass to the component mass Costcomponent. A second factor fmass to cost is defined to scale component masses to component costs.
Other cost components, e.g., logistics or operation and maintenance costs, are scaled directly with the factor fCD to mass from a cost driver to the cost. Table 2 shows the cost drivers for the components entering the applied cost model. All component costs sum up to the capital expenditures (CAPEX). The operation and maintenance costs form the operational expenditures (OPEX). The OPEX costs are calculated with a net present value for a turbine lifetime of 20 years. The COE is calculated from the CAPEX, the OPEX, and the AEP of a 20 year lifetime.
The component costs and total turbine costs (CAPEX + OPEX) of the baseline have been compared to the commercial turbine to assure a reasonable cost scaling and cost distribution within the present study.
Table 2Cost drivers (CDs) for turbine cost and mass split by main cost components.
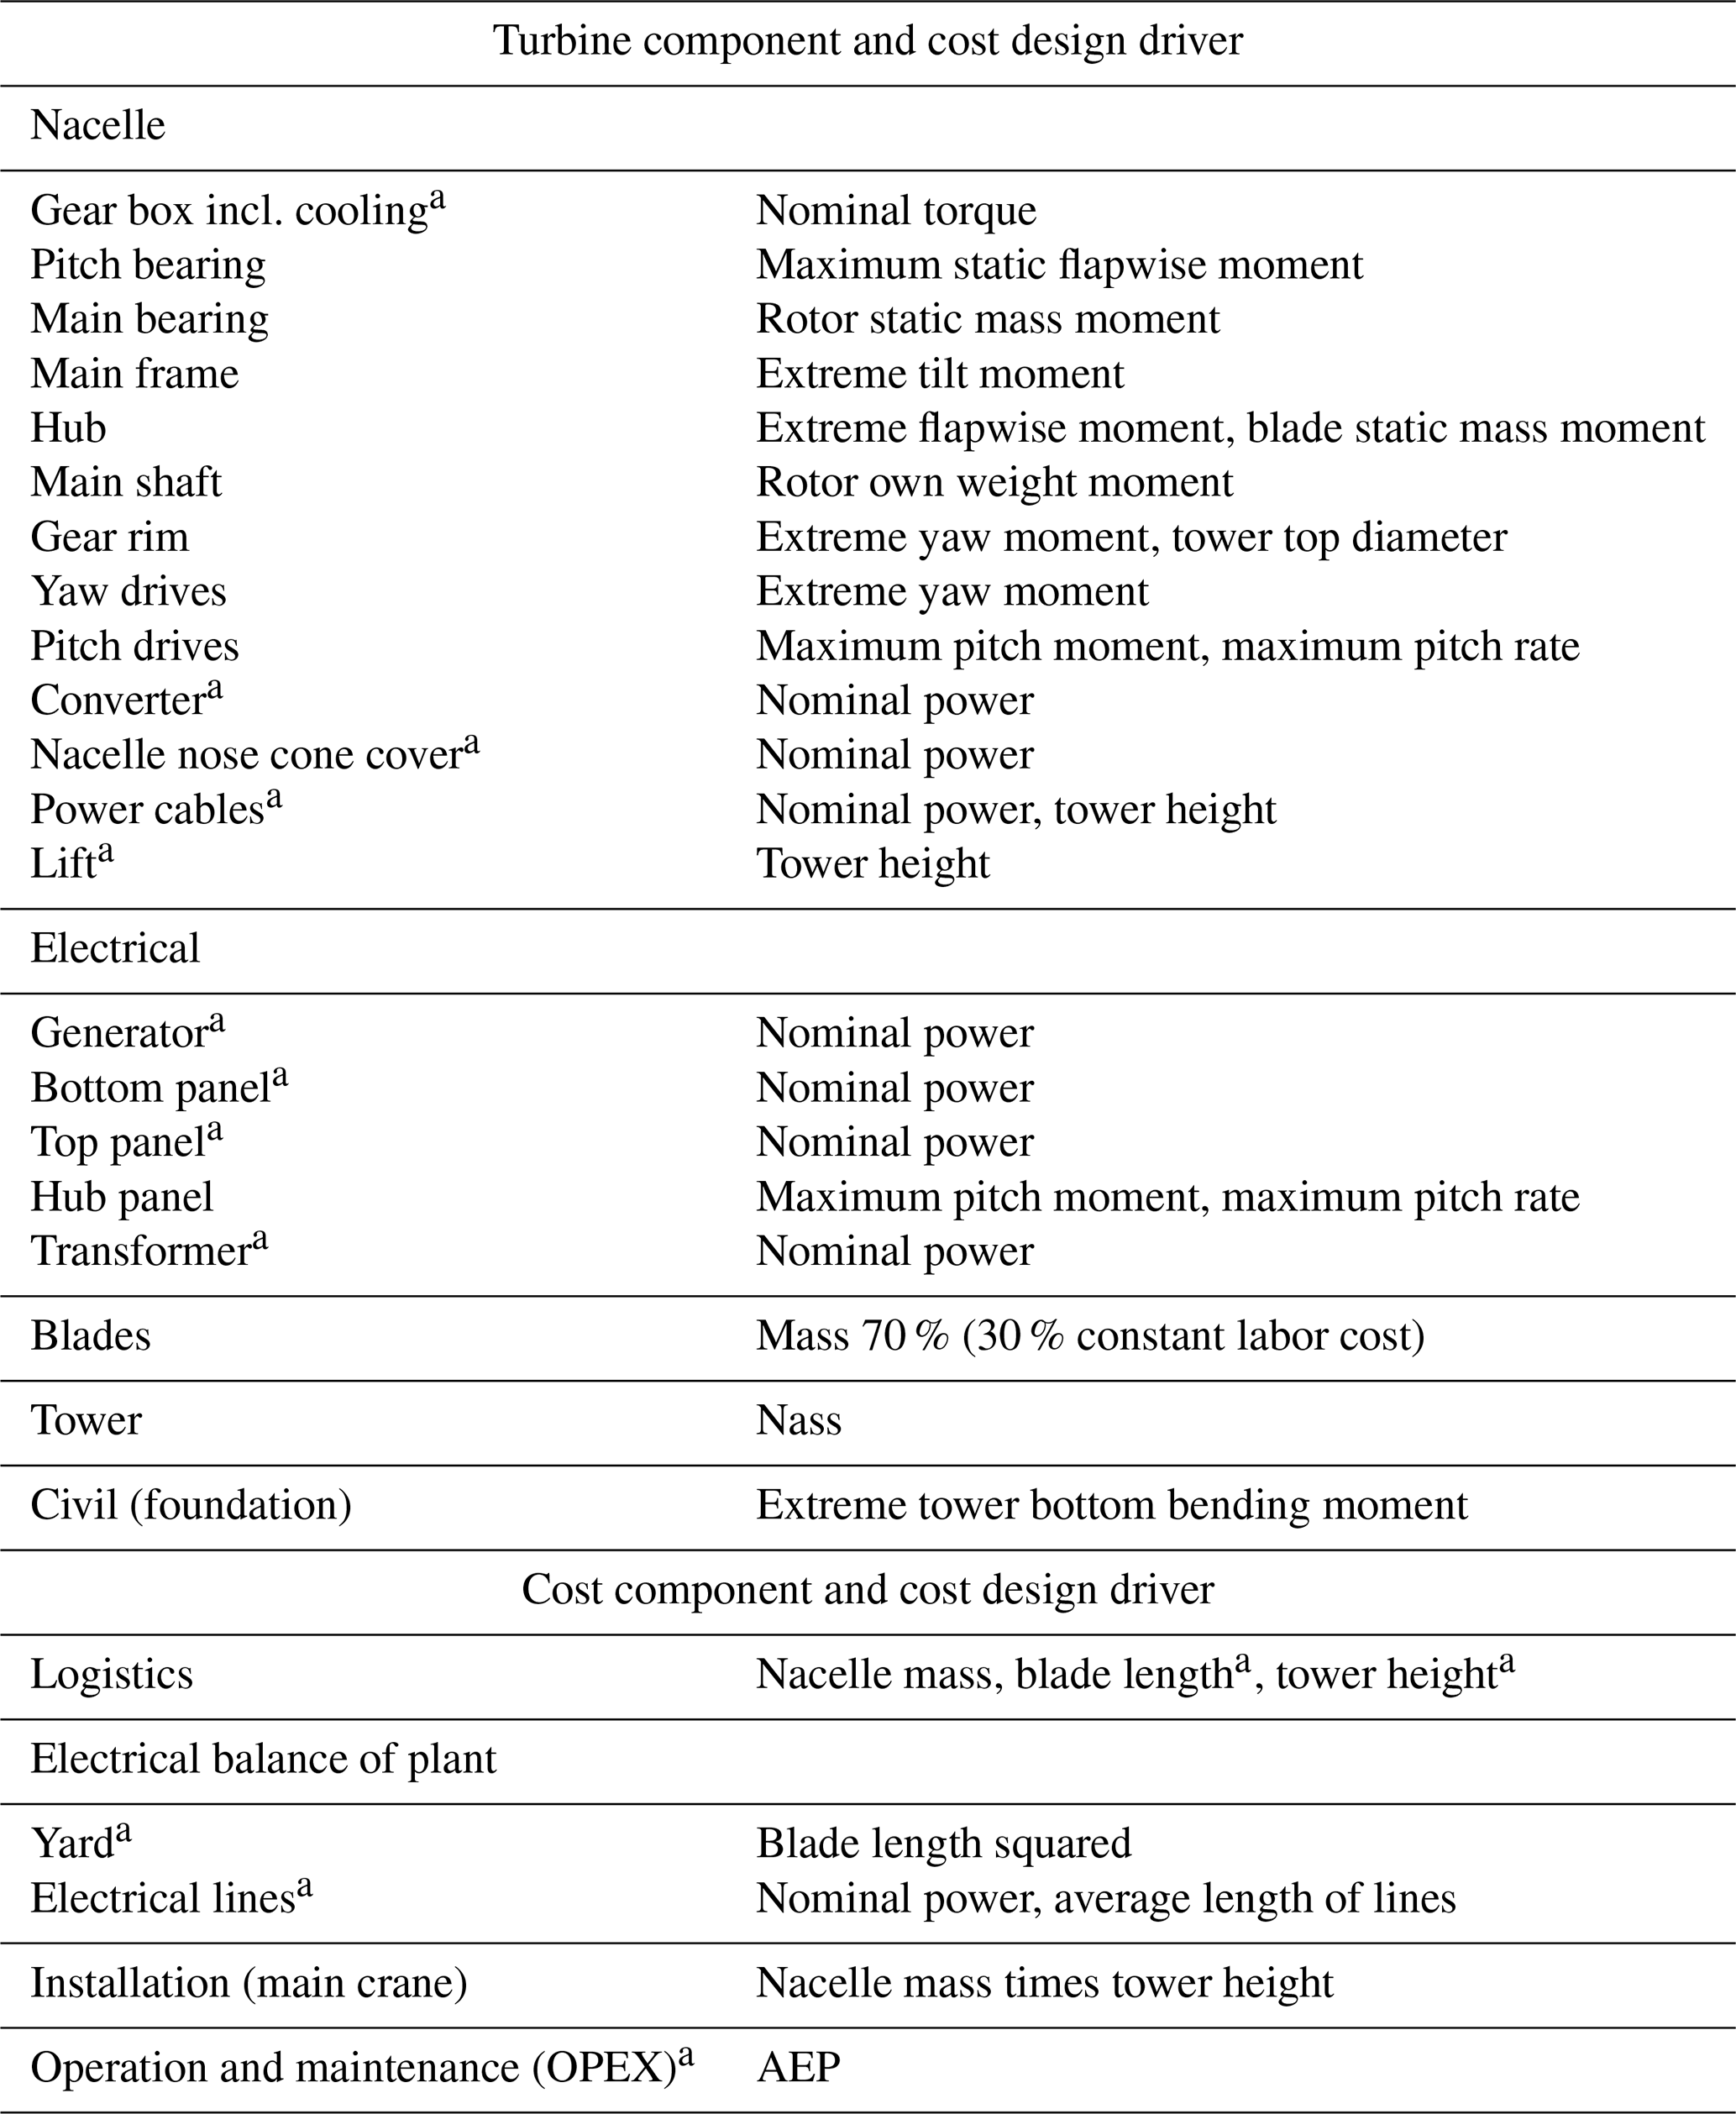
a Indicates costs that are not scaled within the study due to CD.
The following section presents the resulting design configurations regarding the planforms and resulting blade masses. Further, the design-driving loads and the resulting changes in turbine costs and COE are presented. All results are shown relative to the S111uw design configuration as the data are confidential.

Figure 5Comparison of planforms for different designs. Thickness over chord ratio and the range of the thickness constraints, chord and twist are normalized with the maximum chord.
3.1 Design configurations
Figure 5 shows the planforms resulting from the design workflow. All values are normalized with the maximum chord. The figure shows that the chord and the twist distribution change only slightly, while larger differences can be observed for the thickness over chord distribution, which is likely primarily due to the induction distribution being kept fixed during the optimization, while the larger changes in thickness are due to the direct coupling between AEP constraint, blade structural constraints, and blade mass. For the S111uw PF and S111dw PF, the thickness over chord ratio increases from the 70 % span and inboard compared to the baseline (S111uw). The S111dw PF has a slightly lower thickness than the S111uw PF design in this area up to the tip. From 40 % span and inboard to the displayed region, the S111dw PF design shows a larger thickness over chord ratio than the S111uw PF design. In the outer 8 % of the blade span, the PF redesigns show a greater thickness than the baseline blade. The latter is an artifact of the combination of the spline type chosen and the fixed airfoil thickness at the blade tip. For none of the redesigns is the constraint on thickness over chord active.
While the S111uw PF design is constrained in blade deflection, in none of the downwind designs is the blade deflection constraint active. All the resulting redesigns are generally utilizing the maximum strain of the material over a larger blade span than the S111uw and S111dw design configurations. All downwind redesigns are fully strain constrained in the spar caps. However, the tower clearance for the S111dw PF design is only marginal. In the structural module of the optimization, the buckling constraint is active along the full blade span. The downwind configurations generally show greater shell thickness than the upwind configuration.
Generally, the difference in active design constraints between the S111uw PF and S111dw PF design are that the S111uw PF design is strain constrained only in a small part of the mid-span section, and the tip deflection constraint is active. The S111dw PF design, on the other hand, is fully strain constrained over the full blade span, and the tip deflection constraint is not active.
For all redesigns of the rotor blade, significant mass savings of at least 12 % could be achieved. The lowest blade mass savings are achieved by the upwind configuration. For the S111uw PF, 12.5 % of blade mass could be saved. For the S111dw STR, 14.5 % mass savings is achieved, and 17.1 % blade mass reduction was observed for S111dw PF. Table 4 summarizes the blade masses for all design configurations, together with other data collected.
The planform redesigns utilize greater stiffness with less material by using thicker airfoils in the inboard part, resulting in an overall reduction in mass. In the outboard part, thinner, more efficient airfoils compensate for a production loss of the inboard part of the blade. This effect is amplified as a small AEP penalty was allowed in the design procedure. From the S111dw STR, it can be seen that the downwind configuration benefits from lower flapwise loads and a release of the tower clearance constraint resulting in a reduced blade mass. A greater shell thickness is required to carry the higher edgewise loads in the downwind configurations. Comparing the S111dw PF design to the S111uw PF design, a further effect of the edgewise load increase can be seen. To carry the increased edgewise loads, there are two options. The first one is to increase the shell thickness like for the S111dw STR design. The second option is to increase the stiffness by using airfoils with higher relative thickness. The solution found in the optimization routine for the S111dw PF is a combination of both, showing slightly thicker airfoils on the inboard part for the S111dw PF than for the S111uw PF. Another solution to carrying the increased edgewise loads is an increased chord, but since the variation in chord is limited due to a fixed induction and tip speed ratio, this design freedom is not utilized. The lower flapwise loads in the S111uw PF design allow us, on the other hand, to compensate for a power loss with slightly thinner airfoils in the outboard part. The chord distribution is hardly changing as the AEP is constrained to not deviate from the baseline AEP. As this results in a similar lift level along the blade for all designs and the induction distribution is frozen, the chord length does not change. The twist is simply adjusting the given operational point of the airfoils at the given spanwise position.
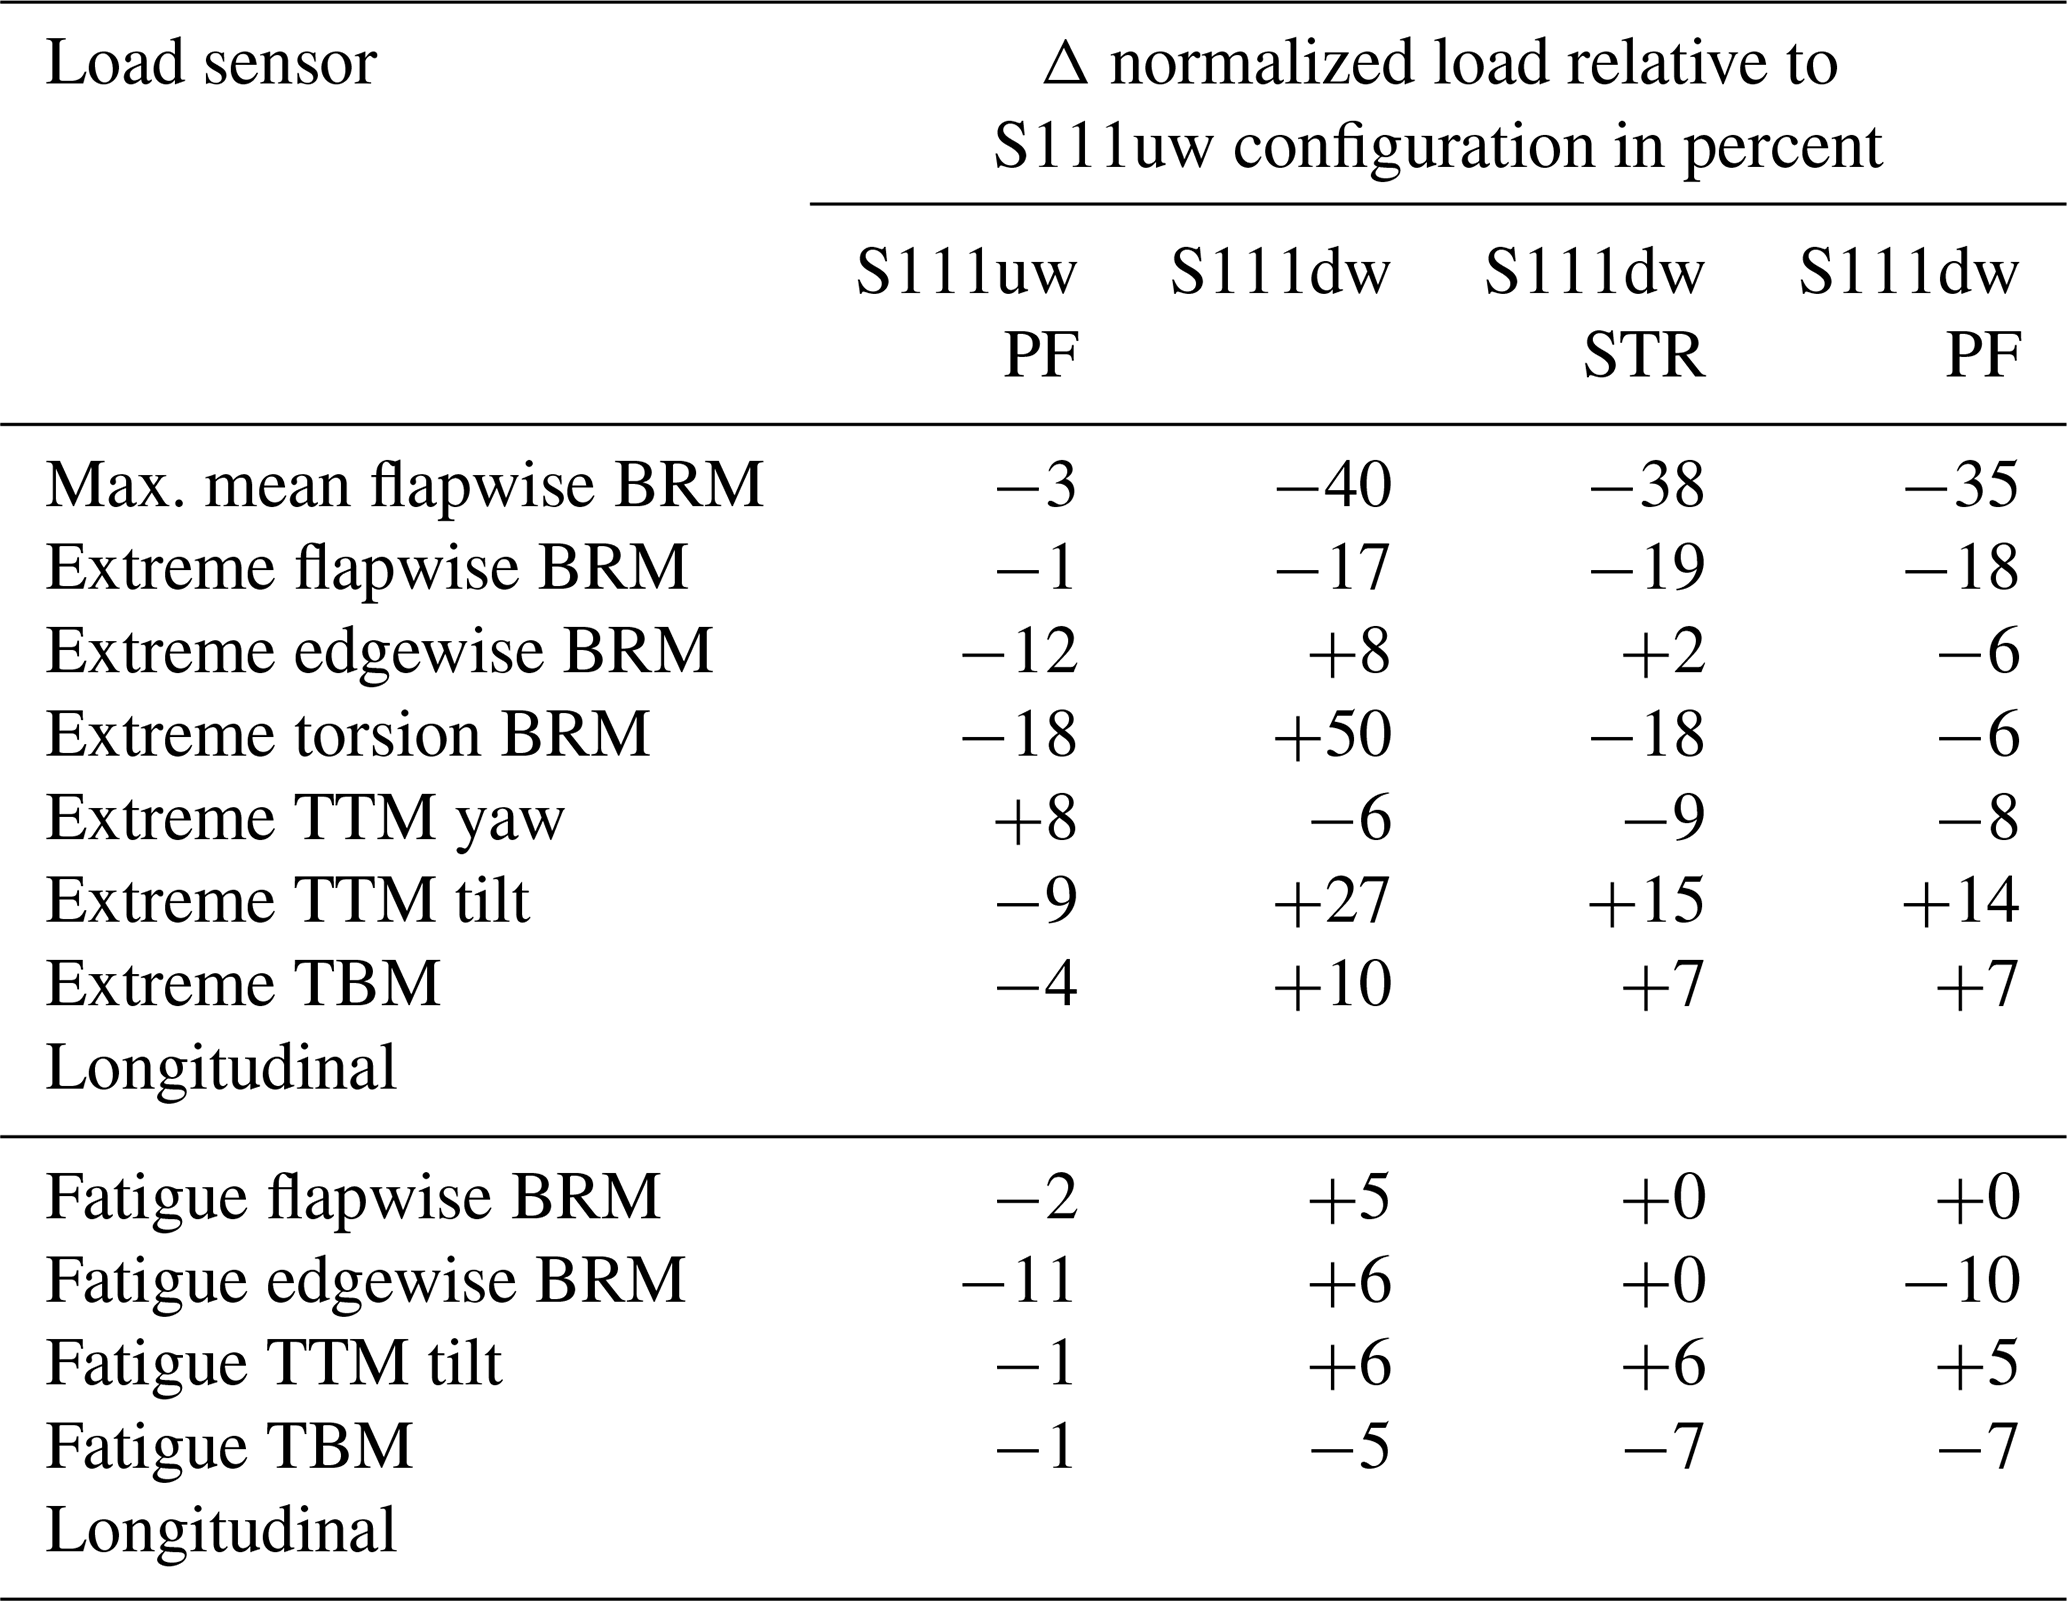
Table 3Turbine loads for mass and cost drivers. Blade root moment (BRM), tower bottom bending moment (TBM), and tower top moment (TTM).
3.2 Cost driving loads from full DLB calculation
The following section shows the loads driving either the cost components in Table 2 or the designed tower and blade mass. For all regarded designs, the minimum tower clearance is guaranteed. The operation at high wind speeds and high turbulence level (DLC 1.3) is design driving for the minimum tip to tower distance in the downwind configuration as the outboard part of the blade is subject to negative lift forces. High pitch angles at high wind speeds cause the negative lift force, and the blade tip bends towards the tower. For the upwind configuration, the operation at the thrust peak at high turbulence (DLC 1.3) is design driving for the minimum tip to tower distance. For all loads entering the cost model either directly or via the mass calculations DLC 1.3, the operation at extreme turbulence remains design driving. The only exception is the extreme blade root torsion moment in which load cases of operation during wind direction change, operation at extreme yaw errors, or yaw errors during parked situations with a locked rotor (DLC 1.4, DLC 2.2y, or DLC 7.1) are design driving. Table 3 shows the loads influencing the cost estimation of the designs relative to the S111uw configuration. It can be seen that the S111uw PF design clearly benefits from the reduced blade mass on the edgewise extreme and fatigue blade root bending moment, as well as on the tower bottom bending moment. The only disadvantage is an increase in the tower top yaw moment.
The table also shows that the downwind designs generally benefit on the flapwise mean, flapwise extreme blade root moment, and the related tower top yaw moment. This is mainly due to the alignment of the rotor cone and the rotor forces (“load alignment”). The tower top tilt moment is increased in the downwind designs compared to the upwind designs. Here, the influence of the tower shadow, as well as the alignment of the rotor overhanging gravity moment with the moment due to thrust force, is observed. Due to the latter, an increase in the extreme tower bottom bending moment is also seen compared to the S111uw design. The gravity-related loads, e.g., tower top tilt moment and longitudinal tower bottom bending moment are reduced for each configuration by the reduction of mass due to the redesign (e.g., S111uw vs. S111uw PF and S111dw vs. S111dw PF). With the reduced flapwise stiffness of the S111dw PF design, the tower shadow effect is overcome. As a result, the fatigue load of the S111dw PF is reduced to the level of the S111uw. A relative reduction of the flapwise stiffness compared to the edgewise stiffness increases the edgewise damping. Therefore, a load decrease for edgewise extreme and fatigue loads of the S111dw STR and S111dw PF compared to the S111dw is observed.
3.3 Turbine mass, cost and COE estimate
This section shows the estimated costs resulting from the load and mass difference of the design configurations. Figure 6 shows the summary of the main cost components of the turbine with an indication of the cost that is not affected by the design process (constant cost). The costs sum up to the total CAPEX. All results are normalized by the CAPEX of the S111uw design. It can be seen that the nacelle is the main cost component, followed by the blades, the tower, and the costs for electrical equipment. The figure shows that more than a third of the CAPEX is not affected by the chosen redesigns. In the CAPEX distribution of the nacelle, major cost differences are associated with the pitch bearing, the mainframe, and the pitch drives. The blade costs reduce significantly with the redesign of the blades, for which the S111dw PF shows the lowest blade costs associated with the lowest blade mass. The tower and foundation costs are for the downwind configurations generally higher than for the upwind configurations as the associated extreme loads and also the tower top fatigue loads are significantly higher. The costs of the electrical components reflect the change in hub panel costs as these scale with the extreme blade root torsion. Only small differences in the logistics costs are observed due to the change in nacelle mass. The balance of the plant is achieved for the same estimated costs, while the installation reflects the changes in total main frame mass, driven by the extreme tilt moment. Overall, the total CAPEX costs of the turbine vary only marginally between all the redesigns. The OPEX costs, on the other hand, are lower for all the downwind designs since the OPEX costs scale with the lower AEP. As a result, the combined turbine costs of the redesigned downwind configurations (S111dw STR and S111dw PF) are lower than for the S111uw PF design.
Table 4Blade mass, tower mass, CAPEX, AEP, and COE differences for the regarded turbine configurations relative to the S111uw design.
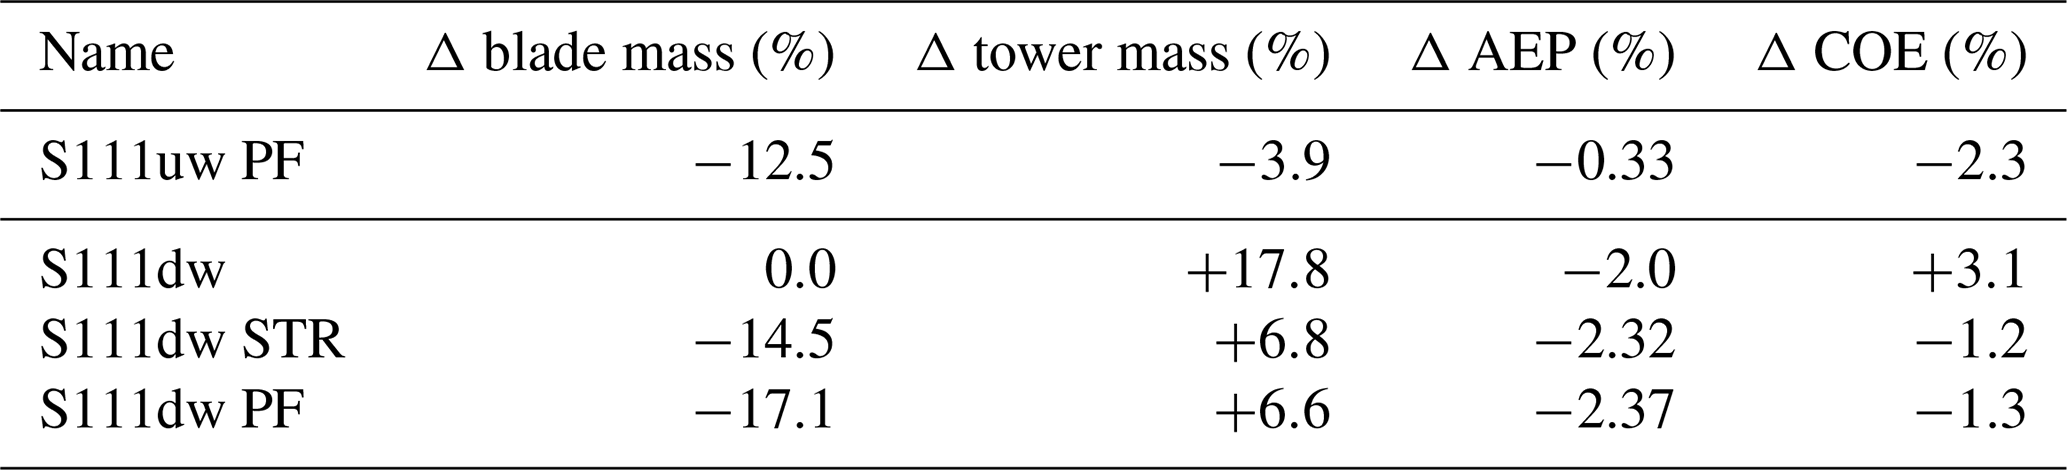
Table 4 summarizes the achieved blade and tower mass, as well as the AEP and the estimated COE differences, compared to the S111uw design. With a COE reduction of −2.3 %, the S111uw PF shows the lowest COE, as the CAPEX is low, while the AEP is high. A pure configuration change from S111uw to S111dw is most expensive in terms of COE due to the high CAPEX mainly caused by high tower and foundation loads. A structural redesign of the blades for the downwind configuration achieves significant COE savings of −1.2 % due to reduced rotor mass. A planform optimization of the downwind configuration reduces the COE −1.3 % below the S111uw baseline turbine. Overall, the S111uw PF still has the lowest COE since the rotor mass is only 5 % above the S111dw PF, while the tower is 10 % lighter and the AEP is 2 % higher.
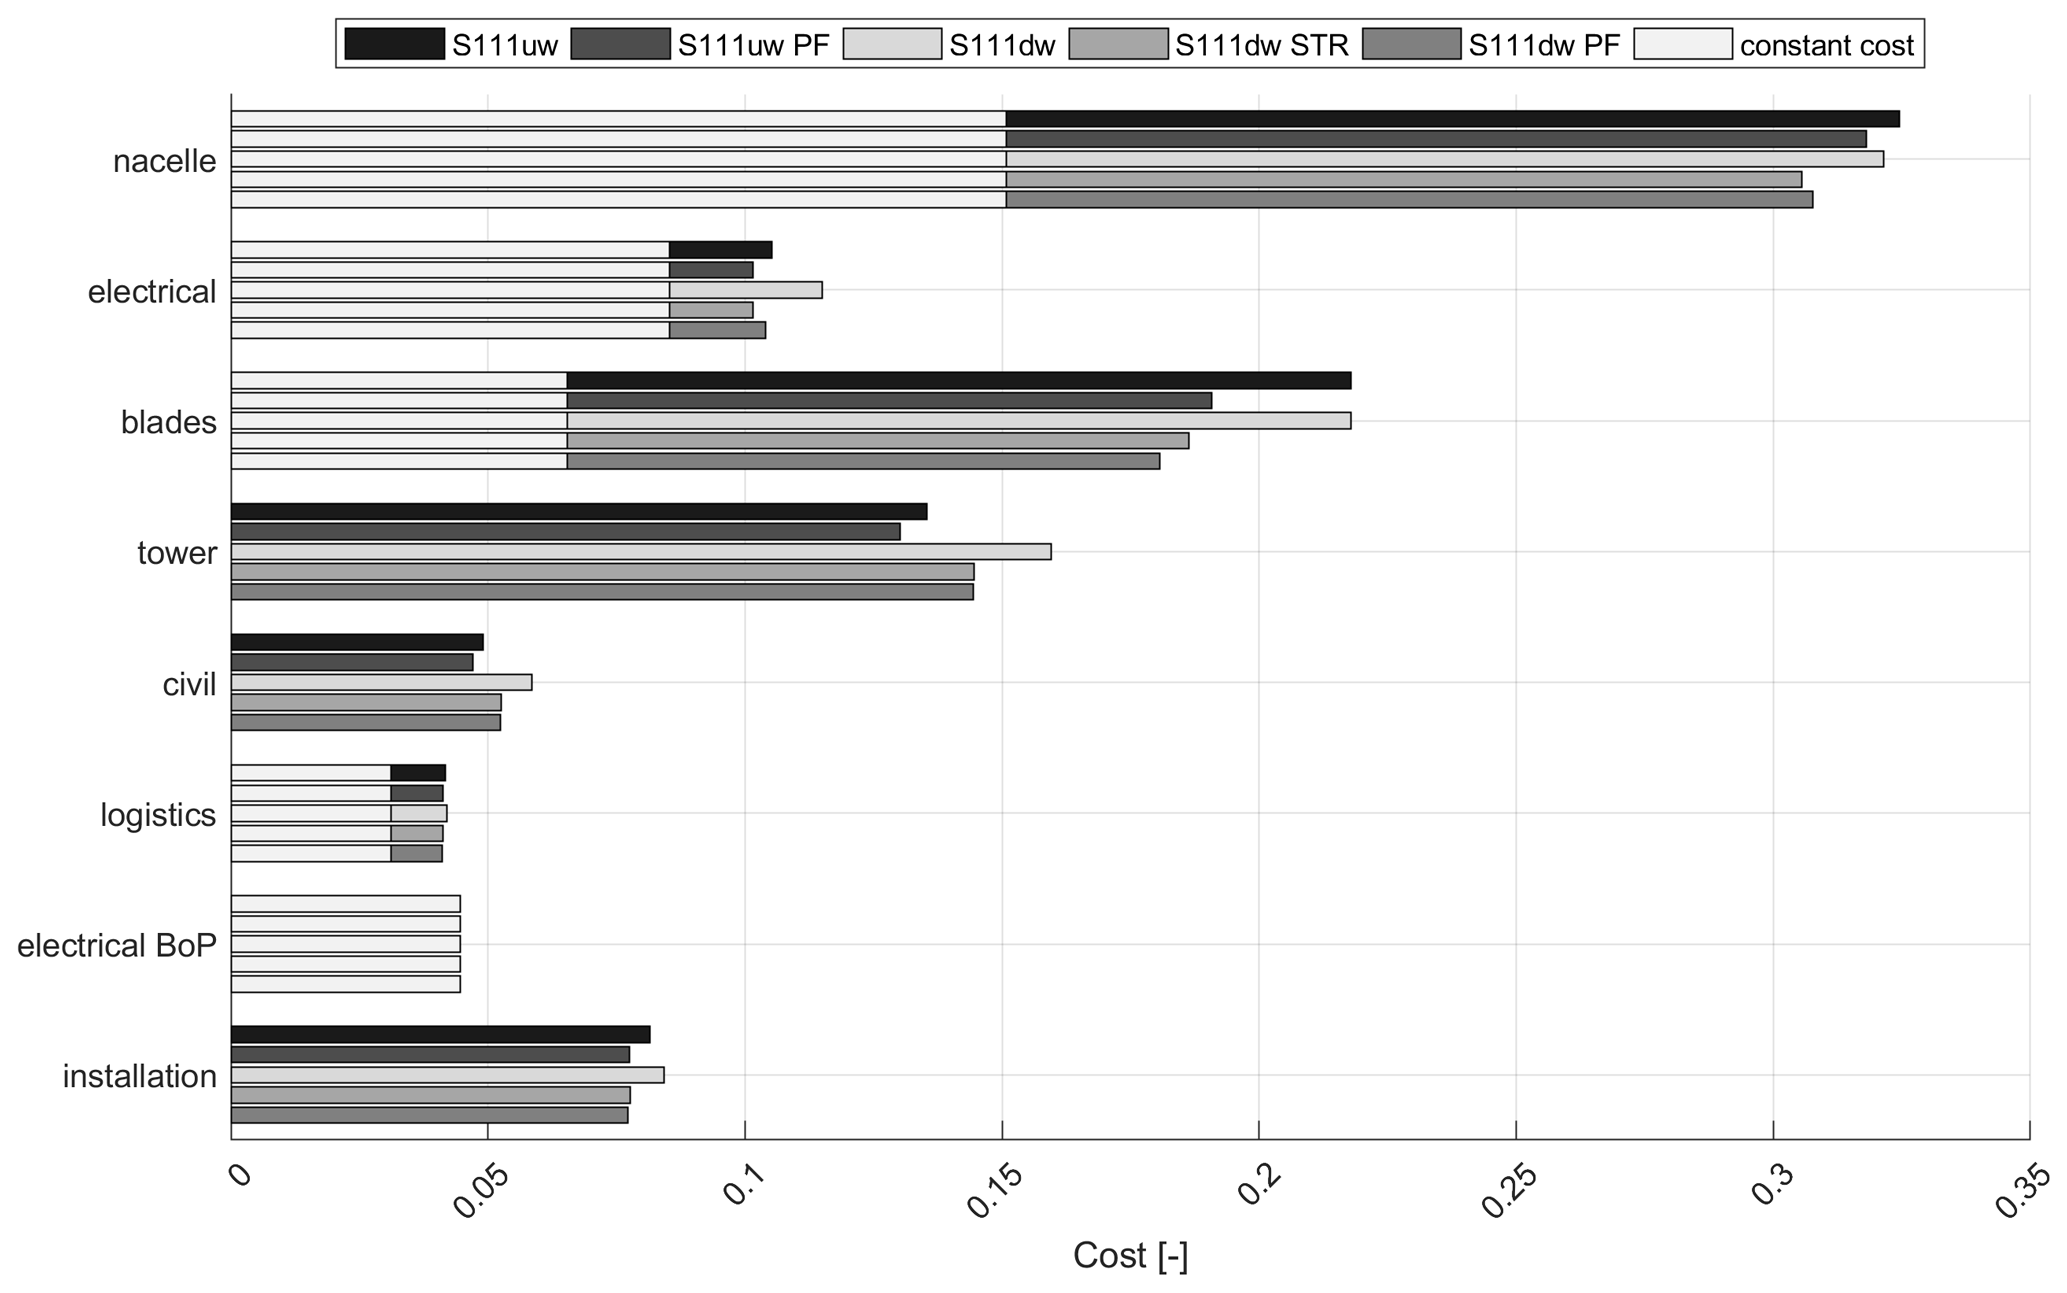
Figure 6Turbine CAPEX cost split by main cost components normalized by the sum of the S111uw configuration with an indication of constant costs not affected by the redesign process.
Within this study, the COE reduction potential for the Suzlon S111 2.1 MW turbine has been estimated for changing the original upwind configuration into a downwind configuration. A design framework including a low-fidelity in-house optimization tool has been used to redesign rotors for upwind and downwind configurations. A full design load basis has been simulated for every design configuration. The design configurations have been evaluated by a COE estimation.
New planforms were optimized for upwind and downwind configurations for minimum blade mass under the constraint of a minimum AEP. The new planforms were shown to have higher thickness over chord ratios inboard, utilizing higher stiffness with less material. This design trend agrees well with findings by Bottasso et al. (2016) and Zahle et al. (2016).
The downwind designs were generally subject to lower flapwise blade root moments than the comparable upwind designs due to the coning direction, as also proposed by, for example, Ichter et al. (2016) and Bortolotti et al. (2019). As a result, lower blade mass could be achieved for downwind configurations than for upwind configurations. The S111dw PF design showed, for example, 4.6 % lower blade mass than the S111uw PF design.
The load saving on the blade in the downwind configuration is offset by an increase in the tower bottom bending moment as the gravity overhanging moment of the rotor nacelle assembly is aligned with the thrust force, as also shown by Ning and Petch (2016). As a result, around 10.5 % higher tower masses were seen in the direct comparison of the S111uw PF design and the S111dw PF design.
The downwind configurations are subject to a lower AEP production due to the coning direction. This effect has also been observed by, for example, Zalkind et al. (2019) and Ning and Petch (2016). In the direct comparison, the AEP of the S111dw PF is 2.04 % lower than the AEP of the comparable S111uw PF.
Lower rotor and nacelle costs can be achieved by the downwind designs. However, the downwind designs also come with higher tower and foundation costs. Overall, the downwind configurations of comparable rotor size achieve a lower total turbine cost than the upwind design configuration. The difference in cost is due to the lower OPEX cost and does heavily depend on the cost model. Overall, the lower turbine cost does not compensate for the loss in AEP. The lowest COE level is achieved by the S111uw PF design configuration which achieves a significant mass and load reduction for a small sacrifice in AEP compared to the baseline.
This study has shown, for the example of the Suzlon S111 2.1 MW turbine, that a downwind rotor configuration could be achieved with lower total turbine costs than the comparable upwind configuration. Due to a lower AEP of the downwind configurations, the upwind configuration, on the other hand, showed overall the lowest COE. A downwind configuration would, therefore, be the configuration to choose on a cost-driven turbine market, while for COE-driven markets, the upwind configuration would be chosen.
These results depend on the very baseline-specific cost model. Scaling the OPEX with the AEP has been the only cost driver for the OPEX which results in the lower turbine costs for the downwind configuration. It could be expected that the higher fatigue load of the downwind configuration would increase the material wear, but this does not enter the OPEX model.
It should also be highlighted that the costs are effected by the chosen optimization approach, namely a mass minimization under AEP constraint. This does not give the true optimal solution in the sense of cost of energy. However, it does show the influence of the observed design trends on the turbine cost and the cost of energy.
The cost model generally depends on the loads simulated. This comes with uncertainty due to the seed number, the seeds themselves, and the assumptions of the wind field inclination angle. In the case of the downwind configuration, additionally, the dynamic effect of the tower shadow is not captured correctly within the HAWC2 simulations. Within HAWC2 the tower shadow model for downwind configurations is a pure deficit model and the increased vorticity behind the tower is not reflected. It can be expected that especially flapwise blade root and tilt-related fatigue loads are underpredicted. Further research would need to be done to quantify the impact of this effect.
Generally, fatigue loads should be part of the design process in future work. In the chosen approach, fatigue loads are not regarded in the design process and hardly reflected in the cost model. This might be a valid assumption in the upwind configurations, but for downwind configurations, this approach needs to be proven. Due to the tower shadow effect, as well as a possible decrease in edgewise damping, it might be possible that rotors of downwind configurations are driven by edgewise fatigue loads rather than flapwise extreme loads.
Prescribing the induction distribution in the optimization is a major restriction of the chosen design approach. The resulting chord and twist distributions are therefore very similar. The induction should be a design variable in future work as unloading the tip might allow for increases in rotor diameter and therefore AEP increase. The latter does not just hold for the downwind configuration but also for the upwind configuration.
Prescribing the induction distribution did, however, have the advantage that the load scaling approach was possible. Scaling loads from the BEM code loads to the extreme loads has decreased computation time significantly. A drawback of the load scaling approach is that a change in aerodynamic damping is not reflected. For the downwind configuration, the flapwise stiffness could be significantly reduced, while the edgewise stiffness had to be increased; the edgewise whirl modes can, therefore, be expected to increase in damping due to the frequency placement of the edgewise frequency compared to the second yaw frequency. An increase in damping decreases the blade extreme loads. The effect of the loads has been observed in the downwind designs, but there is no feedback within the optimization reflecting the change in damping. In future work, the framework would need to be enhanced with either time consuming load calculations or with a set of transfer functions that can transfer a wind field to extreme loads from a linearized turbine model. Such a linearized turbine model could be extracted, for example, from HawcStab2, which uses these models for eigenvalue analysis. In this case, a representative wind field could be used that represents extreme loads from a simulation set with a much larger seed number and with known uncertainty. This would decrease the computational time drastically while achieving reasonable results.
As designed for fast conceptual rotor design studies, the chosen design approach with STORM is limited in finding truly optimal solutions in the sense of the lowest cost of energy. The reasons are, on the one hand, the simplified structural model. On the other hand, the aerodynamic planform is limited by the assumption of a prescribed target induction, thus, allowing hardly any freedom of chord variations. Further, fixing the rotor diameter limits the investigations of the cost of energy for the different designs as it is fixed to one point of investigation. With the chosen approach and the AEP constraint, it is only possible to find the lowest blade mass for a certain targeted AEP at a specific blade length. With these limitations the resulting designs are not truly optimal in the sense of the lowest cost of energy. However, the chosen approach does allow for the comparison of design trends between the upwind and the downwind configurations.
The COE estimation and therefore success criteria of the downwind concept do also depend on the cost share between the different components. Since in the chosen example turbine the rotor and the tower are similar in the CAPEX share, it is difficult in the downwind configuration to offset the increased tower cost with savings on the rotor. If the baseline had a comparably more expensive rotor and a cheaper tower, the downwind configuration would be more competitive. Possible scenarios could be lower steel prices or higher blade material prices.
Another possibility to increase the competitiveness of the downwind configuration would be a change in the tower configuration, such as a wired tower for which wires are a cheap measure to take the bending loads. Alternatively, a low-labor-cost market could give the options of low tower costs with lattice or hybrid-lattice towers which generate bending stiffness from the increased footprint of the tower rather than large tower wall thicknesses for a tubular tower. These options could make the downwind configuration competitive as the cost share of the tower decreases. However, the cost model with the chosen baseline is not able to reflect such significant design changes.
Compensating the AEP loss in the downwind configuration with a larger rotor area could be an option to decrease the COE. Nevertheless, this does also increase the turbine cost not just due to an increased rotor diameter and therefore rotor mass but also to mass-related loads such as tilt loads and tower base loads. The rotor diameter has not been part of the rotor design as the cost model is very specific and does not reflect large differences from the baseline. Especially for components such as generator or gearbox which are not available in any possible configuration but are bought as “off-the-shelf” components, the linear cost scaling is insufficient. A rotor diameter increase of 4 % has been investigated, indicating the potential to decrease the COE for the downwind configurations further with an increase in rotor diameter. With the investigated increase of 4 %, the cost of energy could only be reduced to −1.4 % compared to the baseline cost. The increase in AEP was offset by the higher costs associated with increased rotor and tower mass, as well as increasing nacelle costs. Generally, future investigations should be performed more thoroughly that include the rotor diameter in the optimization. However, it is not expected that the conclusions for the example turbine will change significantly as margins for loads and tower clearance are low.
Future work should also consider a redesign of the nacelle for the better balancing of the rotor mass on the tower for the downwind configuration, as suggested by Zalkind et al. (2019). However, it should be kept in mind that the upwind configuration will always be beneficial in terms of tower bottom bending moment. Masses that can not be relocated for balancing such as rotor, hub, pitch, and yaw-system-related masses account for around 50 % of the mass of the rotor nacelle assembly. Extending the lengthwise dimensions of the remaining components to relocate the center of gravity might be more expensive than the higher tower costs of downwind configurations.
It should not be forgotten in the discussion of the cost efficiency of downwind configurations that simple control features such as peak shaving, as suggested by Loenbaek et al. (2020), might benefit the upwind configuration in the same manner as the configuration change: the tower clearance is increased, and the flapwise blade root moment is decreased with a penalty on AEP. Since the tower bottom load does not in this case increase, as in the case of the downwind configuration, such an upwind configuration might outperform a downwind configuration in terms of COE.
Overall, the study shows that a downwind configuration of the chosen example 2.1 MW turbine would need to be pushed to much larger rotor sizes than investigated. Further, low-cost measures would need to be chosen to carry the increased tower loads if the downwind configuration should become competitive in terms of COE with the comparable upwind configuration.
The optimization framework would need to be extended to be able to capture the design changes regarding the rotor, but also different tower configurations need to be included. To be able to evaluate such changes, a more comprehensive cost model is required to do a fair comparison of the designs.
It can be concluded from the study that it will be difficult to design a downwind configuration in the 2 MW range which can show significant economic benefits unless the design targets a different market than the upwind configuration or more drastic changes are made than just a rotor redesign and a structural redesign of the tower.
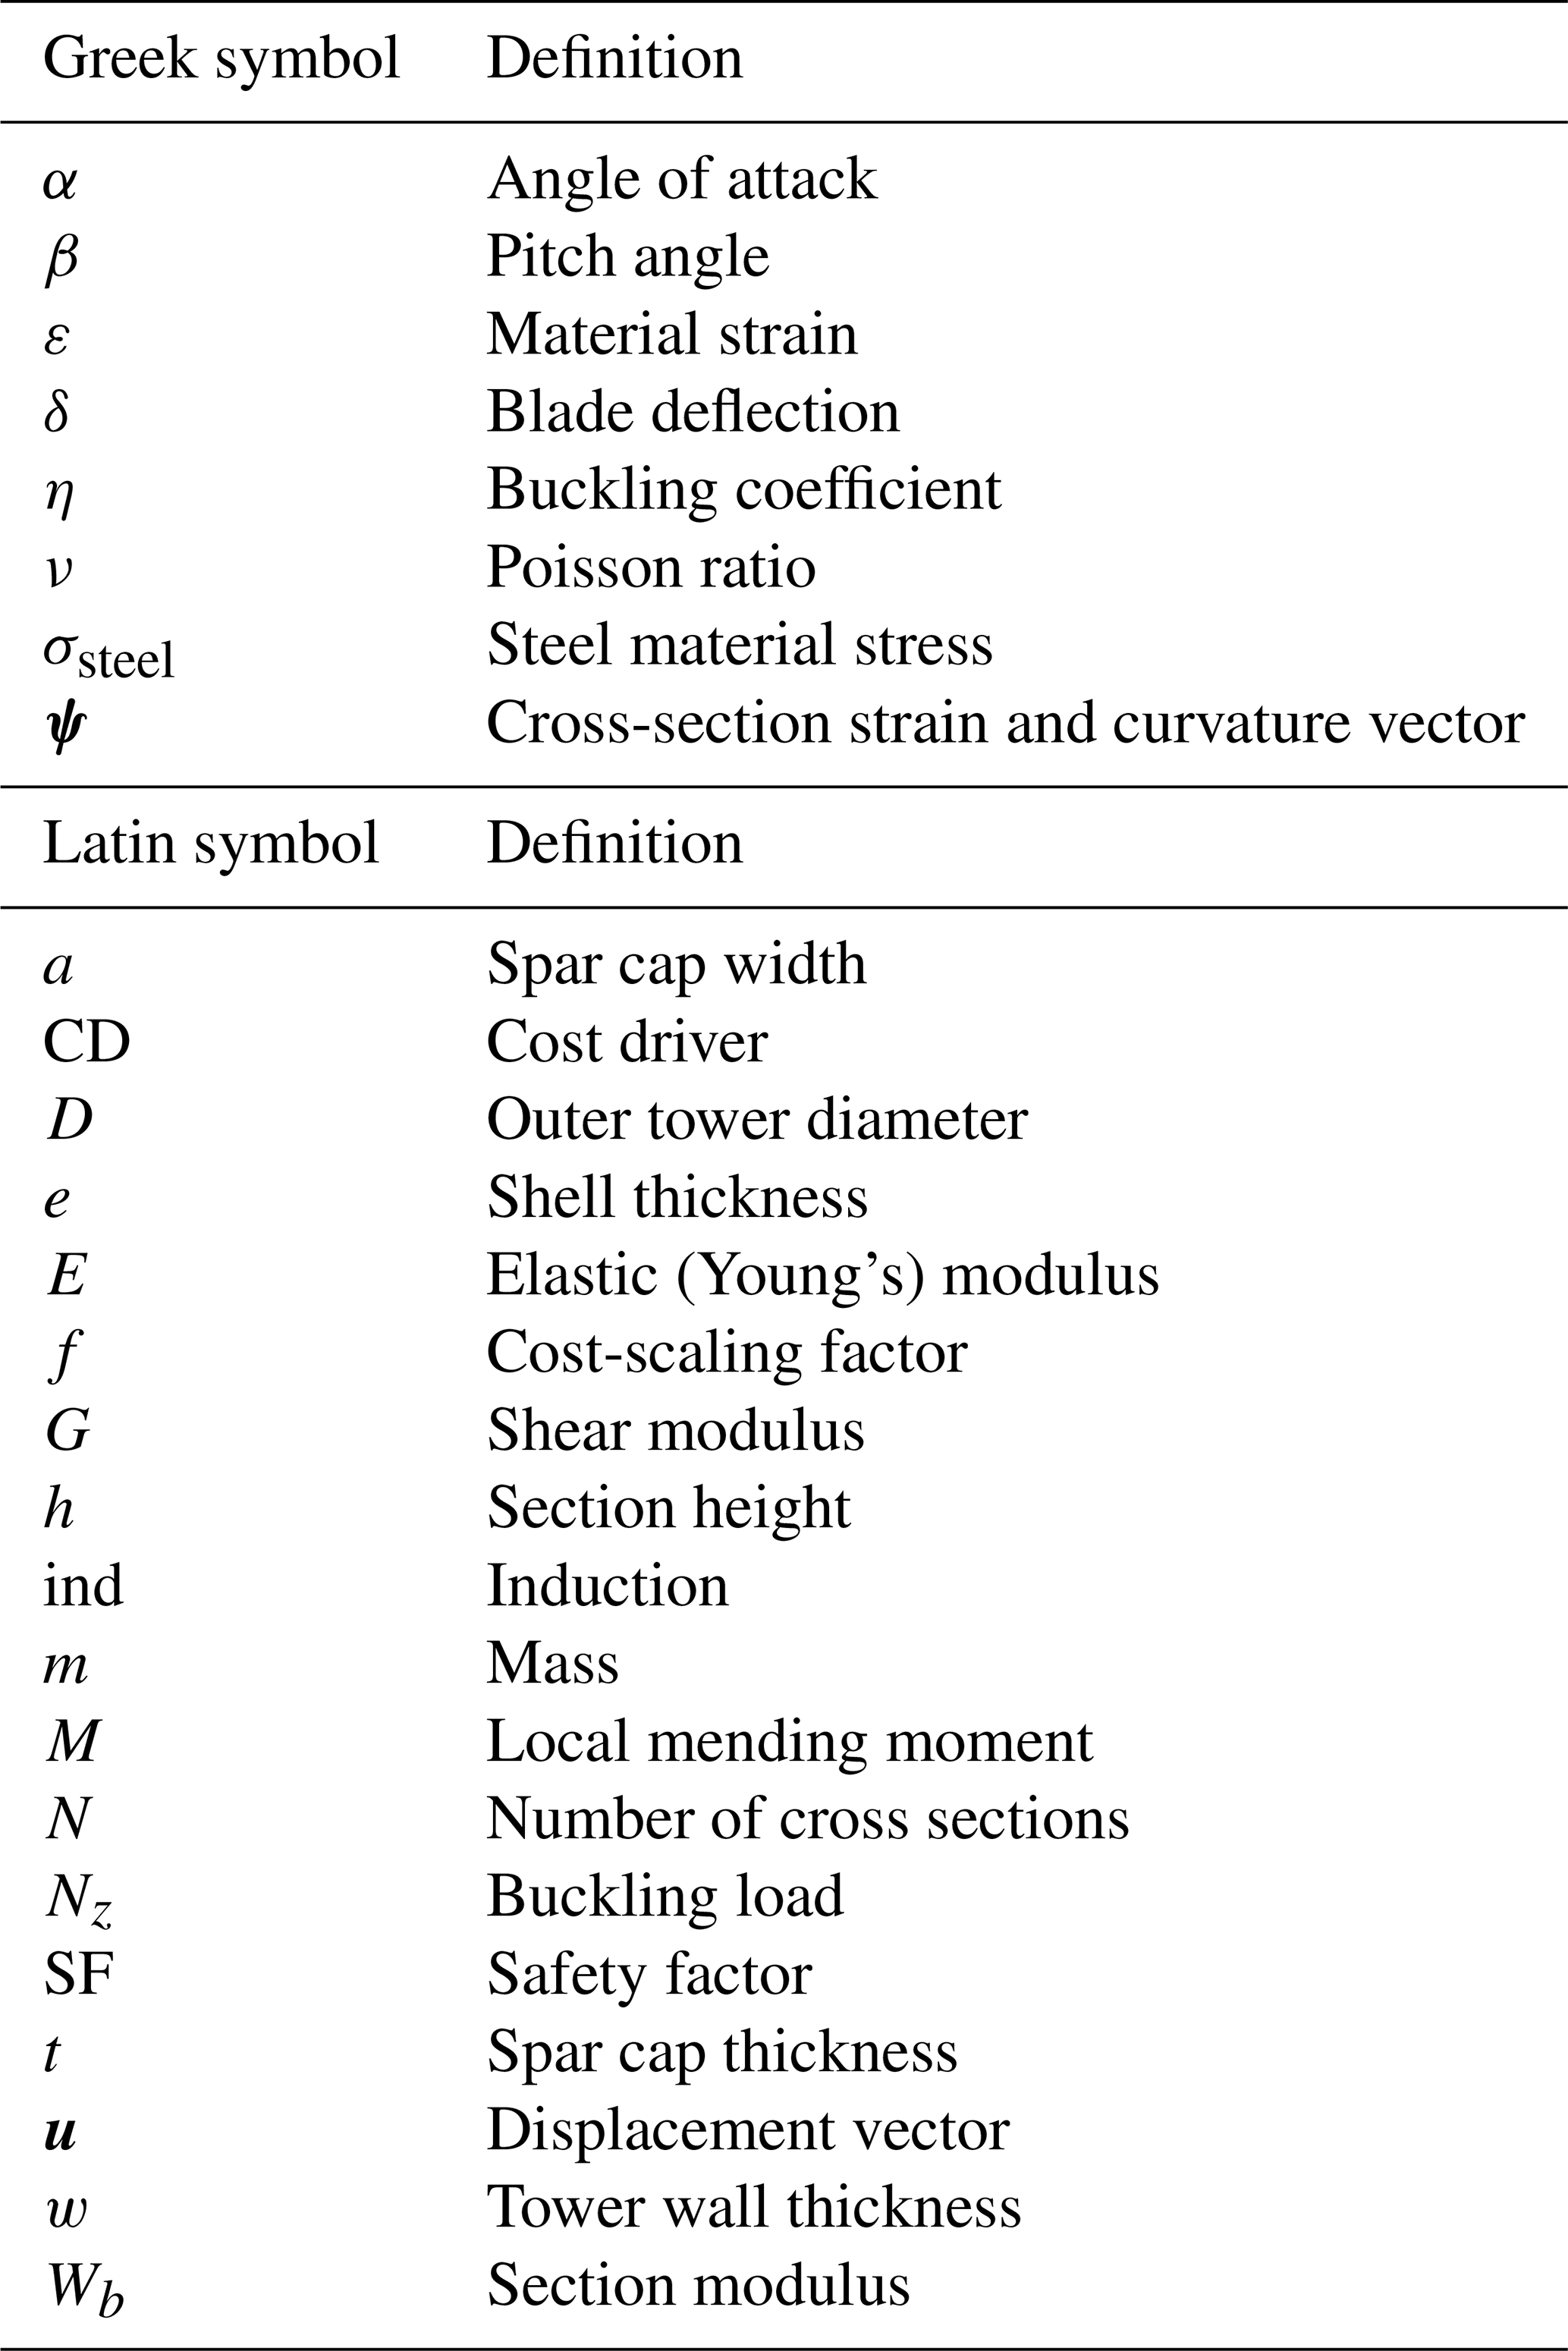
The following Table A1 states the symbols used in the equations.
The data are not publicly accessible since the research is based on a commercial turbine and the data are not available for disclosure by Suzlon.
GW created the baseline model and implemented the downwind design case in the optimization framework. LB developed and set up the optimization framework. FZ set up the HAWTOpt2 framework for the baseline and design case evaluation. All authors revised the models and results. With revisions of all coauthors, GW and LB prepared Sect. 2.3, and GW prepared the remaining paper. DRV supported the setup of the models and revised the models, results, and the final paper.
This project is an industrial PhD project funded by the Innovation Fund Denmark and Suzlons Blade Science Center. Gesine Wanke is employed at Suzlons Blade Science Center.
This research has been supported by the Danish innovation fund (grant no. 5189-00180B).
This paper was edited by Raimund Rolfes and reviewed by Andrew Ning and Pietro Bortolotti.
Andersen, M.: Conceptual aerodynamic and structural design optimization of wind turbine blades, Master's thesis, Technical University of Denmark (DTU), Roskilde, Denmark, available at: https://findit.dtu.dk/en/catalog/2438083980 (last access: 5 November 2019), 2018. a
Blasques, J.: Optimal Design of Laminated Composite Beams, PhD thesis, Technical University of Denmark, Risø, Roskilde, Denmark, DCAMM Special Repport, No. S134, 2011. a
Blasques, J. P. and Stolpe, M.: Multi-material topology optimization of laminated composite beam cross sections, Compos. Struct., 94, 3278–3289, https://doi.org/10.1016/j.compstruct.2012.05.002, 2012. a, b
Bortolotti, P., Kapila, A., and Bottasso, C. L.: Comparison between upwind and downwind designs of a 10 MW wind turbine rotor, Wind Energ. Sci., 4, 115–125, https://doi.org/10.5194/wes-4-115-2019, 2019. a, b
Bottasso, C. L., Croce, A., and Sartori, L.: Free-form design of low induction rotors, Wind Energy Symposium, 33, 1–8, https://doi.org/10.2514/6.2015-0488, 2015. a
Bottasso, C. L., Bortolotti, P., Croce, A., and Gualdoni, F.: Integrated aero-structural optimization of wind turbines, Multibody Syst. Dyn., 38, 317–344, https://doi.org/10.1007/s11044-015-9488-1, 2016. a, b
Carstensen, C.: Large scale structural topology optimization of wind turbine blades with eigenfrequency constraints, Master's thesis, Technical University of Denmark (DTU), Roskilde, Denmark, available at: https://findit.dtu.dk/en/catalog/2355769010 (last access: 2 November 2019), 2017. a
Glasgow, J., Miller, D., and Corrigan, R.: Comparison of upwind and downwind rotor operations of the DOE/NASA l00-kW MOD-0 wind turbine, NASA Report, TM-8744, National Aeronautics and Space Administration, Lewis Research Center, Cleveland, Ohio, USA, 225–234, 1981. a
Greene, G. C.: Measured and Calculated Characteristics of Wind Turbine Noise, NASA Report, CP-2185, National Aeronautics and Space Administration, Langley Research Center, Hampton, Virginia, USA, 1981. a
Hansen, M.: Aeroelastic Stability Analysis of Wind Turbines Using an Eigenvalue Approach, Wind Energy, 7, 113–143, https://doi.org/10.1002/we.116, 2004. a
Hansen, M.: Aerodynamics of Wind Turbines, Earthscan, Edn. 2, 44–62, Earthscan, London, UK, 2008. a
Hansen, M. and Henriksen, L.: Basic DTU Wind Energy Controller, DTU-Wind-Energy-Report, E-0028, DTU wind energy, Risø, Roskilde, Denmark, 2013. a, b
Hansen, M., Thomsen, K., Natarajan, A., and Barlas, A.: Design Load Basis for onshore turbines Revision 00, DTU Report, E-0074, DTU wind energy, Risø, Roskilde, Denmark, 2015. a
Ichter, B., Steele, A., Loth, E., Moriarty, P., and Selig, M.: A morphing downwind-aligned rotor concept based on a 13-MW wind turbine, Wind Energy, 19, 625–637, https://doi.org/10.1002/we.1855, 2016. a
IEC: IEC 61400-1 ed.3 Wind turbines – Part1: Design requirements, Tech. rep., International Electronical Commission, Geneva, Switzerland, 2014. a
Kolda, T. G., Lewis, M., and Torczon, V.: A generating set direct search augmented Lagrangian algorithm for optimization with a combination of general and linear constraints, Sandia Report, Sandia National Laboratories, Livermore, USA, 2006. a
Loenbaek, K., Bak, C., Madsen, J. I., and Dam, B.: Optimal relationship between power and design-driving loads for wind turbine rotors using 1-D models, Wind Energ. Sci., 5, 155–170, https://doi.org/10.5194/wes-5-155-2020, 2020. a, b
Loth, E., Steele, A., Qin, C., Ichter, B., Selig, M. S., and Moriarty, P.: Downwind pre-aligned rotors for extreme-scale wind turbines, Wind Energy, 20, 1241–1259, https://doi.org/10.1002/we.2092, 2017. a
Madsen, H. A., Larsen, T. J., Pirrung, G. R., Li, A., and Zahle, F.: Implementation of the blade element momentum model on a polar grid and its aeroelastic load impact, Wind Energ. Sci., 5, 1–27, https://doi.org/10.5194/wes-5-1-2020, 2020. a
Metzger, F. and Klatte, R.: Status report on downwind horizontal axis wind turbine noise prediction, NASA Report, N82-23684 14-44, 425–430, Hamilton Standard Devision of United Technologies Corporation, Hamilton, US, 1981. a
Ning, A. and Petch, D.: Integrated design of downwind land-based wind turbines using analytic gradients, Wind Energy, 19, 2137–2152, https://doi.org/10.1002/we.1972, 2016. a, b, c
Ning, S. A.: A simple solution method for the blade element momentum equations with guaranteed convergence, Wind Energy, 17, 1327–1345, https://doi.org/10.1002/we.1636, 2014. a
Reiso, M. and Muskulus, M.: The simultaneous effect of a fairing tower and increased blade flexibility on a downwind mounted rotor, J. Renew. Sustain. Ener., 5, 033106-1–1033106-11, https://doi.org/10.1063/1.4803749, 2013. a
Tibalidi, C., Hansen, M. H., and Henriksen, L. C.: Optimal tuning for a classical wind turbine controller, J. Phys. Conf. Ser., 555, 1–11, https://doi.org/10.1088/1742-6596/555/1/012099, 2014. a
Wächter, A. and Biegler, L. T.: On the implementation of an interior-point filter line-search algorithm for large-scale nonlinear programming, Math. Program., 106, 25–57, https://doi.org/10.1007/s10107-004-0559-y, 2006. a
Wanke, G., Bergami, L., Larsen, T. J., and Hansen, M. H.: Changes in design driving load cases: Opterating an upwind turbine with a downwind rotor configuration, Wind Energy, 22, 1500–1511, https://doi.org/10.1002/we.2384, 2019a. a, b
Wanke, G., Hansen, M. H., and Larsen, T. J.: Qualitative yaw stability analysis of free-yawing downwind turbines, Wind Energ. Sci., 4, 233–250, https://doi.org/10.5194/wes-4-233-2019, 2019b. a
Wanke, G., Bergami, L., and Verelst, D. R.: Differences in damping of edgewise whirl modes operating an upwind turbine in a downwind configuration, Wind Energ. Sci., 5, 929–944, https://doi.org/10.5194/wes-5-929-2020, 2020. a
Zahle, F., Tibaldi, C., Verelst, D., Bak, C., Bitsche, R., and Blasques, J.: Aero-Elastic Optimization of a 10 MW Wind Turbine, vol. 1, American Institute of Aeronautics and Astronautics, Kissimmee, Florida, USA, 201–223, 2015. a
Zahle, F., Tibalidi, C., Pavese, C., McWilliam, M. K., Blasques, J. P. A. A., and Hansen, M. H.: Design of an Aeroelastically tailored 10 MW Wind Turbine Rotor, J. Phys. Conf. Ser., 753, 1–11, https://doi.org/10.1088/1742-6596/753/6/062008, 2016. a, b, c
Zalkind, D. S., Ananda, G. K., Chetan, M., Martin, D. P., Bay, C. J., Johnson, K. E., Loth, E., Griffith, D. T., Selig, M. S., and Pao, L. Y.: System-level design studies for large rotors, Wind Energ. Sci., 4, 595–618, https://doi.org/10.5194/wes-4-595-2019, 2019. a, b, c