the Creative Commons Attribution 4.0 License.
the Creative Commons Attribution 4.0 License.
 | 10 Feb 2021
Revealing system variability in offshore service operations through systemic hazard analysis
Romanas Puisa
Victor Bolbot
Andrew Newman
Dracos Vassalos
As wind farms are moving farther offshore, logistical concepts increasingly include service operation vessels (SOVs) as the prime means of service delivery. However, given the complexity of SOV operations in hostile environments, their safety management is challenging. The objective of this paper is to propose a quantitative, non-probabilistic metric for the preliminary comparison of SOV operational phases. The metric is used as a conditional proxy for the incident likelihood, conditioned upon the presence of similar resources (manpower, time, skills, knowledge, information, etc.) for risk management across compared operational phases. The comparison shows that the three considered phases of SOV operation have rather comparable levels of variability, hence the likelihood for incidents. However, the interface between the SOV and turbine via the gangway system and the manoeuvring between turbines seem to show a higher potential for incidents and performance (work efficiency) shortfalls.
- Article
(504 KB) - Full-text XML
- BibTeX
- EndNote


1.1 Background
Offshore wind is becoming a major source of renewable energy in many countries (GWEC, 2019). As wind farms are moving farther offshore, significant innovations in the infrastructure and services are required to maintain the judicious trend. One of such innovations is the specialised service vessels, or service operation vessels (SOVs), which are offering new logistical concepts for servicing wind farms farther offshore. They enable an extended stay of technicians (typically for 2 weeks) in the vicinity of a wind farm, thereby replacing the logistical concept of transferring technicians from shore by crew transfer vessels (CTVs). The latter becomes unreasonable due to prolonged sailing times and increased risk of seasickness.
SOVs are akin to offshore supply vessels and are typically around 80 m in length, can endure severe environmental conditions, and offer a wide array of services. They are highly automated ships (e.g. position and course can be kept automatically by the dynamic-positioning (DP) system), hosting dozens of technicians, support (daughter) crafts, and heavy equipment. Daughter crafts (DCs) are medium-size boats, typically under 20 m, which are carried by the SOV and used to transport lighter equipment to turbines in moderate environmental conditions (<1.8 m significant wave height). DCs are loaded with technicians and launched from an SOV deck by some davit system, typically 3–5 times per day, and then recovered (lifted up) from the water periodically. SOVs would also have a sophisticated system for transferring technicians and equipment to and from a turbine. It is normally a motion-compensated (3 or 6 degrees of freedom; DoFs) gangway system, which allows for relatively safer (based on experience so far) and time-efficient (within some 5 min) transfer.
The multifaceted nature of SOV operations complicates the management of their safety. The overall safety management of SOV operations is an amalgamation of individual safety procedures for the SOV, davit, DC, gangway, drone, and other sub-systems (Sect. 3). These safety systems are developed in isolation from a wider operational context and, when integrated, can lead to confusion, surprises, and undue pressure on operators (Ahsan et al., 2019). In such conditions, accidents can be caused by well-known but inadequately managed scenarios (e.g. loss of power or control) as well as by yet unknown scenarios created by new technology or new ways of operation. In 2018, the offshore supply vessel Vos Stone temporally lost control of thrusters, drifted, and struck a wind turbine (BSU, 2019). Amongst the causes, the officers on the bridge did not manage to seamlessly switch between modes of thruster control (from DP to other mode) because they were confused about them. Inadequately controlled transitions between modes of operation, particularly between normal (frequently used) and abnormal (rarely used, e.g. emergency) modes, are a classic scenario for accidents (Sarter et al., 1997; N. Leveson, 2011, p. 289). Another incident happened in 2013, when the diving-support vessel Bibby Topaz drifted off the position (maintained by the DP system) while two divers were exploring the seabed (IMCA, 2013). Amongst the causes, the vessel had had a dormant (unidentified) hazard – a design error – that did not allow safety critical faults that preceded the incident to be adequately responded to.
1.2 The challenges
The first challenge for safety of SOV operations comes from the uncertainty as to how the amalgamated systems of safety procedures would actually work, even though the performance of individual systems may be known. This is because safety is an emergent system property, which cannot be asserted or aggregated from properties of individual system components (N. G. Leveson, 2011; Checkland, 1981; Meadows, 2008). This challenge is exacerbated by a high level of automation in SOV operations and complex interactions between technology and operators (Sarter et al., 1997). As highlighted above, some interactions may have not been captured during design and can lead to incidents1 in practice.
The second challenge is the ability to compare various phases of SOV operation. A quantitative risk-based comparison would be a natural but very precarious choice. This is because the quantification of risks associated with identified hazards is generally invalid, given the prevalence of systematic (unsafe software and human behaviour) as opposed to random (hardware failures) causes in the lead-up to hazards. Systems systematically drift as opposed to probabilistically jump to failure (Rasmussen, 1997; Dekker, 2016). For instance, non-systematic causal factors (e.g. out-of-range environmental conditions) constituted only some 25 % of all incident causes with DP-operated support vessels within the Norwegian continental shelf (Chen and Moan, 2005). Although there are still frequent attempts to quantify software failures and human errors in terms of probabilities or the like, this approach has been criticised (e.g. Rae et al., 2012; Leveson, 2000), and the systematic nature of these hazards is widely recognised and enshrined in international standards and methodologies (e.g. IEC61508, 1998; DoD, 2012).
1.3 Objectives and organisation
The first challenge can be addressed by applying a systemic hazard analysis (SHA) to an integrated safety management system of operational tasks and procedures within a specific SOV operational phase. In contrast to conventional accident models based on chains of events, systemic models focus on tight couplings and nonlinear interactions between system components (Hollnagel, 2016; Qureshi, 2007). The second challenge can be addressed by proposing some metric that reflects systemic, structural properties of a specific operational phase and then can be used to aid the comparison of various phases. As discussed in Sect. 4.3, this metric corresponds to the variability within the system in terms of interactions between technical and human components, and it is a by-product of the SHA. The metric is used as a conditional proxy for the incident likelihood, conditioned upon the existence of similar resources (manpower, time, skills, knowledge, information, etc.) for risk management across compared operational phases.
With the above in mind, the objective of this paper is to propose a quantitative metric for the system variability with the purpose of being able to preliminarily compare phases of SOV operation. To this end, the SHA was applied to three phases of SOV operation to reveal hazardous scenarios involved in each of them. The considered operational phases were when transiting and manoeuvring within a wind farm, interfacing with turbines, and launching or recovering daughter crafts. We used the systems-theoretic process analysis (STPA) (N. Leveson, 2011; Leveson and Thomas, 2018) as an SHA. The results of the SHA were directly used to derive the system variability metric.
The paper is organised as follows. Section 2 explores related work; Sect. 3 explains the basics behind safety management currently in practice; Sect. 4 introduces the research method, specifically addressing the hazard analysis, system description, and the concept of system variability. Section 5 outlines and discusses the results. Section 6 highlights the work limitations, whereas Sect. 7 concludes the paper.
In this section we review the academic and industrial literature on hazard, system variability, and resilience analysis of servicing wind farms and other offshore installations by SOV-like vessels.
The reviewed literature focuses on collision (ship-to-ship, shop-to-turbine), reliability issues with technology (DP, gangway, and other systems), and human factors (Presencia and Shafiee, 2018; Dong et al., 2017; Rollenhagen, 1997; Sklet, 2006; Rokseth et al., 2017; SgurrEnergy, 2014). The used hazard analysis mainly followed a conventional, non-systemic approach where individual hazards or scenarios are considered in isolation. In most cases, statistics or probabilistic analysis is used for decision making. The exception is Rokseth et al., who applied the STPA method to hazard analysis of offshore supply vessels running on the DP system (Rokseth et al., 2017). None of the studies uses systemic indicators or measures (e.g. of resilience) to infer the safety level or compare operational phases or other aspects.
When it comes to indicators or measures of system variability and resilience, the general literature is abound (e.g. Hollnagel et al., 2007; Herrera et al., 2010). The literature specific to the maritime domain is limited but present (e.g. Praetorius et al., 2015; Patriarca and Bergström, 2017; de Vries, 2017). However, the authors have not come across a work which connects results of a systemic hazard analysis, namely hazardous scenarios, with the system variability or similar systemic indicators.
As any safety-critical system, SOVs comply with international and national safety standards during vessel design, construction, and operation (Grace and Lee, 2017). The latter is “managed by vessel operators as part of their safety management system” (IMCA, 2015). The key element of safety management is a risk assessment (IMCA, 2014; Bromby, 1995), i.e. the identification of safety hazards to ships, personnel, and the environment and establishment of appropriate controls. This also constitutes one of the objectives of the International Safety Management (ISM) Code (IMO, 2018). Risk assessment method statements (RAMSs) are documents that OEMs (e.g. of davit system, daughter crafts) create after they conduct individual risk assessments. RAMSs contain details on identified hazards as well as a step-by-step safe working guide that crew, contractors (technicians), and others should follow to avoid and adequately respond to hazards. The hazards inform training, briefing notes, and operational procedures. Notably, RAMSs are used interchangeably with safety procedures and manuals.
As SOV operations use diverse systems (davits, gangways, daughter crafts, drones) that interact, separate RAMSs are used for each interaction, with a bridging document to state the overall emergency protocol and document primacy (cf. Fig. 1). In other words, the overall safety management system (SMS), or safety governance, onboard an SOV is comprised of multiple RAMSs, depending on the type of systems in interaction.
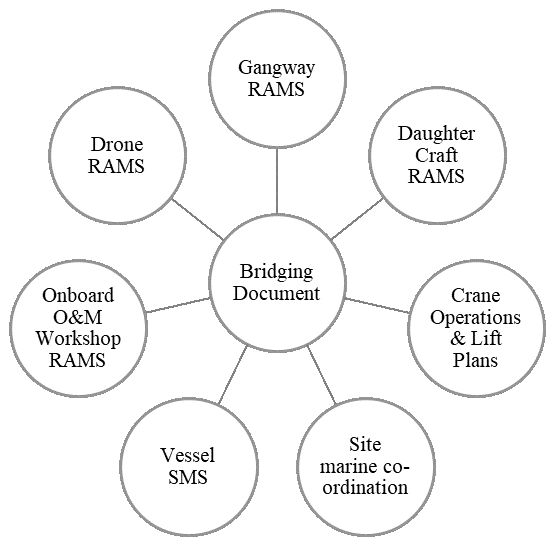
For example, for a typical 14 d SOV operation in the UK, the safety governance may involve over five regulators simultaneously when alongside a turbine (cf. Table 1). This ad hoc or case-by-case safety management, however, happens sufficiently rarely that the developed SMS could often be timed for longer periods. This is a result of an evolutionary process where a limited “bolt-on” capacity was mobilised to a vessel which did not warrant a rework of the vessel safety systems.

When faced with the multitude of internal RAMSs (procedures), the opportunity for confusion and hazardous surprises arises. This is because the knowledge of all individual safety procedures is often outside of what is normally expected of seafarers. Also, RAMSs are developed in isolation, and their amalgamation into one system can create conflicts between safety procedures or create unintended consequences. Therefore, safety management is heavily reliant on the operator's general competence and familiarity with operations.
In view of these practices, a systemic, top-down approach to hazard analysis – when multiple systems (e.g. the DP and gangway systems) are engaged at the same time – is required to properly address the system-level hazards. The following section explicates why and how systemic analysis is performed.
4.1 Hazard analysis
In view of several systemic-hazard-analysis methods available, we selected the systems-theoretic process analysis (STPA) (N. Leveson, 2011; Leveson and Thomas, 2018). The method is based on the systemic accident model STAMP (System-Theoretic Accident Model and Processes), which is designed for complex, highly automated, socio-technical systems (Leveson, 2004; N. G. Leveson, 2011). The comparison of STPA and STAMP with other analysis methods and accident models can be found in the literature (e.g. Salmon et al., 2012; Sulaman et al., 2019; Qureshi, 2007), and it is hence disregarded in this paper.
Before explaining the method, it would be helpful to agree on the terminology used. A hazard is a system state that will lead to an incident or accident given specific environmental conditions beyond the control of the system designer (Leveson, 2004). The system in question can be a safety management system (SMS) which is designed according to the ISM Code or amalgamated from different RAMSs. Incidents and accidents are defined as follows (Rausand, 2013). An incident is a materialised hazard with insignificant consequences. Incidents do not necessary interrupt the prime function (delivery of payload or service). An accident is a materialised hazard with significant consequences (significant loss or damage). Accidents would normally interrupt the prime function.
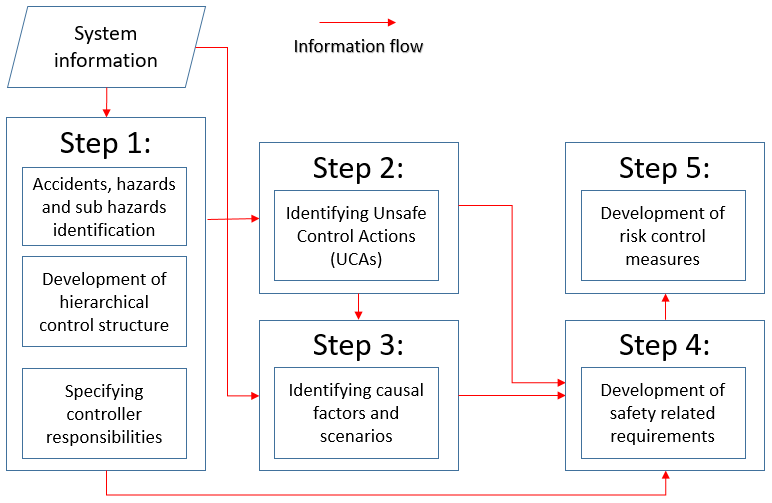
A sequential process behind the STPA method is shown in Fig. 2. The analysis begins by defining the system and its boundaries. This allows the clarification of what accidents (losses) and system-level hazards (conditions for incidents) should be considered in the analysis. For instance, during the SOV interface with the turbine via a gangway, the assumed accidents corresponded to the deviation from the interfacing objective, i.e. occurrence of injuries and life loss and damages to SOV, gangway, or turbine. However, the reference to accidents is beyond the scope of this paper, as explained earlier.
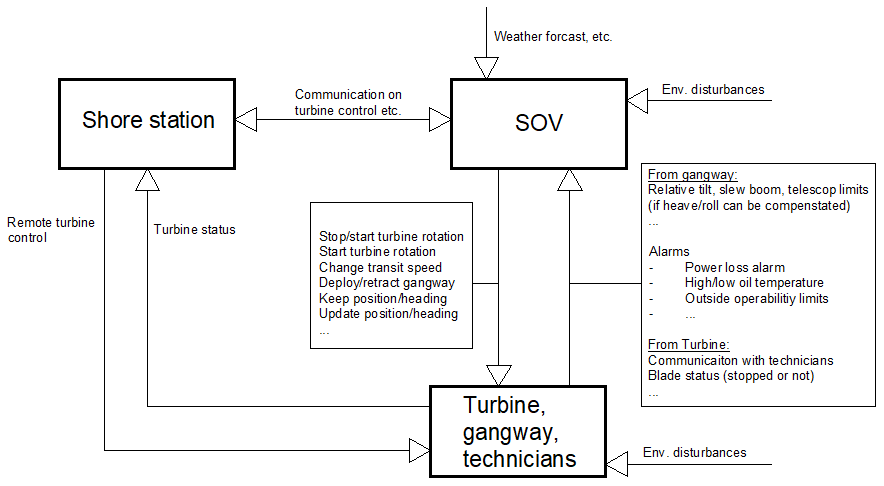
Figure 3Hierarchical safety control diagram of interface between SOV and turbine (further explained in Sect. 4.2).
Sample system-level hazards are as follows:
-
Vessel does not keep a minimum safe distance to turbine or its blades (approaching or staying at turbine when it is in motion).
-
SOV does not keep position or heading within target limits for a predefined time.
-
SOV operates on DP class 1, i.e. no redundancy in thrusters, power generation, and other safety-critical components.
-
SOV transfers technicians when the gangway is disconnected or dysfunctional (e.g. not motion-compensated).
The system-level hazards are typically found in safety rules and regulations. The hazards can be further decomposed into (or described through) sub-system and component-level hazards, which are often more helpful during the analysis. For instance, the second hazard is equivalent to a situation when DP operational requirements do not request a DP operator to enable DP class 2 before starting the transfer.
The system definition further involves its modelling as a hierarchical control diagram. It is a natural way to represent many systems, including safety governance, that involve feedback loops. Figure 3 shows a control diagram for the interface between SOV and a turbine. The control diagram is at a higher level of abstraction, where one controller box comprises three other controllers and controlees: turbine, gangway, and technicians being transferred. The arrows indicate control and feedback channels with example control actions and feedback signals indicated. The control actions reflect the responsibilities assigned to a controller. The responsibilities, or purposes, are also reflected in the control algorithm and feedback information necessary for adequate control.
The use of a control diagram for hazard analysis contrasts with classic analysis methods that instead use failure diagrams such as fault trees and event trees. The key difference between control and failure diagrams is that the latter show imaginary linear chains of causes and effects (BS EN 31010:2010, 2010). The chains are typically based on past accidents, assuming that future ones should happen in a similar fashion. The control diagram, on the other hand, does not make such assumptions and shows real interactions in daily operations. This makes the STPA results credible, easier to communicate, and generalise.
The second and third steps of the hazard analysis generate hazardous scenarios, which are then used to develop safety requirements. A hazardous scenario explains how control actions – from each controller in the control diagram – can lead to sub-system or system-level hazards and why this can happen. Scenarios are inferred by searching the operational context (or states of operation), looking for circumstances – within the entire system – under which a given control action would lead to a hazard. The STPA uses specific keywords to guide the search (Leveson and Thomas, 2018).
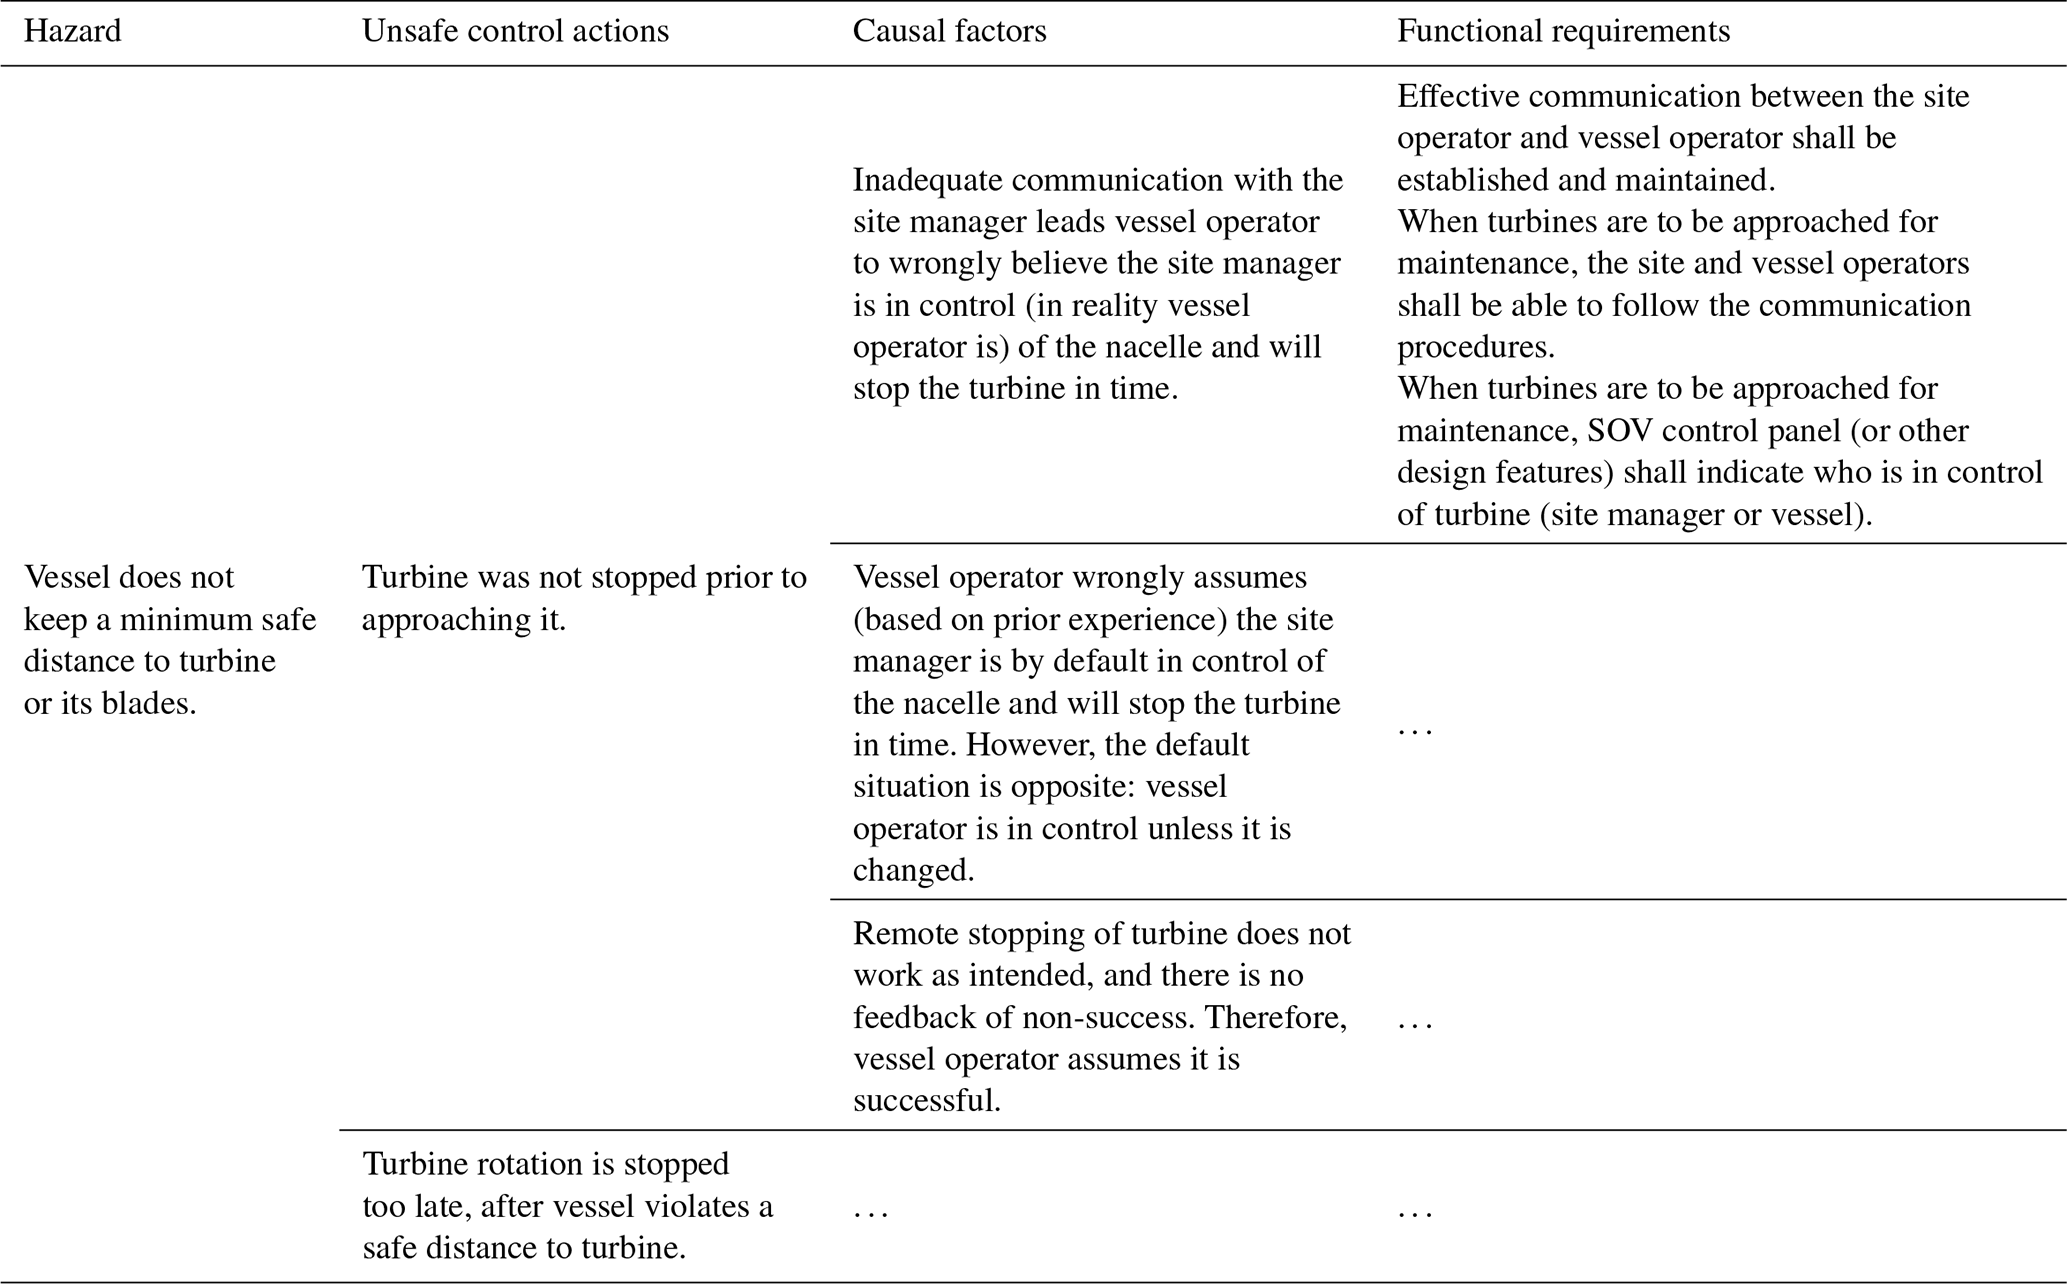
The fourth and fifth steps of the hazard analysis in Fig. 2 are outside the scope of this paper. However, we provide an example analysis result which also includes proposed functional requirements. Thus, Table 2 shows sample hazardous scenarios and safety requirements for the control action “stop turbine rotation” by the SOV controller. The arrows indicate the scenario as a pathway from basis causal factors to system-level hazards: causal factors cause unsafe control actions, which, in turn, lead to hazards. The shaded cells illustrate a specific scenario, which is preventable by implementing the three functional-safety requirements. These requirements are complementary, representing organisational and design controls.
4.2 System overview
The overall system in question is shown in Fig. 4. The figure shows the analysed interactions between system components at the system level. These interactions are of physical contact (e.g. SOV and turbine), communication via radio (e.g. SOV and shore, turbine and shore), and sensory (distance, visual, and audio) by installed sensors and people. Other interactions at the system level (e.g. the links between the DC and turbine or other ships) were not analysed.
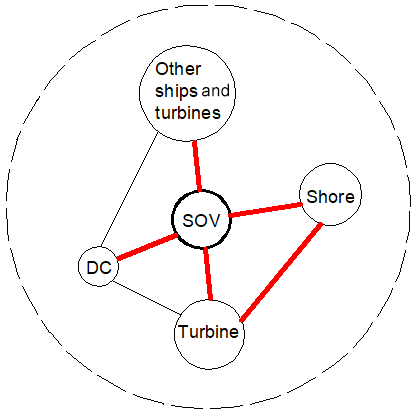
Figure 4System components and system boundary (SOV: service operation vessel, DC: daughter craft).
The considered interactions corresponded to four operational phases.
-
Transit and manoeuvre within a wind farm: the dynamic-positioning (DP) system was considered to be the main system providing the navigation and station-keeping (position and heading) functions: the DP system can be switched into an automatic mode to fully control all 3 degrees of freedom (DoFs): surge, sway, and yaw. The control of DoFs can also be shared with a DP operator who can use a joystick or manual thruster levers.
-
Interface between an SOV and turbine (approach, station keeping, and departure). The DP and motion-compensated gangway systems were considered to be jointly used. The gangway system is used for technician transfer from the SOV to or from a wind turbine. At the time of transfer, the SOV keeps position and heading by means of the DP system. The gangway is controlled by a gangway operator who extends, retracts, and maintains communication with the technicians. There is also a continuous communication between the DP and gangway operators to maintain the gangway operation within its operability limits.
-
Interface between an SOV and daughter crafts (DCs) with a conventional davit system: the DC would be vertically attached to the davit via a lifting line (vertical) and the painter line to keep the DC aligned with the SOV. Both lines are typically connected and disconnected manually by DC deck crew. DCs are loaded with technicians and equipment and launched from an SOV deck by the davit (typically 3–5 times per day), and then they are recovered (lifted up) from the water the same way. During the DC launch and recovery, the SOV uses the DP system to maintain the position and heading. The interface between an SOV and DC was assumed to follow sub-phases with corresponding systems and hazards involved: (1) the davit system is used to launch from the SOV and recover a DC from the water, (2) and technician and equipment are transferred when a DC is on water, with technicians climbing up or down the ladder.
These phases of operation are safety-critical and there are different safety hazards to watch for (next section). For instance, during a transit or manoeuvring, the vessel might collide with turbines or other vessels, e.g. when the vessel deviates from a correct trajectory or inadequately performs collision avoidance.
For each phase, a safety control diagram was developed; e.g. Fig. 3 shows the one used for the interface between an SOV and a wind turbine. Thus, the safety control diagram in Fig. 3 was developed by assuming the SOV to be the main controller, which comprises human controllers on the bridge (e.g. a DP operator), automation, and other ship systems. The shore station as a controller was not analysed, and only the communication with the SOV was considered. The text next to the arrows explaining their meaning, i.e. what control and feedback information was assumed. The SOV as a controller is generally responsible for (1) keeping the station (position and heading) until the transfer of technicians via the gangway is complete and (2) providing power to the gangway. Additionally, it was assumed that these responsibilities are only exercised when the SOV, gangway, and other systems are fully operational. Based on this information, control actions and feedback can be inferred. Technical publications, such as DP operational manuals, were also used to determine control actions and feedback signals (e.g. distance sensors, GPS signals). As Fig. 3 shows, the process under control comprised the gangway and turbine, with controlled parameters such as the relative distance, bearing, power supply, and others.
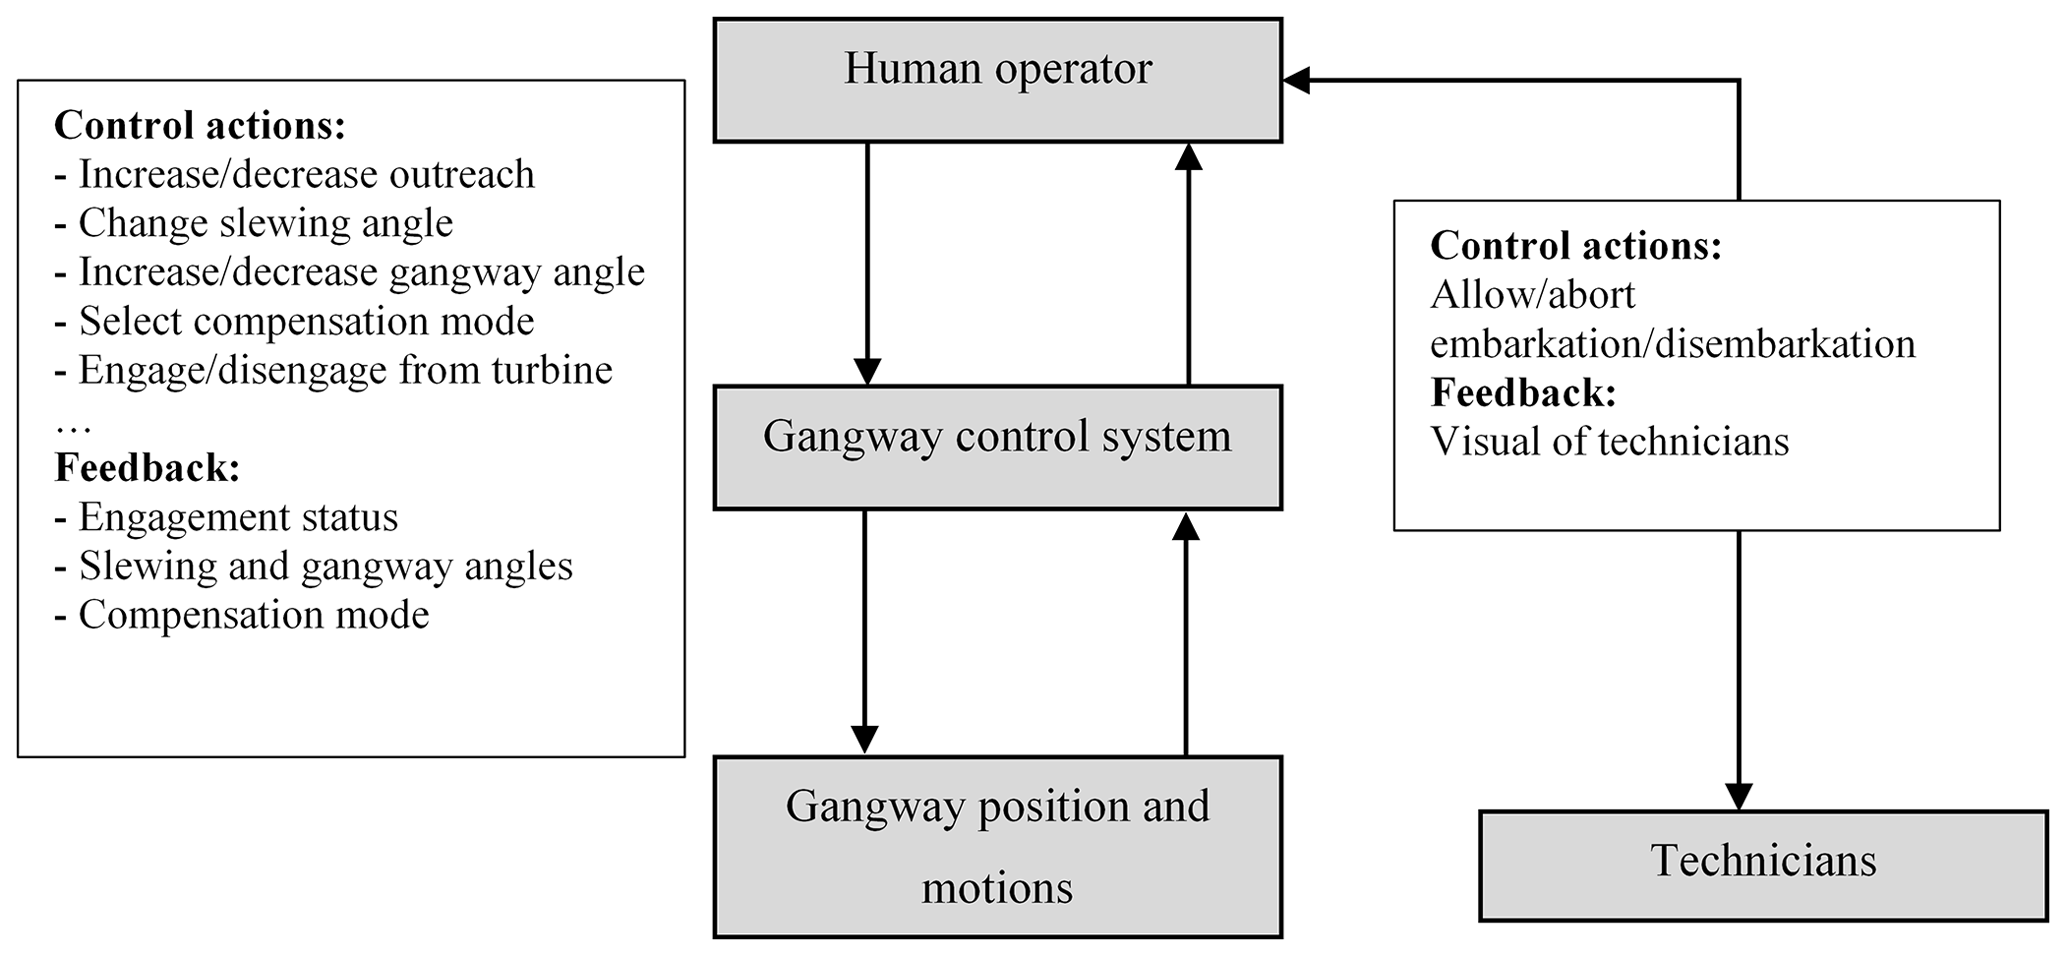
This phase of SOV operation additionally included a separate hazard analysis of the gangway control, as shown in Fig. 5. The control diagram was developed to reflect industrial safety and other requirements for gangways and technician transfer (i.e. IMCA, 2014; DNVGL, 2015a, 2017). The continuous lines correspond to control channels, with the text indicating the control actions and dashed lines corresponding to feedback channels. In this diagram, the human operator corresponded to the gangway operator controlling the gangway position and motions by means of the gangway control system. There is also communication with technicians who walk via the gangway.
Detailed explanations of other control diagrams corresponding to other phases of SOV operation are outside the scope of this paper. Interested readers are referred to other authors' publications, where, for example, a system description and hazard analysis for the DP system in the above phases of SOV operation can be found (Puisa et al., 2019). We note that the safety control diagrams developed for each operational phase were of the same level of abstraction. This makes them comparable, as done in the following section.
4.3 System variability
As argued in Sect. 1, quantification of system safety within the probabilistic framework is often unwarranted in modern, highly automated systems. In this section we introduce the notion of system variability and explain its application to a preliminary comparison of SOV phases.
Design and operational errors are frequent, and procedures are often underspecified in complex systems (Hollnagel, 2018), meaning that hazardous scenarios and operational uncertainties will likely be present all the time. In other words, operational conditions are not stationary but are dynamic, variable, and sometimes surprising. Then, the inability to adequately adjust to such operational complexity due to meagre resources (time, knowledge, competence, etc.) is a harbinger of untoward events (Woods and Hollnagel, 2017); the reverse is system resilience (Hollnagel et al., 2007).
We make the following corollary assumptions derived from the above observations:
-
Incidents and accidents happen when hazardous scenarios (i.e. opportunities for safety incidents) are present within the system, and existing resources (time, manpower, skill, knowledge, information etc.) are inadequate to effectively manage the associated risks.
-
Analogically, underperforming or failing on prime operational objectives (e.g. delivery of technicians and equipment to turbines) happens when operational circumstances are complex and uncertain, and existing resources are inadequate to effectively manage such circumstances.
-
Performance and safety, therefore, share a common denominator – the ability to manage surprises in view of limited resources. According to Rasmussen's boundary of safe behaviour, production pressures push operations towards the safety boundary because the performance is at maximum there (Rasmussen, 1997). In other words, the performance increases as the incident likelihood increases but up to a point. After this point, frequent incidents inhibit the performance.
-
The presence of hazardous scenarios (i.e. opportunities for safety incidents) and operational complexity (i.e. opportunities for performance shortfalls) are germane, and there are overlapping conditions within the system. The higher the likelihood for incidents is, the higher the operation complexity might be in the system, and vice versa.
Although we cannot predict when an untoward event can happen, we can say whether it is likely or not. It can be done “by characterising the variability within the system, specifically the variability in components and subsystems and how they may combine in unwanted ways. This can be done by looking at how functions and subsystems depend on each other” (Hollnagel, 2016, p. 172). This very information is obtainable from a systemic hazard analysis where flawed interactions between system components at various levels of abstraction are revealed.
With this in mind, the first above assumption about the incident likelihood (in a non-probabilistic sense) can be expressed more formally (Eq. 1):
where NHS corresponds to the number of hazardous scenarios (pathways to hazards), and RtA stands for resources to adjust to avoid those scenarios. The actual dependence between the left- and right-hand sides of the equation is unknown and requires further studies. In this paper we are only interested in an approximate form of this relationship so we could compare – although preliminary – various systems or operational phases.
On this basis, we propose the following model to capture the incident likelihood, referring to this surrogate metric as the system variability (Eq. 2). It is a ratio of the number of hazardous scenarios per operational phase, NHSi, to the total number of hazardous scenarios across all N phases of operation (Eq. 2):
The numerator matches the one in Eq. (1), whereas the denominator is used to normalise the numerator across all operational phases. The RtA figure from Eq. (1) is apparently not included. For this reason, we do not refer to this metric as the likelihood because it captures only a part of the risk picture. However, if RtA can be assumed to be similar across compared system states (e.g. modes of SOV operation), then Eq. (2) would reflect the incident likelihood. The assumption of similarity can be reasonable if we consider a rather short period of time, say a 2-week shift that the SOV crew spends at a wind farm. This is because human resources, skills, work, safety culture, etc. will likely remain the same for the shift. For the sake of demonstration of the approach, we assume that RtA is similar across all phases of SOV operation, and Eq. (2) is hence valid to apply.
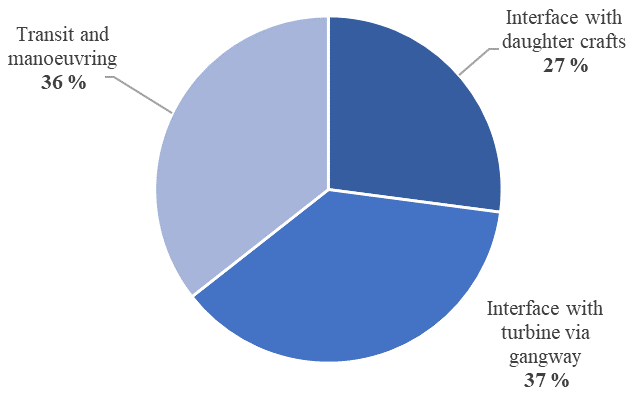
This section outlines the results of hazard analysis by STPA, covering the three stages of SOV operation (Sect. 4.2). Tables 3 to 5 outline the considered hazards and the number of identified scenarios that can lead to them, along with example scenarios meant to demonstrate the interactions involved. Based on these tables, Fig. 6 shows the system variability as described in Sect. 4.2. The values indicate that the interface between the SOV and gangway has, potentially, the highest variability. However, the system variability for the transit and manoeuvring phase is almost the same. The lowest variability is of the SOV interface with daughter crafts.
Table 3Analysed hazards and their hazard exposure (number of scenarios to hazard) for SOV operational stage: transit and manoeuvring.
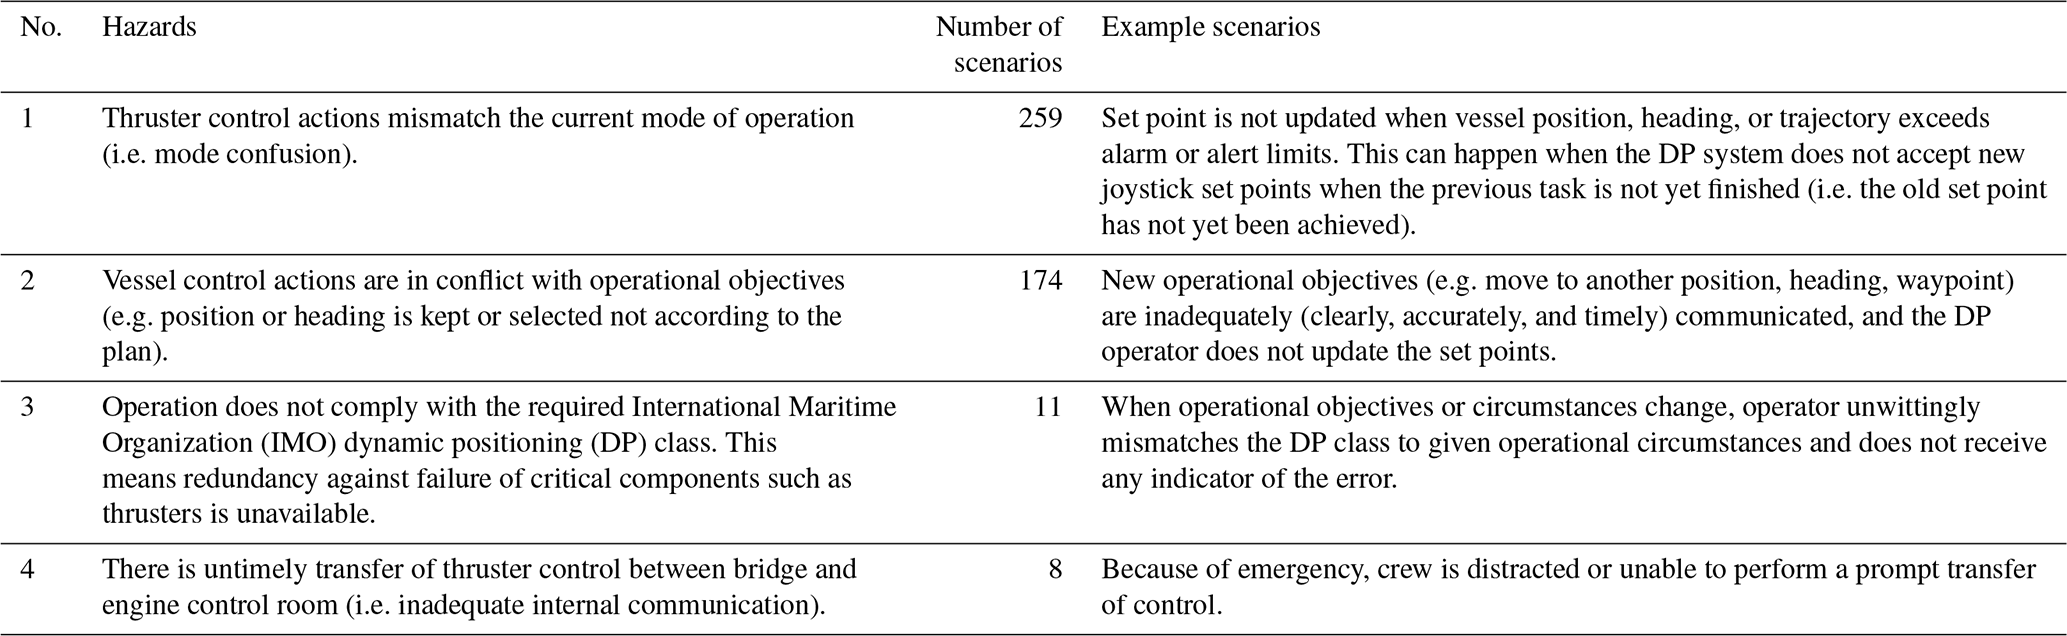
Table 4Analysed hazards and their hazard exposure (number of scenarios to hazard) for SOV operational stage: interface turbine via gangway.

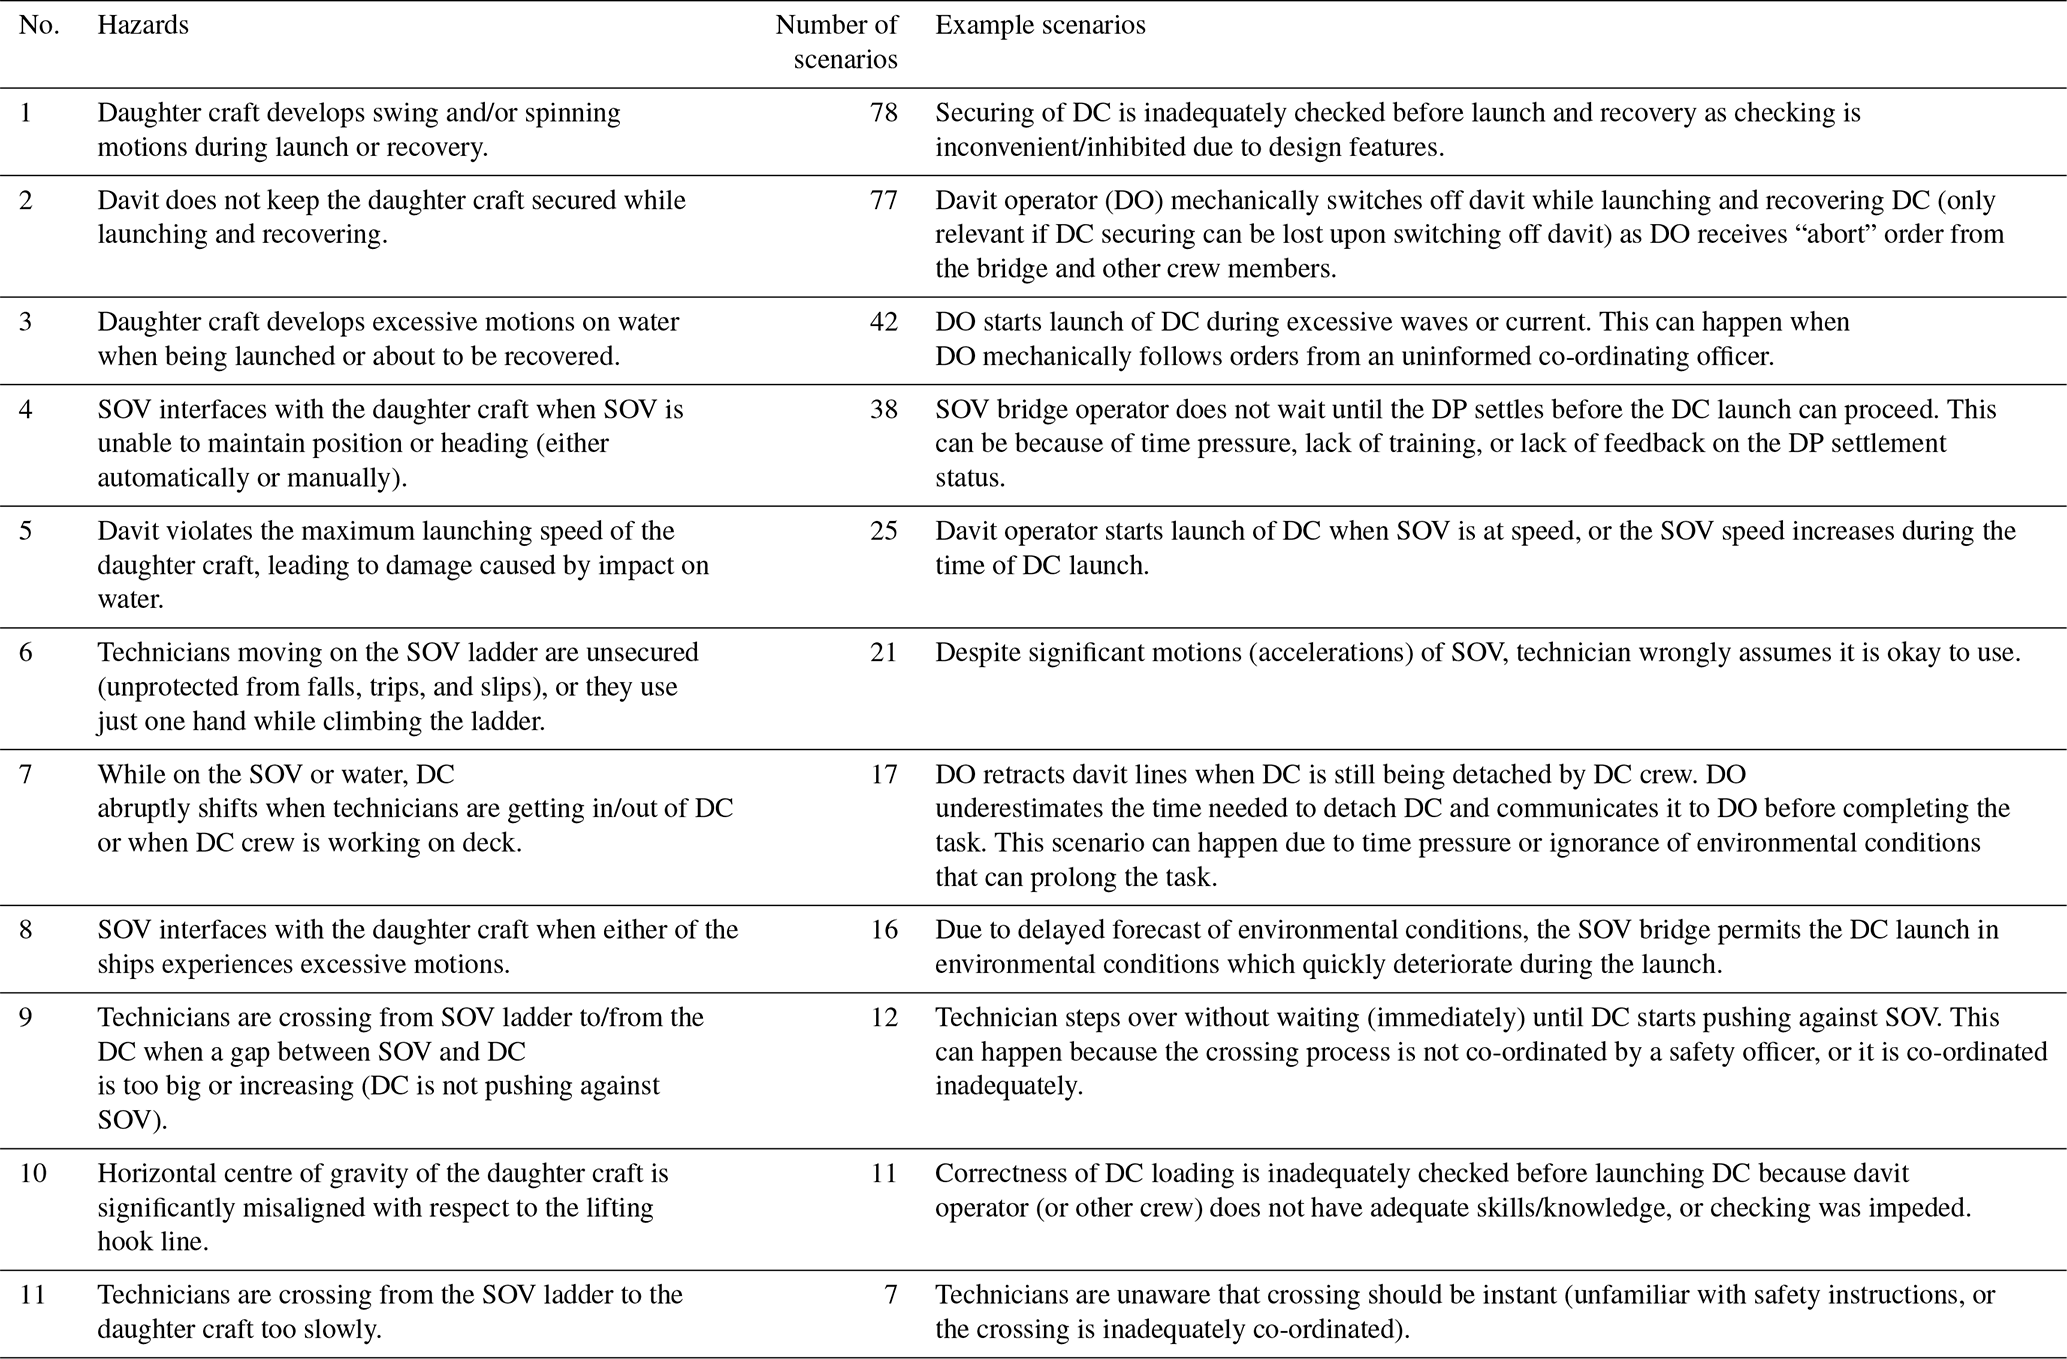
Table 5Analysed hazards and their hazard exposure (number of scenarios to hazard) for SOV operational stage: interface with daughter crafts.
The presented results of the systemic hazard analysis are twofold. First, they bring awareness of system-level hazards involved in various stages of SOV operations, although the existing industrial rules and good practices are likely to cover them. For instance, the sample scenario for the hazard in Table 4 “Vessel does not keep a minimum safe distance to the turbine or its blades” is addressed by class rules which require the DP system to perform self-check routines and bring the system to a stop if necessary (DNVGL, 2015b). However, these technical publications do not explain how the rules or guidelines can be violated and what level of complexity is involved when following them.
This brings us to the second contribution of the study, namely to the number of scenarios in the lead-up to these hazards. These scenarios reflect the system complexity, i.e. the degree of freedom for the system to fail. The proposed metric of system variabilities, which is based on the number of hazardous scenarios shown in Eq. (2), aims to capture the likelihood of system failure. As Fig. 6 shows, all three phases of SOV operation have rather comparable levels of system variability and hence likelihood for incidents, given that similar resources for risk management are available in the three phases. However, the interface between the SOV and turbine via the gangway system and the manoeuvring between turbines seem to be more complex phases of operation where the potential for incidents is more likely. The similarity between these two phases may come from the fact that the DP system is used in both of them, and this system is quite complex. At the same time, the gangway system does not seem to add a significant amount of variability in the analysis we have performed.
Given the relationship between performance and safety (see Sect. 4.3), the phases with higher system variability may also be more complex and exposed to higher time and other production pressures. Hence, these phases need adequate resources to maintain both safety and performance.
The proposed indicator of the system variability is only suitable for some preliminary analysis. The paper has not validated the indicator by analytical or empirical means. However, the presented theoretical basis and used assumptions therein provide reasonable support for the indictor. Clearly, further research is needed in this still-new area of systemic safety analysis.
We recognise that the proposed indicator is not fully independent from how a hazard analysis is performed. Different analysts will produce different sets of results for the same system, and hence the system variability will also be different. Therefore, such indicators should not be used to compare different analyses – unless those analyses used the same assumptions – and should be limited to a comparison of different operational scenarios or phases within a single analysis.
The paper has presented the results of systemic hazard analysis of service operational vessel (SOV) operations. We have specifically analysed 23 operational hazards arising during the three stages of SOV operation: (1) transit and manoeuvre within a wind farm and interfaces with (2) turbines and (3) daughter crafts. The hazards are mostly related to flawed interactions between people and technology as opposed to individual failures (e.g. human errors, random failures of equipment) that are addressed conventionally. During the hazard analysis, we identified 1270 hazardous scenarios that explain how hazards can materialise.
The study has made the following contributions and conclusions:
-
It has brought awareness of system-level hazards involved in various phases of SOV operation and the number of hazardous scenarios associated with them.
-
The paper has introduced the notion of system variability as a conditional proxy to the incident likelihood. It can be used to compare various phases of operation, provided that resources for risk (safety) management are very similar within those phases. The proposed metric can be seen as an alternative to aggregate probabilistic figures (e.g. total risk) which are frequently employed.
-
The comparison has shown that all three phases of SOV operation have rather comparable levels of system variability. However, the interface between the SOV and turbine via the gangway system and the manoeuvring between turbines seem to be more complex phases of operation with a higher potential for both incidents and performance (work efficiency) shortfalls. Consequently, continuous management of resources is necessary to maintain both safety and performance there.
-
Future studies should incorporate the effect of resources (for risk and performance management) into the comparison, as discussed in Sect. 4.3.
The raw data are not sharable as a standard restriction in EU projects where the foreground knowledge belongs only to project participants. This paper only shares some summary results.
The main author contributions are listed below, based on the CRediT contributor role taxonomy: RP was in charge of funding acquisition, conceptualization, methodology, and writing – review and editing. VB contributed to investigation, formal analysis, and methodology. AN worked on validation, methodology, and writing – original draft preparation. DV contributed to supervision of research activities.
The authors declare that they have no conflict of interest.
This paper represents the opinions of the authors and is the product of professional research. It is not meant to represent the position or opinions of their organisations, nor the official position of any staff members. Any errors are the fault of the authors.
This article is part of the special issue “Wind Energy Science Conference 2019”. It is a result of the Wind Energy Science Conference 2019, Cork, Ireland, 17–20 June 2019.
The work described in this paper was produced as part of the research project NEXUS (https://www.nexus-project.eu, last access: 9 February 2021). The project has received funding from the European Union's Horizon 2020 research and innovation programme under agreement no. 774519. The authors are thankful to their colleagues and project partners who directly and indirectly contributed to the presented work. Particular thanks go to Kongsberg Maritime (former Rolls Royce Marine) for sharing design information and providing valuable feedback. The sponsorship of the Maritime Research Centre by DNV GL and Royal Caribbean Cruises Ltd is also much appreciated.
This research has been supported by the European Commission, Horizon 2020 framework programme (grant no. 774519).
This paper was edited by Michael Muskulus and reviewed by three anonymous referees.
Ahsan, D., Pedersen, S., Bang Nielsen, M. R., and Ovesen, J.: Why does the offshore wind industry need standardized HSE management systems? An evidence from Denmark, Renew. Energy, 136, 691–700, https://doi.org/10.1016/j.renene.2019.01.034, 2019.
Bromby, M.: Ensuring compliance with the IMO's Code and its place within quality management systems, in: Conference on Quality Management Systems in Shipping, 27–28 March 1995, London, 1995.
BS EN 31010:2010: Risk management, Risk assessment techniques, available at: https://shop.bsigroup.com/ProductDetail/?pid=000000000030183975 (last access: 9 February 2021), 2010.
BSU: Allision between VOS STONE and a wind turbine on 10 April 2018 in the Baltic Sea, Investigation report 118/18, Bundesstelle fuer Seeunfalluntersuchung, Hamburg, 2019.
Checkland, P.: Systems thinking, systems practice, J. Wiley, Zurich, 1981.
Chen, H., and Moan, T.: DP incidents on mobile offshore drilling units on the Norwegian Continental Shelf, in: Advances in Safety and Reliability – Proceedings of the European Safety and Reliability Conference, ESREL, Gdynia-Sopot-Gdansk, Poland, 337–344, 2005.
Dekker, S.: Drift into failure: From hunting broken components to understanding complex systems, CRC Press, Boca Raton, FL, USA, 2016.
de Vries, L.: Work as done? Understanding the practice of sociotechnical work in the maritime domain, J. Cognit. Eng. Decis. Mak., 11, 270–295, 2017.
DNVGL: Certification of offshore gangways for personnel transfer, Oslo, Norway, available at: https://rules.dnvgl.com/docs/pdf/DNVGL/ST/2015-12/DNVGL-ST-0358.pdf (last access: 9 February 2021), 2015a.
DNVGL: Dynamic positioning vessel design philosophy guidelines, Recommended practice (DNVGL-RP-E306), Oslo, Norway, available at: https://rules.dnvgl.com/docs/pdf/DNVGL/RP/2015-07/DNVGL-RP-E306.pdf (last access: 9 February 2021), 2015b.
DNVGL: Offshore gangways (DNVGL-ST-0358), Oslo, Norway, available at: https://rules.dnvgl.com/docs/pdf/DNVGL/ST/2017-09/DNVGL-ST-0358.pdf (last access: 9 February 2021), 2017.
DoD – Department of Defense: Standard practice, System safety, Washington, D.C., USA, available at: https://www.dau.edu/cop/armyesoh/DAU Sponsored Documents/MIL-STD-882E.pdf (last access: 9 February 2021), 2012.
Dong, Y., Vinnem, J. E., and Utne, I. B.: Improving safety of DP operations: learning from accidents and incidents during offshore loading operations, Eur. J. Decis. Process., 5, 5–40, https://doi.org/10.1007/s40070-017-0072-1, 2017.
Grace, L. and Lee, W.-H.: Cost Effective Offshore Concepts-Compact Semi-Submersible – A New Concept of Windfarm Service Operations Vessel, in: Offshore Technology Conference, 1–4 May 2017, Houston, Texas, USA, 2017.
GWEC: Global Wind Report 2018, GWEC – Global Wind Energy Council, Brussels, 2019.
Herrera, I. A., Hollnagel, E., and Håbrekke, S.: Proposing safety performance indicators for helicopter offshore on the Norwegian Continental Shelf, in: PSAM 10 – Tenth Conference on Probabilistic Safety Assessment and Management, 7–11 June 2010, Seattle, Washington, USA, p. 10, 2010.
Hollnagel, E.: Barriers and accident prevention, Routledge, New York, USA, 2016.
Hollnagel, E.: Safety-I and Safety-II: the past and future of safety management, CRC Press, Boca Raton, FL, USA, 2018.
Hollnagel, E., Woods, D. D., and Leveson, N.: Resilience engineering: Concepts and precepts, Ashgate Publishing, Ltd., Dorchester, UK, 2007.
IEC61508: IEC 61508 Functional safety of electrical/electronic/programmable electronic safety-related systems, International Electrotechnical Commission, Geneva, Switzerland, 1998.
IMCA: Serioius DP diving incident, IMCA Safety Flash 02/13, available at: https://imcaweb.blob.core.windows.net/wp-uploads/2020/06/IMCASF-02-13.pdf (last access: 9 February 2021), 2013.
IMCA: Guidance on the Transfer of Personnel to and from Offshore Vessels and Structures (IMCA SEL 025 Rev. 1, IMCA M 202 Rev. 1), available at: https://www.imca-int.com/product/guidance-on-the-transfer-of-personnel-to-and-from-offshore- (last access: 9 February 2021), 2014.
IMCA: International Guidelines for The Safe Operation of Dynamically Positioned Offshore Supply Vessels (182 MSF Rev. 2), available at: http://key4mate.com/wp-content/uploads/2015/08/IMCA_M182_DP_Guide.pdf (last access: 9 February 2021), 2015.
IMO: International Safety Management Code (ISM Code) with guidelines for its implementation, IMO, London, 2018.
Leveson, N.: A new accident model for engineering safer systems, Safe. Sci., 42, 237–270, 2004.
Leveson, N.: Engineering a safer world: Systems thinking applied to safety, MIT Press, Cambridge, Massachusetts, USA, 2011.
Leveson, N. and Thomas, J.: STPA Handbook, MIT Press, Cambridge, Massachusetts, USA, 2018.
Leveson, N. G.: System safety in computer-controlled automotive systems, SAE Technical Paper 0148-7191, available at: https://citeseerx.ist.psu.edu/viewdoc/download?doi=10.1.1.41.8282&rep=rep1&type=pdf (last access: 9 February 2021), 2000.
Leveson, N. G.: Applying systems thinking to analyze and learn from events, Safe. Sci., 49, 55–64, 2011.
Meadows, D. H.: Thinking in systems: A primer, Chelsea Green Publishing, Chelsea, 2008.
Patriarca, R. and Bergström, J.: Modelling complexity in everyday operations: functional resonance in maritime mooring at quay, Cognit. Technol. Work, 19, 711–729, 2017.
Praetorius, G., Hollnagel, E., and Dahlman, J.: Modelling Vessel Traffic Service to understand resilience in everyday operations, Reliabil. Eng. Syst. Safe., 141, 10–21, 2015.
Presencia, C. E. and Shafiee, M.: Risk analysis of maintenance ship collisions with offshore wind turbines, Int. J. Sustain. Energ., 37, 576–596, 2018.
Puisa, R., Bolbot, V., and Ihle, I.: Development of functional safety requirements for DP-driven servicing of wind turbines, in: The 7th edition of the European STAMP Workshop and Conference (ESWC), Helsinki, 2019.
Qureshi, Z. H.: A review of accident modelling approaches for complex socio-technical systems, in: Vol. 86, Proceedings of the twelfth Australian workshop on Safety critical systems and software and safety-related programmable systems, 47–59, available at: https://apps.dtic.mil/sti/pdfs/ADA482543.pdf (last access: 9 February 2021), 2007.
Rae, A., McDermid, J., and Alexander, R.: The science and superstition of quantitative risk assessment, available at: https://research-repository.griffith.edu.au/bitstream/handle/10072/337460/RaePUB2470.pdf?sequence=1 (last access: 9 February 2021), 2012.
Rasmussen, J.: Risk management in a dynamic society: a modelling problem, Safe. Sci., 27, 183–213, 1997.
Rausand, M.: Risk assessment: theory, methods, and applications, John Wiley & Sons, Hoboken, New Jersey, USA, 2013.
Rokseth, B., Utne, I. B., and Vinnem, J. E.: A systems approach to risk analysis of maritime operations, Proceedings of the Institution of Mechanical Engineers, Part O, J. Risk Reliabil., 231, 53–68, 2017.
Rollenhagen, C.: MTO – an Introduction; the Relationship Between Humans, Technology and Organization, Utbildningshuset, Lund, Sweden, 1997.
Salmon, P. M., Cornelissen, M., and Trotter, M. J.: Systems-based accident analysis methods: A comparison of Accimap, HFACS, and STAMP, Safe. Sci., 50, 1158–1170, https://doi.org/10.1016/j.ssci.2011.11.009, 2012.
Sarter, N. B., Woods, D. D., and Billings, C. E.: Automation surprises, Handbook of human factors and ergonomics, 1926–1943, available at: https://citeseerx.ist.psu.edu/viewdoc/download?doi=10.1.1.134.7077&rep=rep1&type=pdf (last access: 9 Feburary 2021), 1997.
SgurrEnergy: Offshore Wind and Marine Energy Health and Safety Guidelines, Renewable, UK, available at: https://cdn.ymaws.com/www.renewableuk.com/resource/collection/AE19ECA8-5B2B-4AB5-96C7-ECF3F0462F75/OnshoreWind_HealthSafety_Guidelines.pdf (last access: 9 February 2021), 2014.
Sklet, S.: Safety barriers: Definition, classification, and performance, J. Loss Prevent. Process Indust., 19, 494–506, https://doi.org/10.1016/j.jlp.2005.12.004, 2006.
Sulaman, S. M., Beer, A., Felderer, M., and Höst, M.: Comparison of the FMEA and STPA safety analysis methods – a case study, Softw. Qual. J., 27, 349–387, 2019.
Woods, D. D. and Hollnagel, E.: Prologue: resilience engineering concepts, in: Resilience engineering, CRC Press, Dorchester, UK, 13–18, 2017.
We use the term incidents to refer to both incidents and accidents throughout the paper.