the Creative Commons Attribution 4.0 License.
the Creative Commons Attribution 4.0 License.
 | 23 May 2022
High-Reynolds-number investigations on the ability of the full-scale e-TellTale sensor to detect flow separation on a wind turbine blade section
Antoine Soulier
Caroline Braud
Dimitri Voisin
Frédéric Danbon
The complexity of the flow over a wind turbine blade makes its understanding and monitoring a challenging task, especially on operating wind turbines. The innovative electronic TellTale (e-TellTale) sensor is developed for that purpose – detecting the flow separation on wind turbines blades. In this paper, high-Reynolds-number wind tunnel tests have been performed with different configurations of full-scale e-TellTale sensors and wall pressure measurements on a wind turbine blade section. A comparison between the lift curve and the e-TellTale signal was used to evaluate the ability of the sensor to detect flow separation. Results show different interesting properties of the sensor response depending on its size, position along the chord and fitting process that could be used in real applications.
- Article
(6680 KB) - Full-text XML
- BibTeX
- EndNote


Increasing the life of wind turbines is one of the major areas of investigation faced by wind farm operators. A cause of premature aging often put forward is the accumulation of loads imposed by the strong shears upstream of the rotor due to an incorrect setting of the wind turbine or to the atmosphere in which it operates (Rezaeiha et al., 2017). In order to limit the influence of these disturbances on the wind turbine, modern pitch-regulated wind turbines are operational today. Sensors currently used are located on the wind turbine nacelle such as cup anemometers (Smaïli and Masson, 2004) and on the wind turbine spinner (Pedersen et al., 2015). Upstream flow measurements from a nacelle-mounted lidar are also under development (Scholbrock et al., 2013). This lidar system will predict flow perturbations (gust, misalignment, etc.) before a control action of the blade is performed. The control objective is to alleviate turbine blade lift fluctuations and resulting load fluctuations by an adequate adjustment of the blade incidence. However, measurements at the wind turbine nacelle do not sufficiently take into account the state of the flow on the aerodynamic surfaces (attached/separated, laminar/transitional or turbulent aerodynamic boundary layer), which is critical to deciding a control action. Also, pitch control on very large blades is not fast enough to account for the small timescales from small turbulent structures generated in a wind turbine wake for instance (Chamorro et al., 2012), while the small turbulent structures have a strong impact on blade loads (Bartholomay et al., 2018). Having local and robust aerodynamic sensors at the blade scale placed at key areas would be an important step for wind turbine monitoring and operation. Furthermore, they could be used together with active devices to further decrease local spatio-temporal loads (Shaqarin et al., 2013; Jaunet and Braud, 2018). Swytink-Binnema and Johnson (2016) have demonstrated the possibility of detecting aerodynamic flow separation using distributed tufts over the blade surface and a blade-root-embedded camera. A simple and robust alternative to this sensor is the use of electronic TellTale (e-TellTale) sensors. The system is composed of a silicone strip with a strain gauge at its base. When the silicone strip goes away from the surface, the displacement is measured by the strain gauge. The e-TellTale sensor is already used on the sails of some boats and can be glued onto the aerodynamic surface of wind turbine blades for retrofitting purposes. First tests of this innovative sensor were conducted at a low Reynolds number using a downscaled device (Soulier et al., 2021). The strip of the e-TellTale was demonstrated to follow the separation/reattachment dynamics similarly to much more accurate detection methods based on time-resolved PIV (particle image velocimetry) measurements. The present paper extends the investigation on the ability of the e-TellTale sensor to detect the flow separation over airfoil profiles towards the use of a full-scale device and high-Reynolds-number wind tunnel tests (the chord-based Reynolds number is ). The same 2D blade section was used here (NACA 654-421), and different parameters of the e-TellTale device were investigated, including its position, the strip length and its surface-fitting process. The evaluation has been performed at different AoAs (angles of attack) and through measurements of three lines of chordwise pressure taps acquired synchronously with the strain gauge signal of the e-TellTale sensor.
The paper is divided in three main sections. Section 2 describes the experimental setup, including the description of the wind tunnel facility, the blade manufacturing, the measurements used for the evaluation of the e-TellTale sensor and the description of the different e-TellTale configurations. Section 3 describes the aerodynamics of the chosen blade profile, focusing on the flow separation phenomena. The last section presents the results including the impact of the strip location and length and fitting process on the sensor signal.
2.1 The wind tunnel
The measurements were performed at Nantes (France), in the NSA return wind tunnel of CSTB (http://www.cstb.fr/en/, last access: 20 May 2020). The test section is 20 m long with a cross-section of 4 m × 2 m (see Fig. 1). The turbulence intensity level in this test section is around 1 %, and the operating speed of the wind tunnel is set to U∞=20 m s−1. At this free-stream velocity, the Reynolds number of the flow based on the chord length (c=0.693 m) is 8.85×10⁵. The profile was set on a rotating table on its bottom and guided on the ceiling using a bearing. Three pressure lines were used at different span locations, where measurements were performed, to check the flow bidimensionality in the area of interest (see Sect. 2.3).
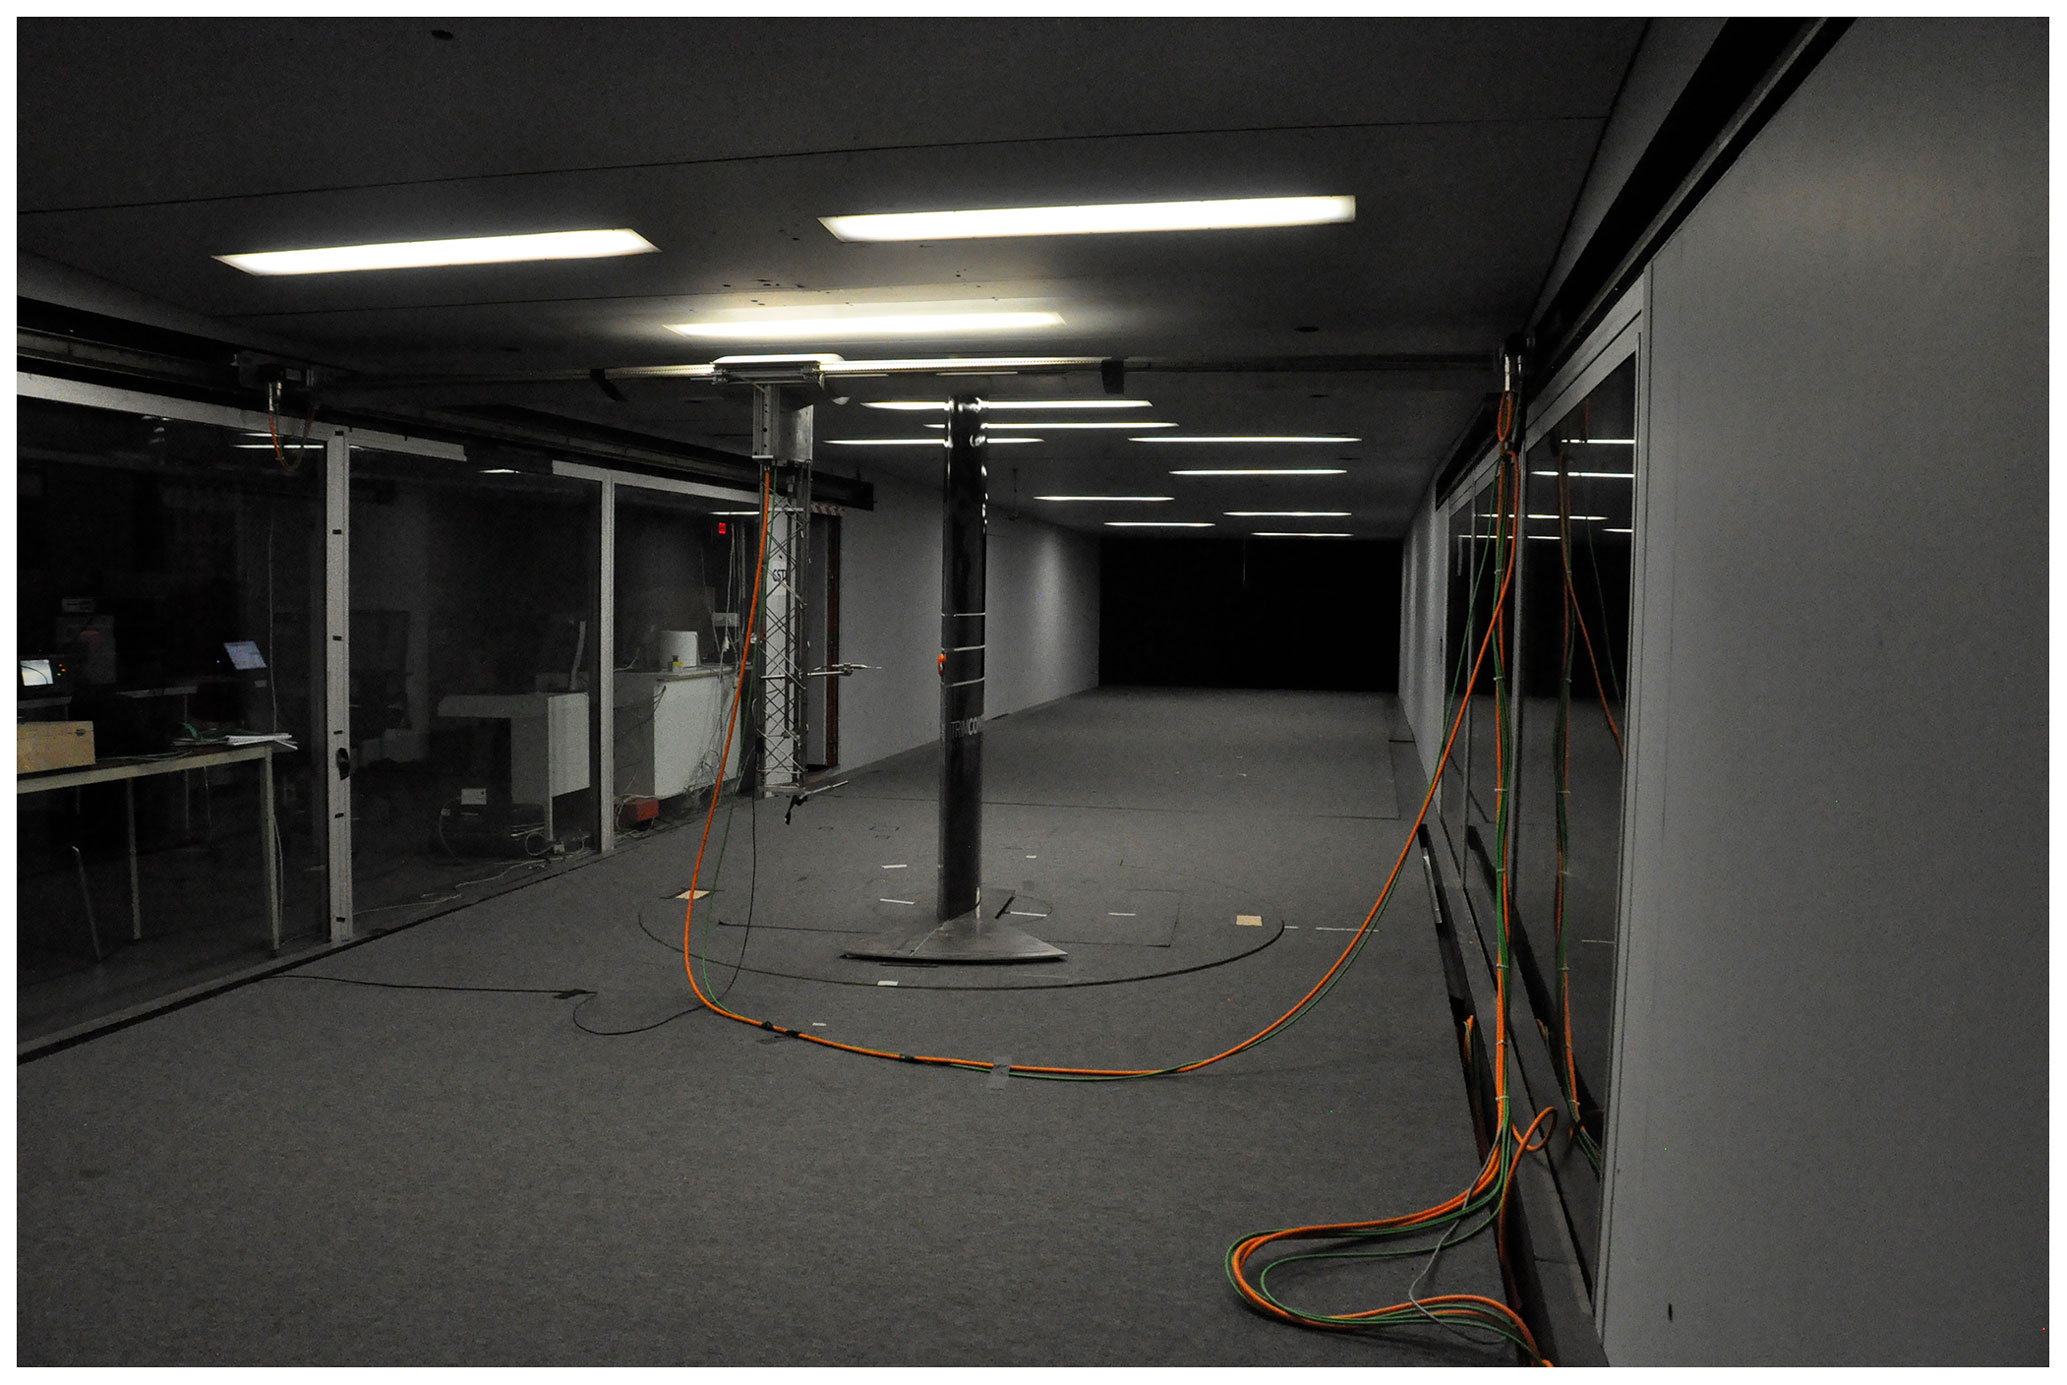
Figure 1The NSA wind tunnel facility of CSTB with the 2D NACA 654-421 blade section installed.
2.2 Blade manufacturing
The chosen 2D blade section, NACA 654-421, was manufactured to be installed in the wind tunnel facility of CSTB. It was made of a skeleton coated with a supple composite. Details on the blade manufacturing can be found in Fig. 2. The shape of this airfoil profile, already used in previous studies (Sicot et al., 2008; Devinant et al., 2002), is also used in operation on stall-regulated wind turbines.

Figure 2The blade manufacturing. (a) Elements of the skeleton: two steel beams ensure the rigidity; plywood ribs ensure the blade aerodynamic shape; 3D-printed ribs are equipped with pressure taps; the trailing edge is made of resin. (b) Picture of the blade with one of the glass reinforced polymer skins removed.
2.3 Measurements
The coordinate axes of the present study are x in the streamwise direction, y in the cross direction and z in the spanwise direction perpendicular to the chord line. The origin is taken at the intersection between the leading edge and the chord line, in the middle of the blade span (see Fig. 3). To obtain the lift coefficient CL, three chordwise lines of pressure taps were distributed around the profile using three 3D-printed ribs equipped with 117 pressure sensors each. They were located in the middle of the profile at z=0 and z±0.173c (see Fig. 3). Copper tubes of 0.8 mm internal diameter were flush mounted using pressure tap holes in the 3D-printed ribs. Vinyl tubes were then connected to transport the pressure towards ESP 32HD pressure sensors ranging from 0 to 2.5 kPa with a precision of ±0.03 % of the full scale. The cutoff frequency of the total system (tubes plus sensors) was 256 Hz. The signal was low-pass filtered at 256 Hz and acquired at 512 Hz. For each AoA, the pressure coefficient, CP, was calculated and averaged over the duration of the measurement, which was 2 min, and then the lift coefficient CL was computed for each line of pressure taps by integration. It has been checked that the statistical convergence of CL is reached well before 1 min. The lift coefficient presented in this study is the result of an average over the three lines of pressure.
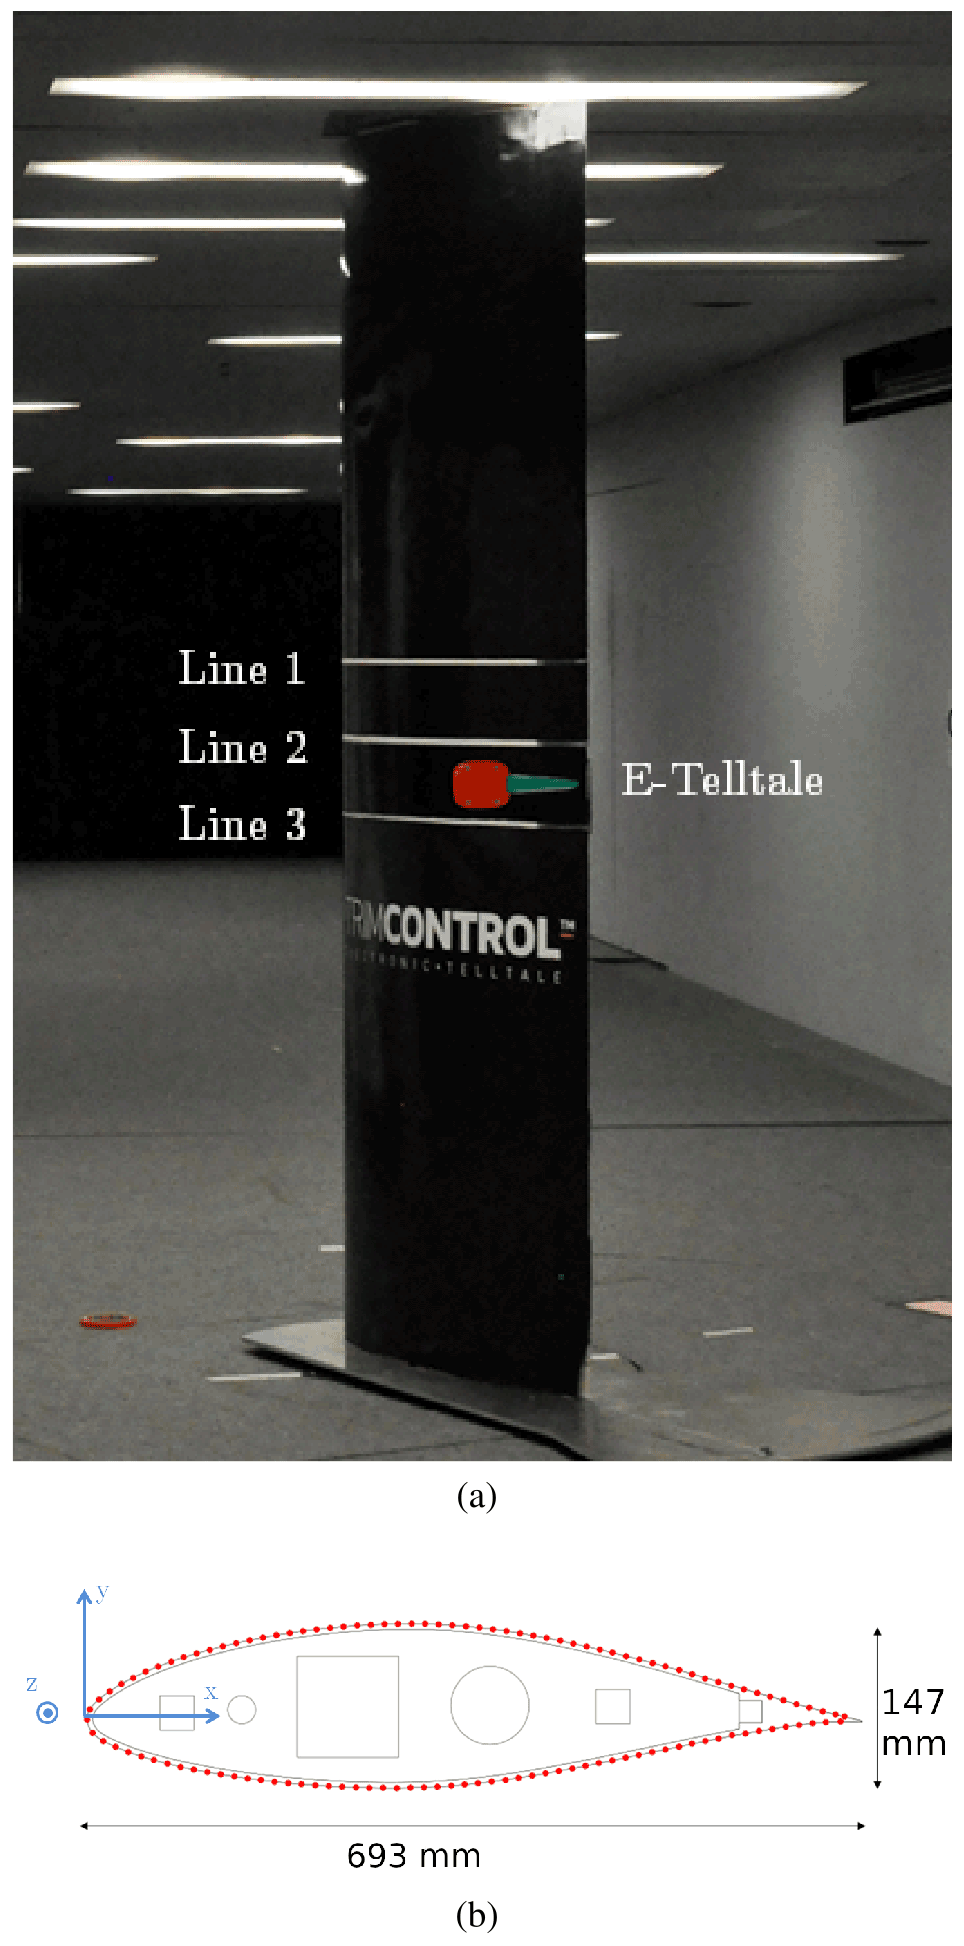
Figure 3(a) Positions of the chordwise pressure lines along the span. (b) Positions of pressure taps around the chord.
2.4 e-TellTale sensors
The e-TellTale sensors are each composed of a silicone strip with a strain gauge sensor at its base so that it measures displacements of the strip away from the surface (see Fig. 4). The signal from the strain gauge sensor was amplified with a specialized amplifier (LTC6915). The signal is then filtered with a low-pass analog filter with a cutoff frequency of 160 Hz and a slope of −20 dB per decade. The filtered signal was then recorded with the same acquisition device as for the pressure measurements.

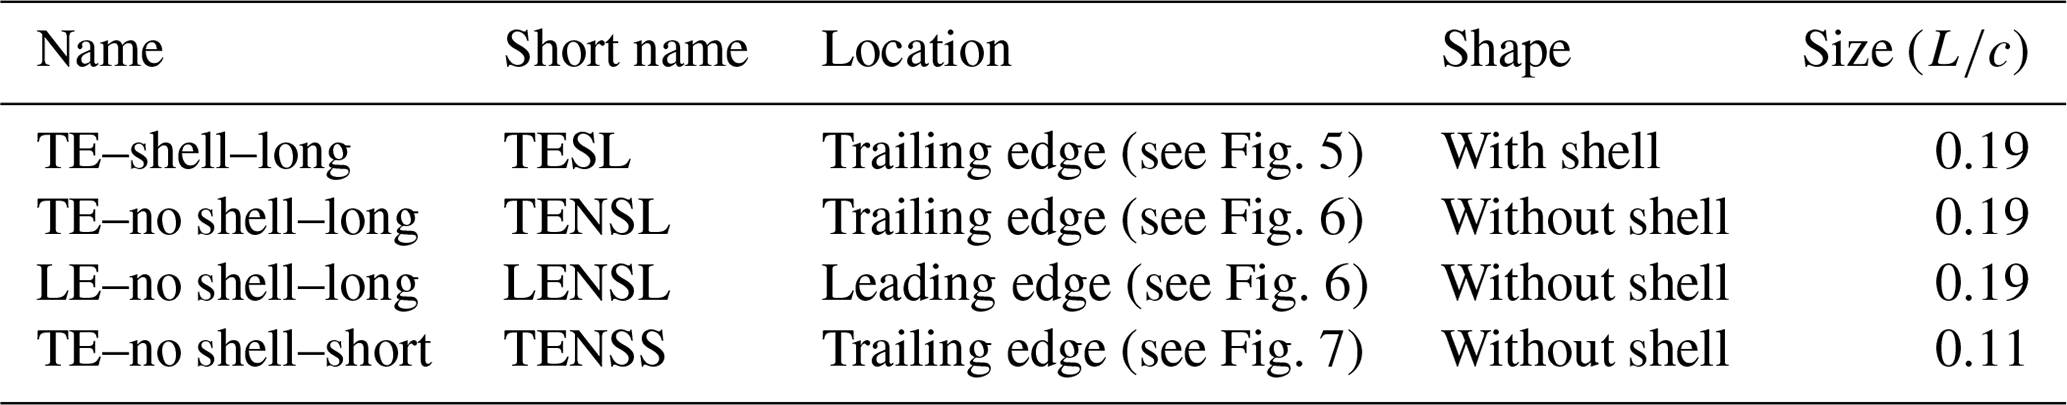
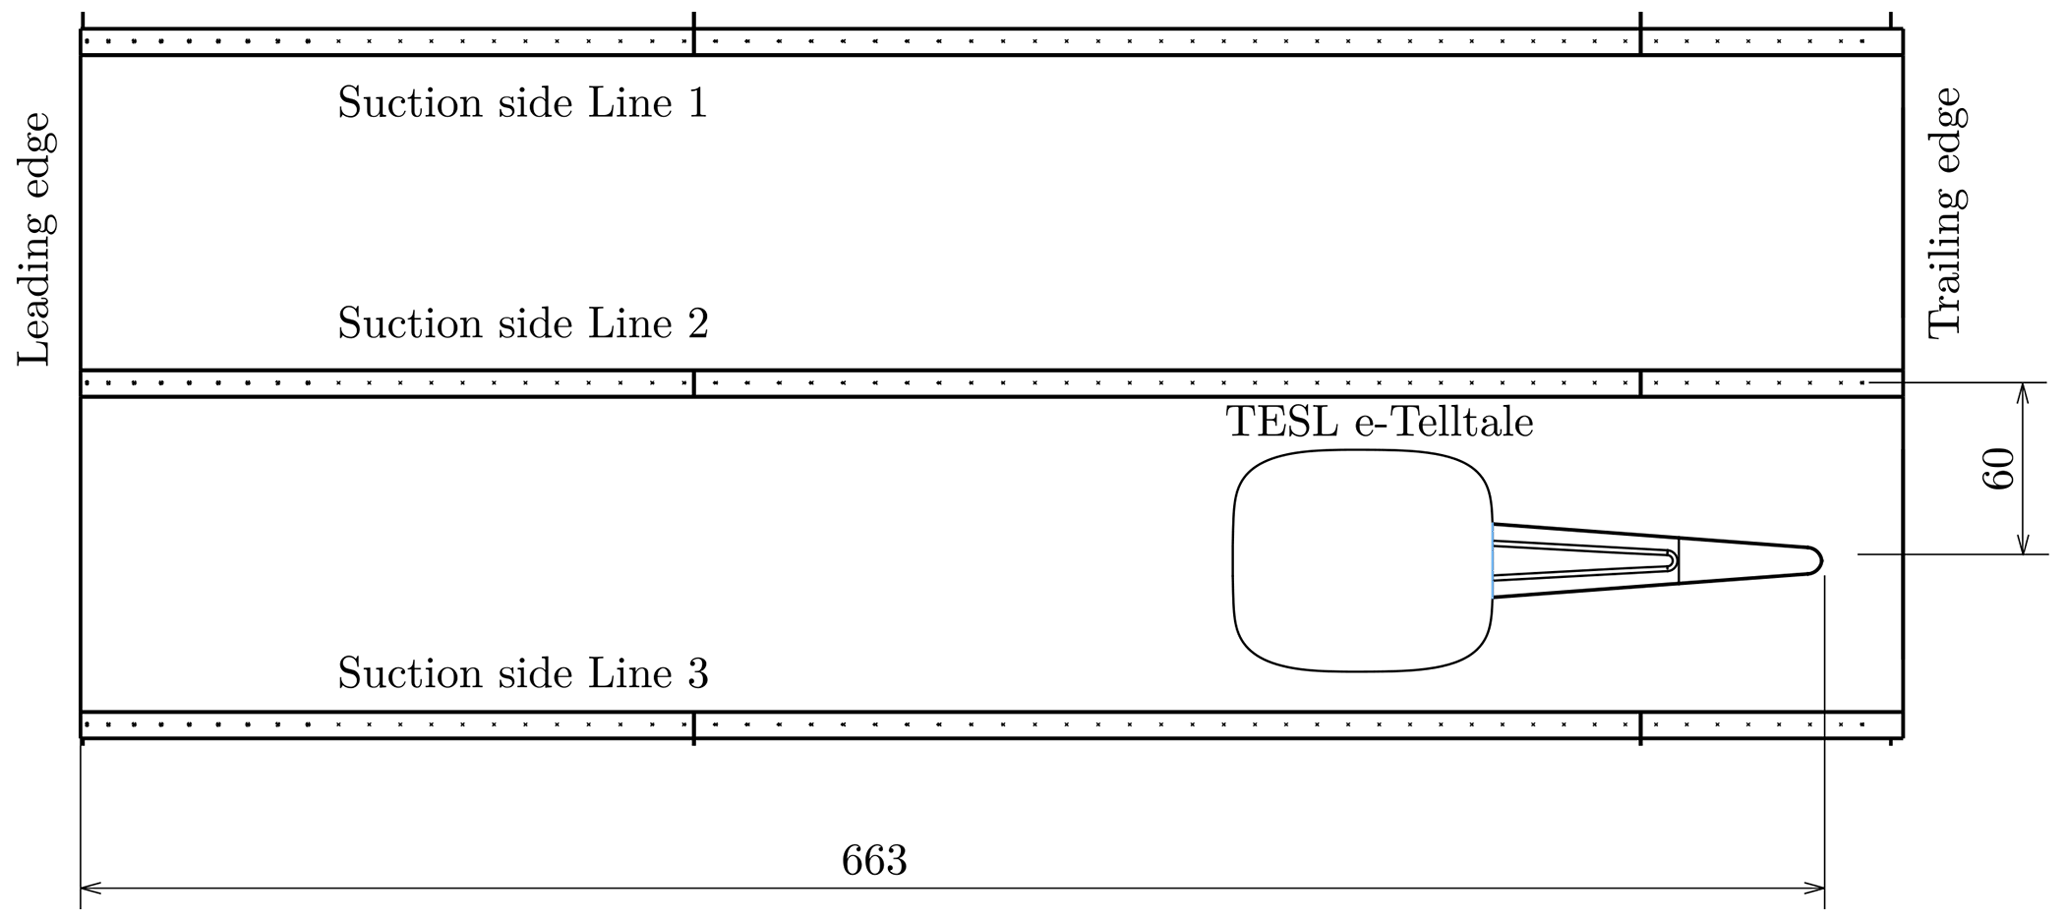
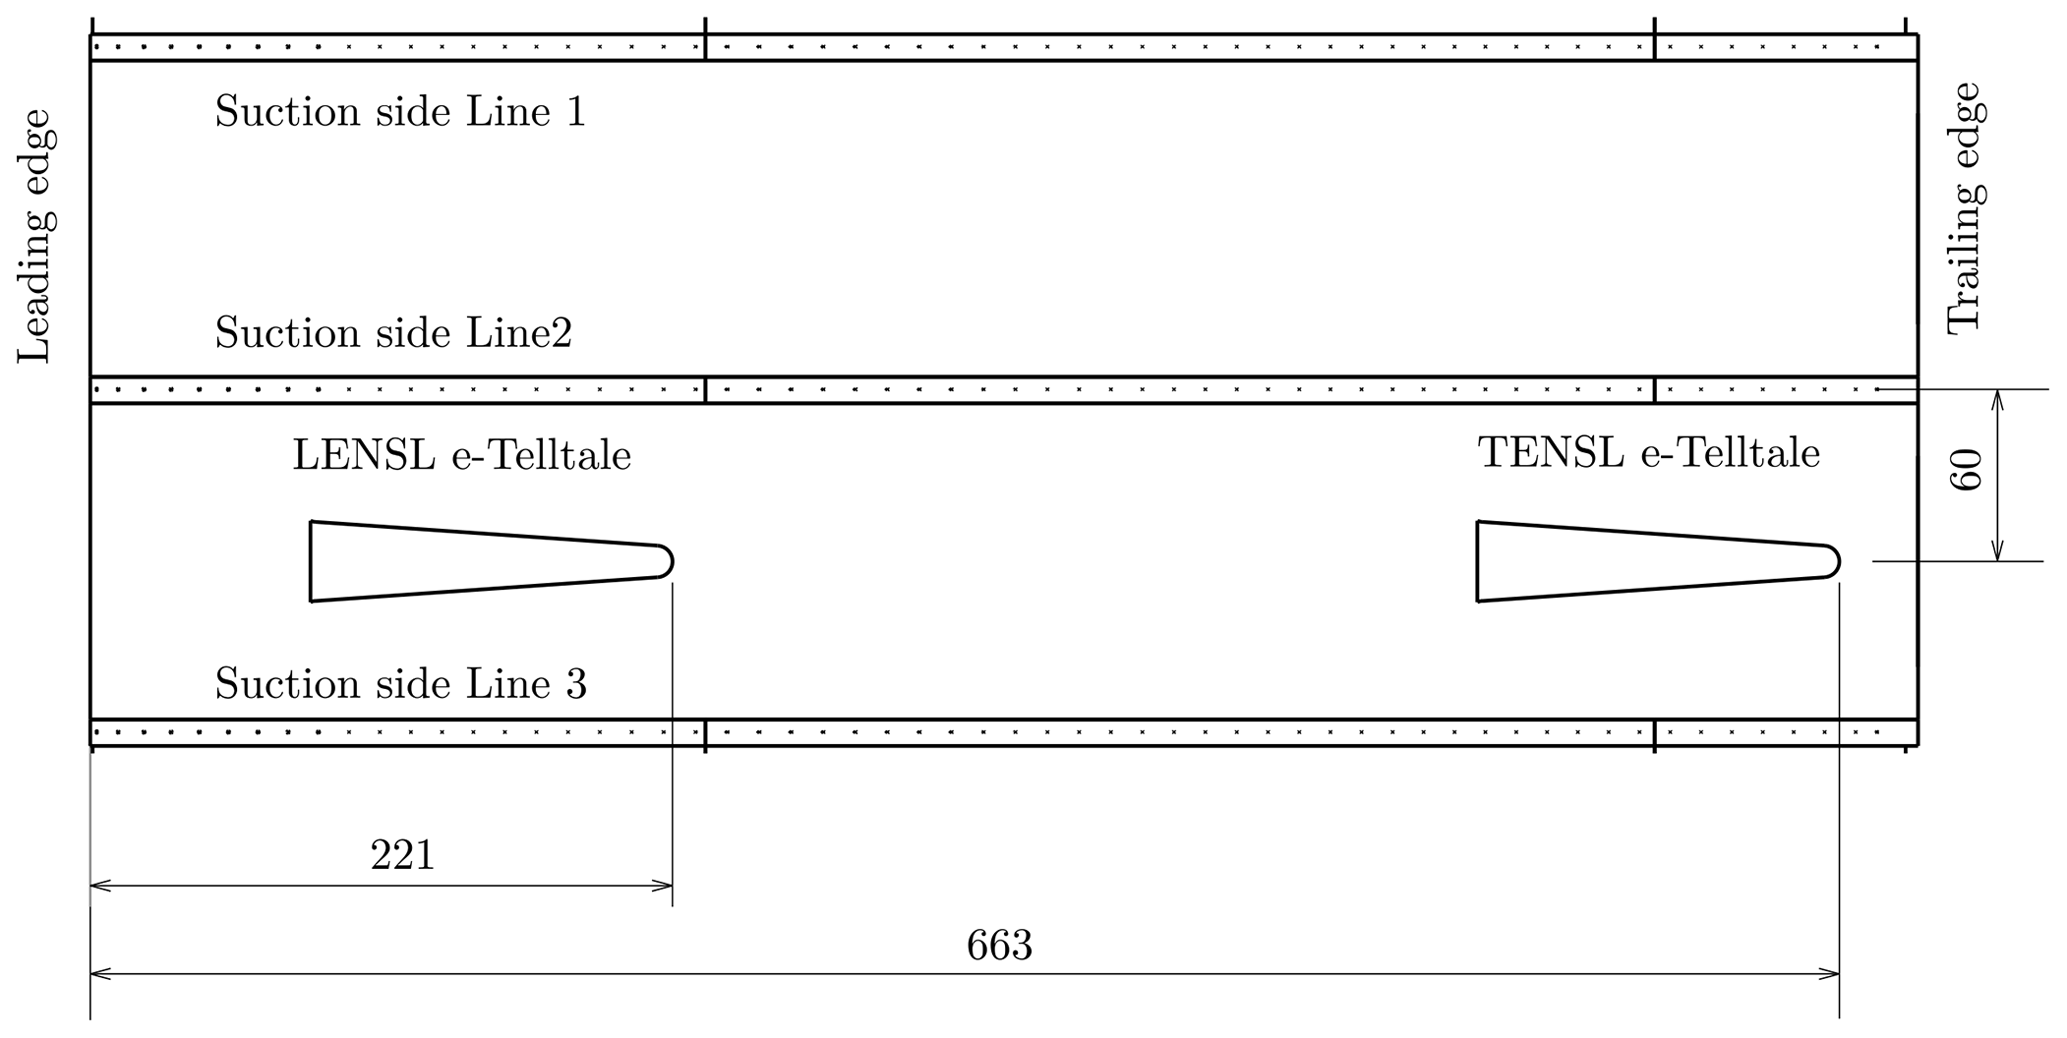
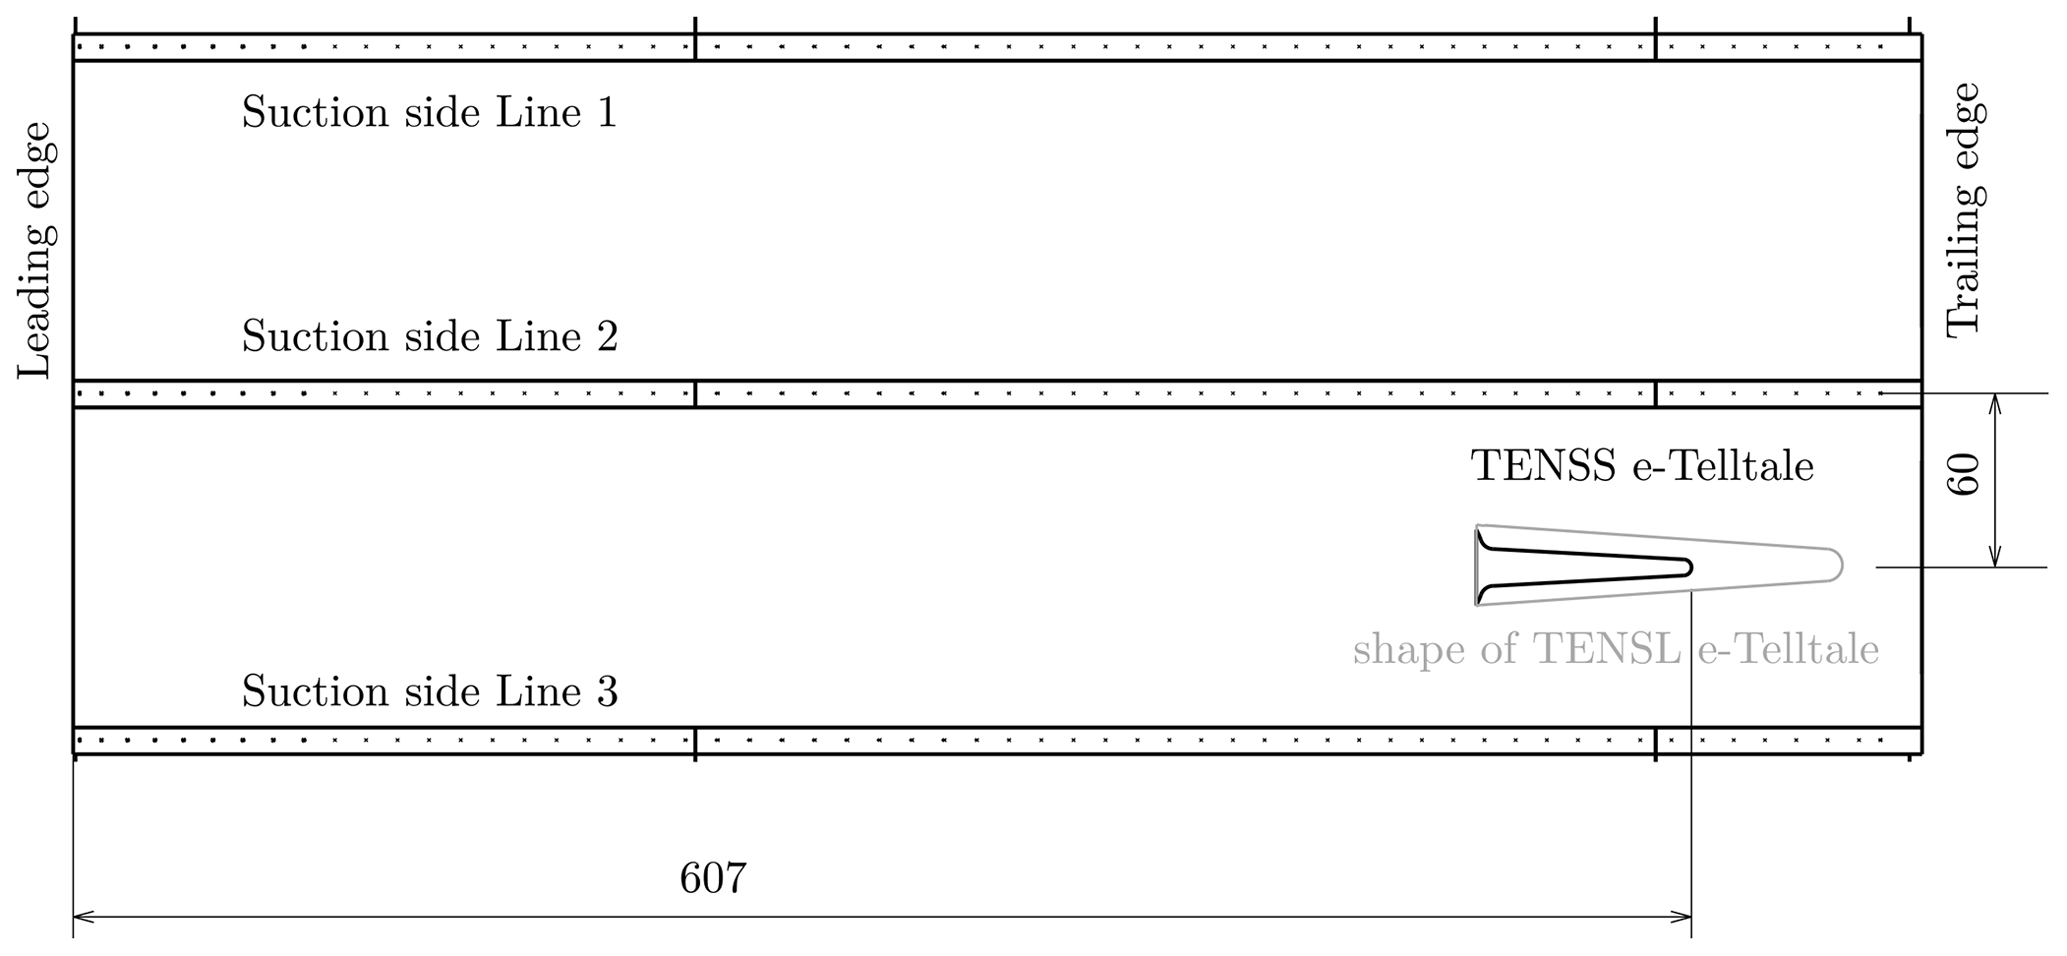
In the present study, which is the first high-Reynolds-number wind tunnel evaluation of this innovative e-TellTale sensor, we focus on the ability of the e-TellTale sensors to detect mean load variations highlighted by the lift coefficient evolution versus the AoA and related to the flow separation over the suction side surface of the blade described in Sect. 3. Different parameters of the e-TellTale sensor were investigated and are summarized in Table 1. The first question that arises for such local sensors is where to place them on operating turbines. For this reduced problem (2D blade model), this question can be summarized as follows: which sensor positions are the best to detect the angles at which separation occurs? Two locations will be targeted as this blade profile shape has two types of flow separation (see Sect. 3 for more details): the flow separation at the trailing edge and the flow separation at the leading edge. Therefore, the end of the strip is first located at 95.6 % of the way from the leading edge, the trailing-edge or TE case, and at 31.8 % of the way from the leading edge, the leading-edge or LE case (see Fig. 5). The TE position is slightly modified for shorter strips so that the end of the strip is at 87.6 % from the leading edge rather than 95.6 % (see Fig. 5). Another question we aim to answer in this study is the ability of this device to detect flow separation for two different surface-fitting processes. The first e-TellTale is equipped with an aerodynamic shell that is glued onto the surface, the shell or S case. The second e-TellTale is integrated in the surface of the airfoil so that the surface of the airfoil is less perturbed, the no-shell or NS case. The shell case is generally mounted on wind turbines already in operation, while the no-shell case could be part of the blade manufacturing process. As a first evaluation of this parameter, the length of the strip is divided by almost 2 by keeping only the central part of the strip that is thicker (see Figs. 4 and 7). Between the two cases, the surface thickness ratio is modified from 921 to 218 mm. The two cases will be referred to later as the long strip (or L strip) and short strip (or S strip).
Table 1e-TellTale configurations (with L the length of the silicon strip and c the chord of the profile).
The NACA 654-421 profile has different slope modifications of the static lift coefficient corresponding to different states of flow on the suction side surface of the airfoil. This profile has already been studied in the work of Devinant et al. (2002), and a modified version (rounded trailing edge) of this NACA profile was used in the ANR (French national grant) project SMARTEOLE (Leroy, 2018; Braud and Guilmineau, 2016; Baleriola et al., 2018; Jaunet and Braud, 2018).
Measurements of the present study were performed with a turbulence intensity of 1 %, which may be at the origin of some discrepancies in the exact values of the separation angles from different studies on the same profile (Devinant et al., 2002). However, similarly to previous studies, this profile shape presents different states of the flow depending on the AoA that have an impact on the shape of the lift curve and on the chordwise pressure distribution. Figures 8 and 9 show the lift coefficient and pressure coefficient of the average of the three lines of pressure taps; they are used for a rough description of the flow state with the AoA for this airfoil shape as there exist many scenarios according to Gault (1957):
-
Until AoA≃6∘, the lift rises linearly with the AoA; the flow is attached to the surface of the profile as seen on the pressure distribution with no area of constant pressure on the suction side of the trailing edge.
-
Between AoA≃6 and 8∘, the flow transitions from the attached state to the separated state (i.e., zero pressure gradient), as can be seen in the zoomed-in part of Fig. 9 (panel b), where the mean pressure coefficient near the trailing edge progressively increases towards a plateau from AoA=6∘.
-
From AoA≃8 to 17∘, the flow separation (i.e., mean zero pressure gradient) can now be observed on average and moves progressively towards the leading edge. This corresponds to a linear evolution of the lift with the AoA, with however a smaller slope than the previous flow state.
-
From AoA≃17 to 20∘, the evolution of the separation point towards the leading edge is faster and not linear; the flow transitions towards stall. In the pressure distributions at AoA=17∘ and AoA=20∘ a large plateau of constant wall pressure can be seen on the suction side of the profile, showing that the flow separation location reaches the first 30 % of the chord length.
-
Over AoA≃21∘ the separation point has reached the leading-edge area, the flow is stalled and the wall pressure is almost constant on the whole suction side. The flow behaves like an asymmetric bluff body with shear layers on each side of the profile (from the leading edge and the trailing edge), a recirculating area in the close wake and a wake behavior further downstream. From the lift curve, the flow can be considered a stalled flow.
These flow states correspond to a progressive displacement of the mean flow separation from the trailing edge to the leading edge until the stall occurs, a typical scenario found by Gault (1957) for thick airfoil shapes. It should be noted that, near the transitioning regions (around AoA + 8∘ or near stall), the flow becomes 3D as highlighted by Manolesos et al. (2014) and Bak et al. (1999), leading to discrepancies that are still under investigation (Olsen et al., 2020). Therefore, for consistency, the pressure measurements were conducted simultaneously with the e-TellTale sensor signal, and they are presented with the e-TellTale signal. Also, an average of the two chordwise pressure lines that surround the e-TellTale sensor is used for Figs. 10–13.


Figure 9(a) Pressure coefficient CP average on the three lines of pressure taps for , , and . (b) Zoomed-in view of the trailing edge.
During these experiments attention was drawn to evaluate the ability of the e-TellTale to detect the slope changes in CL corresponding to the flow separation at the trailing edge (AoA≃8∘) and the leading-edge flow separation, corresponding to the stall angle (AoA≃21∘) as explained in Sect. 3. Each modification of the lift slope corresponds to an evolution of the flow separation state, which ideally induces a different movement of the e-TellTale strip and thus a difference in the strain gauge signal of the e-TellTale device. In this section, the time-averaged strain gauge signal and the standard deviation are computed for each AoA and presented together with the corresponding lift curve.
4.1 The reference case (TENSL)
In order to compare different parameters of the e-TellTale (as presented in Table 1), the TENSL configuration (near the trailing edge, no shell, long strip) was selected as the reference case. Figure 10 shows the evolution of the mean and the standard deviation of the signal of the e-TellTale corresponding to the TENSL case as a function of AoA. The lift curve is plotted as well to allow us to locate the state of the flow with the AoAs which are shown in the figure. From −5 to 5∘, the linear evolution of the lift indicates an attached flow state. For this AoA range, both the mean and the standard deviation of the signal of the e-TellTale are near 0. From 5 to 8∘, corresponding to the flow separation appearance at the trailing edge, both the mean and the standard deviation rise up with the AoA. Then from 8 to 10∘ they decrease to values near 0. It should be noticed that this behavior is not present when the e-TellTale is located near the leading edge (LENSL, Fig. 12), clearly indicating that this bump from 5 to 10∘ is associated with the location of the e-TellTale sensor in the trailing-edge flow separation area. This suggests that, in that region, when the AoA is increasing from 5 to 8∘, the flow is departing from the wall, causing movement of the e-TellTale strip outwards from the wall and thus increasing its signal. The separated flow should naturally induce a mean shear area with associated turbulent structures. This turbulent, separated shear layer supposedly fluctuates from the wall to the separated shear area, causing fluctuations of the e-TellTale strip (that were observed), increasing the rms value of the e-TellTale sensor. Above 8∘, the separated shear layer probably moves too far from the wall, moving out of reach of the e-TellTale strip length, which in turn reduces the mean and rms value of the e-TellTale signal. More spatio-temporal information is needed to confirm this scenario. Also, it should be noted that this scenario does not take into account potential fluid–structure interactions with the e-TellTale strip. It is however interesting to note that the e-TellTale has a particular sensitivity to the transition flow state from the fully attached flow to the trailing-edge flow separation. The advantage of this observation is to make this innovative sensor appropriated to predict the trailing-edge flow separation. At AoA>10∘, both the mean and the standard deviation of the e-TellTale signal increase again until AoA=18∘. Contrary to the AoA range corresponding to the appearance of the trailing-edge flow separation, between AoA=5∘ and AoA=8∘, the evolution is not linear. Progressive saturation of the signal appears slowly. This may be explained by the displacement of the separation point and its associated shear layer, which move further away from the sensor with the increase in the AoA. Between AoA=18∘ and AoA=21∘ the e-TellTale signal is marked by a sudden rise in two steps: a first moderate step between 18 and 20∘ and a sudden rise between 20 and 21∘. This can be explained by the strip that flips towards the leading edge due to the strength of the reverse flow after 20∘, in good agreement with low-Reynolds-number experiments performed by Soulier et al. (2021). After the stall angle, AoA=21∘, the mean signal reaches its maximum value while the standard deviation doubles. This indicates that not only does the strip flip in the reverse flow on average but also it fluctuates in the flow with larger oscillation than when the stall has occurred, again in good agreement with low-Reynolds-number observations (Soulier et al., 2021). The significant rise which occurs at the stall angle allows a clear detection of the stall angle with the e-TellTale sensor, even though not ahead of its appearance. After this AoA of 21∘, the stalled flow or the bluff-body flow is settled and both the mean and the standard deviation of the e-TellTale signal linearly decrease, probably due to the deportation of the shear layer further away from the location of the e-TellTale.
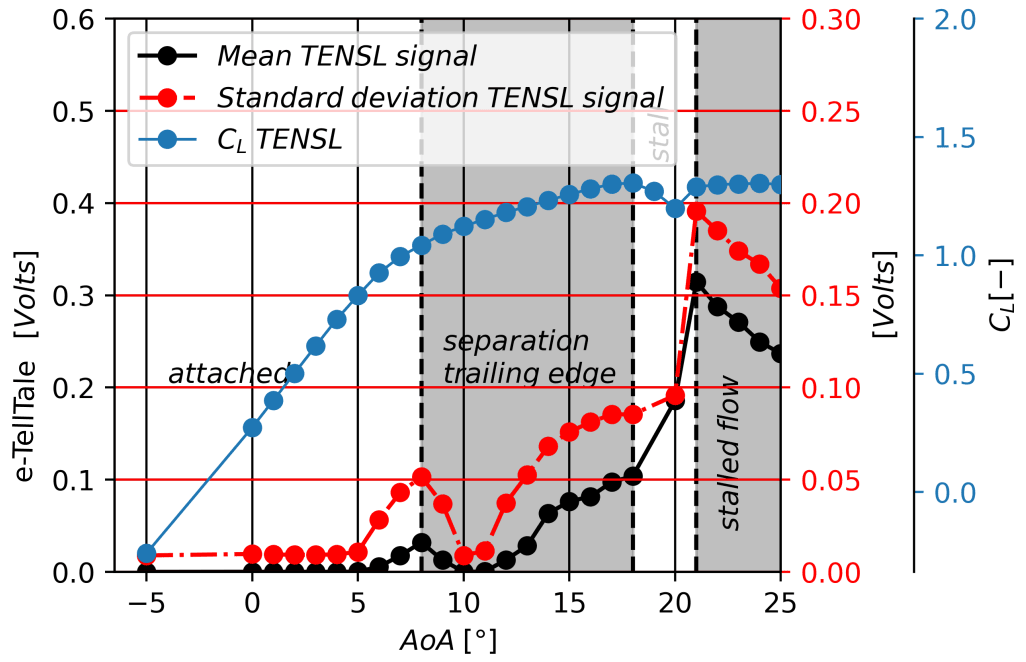
Figure 10Mean and standard deviation of the e-TellTale TENSL signal and lift CL as a function of AoA.
4.2 Influence of the strip stiffness or length (TENSS case)
Compared to the previous case (Sect. 4.1), the TENSS case presents a shorter strip length with a reduction of 58 % (see Table 1). The TENSS case has also a surface thickness ratio reduction of 77 % with varying from 921 to 218 mm (A is the area of the strip, and T is the thickness of the strip), whose parameter is inversely proportional to the stiffness of the strip. The short strip is therefore much stiffer than the long one.
The e-TellTale is located at the same position as the reference TENSL case (the root of the strip at around 77 % of the chord). For this test, the same device is used but the strip has been cut, ensuring that the strain gauge and the position of the strip are identical to the reference case. Figure 11a and b show the mean and standard deviation respectively of the TENSS case signal versus the AoA, plotted together with the reference case. They clearly show that there is almost no information about the stall with the shorter-strip case (i.e., for AoA>19∘); only a slight increase in the standard deviation value with a peak around 21∘ is observed (see Fig. 11b). On the contrary, for AoAs corresponding to the appearance of the flow separation at the trailing edge, from AoA=5∘ to AoA=8∘, the mean signal is 1.5 times higher than the reference case (longer-strip case). Also, the mean and standard deviation of the signal suddenly drop at AoA=9∘. Having a higher sensitivity of the strain gauge signal for the shorter-strip case, which is stiffer, highlights that the length of the strip is the most relevant parameter for the detection of trailing-edge separation phenomena of this profile. For the stall phenomena it seems that the reversed flow close to the wall is not the relevant phenomenon at the origin of the displacement of the strip, but rather the separated shear layer and its distance to the wall are the relevant phenomena. However, further spatio-temporal explorations are needed to investigate this point. For further understanding of full-scale blade aerodynamics, the high sensitivity of the short sensor case to the appearance of the trailing-edge separation and not the stall makes it really interesting to discriminate them.
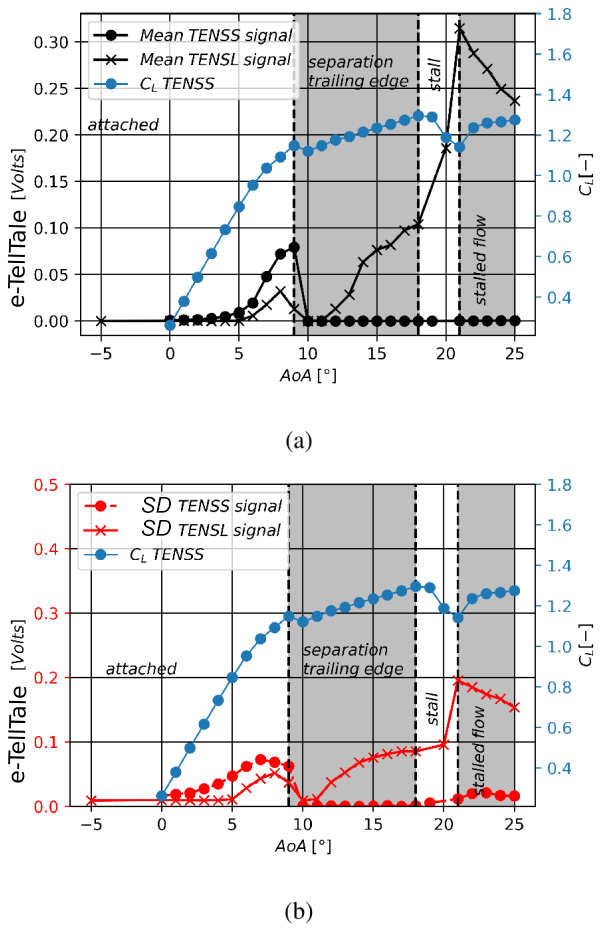
Figure 11Comparison of the mean (a) and the standard deviation (b) of the signal of the TENSL (reference case) and TENSS e-TellTale sensors as a function of AoA.
4.3 Influence of the position of the e-TellTale (LENSL)
The influence of the position of the e-TellTale is discussed in this section. The e-TellTale located near the leading edge in the area of a high favorable pressure gradient, the LENSL case, is compared to the reference case, at the trailing edge (see Fig. 6) in Fig. 12. When located at the leading edge, the e-TellTale is clearly unable to detect the AoA corresponding to the trailing-edge flow separation: AoA=8∘. On the contrary, both the mean and the standard deviation of the signal start to rise just after the second linear part of the lift, AoA=18∘, with a stronger slope than when the e-TellTale is located at the trailing edge. This should be attributed to the separation location, where the zero mean pressure gradient starts, which reaches the strip region, between 19 % and 31 % of the chord length, for angles of attack higher than 18∘. It leads to a higher level of the signal, more than double for the mean signal, and around 50 % higher standard deviation. Also, the peak of the signal occurs at higher AoAs than when the sensor is located at the trailing edge. All these observations are pretty obvious as they are in good agreement with the fact that the stall phenomena originate at the leading edge, with the separated shear layer that remains, for the sensor located near the leading edge, close to the wall and thus close to the sensor, even at high AoAs.
Due to its strong signal value, this configuration is well suited to detecting the stall phenomena compared to other e-TellTale cases.
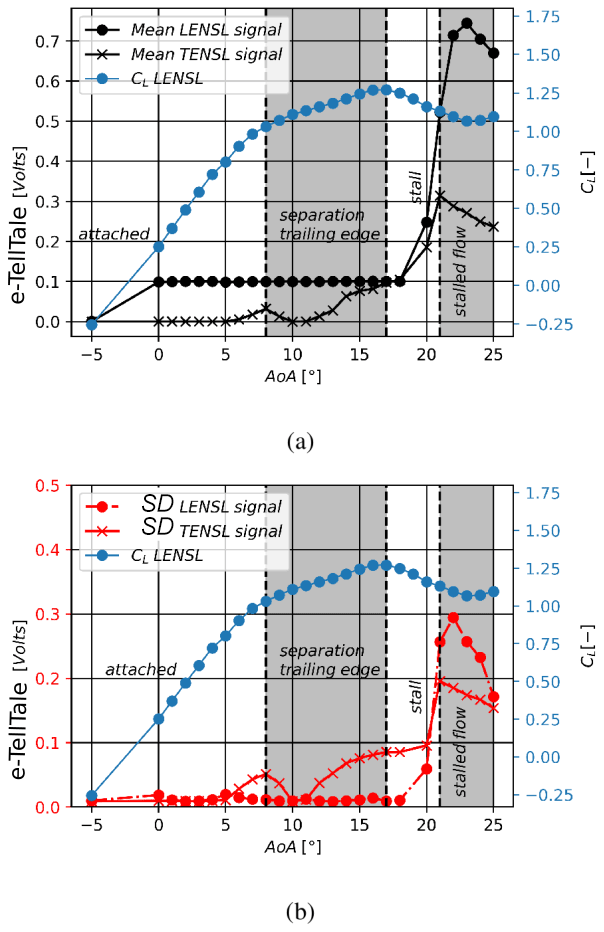
Figure 12Comparison of the mean (a) and the standard deviation (b) of the signal of the LENSL and TENSL (reference case) e-TellTale sensors as a function of AoA.
4.4 Influence of the shell (TESL case)
Figure 13a and b show the mean and standard deviation respectively of the TESL case versus the AoA, compared with the reference case. The magnitude of both the mean and the standard deviation is larger considering both the trailing-edge separation and the leading-edge flow separation angles. However, both phenomena are detected at higher AoAs, AoA=9∘ and AoA ≃ 22–23∘ respectively, when compared with the sensor integrated in the aerodynamic surface. We cannot explain the measured differences between the two configurations with the available measurements. Too many parameters are involved here to conclude. It should however be noted that the strip of the e-TellTale in the integrated case (i.e., TENSL case) was observed to have difficulties initiating a movement. This may be attributed to a complex interaction between the boundary layer and the cavity in which the sensor is integrated.

Figure 13Comparison of the mean (a) and the standard deviation (b) of the signal of the TESL and TENSL e-TellTale sensors as a function of AoA.
In order to evaluate the ability of an innovative aerodynamic sensor, the e-TellTale, to detect the flow separation on wind turbine blades, high-Reynolds-number wind tunnel tests () were performed on a 2D blade section using a full-scale e-TellTale sensor. This innovative sensor is made of a strip with a strain gauge at its base, detecting displacement of the strip away from the aerodynamic surface. These tests highlight the impact of different parameters on the signal of the e-TellTale and also the possible different uses of the sensor in agreement with these findings. First, the e-TellTale with a long strip located at the trailing edge is able to detect both the trailing flow separation angle and the stall angle. This e-TellTale detects only the stall angle when located at the leading edge, with however a higher amplitude in the mean and standard deviation of the sensor's signal. For a sensor located at the trailing edge, the strip can be shortened to detect only the trailing-edge separation angle with a higher sensitivity, this configuration being however ineffective in detecting the stall angle. The limit size of the strip has not been identified yet, but a relative length of (associated with a surface-to-thickness ratio of 218 mm) is short enough for that purpose, while a length of (associated with a surface to thickness ratio of 921 mm) is too long. When the e-TellTale is not integrated into the aerodynamic surface, which may concern all the wind turbines already in operation, the same conclusions can be drawn: this sensor is able to detect both the trailing-edge flow separation angle and the stall angle, with however a slight delay in the detection of the trailing-edge separation regarding the lift curve used as the reference. This delay in the detection of flow separation by the e-TellTale has been addressed at a smaller scale in Soulier et al. (2021). However some future measurements are needed at full scale to complete the study of the delay. Lastly, the sensor might have some limitations when dealing with thin airfoils that have a strong stall just after the maximum lift value, with a very fast displacement of the flow separation from the trailing edge to leading edge. In that case the dynamic response of the sensor is of major importance and the best location might be rather near the leading edge. Indeed, the sensitivity of the sensor to the separated shear layer when it is located at the trailing edge may rapidly disappear.
Code are not publicly accessible (post-processing codes were developed and adapted for internal usage of CSTB wind tunnel tests).
This work was performed during the PhD of AS under the supervision of CB, DV and FD. CB provided her scientific expertise in turbulent shear flows and wind turbine blade aerodynamics; DV shared his expertise on the innovative e-TellTale sensor; FD supervised the wind tunnel experiments at CSTB.
The contact author has declared that neither they nor their co-authors have any competing interests.
Publisher’s note: Copernicus Publications remains neutral with regard to jurisdictional claims in published maps and institutional affiliations.
The authors would like to thank the technical staff at CSTB who carried out experiments in the NSA wind tunnel.
This paper was edited by Raúl Bayoán Cal and reviewed by two anonymous referees.
Bak, C., Madsen, H. A., Fuglsang, P., and Rasmussen, F.: Observations and hypothesis of double stall, Wind Energy, 2, 195–210, https://doi.org/10.1002/1099-1824(199910/12)2:4<195::AID-WE27>3.0.CO;2-7, 1999. a
Baleriola, S., Leroy, A., Loyer, S., Devinant, P., and Aubrun, S.: Experimental lift control using fluidic jets on a model wind turbine, J. Phys. Conf. Ser., 1037, 022014, https://doi.org/10.1088/1742-6596/1037/2/022014, 2018. a
Bartholomay, S., Michos, G., Perez-Becker, S., Pechlivanoglou, G., Nayeri, C., Nikolaouk, G., and Paschereit, C. O.: Towards Active Flow Control on a Research Scale Wind Turbine Using PID controlled Trailing Edge Flaps, Wind Energy Symposium, American Institute of Aeronautics and Astronautics, Inc., https://doi.org/10.2514/6.2018-1245, 2018. a
Braud, C. and Guilmineau, E.: Jet flow control at the blade scale to manipulate lift, J. Phys. Conf. Ser., 753, 022031, https://doi.org/10.1088/1742-6596/753/2/022031, 2016. a
Chamorro, L. P., Guala, M., Arndt, R. E. A., and Sotiropoulos, F.: On the evolution of turbulent scales in the wake of a wind turbine model, J. Turbul., 13, 1–13, https://doi.org/10.1080/14685248.2012.697169, 2012. a
Devinant, P., Laverne, T., and Hureau, J.: Experimental study of wind-turbine airfoil aerodynamics in high turbulence, J. Wind Eng. Ind. Aerod., 90, 689–707, 2002. a, b, c
Gault, D. E.: A correlation of low-speed airfoil-section stalling characteristics with Reynolds number and airfoil geometry, Tech. Rep., Technical note 3963, Document ID: 19930084707, National Advisory Committee for Aeronautics, https://ntrs.nasa.gov/citations/19930084707 (last access: 20 May 2020), 1957. a, b
Jaunet, V. and Braud, C.: Experiments on lift dynamics and feedback control of a wind turbine blade section, Renew. Energ., 126, 65–78, https://doi.org/10.1016/j.renene.2018.03.017, 2018. a, b
Leroy, V.: Unsteady aerodynamic modelling for seakeeping analysis of Floating Offshore Wind Turbines, Centrale Nantes, https://tel.archives-ouvertes.fr/tel-02090543 (last access: 20 May 2020), 2018. a
Manolesos, M., Papadakis, G., and Voutsinas, S.: An experimental and numerical investigation on the formation of stall-cells on airfoils, J. Phys. Conf. Ser., 555, 012068, https://doi.org/10.1088/1742-6596/555/1/012068, 2014. a
Olsen, A. S., Sørensen, N. N., Bak, C., Gaunaa, M., Mikkelsen, R., Fischer, A., Beckerlee, J., and Ildvedsen, S.: Why is the measured maximum lift in wind tunnels dependent on the measurement method?, J. Phys. Conf. Ser., 1618, 032040, https://doi.org/10.1088/1742-6596/1618/3/032040, 2020. a
Pedersen, T. F., Demurtas, G., and Zahle, F.: Calibration of a spinner anemometer for yaw misalignment measurements, Wind Energy, 18, 1933–1952, https://doi.org/10.1002/we.1798, 2015. a
Rezaeiha, A., Pereira, R., and Kotsonis, M.: Fluctuations of angle of attack and lift coefficient and the resultant fatigue loads for a large Horizontal Axis Wind turbine, Renew. Energ., 114, 904–916, https://doi.org/10.1016/j.renene.2017.07.101, 2017. a
Scholbrock, A., Fleming, P., Fingersh, L., Wright, A., Schlipf, D., Haizmann, F., and Belen, F.: Field testing LIDAR based feed-forward controls on the NREL controls advanced research turbine, 51th AIAA Aerospace Sciences Meeting Including the New Horizons Forum and Aerospace Exposition, Grapevine, Texas, https://pdfs.semanticscholar.org/893c/541585d70004b30b357425f05ac7b1f75477.pdf (last access: 20 May 2020), 2013. a
Shaqarin, T., Braud, C., and Coudert, S.: Open and closed-loop experiments to identify the separated flow dynamics of a thick turbulent boundary layer, Exp. Fluids, 54, 1448, https://doi.org/10.1007/s00348-012-1448-4, 2013. a
Sicot, C., Devinant, P., Loyer, S., and Hureau, J.: Rotational and turbulence effects on a wind turbine blade. Investigation of the stall mechanisms, J. Wind Eng. Ind. Aerod., 96, 1320–1331, https://doi.org/10.1016/j.jweia.2008.01.013, 2008. a
Smaïli, A. and Masson, C.: On the rotor effects upon nacelle anemometry for wind turbines, Wind Eng., 28, 695–713, https://doi.org/10.1260/0309524043729958, 2004. a
Soulier, A., Braud, C., Voisin, D., and Podvin, B.: Low-Reynolds-number investigations on the ability of the strip of e-TellTale sensor to detect the flow features over wind turbine blade section: flow stall and reattachment dynamics, Wind Energ. Sci., 6, 409–426, https://doi.org/10.5194/wes-6-409-2021, 2021. a, b, c, d
Swytink-Binnema, N. and Johnson, D. A.: Digital tuft analysis of stall on operational wind turbines: Digital tuft analysis of stall on operational wind turbines, Wind Energy, 19, 703–715, https://doi.org/10.1002/we.1860, 2016. a