the Creative Commons Attribution 4.0 License.
the Creative Commons Attribution 4.0 License.
 | 28 Jun 2022
Experimental analysis of the effect of dynamic induction control on a wind turbine wake
Daan van der Hoek
Joeri Frederik
Ming Huang
Fulvio Scarano
Carlos Simao Ferreira
Jan-Willem van Wingerden
Dynamic induction control (DIC) has proven to be an effective method of increasing the power output for a wind farm in both simulation studies and wind tunnel experiments. By pitching the blades of a wind turbine periodically, the recovery of the low-velocity wake is accelerated, thereby increasing the energy available to downstream turbines. The wake itself of a turbine operating with DIC has not yet been studied experimentally. This paper presents a wind tunnel experiment where the wake of a wind turbine under periodic excitation is investigated. Using three-dimensional particle image velocimetry, the velocity field behind the turbine was reconstructed. Analysis of the velocity fields indicated that the available power in the wake increases when using DIC. This increase was partially due to a lower average thrust force experienced by the turbine with DIC. However, a large difference was seen between measurement results and actuator disk theory, indicating enhanced recovery of the wake is contributing to the increased energy. Instantaneous measurements visualizing the development of blade tip vortices also showed how the location of vortex breakdown, which is directly related to re-energizing the wake, shifts over time with DIC. We believe this shifting location is contributing to the enhanced wake recovery of DIC, providing more energy to downstream wind turbines.
- Article
(12099 KB) - Full-text XML
- BibTeX
- EndNote


The area that is covered by (offshore) wind farms is often limited by technical or economic reasons, resulting in closely spaced wind turbines. While placing turbines close to each other leads to lower installation and maintenance costs, it also introduces energy losses due to the aerodynamic interaction between turbines. As a turbine extracts energy from the wind, a slower and more turbulent airflow is left in its wake. When multiple turbines are aligned with the incoming wind direction, they will experience the wake from upstream turbines. Current industry practice is to operate each wind turbine individually, so-called greedy control, thereby disregarding the impact from wakes on nearby turbines. This results in sub-optimal power production and increased structural loading of downstream turbines (Barthelmie et al., 2010; Kanev and Savenije, 2015).
Wake losses in wind farms can be partially mitigated by actively manipulating the wakes of upstream turbines using wind farm control (Boersma et al., 2017). Wind farm control methods can generally be categorized into wake redirection control and axial induction control (Kheirabadi and Nagamune, 2019). Wake redirection control usually refers to purposefully misaligning a turbine with the wind (e.g., Kanev et al., 2018). This changes the direction of the force applied by the turbine on the incoming airflow, thus deflecting the wake away from downstream turbines. While the misaligned turbines produce less power, the overall power generated by a farm increases (e.g., Gebraad et al., 2016; Campagnolo et al., 2016; Fleming et al., 2017, 2019). Axial induction control distinguishes between static and dynamic methods. With static induction control (SIC), the upstream turbine is derated in order to extract less energy from the wind, leaving more for downstream turbines (Kanev et al., 2018). Although steady-state wake models indicate a potential increase in power production using SIC (Annoni et al., 2016), high-fidelity simulations and field tests have shown either limited or no benefits (Annoni et al., 2016; Campagnolo et al., 2016; van der Hoek et al., 2019; Frederik et al., 2020). More promising results have been obtained using dynamic induction control (DIC), where the induction factor of a turbine is varied over time. This action is thought to induce additional turbulence in the wake of a turbine, which enhances mixing and subsequently results in faster wake recovery (Frederik et al., 2020).
High-fidelity simulations have shown that it is possible to improve the power production of a wind farm by optimizing the control inputs for dynamic induction (Goit and Meyers, 2015; Munters and Meyers, 2017). However, finding the optimal excitation sequence is very computationally intensive. Goit and Meyers (2015) first applied this approach in large-eddy simulations. The optimal thrust coefficient of the turbines over time was determined using the adjoint-based gradient and implemented using a receding horizon approach. This turned out to be highly successful, increasing energy extraction by 16 %. However, this method has a number of features that make it impossible to implement directly in a real-world environment. First, the objective function used in the optimization sequence requires perfect knowledge of the flow, which is not available in real life. Second, the computational time necessary for the gradient calculation was substantially larger than the receding horizon time window, which makes real-time implementation infeasible. Third, the authors controlled the turbine's thrust coefficient directly, whereas in practice it depends on multiple parameters, both internal (e.g., pitch angle, tip-speed ratio) and external (e.g., wind speed, turbulence).
Munters and Meyers (2018) addressed the first two challenges by introducing periodic thrust variations. Although this approach reduces the potential power gain slightly, it is more practical to implement. As the optimization is now limited to finding the optimal thrust amplitude and frequency, the computationally expensive optimization sequence is no longer needed. The final challenge is to translate the thrust coefficient variation into a control signal for the wind turbine. Frederik et al. (2020) proposed a straightforward approach where a periodic variation in the pitch angle is superimposed on the baseline controller. While this approach slightly alters the applied thrust variation, wind tunnel experiments with a three turbine array showed a similar wake mixing effect, leading to a 2 %–4 % gain in power (Frederik et al., 2020).
The experiments by Frederik et al. (2020) demonstrated the potential benefit of DIC, but they only considered power measurements taken directly from the wind turbines. To the best of our knowledge, no experiments have been conducted thus far that characterize the aerodynamic behavior of a wind turbine wake in a DIC regime, which is vital to gain a better understanding of its physical working principle. The goal of this paper is to investigate the effect of dynamic induction control on a wind turbine wake. To do this, the wake of a small-scale wind turbine model is measured using three-dimensional particle image velocimetry (PIV), a technique used successfully in wind tunnel experiments to characterize the wake of scaled wind turbine models (e.g., Rockel et al., 2014; Lignarolo et al., 2014).
The paper is organized as follows. Section 2 presents the setup used for carrying out the experiments, which includes the turbine model, control strategy, and PIV system. In Sect. 3, the measurement results are shown in the form of flow fields. Some of the key measurement results are discussed further in Sect. 4. Finally, conclusions on the performance of DIC are given in Sect. 5.
First, we present the wind tunnel and the scaled wind turbine model. Next, the wind turbine control methods used during the experiment are discussed. Finally, the PIV setup used to measure the wind turbine wake is introduced.
2.1 Wind tunnel and turbine model
The experiments were done in the Open Jet Facility (OJF) of the Aerospace Engineering Faculty at TU Delft. This is a closed-loop open jet wind tunnel with an octagonal outlet of 2.85 by 2.85 m. The wind tunnel has a contraction ratio of 3:1 and can reach a free stream velocity of 35 m s−1 with a turbulence intensity (TI) between 0.5 % and 2 % (Lignarolo et al., 2015). The current experiments were conducted at a wind speed of .
The turbine model used for the experiments was the MoWiTO-0.6 developed at the University of Oldenburg (Schottler et al., 2016). This turbine has a rotor diameter of D=0.58 m and is equipped with a generator that allows torque control to regulate the rotor speed. A stepper motor attached to a spindle is used to pitch the blades collectively. An overview of the model including relevant dimensions is provided in Fig. 1. To measure the deformation of the tower, strain gauges were applied at the bottom on the front and back in a full Wheatstone bridge configuration. The strain gauges were calibrated by hanging weights on the back of the nacelle, mimicking the force moment around the tower base originating from the thrust force. This process resulted in a linear expression of the tower moment as a function of the strain gauge voltage. This expression was used to reconstruct the thrust force acting on the rotor from the measured voltage. For additional information on the design of the wind turbine, see the paper by Schottler et al. (2016).
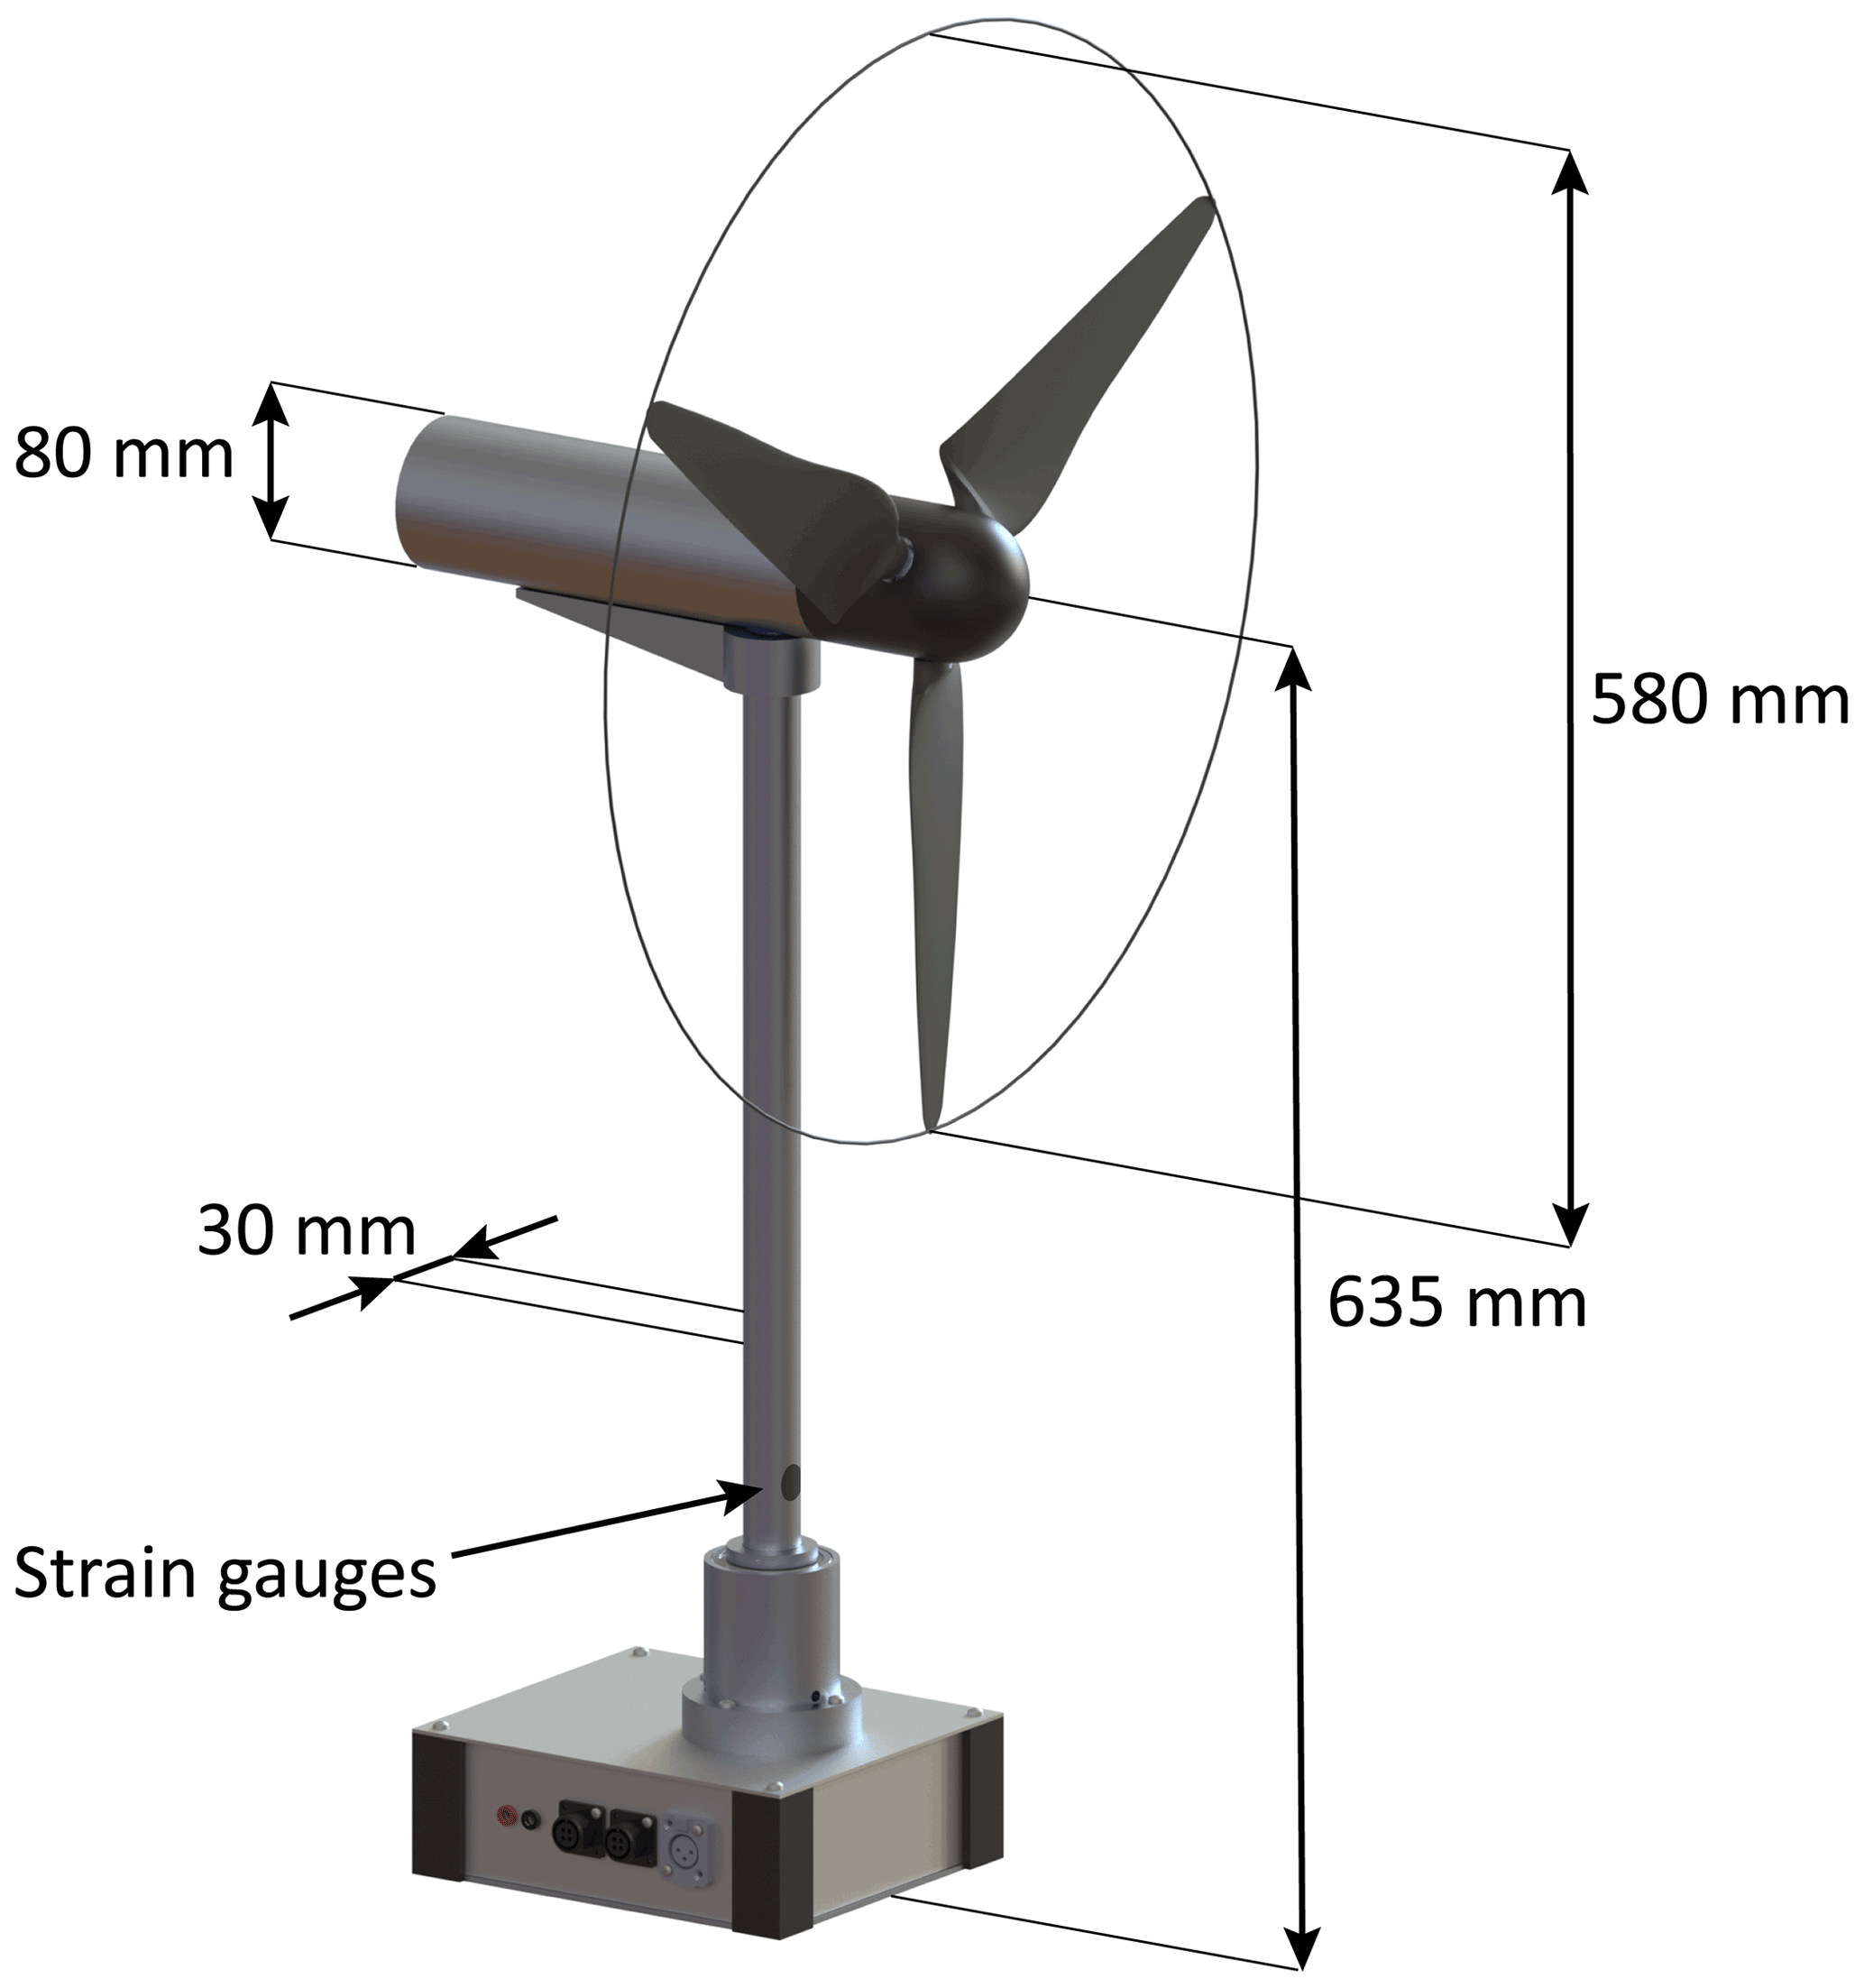
Figure 1MoWiTO-0.6 wind turbine model including relevant dimensions.
Communication between wind turbine and computer was arranged with a dSPACE MicroLabBox. The frequency for communication was set to 10 kHz, while measurements were recorded at a frequency of 1 kHz. Recorded turbine signals included the rotor speed, pitch angle, generator current, and strain at the tower base.
The steady-state aerodynamic coefficients, electrical power and thrust CT, were determined experimentally at the start of the measurement campaign for different tip-speed ratios and pitch angles. The electrical power Pe could be reconstructed from the generator current using a generator-specific constant (Schottler et al., 2016). The thrust force T was acquired by measuring the strain at the tower base and relating this to the linear calibration function. The measurements indicated that the turbine performed optimally for a tip-speed ratio of , with rotor speed Ω, rotor radius R, and wind speed U∞. The coefficients and CT for this tip-speed ratio are given in Fig. 2 for a range of pitch angles. The 0∘ pitch angle was defined as the most outward position that the blades could reach. For a blade pitch angle of optimal power was achieved while simultaneously guaranteeing a reasonable thrust coefficient. The contribution of the tower and nacelle to the thrust force was measured by removing the blades from the turbine and was observed to consist of approximately 3 % of the total thrust force at the optimal operating settings.
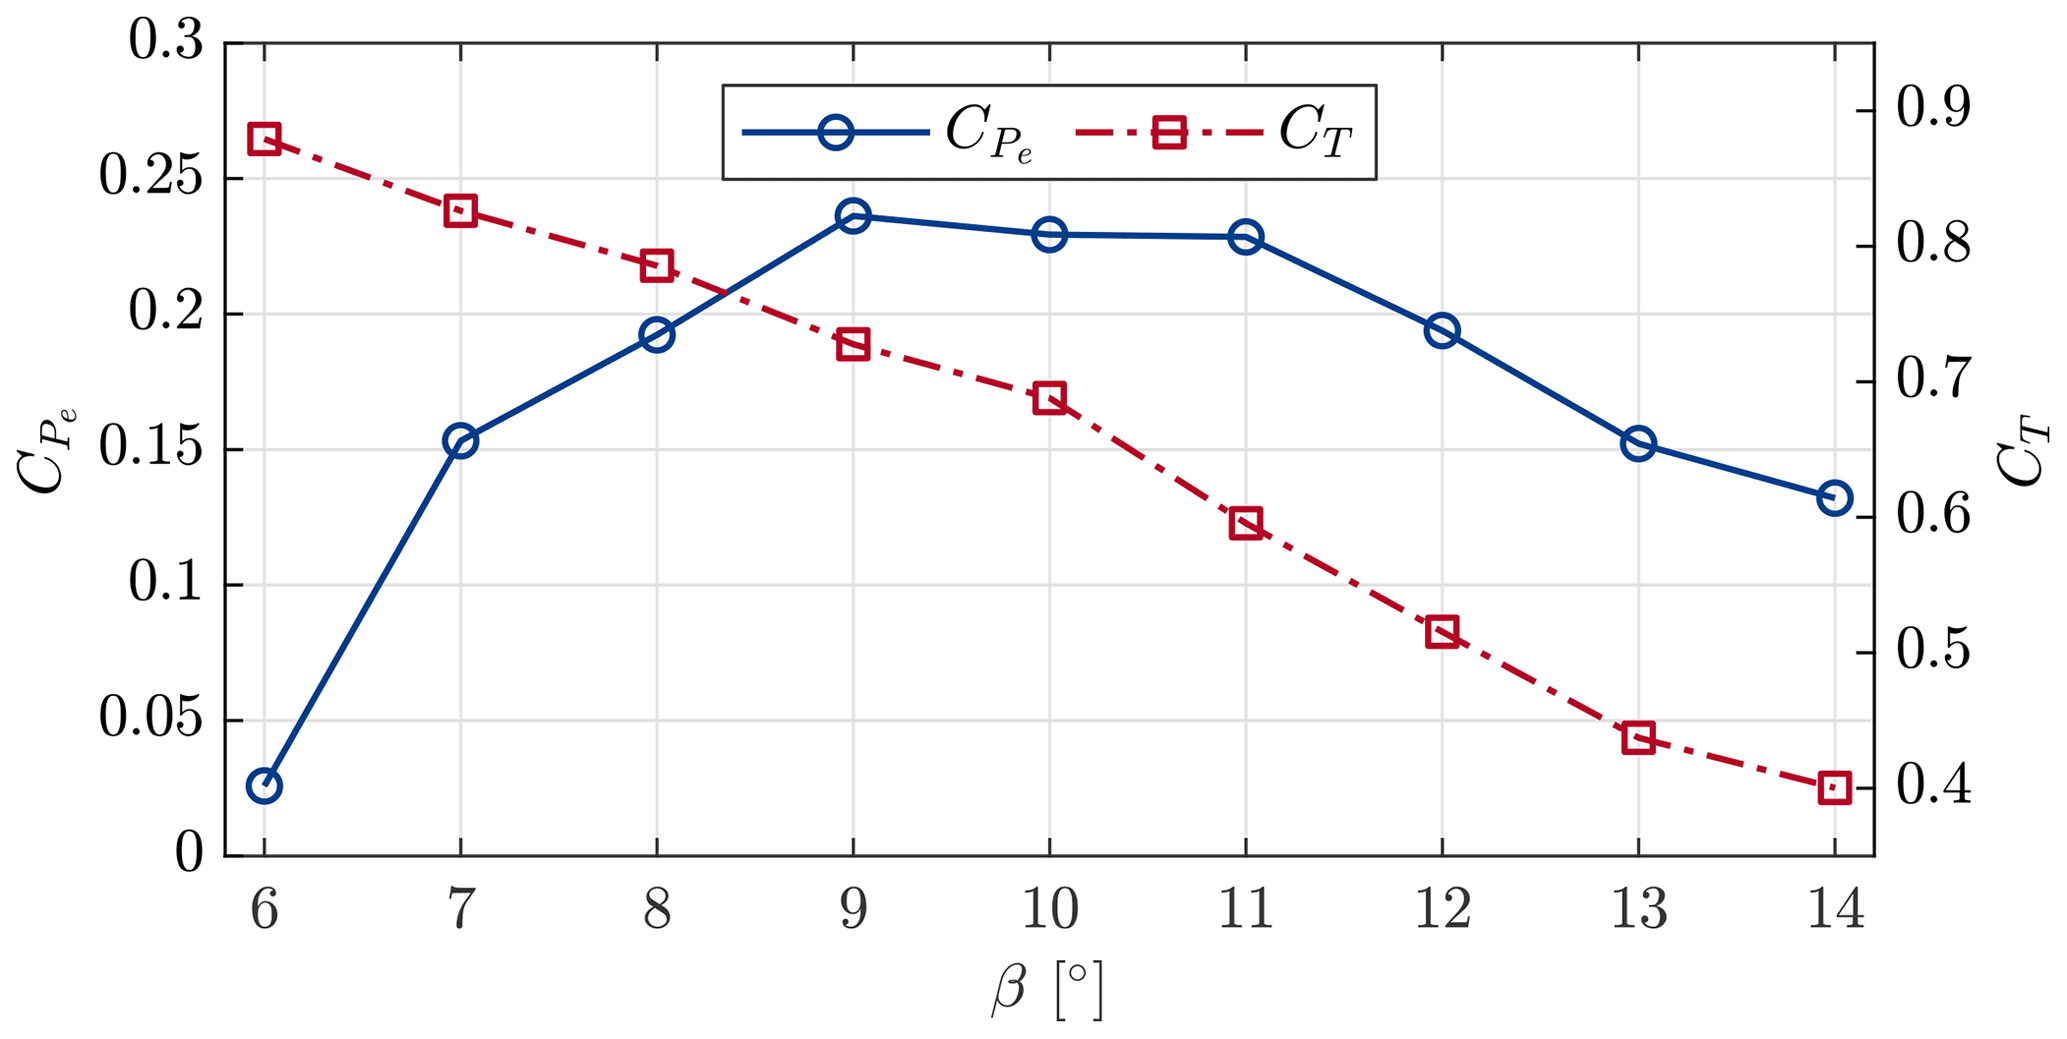
Figure 2Experimentally determined power () and thrust (CT) coefficients of the MoWiTO-0.6 for different pitch angles β at the optimal tip-speed ratio .
2.2 Dynamic induction control strategy
The wind turbine was operated with two different control methods. First, we used the classical greedy control approach, where a turbine maximizes its own power output without considering interaction with other turbines. This control strategy served as a baseline for the second method, which was dynamic induction control.
For the baseline case, we implemented the simple K-omega-squared control strategy from (Bossanyi, 2000) to regulate the rotor speed. In this case, a generator torque is applied on the turbine according to the control law
where Qe is the electrical torque. The desired torque was applied by the generator, which was in turn controlled by a shunt resistor. The controller gain K was based on the following relation for the optimal operating settings:
with ρair indicating air density. Using this control law, the turbine should be operating at the top of its power coefficient curve (see Fig. 2). The blade pitch was kept constant at the optimal value. Note that during the experiment, the turbine was only operated in the partial load region for which this control law is valid.
A similar controller to the one used by Frederik et al. (2020) was implemented for dynamic induction control. This controller also used the control law from Eq. (1) to regulate the rotor speed. Additionally, by imposing a sinusoidal signal on the collective blade pitch angles, the thrust coefficient of the turbine could be varied over time. The amplitude and frequency of these variations were limited by the bandwidth of the pitch motor.
Previous studies have indicated that the optimal pitch frequency is found for a particular range of Strouhal numbers, where the Strouhal number is defined as
with f the excitation frequency. Munters and Meyers (2018) used large-eddy simulations to optimize the Strouhal number for periodic DIC and found a value of St=0.25. Wind tunnel experiments carried out by Frederik et al. (2020) used Strouhal numbers ranging from 0.1–0.4 and observed that the total power peaked for St values between 0.2–0.3. Note that the Strouhal definition implies that the excitation frequency scales with the turbine rotor diameter. For large wind turbines with rotor diameters of up to 180 m, this optimal Strouhal number results in a very low frequency (typically ≪0.1 Hz). The corresponding pitch frequency for the MoWiTO-0.6 model is equal to f=1.72 Hz. Initial testing with the turbine showed a maximum pitching speed around , limiting the pitch amplitude to 2.3∘ at St=0.25. To ensure that a range of different frequencies around this reported optimal frequency could be tested, we varied the blade pitch angle between 8–12∘. Note that this variation was not centered around the pitch angle of that is used to achieve optimal power production. This steady offset in pitch angles between baseline operation and DIC is consistent with the implementation of Frederik et al. (2020). Similar to their experiment, the original plan was to include a second turbine in the wake of the first turbine. This would have allowed us to directly measure the effect of DIC on the power of a downstream turbine. Due to some issues we experienced with the experiment setup, this turned out to be infeasible. Another reason for the steady offset in pitch angle was to ensure a higher thrust variation and smaller loss of power according to the aerodynamic coefficients from Fig. 2.
The periodic pitch signal resulted in a varying thrust coefficient with values between 0.52–0.79, which was a slightly lower amplitude than the cases presented in Frederik et al. (2020). We expect smaller wake mixing effects due to the smaller variation in thrust. However, Frederik et al. (2020) conducted their experiments at TIs of 5 % and 10 %, whereas the experiments presented here were conducted at a lower TI. A higher TI results in a higher amount of natural wake mixing, regardless of the wind turbine control action. Therefore, the low-TI conditions ensured that only a small pitch action was needed to observe significant perturbations in the wake.
The evolution of the thrust coefficient over time with this sinusoidal pitch reference is depicted in Fig. 3. This figure is based on the steady-state thrust coefficient from Fig. 2 and merely illustrates the varying thrust signal. During the experiment we expect slightly altered signals since the thrust force is affected by dynamic inflow. Compared to the baseline case, a thrust coefficient above 0.72 is considered over-inductive: the induction is higher than the optimum in terms of steady-state energy capture. A similar variation from over-inductive to under-inductive thrust coefficients was used in previous research (Munters and Meyers, 2018; Frederik et al., 2020). It is expected that these variations lead to increased turbulence in the wake and, subsequently, faster wake recovery.
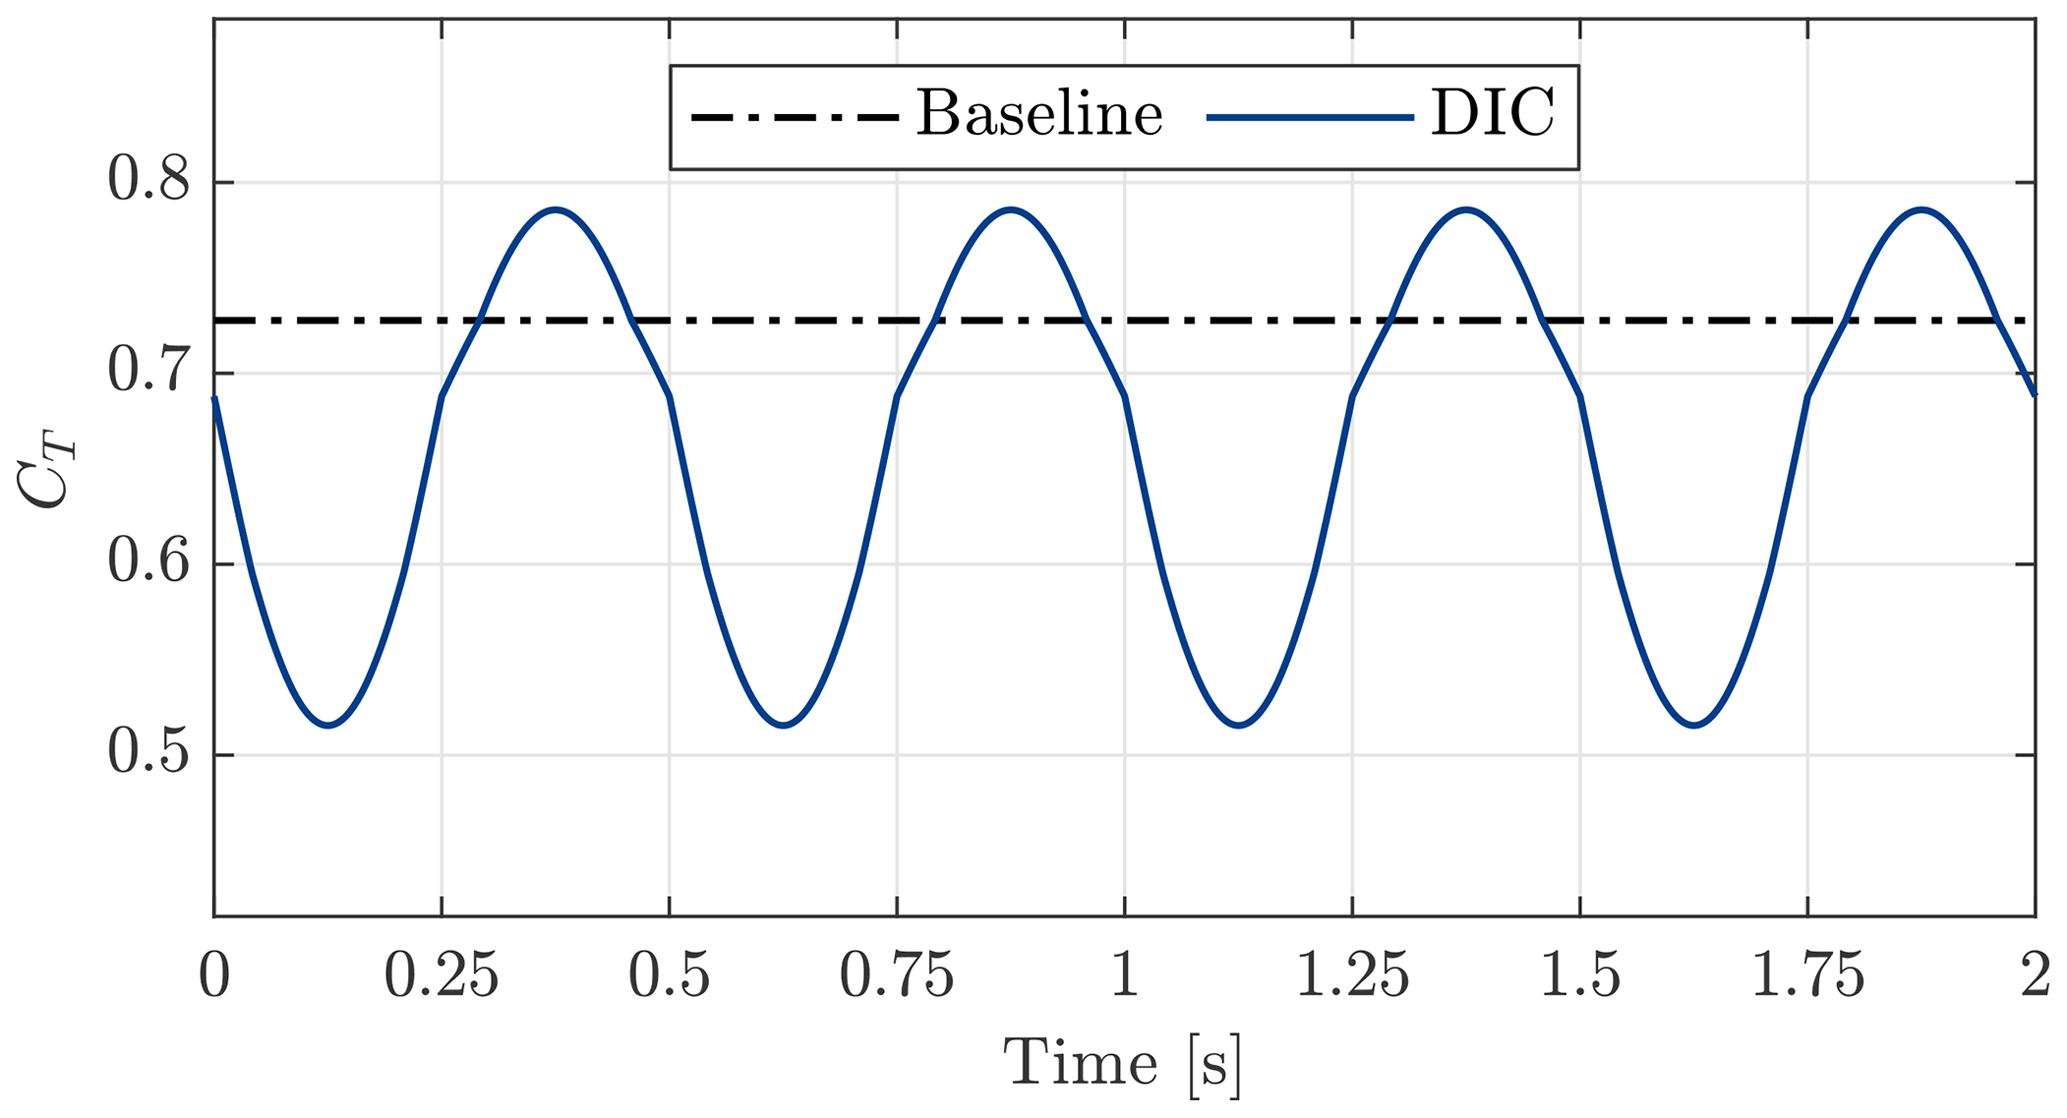
Figure 3Thrust coefficient reference for baseline control and periodic dynamic induction with a frequency of 2 Hz (St=0.29).
The wind tunnel experiments from Frederik et al. (2020) did not show a clear optimum over the Strouhal numbers. However, small differences in power gain were observed for different frequencies. In our experiment, we applied DIC at Strouhal numbers of 0.19, 0.24, and 0.29, deeming these sufficient for including the optimal Strouhal number with this particular setup.
2.3 Three-dimensional velocity measurements
The wake of the turbine was measured using a large-scale PIV system. An overview of the setup is shown in Fig. 4. Helium-filled soap bubbles (HFSBs) were used as flow tracers (Scarano et al., 2015). An aerodynamic seeding rake at the outlet of the open jet released a continuous stream of particles into the incoming flow. The seeder introduced additional disturbances to the flow (see, e.g., Jux et al., 2018), but its position was deemed necessary for sufficient seeding of the measurement volume. Three LaVision LED flashlights were used to illuminate the particles in the turbine wake. A setup consisting of three Photron FASTCAM SA1.1 high-speed cameras recorded the light scattered by the seeding particles at a frequency of 500 Hz, with a resolution of 1024 by 1024 pixels. The field of view (FOV) covered by the cameras was approximately . A high-speed controller from LaVision was used to synchronize the illumination and imaging. Each recording lasted 10 s, resulting in 5000 images for each measurement.
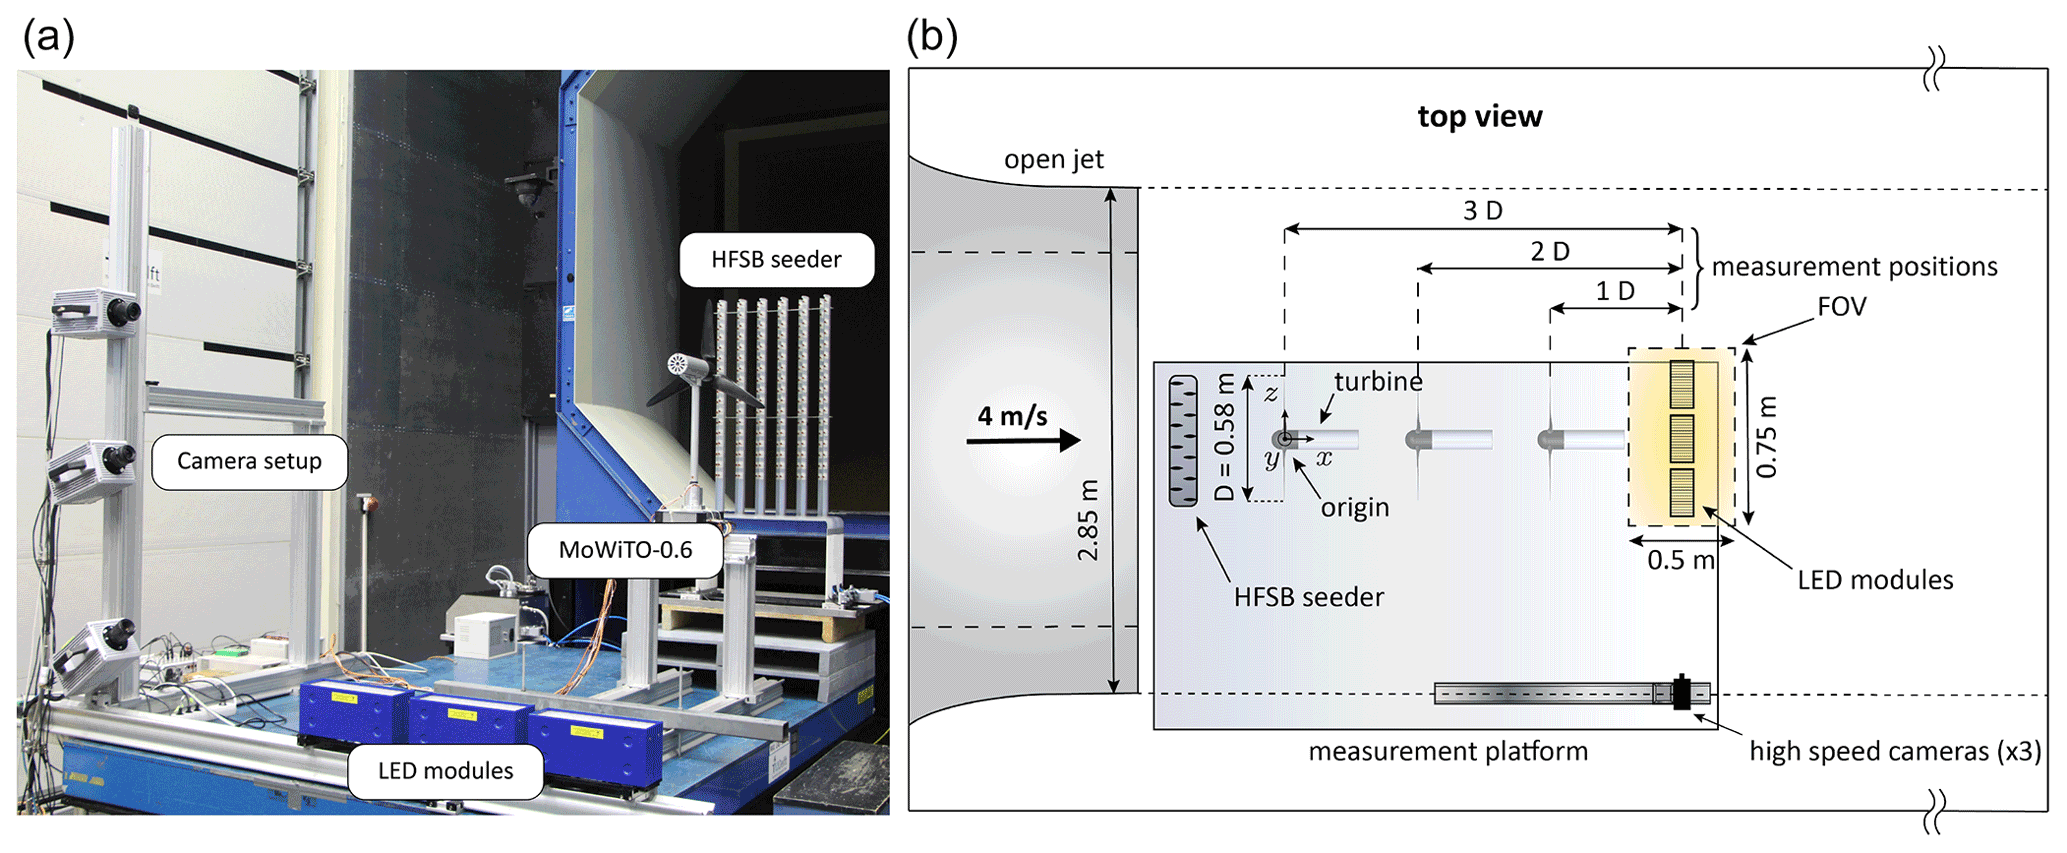
Figure 4Experimental setup for measuring the wake using particle image velocimetry (a) and a schematic overview of the setup highlighting the different components and turbine locations used for measuring the wake (b).
Processing the recorded images consisted of several steps. First, a high-pass filter was applied to the raw images in order to remove any undesired background light (Sciacchitano and Scarano, 2014). The filtered images were subsequently processed with the DaVis 10 software from LaVision. This process included a self-calibration using recorded images to correct any misalignments between cameras and the measurement volume (Wieneke, 2008). Next, the motion of the tracers was obtained by tracking them individually (particle-tracking velocimetry) using the efficient shake-the-box (STB) algorithm from Schanz et al. (2016). This algorithm reconstructs the particles' trajectories from the recorded data based on the principle of Lagrangian particle tracking (LPT), providing the velocity vector along trajectories in a three-dimensional domain. Finally, the scattered data from the particle positions and velocities were reduced onto a Cartesian grid by spatially averaging over small cubic cells (binning). Time-averaged velocity fields were rendered using a bin size of . A 75 % overlap among neighboring bins yielded a final vector spacing of 12.5 mm. Instantaneous velocity fields were acquired using the vortex-in-cell plus (VIC+) method (Schneiders and Scarano, 2016; Jeon et al., 2018). This method uses data assimilation, combining particle tracks with the vorticity transport equation, and offers more accurate results with a higher spacial resolution.
By moving the turbine to three different positions, as indicated in Fig. 4, multiple regions along the wake were measured. The distance between the rotor plane and the center of the FOV was varied between 1 and 3 diameters D downstream, obtaining an effective measuring range of 0.5–3.5 D. Repositioning the turbine instead of the measurement system was done to save time when carrying out the experiments as this removed the need to calibrate the PIV system when different parts of the wake were measured. Lignarolo et al. (2014) measured the properties of the open jet for different locations downstream, and found that the inflow velocity and turbulence intensity were affected due to the shear layer of the jet. Based on their analysis, we do not expect large deviations in mean inflow velocity but possibly a minor change in turbulence intensity when moving the turbine from 1–4 D with respect to the outlet of the jet. The presence of the HFSB seeder was expected to have a larger impact on the conditions upstream of the turbine; however, it is unknown how significant these changes were.
This section presents the results obtained from the measurements described in the previous section. Section 3.1 contains the thrust coefficient measured at the turbine. In Sect. 3.2, we show the time-averaged flow fields at multiple distances behind the turbine. The velocity fields are averaged over the DIC pitch cycle in Sect. 3.3, providing a measure of the available power in the wake over time. Finally, instantaneous measurements are used to visualize the development of the blade tip vortices in Sect. 3.4.
3.1 Turbine thrust coefficient
The performance of the turbine at the three measurement positions was compared using the thrust force measured by strain gauges at the tower base. The measured thrust forces were transformed to thrust coefficients using
with thrust force T, air density ρ, and rotor radius R. A constant inflow velocity of , used for operating the wind tunnel, was used for the computation. Figure 5 shows CT for the baseline case and one of the DIC cases (St=0.24). We observe that the average CT in both cases (baseline and DIC) was up to 20 % lower compared to the expected values from Fig. 3, which were based on the steady-state thrust coefficient. Furthermore, we see that the difference in average thrust coefficient between baseline and DIC varied depending on the location of the turbine. The average CT decreased for the baseline case, whereas it increased for the DIC case.
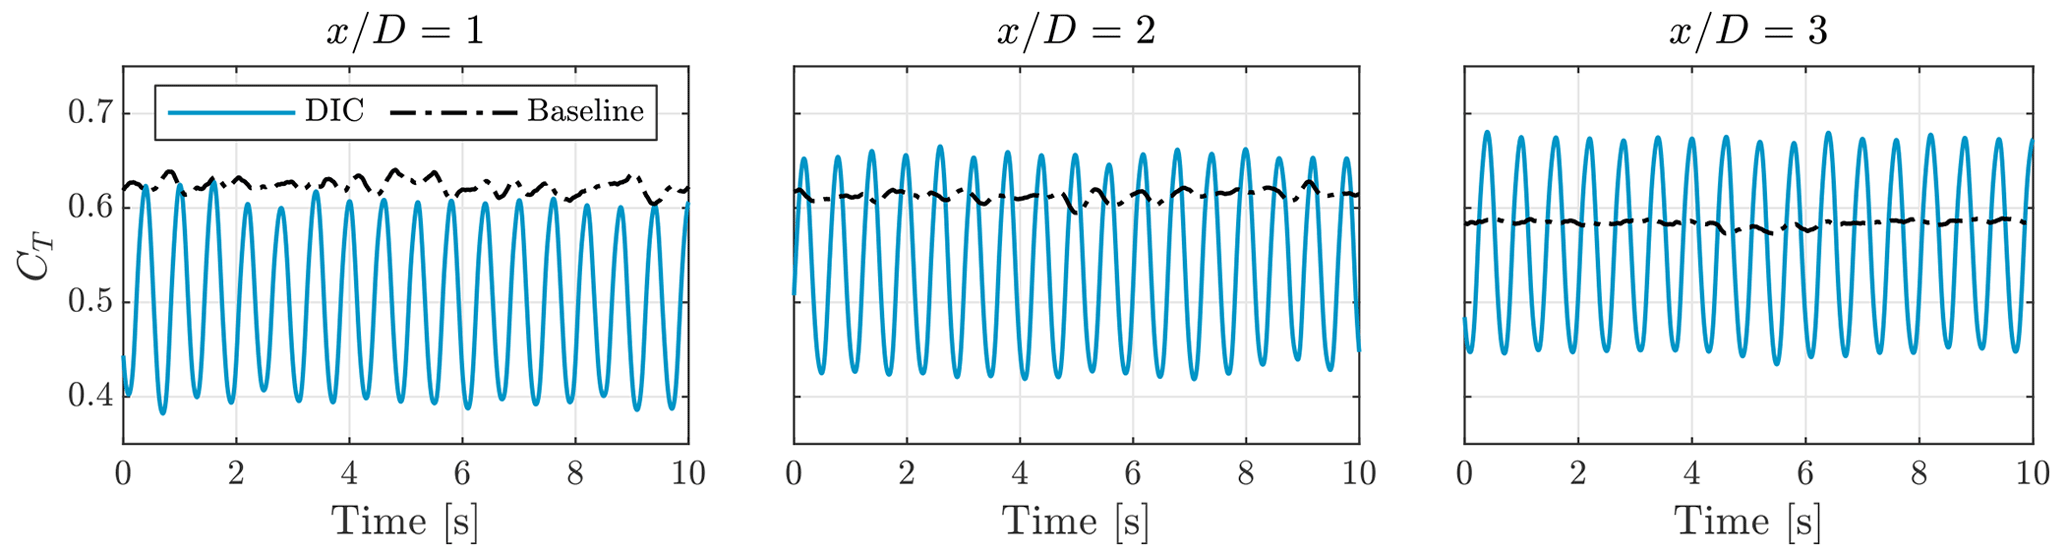
Figure 5Thrust coefficient of the turbine for different measurement positions. The results are based on a single measurement for each distance using either baseline control or DIC with St=0.24.
We believe there are several explanations for the variations in the measured CT. First, the HFSB seeding rake was not present when the aerodynamic coefficients from Fig. 2 were obtained. This could indicate that the seeding rake affected the incoming flow. Furthermore, we expect that the influence of the seeding rake changes depending on how close the turbine is positioned from it. Measurements of the wind field without a turbine were taken at a distance of 4 D from the seeder, indicating a largely unaltered mean inflow velocity and an average turbulence intensity of 5 %. Unfortunately, there is no information on the actual inflow conditions at each of the turbine positions. Second, the relatively low wind speed used for the experiments introduced some unsteadiness in the inflow and was also more susceptible to measurement errors in the wind speed at the outlet of the open jet. Finally, the turbine controller was designed using the aerodynamic coefficients that were obtained without the seeding rake. In the DIC case, the rotor speed varied periodically due to the pitch action, making it more difficult for the controller to operate the turbine at the optimal tip-speed ratio.
The measurements shown in Fig. 5 make it clear that the flow fields from different turbine positions should be evaluated carefully. Due to the relative difference in CT between the baseline case and DIC, we are basically comparing different cases at each turbine location. However, we believe the principles behind dynamic induction control can still be investigated through these measurements, in particular the effect of DIC on tip vortex development, which we believe to be independent from the average thrust force, that is addressed in Sect. 3.4.
3.2 Time-averaged flow fields
Time-averaged flow fields were obtained from the binning procedure described in Sect. 2.3, using all the particle data from each measurement. Contours of the streamwise velocity field at multiple cross-sections downstream are presented in Fig. 6. A clear difference in the velocity deficit was observed between baseline control and DIC with St=0.24. The results of the other pitch frequencies are not shown as the relative differences in average velocity were minor. The coordinate system used in these figures is the same as specified in Fig. 4. Due to the combination of a lower average induction factor and the periodic excitation, the average streamwise velocity in the wake of the turbine operating with DIC was higher than in the baseline control case. This is seen for all three measurement locations.
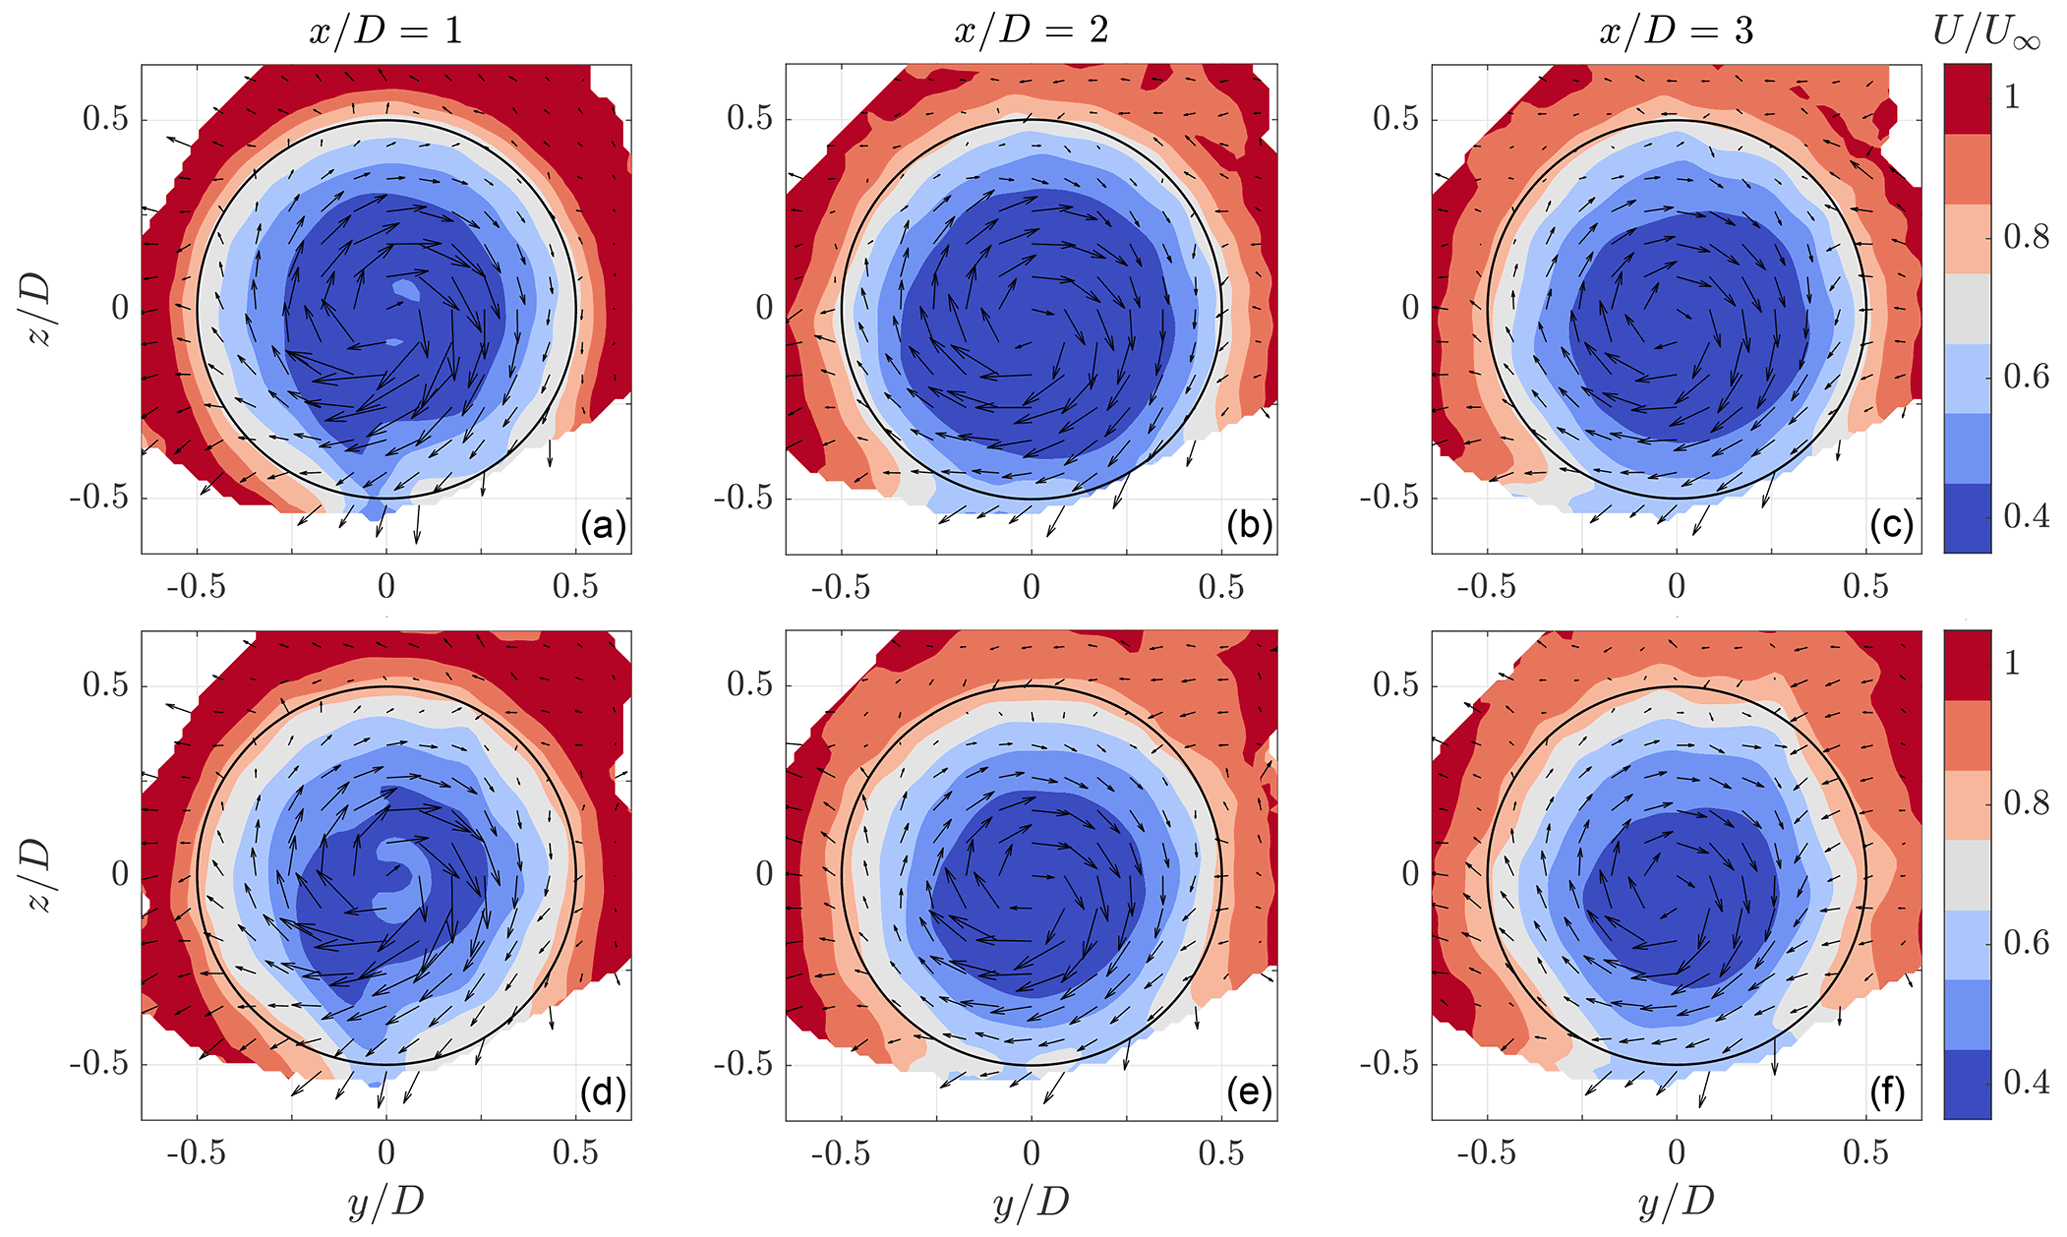
Figure 6Cross-sections of the wake at distances ranging from 1 to 3 diameters downstream of a turbine operating with baseline control (a–c) and DIC with St=0.24 (d–f). The contours show the average normalized streamwise velocity component, while the arrows indicate the cross-stream velocity components. The black circles indicate the relative location of the rotor disk of the model wind turbine.
The measurements from different locations are merged into a single velocity field in Fig. 7. Data from the different measurement positions do not overlap, but the transitions between these measurements seem relatively smooth, even though the turbine experienced different thrust levels. When subtracting the flow fields from the baseline and DIC case, we see clearly that there is a lower velocity deficit in most parts of the wake as a result of DIC. The increase in velocity is primarily concentrated at the edges of the wake, except at one side () around . This asymmetry in the wake might be related to the development of the tower wake, which is addressed later on.
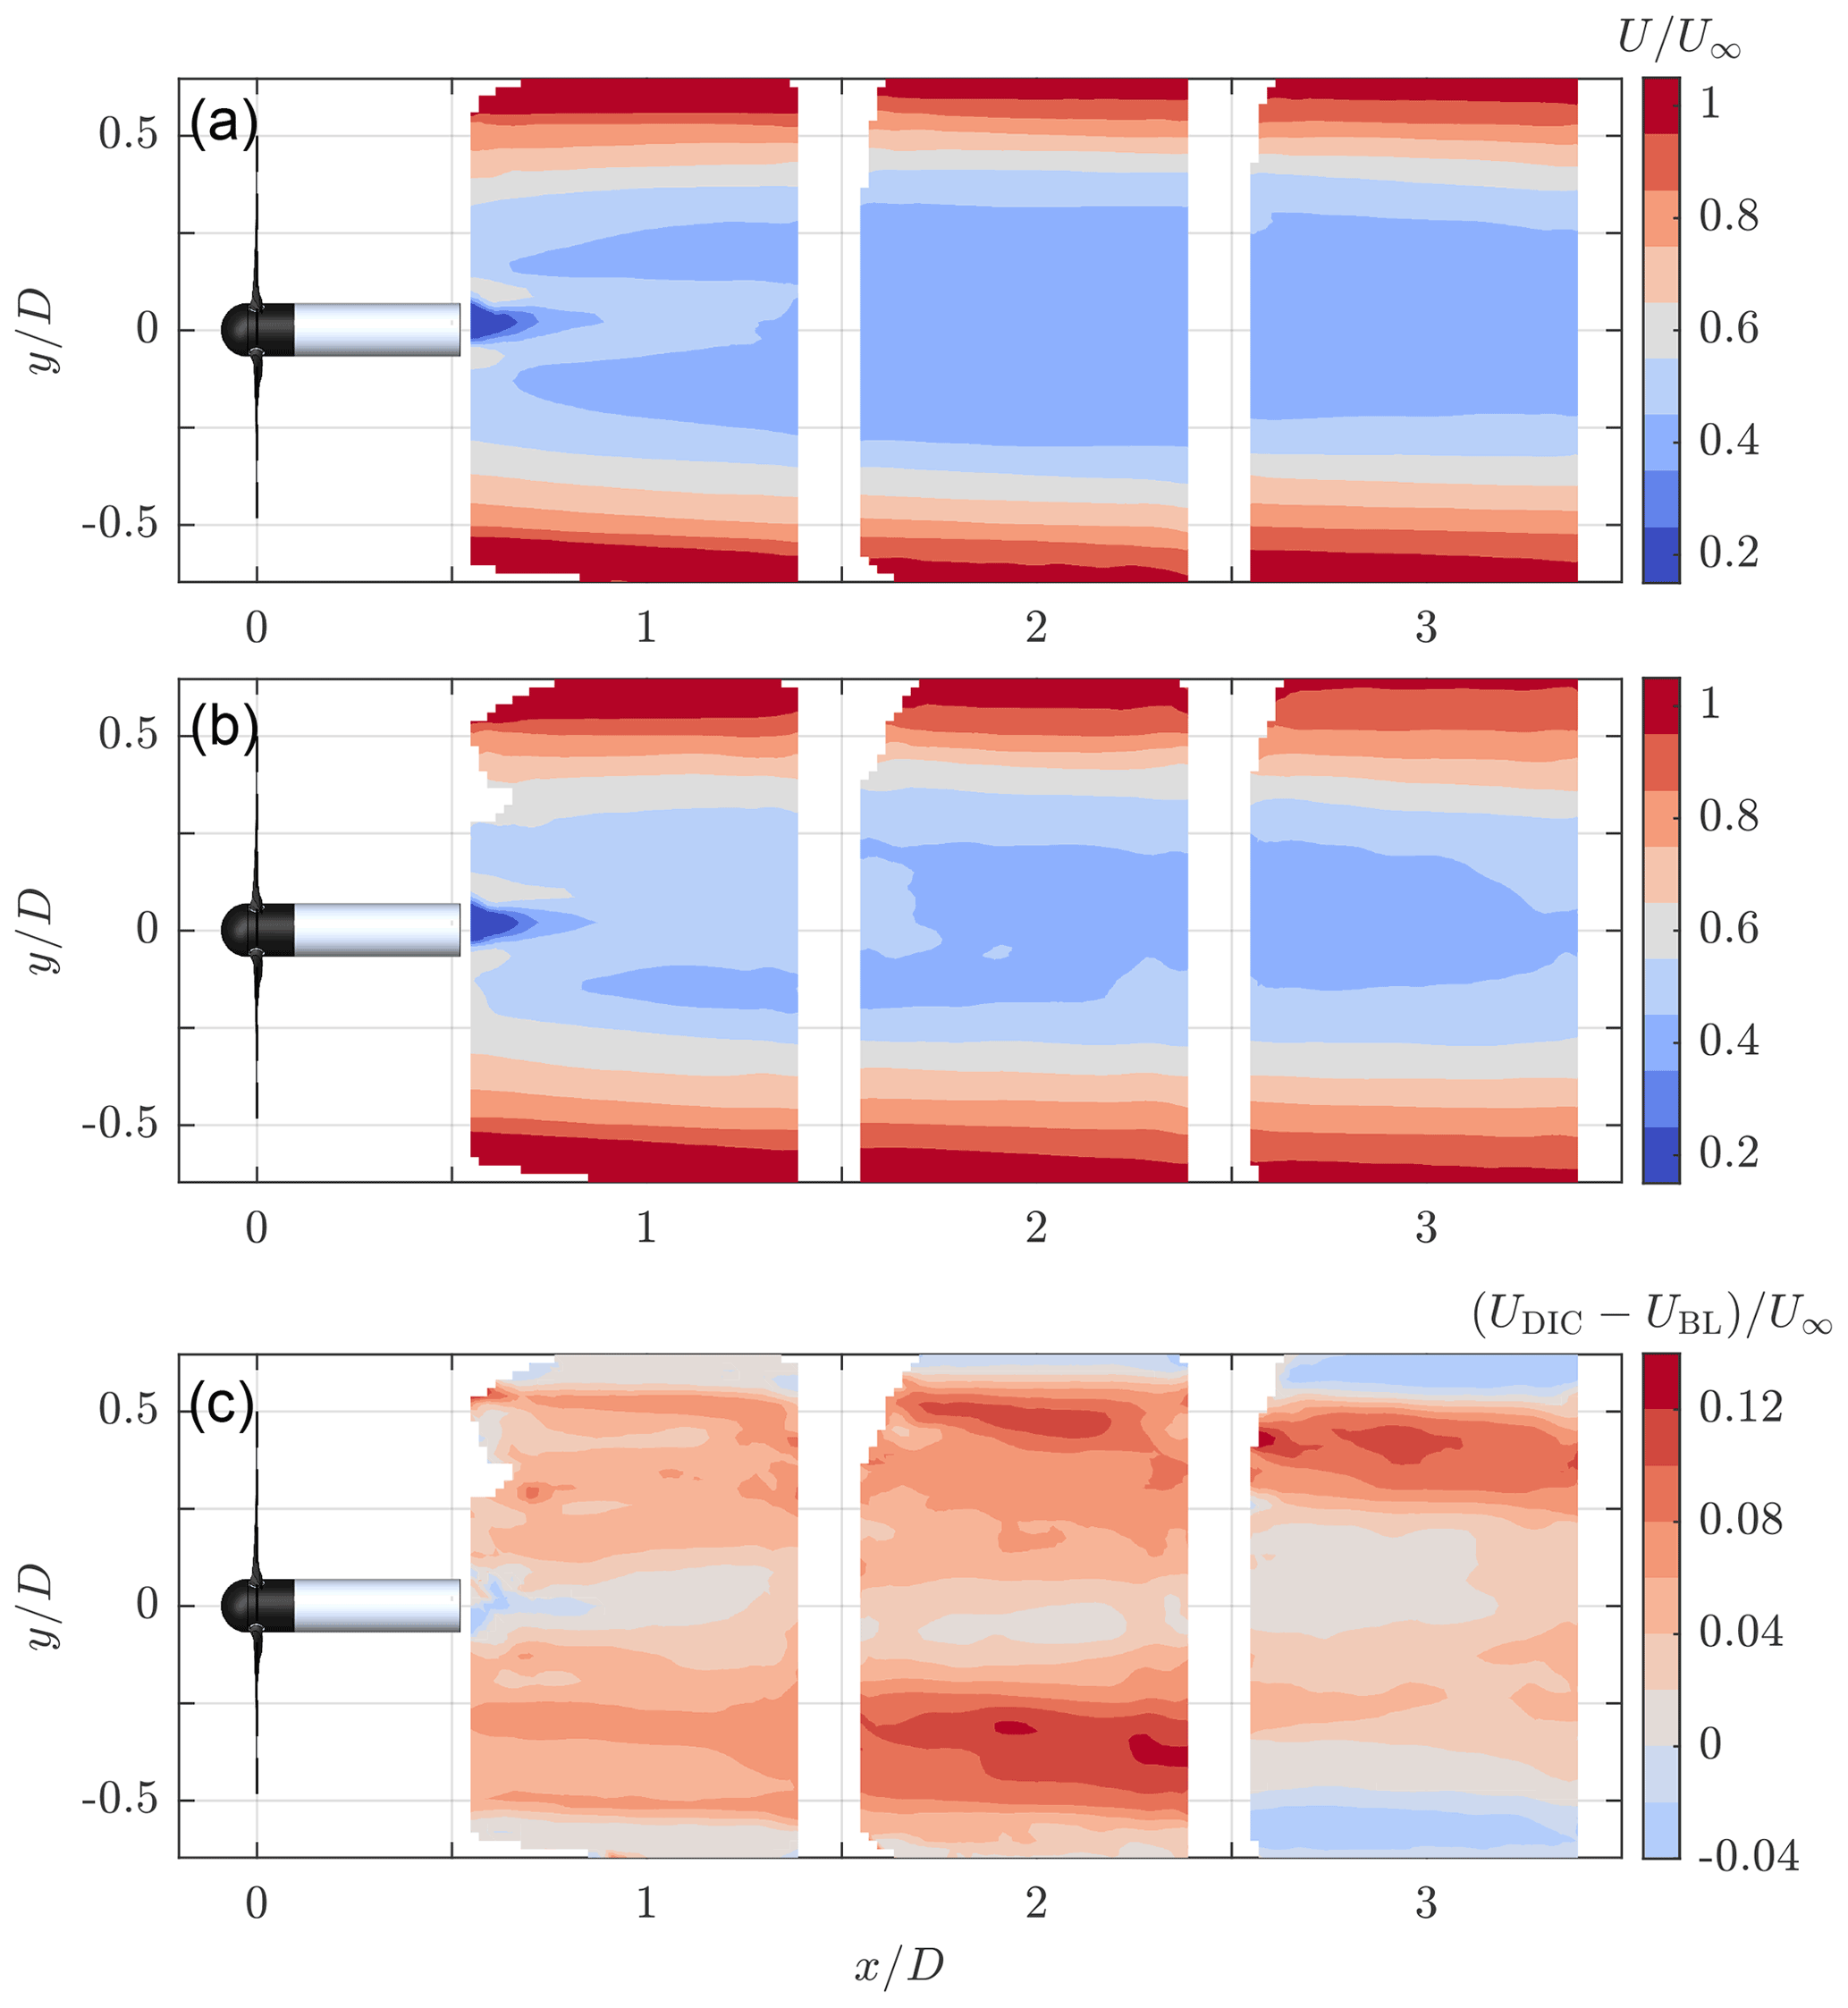
Figure 7Contours of the streamwise velocity component in the wake of the turbine at hub height (), operating with baseline control (a) and DIC (St=0.24) (b). The difference in velocity field between the two control methods is visualized in (c).
The time-averaged velocity fields show that the velocity, and hence the energy in the wake, increased when DIC was used. Using these flow fields, we cannot discern the contributions to the increased velocity of the periodic excitation or the lower average thrust force. However, we can get an indication of how DIC affects the recovery of the wake by inspecting the turbulence intensity. The turbulence intensity is defined relative to the undisturbed inflow velocity U∞ as
with
indicating the variance for each of the three velocity components. The TI at multiple locations in the wake is presented in Fig. 8. For the baseline case, we observe high TI values concentrated at the edge of the wake due to vortices released at the blade tips. The effect of these vortices spread out further downstream as the vortices started interacting with each other. Furthermore, high turbulence levels were present behind the turbine nacelle and tower. Although the influence of the tower seemed to diminish when moving downstream, the lower left quarter of the wake shows that vortices shed by the tower started interacting with the blade tip vortices. Comparing the contours from the baseline operation with DIC, similar TI values were found at . From a distance of and onwards, increased turbulence levels for DIC are visible in large parts of the wake and moving towards the center.
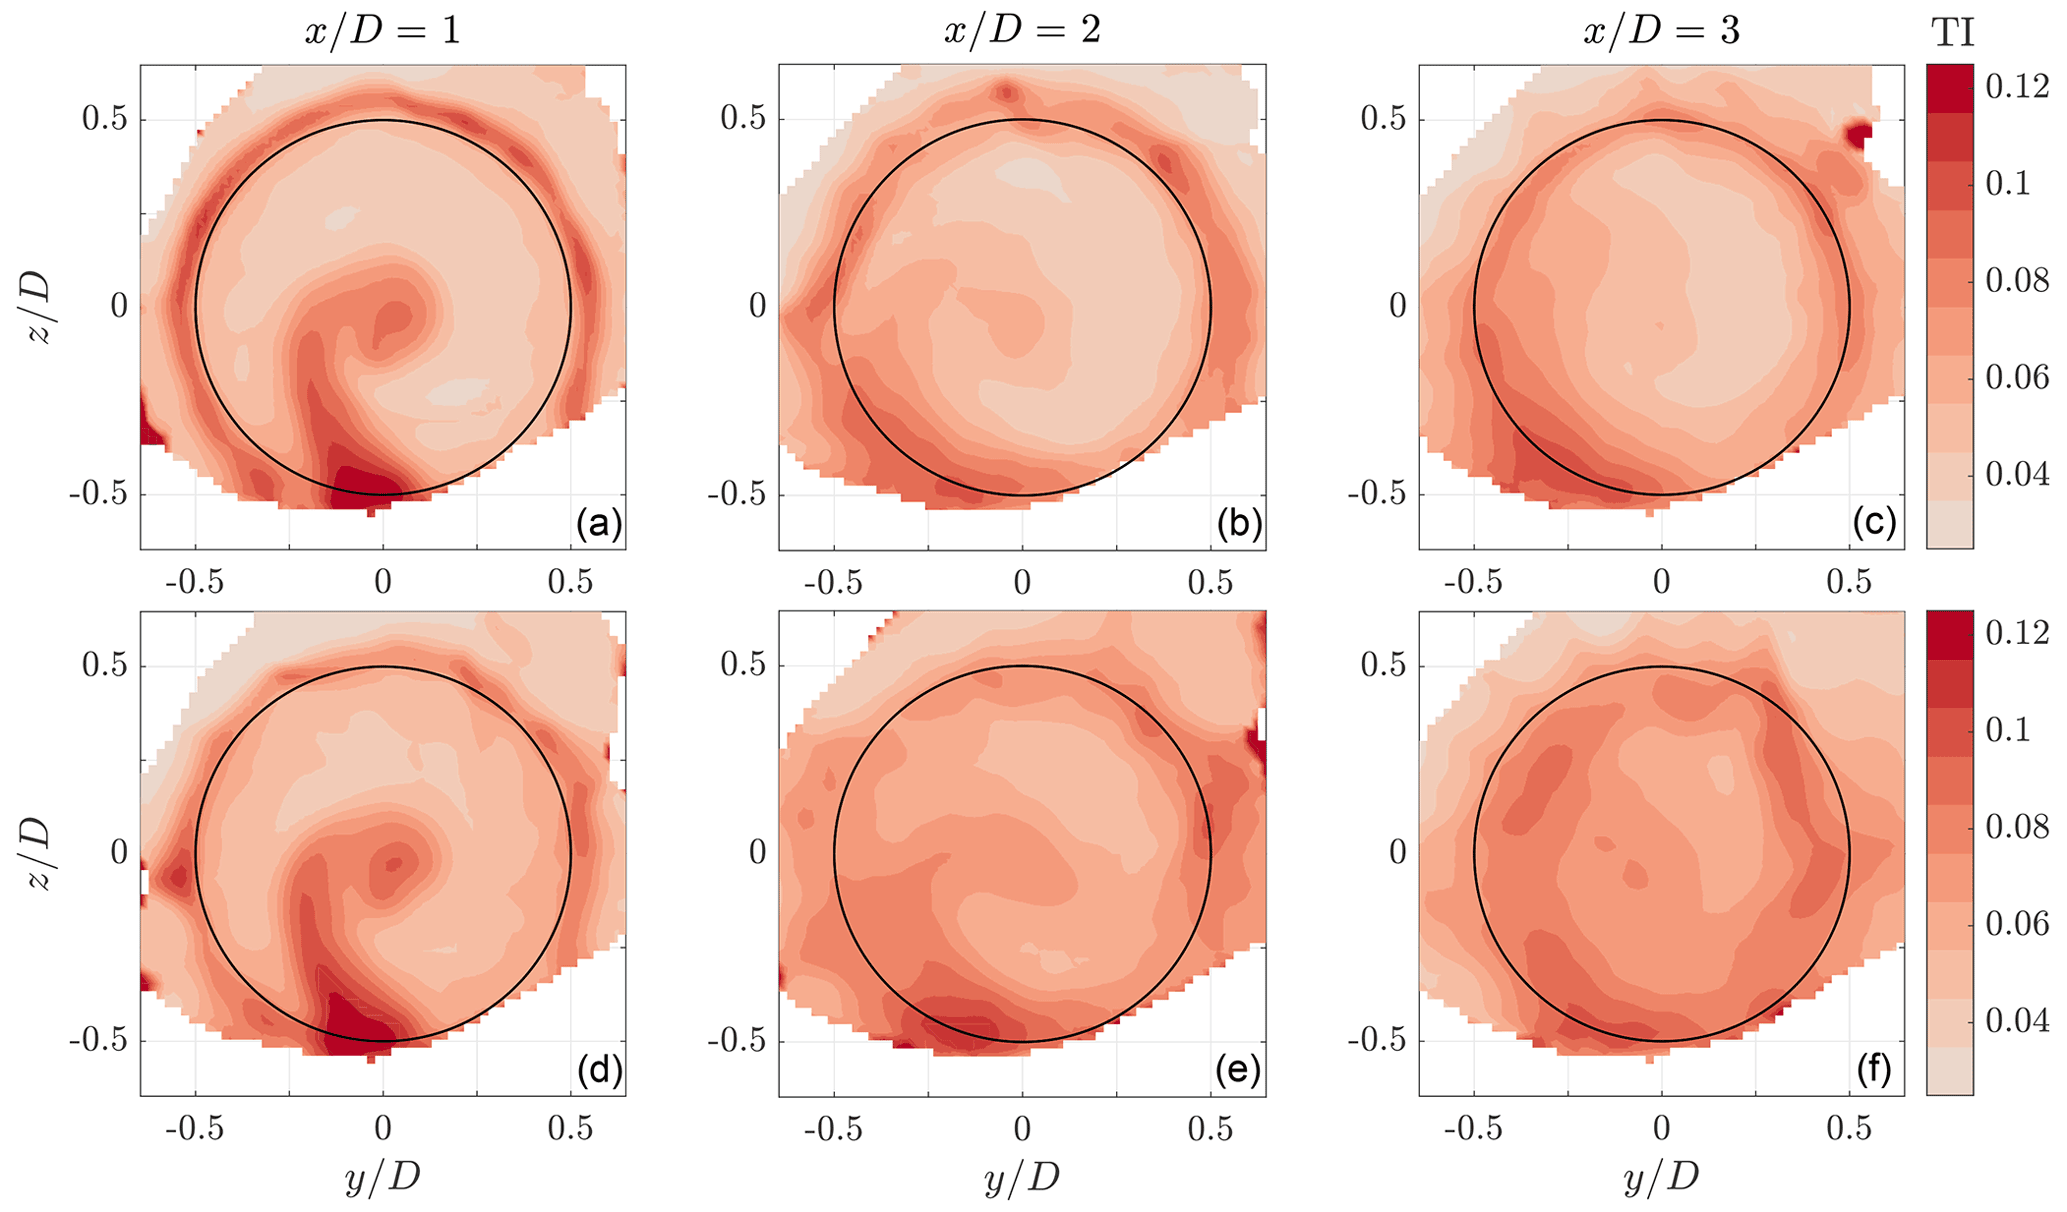
Figure 8Turbulence intensity (TI) contours at multiple locations in the wake of a turbine operating with baseline control (a–c) and DIC with St=0.24 (d–e).
3.3 Periodically averaged velocity and available power
This section investigates the effect of DIC on the velocity in the wake over a pitch cycle. Using the function of available power (AP) from Vollmer et al. (2016), we can quantify how the energy in the wake varied over time. The periodically averaged flow fields were obtained by dividing the instantaneous velocity fields over different phases of the pitch cycle. For a turbine pitching at a frequency of 2 Hz (St=0.29), this resulted in 250 measurements for a single pitch cycle (i.e., the pitch cycle was discretized in 250 phase segments). For each of these pitch phases, the data of all pitch cycles were subsequently averaged using the following equation to obtain a higher statistical convergence:
Here, Upa is the periodic average of the velocity for a phase of the pitch cycle βph, nc represents the number of pitch cycles, and U is the velocity as a function of the pitch angle β at any time t. Depending on the Strouhal number, this means that the number of pitch cycles used for averaging ranged from 13–20. Phase-locked measurements are generally acquired with particle image velocimetry by timing the imaging with the principle frequency of excitation, which is usually the rotational frequency of the turbine (e.g., Lignarolo et al., 2014). However, since the pitch frequency did not always coincide with the rotor frequency, and the latter was not constant when DIC was activated, this was not a valid option for this experiment.
The result of the periodical averaging approach is shown in Fig. 9. For the baseline case, the averaging was done over a single revolution of the rotor. The resulting velocity field looks quite similar to the ones from the time-averaged figures. The velocity fields with DIC are shown at three different phases of the pitch cycle, which are indicated by the relative angle of the blades. Large differences in the velocity field over time were observed. Following a low pitch angle, corresponding to a high thrust force, the wake expanded, and a region of high velocity deficit (dark blue) was induced behind the turbine. As thrust decreased, the wake contracted while a comparatively lower velocity deficit was induced behind the turbine.
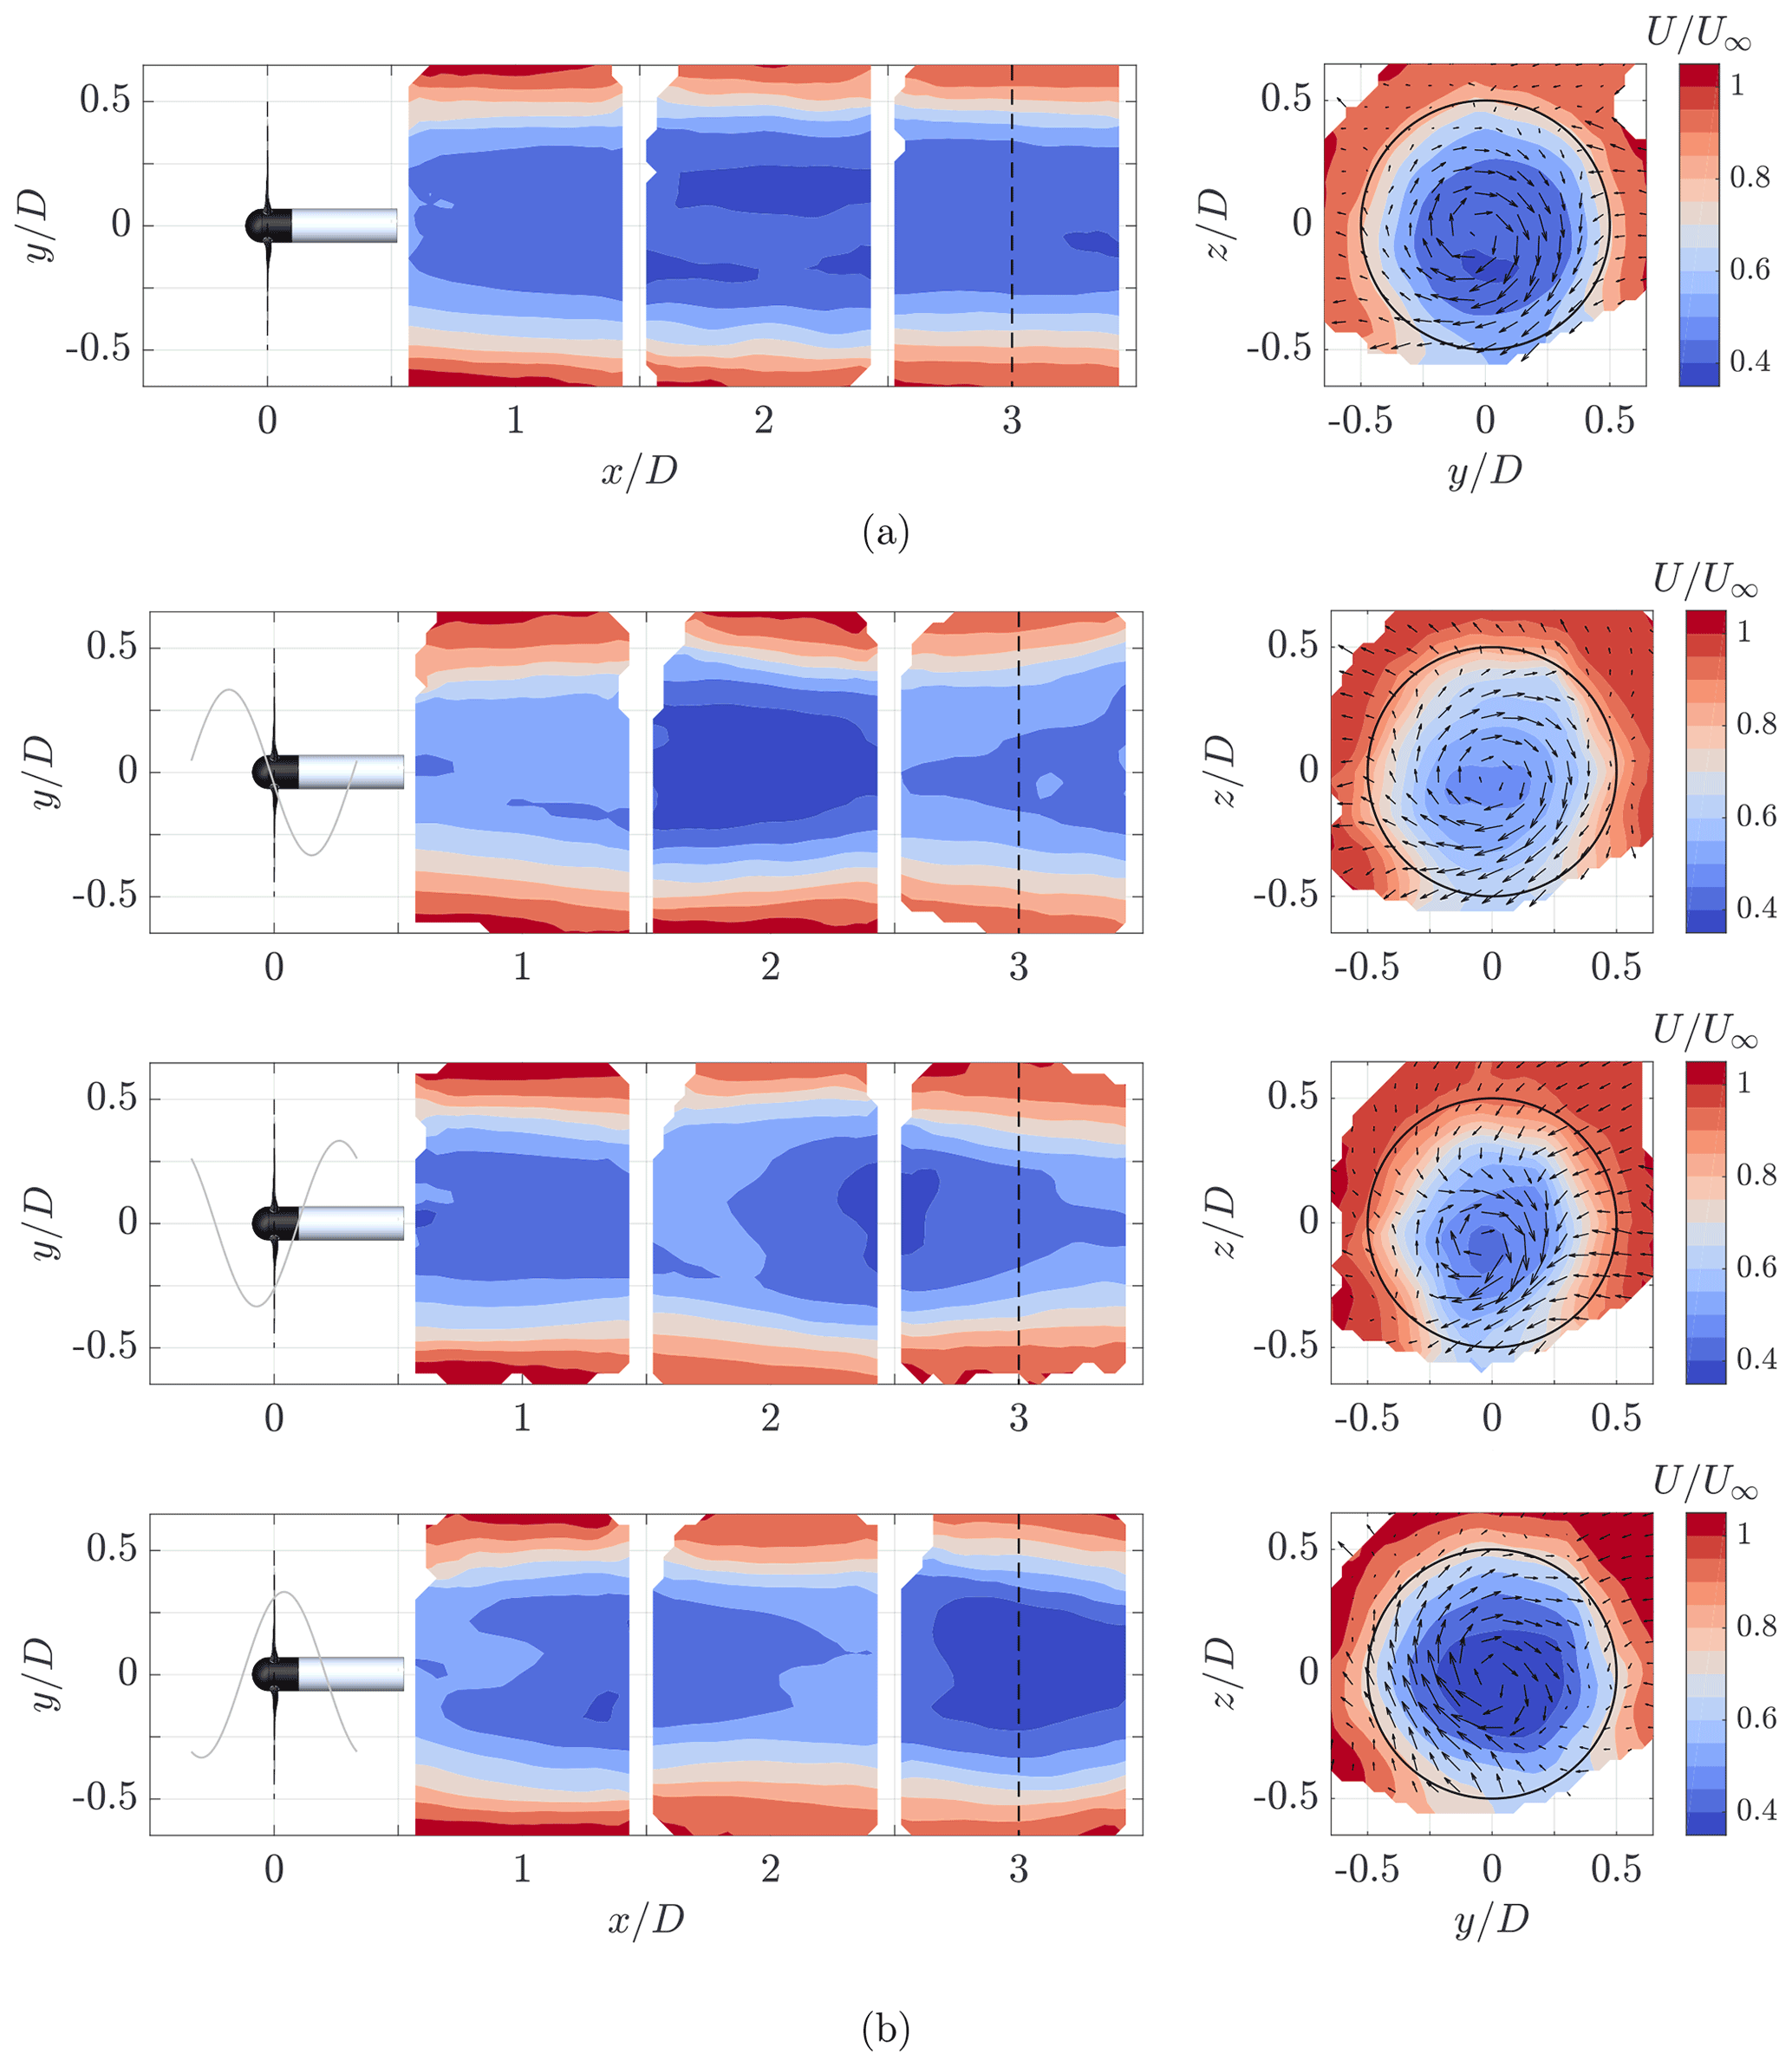
Figure 9Cross-section of the periodically averaged wake at hub height () and at three diameters downstream of a turbine operating with (a) baseline control and (b) DIC (St=0.24). The contours show the normalized streamwise velocity components, and the arrows indicate the cross-stream velocity components. The gray line indicates the pitch angle at different phases of the pitch cycle.
Next, the effect of DIC was evaluated using the fraction of AP as defined by Vollmer et al. (2016):
Here, x denotes the distance downstream, while r and θ indicate the radial distance and azimuth angle. The equation provides the power available to a hypothetical downstream wind turbine with respect to the upstream turbine that is driven by an undisturbed flow. By applying this equation to the phase-averaged data at a distance of downstream, the fAP over time is obtained in Fig. 10 for all Strouhal numbers. From the figure, it is clear that the AP downstream increased significantly for each implementation of DIC compared to baseline operation. Small differences were observed between the different Strouhal numbers, such as the minima and maxima of the fAP. Furthermore, it seems the pitching frequency affected the average traveling speed of the low-velocity wake region, as can be seen from the time shift of the signals.

Figure 10Available power fAP over time at a distance of . The results have been normalized over time using the corresponding pitch frequencies in order to compare the results over a single pitch cycle. The different measurements have been synchronized using the pitch reference signal.
The fraction of AP was subsequently computed for the entire measurement volume and averaged over time to obtain Fig. 11. The figure indicates that the AP was initially still relatively high due to the fact that the wake had not fully expanded yet. The available power reached its minimum between –2, after which it started to recover slowly. The different pitch frequencies for DIC showed only small differences on average; no clear optimum for the Strouhal number is observed based on the present results. The first two measurement positions, and 2, showed a similar trend in the difference between baseline controller and DIC. However, at we see a relative increase in the fAP for the baseline case. This was something that could be expected when looking at the turbine thrust measurements from Fig. 5, where the relative thrust coefficient between baseline and DIC was a lot smaller at this measurement location.
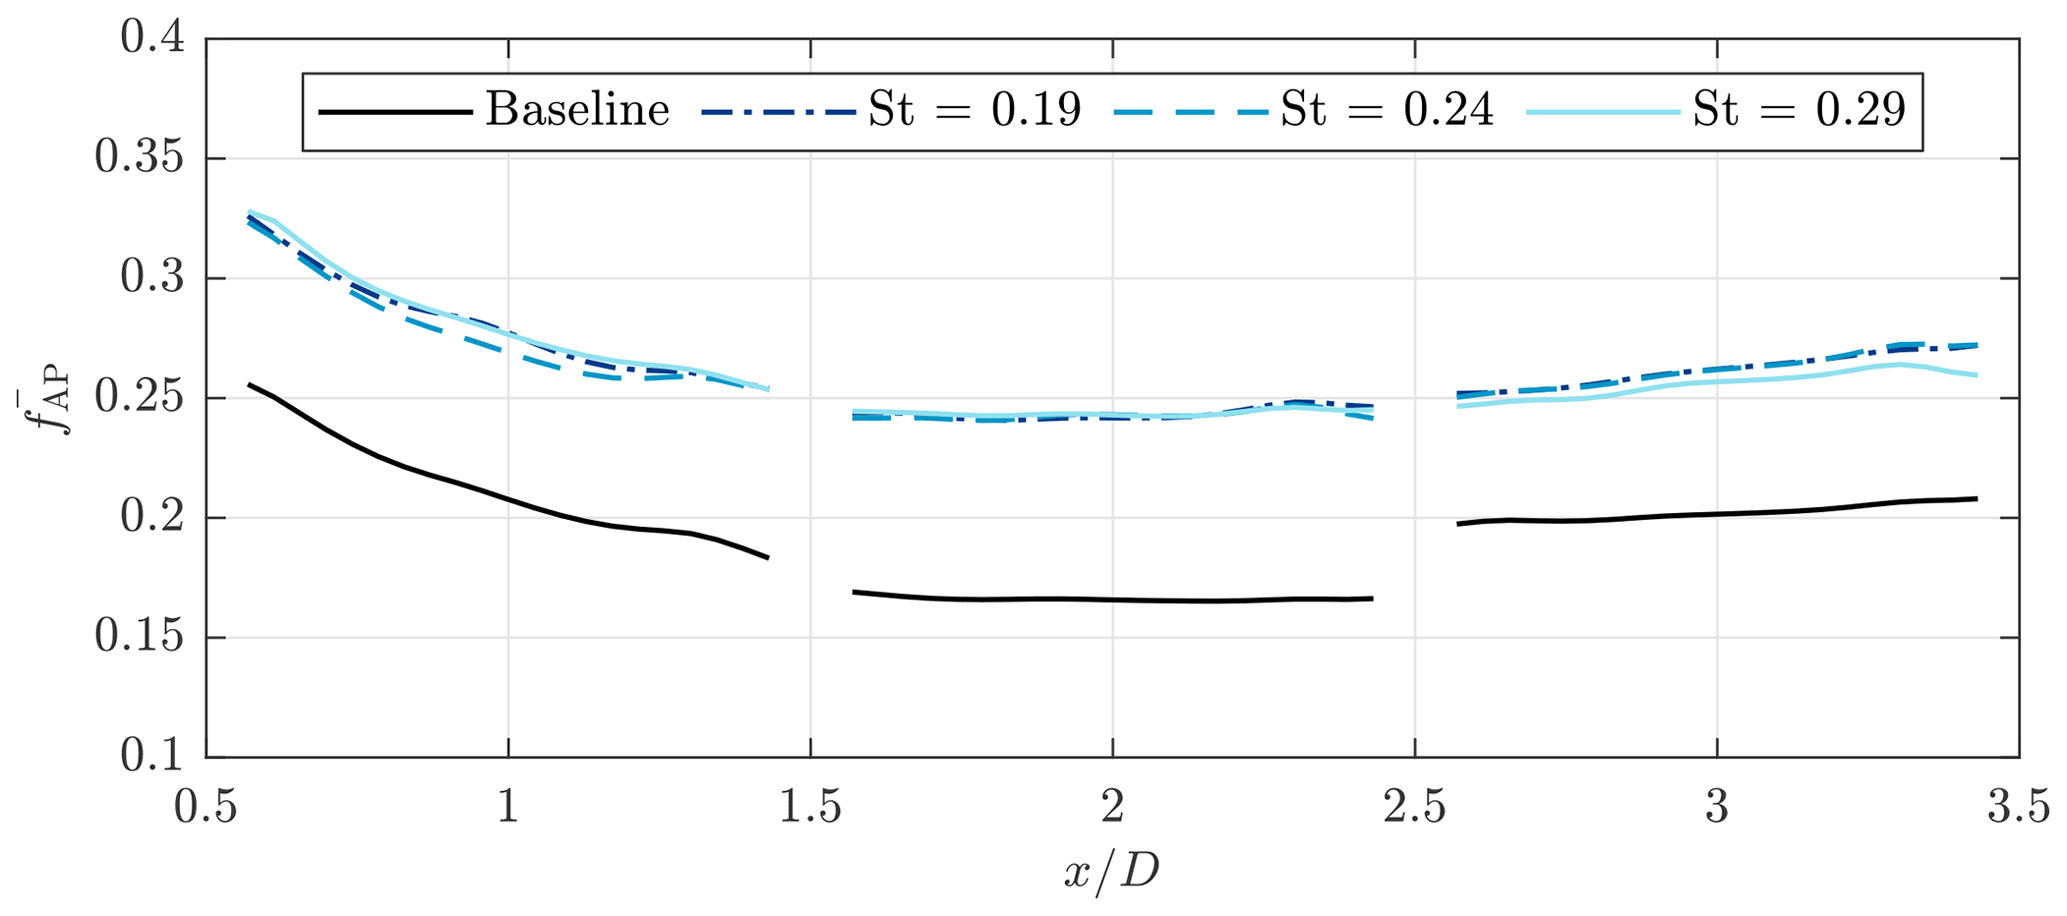
Figure 11Average available power in the wake of a turbine operated with DIC compared to baseline operation. The is based on cross-sections of the measured streamwise velocity field.
Using the average AP from Fig. 11, we can also make a simplified calculation of the efficiency of a potential two-turbine array. By assuming that the hypothetical downstream turbine is operating with the optimal from Fig. 2, the power of the downstream turbine can be determined and added to the power of the upstream turbine to obtain a measure of the array power efficiency. The individual and total power coefficients for a hypothetical turbine located at are given in Fig. 12. Note that the average thrust force of the two control methods was almost equal at this location, allowing a more straightforward comparison of their individual results. When comparing the total power coefficient of the baseline case to DIC, we see that DIC was slightly less effective. This was mostly due to the amount of energy lost at the operated turbine, which was higher than in other studies (Frederik et al., 2020).
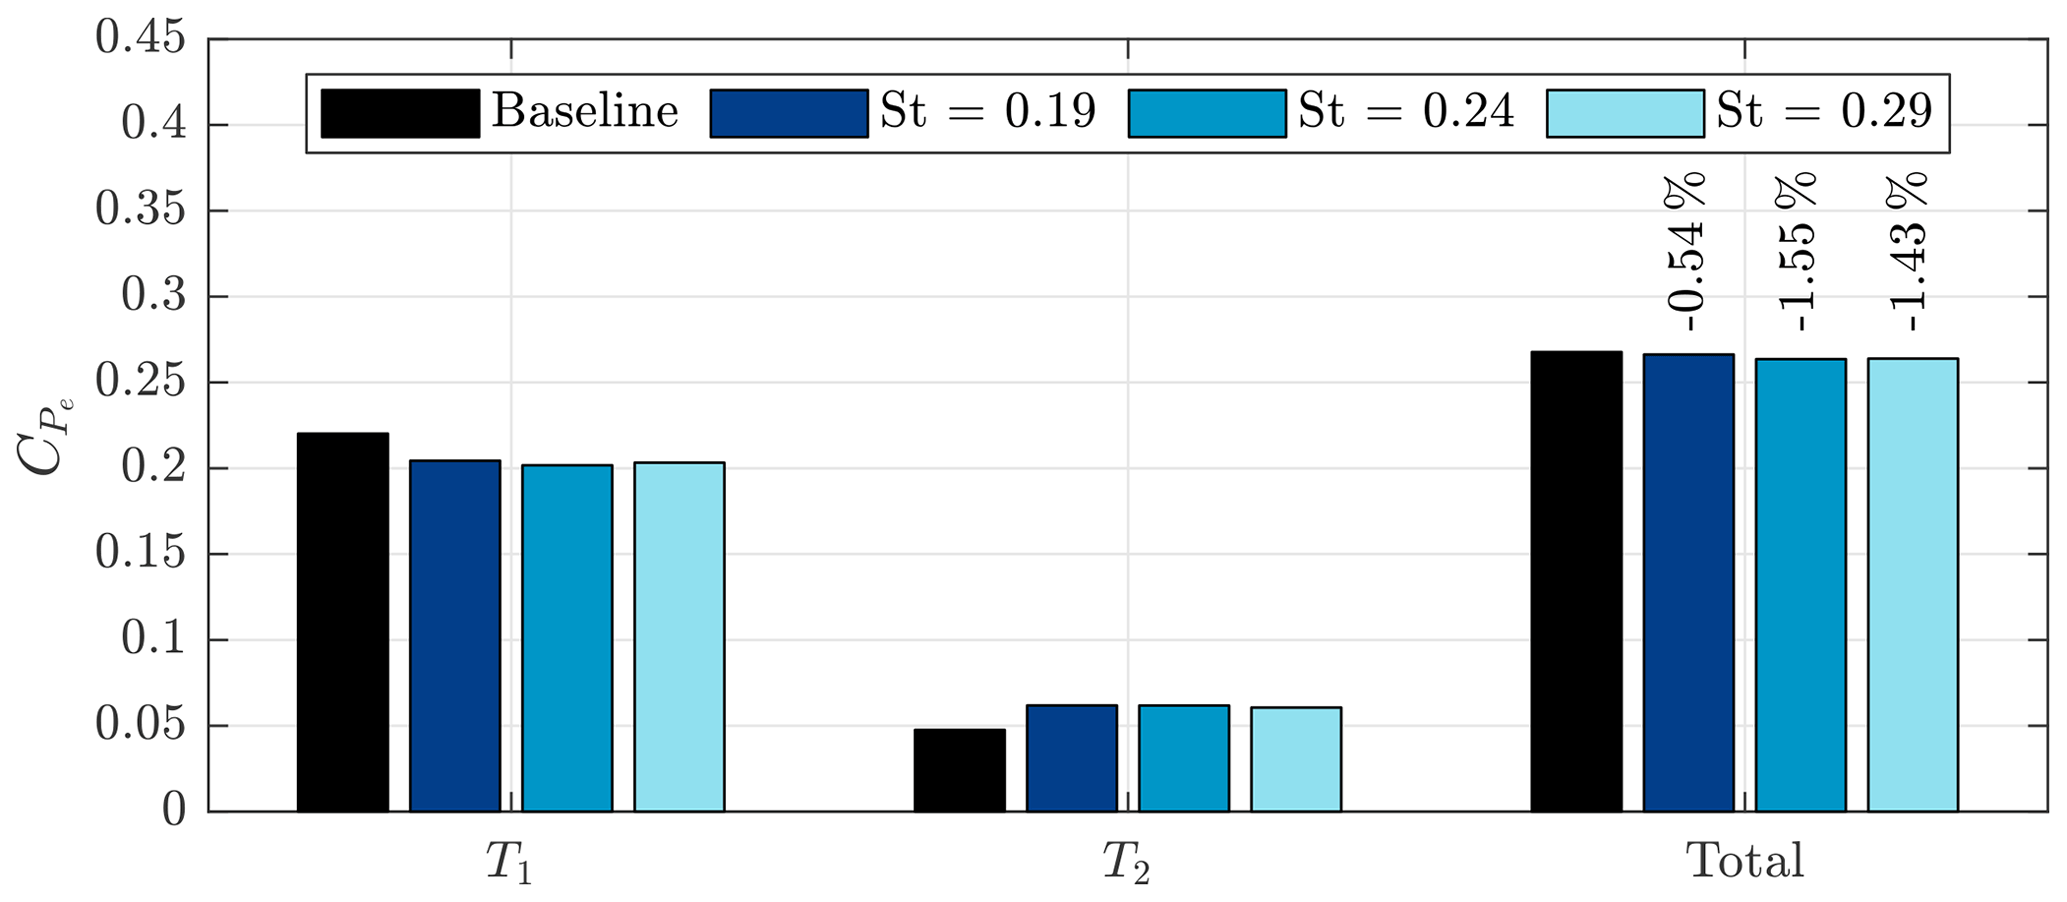
Figure 12Average power coefficient comparing baseline control with DIC for three different frequencies. The first column shows the power of the measurement turbine, the second column shows the power of a hypothetical turbine located at a distance of in the wake, and the final column shows the combined power of T1 and T2.
The comparison of the total power coefficient from Fig. 12 provides some insight in the effectiveness of DIC, but it relies on several assumptions. An additional evaluation can be made using one-dimensional actuator disk theory to compare the measurement results to a simple theoretical framework. In this case, the velocity in the wake of the turbine is assumed to depend solely on the induction factor, and recovery due to turbulence is neglected. The induction factor and corresponding wake velocity are given by
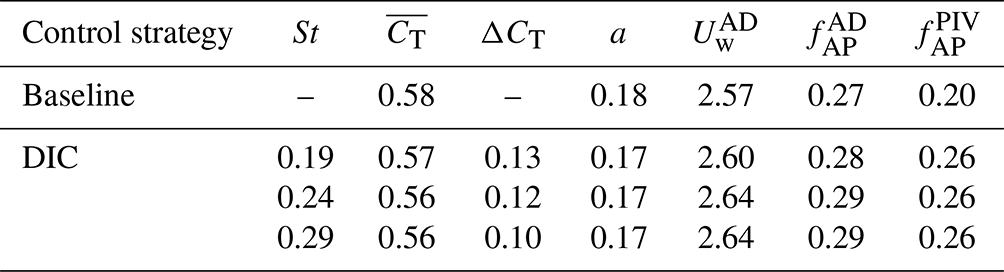
where a is the induction factor, and is the wake velocity according to actuator disk theory. For this theoretical wake velocity we also determined the fAP in order to compare it to the measurement results. The comparison between actuator disk theory and the PIV measurements is provided in Table 1. The average difference between the measured thrust forces among the various measurement cases is seen to be very small, resulting in very similar fAP values for the actuator disk model. We do see some differences in the amplitude of the different DIC frequencies, indicating that the pitch frequency is also affecting the thrust amplitude. Regarding the fAP from the PIV measurements, much larger differences are observed between baseline and DIC. Here, a clear increase in the AP is found when DIC is being used. The difference in values between actuator disk theory and the PIV measurements seems to suggest that a large part of the increased energy in the wake is due to enhanced wake recovery induced by the periodic excitation from DIC.
Table 1Comparison of wake properties for a hypothetical turbine at downstream with DIC compared to baseline operation. The different columns indicate values of the Strouhal number St, average thrust coefficient , thrust amplitude ΔCT, average induction factor a, fraction of AP based on actuator disk theory , and fraction of AP based on the PIV measurements .
3.4 Tip vortex development
The phase-averaged velocity fields allowed us to investigate some of the periodic behavior inside the wake. However, a large part of the dynamics is lost due to the averaging procedure. An additional study of the instantaneous data was made to find more information on the wake mechanics of DIC. Processing the measurements using VIC+ (Schneiders and Scarano, 2016; Jeon et al., 2018), we were able to obtain time-resolved velocity fields at a grid spacing of 15 mm. After processing the PIV measurements, the Q criterion was computed from the acquired velocity components in order to identify the vortical structures in the wake (Hunt et al., 1988). This allowed us to visualize the vortices generated at the tips and roots of the blades in Figs. 13 and 14. The first figure shows the development of the vortices over time for baseline operation, while the second figure shows how the vortices develop over time at different stages of the pitch cycle with DIC. In the baseline case, we observe how each of the vortices shed by the blades traveled downstream without much interaction around . However, moving further downstream it becomes apparent that starting at , the first two vortices started interacting. At this point, the vortices were so close to each other that they started having a reciprocal influence, causing them to roll up around one another. This process is called leapfrogging due to the phenomenon where the first vortex jumps back underneath the two trailing vortices. The leapfrogging event continued around , where we observe that the first two vortices have rolled up underneath the last trailing vortex. Leapfrogging plays an important role in the recovery of a wind turbine wake. The wake turbulence induced after the vortex breakdown has been shown to lead to positive entrainment of kinetic energy into the wake (Lignarolo et al., 2014).
Since the breakdown of the tip vortices has a strong influence on the recovery of the wake, it is interesting to look at the difference in the leapfrogging process with DIC. The first time instant from Fig. 14 shows the wake as the pitch angle is traveling from its minimum position, which is associated with the highest thrust force. Initially, we observe that the vortices start interacting at a later stage than in the baseline case. However, as the stronger vortices that were shed when the thrust force was at its peak traveled downstream, it is seen that the leapfrogging location was moved upstream. Furthermore, the figure shows that the leapfrogging process is no longer sequential but that the three vortices start rolling up all at once. At the third frame, a single vortex is observed before , consisting of three successive tip vortices. As the pitch angle increased, and thrust force went down, the strength of the vortices decreased, and the location of the leapfrogging event shifted downstream again. From these visualizations it becomes evident that DIC has a large influence on the breakdown of tip vortices and the accompanying re-energizing of the wake.
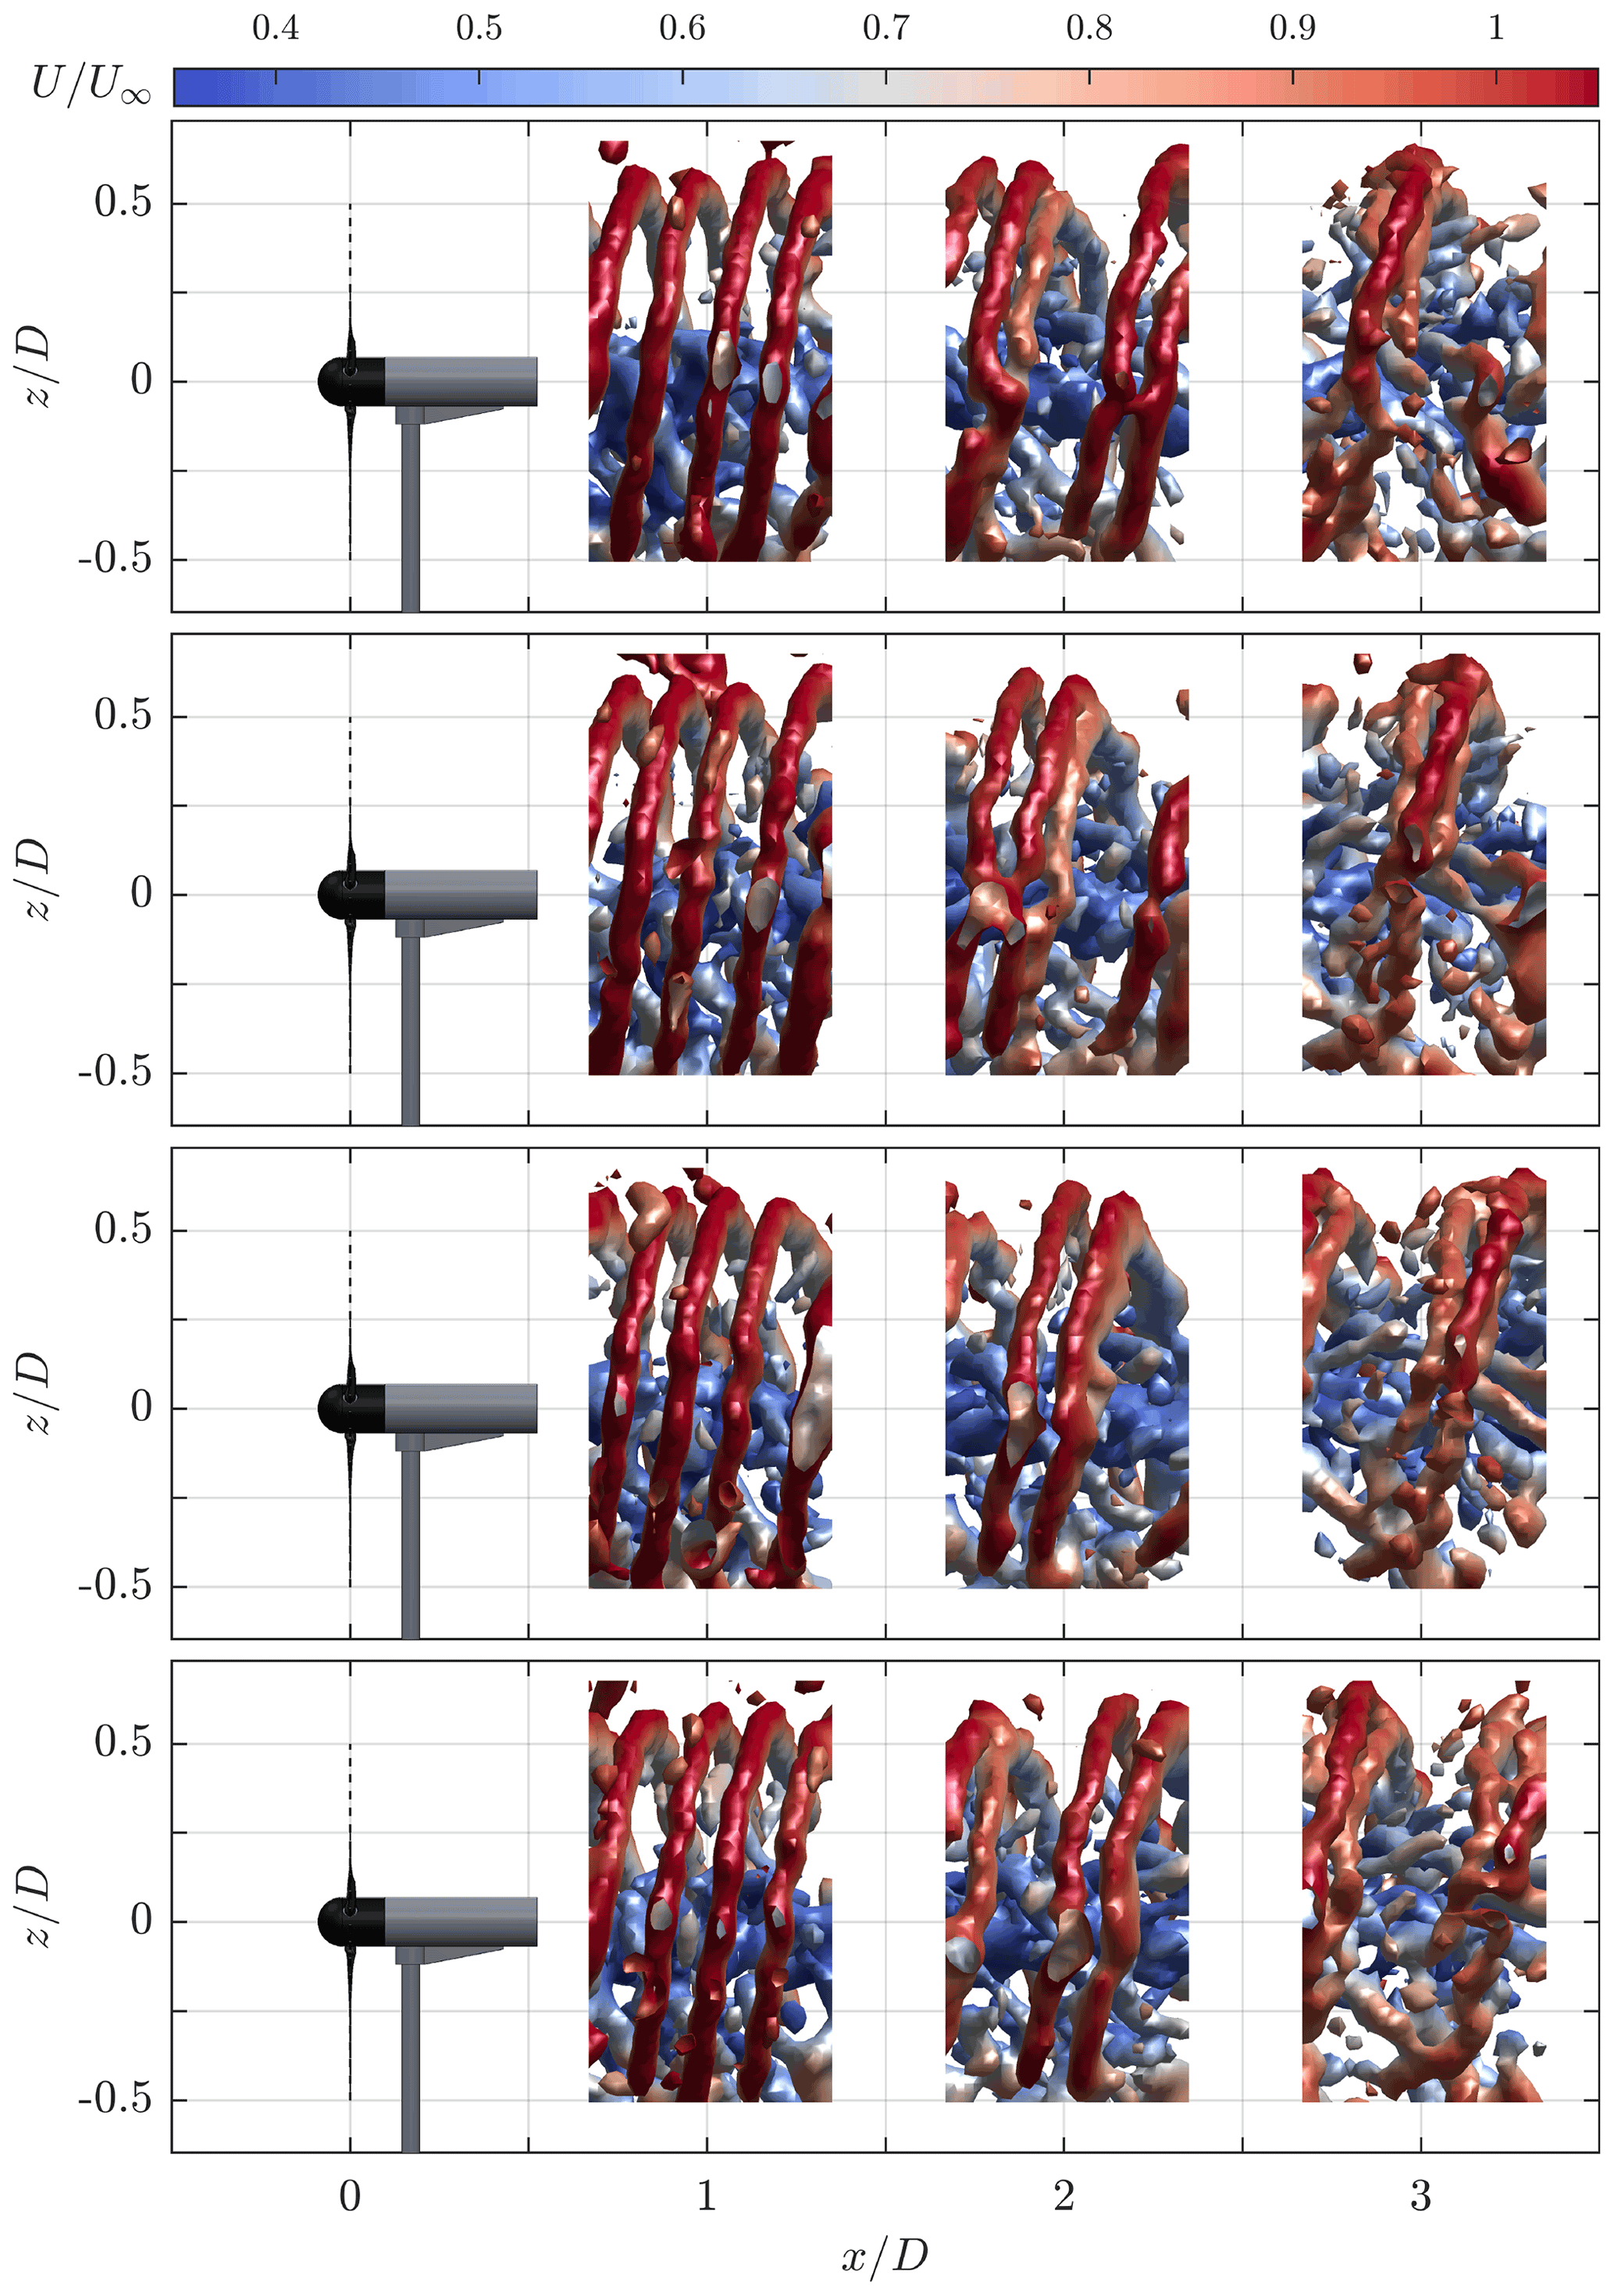
Figure 13Isosurfaces of the instantaneous normalized Q criterion () visualizing the blade tip vortices for baseline operation. The different snapshots are separated by Δt=0.02 s. The colors of the isosurfaces correspond to the normalized streamwise velocity component.
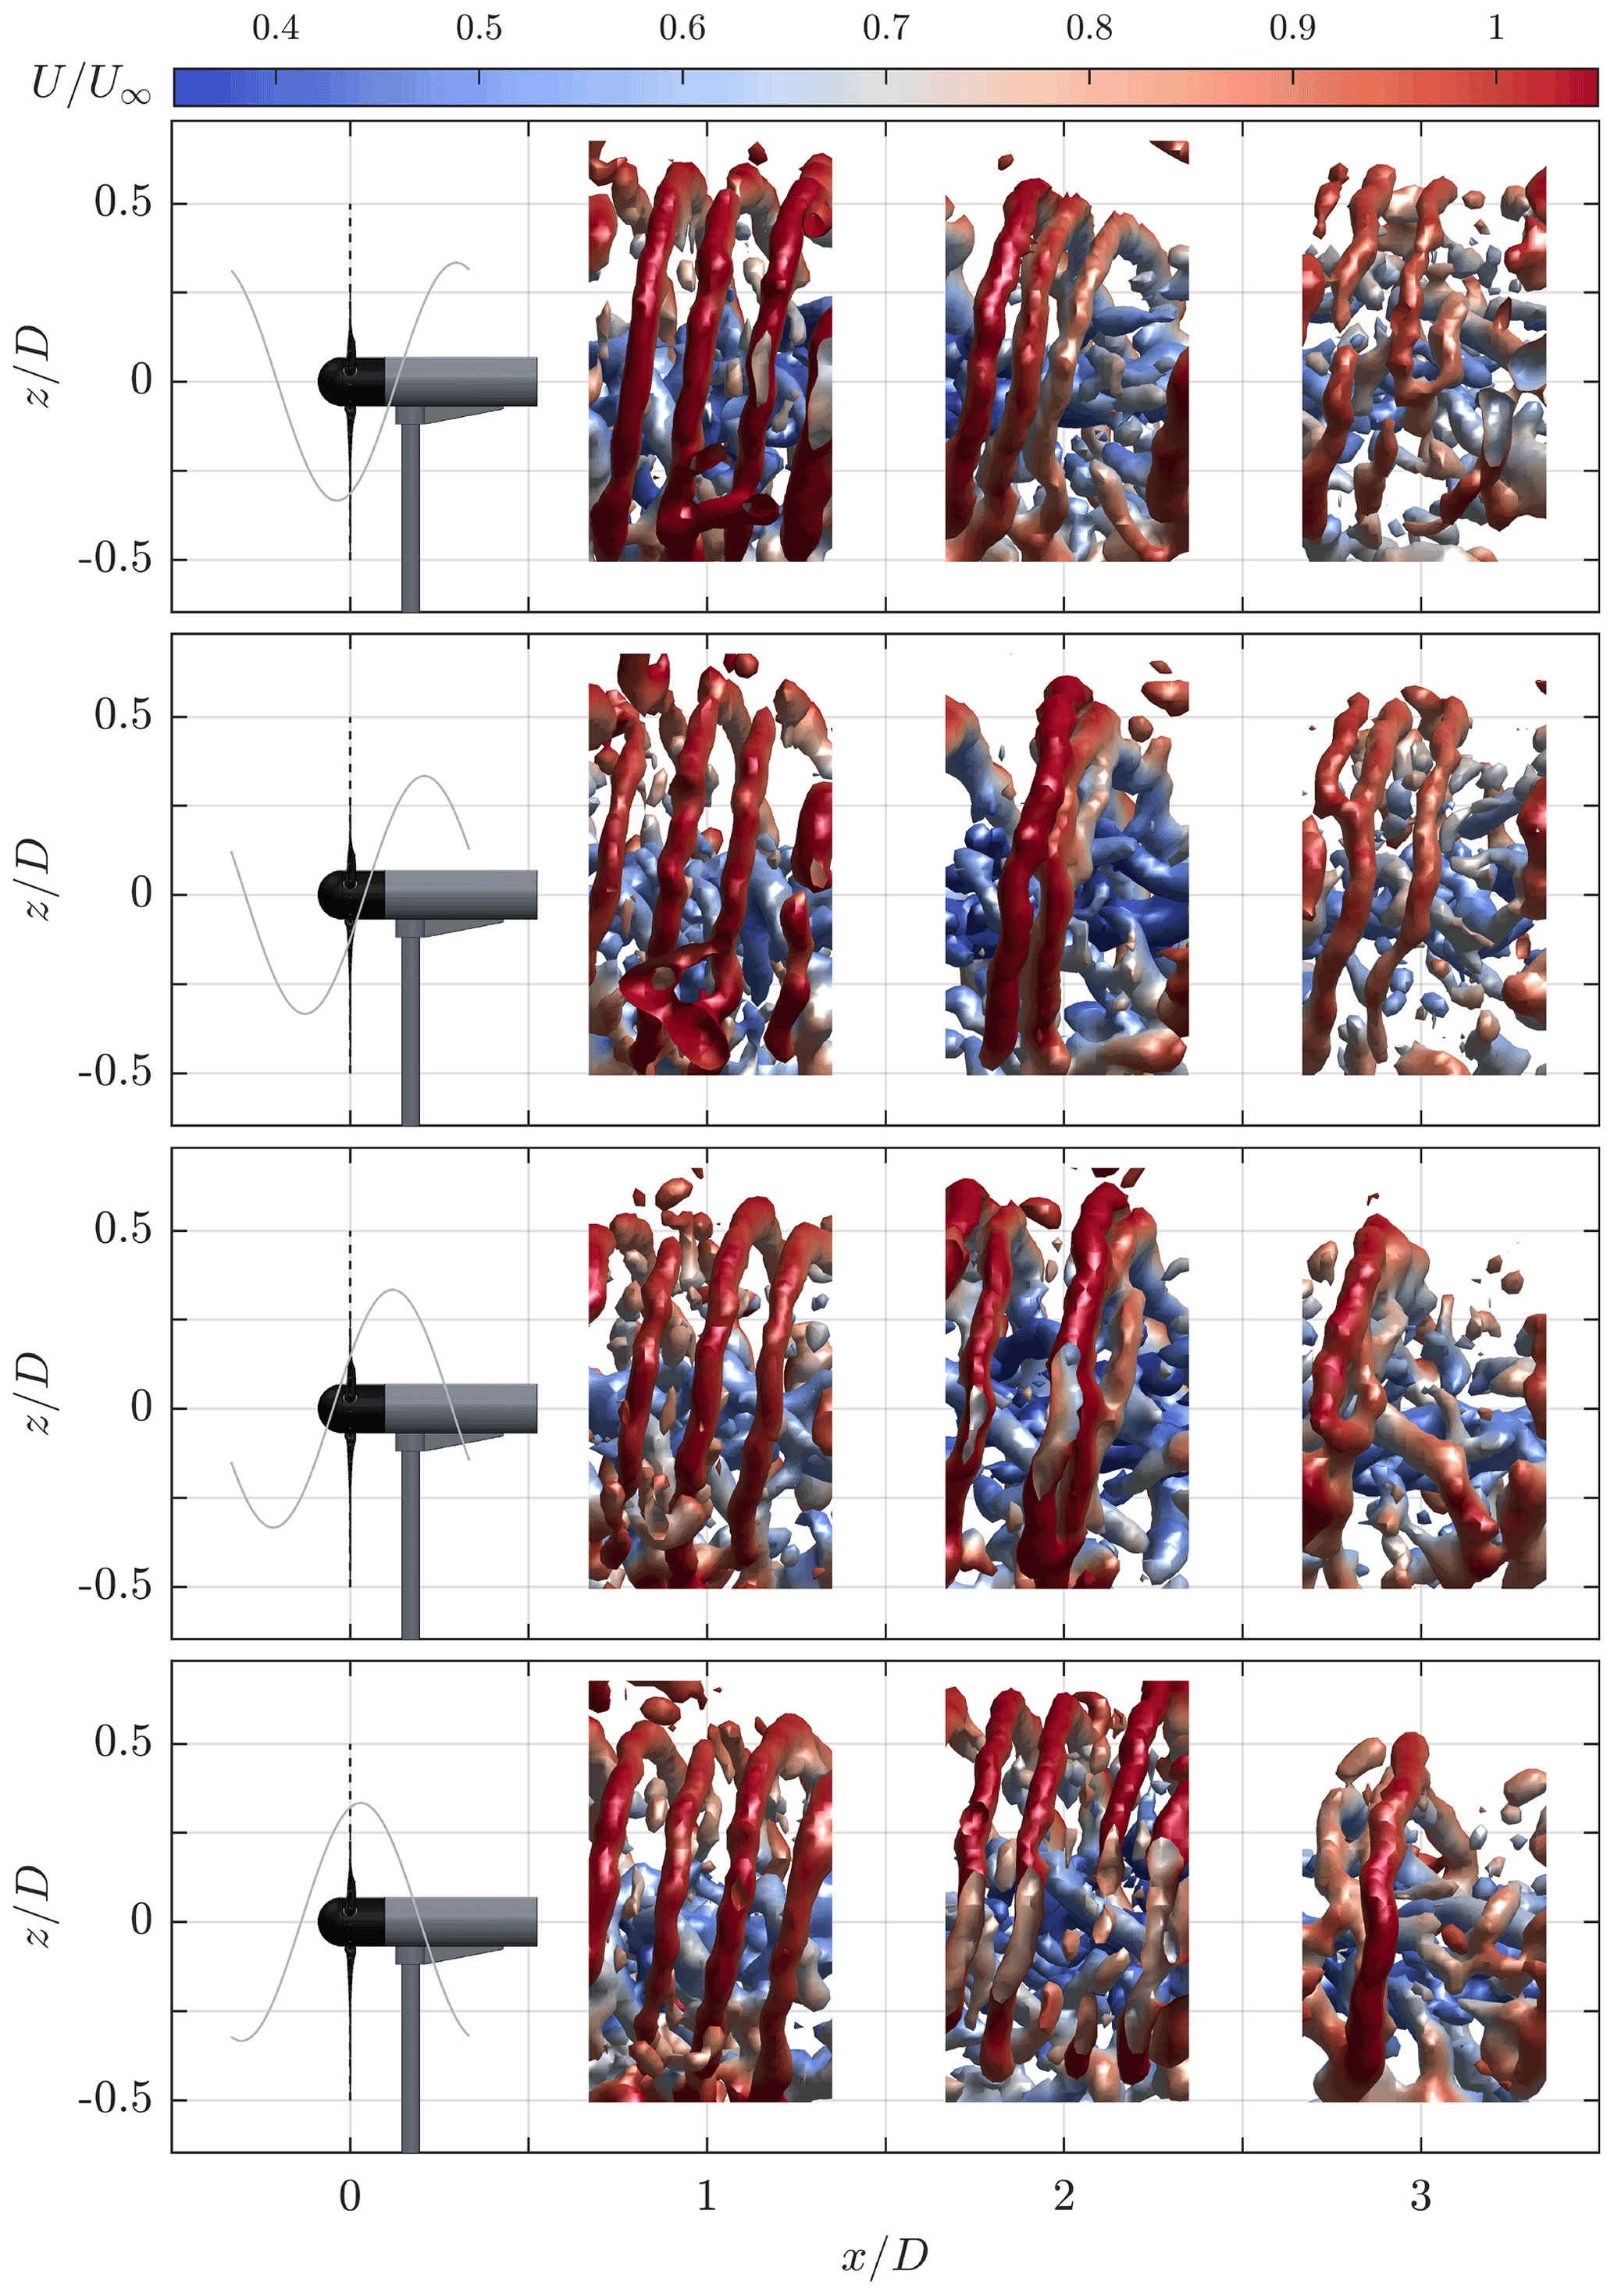
Figure 14Isosurfaces of the instantaneous normalized Q criterion () visualizing the blade tip vortices for operation with DIC (St=0.19). The different snapshots are separated by Δt=0.1 s. The colors of the isosurfaces correspond to the normalized streamwise velocity component, while the gray line indicates the current pitch angle.
The results from the PIV measurements were investigated from three different perspectives: from a time-averaged, periodic, and instantaneous point of view. Especially for the time-averaged results it should be recalled that there was a steady offset in the thrust coefficient experienced by the turbine during baseline operation and DIC. Hence, the improved velocity fields for DIC do not provide sufficient evidence for the effectiveness of this control approach. However, it should be noted that during the experiment the difference in average thrust levels was smaller than anticipated (see Fig. 5). Due to the changing wind turbine position, small differences in adjacent parts of the velocity fields were observed. This is particularly the case when we examine the difference in streamwise velocity at in Fig. 7.
The time-averaged data did show increased TI levels towards the center of the wake as a result of applying DIC (see Fig. 8). Since atmospheric turbulence is a key driver for wake recovery, we believe that the additional turbulence induced by DIC stimulates wake mixing, leading to a higher energy content. The TI contours also made it apparent that the influence of the wind turbine's tower and nacelle on the wake was significant and not exclusive to the lower half of the wake. We observe how high turbulence levels behind the tower were sucked upward to around hub height due to the rotation of the wake. This observation corroborates findings from high-fidelity simulations (Santoni et al., 2017) and field measurements (Abraham et al., 2019), which showed that both tower and nacelle play an important role in the recovery of the wake, especially in the far wake. The results presented in this paper not only visualize these effects but also show that the turbulence caused by the tower and nacelle is enhanced by DIC. We believe this to be an important observation, one that should be taken into account in future studies into axial induction control. This holds especially for high-fidelity simulation studies, which often omit the nacelle and tower structures for practical reasons.
Periodically averaged velocity fields were used to determine the hypothetical available power for a second turbine at . This measurement was subsequently averaged over time in order to obtain the total power of an array with a second hypothetical turbine. The difference in the total power turned out to be minor and in favor of the baseline operation. This was partially due to the relatively high power loss (approximately 10 %) of the model wind turbine when it was pitching. We expect the power loss to be lower for large-scale wind turbines, which have power curves that are less steep. Furthermore, the loss can be partially ascribed to the fAP of the baseline control case at , which was above the expected trend of the AP obtained from the measurements at and 2. As mentioned before, we believe this trend break was a result of the varying average thrust experienced at the different measurement positions.
Based on the phase-averaged velocity fields we can conclude that the streamwise velocity increased when a periodic forcing component was applied to the flow. Furthermore, the results presented in Table 1 show that the increase in mass flow or energy was higher than expected based on the average thrust levels. The exact cause behind the increased energy levels in the wake is difficult to pinpoint. However, simulations and experiments have indicated that wake recovery is related to the location of the blade tip vortex breakdown (Lignarolo et al., 2014, 2015; Marten et al., 2020). From the instantaneous measurements we can observe that the leapfrogging event for the baseline case was completed around . When applying DIC, we see how the strength of the vortices was affected directly. The stronger vortices accelerated the instability that leads to the leapfrogging event and the subsequent vortex breakdown. As a result, we see that the location of the vortex breakdown changed over time, ranging from to . Based on these observations, we believe that the wake recovery starts at an earlier stage at some time instants and is spread out over a larger part of the wake when DIC is used. In contrast, the wake starts recovering at a fixed location for the baseline case, achieving a lower overall recovery. While the difference in average thrust between baseline and DIC makes it difficult to directly compare all measurement results, we believe the analysis of the tip vortices is not affected heavily. If anything, implementing DIC at a higher average thrust would likely have triggered the leapfrogging event at an earlier stage.
Finally, we will also use this section to briefly discuss some of the challenges that were encountered during the experiment. Our desire for large-scale PIV measurements meant a turbine of limited size while also being capable of exciting the wake through a pitch action of the blades. The turbine used in this experiment was able to meet this desire, but due to limitations of the pitch actuators it was not possible to measure at inflow wind speeds . Operating the open jet at this velocity introduces some unsteadiness to the flow, and the true wind speed measurement at the outlet of the jet is susceptible to measurement errors. The large measurement volume also required the HFSB seeding rake to be positioned in front of the jet in order to cover a large volume with flow tracers. Based on the measurements from Fig. 5, we believe the effect of the seeding rake is not to be ignored. Indeed, an increase in turbulence intensity was observed when the flow was measured without the turbine present. Not only did the measured thrust levels differ from the experimentally determined thrust coefficient seen in Fig. 2, they also varied depending on the measurement position of the turbine. For the sake of consistency across measurements, future experiments would do better by operating the turbine at a fixed location while moving the PIV setup to cover different parts of the wake.
In this paper, we investigate the wake of a small-scale wind turbine (D=0.58 m) operating with dynamic induction control (DIC). Measurements of the wake, ranging from 0.5–3.5 D downstream, were taken using particle image velocimetry with helium-filled soap bubbles. The results with DIC were compared to those from a baseline controller. While the baseline controller maximizes the individual turbine power output, DIC aims to optimize the overall wind park output. Three different pitching frequencies were used for DIC at Strouhal numbers of St=0.19, 0.24, and 0.29.
When applying DIC, time-averaged measurements showed a decrease in the wake velocity deficit, which was partially due to a lower average thrust force. The periodic excitation also resulted in higher turbulence levels towards the center of the wake compared to baseline control, indicating enhanced wake recovery. Averaging the velocity data over a single pitch cycle showed a low-velocity region traveling downstream causing the wake to expand and contract locally. The available power fAP of a hypothetical turbine downstream was subsequently computed using these velocity fields, showing minor variations in power for the different Strouhal numbers. The measurements were also compared against one-dimensional actuator disk theory. Where the latter showed similar levels of fAP between baseline control and DIC, a clear increase in available power with DIC was observed from the measurements. This is an additional indication of the enhanced wake recovery due to the periodic excitation.
Finally, the development of blade tip vortices was visualized using the Q criterion. These figures identified the locations of the leapfrogging process and subsequent breakdown of vortices, which strongly influence wake mixing and hence the re-energizing of the wake. For the baseline case, we observed a stable region for the leapfrogging event between and 3. On the other hand, DIC resulted in a periodically changing location depending on the thrust force of the turbine. Furthermore, changes in the leapfrogging process itself were observed as three successive vortices started interacting simultaneously. This alternative way of vortex breakdown is presumably one of the main drivers behind the enhanced wake recovery of periodic dynamic induction control: the effective wake recovery location is brought forward and expanded over a larger area. Further research in this area, both experimental and through simulations, is required to improve our understanding of this mechanism.
This study showed that dynamic induction control increased the wind speed and turbulence intensity in the wake. The periodic thrust force continuously changed the location of vortex breakdown, leading to enhanced wake recovery. The experimental results can be used to improve modeling dynamic excitations of the wake, with the goal of increasing the efficiency of large-scale wind farms.
Measurement data from the wind tunnel experiment are available upon request.
DvdH prepared and conducted the measurement campaign, analyzed the measurement data, and wrote the paper. JF and MH assisted with the measurement campaign and helped with analyzing the data and with writing parts of the paper. FS aided in the design of the experiment and operation of the measurement equipment. CSF and JWvW supervised the work. All authors were involved with reviewing the paper.
The contact author has declared that neither they nor their co-authors have any competing interests.
Publisher’s note: Copernicus Publications remains neutral with regard to jurisdictional claims in published maps and institutional affiliations.
Additional thanks go out to Will van Geest, Alex Rozene Vallespin, and Wim Wien for their assistance in preparing the wind turbine model.
This work is part of the research program “Robust closed-loop wake steering for large densely spaced wind farms” with project number 17512, which is (partly) financed by the Dutch Research Council (NWO).
This paper was edited by Johan Meyers and reviewed by Stefano Cacciola and one anonymous referee.
Abraham, A., Dasari, T., and Hong, J.: Effect of turbine nacelle and tower on the near wake of a utility-scale wind turbine, J. Wind Eng. Ind. Aerod., 193, 103981, https://doi.org/10.1016/J.JWEIA.2019.103981, 2019. a
Annoni, J., Gebraad, P. M. O., Scholbrock, A. K., Fleming, P. A., and van Wingerden, J. W.: Analysis of axial-induction-based wind plant control using an engineering and a high-order wind plant model, Wind Energy, 19, 1135–1150, 2016. a, b
Barthelmie, R. J., Pryor, S. C., Frandsen, S. T., Hansen, K. S., Schepers, J. G., Rados, K., Schlez, W., Neubert, A., Jensen, L. E., and Neckelmann, S.: Quantifying the Impact of Wind Turbine Wakes on Power Output at Offshore Wind Farms, J. Atmos. Ocean. Tech., 27, 1302–1317, 2010. a
Boersma, S., Doekemeijer, B. M., Gebraad, P. M. O., Fleming, P. A., Annoni, J., Scholbrock, A. K., Frederik, J. A., and van Wingerden, J. W.: A tutorial on control-oriented modeling and control of wind farms, American Control Conference (ACC), 24–26 May 2017, Seattle, USA, 1–18, 2017. a
Bossanyi, E. A.: The Design of closed loop controllers for wind turbines, Wind Energy, 3, 149–163, https://doi.org/10.1002/we.34, 2000. a
Campagnolo, F., Petrović, V., Bottasso, C. L., and Croce, A.: Wind tunnel testing of wake control strategies, Proceedings of the American Control Conference (ACC), 6–8 July 2016, Boston, USA 513–518, 2016. a, b
Fleming, P., King, J., Dykes, K., Simley, E., Roadman, J., Scholbrock, A., Murphy, P., Lundquist, J. K., Moriarty, P., Fleming, K., van Dam, J., Bay, C., Mudafort, R., Lopez, H., Skopek, J., Scott, M., Ryan, B., Guernsey, C., and Brake, D.: Initial results from a field campaign of wake steering applied at a commercial wind farm – Part 1, Wind Energ. Sci., 4, 273–285, https://doi.org/10.5194/wes-4-273-2019, 2019. a
Fleming, P. A., Annoni, J., Scholbrock, A. K., Quon, E., Dana, S., Schreck, S., Raach, S., Haizmann, F., and Schlipf, D.: Full-scale field test of wake steering, J. Phys.-Conf. Ser., 854, 012013, https://doi.org/10.1088/1742-6596/854/1/012013, 2017. a
Frederik, J. A., Weber, R., Cacciola, S., Campagnolo, F., Croce, A., Bottasso, C., and van Wingerden, J.-W.: Periodic dynamic induction control of wind farms: proving the potential in simulations and wind tunnel experiments, Wind Energ. Sci., 5, 245–257, https://doi.org/10.5194/wes-5-245-2020, 2020. a, b, c, d, e, f, g, h, i, j, k, l, m
Gebraad, P. M. O., Teeuwisse, F. W., van Wingerden, J. W., Fleming, P. A., Ruben, S. D., Marden, J. R., and Pao, L. Y.: Wind plant power optimization through yaw control using a parametric model for wake effects – a CFD simulation study, Wind Energy, 19, 95–114, 2016. a
Goit, J. P. and Meyers, J.: Optimal control of energy extraction in wind-farm boundary layers, J. Fluid Mech., 768, 5–50, 2015. a, b
Hunt, J., Wray, A., and Moin, P.: Eddies, streams, and convergence zones in turbulent flows, in: Proceedings of the Summer Program (Center for Turbulence Research), December 1988, report CTR-S88, 193–208, 1988. a
Jeon, Y. J., Schneiders, J. F. G., Müller, M., Michaelis, D., and Wieneke, B.: 4D flow field reconstruction from particle tracks by VIC+ with additional constraints and multigrid approximation, Proceedings 18th International Symposium on Flow Visualization, Zurich, Switzerland, 26-29 June, https://doi.org/10.3929/ETHZ-B-000279199, 2018. a, b
Jux, C., Sciacchitano, A., Schneiders, J. F. G., and Scarano, F.: Robotic volumetric PIV of a full-scale cyclist, Exp. Fluids, 59, 74, https://doi.org/10.1007/s00348-018-2524-1, 2018. a
Kanev, S. and Savenije, F.: Active Wake Control: loads trends, Tech. Rep. ECN-E–15-004, Energieonderzoek Centrum Nederland (ECN), https://publications.ecn.nl/E/2015/ECN-E--15-004 (last access: 22 June 2022) 2015. a
Kanev, S., Savenije, F., and Engels, W.: Active wake control: An approach to optimize the lifetime operation of wind farms, Wind Energy, 21, 488–501, 2018. a, b
Kheirabadi, A. and Nagamune, R.: A quantitative review of wind farm control with the objective of wind farm power maximization, J. Wind Eng. Ind. Aerod., 192, 45–73, https://doi.org/10.1016/j.jweia.2019.06.015, 2019. a
Lignarolo, L., Ragni, D., Krishnaswami, C., Chen, Q., Simão Ferreira, C., and van Bussel, G.: Experimental analysis of the wake of a horizontal-axis wind-turbine model, Renew. Energ., 70, 31–46, https://doi.org/10.1016/j.renene.2014.01.020, 2014. a, b, c, d, e
Lignarolo, L. E., Ragni, D., Scarano, F., Simão Ferreira, C. J., and Van Bussel, G. J.: Tip-vortex instability and turbulent mixing in wind-turbine wakes, J. Fluid Mech., 781, 467–493, https://doi.org/10.1017/JFM.2015.470, 2015. a, b
Marten, D., Paschereit, C. O., Huang, X., Meinke, M., Schröder, W., Müller, J., and Oberleithner, K.: Predicting wind turbine wake breakdown using a free vortex wake code, AIAA J., 58, 4672–4685, https://doi.org/10.2514/1.J058308, 2020. a
Munters, W. and Meyers, J.: An optimal control framework for dynamic induction control of wind farms and their interaction with the atmospheric boundary layer, Philos. T. R. Soc. A, 375, 20160100, https://doi.org/10.1098/rsta.2016.0100, 2017. a
Munters, W. and Meyers, J.: Towards practical dynamic induction control of wind farms: analysis of optimally controlled wind-farm boundary layers and sinusoidal induction control of first-row turbines, Wind Energ. Sci., 3, 409–425, https://doi.org/10.5194/wes-3-409-2018, 2018. a, b, c
Rockel, S., Camp, E., Schmidt, J., Peinke, J., Cal, R. B., and Hölling, M.: Experimental study on influence of pitch motion on the wake of a floating wind turbine model, Energies, 7, 1954–1985, https://doi.org/10.3390/en7041954, 2014. a
Santoni, C., Carrasquillo, K., Arenas-Navarro, I., and Leonardi, S.: Effect of tower and nacelle on the flow past a wind turbine, Wind Energy, 20, 1927–1939, https://doi.org/10.1002/WE.2130, 2017. a
Scarano, F., Ghaemi, S., Caridi, G. C. A., Bosbach, J., Dierksheide, U., and Sciacchitano, A.: On the use of helium-filled soap bubbles for large-scale tomographic PIV in wind tunnel experiments, Exp. Fluids, 56, 42, https://doi.org/10.1007/S00348-015-1909-7, 2015. a
Schanz, D., Gesemann, S., and Schröder, A.: Shake-The-Box: Lagrangian particle tracking at high particle image densities, Exp. Fluids, 57, 70, https://doi.org/10.1007/s00348-016-2157-1, 2016. a
Schneiders, J. F. G. and Scarano, F.: Dense velocity reconstruction from tomographic PTV with material derivatives, Exp. Fluids, 57, 139, https://doi.org/10.1007/s00348-016-2225-6, 2016. a, b
Schottler, J., Hölling, A., Peinke, J., and Hölling, M.: Design and implementation of a controllable model wind turbine for experimental studies, J. Phys.-Conf. Ser., 753, 072030, https://doi.org/10.1088/1742-6596/753/7/072030, 2016. a, b, c
Sciacchitano, A. and Scarano, F.: Elimination of PIV light reflections via a temporal high pass filter, Meas. Sci. Technol., 25, 084009, https://doi.org/10.1088/0957-0233/25/8/084009, 2014. a
van der Hoek, D., Kanev, S., Allin, J., Bieniek, D., and Mittelmeier, N.: Effects of axial induction control on wind farm energy production – A field test, Renew. Energ., 140, 994–1003, 2019. a
Vollmer, L., Steinfeld, G., Heinemann, D., and Kühn, M.: Estimating the wake deflection downstream of a wind turbine in different atmospheric stabilities: an LES study, Wind Energ. Sci., 1, 129–141, https://doi.org/10.5194/wes-1-129-2016, 2016. a, b
Wieneke, B.: Volume self-calibration for 3D particle image velocimetry, Exp. Fluids, 45, 549–556, https://doi.org/10.1007/S00348-008-0521-5, 2008. a