the Creative Commons Attribution 4.0 License.
the Creative Commons Attribution 4.0 License.
 | 20 Dec 2022
Lifetime prediction of turbine blades using global precipitation products from satellites
Haichen Zuo
Ásta Hannesdóttir
Abdalmenem Owda
Charlotte Hasager
The growing size of wind turbines leads to extremely high tip speeds when the blades are rotating. The blades are prone to leading edge erosion when raindrops hit the blades at such high speeds, and blade damage will eventually affect the power production until repair or replacement of the blade is performed. Since these actions come with a high cost, it is relevant to estimate the blade lifetime for a given wind farm site prior to wind farm construction. Modeling tools for blade lifetime prediction require input time series of rainfall intensities and wind speeds in addition to a turbine-specific tip speed curve. In this paper, we investigate the suitability of satellite-based precipitation data from the Global Precipitation Measurement (GPM) mission in the context of blade lifetime prediction. We first evaluate satellite-based rainfall intensities from the Integrated Multi-Satellite Retrievals for GPM (IMERG) final product against in situ observations at 18 weather stations located in Germany, Denmark, and Portugal. We then use the satellite and in situ rainfall intensities as input to a model for blade lifetime prediction, together with the wind speeds measured at the stations. We find that blade lifetimes estimated with rainfall intensities from satellites and in situ observations are in good agreement despite the very different nature of the observation methods and the fact that IMERG products have a 30 min temporal resolution, whereas in situ stations deliver 10 min accumulated rainfall intensities. Our results indicate that the wind speed has a large impact on the estimated blade lifetimes. Inland stations show significantly longer blade lifetimes than coastal stations, which are more exposed to high mean wind speeds. One station located in mountainous terrain shows large differences between rainfall intensities and blade lifetimes based on satellite and in situ observations. IMERG rainfall products are known to have a limited accuracy in mountainous terrain. Our analyses also confirm that IMERG overestimates light rainfall and underestimates heavy rainfall. Given that networks of in situ stations have large gaps over the oceans, there is a potential for utilizing rainfall products from satellites to estimate and map blade lifetimes. This is useful as more wind power is installed offshore including floating installations very far from the coast.
- Article
(6679 KB) - Full-text XML
-
Supplement
(427 KB) - BibTeX
- EndNote


Leading edge erosion is a progressive roughening of wind turbine blades primarily caused by the impact of precipitation with the blade movement through the air. The problem has emerged with the growing rotor diameter of modern wind turbines, which leads to higher tip speeds (Keegan et al., 2013). Leading edge erosion is more pronounced offshore than for wind farms on land because offshore turbines are larger, and the steady state wind speed is higher over the ocean. The energy of raindrops impinging on turbine blades is therefore also higher. Blade repair or replacement after only 5–7 years in operation has been reported for several offshore wind farms in the North Sea and the Kattegat Strait (Ibrahim and Medraj, 2020; Herring et al., 2019) even though the nominal lifetime of a turbine blade is typically 20–25 years.
A newly installed turbine blade has an incubation time where little to no damage is detected. Thereafter, initial damage occurs in the form of pitting. Widespread damage will follow, and it can be observed as an erosion of material in the top coating, filler, or substrate. A rough blade has poorer aerodynamic efficiency, and therefore, leading edge roughness can cause a significant loss of the annual wind power production (Bak et al., 2020). It can lead to unforeseen operation and maintenance (O & M) costs and, if untreated, to the replacement of wind turbine blades (Mishnaevsky and Thomsen, 2020). Ideally, repair of the blade is scheduled long before structural damage occurs. O & M costs are exacerbated offshore due to vessel costs, and this contributes to the operational expenditures (OPEX) of a given wind farm. A strategy to mitigate this financial risk is to operate the turbines in a so-called erosion safe mode in which the blade tip speed is reduced during events of heavy precipitation (Bech et al., 2018; Skrzypiński et al., 2020). Another strategy is to enforce the turbine blades in order to make them more resistant to leading edge erosion. Coatings, tapes, and erosion shields represent different forms of leading edge protection that are commercially available (Herring et al., 2019).
In connection with the planning of offshore wind energy projects, it is essential to predict the lifetime of the turbine blades in order to forecast the OPEX budget during the project lifetime. To calculate the lifetime of a wind turbine blade, information about the rainfall intensity and wind speed at the wind turbine location is needed at the highest possible temporal and spatial resolution. The temporal coverage of the rain and wind data sets should ideally be on the order of 10 years to account for intra-annual variabilities (Hasager et al., 2021). A wind turbine tip speed curve is also necessary since the movement of the turbine blade relative to that of the raindrops and the wind direction determines the blade damage.
Networks of rain gauges and rain radars are established on land, typically by national meteorological agencies (Kidd et al., 2017). The rain observations are used for many different applications, e.g., hydrology, agriculture, health, civil protection, and climate change monitoring. In contrast, rain observations over the oceans are very sparse (Herring et al., 2020; Klepp et al., 2020), and rain information in this setting is typically obtained through numerical weather prediction (NWP) modeling or satellite observations (Shaw et al., 2022). Previous blade lifetime analyses are based on rain gauge observations (Bech et al., 2022; Hasager et al., 2020, 2021; Law and Koutsos, 2020; Skrzypiński et al., 2020; Verma et al., 2021b), disdrometer observations (Tilg et al., 2022; Verma et al., 2021a), weather radar observations (Letson et al., 2020), re-analysis data (Prieto and Karlsson, 2021), and mesoscale weather model outputs (Eisenberg et al., 2018; Visbech et al., 2022).
The Global Precipitation Measurement (GPM) mission is a network of satellites delivering global rain observations since 2014 (Hou et al., 2014). It has a core observatory consisting of dual-frequency precipitation radars operating in Ku-band (13.6 GHz) and Ka-band (35.5 GHz), as well as the GPM Microwave Imager, a radiometer operating at different frequencies from 10 to 183 GHz. Many other spaceborne microwave sensors contribute to GPM, and additional observations from infrared sensors on geostationary satellites are included. The GPM mission is an expansion of the Tropical Rainfall Measuring Mission (TRMM), which was in operation during 1997–2015 (Huffmann et al., 2007). Whereas TRMM sensed the heavy rainfall associated within the tropics, GPM also senses the light rain, hail, and snowflakes common to higher latitudes. Here, we hypothesize that rainfall intensities from GPM can also be useful for the prediction of erosion damage on wind turbine blades, especially offshore where other rain observations are limited.
Integrated Multi-Satellite Retrievals for GPM (IMERG) lead to global rain products with a uniform grid spacing of 0.1∘ latitude and longitude from latitude 60∘ N to latitude 60∘ S. The temporal sampling of these products is 30 min. The initial sampling of the different satellite sensors contributing to IMERG can be considerably higher or lower, and therefore, the IMERG validation performance varies for different scales, periods, and locations on Earth (Chen and Li, 2016). IMERG products come in three versions: early, late, and final. The final product is considered the most suitable for scientific applications as it is adjusted based on rain gauge observations from the Global Precipitation Climatology Centre (Huffmann et al., 2020a). Therefore, it compares best with independent in situ observations (Tapiador et al., 2020). Dezfuli et al. (2017) found that the IMERG final product outperforms the previous TRMM Multisatellite Precipitation Analysis. Due to the higher temporal and spatial resolution of IMERG, the product captures mesoscale convective systems much better.
The objective of this paper is to determine whether rainfall intensities obtained from the IMERG final product are suitable for estimating the lifetime of wind turbine blades. The idea of using satellite data for blade lifetime prediction was put forward by Mishnaevsky et al. (2021), and here we test its applicability in practice for the first time. We evaluate the performance of IMERG rainfall intensities with respect to high-quality in situ observations from weather stations. Next, we use the IMERG and in situ observations of the rainfall intensity as input to a damage model code for the prediction of blade lifetimes and compare the two types of lifetime estimates.
A number of independent studies evaluate the performance of IMERG final products for different regions, temporal scales, and applications. Overall, IMERG tends to overestimate light rain intensities and underestimate heavy rain intensities. This can lead to seasonal biases for regions where the rain characteristics vary throughout the year (Bogerd et al., 2021; Maranan et al., 2020; Tapiador et al., 2020). Rios Gaona et al. (2016) performed an early evaluation of the IMERG final product against ground-based rain radar observations in the Netherlands and found that IMERG underestimates countrywide rainfall depths by 2 %.
Based on comparisons with rain gauge data in Brazil, Freitas et al. (2020) reported that the IMERG product is a good source of sub-daily rainfall depth data for hydrological and hydroclimatic applications, but they found large overestimations and underestimations of the IMERG product for rainfall duration and intensity properties, respectively. Cui et al. (2020) focused on mesoscale convective systems in the US and reported that IMERG overestimates the total annual precipitation but underestimates the hourly mean precipitation. They noted that evaporation of light rain under clouds causes frequent falls alarms and positive biases (i.e., IMERG shows precipitation pixels, but no rain is measured at the ground stations). A very high number of false alarms (83 % of all IMERG rain pixels) are also reported by Maranan et al. (2020) for forested areas in Ghana, whereas high rain intensities are negatively biased.
A decomposition according to the source of the IMERG data can give insights into the performance per sensor type. Based on analyses over the eastern United States, Tan et al. (2016) found that the detection of rain events is most reliable for passive microwave sensors or morphed products, whereas infrared sensors alone lead to a poorer performance when it comes to the identification of rain events. Infrared sensors miss a very large portion of the actual rain events measured on the ground. Bogerd et al. (2021) found that false alarm rates are amplified when infrared sensors are included in an analysis over the Netherlands.
For detected rain events, the performance of rain rate estimates also varies from sensor to sensor (Bogerd et al., 2021). For all data sources, the intensity of shallow rainfall is the most challenging to estimate, and work is ongoing to improve the algorithms for the detection and classification of such events (Arulraj and Barros, 2017). Mountainous terrain represents another challenge for accurate rainfall detection from microwave instruments due to rain shadowing (Prakash et al., 2018).
Figure 1 shows the areas of interest for this analysis, which covers 18 meteorological stations in Germany, Denmark, and Portugal.
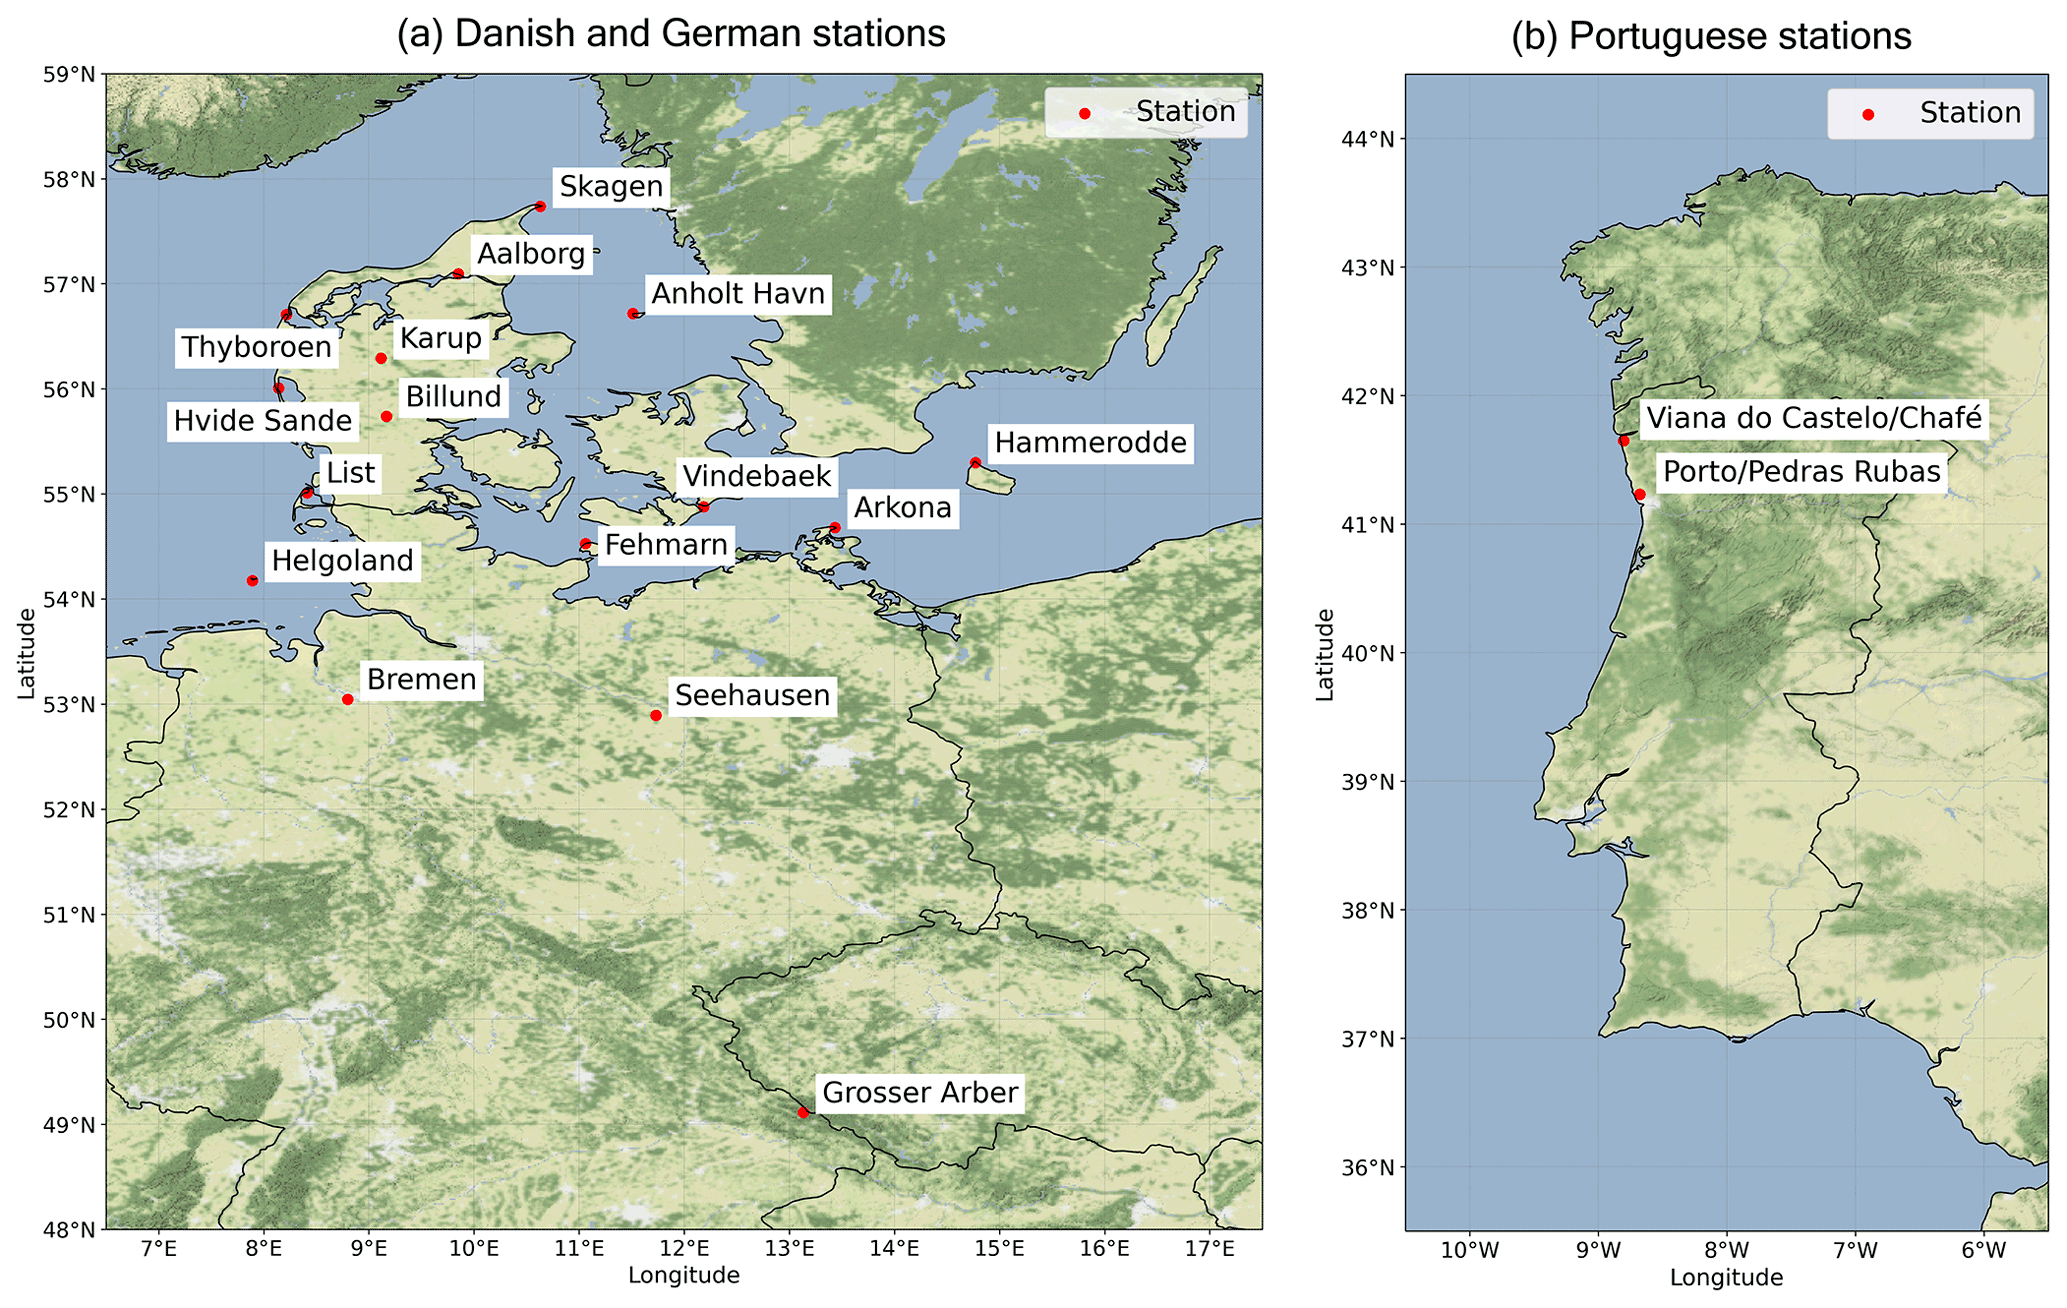
Figure 1Locations of the 18 meteorological stations investigated. (a) Danish and German stations; (b) Portuguese stations (© Stamen Design).
3.1 Satellite observations
Satellite observations of rainfall intensities are obtained from the product called GPM IMERG Final Precipitation L3 Half Hourly V06 (GPM_3IMERGHH) (Huffman et al., 2019). We chose the IMERG final product for the estimation of the turbine blade erosion because it is calibrated with rain gauge measurements. The final product provides more accurate rainfall intensities in regions with gauge information, and it is considered the research-grade product (Huffman et al., 2020b).
We investigated the 6-year period from 2014 to 2019 when collocated IMERG and in situ observations of rainfall intensities are available. GPM data are included in the IMERG final product from mid-March 2014, but thanks to retrospective reprocessing and a TRMM satellite calibrator, it is possible to achieve a consistent product dating back to June 2000 (Huffman et al., 2020b). Our nonparametric tests showed that IMERG data of January 2014 are consistent with the data from the month of January in 2015–2019, so we carried out our analyses for the 6 complete years. We extracted time series of the parameters precipitationCal (i.e., precipitation estimate in millimeters per hour based on multi-satellite with gauge calibration), together with precipitationQualityIndex (i.e., a quality index for the precipitationCal field based on the correlation between the different sensor components contributing to the IMERG products; Huffmann, 2019) and probabilityLiquidPrecipitation (i.e., the probability of liquid precipitation phase in percent) for the IMERG grid cell over each meteorological station.
3.2 In situ observations
We obtained observations of rainfall intensity and wind speed for 12 coastal and 6 inland stations located in Germany (7 stations), Denmark (9 stations), and Portugal (2 stations). The locations of the meteorological stations are shown in Fig. 1. The German data series was obtained from the German Weather Service (DWD), the Danish data series was obtained from the Danish Meteorological Institute (DMI), and the Portuguese data series was obtained from the Portuguese Institute for Sea and Atmosphere (IPMA). The German and Danish stations have been used in previous works by Bech et al. (2022) and Hasager et al. (2021), where detailed descriptions of the data sets are given.
Rainfall intensities are measured by rain gauges at each meteorological station, and quality control is performed; see Hasager et al. (2020, 2021) for details. The rainfall intensities are delivered as 10 min cumulative values. In order to match the temporal resolution of the rainfall intensities from IMERG, we calculated the cumulative values over 30 min intervals. Wind speeds and directions at the meteorological stations are observed at a measurement height of 10 m except at Grosser Arber and Seehausen where winds are measured at a 15 m height and at Arkona where the measurement height is 24 m. We extrapolated the wind speeds to the hub height of the IEA 15 MW turbine (Gaertner et al., 2020) using the wind profile power law with the alpha exponent of 0.143, following Hsu et al. (1994). The same method is applied in Bech et al. (2022) and Hasager et al. (2021). To collocate the in situ observations with the IMERG product in time, we averaged the 10 min wind speeds and directions to 30 min intervals.
4.1 Data pre-processing
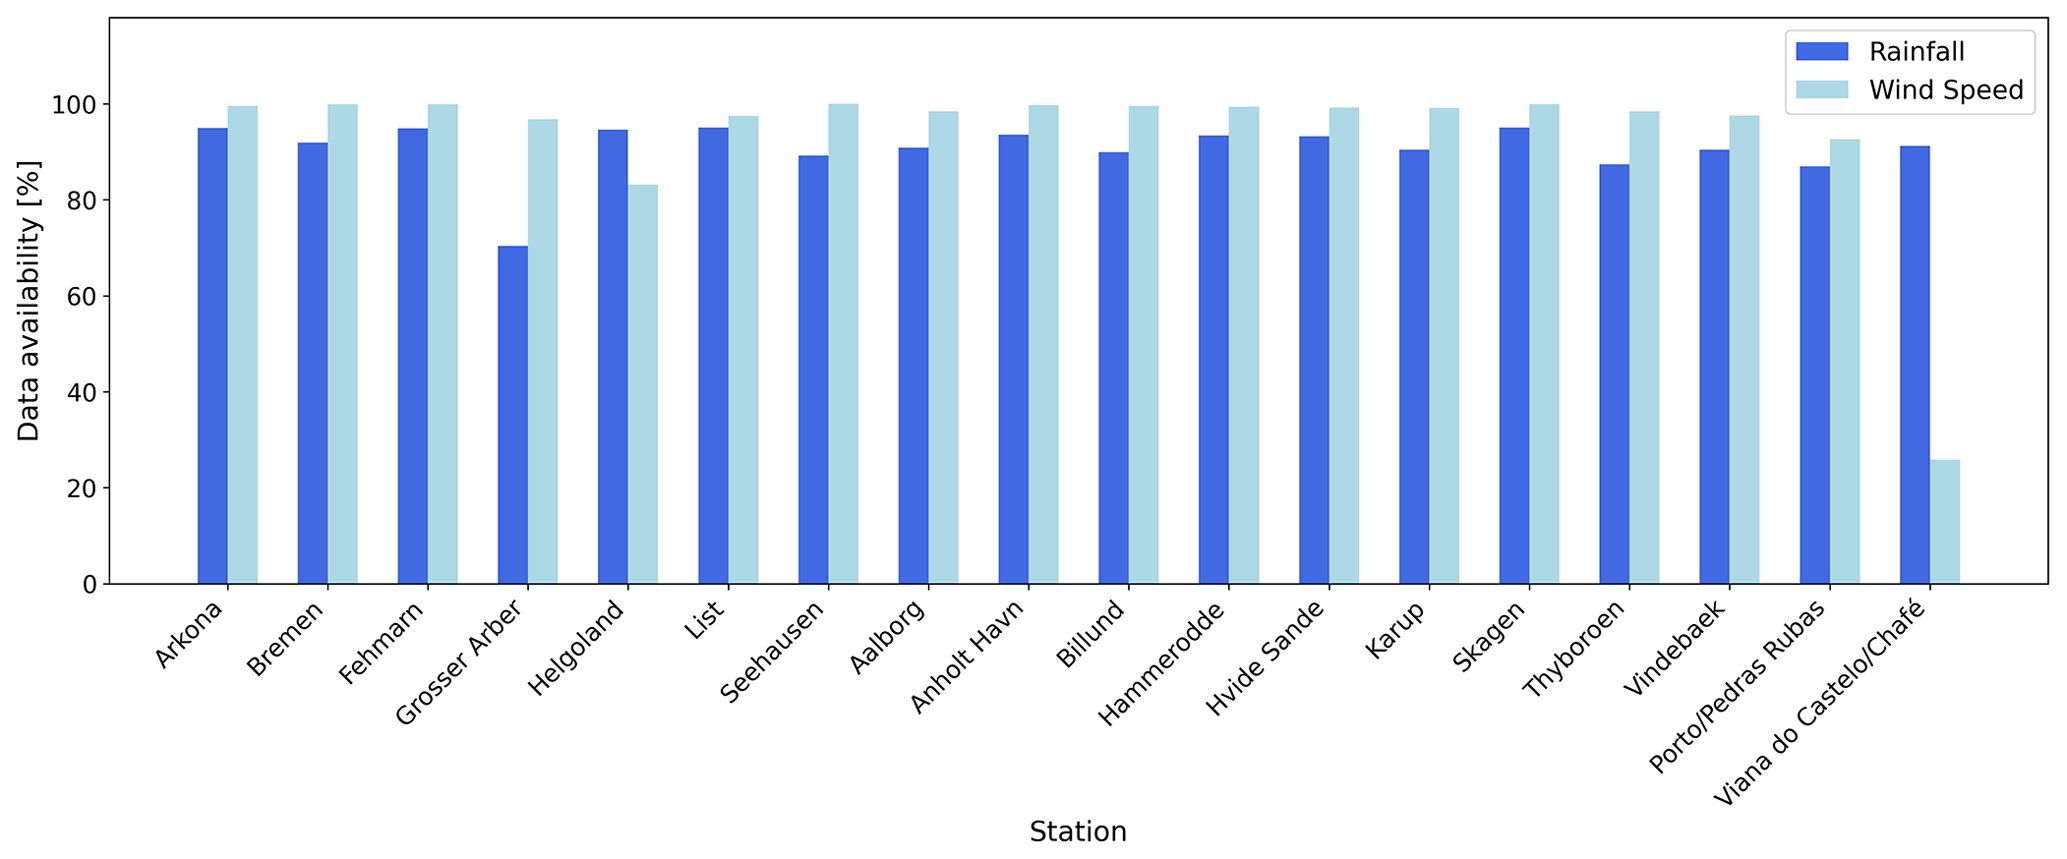
For the IMERG product, we removed precipitationCal data whenever precipitationQualityIndex was smaller than 0.4 because of a high uncertainty due to significant infrared contribution to ensure a sufficient data quality (Huffman et al., 2019). We only considered the impact of rain on wind turbine blades, so instances where solid precipitation (hail, sleet, and snow) occurs are filtered out. We kept values if the parameter probabilityLiquidPrecipitation was larger than 75 %. Empirically, the threshold to classify precipitation as rainfall or snow is 50 % (Xiong et al., 2022). We increased the threshold to 75 % to exclude other solid types such as hail and graupel and to make the proportion of liquid precipitation samples for IMERG and for in situ alike. Solid precipitation was also removed from the in situ data set. Additionally, only the precipitationCal values equal to or greater than 0.2 mm h−1 (0.1 mm/30 min) were considered as rainfall (Maranan et al., 2020). After quality control, we converted the IMERG data to half-hourly accumulated rainfall. The availability of collocated data for blade erosion estimation is shown in Fig. 2.
4.2 IMERG data evaluation
We evaluated the data quality of the IMERG product by comparing it with in situ measurements. Referring to the existing established statistics (Bogerd et al., 2021), the relative bias (RB), mean absolute error (MAE), and normalized MAE (NMAE) were calculated for each station based on Eqs. (1)–(3):
where RIMERG,i and RIn situ,i are the 30 min rainfall accumulation for the IMERG product and in situ measurements, respectively, and n is the sample size over the whole study period or corresponding to a certain condition, such as rainfall intensity.
Contingency metrics, including the probability of detection (POD) and the probability of false alarm (POFA), were also quantified based on Eqs. (4) and (5) (Bogerd et al., 2021):
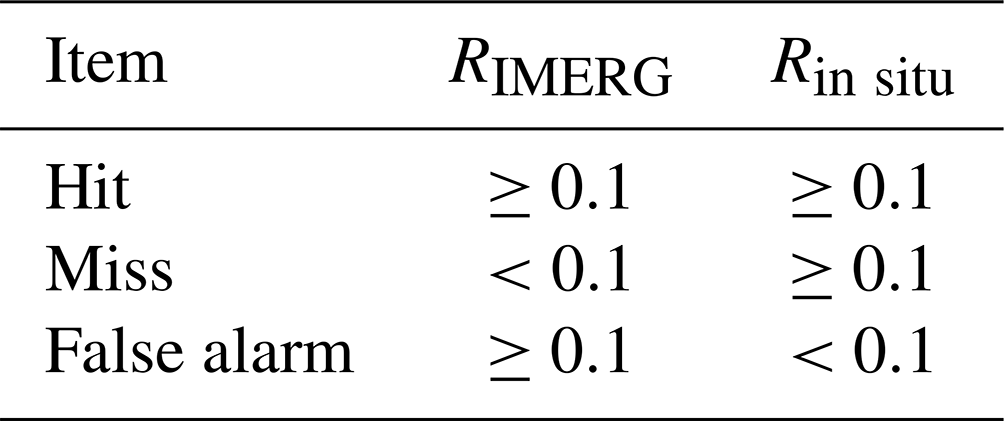
where “hits”, “misses”, and “false alarms” are defined in Table 1. The threshold to distinguish whether there is rainfall during a 30 min interval is 0.1 mm.
Table 1Definition of thresholds for “hit”, “miss”, and “false alarm” (mm per 30 min).
In addition to the overall comparisons, the temporal variability in rainfall intensities was also assessed. Correlation coefficients (R) based on daily rainfall between the two measurement systems were calculated for each country according to Eq. (6):
where RIMERG-d,i and RIn situ-d,i are the daily rainfall for the IMERG product and ground-based measurements, respectively, and are the mean daily rainfall of a country for the IMERG product and ground-based measurements, respectively, i is the index of a daily data sample, and n is the total number of daily data samples during the study period. The monthly and annual variations in both rainfall intensity and wind speed over the whole study period were also quantified for each station.
To investigate the performance of IMERG under different rainfall intensities, we classify the rain rate into three categories according to the United Kingdom Meteorological Office standard (Met Office, 2012): slight (<0.5 mm h−1), moderate (0.5–4 mm h−1), and heavy (≥4 mm h−1) (Met Office, 2012). For each category, the relative bias (RB) of each station is quantified according to Eq. (1).
4.3 Blade lifetime model
The impingement blade lifetime model developed by Bech et al. (2022) using the soft-sign fit for the rain droplet sizes was used to estimate blade lifetimes at each of the stations. The model is based on the correlation between the droplet size of impinging rain and the damage to turbine blades. The correlation is found from extensive tests of a specimen in a rain erosion test (RET) rig spun with several speeds and with four different droplet sizes. The rain erosion testing is done with a specimen with topcoat polyurethane based on glass fiber. The droplet sizes are 0.76, 1.90, 2.38, and 3.50 mm, and the impact speeds range from 90 to 150 m s−1. For each data set, the damage progression is observed from photographs and visual inspection. The observations are plotted in diagrams with impingement and impact speed, and the best-fit empirical curves are established (VH curves: V for velocity, H for impingement). The slopes of the curves are steeper for the larger droplets than for the smaller droplets. This corresponds to an increasing exponent of the fitted power law. The result of the analysis is a droplet-size-dependent empirical model for impingement to damage as a function of the impact velocity. The increasing slope with increasing droplet size reveals that larger droplets result in shorter erosion life at lower velocities relevant for wind turbine rotors. The impingement blade lifetime prediction model for site-specific conditions is an empirical damage accumulation model with drop-size-dependent VH curves. Thus, the impingement model is sensitive to the wind turbine tip speed, the rainfall intensity, and the droplet size. It should be noted that other coating systems might give other lifetimes dependent upon their properties and response to impacting speed, rain intensity, and droplet size. We assumed that an IEA 15 MW turbine is installed at each of the in situ stations, and we predicted the lifetime of its blade. The rainfall intensity is observed by IMERG and in situ stations, with both data sets used as input, together with the in situ wind speed. Wind speeds were extrapolated to the hub height of the IEA 15 MW wind turbine (150 m) and converted to tip speeds. The median drop size was estimated from the function of Best (1950) using the rainfall intensities from IMERG and the in situ observations. The model output is a lifetime in years for the blades on the theoretical 15 MW turbine.
5.1 IMERG data evaluation
In the following, we present the results of comparing the IMERG final product against in situ observations at the 18 stations located in Germany, Denmark, and Portugal.
5.1.1 Overall comparison of IMERG and in situ rainfall intensities
Figure 3 illustrates the average rainfall over 30 min from IMERG and in situ observations, and Table 2 shows the comparative statistics calculated for the “hits” (i.e., times when both IMERG and the in situ stations show rainfall). The average rainfall intensities from IMERG are higher than the observed values for all stations except for Grosser Arber in Germany. Subsequently, we find positive RB values for 17 stations. Grosser Arber is the only station in our data set which is located far inland and in mountainous terrain, and these could be the reasons why it deviates from the other stations. MAE ranges from 0.7 to 1.3 mm. Considering that the mean rainfall per station is on the same order of magnitude, this MAE is high, as also reflected in the NMAE values ranging from 0.8 to 1.5. Our findings are similar to those reported by Bogerd et al. (2021) for the Netherlands.
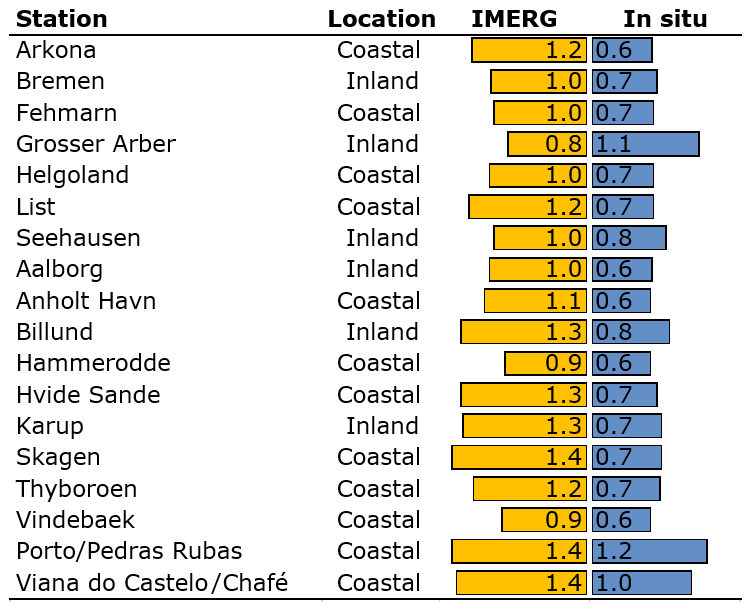
Figure 3Comparisons between the IMERG and in situ observations of the average rainfall (mm) during 30 min periods in 2014–2019.
Table 2Overall comparative statistics between the IMERG and in situ observations of the average accumulated rainfall (mm) during 30 min periods in 2014–2019. RB is the relative bias, MAE is the mean absolute error, NMAE is the normalized mean absolute error, POD is the probability of detection, and POFA is the probability of false alarms.
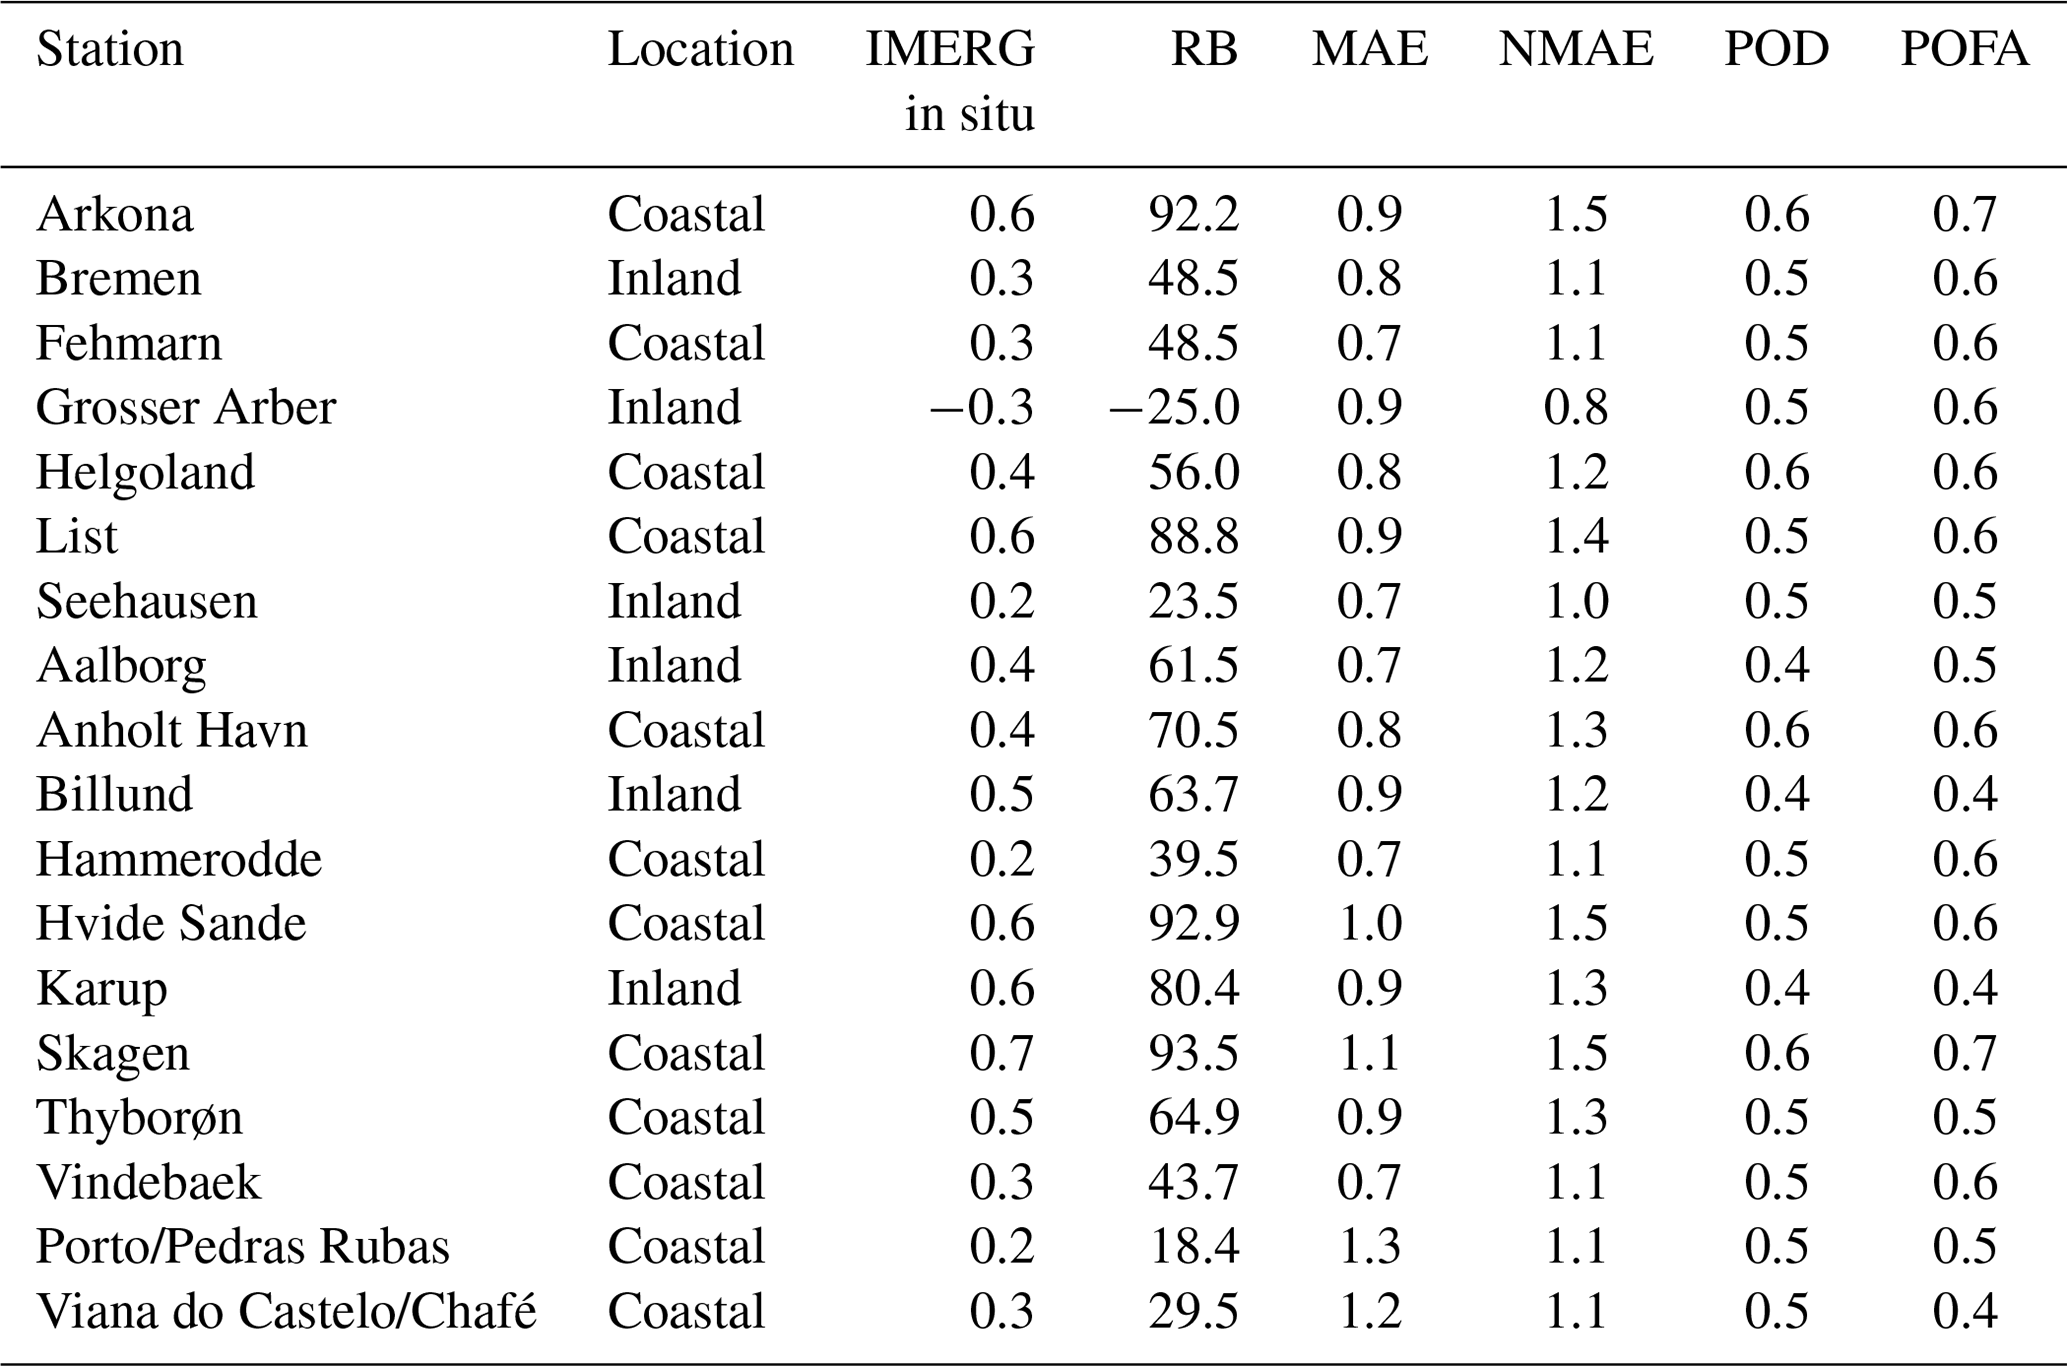
The metric POD is an expression of the number of hits relative to all hits and misses. It would have the value 1 if all rain events observed at the in situ stations were detected correctly by IMERG. For the stations investigated here, POD lies within the range of 0.4–0.6. POFA, on the other hand, expresses the number of false alarms relative to all hits and false alarms. It would have the value 0 if all rain events detected by IMERG were also observed by the in situ stations. POFA lies within the range 0.4–0.7 in our analysis. POD and POFA are well correlated (R2=0.82), so stations with a high POD also show a high POFA.
5.1.2 Temporal variability in rainfall intensities
To obtain a deeper understanding of the statistics presented above, we examined the temporal variability in the rainfall intensities detected from IMERG and the in situ stations. We considered the daily, monthly, and annual variability in the rainfall intensities.
Daily variability
Figure 4 shows hexbin plots of the daily accumulated rainfall values from IMERG vs. in situ observations for the period 2014–2019. We separated the German, Danish, and Portuguese stations since the in situ data originate from national weather services in each respective country, and the procedures for quality control and filtering may vary between these agencies. Further, the climatic conditions may vary from country to country. All three plots show a clear linear relationship between IMERG and in situ rainfall intensities with a positive intercept, which is a direct consequence of the positive RB values presented in Table 2. We also notice a number of outliers in each plot where the IMERG data set shows extremely high rainfall intensities which do not occur in the in situ data set, and vice versa.
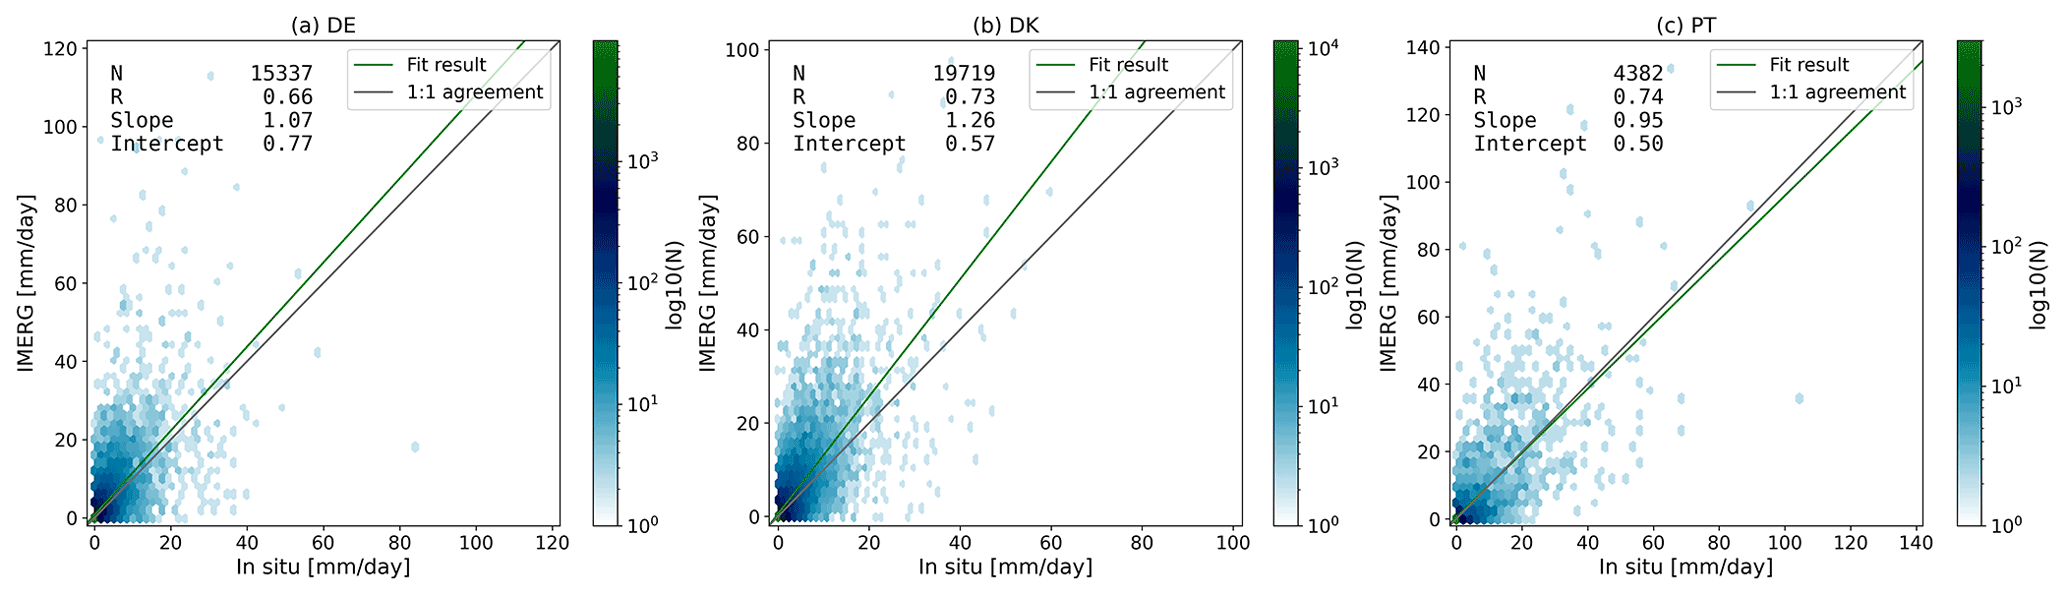
Figure 4Hexbin plots showing the daily rainfall intensities from IMERG vs. the in situ observations during the period 2014–2019 for (a) German stations, (b) Danish stations, and (c) Portuguese stations. The color of each hexagon indicates the number of samples in it.
Figure 5 shows a time series of the daily rainfall intensities per station for the example year 2019. The overall impression is that peaks in the time series from IMERG mostly coincide with peaks measured at the in situ stations. This indicates, once again, that rainy days are detected from both time series. In the case the rainfall on a given day falls in different 30 min periods for IMERG and the in situ stations, it will contribute to the POD and POFA statistics given above. The magnitude of some of the peaks is shown to be very different between the two data sets. The time series from Arkona, Porto/Pedras Rubas, and Viana do Castelo/Chafé show occasional spikes where the rainfall intensity from IMERG exceeds 80 mm. These high rates are not reflected in the in situ observations. At Porto/Pedras Rubas we see examples of rainfall events exceeding 80 mm in the in situ data where the IMERG data show more moderate intensities.
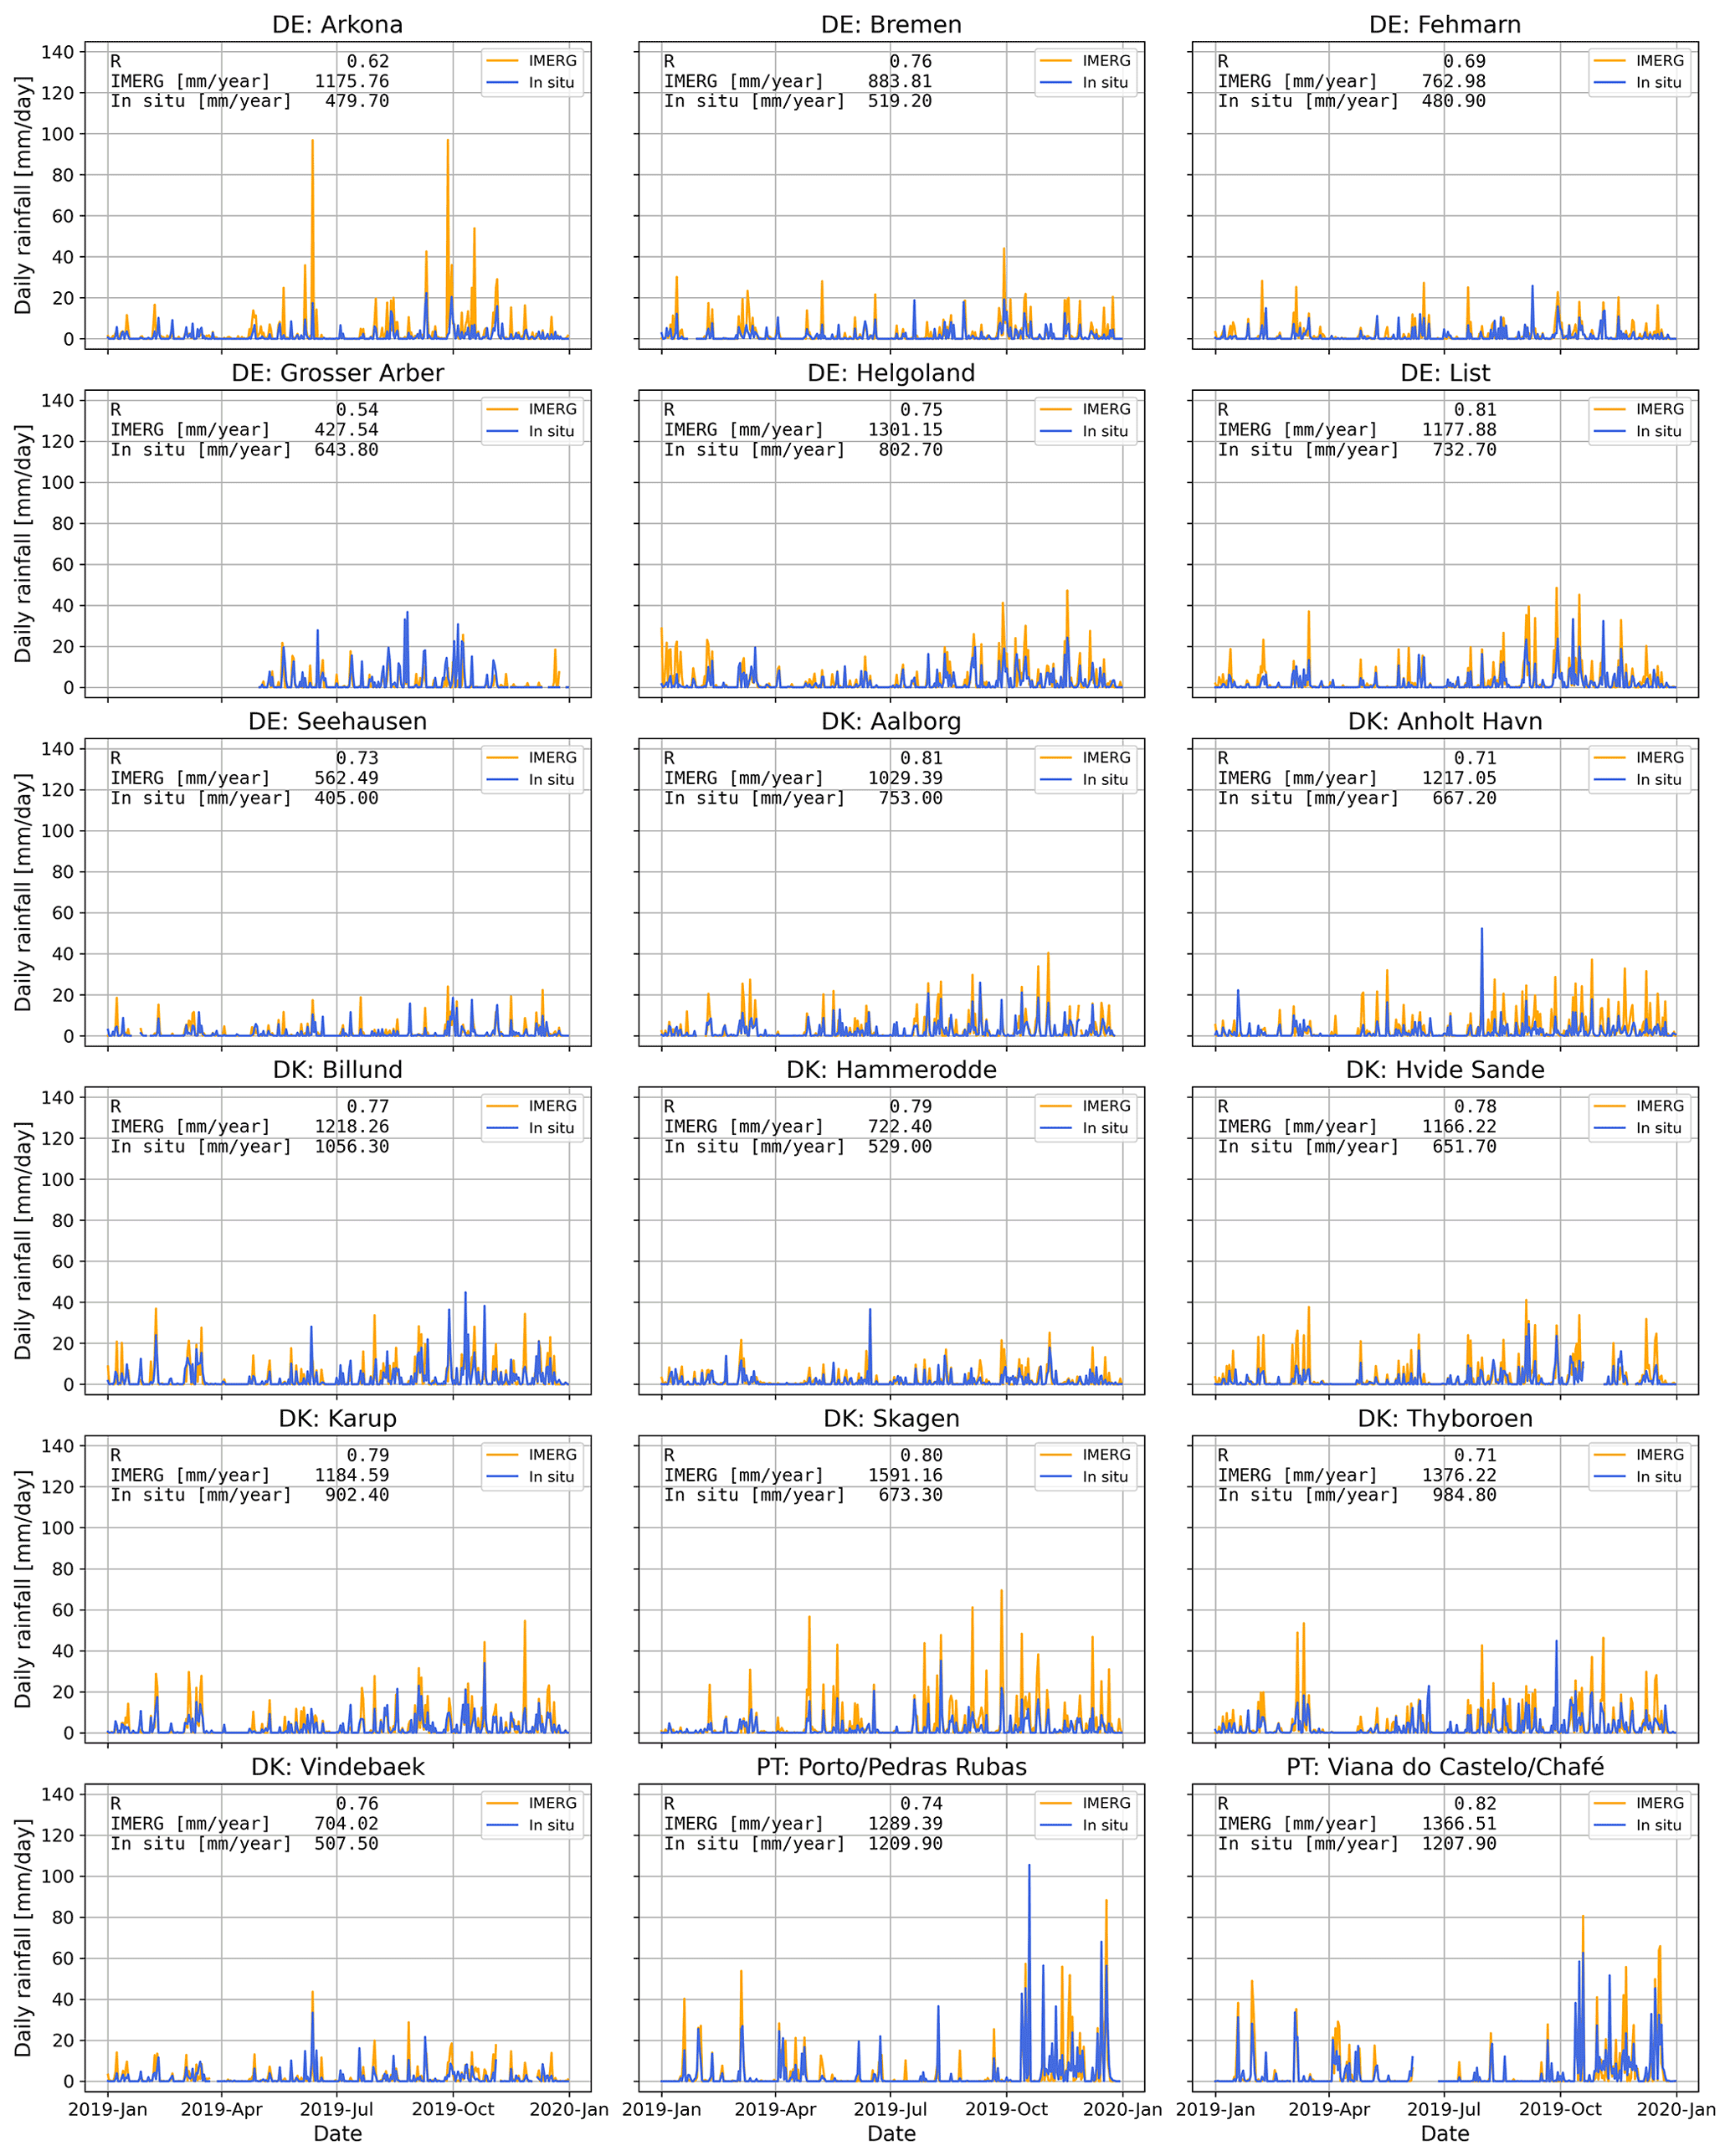
Figure 5Daily rainfall intensities from IMERG and in situ observations during the example year 2019 for the 18 stations investigated.
Monthly variability
Figure 6 shows accumulated monthly rainfall intensities and monthly mean wind speeds per station averaged over 2014–2019. Overall, the rain gauges in Germany and Denmark show the highest rainfall intensities during the summer months with peaks in July, August, or September and often with a secondary maximum during the winter months. At the two Portuguese stations, in contrast, the summer is very dry, and the rainfall intensities peak in November.
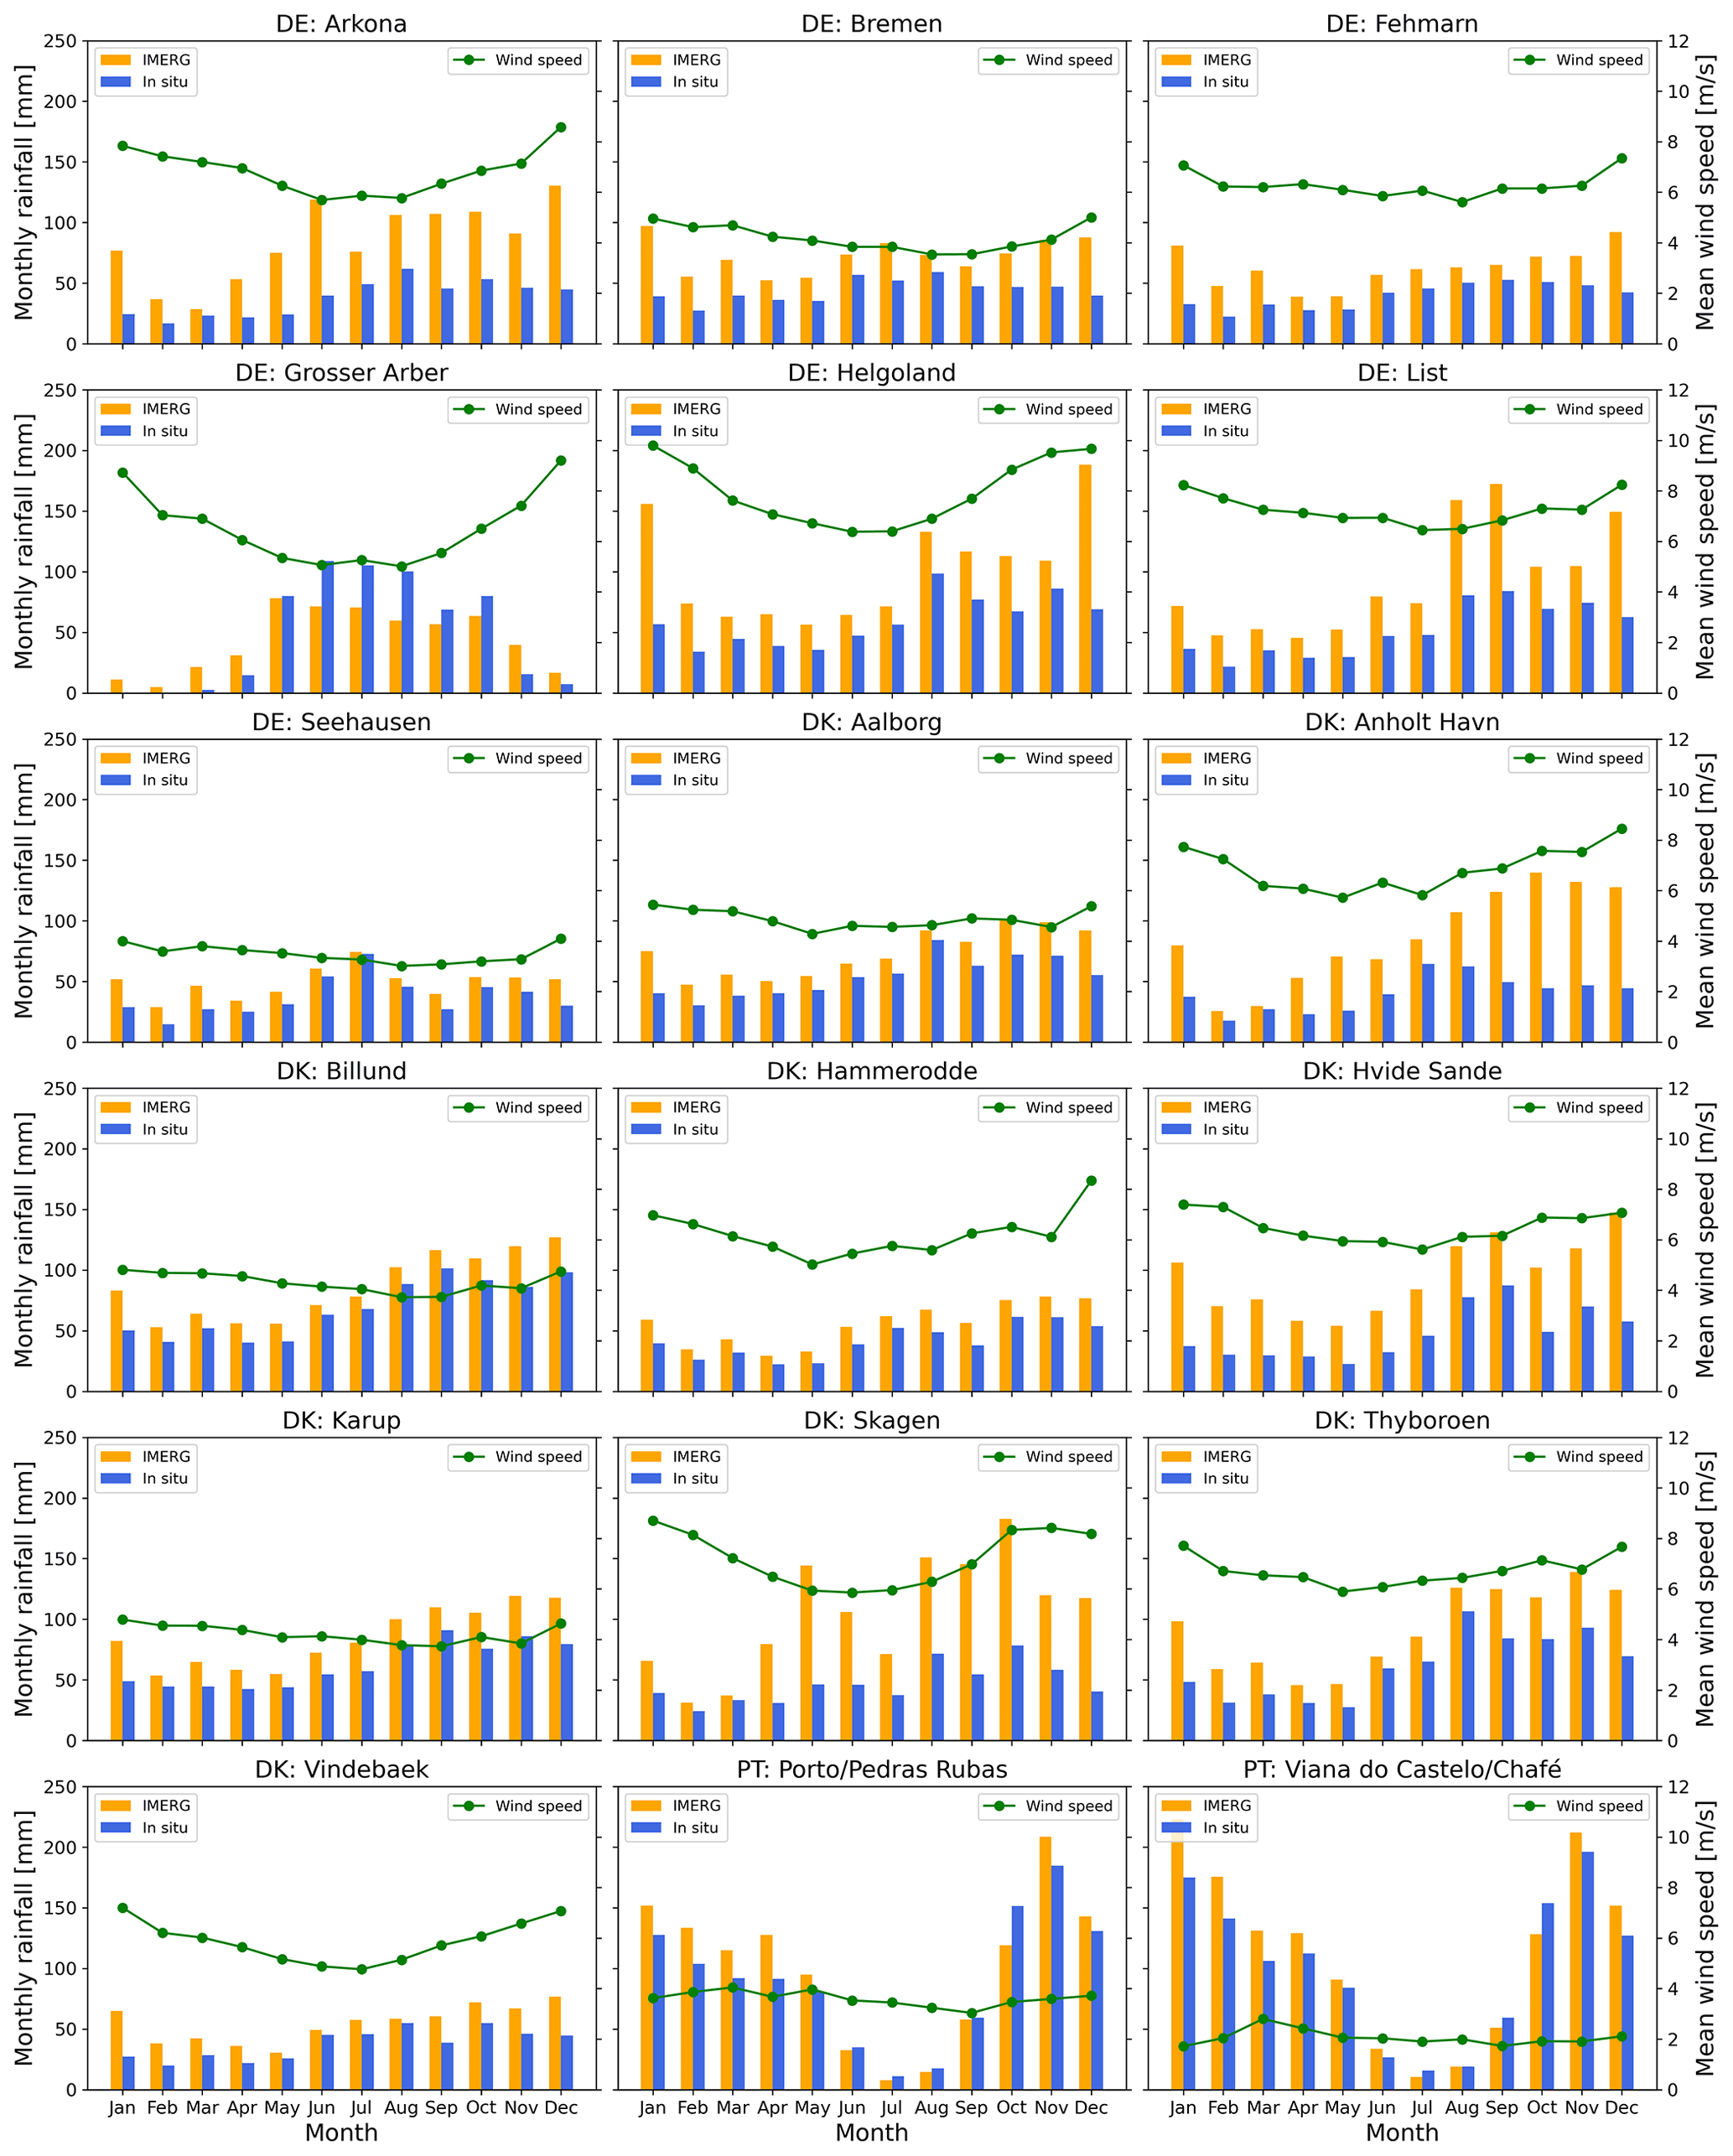
Figure 6Monthly rainfall from IMERG and in situ observations (bars) and monthly mean wind speeds from in situ observations (green curves) averaged over 2014–2019 for the 18 stations investigated.
From Fig. 6 it is also evident that there can be large differences between the monthly rainfall from IMERG and the in situ stations. IMERG overestimates the monthly rainfall with respect to the in situ observations at all stations except for Grosser Arber and the two Portuguese stations. At these stations, the in situ observations show higher monthly rainfall intensities than IMERG for certain months during June to October. The differences between IMERG and in situ rainfall vary throughout the year and are most likely related to the dominant type of rain at a given time of the year (Bogerd et al., 2021). We find the largest discrepancies between IMERG and in situ rainfall for the stations Arkona, Helgoland, List, Anholt Havn, Hvide Sande, and Skagen. These stations are all within close proximity to the coast, and several of the stations also showed large peaks in the time series in Fig. 5.
Most of the German and Danish stations show the highest mean wind speeds in the winter months, especially in December and January. The monthly wind speed variation is most pronounced for stations near the coast (Arkona, Fehmarn, Helgoland, List, Anholt Havn, Hammerodde, Hvide Sande, Skagen, and Thyborøn), whereas the monthly mean wind speeds observed at the inland stations are lower and more uniform throughout the year. The inland station Grosser Arber is an exception as it shows a similar monthly wind speed distribution to the coastal stations. The reason for this deviation could be that Grosser Arber is located in mountainous terrain, so the wind speed observations are influenced by topography. The two stations in Portugal show low mean wind speeds (2–4 m s−1) throughout the year, so the wind climate is significantly different from that of the German and Danish stations.
Interannual variability
Figure 7 shows the average annual rainfall for the 18 stations, and Fig. 8 shows the annual rainfall per year, together with the annual mean wind speed. The annual rainfall intensities reflect the findings for daily and monthly timescales: at 16 stations, IMERG rainfall intensities exceed the intensities observed on the ground during all the 6 years investigated. At Grosser Arber, we find that the highest rainfall intensities are observed at the in situ stations for four of the years (2014, 2016, 2018, 2019), whereas IMERG rainfall intensities are higher during 2015 and 2017. Viana do Castelo in Portugal shows a higher rainfall intensity from the in situ measurements during 2015, but for the other years, IMERG shows the highest intensities.

Figure 7Average annual rainfall (mm) during 2014–2019 from IMERG and in situ observations for the 18 stations investigated.
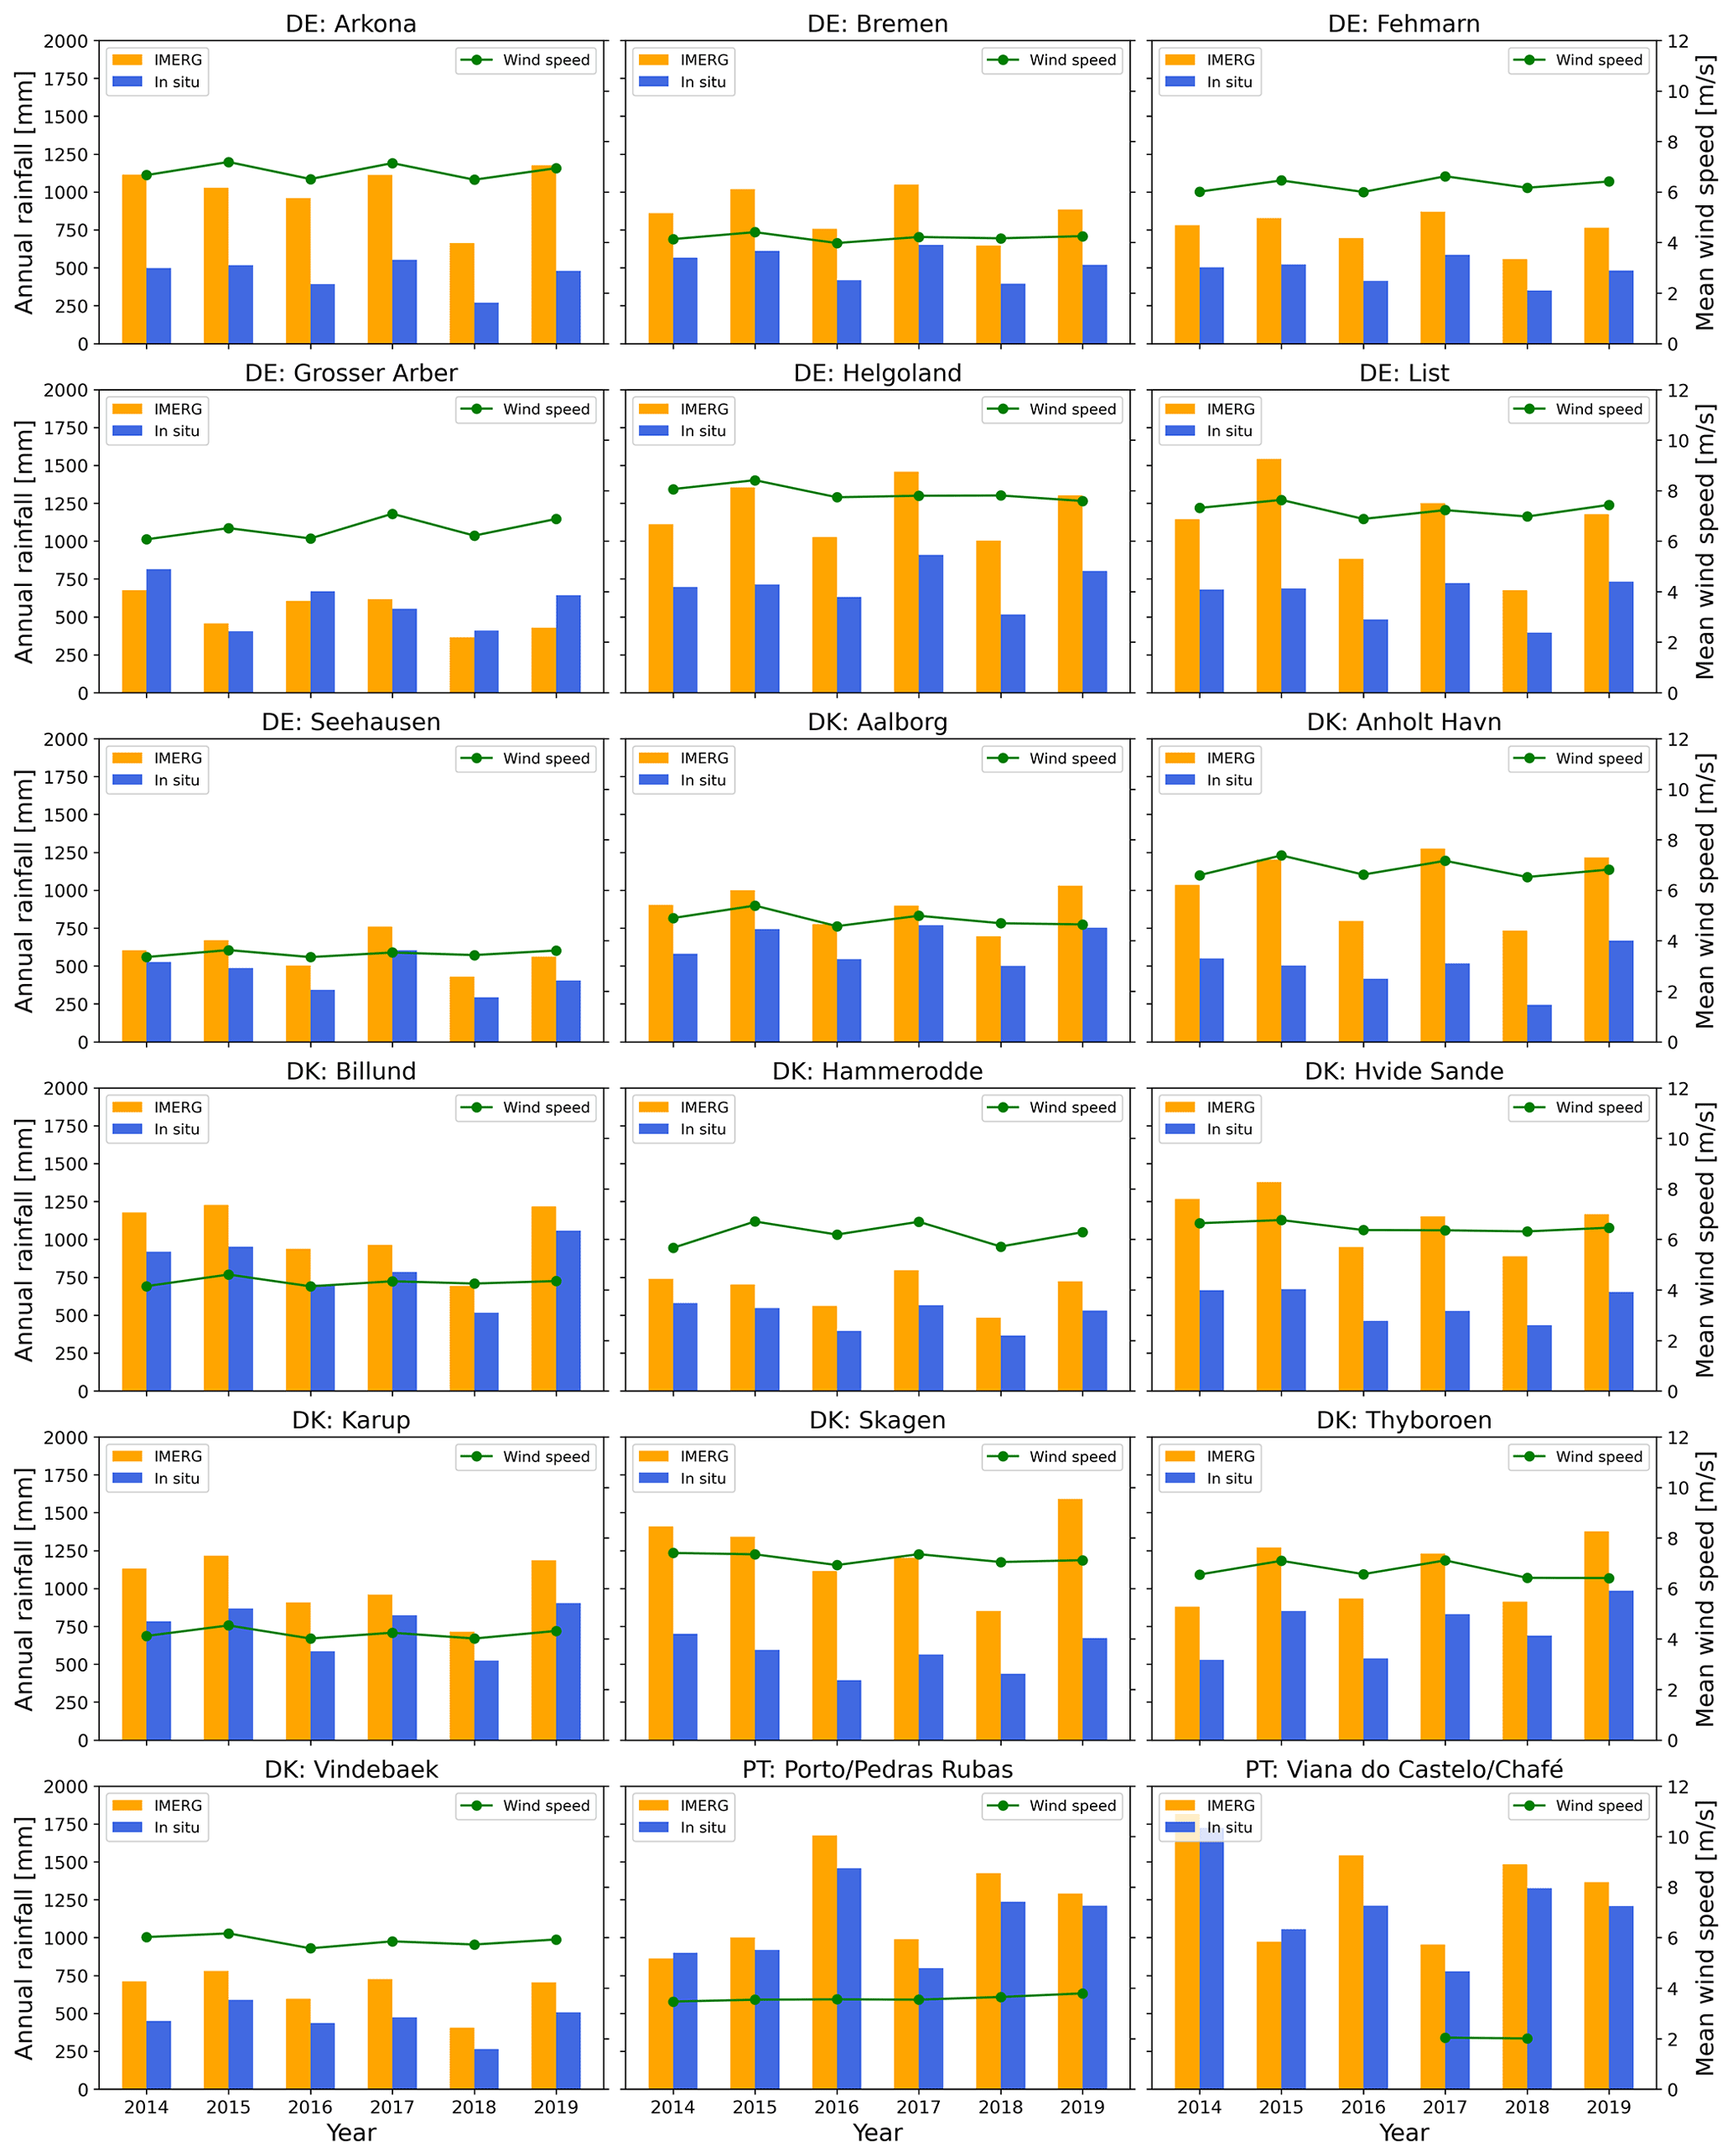
Figure 8Annual rainfall from IMERG and in situ observations (bars) and annual mean wind speeds from in situ observations (green curves) during the period 2014–2019 for the 18 stations investigated.
Figure 8 also shows that fluctuations in the mean wind speed from year to year are limited during 2014–2019. Mean wind speeds exceeding 6 m s−1 are found for stations located near the coast (Arkona, Fehmarn, Helgoland, List, Anholt Havn, Hammerodde, Hvide Sande, Skagen, and Thyborøn), whereas inland stations show lower mean wind speeds on the order of 4–6 m s−1. Grosser Arber is again an exception as the mean wind speed here is 6–8 m s−1. This is most likely due to the higher elevation of the station.
5.1.3 Bias of the rainfall intensity according to precipitation type
Relative biases (RB) on rainfall intensities for different precipitation types (i.e., slight, moderate, and heavy) are given in Fig. 9. The figure shows that IMERG overestimates rainfall at slight and moderate intensities for all stations except for Grosser Arber, whereas rainfall at high intensities is underestimated for all stations except for Skagen. This finding is well aligned with the literature (Bogerd et al., 2021; Maranan et al., 2020; Tapiador et al., 2020) and also with the monthly distributions of rainfall presented in Fig. 6.
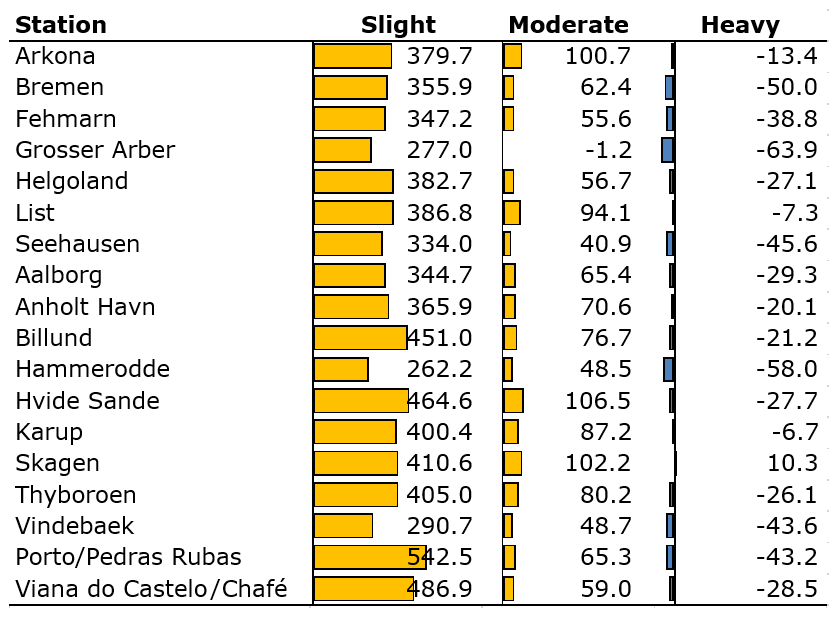
Figure 9Relative biases (RBs) of the rainfall intensity (mm) for different categories of precipitation (Met Office, 2012): slight (<0.5 mm h−1), moderate (0.5–4 mm h−1), and heavy (≥4 mm h−1). The orange color indicates overestimation and the blue color underestimation of rainfall intensities by IMERG with respect to the in situ stations.
5.2 Blade lifetime estimates
In the following, we present the blade lifetimes estimated with input rainfall intensities from IMERG and the in situ stations, respectively. One of the 18 stations investigated, Viana do Castelo in Portugal, is left out of this analysis because the data availability of wind speeds at the station is only 24 %, whereas the other stations have a data availability of 70 %–95 % (Fig. 2).
Figure 10 shows the expected average blade lifetimes in years per station calculated with input rainfall from IMERG and the in situ stations. Overall, we see a good agreement between estimates based on IMERG and in situ rainfall intensities. Biases between the estimates based on IMERG and in situ rainfall are positive for eight stations and negative for seven stations. Seven of the stations show lifetimes deviating by less than 1 year for the IMERG and in situ inputs. The other stations show deviations up to 30 %, and the deviation for Grosser Arber is exceptionally high (approximately 100 %) as the lifetime estimates from IMERG and in situ data are 11.2 and 5.6 years, respectively. This deviation might be due to challenges associated with microwave sensing and rain shadowing in mountainous terrain (see Sect. 2 and Prakash et al., 2018).
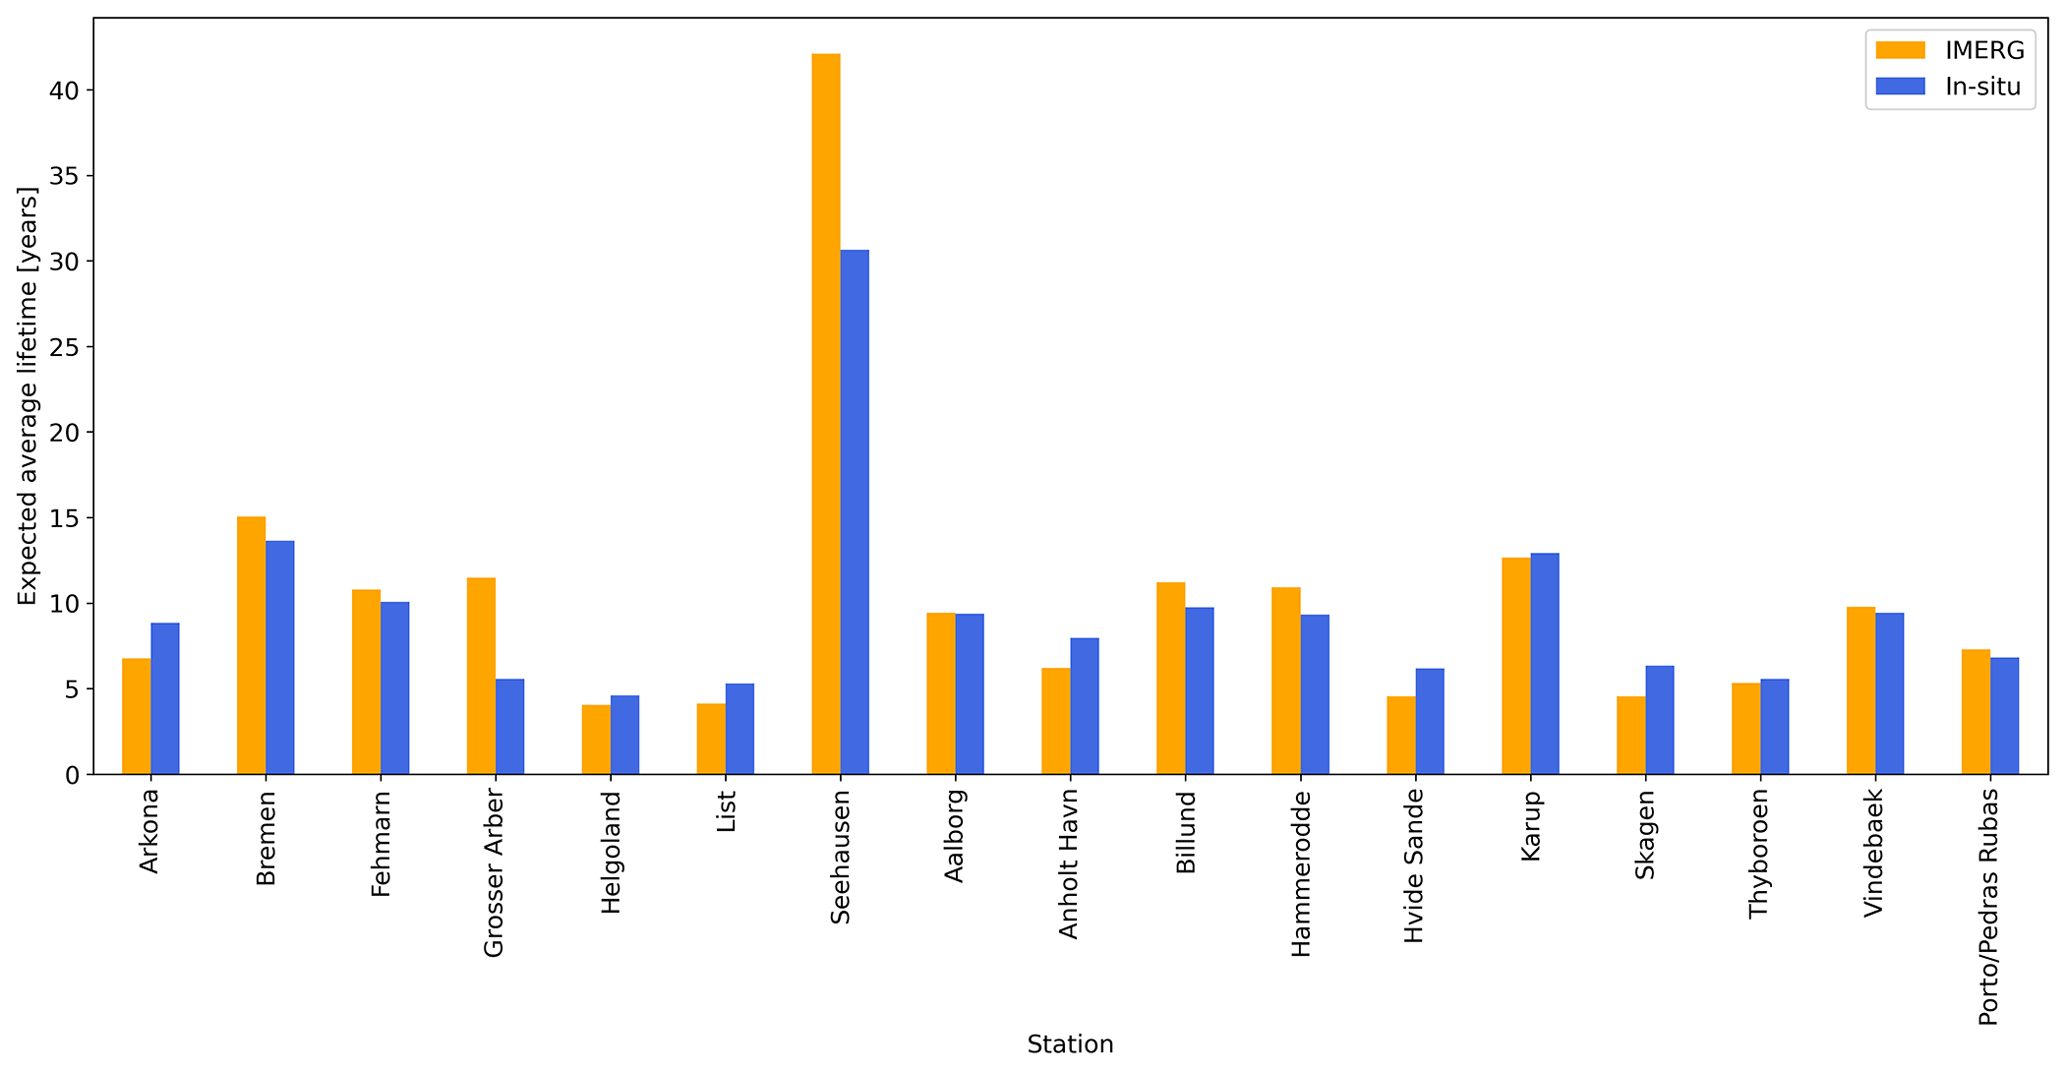
Figure 10Blade lifetimes estimated using 30 min accumulated rainfall intensities from IMERG and the in situ stations. Note that the Portuguese station Viana do Castelo/Chafé is left out due to a limited wind data availability.
The station Seehausen shows much longer lifetimes than the other stations (44.5 years from IMERG and 35.5 years from in situ observations; see Fig. 10). This can be attributed to the relatively low rainfall intensities in combination with low mean wind speeds throughout the year at this location. Two other inland stations, Bremen and Karup, also show blade lifetimes exceeding 10 years based on the in situ observations. Overall, the estimated blade lifetimes tend to be longer for inland stations compared to stations near the coast, and Grosser Arber is again an exception from this pattern. Recent work by Bech et al. (2022) supports these findings.
Rainfall intensities from IMERG are given as 30 min accumulated values, and we have created similar accumulated values from the in situ observations, whereas previous analyses over the same sites are based on the native 10 min observations from the in situ observations (Bech et al., 2022). In order to test the sensitivity of blade lifetime estimates to the temporal resolution of the input rainfall intensities, we compare the estimated blade lifetimes based on 10 min in situ observations with the lifetimes calculated with 30 min accumulated rainfall. The outcome is shown in Fig. 11, which indicates that the effect of accumulating the rainfall intensities to 30 min values instead of using the native 10 min values is small, i.e., ranging from −6 % to 5 % and in absolute values from −0.4 to 0.7 years. This is excluding Seehausen. At Seehausen the lifetime is very long, and when we estimate lifetimes much longer than the length of our time series, the uncertainty increases.
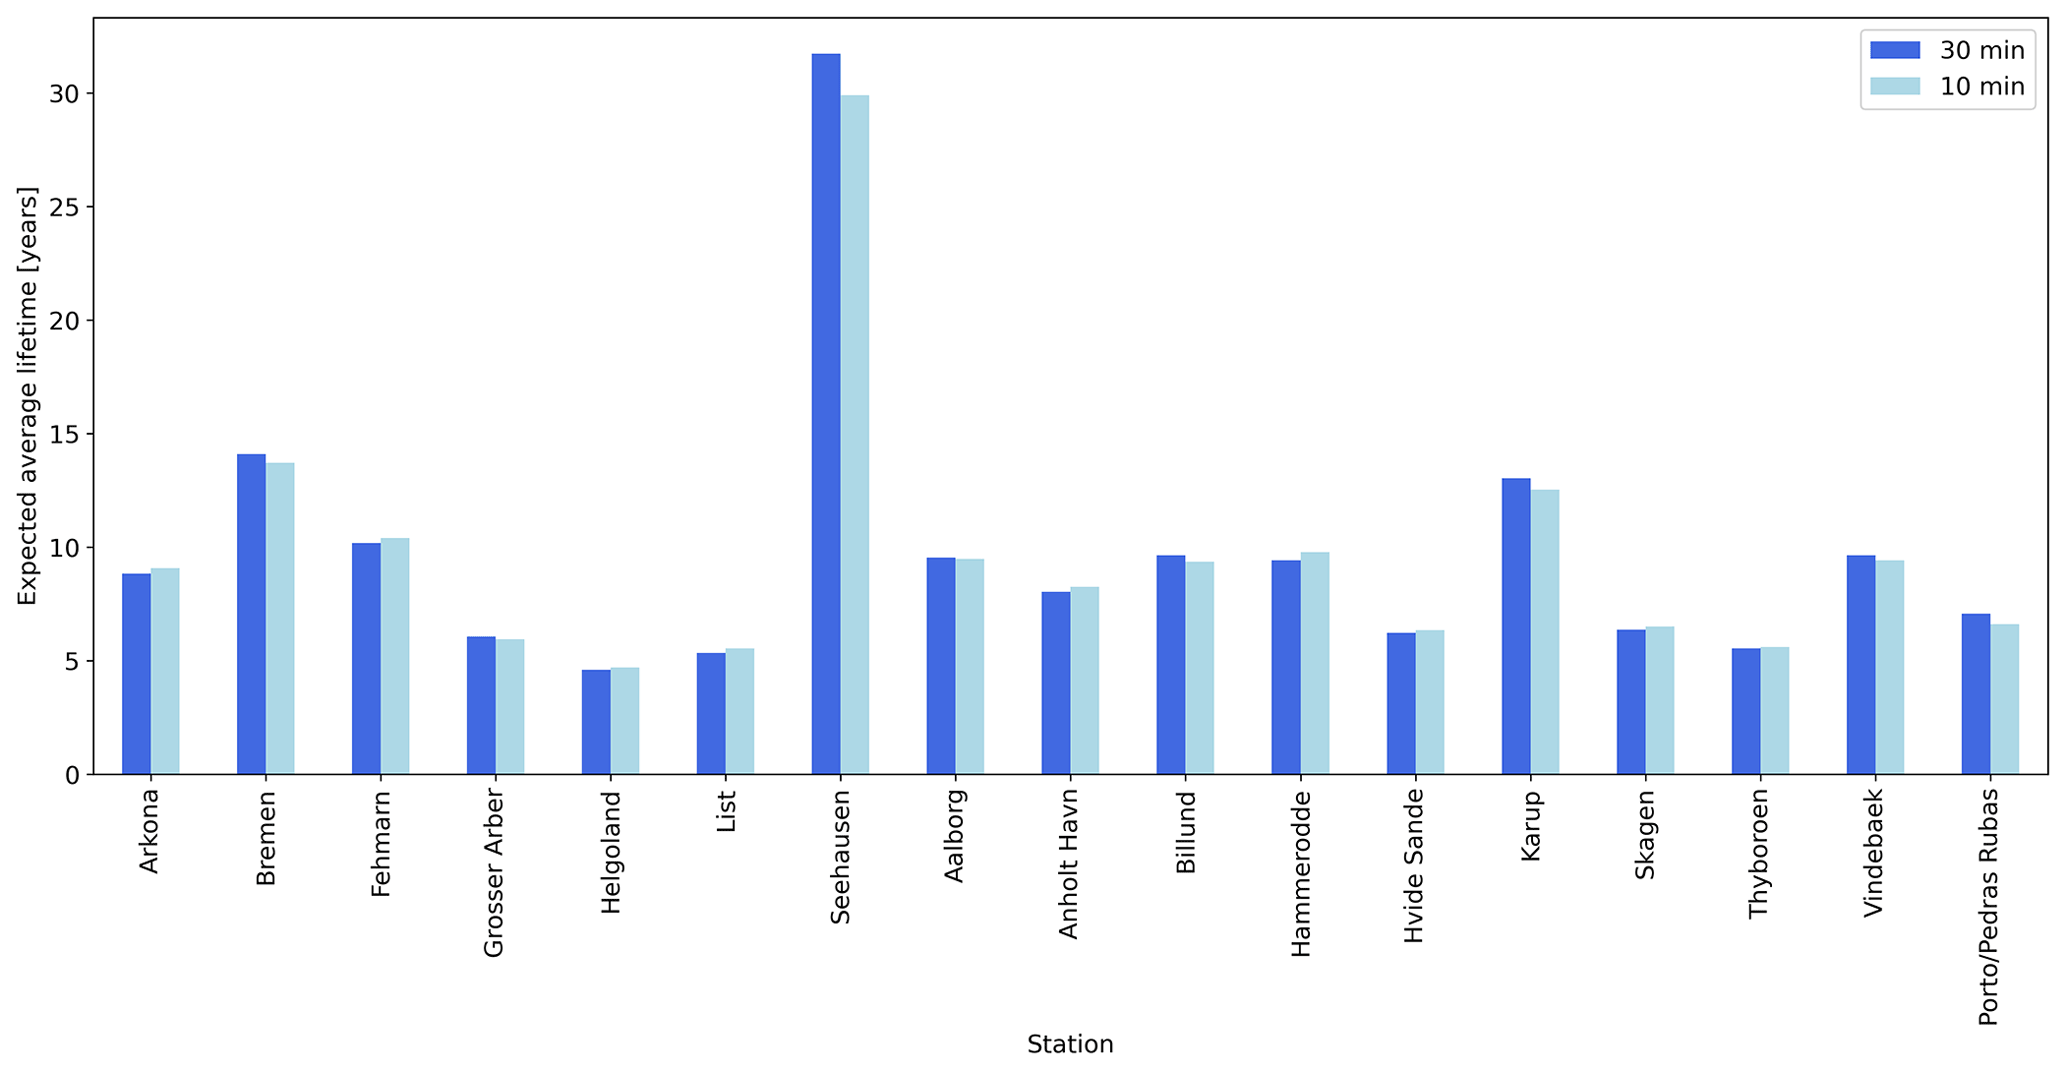
Figure 11Blade lifetimes estimated using 30 min accumulated rainfall intensities from the in situ stations and the native 10 min rainfall intensities observed at the stations. Note that the Portuguese station Viana do Castelo/Chafé is left out due to a limited wind data availability.
This study is the first to use IMERG rain data as input to predict turbine blade lifetimes. Our blade lifetime estimates based on the IMERG final product and local rain gauge data differ very little in spite of large biases of the rainfall rates at certain stations. Our results suggest that blade lifetimes are shorter for locations near the coast as compared to stations located further inland even for stations with similar annual rainfall rates. The damage to turbine blades is caused by heavy rainfall and strong winds in combination, and therefore, the coastal stations with high annual mean wind speeds are the most prone to damage to the turbine blades. In other words, the blade lifetime model applied in this study is less sensitive to rainfall rates than to wind speeds (Bech et al., 2022). Our findings are aligned with results from the Netherlands (Verma et al., 2021a).
IMERG products are available onshore and offshore for more than 20 years (2000–2022). This could potentially enable a regional to global mapping of the expected lifetime for specific turbines and blade coatings based on the concept applied here. In the context of blade lifetime assessment, the temporal coverage of available input data is important since the joint rain and wind variability in northern Europe is significant (Fig. 6). Around 10 years of data are sufficient to predict blade lifetimes (Hasager et al., 2021). In the case of shorter time series, there is considerable variation in the predicted lifetime. Our sensitivity analysis using 10 min vs. 30 min accumulated rainfall intensities shows little influence on lifetime estimates at sub-hourly timescales. We see large differences for the station Seehausen only, which has a lifetime much longer than the length of our time series.
Our comparisons of rainfall intensities from the IMERG final product vs. rain gauge observations at ground stations confirm the findings in previous works (Bogerd et al., 2021). Light and moderate rainfall is overestimated by IMERG, whereas heavy rainfall is underestimated. We see this pattern for almost all the 18 stations investigated (Fig. 9), and because heavy rain contributes more than light rain to leading edge erosion, blade lifetimes based on IMERG could be underestimated. We also find that the seasonal variability in the rainfall type and intensity drives the bias on IMERG rainfall rates with respect to in situ observations (Fig. 6). Comparisons between IMERG and in situ observations of rainfall intensities are therefore only representative of local areas where the climatic conditions remain similar. Another reason why validation of the IMERG final product is representative of local areas only is the nature of the data set in which the number and the type of satellite sensors, as well as the number of in situ stations assimilated in the product, are variable (see Sect. 1).
The stations considered here are primarily located in northern Europe where the rainfall conditions are similar in terms of the monthly distribution of rainfall (Fig. 6) and the total amount of rainfall per year (Fig. 7). We therefore also find that the bias between IMERG and in situ rainfall is on the same order of magnitude (Table 2). The two stations in Portugal and the elevated station Grosser Arber are located in very different regimes in terms of rainfall. In spite of these differences, the bias between IMERG and in situ rainfall is not so different.
A few aspects should be noted about the reference precipitation data set used here, as well as in previous works (Bech et al., 2022; Hasager et al., 2021). Networks of in situ stations operated by national weather services (here by DMI, DWD, and IPMA) are primarily established to monitor extreme rain events and to model the hydrological balance of catchment areas. In connection with these activities, different corrections are implemented, but such corrections are not necessarily included in the in situ data sets we have accessed. The in situ data set used here represents the best possible estimates of the rainfall intensities and wind speeds locally at the stations, but they are not necessarily representative of the “ground truth”. For example, strong winds may influence the amount of rainfall collected by a rain gauge. Such a bias will vary from station to station depending on the local wind climate. Likewise, the observations of wind speed may be influenced by sheltering obstacles such as buildings in the vicinity of the stations.
Precipitation measurements made with rain gauges at ground stations are very different in nature from remote sensing observations based on microwave or infrared sensors in space. Firstly, the observations are made at different levels in the atmosphere where the properties of a given rainfall event may also differ. Secondly, the sensing techniques are radically different. Rain gauges collect rain droplets by weight, whereas remote sensing instruments in this context measure the properties of a volume of air. As described in Sect. 2, the capability of microwave sensors when it comes to detection of rainfall depends on the instrument frequency.
In our analyses, we have considered liquid precipitation only, as the damage model currently only works for liquid precipitation. Solid precipitation in the form of hail can cause severe damage to wind turbine blades as well (Letson et al., 2020; Macdonald et al., 2016). In the future, it might be possible to separate different types of precipitation with confidence and analyze their individual effects on leading edge erosion. Thanks to dual frequency Ku- and Ka-band radar sensing in combination with passive microwave sensing, GPM makes it possible to estimate particle size distributions within rain clouds (Le and Chandrasekar, 2014; Tokay et al., 2017). Drop size distributions are essential for the development and prediction of storms. Tilg et al. (2022) have shown that the drop size distributions obtained from disdrometers (i.e., laser instruments) can also lead to improved estimates of the kinetic energy, which drives the leading edge erosion of turbine blades. The kinetic energy model used by Hasager et al. (2020, 2021), Skrzypiński et al. (2020), and Tilg et al. (2022) severely overestimates the effect of larger drops compared to smaller drops in contrast to the droplet-dependent impingement model used in the present study (Bech et al., 2022). There is thus an obvious potential for resolving drop size distributions from GPM and using them for the prediction of blade lifetimes.
The damage model by Bech et al. (2022) is valid for the specific coasting system tested and is more weakly dependent upon droplet size than the kinetic energy model. It is surmised that other coating systems will respond differently depending on their viscoelastic properties, the thickness of coating, and adhesion to the substrate. Our focus has been on the input precipitation data, and despite differences between GPM and local observations, the lifetime results compare well. Another focus could involve wind speed variation and impact speed variation on blades with erosion observed in the field (Prieto and Karlsson, 2021; Visbech et al., 2022). It would be valuable to assure the methodological reliability using GPM and different wind speed input and precipitation data near wind turbine sites with observed blade erosion for lifetime prediction.
The combination of heavy rain and strong winds can cause leading edge erosion of wind turbine blades and, ultimately, a need for blade repair or replacement. We have demonstrated for the first time that rainfall intensities obtained from the Global Precipitation Measurement (GPM) mission constellation of satellites can be used as input for the prediction of blade lifetimes at locations in Germany, Denmark, and Portugal. Our analysis is based on precipitation data from the Integrated Multi-Satellite Retrievals for GPM (IMERG) final product, which contains GPM observations from 2014 onwards. The satellite-based rainfall intensities were first compared against in situ observations of rainfall at the daily, monthly, and annual timescales. In line with previous analyses, we find that heavy rainfall is underestimated by IMERG, whereas light rainfall is overestimated. The accuracy of annual rainfall intensities from IMERG is thus very dependent on the rainfall regime at a given point location and on the type(s) of satellite sensors and the number of ground stations included in the IMERG final product at that specific location. In spite of these challenges, blade lifetimes estimated from the satellite and in situ observations of rainfall are rather similar at most of the stations analyzed. We also find that the 30 min temporal resolution offered by IMERG is sufficient to predict blade lifetimes. Our analyses indicate that there is a potential for using satellite-based rainfall observations for the modeling of leading edge erosion, and this represents a new application of the GPM. The findings are particularly relevant for the planning of wind farms offshore where networks of in situ stations lack coverage. In the future, it might be possible to refine the analyses presented here by resolving the drop size distributions based on GPM satellite observations.
IMERG final products are available for download at https://doi.org/10.5067/GPM/IMERG/3B-HH/06 (Huffman et al., 2019).
The supplement related to this article is available online at: https://doi.org/10.5194/wes-7-2497-2022-supplement.
MB coordinated the work, downloaded the IMERG final product, and prepared the manuscript with contributions from all co-authors. HZ compared rainfall and wind speed data sets from IMERG and in situ observations and made Figs. 2–9. AH estimated blade lifetimes and made Figs. 10 and 11. AO prepared the IMERG time series and produced overview maps of the in situ stations (Fig. 1). CH conceptualized the work, supervised the process, and acquired the financial support for the project leading to this publication.
The contact author has declared that none of the authors has any competing interests.
Publisher's note: Copernicus Publications remains neutral with regard to jurisdictional claims in published maps and institutional affiliations.
We acknowledge the Goddard Earth Sciences Data and Information Services Center (GES DISC) for the GPM IMERG Final Precipitation product (Huffman et al., 2019) and the Danish Meteorological Institute (DMI), the Portuguese Institute for Sea and Atmosphere (IPMA), and the Open Data Server from Deutscher Wetterdienst (DWD) for meteorological data.
This research has been supported by the Innovation Fund Denmark (grant nos. 9067-00008B and 6154-00018B), the European Space Agency (Atlantic Regional Initiative – Applications: Offshore Wind Energy), and the HORIZON EUROPE Marie Sklodowska-Curie Actions (grant nos. 858358 and 861291).
This paper was edited by Amy Robertson and reviewed by Hamish Macdonald and Kirsten Dyer.
Arulraj, M. and Barros, A. P.: Shallow precipitation detection and classification using multifrequency radar observations and model simulations, J. Atmos. Ocean. Tech., 34, 1963–1983, https://doi.org/10.1175/JTECH-D-17-0060.1, 2017.
Bak, C., Forsting, A. M., and Sørensen, N. N.: The influence of leading edge roughness, rotor control and wind climate on the loss in energy production, J. Phys.: Conf. Ser., 1618, 052050, https://doi.org/10.1088/1742-6596/1618/5/052050, 2020.
Bech, J. I., Hasager, C. B., and Bak, C.: Extending the life of wind turbine blade leading edges by reducing the tip speed during extreme precipitation events, Wind Energ. Sci., 3, 729–748, https://doi.org/10.5194/wes-3-729-2018, 2018.
Bech, J. I., Johansen, N. F.-J., Madsen, M. B., Hannesdóttir, Á., and Hasager, C. B.: Experimental study on the effect of drop size in rain erosion test and on lifetime prediction of wind turbine blades, Renew. Energy, 197, 776–789, https://doi.org/10.1016/j.renene.2022.06.127, 2022.
Best, A. C.: The size of distribution of raindrops, Q. J. Roy. Meteorol. Soc., 76, 16–36, https://doi.org/10.1002/qj.49707632704, 1950.
Bogerd, L., Overeem, A., Leijnse, H., and Uijlenhoet, R.: A comprehensive five-year evaluation of IMERG late run precipitation estimates over the Netherlands, J. Hydrometeorol., 22, 1855-1868, https://doi.org/10.1175/JHM-D-21-0002.1, 2021.
Chen, F. and Li, X.: Evaluation of IMERG and TRMM 3B43 monthly precipitation products over mainland China, Remote Sens., 8, 472, https://doi.org/10.3390/rs8060472, 2016.
Cui, W., Dong, X., Xi, B., Feng, Z. H. E., and Fan, J.: Can the GPM IMERG final product accurately represent MCSs' precipitation characteristics over the central and eastern United States?, J. Hydrometeorol., 21, 39–57, https://doi.org/10.1175/JHM-D-19-0123.1, 2020.
Dezfuli, A. K., Ichoku, C. M., Mohr, K. I., and Huffman, G. J.: Precipitation characteristics in West and East Africa from satellite and in situ observations, J. Hydrometeorol., 18, 1799–1805, https://doi.org/10.1175/JHM-D-17-0068.1, 2017.
Eisenberg, D., Laustsen, S., and Stege, J.: Wind turbine blade coating leading edge rain erosion model: Development and validation, Wind Energy, 21, 942–951, https://doi.org/10.1002/we.2200, 2018.
Freitas, da S. E., Coelho, V. H. R., Xuan, Y., de Melo, D. C. D., Gadelha, A. N., Santos, E. A., de Galvão, C. O., Ramos, F., Geraldo, M., Barbosa, L. M., Huffman, G. J., Petersen, W. A., and Almeida das N., C.: The performance of the IMERG satellite-based product in identifying sub-daily rainfall events and their properties, J. Hydrol., 589, 125128, https://doi.org/10.1016/j.jhydrol.2020.125128, 2020.
Gaertner, E., Rinker, J., Sethuraman, L., Zahle, F., Anderson, B., Barter, G., Abbas, N., Meng, F., Bortolotti, P., Skrzypiński, W. R., Scott, G., Feil, R., Bredmose, H., Dykes, K., Shields, M., Allen, C., and Viselli, A.: Definition of the IEA 15-Megawatt Offshore Reference Wind Turbine (NREL/TP-5000-75698), National Renewable Energy Laboratory, Golden, CO, USA, https://www.nrel.gov/docs/fy20osti/75698.pdf (last access: 14 December 2022), 2020.
Hasager, C. B., Vejen, F., Bech, J. I., Skrzypiński, W. R., Tilg, A.-M., and Nielsen, M.: Assessment of the rain and wind climate with focus on wind turbine blade leading edge erosion rate and expected lifetime in Danish Seas, Renew. Energy, 149, 91–102, https://doi.org/10.1016/j.renene.2019.12.043, 2020.
Hasager, C. B., Vejen, F., Skrzypinski, W. R., and Tilg, A.-M.: Rain Erosion Load and Its Effect on Leading edge Lifetime and Potential of Erosion-Safe Mode at Wind Turbines in the North Sea and Baltic Sea, Energies, 14, 1959, https://doi.org/10.3390/en14071959, 2021.
Herring, R., Dyer, K., Martin, F., and Ward, C.: The increasing importance of leading edge erosion and a review of existing protection solutions, Renew. Sustain. Energ. Rev., 115, 109382, https://doi.org/10.1016/j.rser.2019.109382, 2019.
Herring, R., Dyer, K., Howkins, P., and Ward, C.: Characterisation of the offshore precipitation environment to help combat leading edge erosion of wind turbine blades, Wind Energ. Sci., 5, 1399–1409, https://doi.org/10.5194/wes-5-1399-2020, 2020.
Hou, A. Y., Kakar, R. K., Neeck, S., Azarbarzin, A. A., Kummerow, C. D., Kojima, M., Oki, R., Nakamura, K., and Iguchi, T.: The global precipitation measurement mission, B. Am. Meteorol. Soc., 95, 701–722, https://doi.org/10.1175/BAMS-D-13-00164.1, 2014.
Hsu, S. A., Meindl, E. A., and Gilhousen, D. B.: Determining the power-law wind-profile exponent under near-neutral stability conditions at sea, J. Appl. Meteorol. Clim., 33, 757-765, https://doi.org/10.1175/1520-0450(1994)033<0757:DTPLWP>2.0.CO;2, 1994.
Huffman, G.: IMERG V06 Quality Index, NASA, USA, https://docserver.gesdisc.eosdis.nasa.gov/public/project/GPM/IMERGV06_QI.pdf (last access: 14 December 2022), 2019.
Huffman, G. J., Bolvin, D. T., Nelkin, E. J., Wolff, D. B., Adler, R. F., Gu, G., Hong, Y., Bowman, K. P., and Stocker, E. F.: The TRMM Multisatellite Precipitation Analysis (TMPA): Quasi-global, multiyear, combined-sensor precipitation estimates at fine scales, J. Hydrometeorol., 8, 38–55, https://doi.org/10.1175/JHM560.1, 2007.
Huffman, G. J., Stocker, E. F., Bolvin, D. T., Nelkin, E. J. and Tan, J.: GPM IMERG Final Precipitation L3 Half Hourly 0.1 degree × 0.1 degree V06, Goddard Earth Sciences Data and Information Services Center (GES DISC), Greenbelt, MD [data set], https://doi.org/10.5067/GPM/IMERG/3B-HH/06, 2019.
Huffman, G. J., Bolvin, D. T., Braithwaite, D., Hsu, K. L., Joyce, R. J., Kidd, C., Nelkin, E. J., Sorooshian, S., Stocker, E. F., Tan, J., Wolff, D. B., and Xie, P.: Integrated Multi-satellite Retrievals for the Global Precipitation Measurement (GPM) Mission (IMERG), Adv. Global Change Res., 67, 343–353, https://doi.org/10.1007/978-3-030-24568-9_19, 2020a.
Huffman, G. J., Bolvin, D. T., Nelkin, E. J., and Tan, J.: Integrated Multi-satellitE Retrievals for GPM (IMERG) Technical Documentation, NASA, USA, https://gpm.nasa.gov/resources/documents/IMERG-V06-Technical-Documentation (last access: 14 December 2022), 2020b.
Ibrahim, M. E. and Medraj, M.: Water droplet erosion of wind turbine blades: Mechanics, testing, modeling and future perspectives, Materials, 13, 157, https://doi.org/10.3390/ma13010157, 2020.
Keegan, M. H., Nash, D. H., and Stack, M. M.: On erosion issues associated with the leading edge of wind turbine blades, J. Phys. D, 46, 383001, https://doi.org/10.1088/0022-3727/46/38/383001, 2013.
Kidd, C., Becker, A., Huffman, G., Muller, C., Joe, P., Jackson, G., and Kirschbaum, D.: So, how much of the Earth's surface is covered by rain gauges?, B. Am. Meteorol. Soc., 98, 69–78, https://doi.org/10.1175/BAMS-D-14-00283.1, 2017.
Klepp, C., Kucera, P. A., Burdanowitz, J., and Protat, A.: OceanRAIN – The Global Ocean Surface-Reference Dataset for Characterization, Validation and Evaluation of the Water Cycle, in: Satellite Precipitation Measurement. Advances in Global Change Research, 69, edited by: Levizzani, V., Kidd, C., Kirschbaum, D., Kummerow, C., Nakamura, K., and Turk, F., Springer, Cham, https://doi.org/10.1007/978-3-030-35798-6_10, 2020.
Law, H. and Koutsos, V.: Leading edge erosion of wind turbines: Effect of solid airborne particles and rain on operational wind farms, Wind Energy, 23, 1955–1965, https://doi.org/10.1002/we.2540, 2020.
Le, M. and Chandrasekar, V.: An algorithm for drop-size distribution retrieval from GPM dual-frequency precipitation radar, IEEE T. Geosci. Remote, 52, 6813630, https://doi.org/10.1109/TGRS.2014.2308475, 2014.
Letson, F., Barthelmie, R. J., and Pryor, S. C.: Radar-derived precipitation climatology for wind turbine blade leading edge erosion, Wind Energ. Sci., 5, 331–347, https://doi.org/10.5194/wes-5-331-2020, 2020.
Macdonald, H., Infield, D., Nash, D. H., and Stack, M. M.: Mapping hail meteorological observations for prediction of erosion in wind turbines: UK hail meteorological observations, Wind Energy, 19, 777–784, https://doi.org/10.1002/we.1854, 2016.
Maranan, M., Fink, A. H., Knippertz, P., Amekudzi, L. K., Atiah, W. A., and Stengel, M.: A process-based validation of GPM IMERG and its sources using a mesoscale rain gauge network in the west African forest zone, J. Hydrometeorol., 21, 729–749, https://doi.org/10.1175/JHM-D-19-0257.1, 2020.
Met Office: Water, Fact sheet 3 — Water in the atmosphere, Met Office, Exeter, UK, https://www.metoffice.gov.uk/binaries/content/assets/metofficegovuk/pdf/research/library-and-archive/library/publications/factsheets/factsheet_3-water-in-the-atmosphere-v02.pdf (last access: 14 December 2022), 2012.
Mishnaevsky, L. and Thomsen, K.: Costs of repair of wind turbine blades: Influence of technology 695 aspects, Wind Energy, 23, 2247–2255, https://doi.org/10.1002/we.2552, 2020.
Mishnaevsky Jr., L., Hasager, C. B., Bak, C., Tilg, A.-M., Bech, J. I., Rad, S. D., and Fæster, S.: Rain erosion of wind turbine blades: Understanding, prevention and protection, Renew. Energy, 169, 953–969, https://doi.org/10.1016/j.renene.2021.01.044, 2021.
Prakash, S., Mitra, A. K., AghaKouchak, A., Liu, Z., Norouzi, H., and Pai, D. S.: A preliminary assessment of GPM-based multi-satellite precipitation estimates over a monsoon dominated region, J. Hydrol., 556, 865–876, https://doi.org/10.1016/j.jhydrol.2016.01.029, 2018.
Prieto, R. and Karlsson, T.: A model to estimate the effect of variables causing erosion in wind turbine blades, Wind Energy, 24, 1031–1044, https://doi.org/10.1002/we.2615, 2021.
Rios Gaona, M. F., Overeem, A., Leijnse, H., and Uijlenhoet, R.: First-year evaluation of GPM rainfall over the Netherlands: IMERG day 1 final run (V03D), J. Hydrometeorol., 17, 2799–2814, https://doi.org/10.1175/JHM-D-16-0087.1, 2016.
Shaw, W. J., Berg, L. K., Debnath, M., Deskos, G., Draxl, C., Ghate, V. P., Hasager, C. B., Kotamarthi, R., Mirocha, J. D., Muradyan, P., Pringle, W. J., Turner, D. D., and Wilczak, J. M.: Scientific challenges to characterizing the wind resource in the marine atmospheric boundary layer, Wind Energ. Sci., 7, 2307–2334, https://doi.org/10.5194/wes-7-2307-2022, 2022.
Skrzypiński, W. R., Bech, J. I., Hasager, C. B., Tilg, A.-M., Bak, C., and Vejen, F.: Optimization of the erosion-safe operation of the IEA Wind 15 MW Reference Wind Turbine, J. Phys.: Conf. Ser., 1618, 052034, https://doi.org/10.1088/1742-6596/1618/5/052034, 2020.
Tan, J., Petersen, W. A., and Tokay, A.: A novel approach to identify sources of errors in IMERG for GPM ground validation, J. Hydrometeorol., 17, 2477–2491, https://doi.org/10.1175/JHM-D-16-0079.1, 2016.
Tapiador, F. J., Navarro, A., García-Ortega, E., Merino, A., Sánchez, J. L., Marcos, C., and Kummerow, C.: The contribution of rain gauges in the calibration of the IMERG product: Results from the first validation over Spain, J. Hydrometeorol., 21, 161–182, https://doi.org/10.1175/JHM-D-19-0116.1, 2020.
Tilg, A.-M., Skrzypiński, W. R., Hannesdóttir, Á., and Hasager, C. B.: Effect of drop-size parameterization and rain amount on blade-lifetime calculations considering leading edge erosion, Wind Energy, 25, 952–967, https://doi.org/10.1002/we.2710, 2022.
Tokay, A., D'Adderio, L. P., Porcù, F., Wolff, D. B., and Petersen, W. A.: A field study of footprint-scale variability of raindrop size distribution, J. Hydrometeorol., 18, 3165–3179, https://doi.org/10.1175/jhm-d-17-0003.1, 2017.
Verma, A. S., Jiang, Z., Caboni, M., Verhoef, H., van der Mijle Meijer, H., Castro, S. G. P., and Teuwen, J. J. E.: A probabilistic rainfall model to estimate the leading-edge lifetime of wind turbine blade coating system, Renew. Energy, 178, 1435–1455, https://doi.org/10.1016/j.renene.2021.06.122, 2021a.
Verma, A. S., Jiang, Z., Ren, Z., Caboni, M., Verhoef, H., van der Mijle-Meijer, H., Castro, S. G. P., and Teuwen, J. J. E.: A probabilistic long-term framework for site-specific erosion analysis of wind turbine blades: A case study of 31 Dutch sites, Wind Energy, 24, 1315–1336, https://doi.org/10.1002/we.2634, 2021b.
Visbech, J., Göçmen, T., Hasager, C. B., Shkalov, H., Handberg, M., and Nielsen, K. P.: Introducing a data-driven approach to predict site-specific leading edge erosion, Wind Energ. Sci. Discuss. [preprint], https://doi.org/10.5194/wes-2022-55, in review, 2022.
Xiong, W., Tang, G., Wang, T., Ma, Z., and Wan, W.: Evaluation of IMERG and ERA5 Precipitation-Phase Partitioning on the Global Scale, Water, 14, 1122, https://doi.org/10.3390/w14071122, 2022.