the Creative Commons Attribution 4.0 License.
the Creative Commons Attribution 4.0 License.
 | 22 Dec 2022
Methodology to predict stiffness knock-down in laminates for wind turbine blades with artificial wrinkles
Heloisa Guedes Mendonça
Lars Pilgaard Mikkelsen
Xiao Chen
Johannes Bode
Flemming Mortensen
Philipp Ulrich Haselbach
Kim Branner
This work presents a methodology to evaluate the effect of wrinkle defects in the stiffness response of laminate characteristic of wind turbine blades. The assessment is carried out through numerical models and experimental tests with coupon specimens embedded with artificial wrinkles. Specimens are manufactured with two types of defects, prone to arising along the manufacturing process of wind turbine blades. Image-based numerical models were built to enclose the actual features of the cross-sectional wrinkling of each defect type. Experimental quasi-static tension and compression tests were performed, where extensometers collect the strain distribution about the wrinkle section as around the flat section of the test specimens. Two-dimensional finite element simulations carried out in Abaqus/Standard captured the stiffness behaviour of the two types of wrinkles. The numerical approach is validated against the quasi-static tests retrieving a fair agreement with experimental data. A significant knock-down in the stiffness response was found due to the wrinkle with larger aspect ratio of amplitude / half-wavelength.
- Article
(4779 KB) - Full-text XML
- BibTeX
- EndNote


Wrinkles are manufacturing-induced defects, which can impact the production cycle time, leading to expensive repairs when required, ultimately resulting in a decline of wind turbine blade reliability. This study is dedicated to evaluate out-of-plane wrinkles due to their critical impact on the structural performance of the blade. Thus, the term “wrinkles” in this study is interpreted as out-of-plane wrinkles. Out-of-plane wrinkles are a result of fibre bending out of the laminate and layer bending through thickness (Wang, 2001; Lightfoot et al., 2013). Moreover, ply/fibre waviness is a fibre deviation from a straight alignment in a unidirectional laminate (Thor et al., 2020).
On the production of wind turbine blades, geometric changes on tooling surfaces, operator errors and skewed fibres are regarded as factors leading to wrinkles (Galappaththi et al., 2013). Wrinkles in composite laminates are a result of various factors, such as temperature gradient during manufacturing of composites structures, the compaction process, component and tool interaction, and fibre mismatch in curved portions of the structure (Kulkarni et al., 2020). Low inter-laminar shear stress affects the compaction quality of plies in the layup process. As for manufacturing of complex-shaped structures, the low drapability of plies to conform to the required mould design can result in fibre waviness (Hassan et al., 2017).
Characteristic parameters of wrinkles are wavelength (λ), amplitude (δ) and maximum angle (θmax) as shown in Fig. 1. Concerning the severity level, there is no consensus on a unique metric. The severity of the defect can be measured by the aspect ratio of the amplitude to wavelength () (Wang et al., 2012). Additionally, maximum angle is often regarded as a critical parameter (Mukhopadhyay et al., 2015), having the most significant influence on the mechanical properties of the laminate (Davidson et al., 2012). Amplitude-to-thickness ratio () is also considered detrimental to assess strategies for fibre waviness (Thor et al., 2021). In this work, the aspect ratio of amplitude to half-wavelength () and maximum wrinkle angles (θmax) are taken as a metric on the severity level of a given wrinkle as it considers the main geometric parameters of the defect at the cross section.
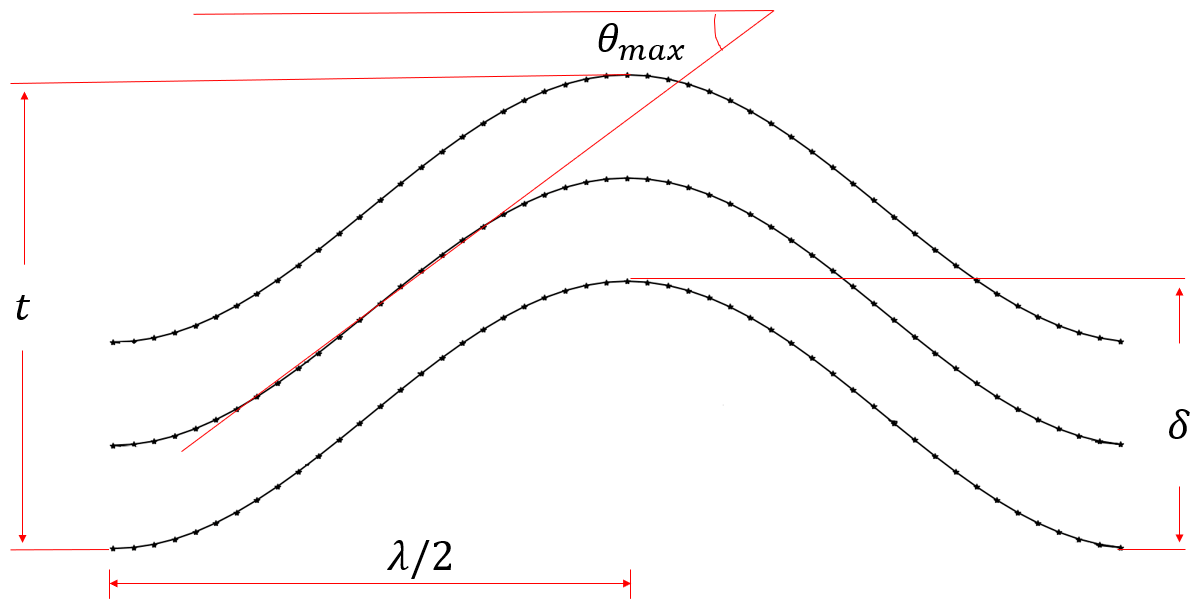
Figure 1Geometric parameters regarded for severity determination of a wrinkle defect (Mukhopadhyay et al., 2018).
Manufacturing of artificial wrinkles requires thorough methods as the specimens often undergo variability in the wrinkle parameters. One of the applied methods lies in inserting a plastic rod in the region of interest. The vacuum is then applied to induce a wrinkle at the region where the rod is placed. Afterwards, a vacuum is removed to extract the rod; subsequently, the vacuum is re-applied to create a resin pocket shaping the wrinkle (Leong et al., 2012a, b). Alternatively, ply strips are placed in the target location where the wrinkle severity is controlled by varying the width and thickness of the inserted strips (Mukhopadhyay et al., 2015; Riddle, 2013). A different method requires a female metal plate tooling to create the sinusoidal wave configuration intended for the wrinkling (Thor et al., 2021). The production method in this work was conceived on reproducing a wind turbine blade (WTB) manufacturing step which can result in out-of-plane wrinkles.
Several methods are employed to represent wrinkles through numerical models (Leong et al., 2012a, b; Smith et al., 2014; Mukhopadhyay et al., 2015; Bender et al., 2019; Xie et al., 2018, 2015). Analytical models are equally described in the literature (Hsiao and Daniel, 1996a, b; Zhu et al., 2015). Finite element modelling is targeted in this work as it allows detailed representation of geometrical complex features. An idealized finite element model (FEM) based on the characteristic parameters of wrinkles was built with 3D solid elements (Leong et al., 2012a, b). Non-destructive test (NDT) imaging was converted into numerical models by using a MATLAB-based simulator to take ultrasonic data as a material map from laminates with wrinkles and converted into an Abaqus finite element mesh by using a 3D vector field mapping of fibre orientations (Smith et al., 2014; Xie et al., 2015). Trigonometrical functions are frequently used to generate a parameterized model of the defect. Mathematical cosine function controls the through-thickness mesh coordinates of a wrinkling configuration built in Abaqus/Explicit with 3D elements, in which parameters are measured directly from test coupons (Mukhopadhyay et al., 2015). In a similar approach, sine function was taken to control the mesh nodes of a 3D solid model, introducing a parameter to control the flattening of the wrinkle, known as the wash-out degree (Bender et al., 2019). Multi-directional parametric models based on a Gaussian-modulated cosine-wave profile were applied for the topology definition of wrinkles (Xie et al., 2018). In the same work, the MATLAB-based simulator developed by Xie et al. (2015) is used to search the best Gaussian-envelope cosine-shape fit to the image of the wrinkle coupon specimens. Although the transfer process allows the selection of uniform and ply-thickness dependence of fibre volume fraction (FVF), the authors conduct the analysis with constant FVF, arguing for a tendency of uniformity in FVF during the curing process. The numerical method in this work is related to an image-based model which extracts the true parameters of the cross section defect image.
Reduction in laminate stiffness is registered in composite structures with fibre waviness (Chan and Wang, 1994; Chan and Chou, 1995). An analytical constitutive model was developed and experimentally verified to predict the elastic properties of unidirectional composites with fibre waviness. A decrease of Young's modulus with an increase in fibre waviness was noticed, although for crossply laminates Young's modulus did not prove to be a sensitive function of fibre waviness (Hsiao and Daniel, 1996a). Experimental tests with wrinkle coupon specimens are often conducted in servo-hydraulic machines with prior buckling stress investigation (Hsiao and Daniel, 1996a). Instrumentation is usually based on high-speed cameras and digital image correlation (DIC) for measurement of full 3D displacement and 2D strain on the specimen surface (Mukhopadhyay et al., 2018). As the aim of this work is to validate a numerical approach for stiffness prediction in laminate with artificial wrinkles, the strain measurement is sufficient to evaluate the target regions by means of extensometers.
Section 2 presents the steps required to develop the methodology of analysis to validate the numerical models proposed in this work. In Sect. 3, the detailed configuration of wrinkles is described along with manufacturing processes. In Sect. 4, the numerical models are presented with two-step modelling with an image-based model used to retrieve the geometry for construction of a finite element model. In Sect. 5 the experimental design is described. The results of stiffness prediction are presented in Sect. 6. Finally, the conclusion of this work is shown in Sect. 7.
The evaluation of how wrinkles impact on wind turbine blades (WTBs) is planned across five stages. The first includes (i) characterization of wrinkles based on geometrical parameters and critical blade operation scenario – this stage is dedicated to replicate wrinkles representative of a wind turbine blade assuming the aspect ratio and maximum angle as a metric of severity (Fig. 1). In this work, a defect is considered significant for investigation when not identified via current NDT methods and later, without a proper repair, will be exposed to operation with potential effects on the structural performance of the blade. That case occurs when the defect is small in amplitude and is located in the subsurface of a thick stack/layup region of the blade. (ii) In the second stage, manufacturing of artificial wrinkles by replicating a manufacturing process that potentially leads to wrinkles in wind turbine blades structures – at this stage two types of wrinkles configurations are introduced. (iii) Then, there is image processing to capture the geometrical parameters of the true defect – in this stage the wrinkle cross-section image of the coupon specimen is analysed by MATLAB-scripted algorithms for the image treatment and retrieval of each individual wrinkling ply contour. (iv) FE modelling of the physical defect is conducted in this stage, in which the geometrical parameters for the individual ply contours from the stage (iii) are applied to support the geometry construction of the defect in an Abaqus FEM. (v) FEM validation is conducted in this phase based on the results obtained in the experimental campaign for a quasi-static loading. The same boundary conditions and load amplitude applied during the test campaign are reproduced in the FEM in order to verify the correlation of the results. Figure 2 presents the schematic of the methodology stages.
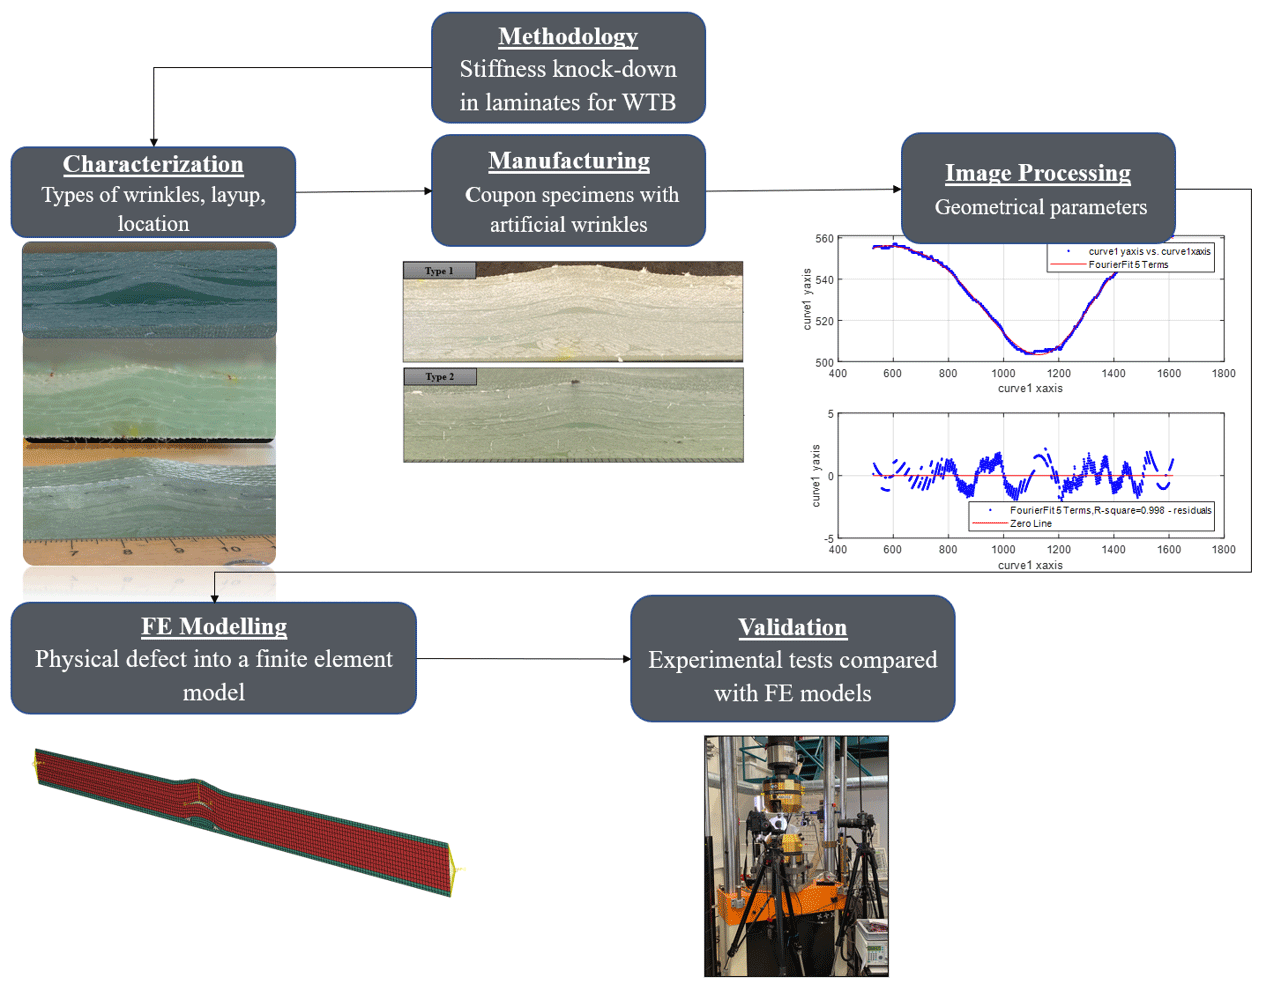
Figure 2Schematic of the steps used to carry on the methodology of analysis to evaluate the stiffness knock-down of laminates for WTB.
3.1 Configuration of wrinkles
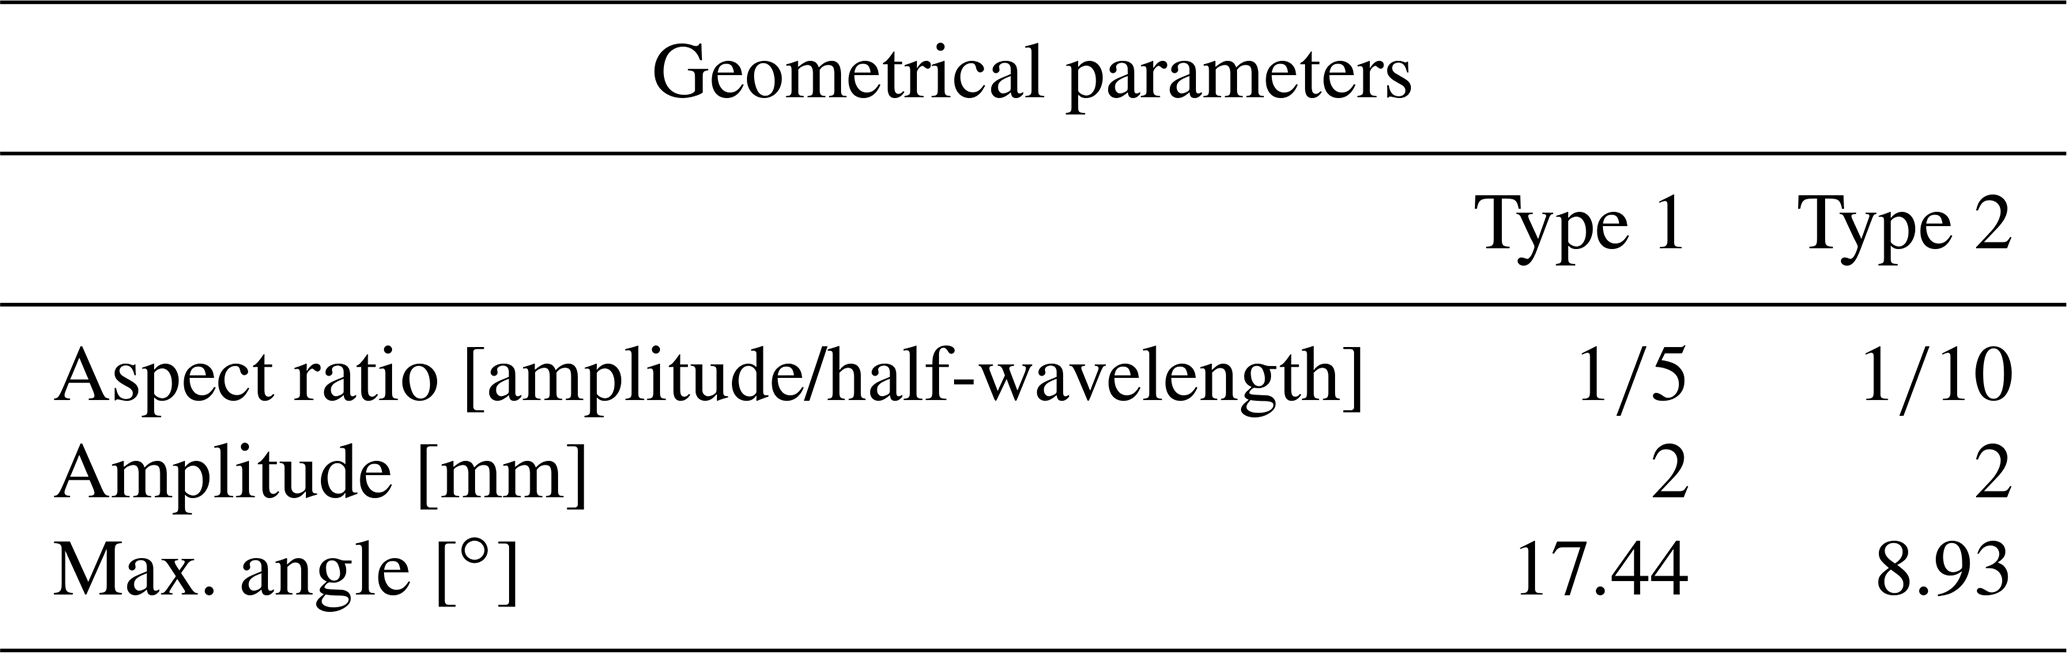
Post-manufacturing evaluation of blade structural integrity is conducted via visual inspection and NDT methods to monitor quality conformity with standards requirements. Presently, NDT technologies applied to large structures such as wind turbine blades lack precision to identify wrinkle defects below the laminate. As a consequence, non-detected wrinkle defects can remain in the blade without repair during operation, which can potentially lead to failure. Wrinkle defects can appear in different forms during the manufacturing process, in which significant variables such as the angle defining the deviation in the fibre direction, the number of plies through thickness and the symmetry/asymmetry of the defect can change from one wrinkle to the other (Xie et al., 2018). The root section is prone to a surge of wrinkles due to pronounced curved shapes, which can result in fold regions during the blade hand layup and due to relatively thick laminate sections. Therefore, the characteristic wrinkles evaluated in this work follow the same manufacturing step, which can lead to such defects. In this work, two types of wrinkles configurations are selected for analysis as shown in Fig. 3. The selection is defined based on wrinkles considered sufficiently small to be identified during the inspection. The geometrical parameters are specified in Table 1. Both types of wrinkles are designed with the same amplitude, but with different aspect ratios and maximum angle. What is referred to as the aspect ratio is the ratio of wrinkle amplitude to half-wavelength. The higher the aspect ratio, the more severe the wrinkle configuration will be as that will lead to larger angles. The maximum angle is determined based on amplitude (δ) and wavelength (λ) as in Eq. (1) (Bender et al., 2019; O'Hare Adams and Hyer, 1993). The defects are manufactured under controlled conditions, so the ply of maximum angle is located at the centre of the specimen. The layup is shown in Fig. 3, in which uni-directional (UD) layers are placed amidst Biax (biaxial fabric) plies. A Biax ply with a local fold is placed on the bottom of the layup in order to reproduce one of the production processes, which can lead to wrinkles. That way, both types of wrinkle specimen are embedded with two shapes of waviness: a symmetric one positioned at the centre of the layup (Shape B) and a second asymmetric one placed on the bottom of the laminate (Shape A). A common characteristic of asymmetric wrinkles, also known as S-shaped, is the presence of resin zones at either side of the wrinkling as the first wrinkled ply is folded under consolidation pressure (Bloom et al., 2013). However, this type of configuration mitigates the accumulation of resin pocket underneath the wrinkle of maximum amplitude, as the effect of the S-shaped wrinkle propagates up to the resin pocket formation. The choice for this wrinkle configuration was selected after experimental test trials proved this configuration with higher strength compared to a wrinkle characterized by resin pocket accumulation. In addition to that, the specimens are manufactured in such a way as to maintain the geometrical parameters and their repeatability. The manufacturing procedure is presented in Sect. 3.2.
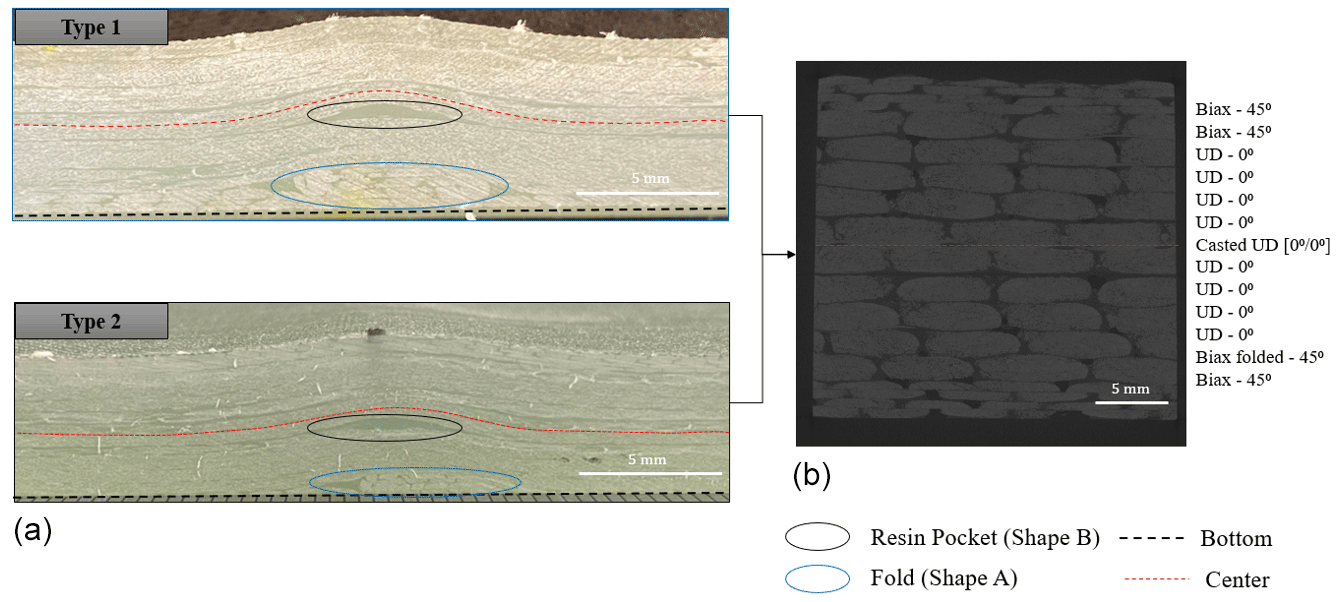
Figure 3(a) Types of wrinkle configurations selected for the analysis; (b) layup specification for the transverse cross section of the specimens taken at the flat region which is similar for both wrinkle types.
Table 1Geometrical parameters for wrinkles configurations type 1 and type 2.
3.2 Manufacturing of coupon specimens
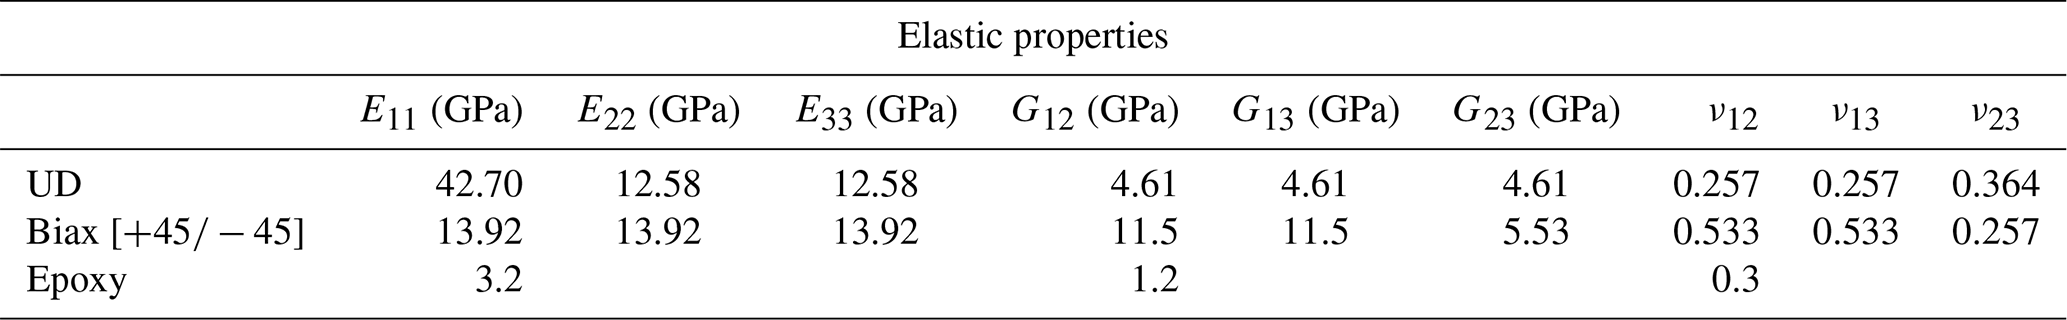
Coupon specimens are produced through two process phases with face sheets of glass fibre reinforced polymer (GFRP) consisting of uni-directional (UD), bi-directional (Biax) and resin epoxy. The UD ply thickness is 0.859 mm, whereas the Biax ply has 0.564 mm. Material properties are presented in Table 2. The transverse contraction values have a neglected influence on the actual longitudinal stiffness of the model. In principle E33 should be slightly lower than E22 due to the present of secondary oriented backing bundles in the x2 direction and accordingly the G13 compared to G12. Nevertheless, those values are considered to have a negligible influence on the axial stiffness prediction, which is dominated by the E11 and G12 components. In the first phase UD plies are laid on a mould to form a [] panel. Two UD sheets are stacked together on top of an aluminium cast mould with geometrical topology equivalent to the wrinkles type 1 and type 2 as defined in Table 1. The artificial defect is induced transversely to the orientation of the fibres along the panel width (Fig. 4). Hexion epoxy resin system with mixing ratio of by weight is used in the infusion. The double UD sheets are impregnated with resin through a vacuum-assisted resin infusion (VARI) process. A curing profile of 12 h at 40 ∘C and 10 h at 80 ∘C is applied. In the second phase assembling of the coupon specimens is performed as shown in Fig. 4. The hand layup follows the sequence , in which the cast UD plies from phase 1 are placed at the centre around the symmetry axis of the sample. The second biaxial layer is folded in a direction transversely to the fibre orientation during the layup. The fold is positioned so that is aligned with the centre of maximum wrinkle amplitude. The laminate assembly is infused via VARI with the same mixing ratio and curing cycle applied in the first phase of production. The panels produced in phases 1 and 2 undergo visual inspection during resin infusion and post-cure to assure quality checking for dry spots and voids. Subsequently, the specimens are evenly sliced in dimensions of () mm for both configurations.
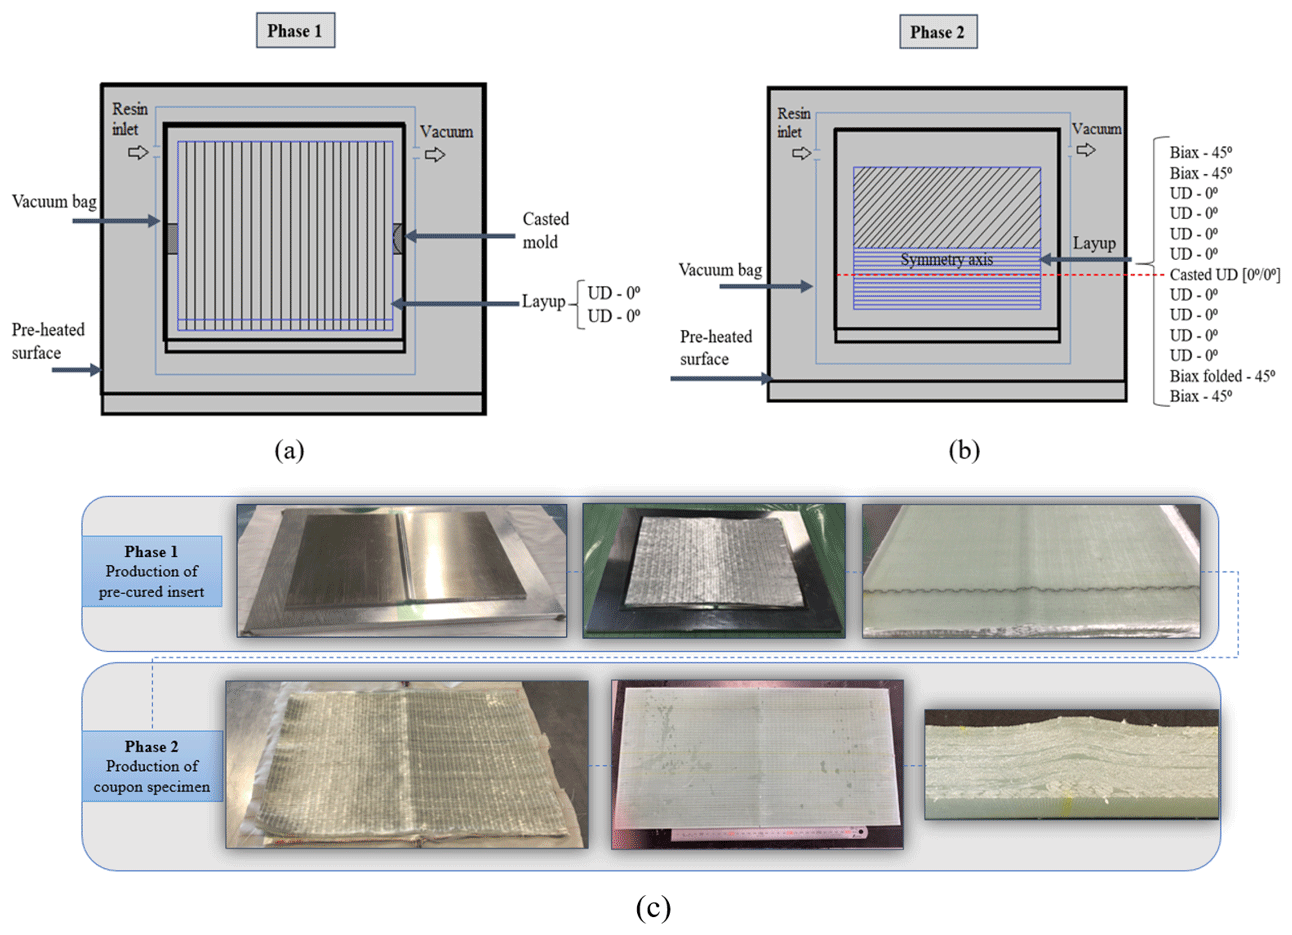
Figure 4Production phases for the artificial wrinkle defect: (a) schematics of production table for phase 1 with VARI of double UD plies resulting in a pre-cured insert for phase 2. (b) Schematics of the VARI in phase 2 in which the complete laminate is assembled with the pre-cured insert from phase 1 leading to the coupon specimen. (c) Image fluxogram indicating the production steps in phase 1 and phase 2.
The main advantages of the two phases technique are the control over the required geometric parameters and mitigation of the resin pocket around the wrinkle of maximum amplitude, resultant from the fold effect in the Biax layer. On that basis, the artificial defect is manufactured in a way to hold a close approximation of a characteristic defect of a WTB.
4.1 Image-based geometric model
Cross section images of the artificial defect are processed through MATLAB-based scripted algorithms. The image processing scheme is performed in a five-step sequence (Fig. 5) covering the steps of image processing, filtering, segmentation, fitting techniques for capturing the proper contour of an individual fibre and a 2D coordinate map generated to support the finite element modelling. A combination of the image processing toolbox available on MATLAB with a series of encoded scripts are used for the image processing, filtering, segmentation and fitting of each individual fibre. The filtering technique of the wrinkle image is based on rank filtering/median filtering, which removes outliers without reducing the resolution of the image. When it comes to the fitting technique, each individual fibre is evaluated accordingly to the least residuals method.

Figure 5Four-step sequence to translate the cross section defect profile into a finite element model by thresholding individual contours, segmentation of such contours and outliers removal, mathematical fitting techniques to generate even spaced coordinates and finally the extraction of 2D coordinates to import into ABAQUS.
Image threshold isolating a range of pixels contours from the fibres is conducted in the first step. The second step executes a series of commands to segment the target contours after filtering outliers. In the third step, fitting techniques are used in order to approximate each individual contour to a mathematical model. Various fitting types are tested individually in the fibre contours. The fitting technique elected for an individual fibre contour is based on the least residuals method. As such, that step generates contours with equally spaced points to support the mesh generation of the FEM. In the fourth step 2D coordinates are extracted from the fitted contours. The map of coordinates is stored as an input file used to create splines of the wrinkling section. At the last step the coordinates are used to generate the splines to support the geometry construction of the FEM into ABAQUS.
For each defect configuration, two types of finite element models are derived: a surrogate model and a high-fidelity model. The surrogate model solely accounts for the effect of individual ply waviness disregarding the effect of complexity geometry resultant from the fold in the Biax ply and resin regions. The high-fidelity model regards the effects of resin regions and asymmetric wrinkle shapes as resultant from the S-shaped Biax layer. The detailed finite element model is presented in Sect. 4.2.
4.2 Finite element model
The numerical simulations are conducted in ABAQUS standard version 2021, meaning that an implicit linear Newton–Raphson solver is used to predict the model response. Two 2D models are obtained with geometrical parameters from the image-based geometric model described in Sect. 4.1: a surrogate model (SM) and high-fidelity model (HFM) as shown in Fig. 6.
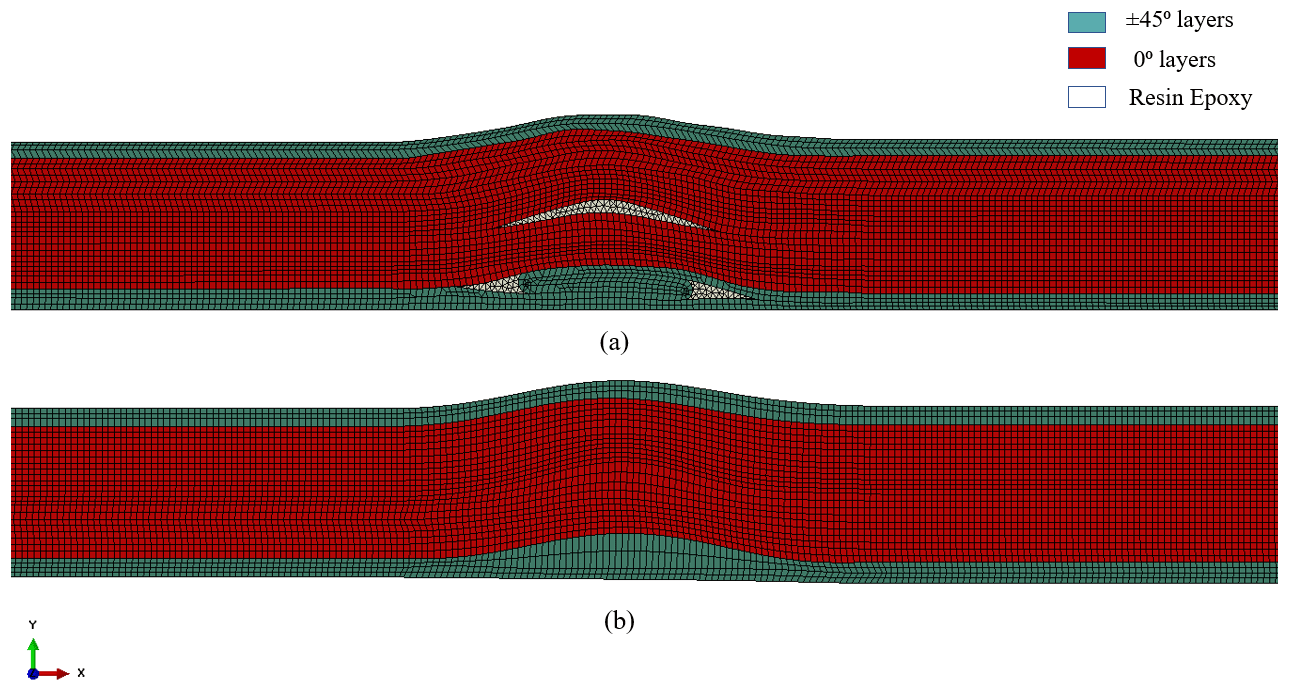
Figure 6Comparison of mesh discretization with the geometric details of the wrinkle type 1 for the models: (a) HFM presents the geometrical complexities of a fold wrinkle and resin pocket (b) SM presents a simplified geometrical configuration.
The HFM embodies the geometric complexities of the characteristic defect. Thus, the HFM refers solely to high-fidelity geometric features represented in the numerical model. Both models (SM and HFM) present approximately the same degrees of freedom, which result in a similar calculation time performed within few minutes on a 16 CPU Linux cluster. Two-dimensional eight-node plane stress elements with biquadratic reduced integration (CPS8R) are used to discretize the specimen geometry. However, in the HFM the resin regions are represented by six-node modified plane stress elements with hourglass control (CPS6M) as triangular elements enable mesh refinement with acceptable resolution within the region. The SM contains the same elements used in the HFM except for the modified plane stress elements for the resin region, which is not represented. The characteristic element length is defined based on mesh convergence studies tracking the displacement values at the regions of interest. Such regions are the locations where the extensometers are placed in the test campaign as described in Sect. 5.
Selected nodes at 25 mm away from the wrinkle centre are used to track displacement values around the wrinkle section. The displacement in the flat section is tracked by selected nodes at 40 and 65 mm from the centre. During the mesh sensitivity analysis, the displacement is plotted over the mesh size. The mesh sensitivity studies show convergence for a characteristic element length of 0.4 mm. The model is built in a ply-by-ply scheme, meaning that each layer is discretized individually as shown in Fig. 7.
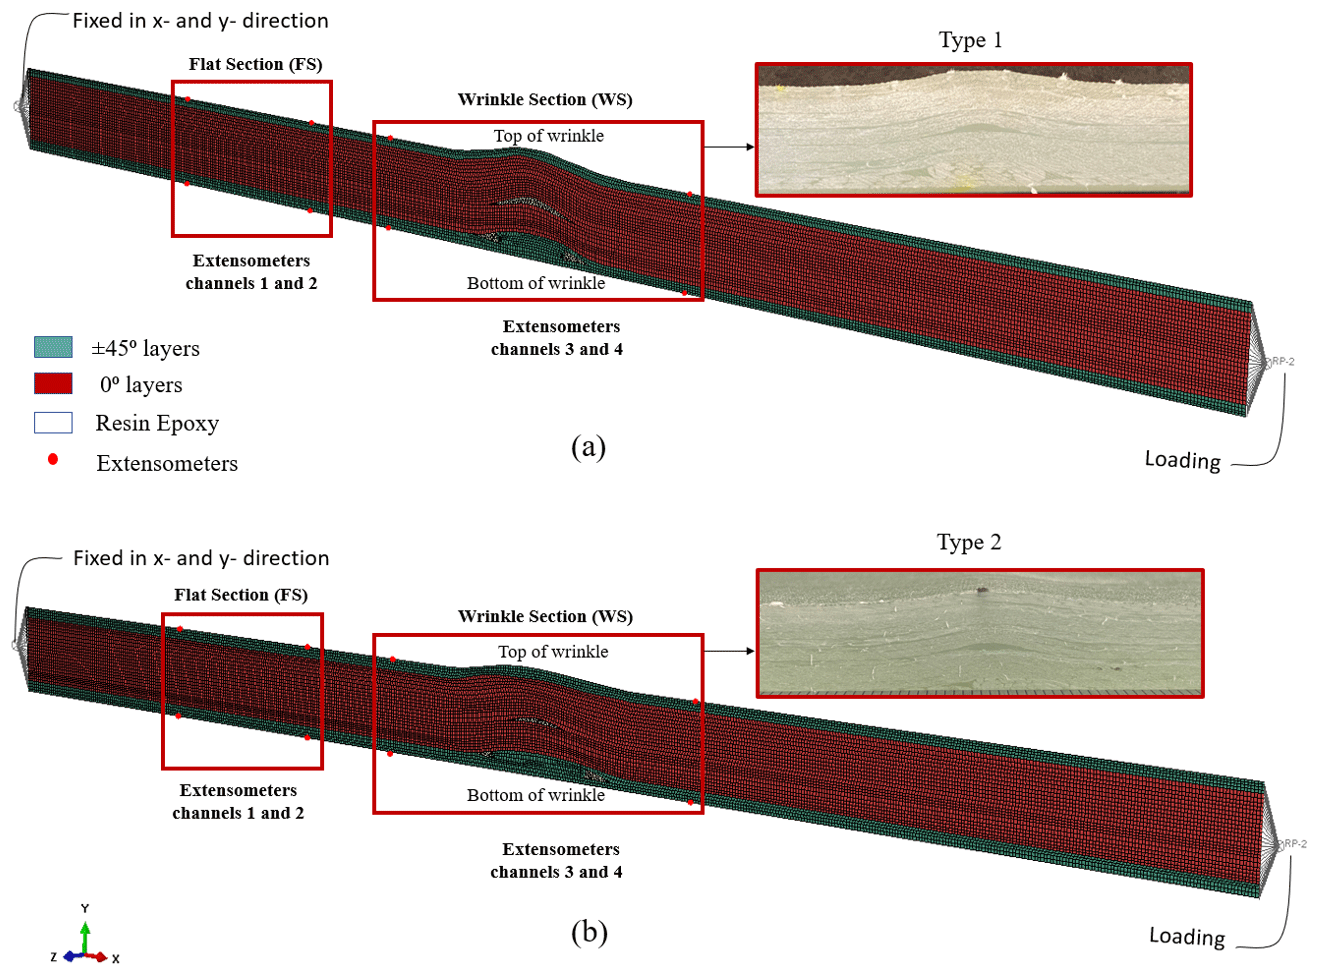
Figure 7High-fidelity finite element model modelled in a ply-by-ply sequence, with biaxial layers on top and bottom, UD layers in between and resin pocket around the Biax fold and underneath the ply contour of max. amplitude: (a) coupon specimen model for wrinkle type 1 and (b) coupon specimen model for wrinkle type 2.
The local material orientation is assigned accordingly with the upper contour of each ply. Directions 1 and 2 are the global x and y directions, respectively. Constraints are introduced through kinematic couplings at reference points located sufficiently close to the model ends to avoid unwanted bending moments. The degrees of freedom of the reference point on the left end of the model are restrained in the x and y directions. The load is applied to a reference point on the right end of the model. The reference point serves as a main node transferring the loading via the kinematic coupled constraints (all degrees of freedom are constrained) to the secondary nodes on the neighbour surfaces at each end of the model. In consequence, the secondary nodes are constrained to the rigid body motion of the main node.
Load frequency and amplitude are applied to the model according to the performed experimental tests. The node sets recording the displacements are defined in the same position that the extensometers are placed during testing in order to track the displacement at the same location, for a straightforward comparison. The reference point at the left end of the model (also used to constrain the DOFs) is also used to track the reaction load.
Two specimens of each configuration type 1 and type 2 were tested under quasi-static loading with a servo-hydraulic test machine Instron 8533, with load cell UK 084 and 250 ± 1.20 kN capacity. The specimens were mounted onto grips with 50 mm gauge length extensometers, aligned back to back with the wrinkle in the centre. For the flat section extensometers of 25 mm gauge length were positioned at a distance of 40 mm away from the wrinkle centre. High-speed cameras were used to capture images of the side and back views of the gauge section as shown in Fig. 8. The images from the camera are not relevant in this study as the samples are not driven to failure. In an upcoming study where the samples are tested under reverse fatigue the images are explored displaying the location for delamination initiation.
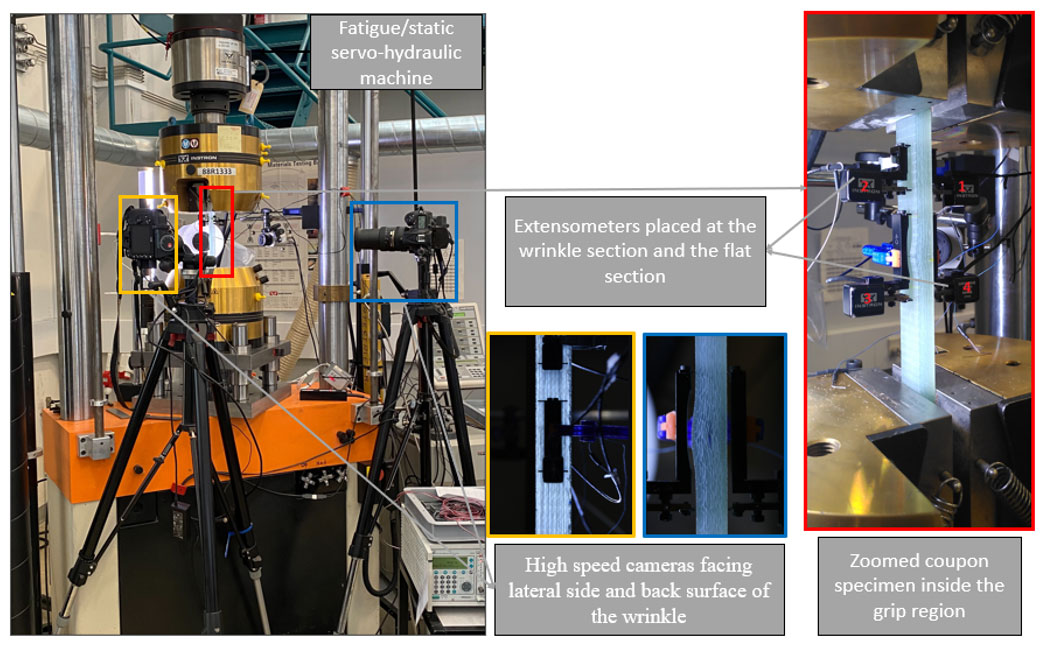
Figure 8Experimental setup with the specification of devices used for test and acquisition of results, with the positioning of coupon specimen in the test rig and placement of acquisition channels around the gauge section.
Prior to testing, the specimens were polished with sandpaper and treated with a lacquer acrylic spray to increase the bonding strength and attenuate the effect of rough side borders (Yang et al., 2019). A numerical buckling analysis was conducted to verify that the sample length within the grip section was below the buckling limit under compression for the target load. A strain rate of 0.01 % s−1 was used for three elapsed cycles. As a loading, a tension–compression test with load amplitudes of ±16 KN was applied over an externally controlled program, which feeds the machine with a triangular ramp loading. According to the ISO and ASTM standard, the stiffness should be taken over a strain range of 0.2 % (ISO 527, 2012; ASTM International, 2017). The load level is chosen such that the deformation exceeds this range but still stays below load levels where damage initiation could be introduced. The tensile-compression strain was measured at the four channels of the clip gauge extensometer.
In this study, the stiffness is described as the overall slope of the stress versus strain relation. Thereby, stiffness values obtained from the experimental tests are measured of the slope load versus strain shown in Fig. 9 and averaged by the mean cross-sectional area of the flat section for the two sets of specimens tested. As the wrinkle-out of the straightness path results in a bending around the centre of symmetry, strain results from the top and bottom of the wrinkle were averaged to account for the eccentricity effect. To preserve the correlation, the strain results from the top and bottom at the flat section were equally averaged. Figure 9 shows the hysteresis loop in detail for both types of wrinkle configurations and sections.
The hysteresis loss observed experimentally is mainly driven by the viscoelastic behaviour of the polymer matrix. Although not considered in the present numerical model, the viscoelastic effect can be addressed by using a visco-material law. The damping is calculated by averaging the hysteresis loop area over the three reversal cycles. The wrinkle section experience higher energy losses as the in-plane shear effect leads to higher damping when compared to the flat section. The type 1 specimen, which has a higher maximum angle, also has a higher damping effect compared to type 2. Experimental damping values are shown in Table 3. The damping from the wrinkle section is approximately 3 times higher compared to the damping observed in the flat section. By comparing both configurations, the damping of type 1 wrinkle is 32 % higher than type 2. Consequently, the higher the wrinkle angle, the higher the energy losses as a result of the shear loading of the resin in the wrinkle section.
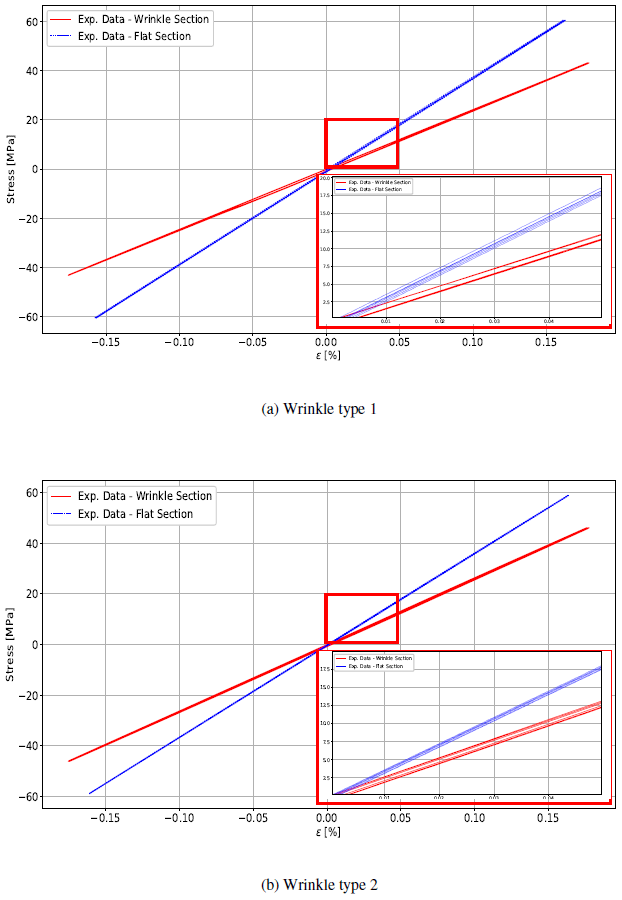
Figure 9Stress vs. strain graph of wrinkle specimens type 1 (a) and type 2 (b) with average strain between top and bottom. The strain is measured over 50 mm around the wrinkle section and 25 mm around the flat section (see Figs. 7 and 8) with local zoom showing the hysteresis loop of the elapsed cycles.

Figure 10Stiffness results for wrinkles type 1 and type 2 around the wrinkle section (WS) and the flat section (FS) based on the numerical model predictions and experimental data.
Table 3Experimental damping values for specimens type 1 and type 2.

Figure 10 shows the experimental results for stiffness in both types of specimens at the wrinkle section and flat section against the predictions pointed by the surrogate model and the high-fidelity model along with respective average deviation. The error bars show the actual stiffness values measured for the two samples tested of each type of wrinkle. The numerical models are verified through correlations of FE simulations and the results from experimental tests. When it comes to experimental data, the stiffness at the flat section has a minor deviation comparing type 1 and type 2 configurations as the samples might deviate in fibre volume fraction or potential microcracks that can arise during the manufacturing process. When the deviation is observed in the numerical results, it is in principal due to a slight difference in thickness for each type of wrinkle which was taking into account in the model for both types of samples. Furthermore, the complexity of the geometrical features present in the HFM induces a different pattern of mesh where the local sizes of few elements are different from the SM, which is simpler and therefore straightforward for a evenly sized mesh.
The stress vs. per cent strains of coupon specimens shown in Fig. 11 are obtained from averaging the extensometer results at the top and bottom of the wrinkle located in a gauge length of 50 mm around the centre. The strain levels are also measured at the flat section, 40 mm away from the wrinkle centre with an extensometer gauge length of 25 mm. The results obtained from the numerical models are extracted at the same position as the experiments. Wrinkles introduce an asymmetry in the experimental setup. The difference in stiffness when comparing the tensile and the compression side can be explained as a result of the asymmetry in the test geometry, which could either be introduced by the wrinkle itself or on details on how the samples are clamped and the alignment of the pistons. Therefore we are mainly focused on averaging the stiffness at the two sides, what is done subsequently in the comparison.
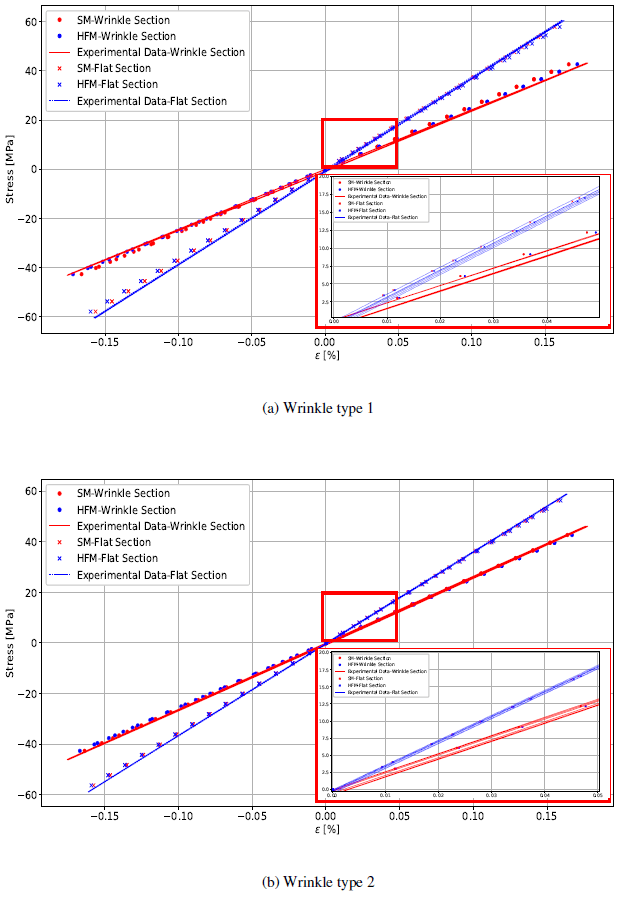
Figure 11Prediction of numerical model results against experimental tests for coupon specimens with two configurations of wrinkles.
The knock-down in stiffness for wrinkle type 1 is 54 %, whereas for wrinkle type 2 it is 37 %. Consequently, the metric applied for wrinkle severity is in conformity to the results observed as wrinkle type 1 is proven to be the most severe. The stiffness knock-down observed in the high-fidelity model is 46 % for wrinkle type 1 and 38 % for wrinkle type 2. The model prediction for the wrinkle section type 1 has a difference of 1.4 % in stiffness against the test results for the high-fidelity model, while in type 2 this difference is 3.2 %. Thus, the modelling of fold complex pattern and resin regions is relevant for accurate prediction of the component structural stiffness. However, the narrow deviation from the surrogate model compared to test results suggests that the effect of fibre waviness through thickness is more critical to the stiffness knock-down than the local effect of the fold or light concentrations of resin regions. At the flat section a deviation of 4.1 % is observed from the high-fidelity model compared to experimental results in type 1 specimen, while in type 2 this deviation is 2.3 %. This difference can be perceived by the simplification in modelling for the flat section.
As the precise representation of the wrinkle section was the primary concern, outside that region the plies were represented as straight lines extended by the ends of each individual wrinkling ply. Furthermore, the fibre volume fraction in both models was considered constant, which implies potential deviation of stiffness prediction on the FE model. For future work in which fatigue loading situation will be considered, the variation in fibre volume fraction shall be accounted for as the slight difference in stiffness plays an important role in crack onset and delamination path. Moreover, accounting for resin regions is equally relevant in fatigue loading as the thermo-viscoelastic effect of the resin can lead to a pronounced damping effect.
In this study, a methodology to manufacture, to test and to predict the stiffness knock-down in laminates with artificial wrinkles representative for wind turbine blades is verified through numerical models and experimental tests. As wrinkles are prone to forming during the manufacturing process of blades, it is fundamental to draw a method allowing the evaluation of the impact of such defects with respect to the structural performance. An element test procedure representing laminates with characteristic wrinkles as typically occurring in wind turbine blades is presented for verification purposes of numerical models. The characteristic laminates were investigated experimentally and numerically under quasi-static loading situation. Each ply waviness was modelled individually with geometrical parameters represented as the physical defect. Experimental tests were used to verify the FE models accounting for the complex geometrical effects compared to FE models representing only the true fibre wrinkling region. Two configurations of wrinkles were accounted for where the critical parameters are defined by the aspect ratio of amplitude to half-wavelength along with the maximum angle. The most severe wrinkle, type 1, of higher aspect ratio and higher maximum angle experienced a knock-down of 54 % in stiffness compared to 37 % for wrinkle type 2. The models presented a fair correlation with the stiffness observed in the experimental tests. However, the geometrical effects of Biax fold and resin regions were proven to not significantly influence the knock-down in stiffness for the quasi-static case. Under fatigue loading the geometrical deviations could be detrimental as they decrease the load carrying capacity of the laminate. Future work shall take into account the effect of variation in fibre volume fraction accounting for the validity of the model tested for fatigue loads and the effect of surrounding structure in a full blade.
All results data are published as line and bar plots in the paper.
HGM developed the research methods, elaborated the computational scripts and FE numerical models, analysed the data, prepared the figures, and was lead author of the article. LPM assisted in the conceptualization, supervision of data analysis, supervision of numerical modelling and test results providing extensive feedback over the various reviews. FM, JB, PUH, KB and XC provided technical supervision and thorough review of the work methodology and reviewing the writing.
At least one of the (co-)authors is a member of the editorial board of Wind Energy Science. The peer-review process was guided by an independent editor, and the authors also have no other competing interests to declare.
Publisher’s note: Copernicus Publications remains neutral with regard to jurisdictional claims in published maps and institutional affiliations.
This research has been supported by the Danish Energy Agency through EUDP grant no. 64018-0068 in the ReliaBlade project.
This paper was edited by Raimund Rolfes and reviewed by two anonymous referees.
ASTM International: ASTM D 3039-00, Standard test method for tensile properties of polymer matrix composite materials, American Society for Testing and Materials, West Conshohocken, PA, USA, https://www.astm.org/d3039_d3039m-14.html (last access: 21 December 2022), 2017. a
Bender, J. J., Hallett, S. R., and Lindgaard, E.: Parametric study of the effect of wrinkle features on the strength of a tapered wind turbine blade sub-structure, Compos. Struct., 218, 120–129, https://doi.org/10.1016/j.compstruct.2019.02.065, 2019. a, b, c
Bloom, L.D ., Wang, J., and Potter, K. D.: Damage progression and defect sensitivity: an experimental study of representative wrinkles in tension, Compos. Part B-Eng., 45, 449–458, https://doi.org/10.1016/j.compositesb.2012.05.021, 2013. a
Chan, W. S. and Chou, C. J.: Effects of delamination and ply fiber waviness on effective axial and bending stiffnesses in composite laminates, Compos. Struct., 30, 299–306, https://doi.org/10.1177/089270579400700306, 1995. a
Chan, W. S. and Wang, J. S.: Influence of fiber waviness on the structural response of composite laminates, J. Thermoplast. Compos., 7, 243–260, 1994. a
Davidson, P., Waas, A., Yerramalli, C. S., Chandraseker, K., and Faidi, W.: Effect of fiber waviness on the compressive strength of unidirectional carbon composites, in: 53rd AIAA/ASME/ASCE/AHS/ASC Structures, Structural Dynamics and Materials Conference 20th AIAA/ASME/AHS Adaptive Structures Conference 14th AIAA, 23–26 April 2012, Honolulu, Hawai, p. 1422, https://doi.org/10.2514/6.2012-1422, 2012. a
Galappaththi, U. I. K., De Silva, A. M., Draskovic, M., and Macdonald, M.: Strategic quality control measures to reduce defects in composite wind turbine blades, in: International Conference on Renewable Energies and Power Quality (ICREPQ’13), 20–22 March 2013, Bilbao, Spain, https://doi.org/10.24084/repqj11.589, 2013. a
Hsiao, H. M. and Daniel, I. M.: Elastic properties of composites with fiber waviness, Compos. Part A-Appl. S., 27, 931–941, https://doi.org/10.1016/1359-835X(96)00034-6, 1996a. a, b, c
Hsiao, H. M. and Daniel, I. M.: Effect of fiber waviness on stiffness and strength reduction of unidirectional composites under compressive loading, Compos. Sci. Technol., 56, 581–593, https://doi.org/10.1016/0266-3538(96)00045-0, 1996b. a
Hassan, M. H., Othman, A. R., and Kamaruddin, S.: A review on the manufacturing defects of complex-shaped laminate in aircraft composite structures, Int. J. Adv. Manuf. Tech., 91, 4081-4094, https://doi.org/10.1007/s00170-017-0096-5, 2017. a
ISO, ISO 527-1:2012: Plastics–Determination of tensile properties – Part 1: General principles. International Organization of Standardization: Geneva, Switzerland, 2012. a
Kulkarni, P., Mali, K. D., and Singh, S.: An overview of the formation of fibre waviness and its effect on the mechanical performance of fibre reinforced polymer composites, Compos. Part A-Appl. S., 137, 106013, https://doi.org/10.1016/j.compositesa.2020.106013, 2020. a
Leong, M., Overgaard, L. C., Thomsen, O. T., Lund, E., and Daniel, I. M.: Investigation of failure mechanisms in GFRP sandwich structures with face sheet wrinkle defects used for wind turbine blades, Compos. Struct., 94, 768–778, https://doi.org/10.1016/j.compstruct.2011.09.012, 2012. a, b, c
Leong, M., Hvejsel, C. F., Thomsen, O. T., Lund, E., and Daniel, I. M.: Fatigue failure of sandwich beams with face sheet wrinkle defects, Compos. Sci. Technol., 72, 1539–1547, https://doi.org/10.1016/j.compscitech.2012.06.001, 2012. a, b, c
Lightfoot, J. S., Wisnom, M. R., and Potter, K.: Defects in woven preforms: Formation mechanisms and the effects of laminate design and layup protocol, Composites Part A-Applied S., 51, 99–107, https://doi.org/10.1016/j.compositesa.2013.04.004, 2013. a
Mukhopadhyay, S., Jones, M. I., and Hallett, S. R.: Compressive failure of laminates containing an embedded wrinkle; experimental and numerical study. Composites Part A: Applied Science and Manufacturing, 73, 132–142, https://doi.org/10.1016/j.compositesa.2015.03.012, 2015. a, b, c, d
Mukhopadhyay, S., Nixon-Pearson, O. J., and Hallett, S. R.: An experimental and numerical study on fatigue damage development in laminates containing embedded wrinkle defects, Int. J. Fatigue, 107, 1–12, https://doi.org/10.1016/j.ijfatigue.2017.10.008, 2018. a, b
O'Hare Adams, D. and Hyer, M. W.: Effects of layer waviness on the compression strength of thermoplastic composite laminates, J. Reinf. Plast. Comp., 12, 414–429, https://doi.org/10.1177/073168449301200404, 1993. a
Riddle III, W. W.: Development of reliability program for risk assessment of composite structures treating defects as uncertainty variables, Montana State University, https://scholarworks.montana.edu/xmlui/bitstream/handle/1/3024/RiddleW1213.pdf?sequence=1&isAllowed=y (last access: 20 December 2022), 2013. a
Smith, R. A., Xie, N., Nelson, L. J., and Hallett, S. R.: October. Modelling the mechanical properties of as-manufactured composite components based on 3D non-destructive characterisation, in: 11th European Conference on Non-Destructive Testing (ECNDT 2014), 6–10 October 2014, Prague, Czech Republic, 2014. a, b
Thor, M., Sauce, M. G., and Hinterhölzl, R. M.: Mechanisms of origin and classification of out-of-plane fiber waviness in composite materials – a review, J. Comp. Sci., 4, 130, https://https://doi.org/10.3390/jcs4030130, 2020. a
Thor, M., Mandel, U., Nagler, M., Maier, F., Tauchner, J., Sause, M. G., and Hinterhölzl, R. M.: Numerical and experimental investigation of out-of-plane fiber waviness on the mechanical properties of composite materials, Int. J. Mater. Form., 14, 19–37, https://doi.org/10.1007/s12289-020-01540-5, 2021. a, b
Wang, J., Potter, K. D., Hazra, K., and Wisnom, M. R.: Experimental fabrication and characterization of out-of-plane fiber waviness in continuous fiber-reinforced composites, J. Compos. Mater., 46, 2041–2053, https://doi.org/10.1177/0021998311429877, 2012. a
Wang, L.: Effects of in-plane fiber waviness on the static and fatigue strength of fiberglass (Master dissertation, Montana State University, College of Engineering, Bozeman, https://www.montana.edu/composites/documents/Lei Wang thesis.pdf (last access: 20 December 2022), 2001. a
Xie, N., Smith, R. A., Mukhopadhyay, S., and Hallett, S. R.: Modelling the mechanical properties of wrinkled composites from NDT data, in: Proceedings of the 20th International Conference on Composite Materials, 19–24 July 2015, Copenhagen, Denmark http://www.iccm-central.org/Proceedings/ICCM20proceedings/papers/paper-3210-3.pdf (last access: 20 December 2022), 2015. a, b, c
Xie, N., Smith, R. A., Mukhopadhyay, S., and Hallett, S. R.: A numerical study on the influence of composite wrinkle defect geometry on compressive strength, Mater. Design, 140, 7–20, https://doi.org/10.1016/j.matdes.2017.11.034, 2018. a, b, c
Yang, G., Yang, T., Yuan, W., and Du, Y.: The influence of surface treatment on the tensile properties of carbon fiber-reinforced epoxy composites-bonded joints, Compos. Part B-Eng., 160, 446–456, https://doi.org/10.1016/j.compositesb.2018.12.095, 2019. a
Zhu, J., Wang, J., and Zu, L.: Influence of out-of-plane ply waviness on elastic properties of composite laminates under uniaxial loading, Compos. Struct., 132, 440–450, https://doi.org/10.1016/j.compstruct.2015.05.062, 1996. 2015 a