the Creative Commons Attribution 4.0 License.
the Creative Commons Attribution 4.0 License.
 | 19 Jan 2022
Local-thermal-gradient and large-scale-circulation impacts on turbine-height wind speed forecasting over the Columbia River Basin
Yun Qian
Larry K. Berg
We investigate the sensitivity of turbine-height wind speed forecast to initial condition (IC) uncertainties over the Columbia River Gorge (CRG) and Columbia River Basin (CRB) for two typical weather phenomena, i.e., local-thermal-gradient-induced marine air intrusion and a cold frontal passage. Four types of turbine-height wind forecast anomalies and their associated IC uncertainties related to local thermal gradients and large-scale circulations are identified using the self-organizing map (SOM) technique. The four SOM types are categorized into two patterns, each accounting for half of the ensemble members. The first pattern corresponds to IC uncertainties that alter the wind forecast through a modulating weather system, which produces the strongest wind anomalies in the CRG and CRB. In the second pattern, the moderate uncertainties in local thermal gradient and large-scale circulation jointly contribute to wind forecast anomaly. We analyze the cross section of wind and temperature anomalies through the gorge to explore the evolution of vertical features of each SOM type. The turbine-height wind anomalies induced by large-scale IC uncertainties are more concentrated near the front. In contrast, turbine-height wind anomalies induced by the local IC thermal uncertainties are found above the surface thermal anomalies. Moreover, the wind forecast accuracy in the CRG and CRB is limited by IC uncertainties in a few specific regions, e.g., the 2 m temperature within the basin and large-scale circulation over the northeast Pacific around 140∘ W.
- Article
(27767 KB) - Full-text XML
- BibTeX
- EndNote


Renewable energy has become an alternative to fossil fuels in the last few decades (Al-Dousari et al., 2019), and wind-generated electricity has seen growth worldwide (Shaw et al., 2019). Wind energy provided more than 8.7 % of United States electrical power production in 2020 (https://www.eia.gov/electricity/monthly, last access: 3 April 2021), ranking as the top renewable energy source (National Renewable Energy Laboratory, 2008; Shaw et al., 2009; Oren, 2012; Willis et al., 2018). To successfully manage wind energy, it is of immense importance to accurately forecast the power supplied to the power grid (Siuta et al., 2017a), which relies on the performance of numeral weather prediction (NWP) models in representing the flow features (Siuta et al., 2017b; Willis et al., 2018; Smith and Ancell, 2019).
A major challenge in forecasting wind power generation using NWP models is the significant variability in the planetary boundary layer (PBL) flows (Smith and Ancell, 2017). In the western United States wind farms are normally located in areas with complex terrain, introducing additional complexity to wind forecasting. The performance of NWP models is sensitive to resolution, model physics, initial/boundary conditions, and parameterizations of the sub-grid processes (e.g., Yang et al., 2013, 2017, 2019; Qian et al., 2015; Siuta et al., 2017a; Berg et al., 2019, 2021; Smith and Ancell, 2019; Xia et al., 2021), which ultimately influences forecasts of wind power (Banta et al., 2013, 2018). The uncertainties associated with the model initialization decrease the reliability of the deterministic forecasts and can have serious financial consequences (Marquis et al., 2011). In an operational mesoscale model, the initial conditions (ICs) are frequently provided either by global NWP model analysis and forecasts or limited area models. Forecast uncertainties may develop from limitations in the ICs, due to their coarse grid spacing and/or the lack of sufficiently dense data sources, especially over the ocean. Deppe et al. (2013) performed a sensitivity study using ensembles of PBL schemes and IC sources. They found that the perturbation of IC produced a larger ensemble spread than application of different PBL schemes, indicating that changes (errors) in IC can lead to large uncertainties in wind flow forecasts. Smith and Ancell (2019) further reported considerable differences in the results of parametric sensitivity among the ensembles started from different ICs. By characterizing NWP model forecasting errors using Doppler-lidar measurements over the Columbia River Basin, Banta et al. (2020) suggested that the forecasting errors could be imported from upstream or generated locally at an earlier time, which emphasized the impacts of the initial status of both local thermal gradient and large-scale circulation on wind forecast. By linking the forecasting errors and IC uncertainties, Smith and Ancell (2017) successfully identified the optimal target regions where deployment of additional observations would improve wind forecasts.
The ensemble sensitivity analysis (ESA) is an efficient approach to link a forecast scalar, such as the maximum wind speed, to atmospheric variables at an earlier time. This approach utilizes a suite of ensemble simulations and has been widely used to assess the impact of IC uncertainties on forecasts (Torn et al., 2006, 2017; Ancell and Hakim, 2007; Hill et al., 2016; Smith and Ancell, 2017). The forecast scalar is usually calculated based on the temporal mean or maximum wind speed at a specific location or averaged over an area from each ensemble simulation. Then the linear regression coefficient between the forecast scalar and an initial variable is calculated to assess the impact of changes in this initial variable. Zack et al. (2010) applied ESA to wind power forecasts in California. They reported that the forecasting errors of wind speeds at 80 m above ground are sensitive to the localized atmospheric features at specific locations of a wind farm. However, responses of wind speed forecast to IC uncertainties can vary with time and space, which cannot be assessed using a single forecast scalar. Smith and Ancell (2017) defined four forecast scalars and found that the forecast uncertainties in terms of the timing and horizontal extent of the wind ramp were sensitive to different IC variables. The self-organizing map (SOM), developed by Kohonen (1982), is one of the most popular nonlinear pattern recognition techniques. This methodology allows us to identify different kinds of wind speed patterns according to the spatial distribution and temporal evolution of wind anomalies induced by IC uncertainties. In this study, we follow the ESA approach to generate a suite of ensemble simulations by perturbing IC and apply SOM analysis to link simulated wind speed features to IC uncertainties.
The Columbia River Gorge (CRG) and Columbia River Basin (CRB) in the Pacific Northwest of the United States are characterized by consistent high winds and have a large number of wind farms and over 6000 MW of installed capacity (Shaw et al., 2019; Wilczak et al., 2019; Banta et al., 2020). This region includes the Cascade Mountain Range, which is cut through by the CRG, linking the Pacific coastal plains with the inland CRB. In a typical warm season, a subtropical ridge over the eastern Pacific intensifies and moves northward, which results in a higher surface pressure building up and moving towards the Pacific Northwest coast (Baker et al., 1978), leading to strong westerly winds in the gorge. In addition, the warm season pressure gradient across the gorge is enhanced by the thermal low that often develops over the hot interior. The maximum surface temperature over the CRB often exceeds 35 ∘C in the afternoon (Banta et al., 2020). Sharp wind ramps are frequently associated with a strong thermally driven gradient, with the total aggregated normalized power generation fluctuating from near zero to 100 % (Wilczak et al., 2019). The local-thermal-gradient-induced diurnal wind patterns are often interrupted by synoptic-scale systems, such as strong cold fronts (Sharp and Mass, 2004), leading to strong wind ramps (Berg et al., 2021). The combined effects of various weather systems and a general lack of observations over the Pacific Ocean increase the complexity of wind forecast and make the forecasting errors sensitive to the atmospheric ICs over the Pacific Northwest.
This study aims to (1) assess the sensitivity of turbine-height wind speed forecasts in the CRG and CRB to IC uncertainties related to local thermal conditions and large-scale circulations and (2) identify the regions of IC uncertainties which have the largest influence on wind forecast. In particular, we focus on two typical summer weather systems associated with a local thermal gradient and large-scale cold frontal passage. Extensive efforts have been made to develop scale-adaptive physical parameterizations and parameter optimization during the Second Wind Forecast Improvement Project (WFIP2), and some of those updates been implemented in the public WRF-ARW version (Olson et al., 2019b; Shaw et al., 2019; Wilczak et al., 2019), but there has been less attention to the impact of ICs on the forecast skill (Smith and Ancell, 2019). We use ESA to generate ensemble wind forecasts from perturbed ICs. We then introduce the SOM to classify forecast anomalies and associated IC uncertainties. This paper is organized as follows: Sect. 2 introduces the case selection, experimental setup, and methods. Section 3 discusses the main results, including the common features of simulated wind speed anomalies induced by IC perturbation, four types of SOM wind speed patterns and their associated ICs, and the spatial distribution and temporal evolution of the forecasting uncertainties in different SOM types, including their vertical characteristics. Discussions and conclusions are given in Sect. 4.
2.1 Case selection and synoptic condition of case study
We selected two cases with typical weather systems in this area to assess the impacts of IC uncertainties related to local thermal conditions and large-scale circulations, represented using the 2 m temperature, and 500 hPa geopotential height and surface pressure, on the wind forecast in the CRG and CRB. Both cases occurred during the WFIP2 field campaign. In the first case, 16–17 August 2016, the local thermal-driven pressure gradient produced diurnally varying westerly winds through the gorge in the absence of strong synoptic forcing (Shaw et al., 2019). The flow characteristics were documented by Banta et al. (2020) using lidar-measured wind speed profiles taken across the CRB. The thermal-driven acceleration of the wind was observed in the late afternoon, exceeding 12 m s−1 at night over the turbine height and then gradually slowing. This case is hereafter referred to as the sea-breeze case. In the second case, 21–22 August 2016, a synoptic-scale cold frontal passage was observed in the CRB, driving cross-barrier flows over the Cascade Mountain Range. This period was marked by a wind ramp event with a maximum speed reaching 14 m s−1 in the CRG (Berg et al., 2021). We denote it hereafter as the cold-front case.
2.2 Initial condition perturbations
The Advanced Research version of the Weather Research and Forecasting Model (WRF-ARW) version 4.2 (Skamarock et al., 2019) is used. The model configuration consists of an outer domain D1 with 36 km horizontal grid spacing and an inner domain D2 with 12 km grid spacing (Fig. 1). The model includes 55 vertical layers with 10–27 model layers found in the planetary boundary layer and an approximately 15 m vertical interval within 200 m above the surface. The lateral boundary conditions (LBCs) for D1 are from the North American Regional Reanalysis (NARR; Mesinger et al., 2006) with a spatial resolution of 32 km. The LBCs for D2 are provided by D1 using one-way nesting. A standard set of model physics parameterization is used in both domains, including the MYNN-EDMF PBL scheme (Nakanishi and Niino, 2006, 2009; Olson et al., 2019a), the MYNN surface layer scheme (Dyer and Hicks, 1970), the Rapid Radiative Transfer Model longwave and shortwave radiation schemes (Iacono et al., 2008), and the aerosol-aware Thompson microphysics scheme (Thompson and Eidhammer, 2014). The Rapid Update Cycle (RUC) land surface model (Smirnova et al., 2016) is used to represent surface processes.
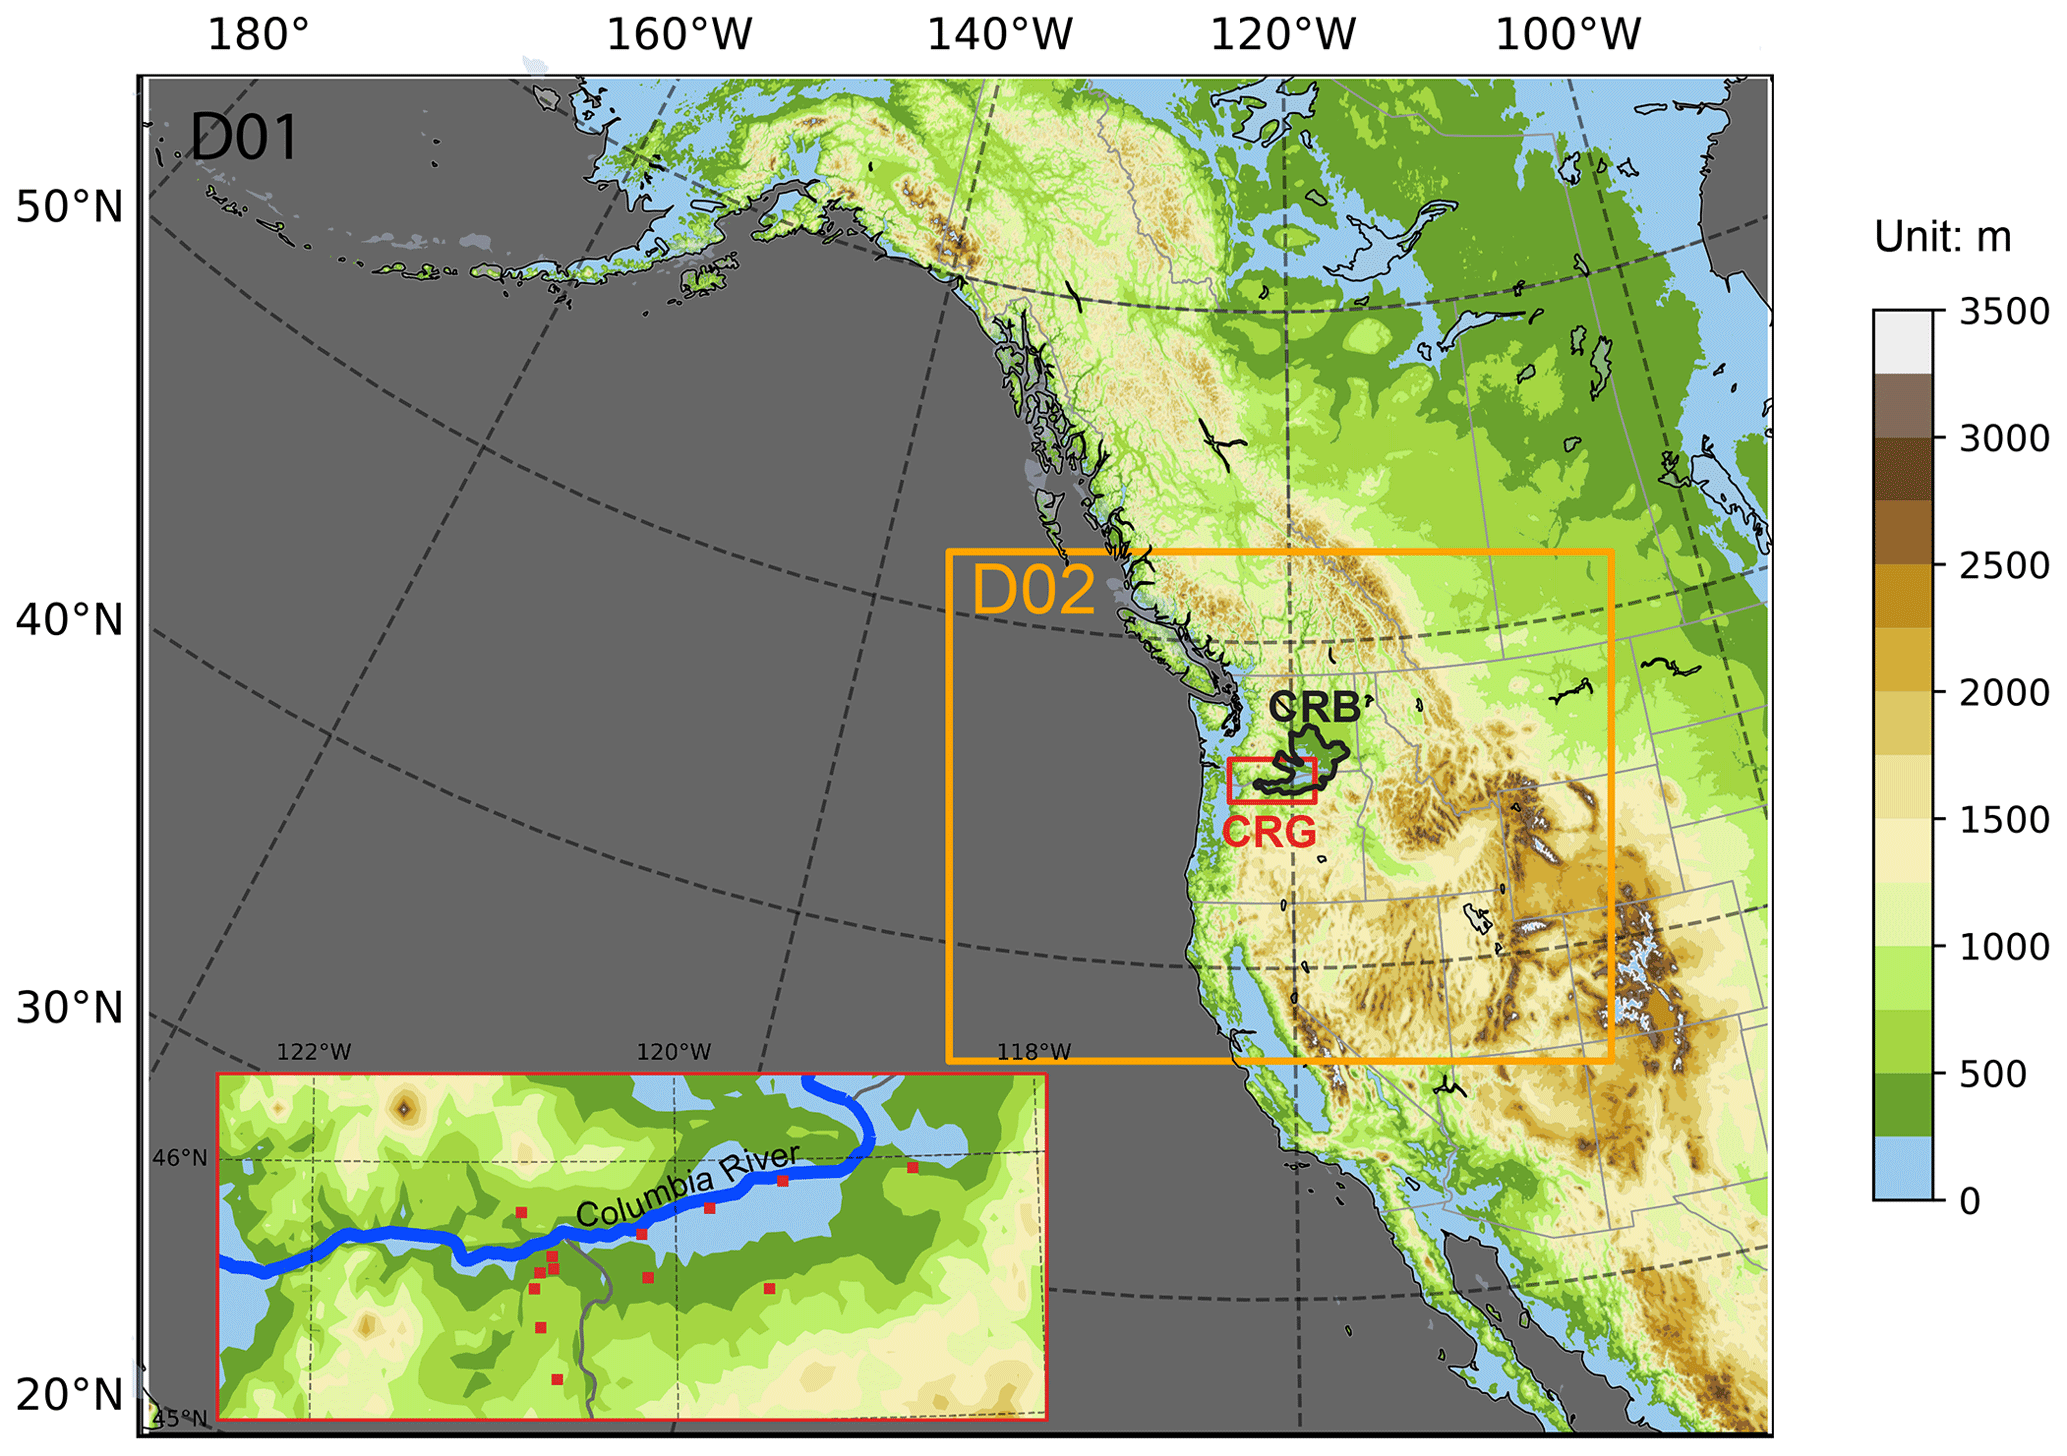
Figure 1Model domain with terrain elevation indicated by colors. The Columbia River Gorge (CRG) and Columbia River Basin (CRB) are outlined in red and black, respectively. The insert axes amplify the CRG with WFIP2 sodar and lidar locations.
For each case, a suite of 100 ensemble members is initialized from NARR forecasts perturbed using the climatological covariance in the WRF data assimilation system (WRFDA). The WRFDA system has a built-in method for generating ensemble initial conditions to add random noise to the analysis in control variable space (Barker et al., 2004). Here we perturbed the control variables including stream function, unbalanced velocity, unbalanced temperature, unbalanced surface pressure, and specific humidity, associated with initial variables wind speed, temperature, pressure, and specific humidity being randomly perturbed. Following the routine used in Smith and Ancell (2017), the ensemble members are cycled for a 48 h spin-up period to allow for the development of flow-dependent covariances. Assimilation is performed every 6 h during the spin-up period on the outer domain. After the spin-up, a 48 h extended forecast is conducted with the boundary conditions provided every 3 h by NARR. The only difference between the members in the extended forecast is their initial conditions. The starting hour of the extended forecast is denoted as 0 h. The first 6 h of the forecast is regarded as a spin-up. Therefore, uncertainties of meteorological conditions at 6 h are referred to as IC uncertainties in the following analyses.
2.3 SOM analysis
The SOM is a clustering method that projects high-dimensional data to a visually comprehensible, two-dimensional map. It provides a spatially organized set of patterns of data variability and has been widely used in atmospheric sciences (e.g., Ohba et al., 2018; Song et al., 2019; Spassiani and Mason, 2021). In this study, we apply SOM to recognize patterns of wind speed forecast anomalies and corresponding IC uncertainties. The turbine-height (80 m) wind vectors from D2 over the CRB from each ensemble member are used. The wind vectors are collected every 3 h during the 24 h time window (from 24 to 48 h) from each grid point and are used as the input vectors for SOM. In this way, the spatial distribution and temporal evolution of the wind vectors are counted during SOM clustering. The input vectors are normalized by removing the regional mean and divided by their standard deviations at each time step. During the training phase, the initial nodes for SOM clustering are assigned randomly or more efficiently, as used here, selected from the leading empirical orthogonal functions (EOFs). Then the input vectors are mapped to nodes with the closet prototype vector using a Euclidean distance measured between the input vector and the initial nodes. The best-matching node (or the winner node) is the one with the smallest distance. Then the winner nodes are adapted to represent the distribution of the data better, and a neighborhood function is applied to determine the strength of adaptation of the adjacent node. The neighborhood function determines how many neighborhood nodes around the winner node are to be adjusted and the rate of change. The adjusted number of neighborhood node decreases with the order number of the current iteration, and the rate of change for a neighborhood node decreases with its distance to the winner node. The choice of prescribed SOM node number is a trade-off between distinctiveness and robustness. We test six-node SOM clustering for the sea-breeze (Fig. S1 in the Supplement) and cold-front (Fig. S2) cases. The results show that some nodes are redundant. Therefore, we choose four nodes for both cases, which allow us to capture distinct patterns of forecast wind speed while minimizing redundant nodes that are similar. The abovementioned SOM clustering is based on basin-wide turbine-height wind vectors over the CRB. Besides, we also conduct SOM clustering using WRF-simulated wind speed taken at grid points closest to the 13 observation sites located over the CRG. The two SOM clustering results will be compared to discuss the robustness of our findings in Sect. 4.
3.1 Common features of the simulated winds and associated initial conditions
Our analysis starts with introducing the meteorological background during the two cases, followed by the common features associated with wind forecast anomalies induced by IC uncertainties.
For the sea-breeze case, a weak large-scale forcing is observed over the Pacific Northwest, consisting of a deepened Aleutian Low and weakened North American trough, a slightly southwest–northeast-tilted westerly jet, and eastward extension of the subtropical high (Fig. S3). The daytime temperature exceeds 35 ∘C in the CRB and is about 10 ∘C warmer than the coastal areas. The thermal-driven flows dominate the CRG and CRB and have distinct diurnal variations. The CRG wind speed indicates that the winds reach peak speed near 21:00 LT (local time), weakening the following morning (Fig. 2a). There is generally good agreement between the observed and simulated wind speed across the CRG for the first 30 h (of 48 h period), but the simulated wind speed decreases quickly after that. The peak wind speed (observed at forecast hour 29) features strong westerly winds east of the Cascade Mountains and across the gorge (Fig. 2c).
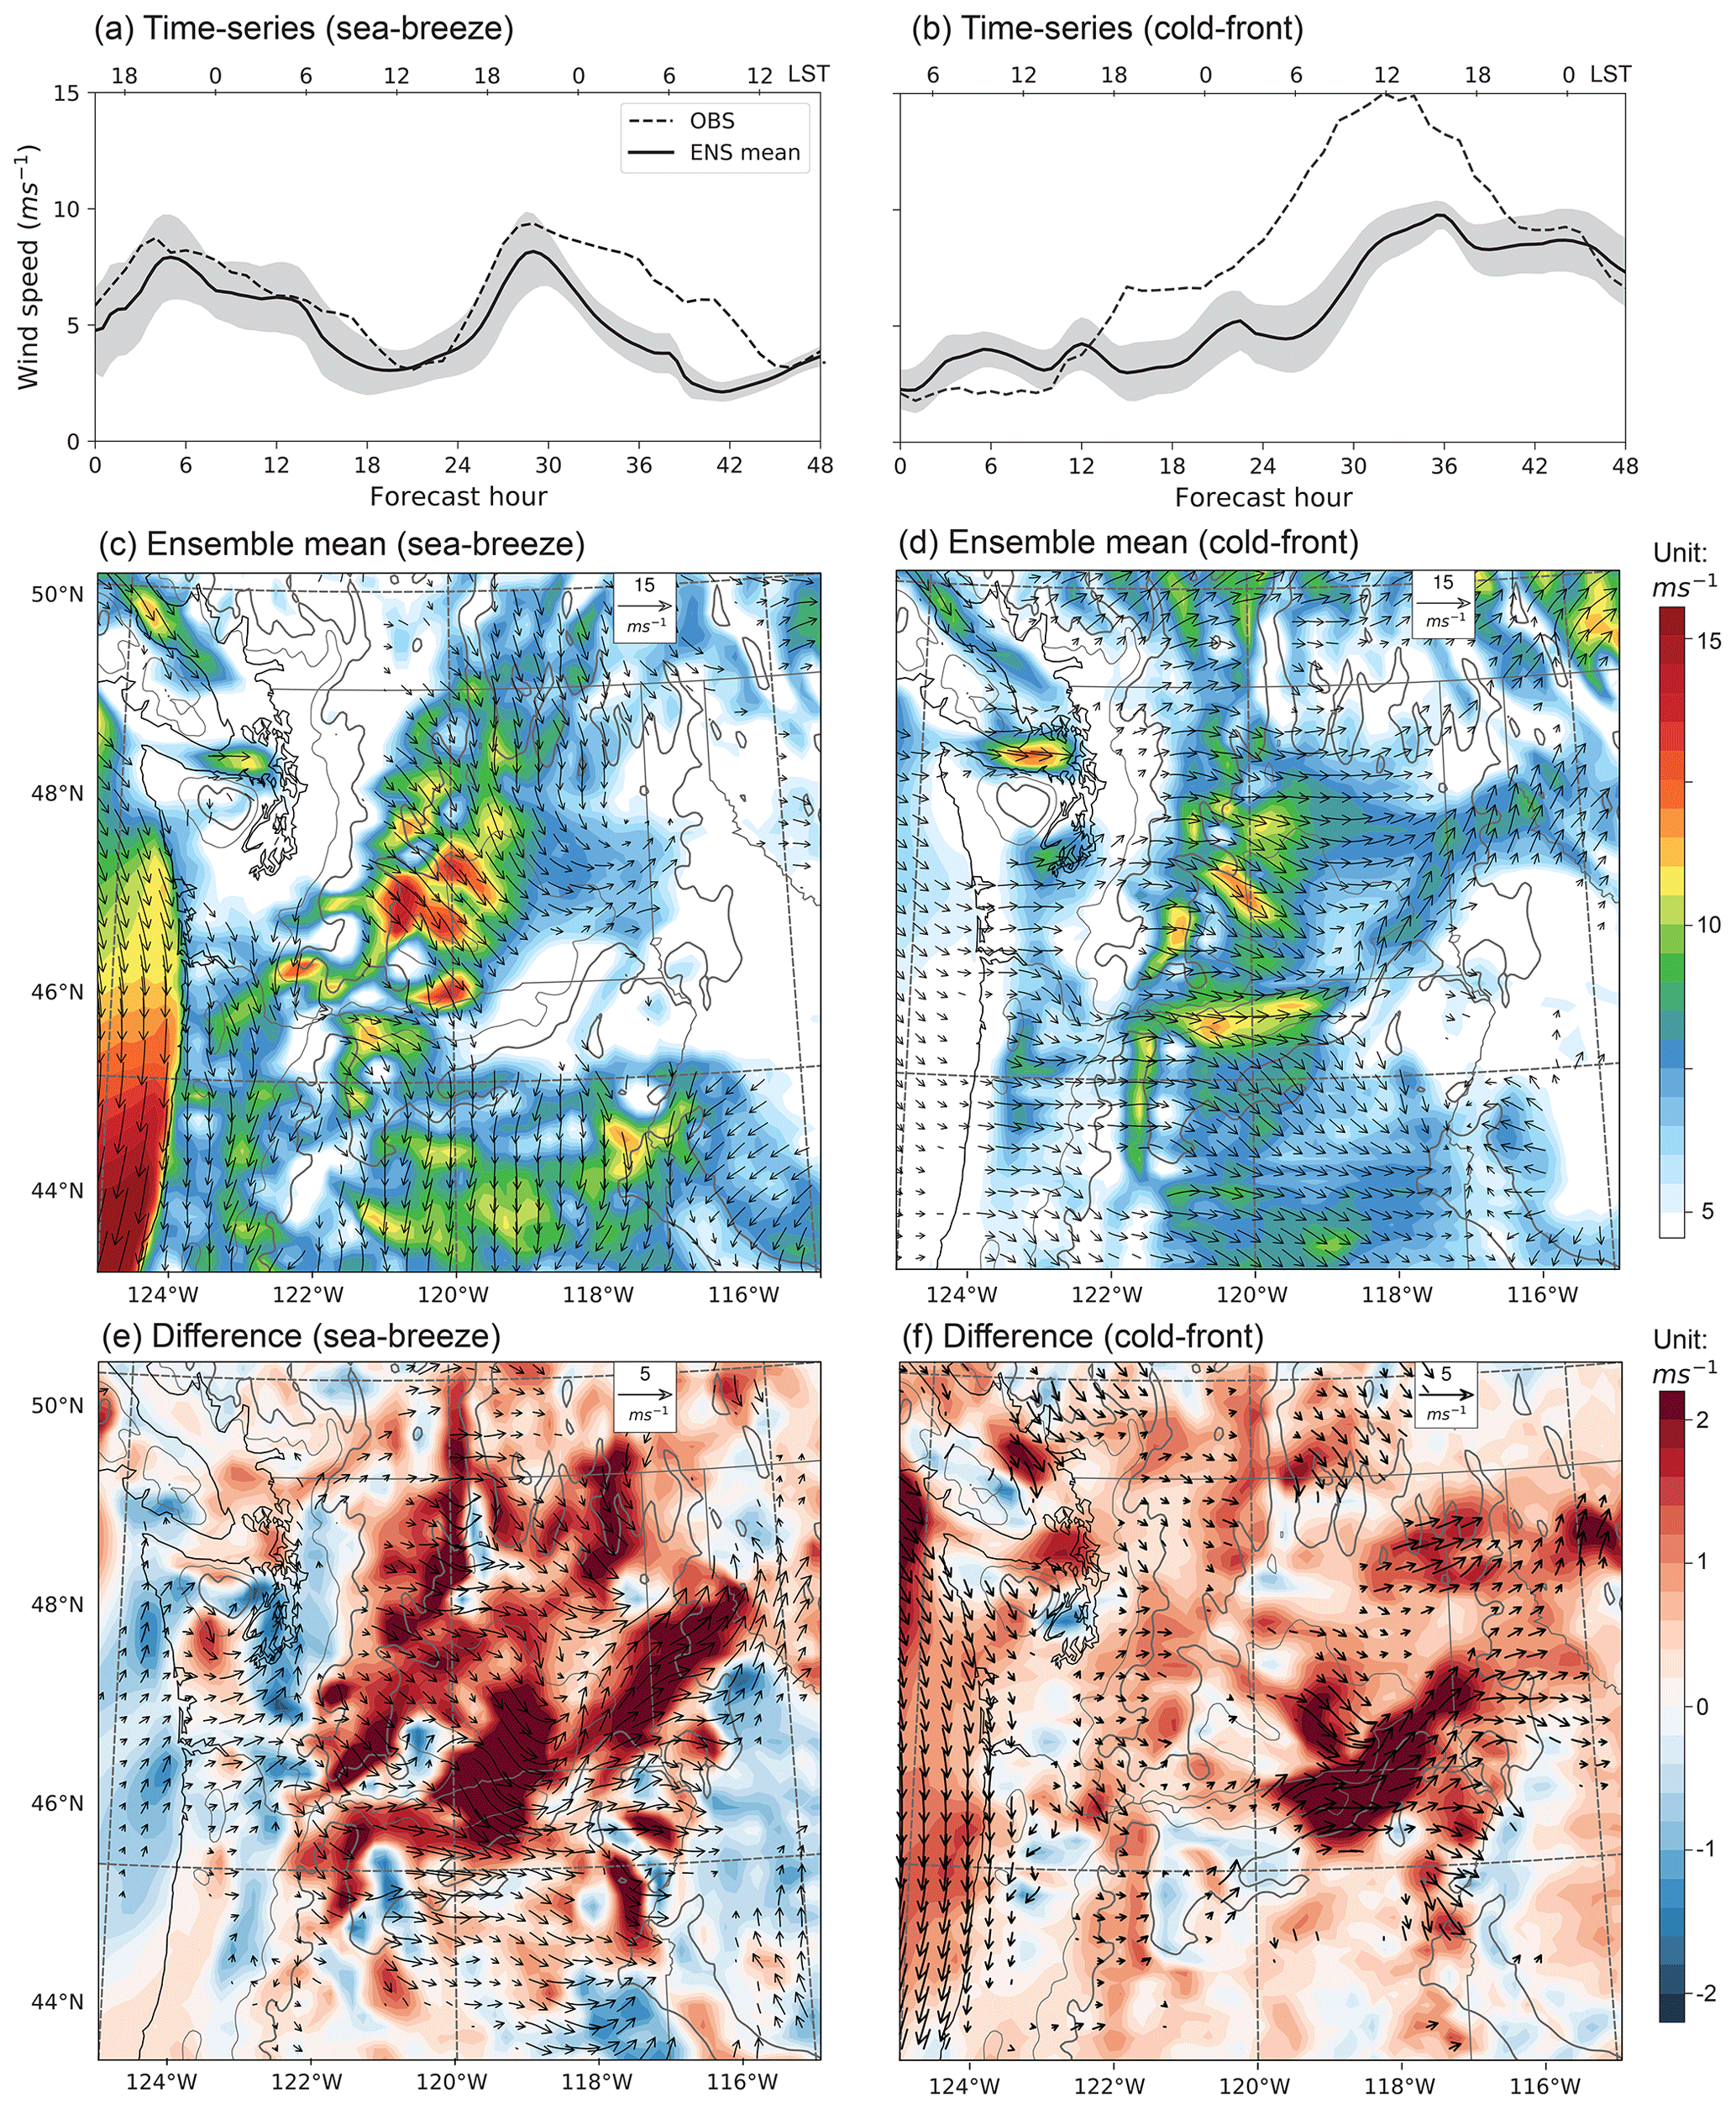
Figure 2(a) Time series of observed and simulated turbine-height wind speed computed across 13 observation sites, as well as time series of the simulated range between the 2.5th and 97.5th percentiles of ensemble members, (c) ensemble mean wind speed at 29 h, and (e) composite differences between two sets with wind speed greater or less than the ensemble mean at 29 h for the sea-breeze case. Panels (b), (d), and (f) are the same as panels (a), (c), and (e), respectively, but for the cold-front case and (d, f) at forecast hour 35. LST in panels (a) and (b) stands for local solar time. Gray lines in panels (c)–(f) indicate terrain elevation of 500 (thin) and 1000 m (thick). Wind vectors are shown when either the zonal or meridional wind anomalies are greater than 5 m s−1 (c, d) and significant at the 0.05 level (e, f), respectively.
To assess the common features of the wind forecast anomalies induced by IC uncertainties, we divide the ensemble members into two sets based on whether their basin-averaged turbine-height wind speed is greater or less than the ensemble mean averaged over 24–48 h. The wind speed differences between the two sets are mostly found within the basin, with westerly components across the gorge (Fig. 2e). The wind differences are associated with a dipole change in 500 hPa geopotential height (GPH), increasing over the southwest United States and the adjacent Pacific and decreasing over the British Columbia and coastal areas at 6 h (Fig. 3a). The pattern aloft suggests that the eastward extension of the subtropical high and the southward displacement of the 500 hPa jet at 6 h tend to accelerate wind speed in the CRB during hours 24–48 of the forecast. The wind speed difference is also associated with enhancement of surface low (Fig. 3b) and warming (Fig. 3c) over the northwest United States at 6 h. This anomalous surface pattern has been observed to enhance the sea-breeze forcing and turbine-height wind speed (Wilczak et al., 2019).
For the cold-front case, the North American trough is deeper than the sea-breeze case, and the subtropical high extends northward, tilting the westerly jet toward a northwest–southeast orientation (Fig. S4). The surface is characterized by an offshore ridge and an inland low-pressure center. The CRG turbine-height wind speed ranges from 2 to 15 m s−1, peaking at forecast hour 35 (Fig. 2b). The model simulations capture the wind ramp event, but the simulated increase in wind speed is smaller and occurs later than is observed. The underestimation also exists in our previous study using a small domain for the same location and period but is smaller in magnitude than the current analysis (Berg et al., 2021). Therefore, we assume that forecasting uncertainties from the outer domain may cause underestimation of the wind speed. The common features for the cold-front case are very different from those in the sea-breeze case. Wind speed differences in the cold-front case broadly spread over the Pacific Northwest and offshore regions (Fig. 2f). The acceleration of the turbine-height wind is associated with a positive 500 hPa GPH anomaly over the northeast Pacific Ocean and a negative one to the southwest of it at 6 h (Fig. 3d). A decrease in 500 hPa GPH is also found coastal Canada. The pattern aloft suggests a further northeastward displacement of subtropical high towards the coast and a clockwise tilting of the westerly jet towards the basin. In response to IC anomalies aloft, a similar pattern is found in surface pressure (Fig. 3e), where the pressure gradient intensifies between the northeast Pacific Ocean and northwest US. The large-scale pattern accelerates wind speed over 24–48 h in the northwest US. Meanwhile, the moderate anomalous warming over the east Cascade Mountains at 6 h enhances the local thermal gradient, which also facilitates the subsequent wind speed increase (Fig. 3f).
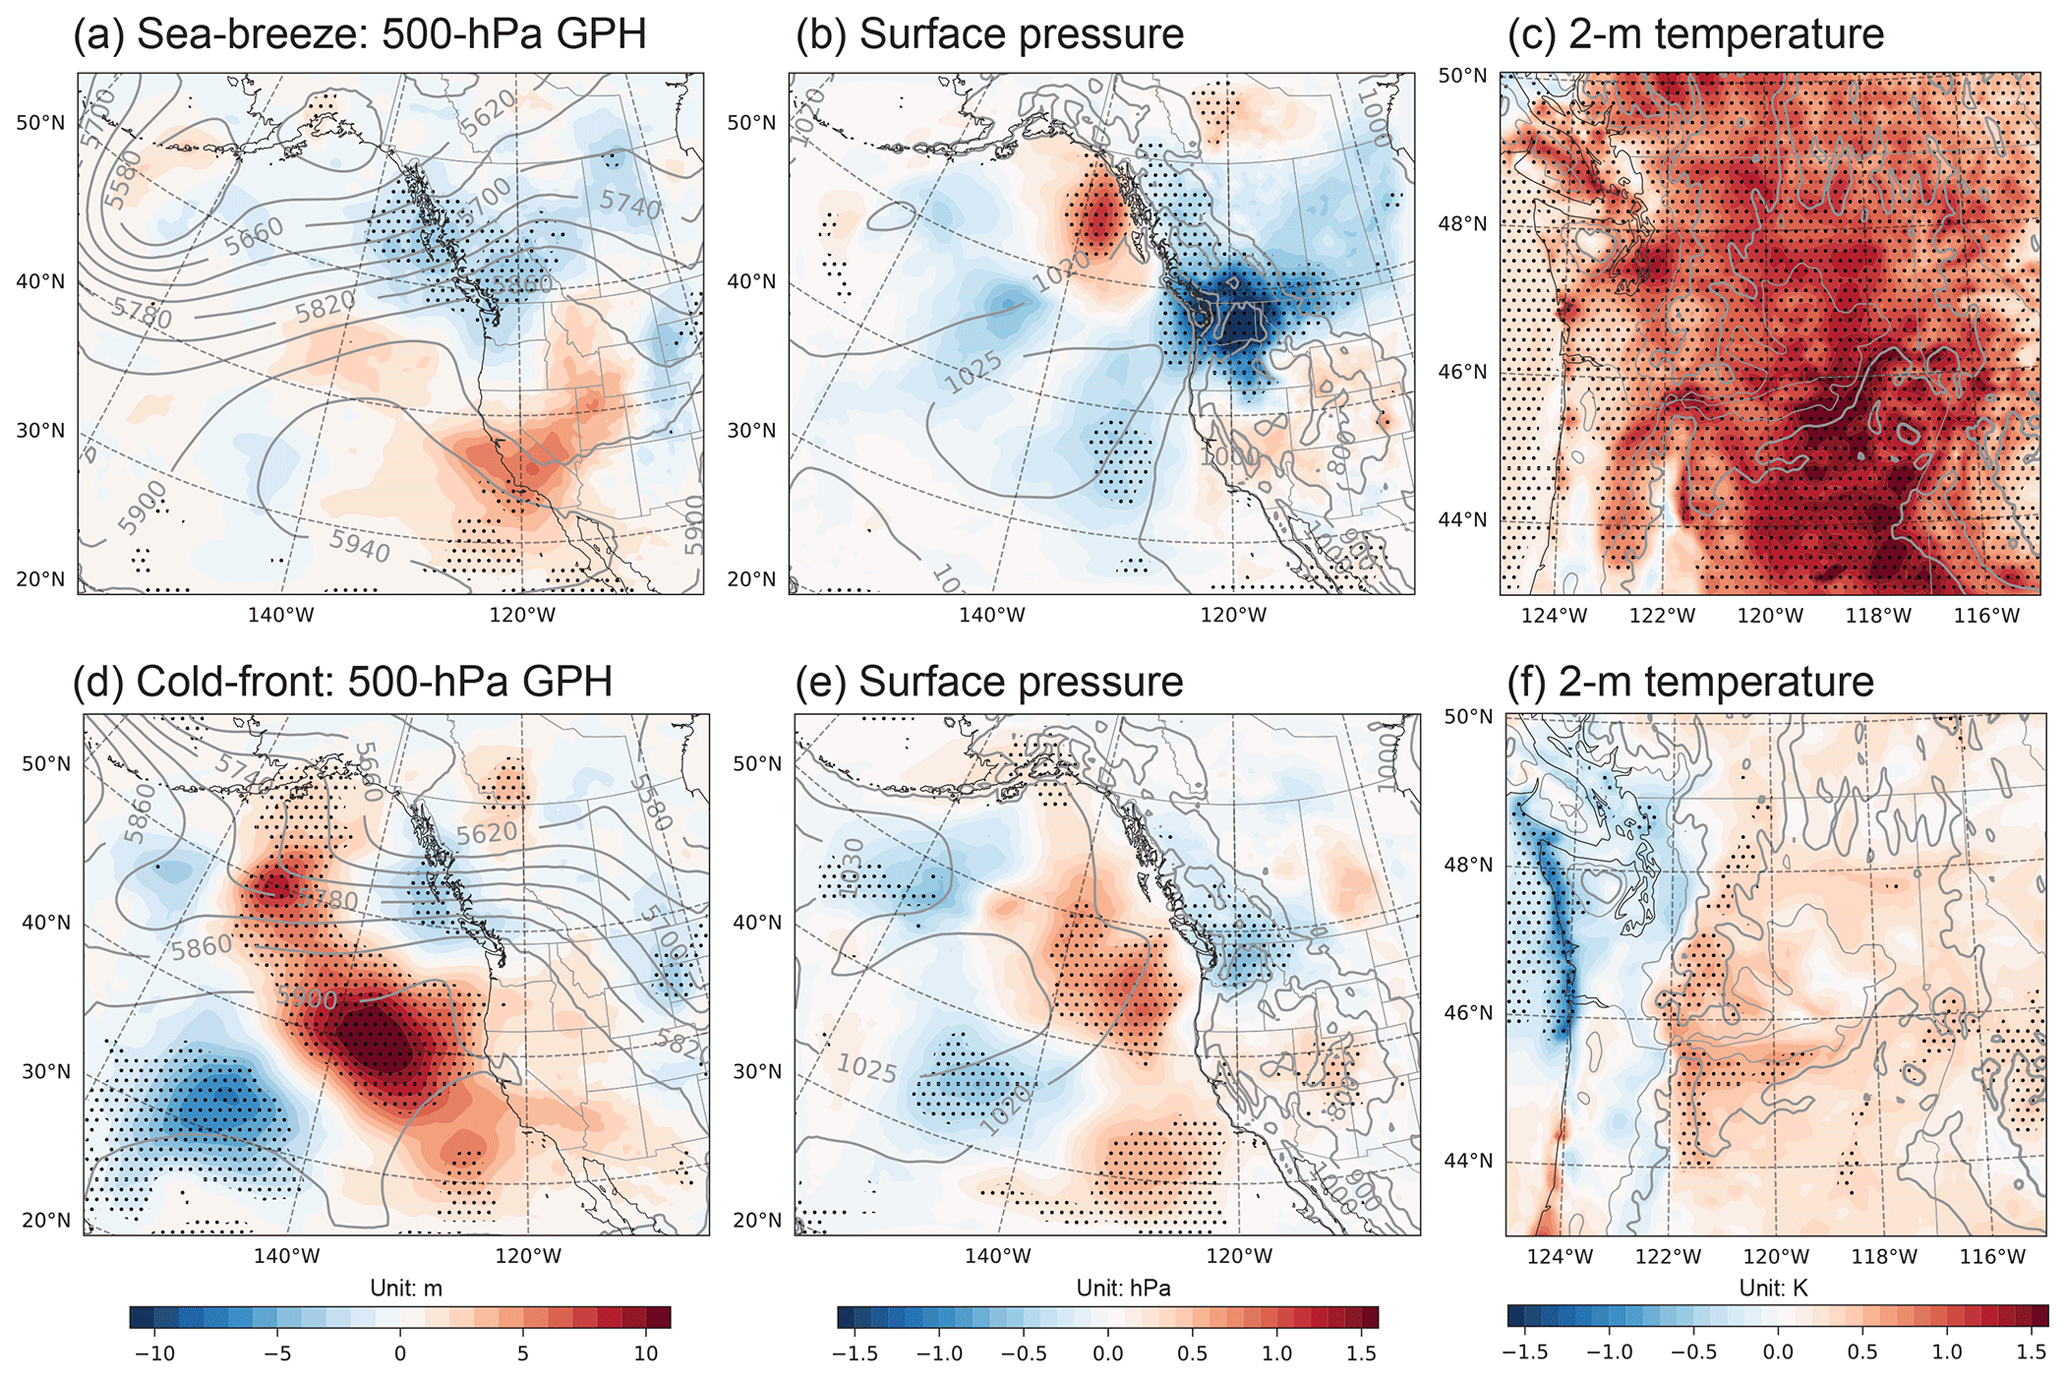
Figure 3Composite differences in (a) 500 hPa GPH, (b) surface pressure, and (c) 2 m temperature for the sea-breeze case at forecast hour 29. Panels (d)–(f) are the same as panels (a)–(c) except for the cold-front case and at forecast hour 35. The areas with dots indicate the differences are significant at the level of 0.05. The contours in panels (a), (b), (d), and (e) are the ensemble mean at the initial hour. Gray lines in panels (c) and (f) indicate terrain elevation of 500 (thin) and 1000 m (thick).
The common feature analyses suggest that the wind speed anomalies over the CRG and CRB in both sea-breeze and cold-front cases are linked to IC uncertainties. The sea-breeze case features wind speed anomalies that are mainly within the basin and a thermally induced surface pressure gradient along the coast at the initial hour. In contrast, anomalous winds are found broadly over the whole Pacific Northwest in the cold-front case, with large anomalies in the 500 hPa heights and surface pressure leading to impacting large-scale circulation.
3.2 Four types of anomalous turbine-height wind speed and their associated initial conditions
We utilize SOM, which considers the spatial distribution and temporal evolution of wind speed forecasts, to categorize the patterns of wind anomalies into four types using wind vectors over the basin during 24–48 h. The mean of wind speed for each SOM type generally resembles the ensemble means shown in Fig. 2c and d, yet there are differences in the magnitude of wind speed between different types. Types are sorted by wind speed, so that type 1 has the strongest winds across the gorge and basin; types 1 and 2 generally correspond to the larger wind speeds, while types 3 and 4 correspond to the weaker winds.
During the sea-breeze case, the first SOM type is marked with persistently strong winds, with maximum anomalies occurring at 29 h (about 1.5 m s−1, Fig. 4). Strong westerly winds are found in the CRG and CRB (Fig. 5a). Positive and negative 500 hPa GPH anomalies are found at 6 h in the southwest United States and British Columbia, respectively (Fig. 6a). At the same time, a strong 2 m temperature warming east of the Cascade Mountains enhances the local thermal gradient, strengthening the thermal low over the basin. The enhanced inland warming is the primary driver that accelerates westerly winds through the sea-breeze mechanism (Fig. 6e and i). Type 4 shows opposite signals to type 1 in anomalous wind speed and direction, 500 hPa GPH, surface pressure, and temperature (Figs. 5d and 6d, h, l). Types 1 and 4, accounting for 50 % of the ensemble members, are consistent with the common features associated with turbine-height wind forecasting anomaly (Fig. 2). These two types represent the impact of IC uncertainties that alter the weather system.

Figure 4Time series of turbine-height wind speed during the sea-breeze case averaged (a) over the basin (CRB) and (b) across the gorge (CRG). The solid black line indicates the ensemble mean, while the colored lines indicate the mean of each SOM type. The envelope shows the 2.5th and 97.5th percentiles of ensemble members. Numbers in parentheses indicate the percentage of each type.
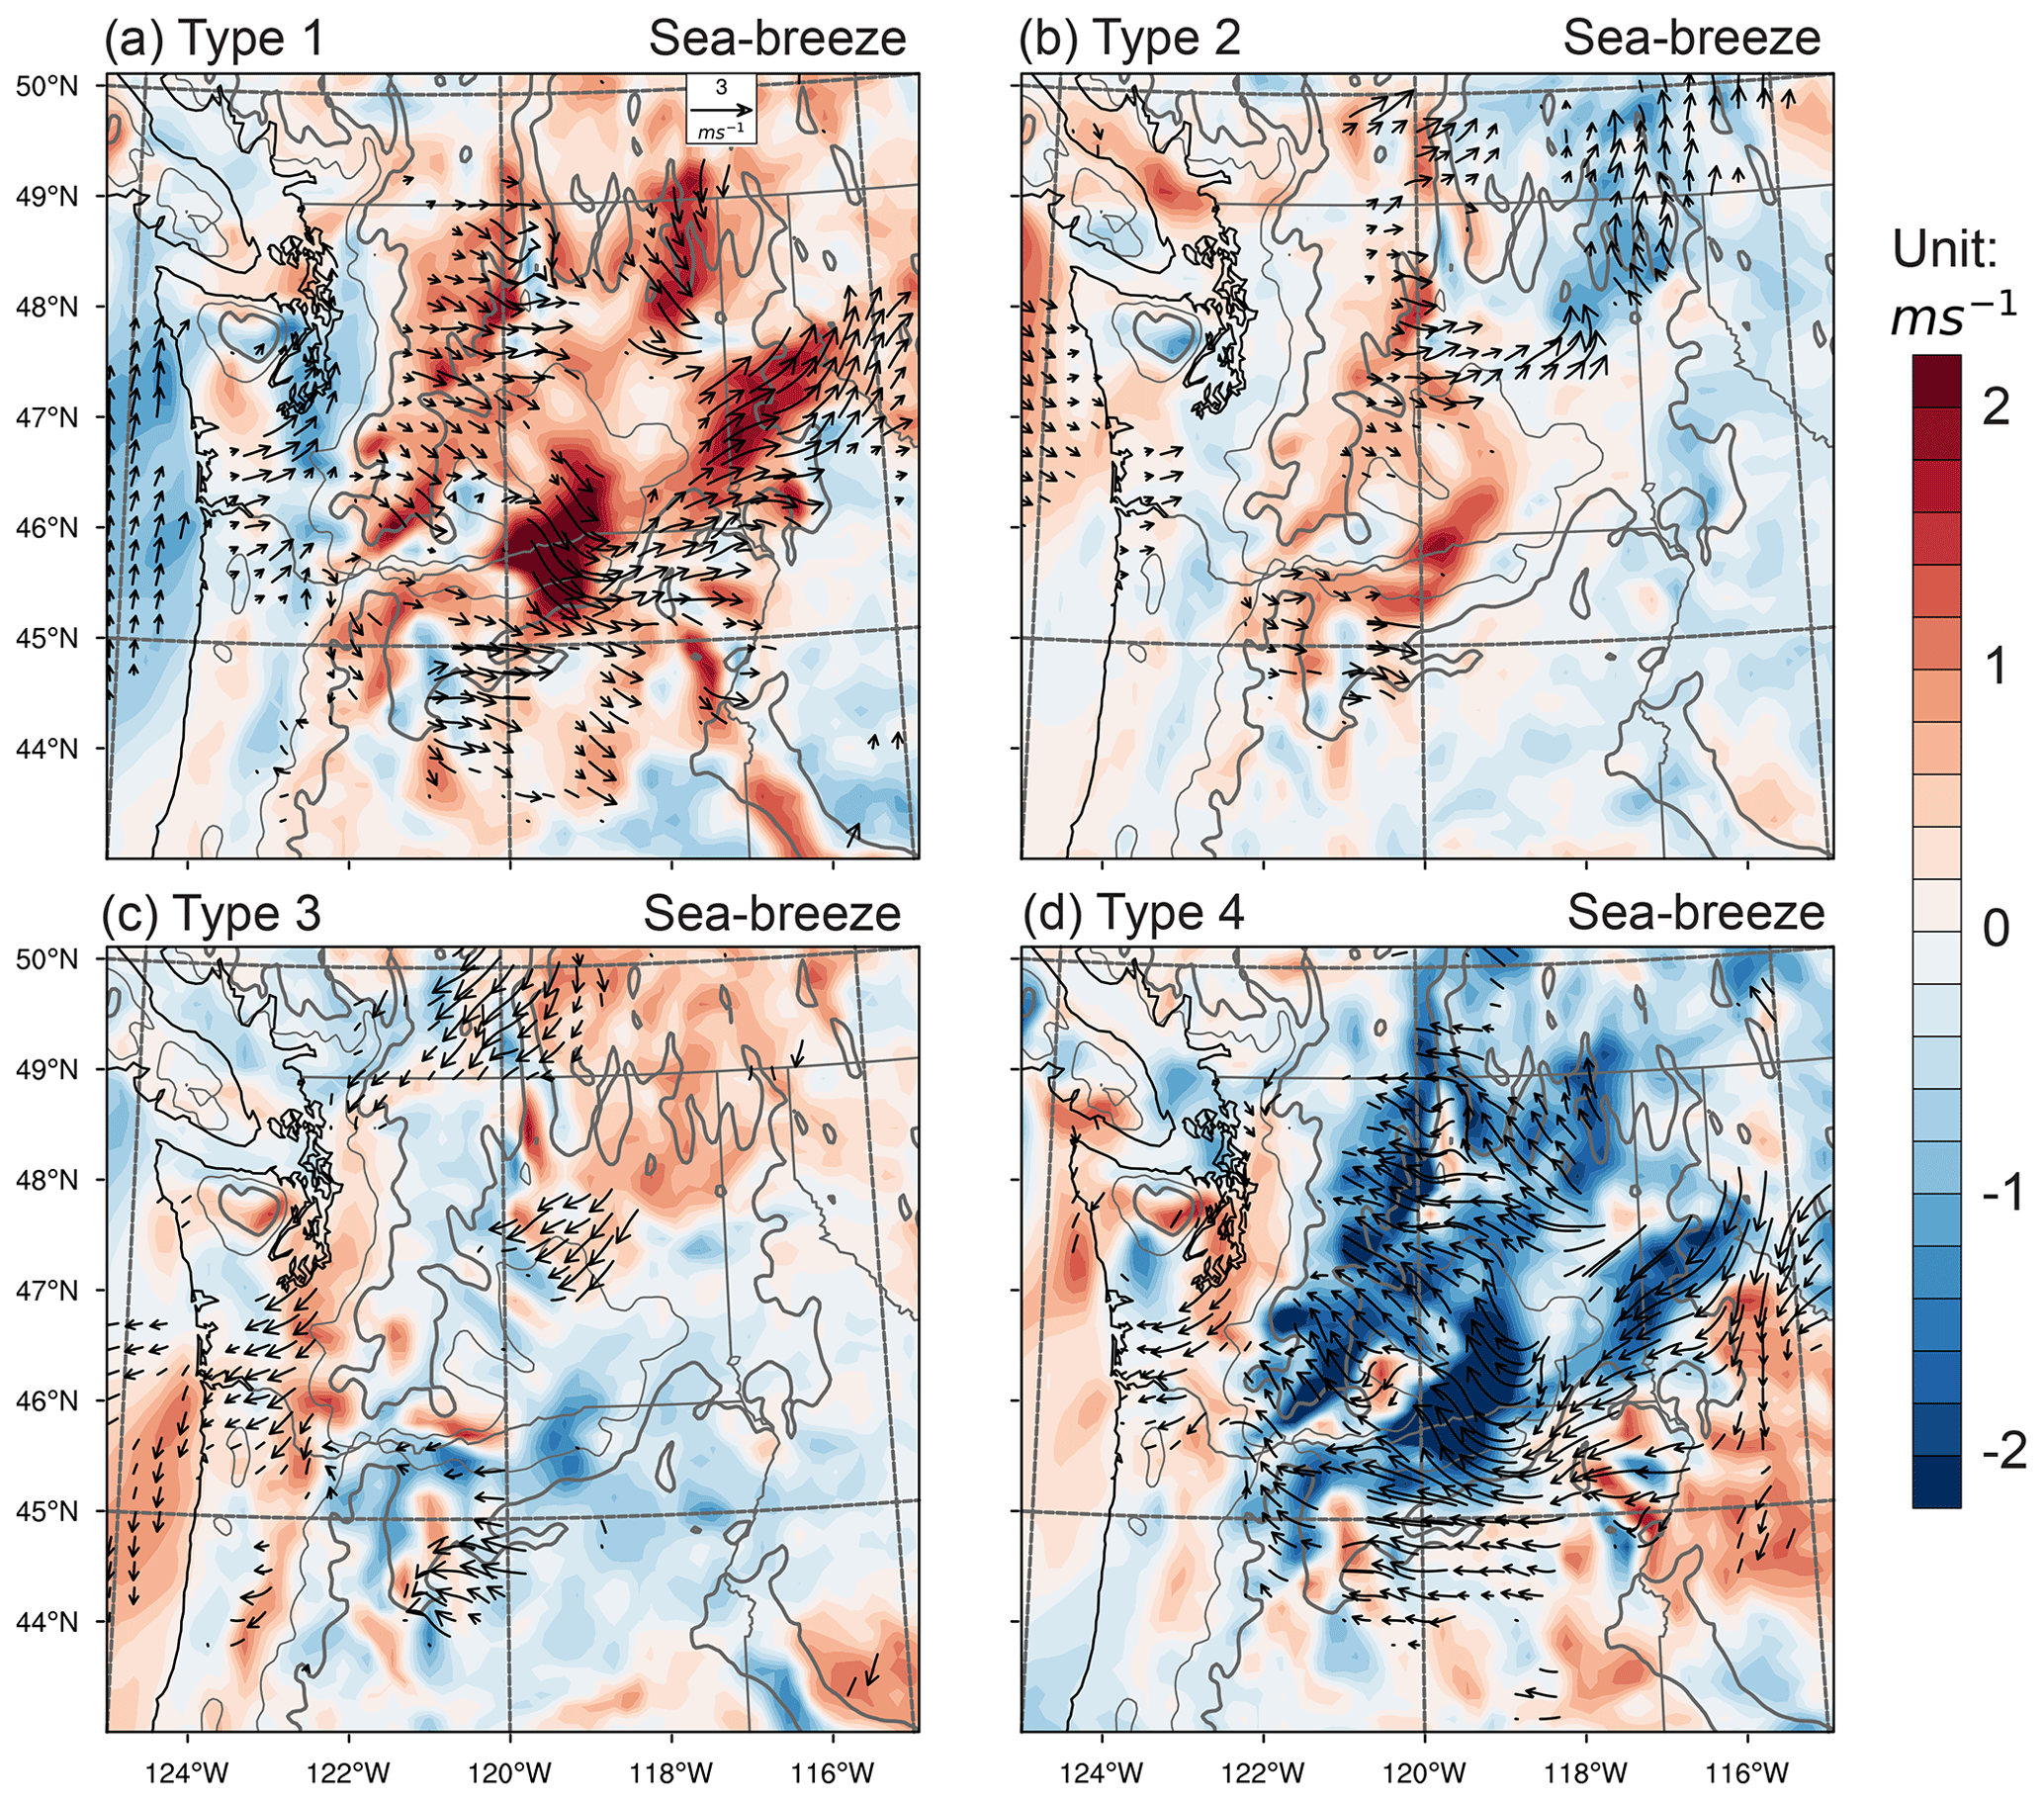
Figure 5Turbine-height wind speed differences from the ensemble mean of each SOM type for the sea-breeze case at 29 h. Wind vectors are shown when either the zonal or meridional wind anomalies are significant at the 0.05 level. Colors indicate the wind speed anomaly. Gray lines indicate terrain elevation of 500 (thin) and 1000 m (thick).
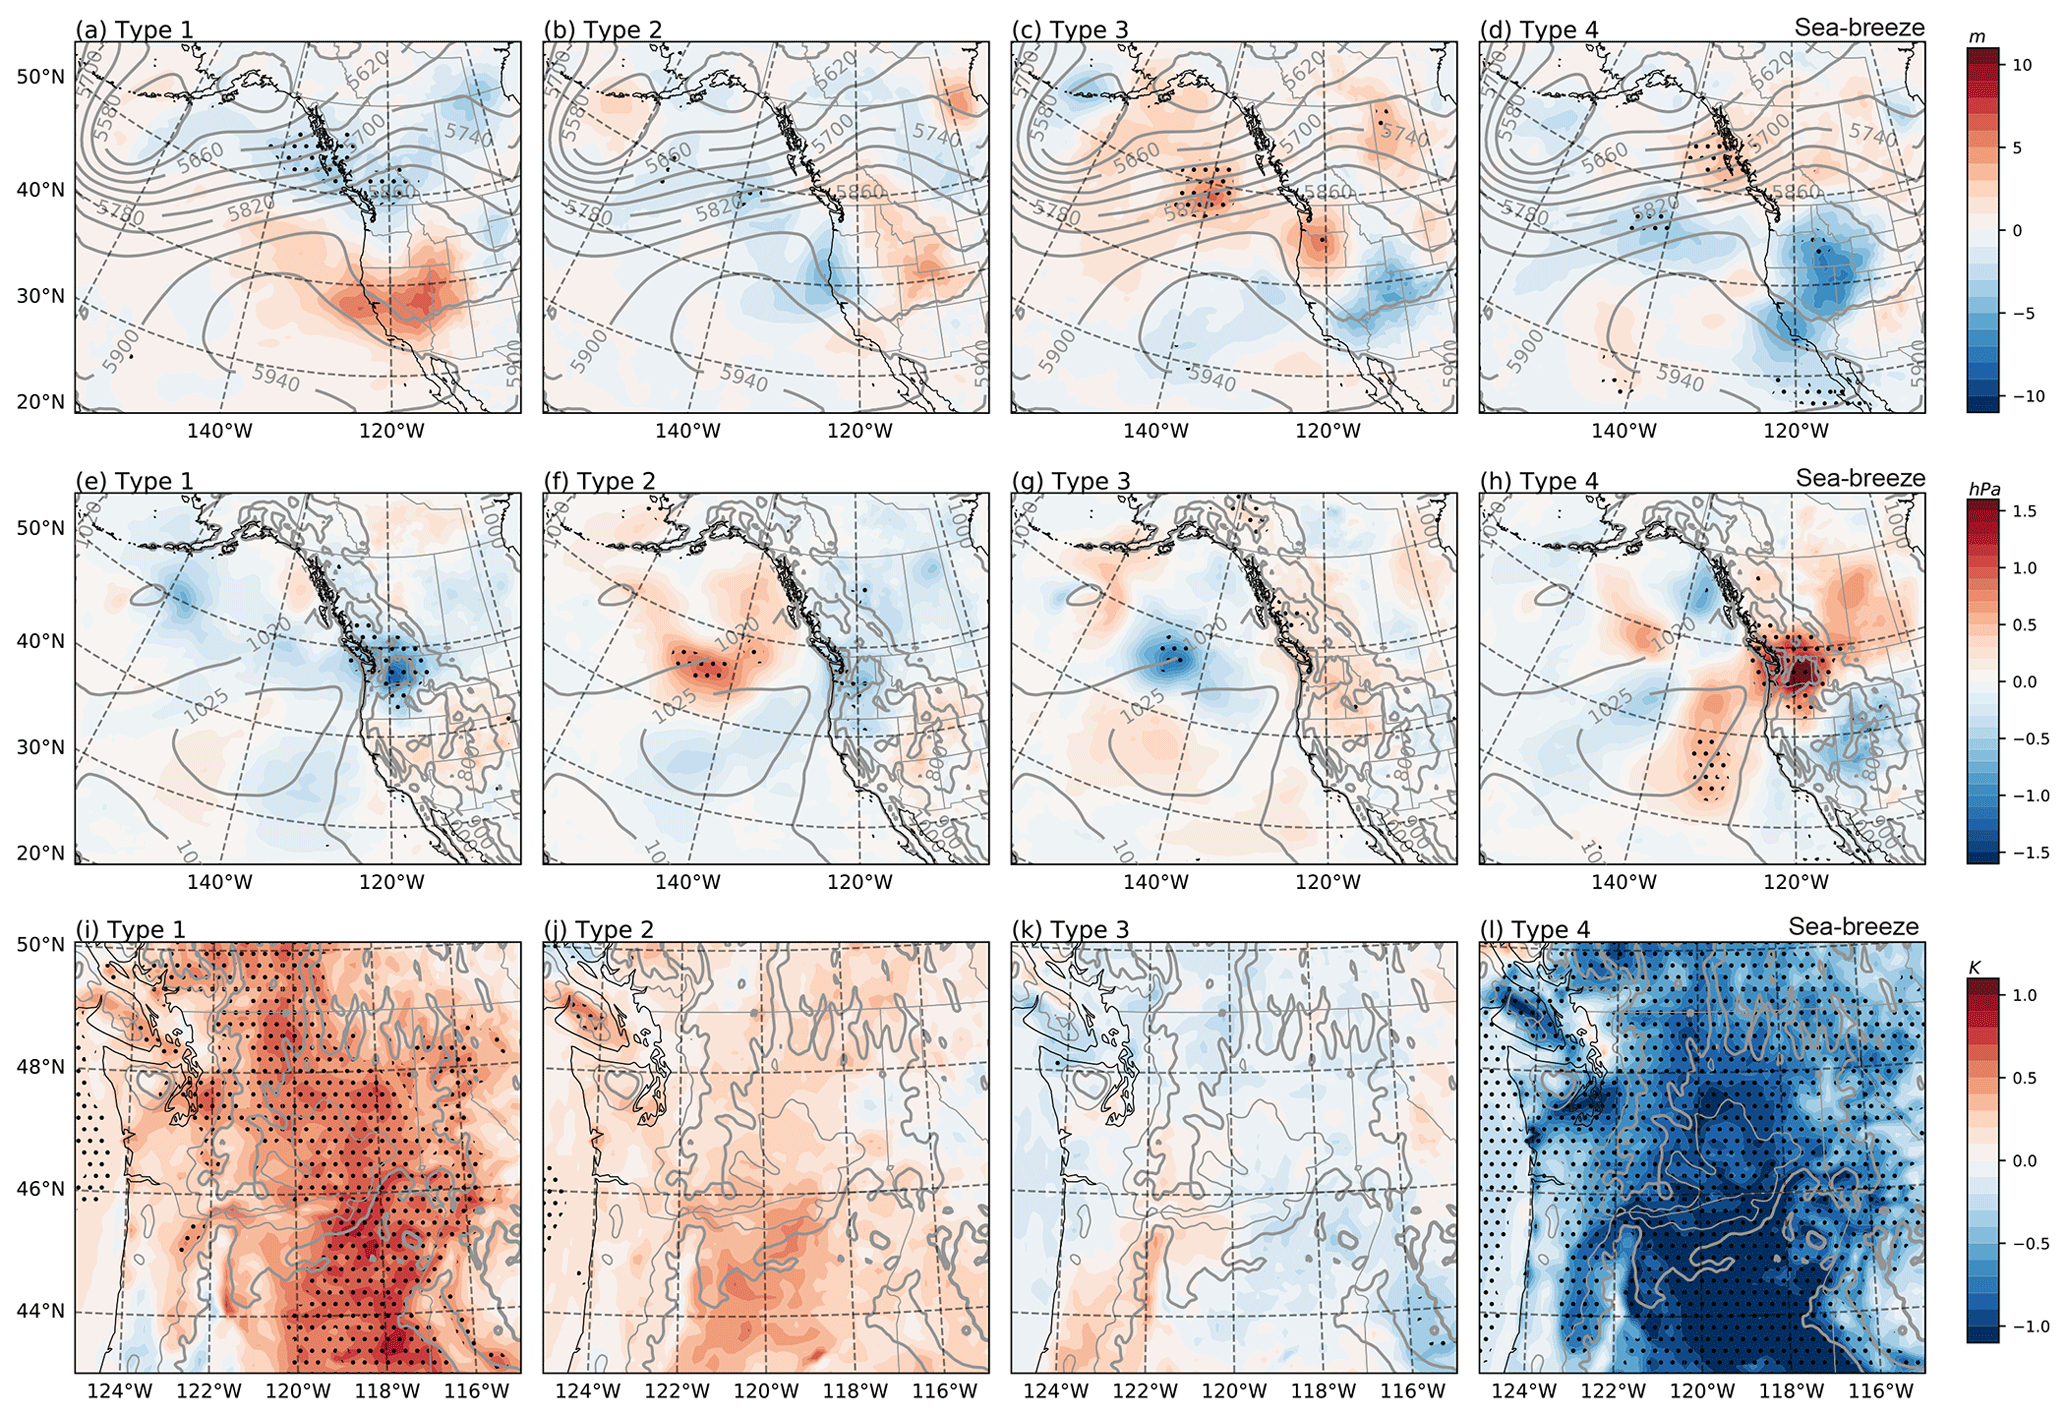
Figure 6(a–d) 500 hPa geopotential height, (e–h) surface pressure, and (i–l) 2 m temperature anomaly for each SOM type from ensemble average for the sea-breeze case at 6 h. Contours in panels (a)–(h) indicate the ensemble average. Gray lines in panels (i)–(l) indicate terrain elevation of 500 (thin) and 1000 m (thick). The dots indicate the differences are significant at the level of 0.05.
For type 2, we also find an enhanced inland heating at 6 h, which is weaker than that in type 1 and causes a non-significant surface low over the CRB (Fig. 6f and j). Meanwhile, a significant positive surface pressure anomaly establishes over the northeast Pacific Ocean around 140∘ W, although there is no significant change in 500 hPa GPH (Fig. 6f). This large-scale anomaly and enhanced inland heating jointly contribute to intensifying surface pressure gradient over the Pacific Northwest, highlighting the importance of uncertainties in local thermal gradient and large-scale circulation. As a result, a moderate wind speed acceleration is found in type 2 (Fig. 5b), with a maximum of 0.7 m s−1 increase at 29 h. Different from type 1, wind speed accelerations in type 2 are only found in the CRG and downwind of the Cascade Mountains. Type 3 has general opposite signals to type 2. An anomalous low-pressure center is found over the northeast Pacific Ocean, accompanied by a moderate cooling (non-significant with warming spots) in the basin. Those anomalies are responsible for wind speed decrease in type 3 by decreasing pressure gradient over the Pacific Northwest. We find that changes in 500 hPa GPH tend to weaken the westerly jet, which may also contribute to negative wind anomaly over the basin. Types 2 and 3 correspond to the combination of moderate uncertainties in initial local thermal gradient and large-scale circulation, which leads to distinct anomalous flows across the gorge.
During the cold-front case, type 1 corresponds to persistently strong winds over the simulation period (Fig. 7), with enhanced westerly winds found across the Cascade Mountains and east of the CRB, as well as enhanced northerly winds offshore (Fig. 8a). Those anomalous winds are associated with dipole anomaly centers at 500 hPa GPH in the northeast Pacific, which suggests a northeast displacement of the subtropical high (Fig. 9a). At the surface, a significant surface pressure increase is found offshore, indicating a strengthening of the surface pressure gradient. The large-scale changes in 500 hPa GPH and surface pressure in type 1 are both conducive to cold-front development. In contrast, type 4 features persistently weak winds (Fig. 7b), anomalous easterly flows east of the Cascade Mountains and southerly flows offshore (Fig. 8d), and large-scale ICs that are unfavorable to cold-front development (Fig. 9d and h). Consistent with our findings in the sea-breeze case, types 1 and 4 here represent the impact of IC uncertainties that alter the weather system. Yet during the cold-front case, strong wind anomalies associated with types 1 and 4 are primarily driven by large-scale IC anomalies, while they are mainly caused by local thermal gradients during the sea-breeze case.
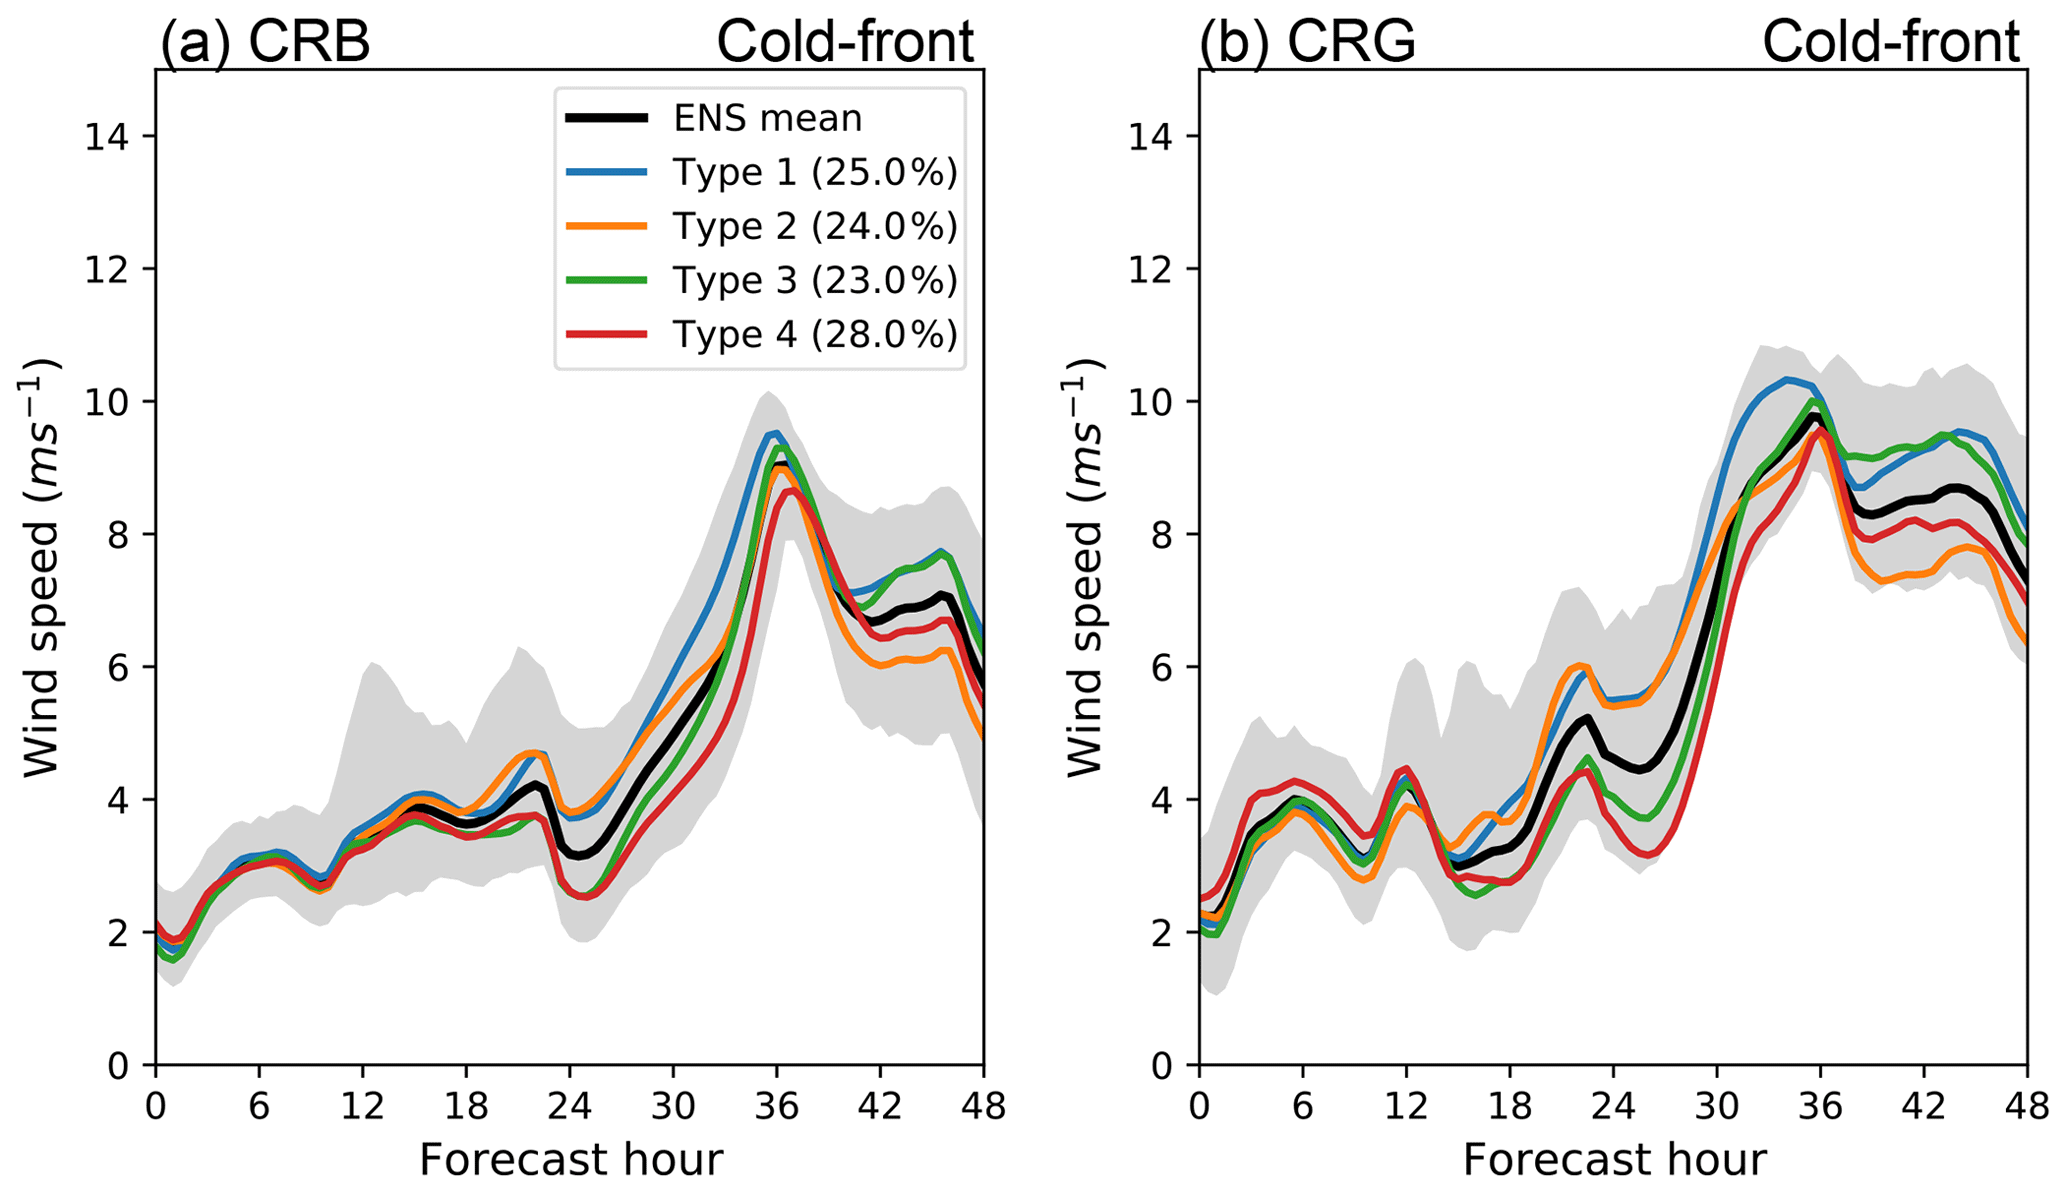
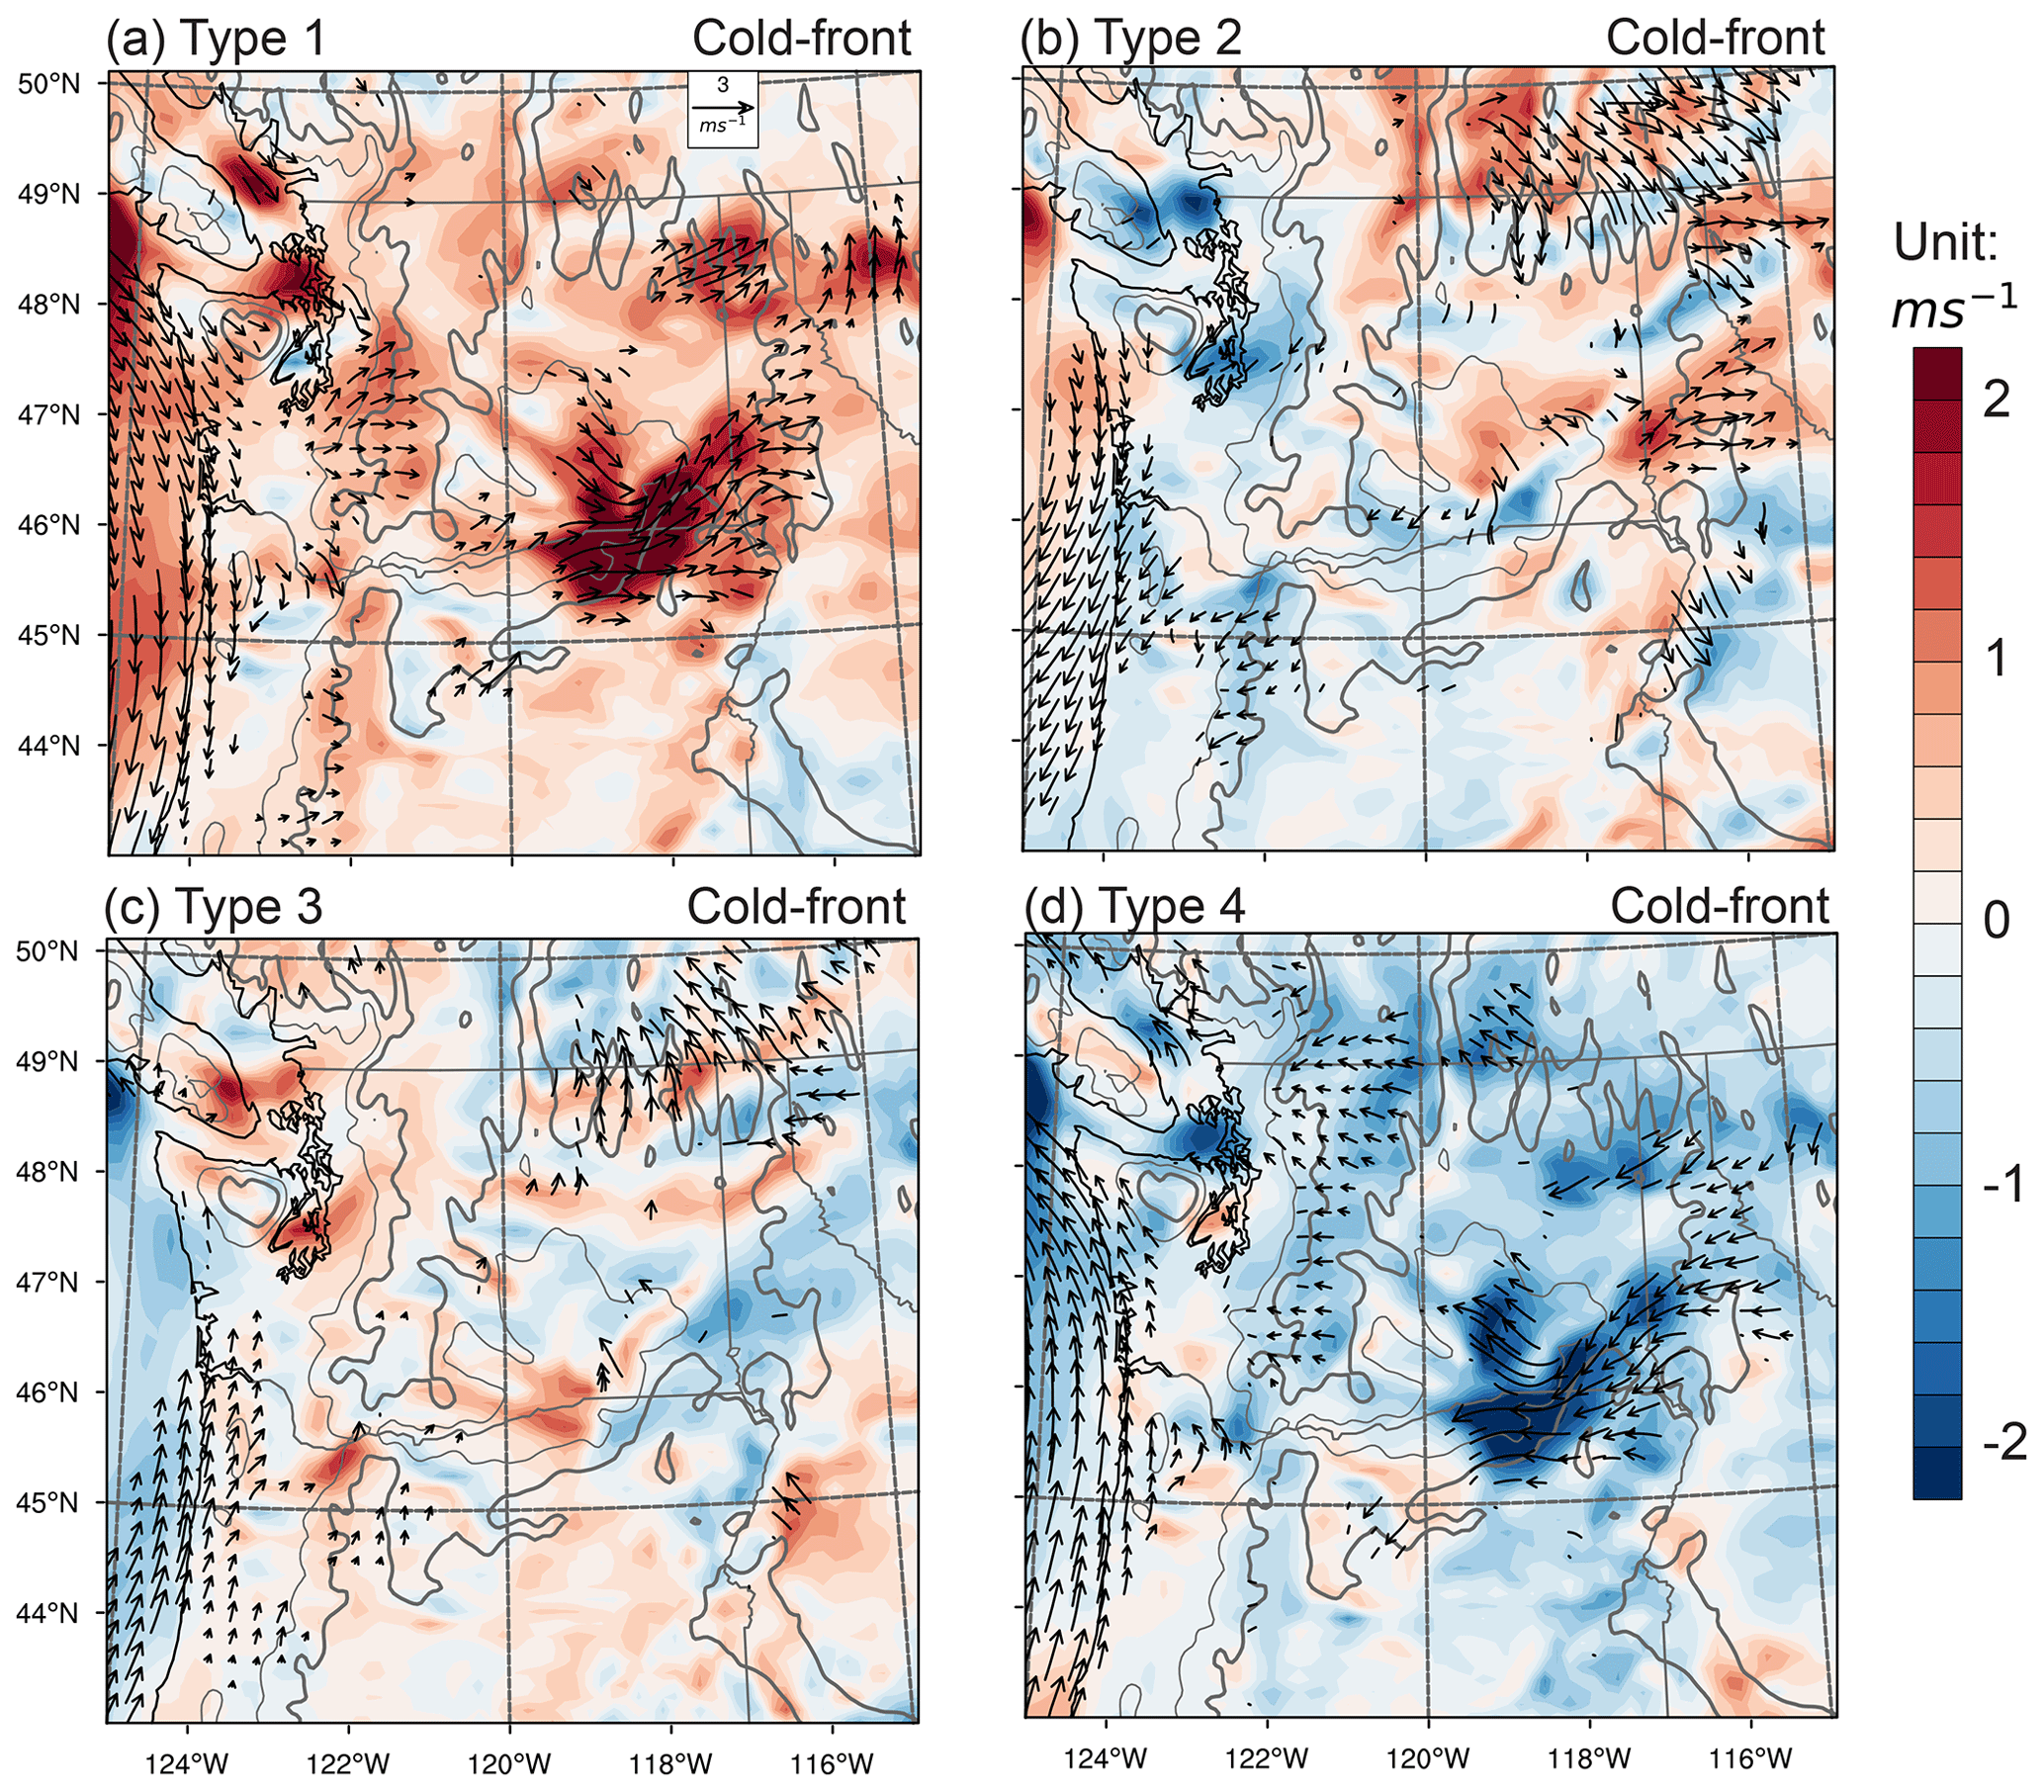
Figure 8The same as Fig. 5 but for the cold-front case.

Figure 9The same as Fig. 6 but for the cold-front case.
In type 2, the wind acceleration is comparable to type 1 during 18–30 h (Fig. 7b). After that, wind speed quickly decreases and becomes smaller than the ensemble mean. There is a small and non-significant wind speed anomaly over the basin at forecast hour 35 (Fig. 8b). The wind acceleration before 30 h is associated with an eastward extension of subtropical high and a moderate enhancement in the surface pressure gradient over the Pacific Northwest (Fig. 9b and f), which are similar to, but weaker than, type 1. The large-scale IC anomalies, accompanied by weak inland heating (Fig. 9j), lead to marine intrusion flows into the basin. The cool and moist intrusion flows cause a reversed temperature gradient, which surpasses the large-scale forcing and results in the transition from positive to negative anomalies in wind speed at 30 h (discussed further in Sect. 3.3). In contrast to type 2, type 3 generally corresponds to large-scale anomalies that are unfavorable to the cold-front development and a colder interior (Fig. 9c, g and k). We find an opposite transition from negative to positive anomalies in wind speed before and after 30 h in type 3 (Fig. 7).
3.3 Temporal evolution of wind speed
The IC uncertainties related to both local thermal gradient and large-scale circulation cause different types of responses in forecasted wind speed. Here we explore how the impact of IC uncertainties on wind anomalies evolve with time. We examine the development of 500 hPa GPH and surface pressure to assess the changes in large-scale circulation while we utilize the cross section along the gorge (from 45∘ N, 130∘ W to 45.6∘ N, 112∘ W) at different forecast hours to assess the changes in local thermal conditions and wind speed.
During the sea-breeze case, we do not find a major evolution in the large-scale-circulation anomalies in types 1 and 4. In type 1, the dipole changes in 500 hPa GPH are found before forecast hour 12, with positive and negative anomaly centers establishing over California–Nevada and British Columbia, respectively (Fig. 10a). A dipole is also developed in type 4 before 12 h with opposite signs (Fig. 10d). In both types 1 and 4, the magnitudes of 500 hPa GPH anomalies increase with time, while the locations do not change much, retaining a favorable (type 1) and unfavorable (type 4) large-scale environment for sea-breeze intrusion.
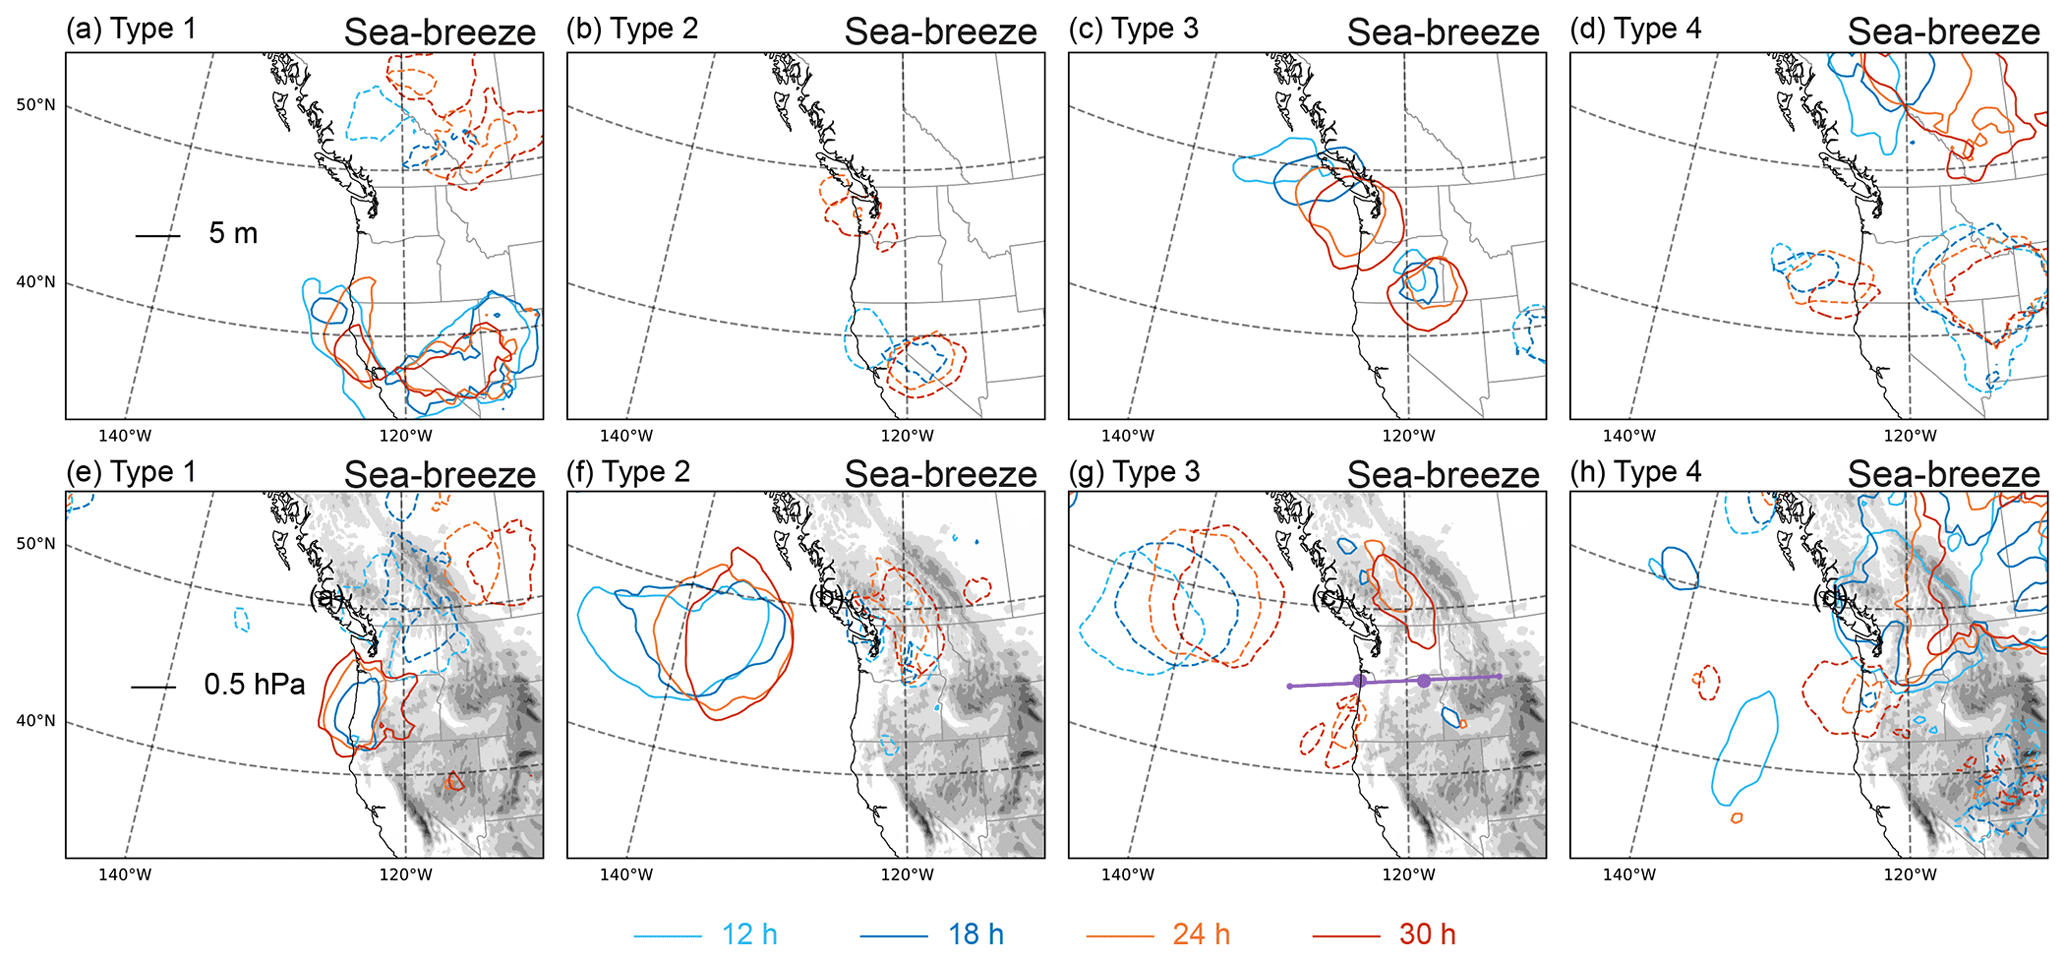
Figure 10(a–d) 500 hPa geopotential height anomaly and (e–h) surface pressure anomaly from the ensemble average for each SOM type during the sea-breeze case. The colored lines indicate forecasts at 12, 18, 24, and 30 h. Dashed contours indicate negative anomaly. The shaded area in panels (e)–(h) indicates the topography. The location of the cross section (from 45∘ N, 130∘ W to 45.6∘ N, 112∘ W) in Fig. 11 is marked as the purple line in panel (g).
As discussed in Sect. 3.2, the anomalous winds in types 1 and 4 are primarily driven by anomalous inland heating. The changes in wind speed are found at 6 h from the surface through the upper levels (Fig. 11a and d). The wind anomalies are mostly located above the warming (type 1) and cooling (type 4) areas over the mountains as the PBL grows or collapses (Deppe et al., 2013), along with anomalous sea-breeze air mass across the gorge. The sea-breeze air mass propagates inland during the day and encounters surface heating, forming a sea-breeze front at its leading edge (Simpson, 1994; Banta et al., 2020). During 18–30 h, the anomalous sea-breeze front in type 1 advances from the west to the east, and strong wind anomalies pass through the gorge (Fig. 11a, e and i). Meanwhile, surface anomalies establishing over coastal Oregon spread across the barrier (Fig. 10e and h). The advance of the sea-breeze front simulated by our model corroborates analyses from station observations (Brewer and Mass, 2014) and lidar measurements (Banta et al., 2020). A similar pattern is found in type 4, with anomalous winds in the opposite direction (easterly wind anomaly) driven by extensive inland cooling (Fig. 11d, h, and l).
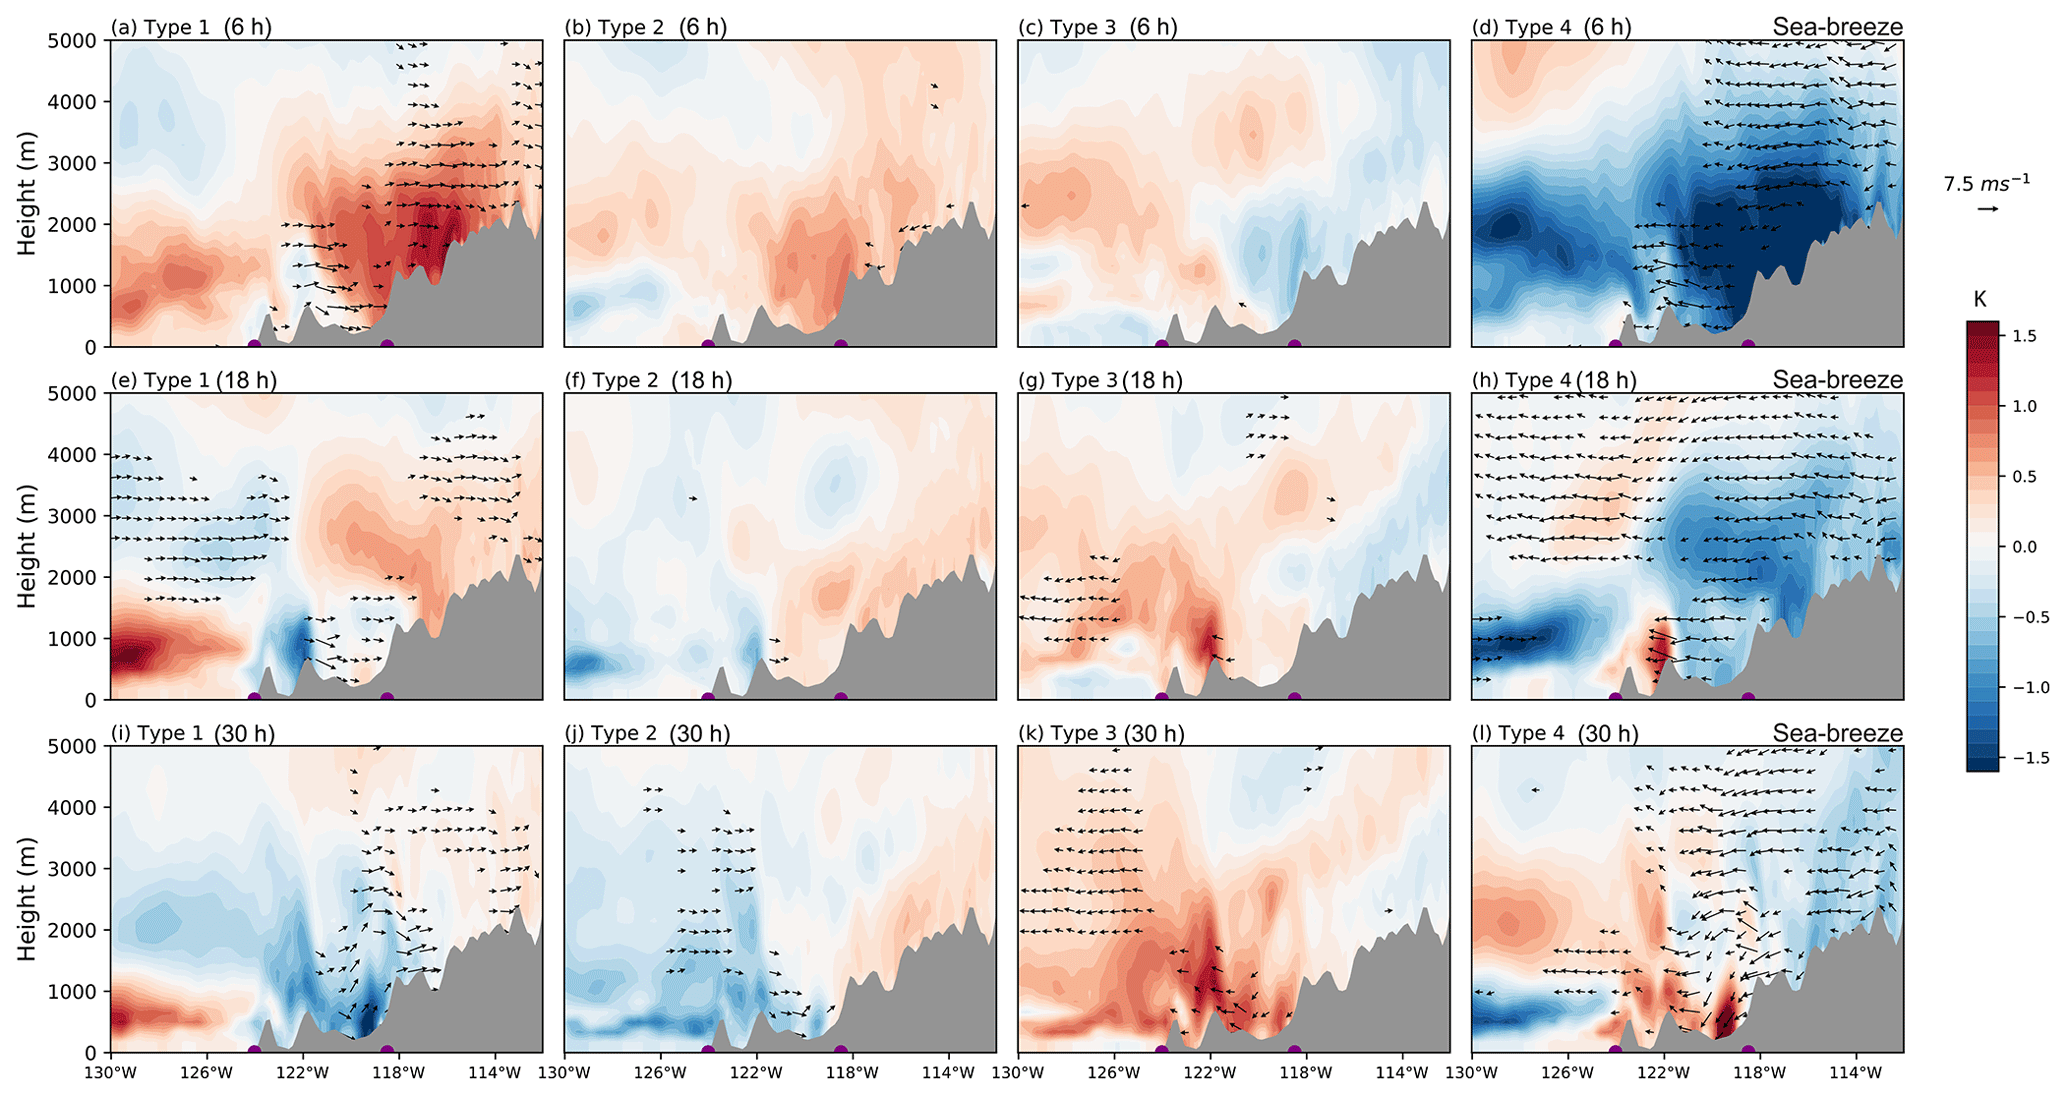
Figure 11Cross section of anomalous wind (vectors) and temperature (colors) at (a–d) 6 h, (e–h) 18 h, and (i–l) 30 h for each SOM type during the sea-breeze case. The gray area indicates the topography. The location of the cross section is marked in Fig. 10.
Types 2 and 3 correspond to the joint impact of IC uncertainties associated with both local thermal gradient and large-scale circulations (Figs. 10b, c and 11b, c). These types feature weak upper-level anomalies but significant changes in surface pressure. The surface high (in type 2) and low (in type 3) pressure centers form before 12 h near 140∘ W and approach the coast during the 18–30 h, accompanied by the thermally driven surface pressure anomalies establishing east of the Cascade Mountains (Fig. 10f and g). From the cross-section view, we find a weak cold front develops offshore at 6 h and advances inland due to both increased surface pressure offshore and inland heating (Fig. 11b, f, and j). Type 3 generally has contrasting environmental conditions and opposite wind anomalies to type 2.
During the cold-front case, strong wind speed anomalies in type 1 are primarily driven by large-scale-circulation anomalies that are favorable to the cold-front development. The stronger westerly wind anomalies are often observed in the study area and are associated with the intensified offshore ridge at leading hours (Shaw et al., 2019; Banta et al., 2020). In this study, we find strong positive anomalies (10 m) at 500 hPa GPH over the northeast Pacific Ocean strengthen before 18 h and move towards the coast during 18–36 h (Fig. 12a). Meanwhile, a negative anomaly center establishes over coastal British Columbia before 18 h, which deepens and moves southward to Washington. Similar anomaly patterns are found at the surface. A high-pressure center (1.0 hPa) forms near 140∘ W and extends toward the coast, intensifying the pressure gradient over the Pacific Northwest (Fig. 12e). From the cross-section view, it clearly shows an offshore cold front which coincides with a weak thermally driven front onshore (near 122∘ W) at 12 h (Fig. 13a). The synoptical-scale front accelerates westerly winds before the front from the surface up to 5 km a.g.l. (above ground level), while the thermally driven front that develops within the basin causes the winds below 1.5 km a.g.l. to accelerate. Along with the inland moving of the large-scale system anomalies, the synoptical-scale front advances eastward and catches up with the thermally driven front at 24 h, which leads to stronger westerly winds in the basin (Fig. 13e). The turbine-height winds peak at around 36 h (Fig. 7a) when the anomalous front passes and leaves behind cold and moist air in the basin (Fig. 13i). At 36 h, anomalous winds develop well from the surface to 500 hPa. By contrast, type 4 corresponds to an unfavorable large-scale initial condition that causes turbine-height wind suppression.
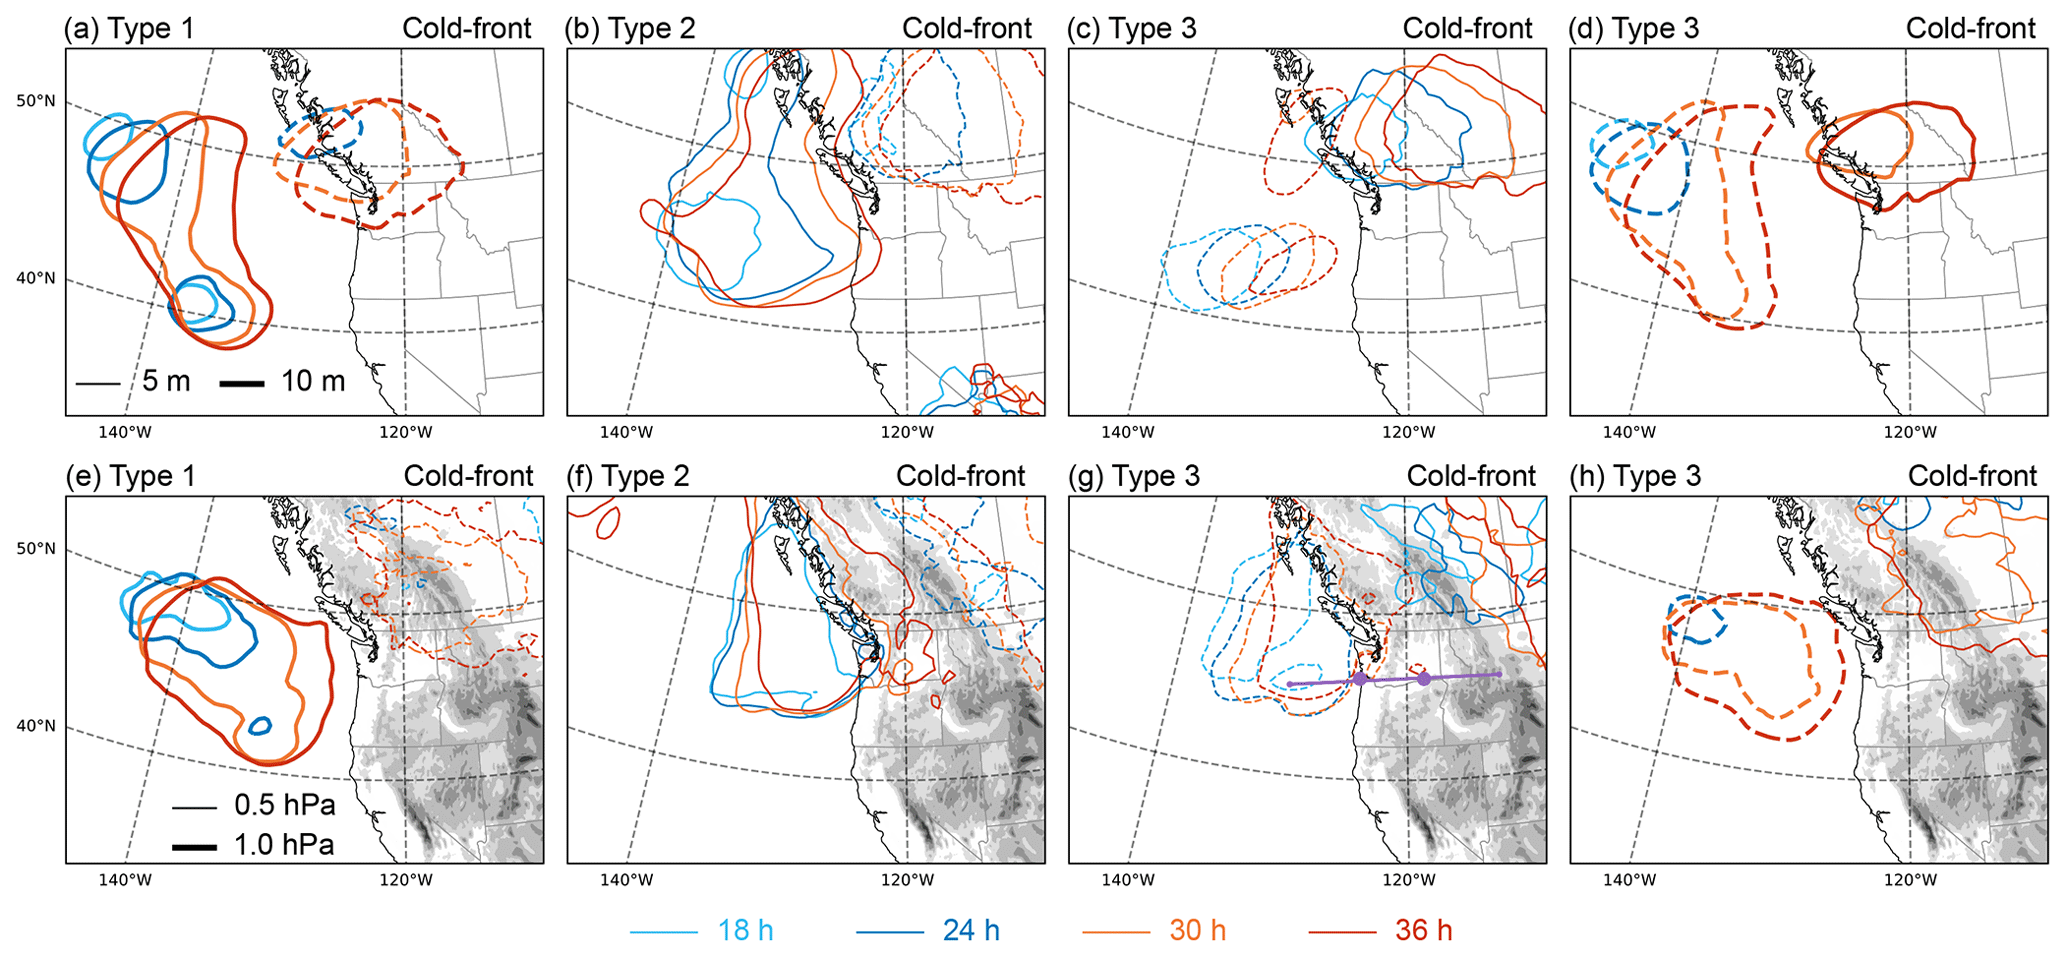
Figure 12The same as Fig. 10 but for the cold-front case.
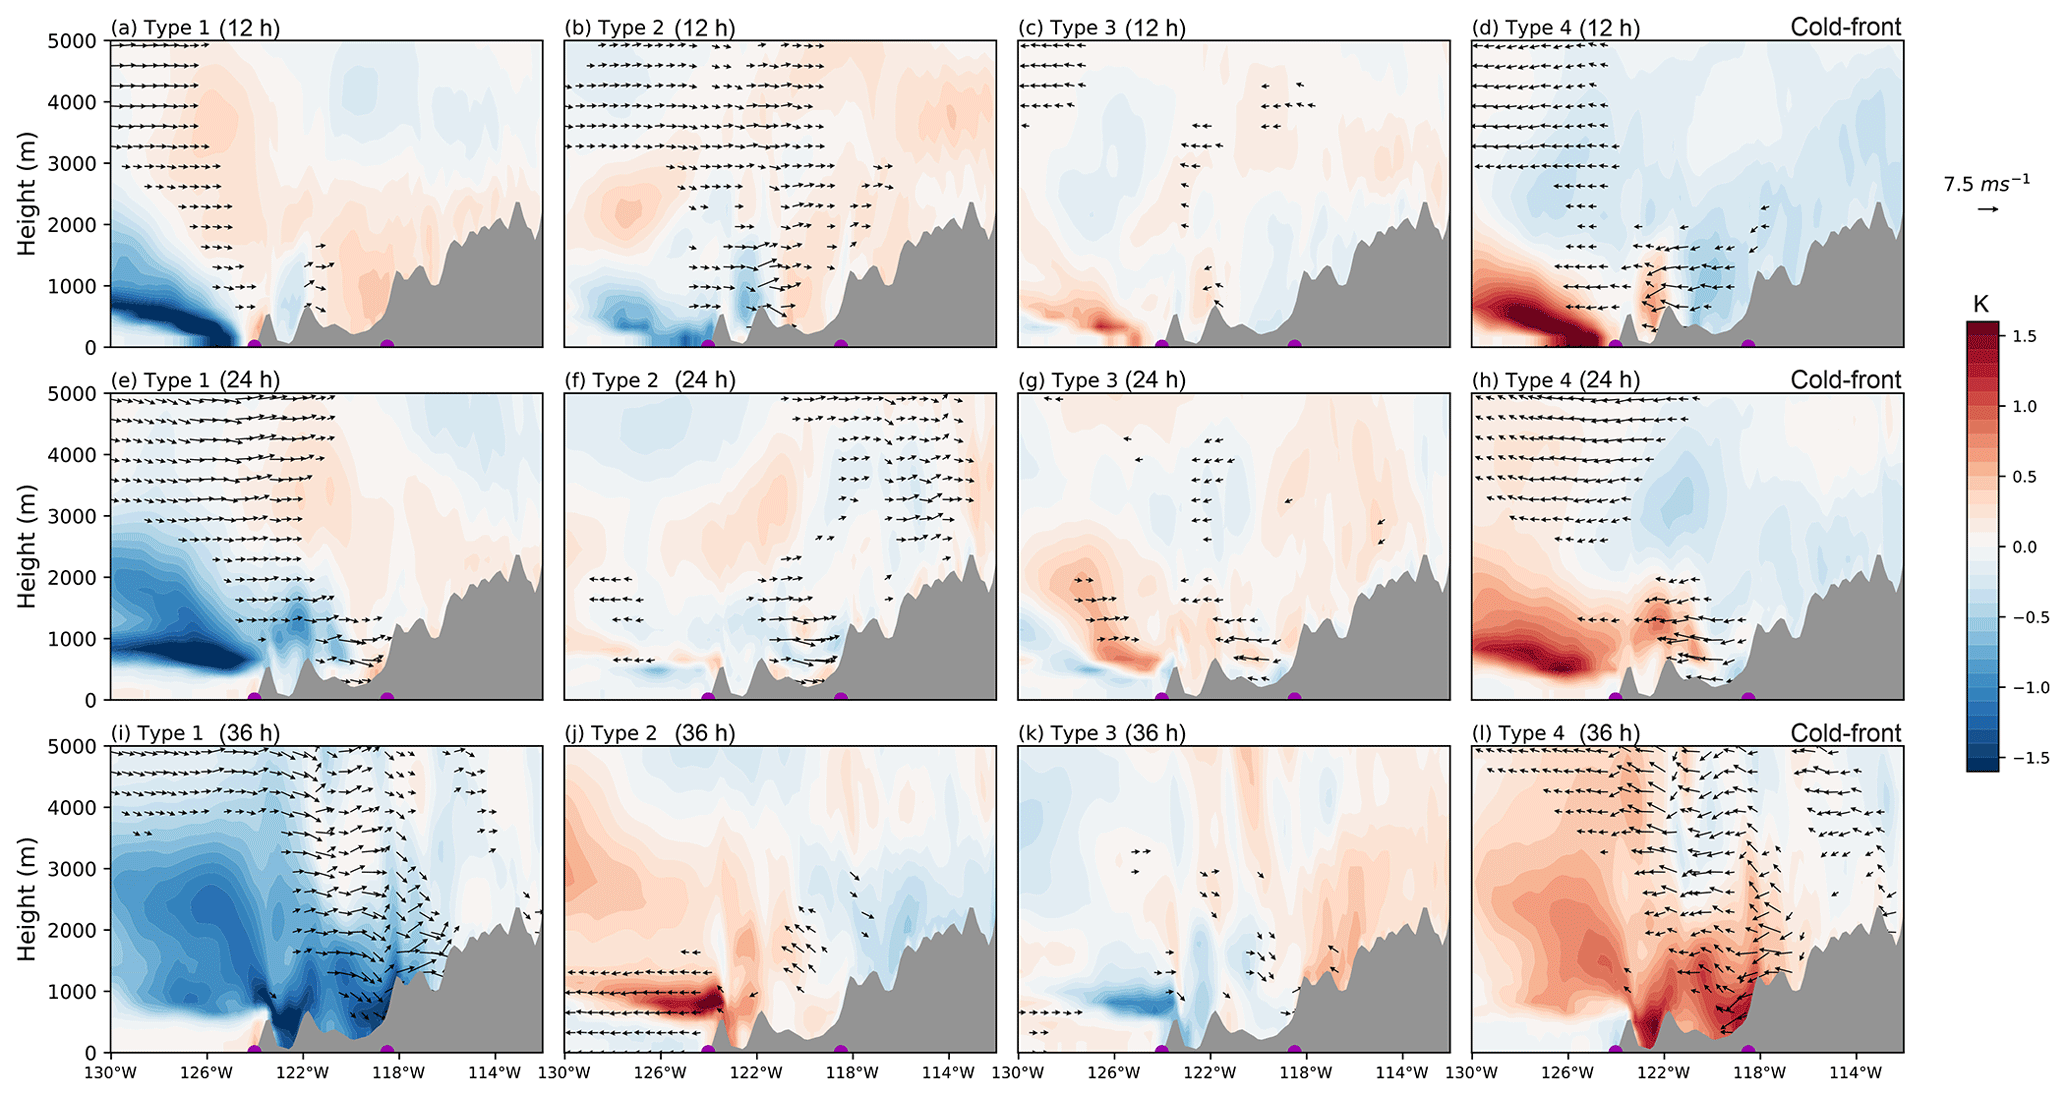
Figure 13The same as Fig. 11, except for (a–d) 12 h, (e–h) 24 h, and (i–l) 36 h during the cold-front case.
Types 2 and 3 correspond to the eastward displacement of the large-scale system, with smaller magnitudes compared to types 1 and 4 (Fig. 12b, c, f, and g). The wind anomalies across the gorge are driven by the joint impact of the anomalous local thermal gradient and large-scale circulation (Fig. 13). In type 2, the enhanced westerly winds bring cool–moist air into the basin before 12 h. The corresponding wind anomaly profiles exhibit features of cold-front acceleration, i.e., strong westerly just ahead of the front. When the cool-moist air cools the basin after 24 h, the reversed thermal gradient surpasses the cold-front forcing, leading to anomalous easterly flows.
During the summer over the Pacific Northwest, the offshore ridge and strong thermal gradients can produce diurnal circulations that develop and interact on various spatial and temporal scales. The diurnal cycles occur concurrently with weak large-scale fronts, troughs, and lines of moist convection and can be interrupted by a strong cold frontal passage. The uncertainties in any of those local and large-scale conditions at an earlier hour can comprise the accuracy of subsequent wind forecasts over the CRG and CRB. This paper assesses the impact of the initial condition uncertainties during two periods influenced by typical weather systems. We utilize the WRFDA technique to generate initial perturbations based on NARR reanalysis, which is then used to initialize 48 h ensemble forecasts. The SOM technique is applied to characterize the major patterns in wind forecasting anomalies and associated IC uncertainties.
We apply the SOM technique and obtain four types of anomalies based on the basin-wide wind vectors. In both meteorological cases, members with strong wind anomalies over the CRB also have the strongest anomalous flows in the CRG (Figs. 4 and 7). We further conduct SOM clustering using wind vectors taken from the WRF grid points closest to the site locations in the gorge (Fig. 1). The CRG-based categorization results are generally consistent with those obtained from the basin-averaged analysis. For the sea-breeze case, 81 % of members are categorized into the same types with the SOM clustering based on basin-wide wind vectors. For the cold-front case, 75 % of members have the same categories. The coinciding members are evenly distributed in each SOM type. Furthermore, the composite analyses and cross-section analyses based on the gorge SOM clustering are consistent with those based on the basin-wide clustering. The close connection of wind anomalies in the CRG and CRB indicates that their local and large-scale driving factors are generally consistent, which implies the forecasting anomalies in the CRG and CRB may be caused by IC uncertainties in the same weather systems. The elevation of the CRG is very near sea level, compared to the Cascade passes, whose lowest elevation is 900 m (Sharp and Mass, 2004). Thus, the CRG serves as a primary pathway for the intrusion flows into the basin (Smith and Ancell, 2019). Observational studies show that flows frequently originate west of the Cascade ranges, propagate through the CRG (Banta et al., 2020), and move eastward through the basin (Brewer and Mass, 2014). Therefore, efforts targeting the improvement of wind forecast in the CRG can also benefit the forecast in the CRB and vice versa.
The SOM technique efficiently recognizes the common features of anomalous winds and their associated IC uncertainty. In both cases, SOM isolates two types (1 and 4) of wind anomalies corresponding to the strengthening or weakening of the synoptic weather system. Specifically, during the sea-breeze case, these SOM types feature the condition of the intensified initial thermal gradient across the Cascades, enhanced pressure gradient, and faster winds in the CRG and CRB. In the cold-front case, the anomalous offshore ridge amplifies and approaches the coast, which can be explained by the inland moving of an enhanced cold front that forms offshore.
Besides the IC uncertainties that alter the influencing weather system, SOM also characterizes two types (2 and 3) of wind anomalies that correspond to the combination of moderate local thermal and large-scale initial uncertainties. These two types of events account for about 50 % of the members in both sea-breeze and cold-front cases. Although the anomalous ICs are much weaker than the abovementioned types 1 and 4, they produce comparable wind anomalies, especially over the CRG. This suggests that the local thermal and large-scale initial uncertainties jointly play essential roles in the subsequent wind forecast.
We note that in all types, initial uncertainties in some key regions, such as surface pressure over the northeast Pacific (around 140∘ W) and surface temperature over the east Cascade, exert significant impacts to the wind forecast in the CRG and CRB in the cases we examine. The knowledge of key regions can be used as a reference for deployment of field campaign, such as in the next stage of the WFIP. The high-quality temperature and pressure observations can be utilized to reduce the IC uncertainties in the wind forecast through the data assimilation system. Note that we mainly focus on IC uncertainties in two typical weather phenomena in this study. Additional sensitive regions may be needed if we consider other transient synoptic regimes that occur during the summer season (Brewer and Mass, 2014).
Data and WRF model configuration used in this paper are available from the Atmosphere to Electrons Data Archive and Portal at https://doi.org/10.21947/1819819 (Liu et al., 2021a), https://doi.org/10.21947/1819820 (Liu et al., 2021b), https://doi.org/10.21947/1819817 (Liu et al., 2021c), and https://doi.org/10.21947/1819818 (Liu et al., 2021d).
YQ and LKB conceived the idea. YL performed the research and analyzed the data with contributions from all co-authors. YL prepared the manuscript with contributions from all-authors.
The contact author has declared that neither they nor their co-authors have any competing interests.
Publisher's note: Copernicus Publications remains neutral with regard to jurisdictional claims in published maps and institutional affiliations.
Computational resources were provided by Wind Energy Technologies Office and the National Renewable Energy Laboratory. The authors thank Fengfei Song for providing the SOM scripts and Raghavendra Krishnamurthy for reviewing earlier versions of the manuscript. PNNL is operated by DOE by the Battelle Memorial Institute under contract DE-A06-76RLO 1830.
This research has been supported by the US Department of Energy's Wind Energy Technologies Office (Wind Forecast Improvement Project 2).
This paper was edited by Andrea Hahmann and reviewed by two anonymous referees.
Al-Dousari, A., Al-Nassar, W., Al-Hemoud, A., Alsaleh, A., Ramadan, A., Al-Dousari, N., and Ahmed, M.:. Solar and wind energy: challenges and solutions in desert regions, Energy, 176, 184–194, 2019.
Ancell, B. and Hakim, G. J.: Comparing adjoint- and ensemble-sensitivity analysis with applications to observation targeting, Mon. Weather Rev., 135, 4117–4134, https://doi.org/10.1175/2007MWR1904.1, 2007.
Baker, R. W., Hewson, E. W., Butler, N. G., and Warchol, E. J.: Wind power potential in the Pacific Northwest, J. Appl. Meteorol., 17, 1814–1826, https://doi.org/10.1175/1520-0450(1978)017<1814:WPPITP>2.0.CO;2, 1978.
Banta, R. M., Pichugina, Y. L., Kelley, N. D., Hardesty, R. M., and Brewer, W. A.: Wind Energy Meteorology: Insight into Wind Properties in the Turbine-Rotor Layer of the Atmosphere from High-Resolution Doppler Lidar, B. Am. Meteorol. Soc., 94, 883–902, https://doi.org/10.1175/bams-d-11-00057.1, 2013.
Banta, R. M., Pichugina, Y. L., Brewer, W. A., James, E. P., Olson, J. B., Benjamin, S. G., Carley, J. R., Bianco, L., Djalalova, I. V., Wilczak, J. M., Hardesty, R. M., Cline, J., and Marquis, M. C.: Evaluating and Improving NWP Forecast Models for the Future: How the Needs of Offshore Wind Energy Can Point the Way, B. Am. Meteorol. Soc., 99, 1155–1176, https://doi.org/10.1175/bams-d-16-0310.1, 2018.
Banta, R. M., Pichugina, Y. L., Brewer, W. A., Choukulkar, A., Lantz, K. O., Olson, J. B., Kenyon, J., Fernando, H. J. S., Krishnamurthy, R., Stoelinga, M. J., Sharp, J., Darby, L. S., Turner, D. D., Baidar, S., and Sandberg, S. P.: Characterizing NWP model errors using doppler-lidar measurements of recurrent regional diurnal flows: Marine-air intrusions into the Columbia River Basin, Mon. Weather Rev., 148, 929–953, https://doi.org/10.1175/MWR-D-19-0188.1, 2020.
Barker, D. M., Huang, W., Guo, Y.-R., Bourgeois, A. J., and Xiao, Q. N.: A Three-Dimensional Variational Data Assimilation System for MM5: Implementation and Initial Results, Mon. Weather Rev., 132,897–914, https://doi.org/10.1175/1520-0493(2004)132<0897:atvdas>2.0.co;2, 2004.
Berg, L. K., Liu, Y., Yang, B., Qian, Y., Olson, J., Pekour, M., Ma, P. L., and Hou, Z.: Sensitivity of Turbine-Height Wind Speeds to Parameters in the Planetary Boundary-Layer Parametrization Used in the Weather Research and Forecasting Model: Extension to Wintertime Conditions, Bound.-Lay. Meteorol., 170, 507–518, https://doi.org/10.1007/s10546-018-0406-y, 2019
Berg, L. K., Liu, Y., Yang, B., Qian, Y., Krishnamurthy, R., Sheridan, L., and Olson, J.: Time Evolution and Diurnal Variability of the Parametric Sensitivity of Turbine-Height Winds in the MYNN-EDMF Parameterization. J. Geophys. Res. Atmos., 126, e2020JD034000, https://doi.org/10.1029/2020jd034000, 2021.
Brewer, M. C. and Mass, C. F.: Simulation of summer diurnal circulations over the northwest United States, Weather Forecast., 29, 1208–1228, https://doi.org/10.1175/WAF-D-14-00018.1, 2014.
Deppe, A. J., Gallus, W. A., and Takle, E. S.: A WRF ensemble for improved wind speed forecasts at turbine height, Weather Forecast., 28, 212–228, https://doi.org/10.1175/WAF-D-11-00112.1, 2013.
Dyer, A. J. and Hicks, B. B.: Flux-gradient relationships in the constant flux layer, Q. J. Roy. Meteorol. Soc., 96, 715–721, 1970.
Hill, A. J., Weiss, C. C., and Ancell, B. C.: Ensemble sensitivity analysis for mesoscale forecasts of dryline convection initiation, Mon. Weather Rev., 144, 4161–4182, https://doi.org/10.1175/MWR-D-15-0338.1, 2016.
Iacono, M. J., Delamere, J. S., Mlawer, E. J., Shephard, M. W., Clough, S. A., and Collins, W. D.: Radiative forcing by long-lived greenhouse gases: Calculations with the AER radiative transfer models, J. Geophys. Res.-Atmos., 113, D13103, https://doi.org/10.1029/2008jd009944, 2008.
Kohonen, T.: Self-organized formation of topologically correct feature maps, Biol. Cybern., 43, 59–69, https://doi.org/10.1007/bf00337288, 1982.
Liu, Y., Qian, Y. and Berg, L. K.: wfip2.model/casestudy.wrf.01.seabreeze.01, Atmosphere to Electrons (A2e) Data Archive and Portal for US Department of Energy, Office of Energy Efficiency and Renewable Energy [data set], https://doi.org/10.21947/1819819, 2021a.
Liu, Y., Qian, Y. and Berg, L. K.: wfip2.model/casestudy.wrf.02.seabreeze.02, Atmosphere to Electrons (A2e) Data Archive and Portal for US Department of Energy, Office of Energy Efficiency and Renewable Energy [data set], https://doi.org/10.21947/1819820, 2021b.
Liu, Y., Qian, Y. and Berg, L. K.: wfip2.model/casestudy.wrf.01.coldfront.01, Atmosphere to Electrons (A2e) Data Archive and Portal for US Department of Energy, Office of Energy Efficiency and Renewable Energy [data set], https://doi.org/10.21947/1819817, 2021c.
Liu, Y., Qian, Y., and Berg, L. K.: wfip2.model/casestudy.wrf.02.coldfront.02, Atmosphere to Electrons (A2e) Data Archive and Portal for US Department of Energy, Office of Energy Efficiency and Renewable Energy [data set], https://doi.org/10.21947/1819818, 2021d.
Marquis, M., Wilczak, J., Ahlstrom, M., Sharp, J., Stern, A., Smith, J. C., and Calvert, S.: Forecasting the Wind to Reach Significant Penetration Levels of Wind Energy, B. Am. Meteorol. Soc., 92, 1159–1171, https://doi.org/10.1175/2011bams3033.1, 2011.
Mesinger, F., DiMego, G., Kalnay, E., Mitchell, K., Shafran, P. C., Ebisuzaki, W., Jović, D., Woollen, J., Rogers, E., Berbery, E. H., Ek, M. B., Fan, Y., Grumbine, R., Higgins, W., Li, H., Lin, Y., Manikin, G., Parrish, D., and Shi, W.: North American regional reanalysis, B. Am. Meteorol. Soc., 87, 343–360, https://doi.org/10.1175/BAMS-87-3-343, 2006.
Nakanishi, M. and Niino, H.: An improved Mellor-Yamada Level-3 model: Its numerical stability and application to a regional prediction of advection fog, Bound.-Lay. Meteorol., 119, 397–407, https://doi.org/10.1007/s10546-005-9030-8, 2006.
Nakanishi, M. and Niino, H.: Development of an improved turbulence closure model for the atmospheric boundary layer, J. Meteorol. Soc. Jpn., 87, 895–912, https://doi.org/10.2151/jmsj.87.895, 2009.
National Renewable Energy Laboratory: 20 % wind energy by 2030: Increasing wind energy's contribution to US electricity supply, Washington, DC, available at: https://www.nrel.gov/docs/fy09osti/42864.pdf (last access: 3 April 2021), 2008.
Ohba, M., Kadokura, S., and Nohara, D.: Medium-range probabilistic forecasts of wind power generation and ramps in Japan based on a hybrid ensemble, Atmosphere, 9, 423, https://doi.org/10.3390/atmos9110423, 2018.
Olson, J. B., Kenyon, J. S., Angevine, W. A., Brown, J. M., Pagowski, M., and Sušelj, K.: A Description of the MYNN-EDMF Scheme and the Coupling to Other Components in WRF–ARW, NOAA Tech. Memo. OAR UAS-003, https://doi.org/10.7289/V5/TM-OAR-UAS-003, 2019a.
Olson, J. B., Kenyon, J. S., Djalalova, I., Bianco, L., Turner, D. D., Pichugina, Y., Choukulkar, A., Toy, M. D., Brown, J. M., Angevine, W. M., Akish, E., Bao, J. W., Jimenez, P., Kosovic, B., Lundquist, K. A., Draxl, C., Lundquist, J. K., McCaa, J., McCaffrey, K., Lantz, K., Long, C., Wilczak, J., Banta, R., Marquis, M., Redfern, S., Berg, L. K., Shaw, W., and Cline, J.: Improving wind energy forecasting through numerical weather prediction model development, B. Am. Meteorol. Soc., 100, 2201–2220, https://doi.org/10.1175/BAMS-D-18-0040.1, 2019b.
Oren, S.: Renewable energy integration and the impact of carbon regulation on the electric grid, in: 2012 IEEE Power and Energy Society General Meeting, 22–26 July 2012, San Diego, CA, USA, 1–2, https://doi.org/10.1109/PESGM.2012.6344802, 2012.
Qian, Y., Yan, H., Hou, Z., Johannesson, G., Klein, S., Lucas, D., Neale, R., Rasch, P., Swiler, L., Tannahill, J., Wang, H., Wang, M., and Zhao, C.: Parametric sensitivity analysis of precipitation at global and local scales in the Community Atmosphere Model CAM5, J. Adv. Model. Earth Syst., 7, 382–411, https://doi.org/10.1002/2014MS000354, 2015.
Sharp, J. and Mass, C. F.: Columbia Gorge gap winds: Their climatological influence and synoptic evolution, Weather Forecast., 19, 970–992, https://doi.org/10.1175/826.1, 2004.
Shaw, W. J., Lundquist, J. K., and Schreck, S. J.: Research needs for wind resource characterization, B. Am. Meteorol. Soc., 90, 535–538, https://doi.org/10.1175/2008BAMS2729.1, 2009.
Shaw, W. J., Berg, L. K., Cline, J., Draxl, C., Djalalova, I., Grimit, E. P., Lundquist, J. K., Marquis, M., McCaa, J., Olson, J. B., Sivaraman, C., Sharp, J., and Wilczak, J. M.: The second wind forecast improvement project (wfip2) general overview, B. Am. Meteorol. Soc., 100, 1687–1699, https://doi.org/10.1175/BAMS-D-18-0036.1, 2019.
Simpson, J. E.: Sea breeze and local winds, Cambridge University Press, New York, 234 pp., 1994.
Siuta, D., West, G., and Stull, R.: WRF hub-height wind forecast sensitivity to PBL scheme, grid length, and initial condition choice in complex terrain, Weather Forecast., 32, 493–509, https://doi.org/10.1175/WAF-D-16-0120.1, 2017a.
Siuta, D., West, G., Stull, R., and Nipen, T.: Calibrated probabilistic hub-height wind forecasts in complex terrain, Weather Forecast., 32, 555–577, https://doi.org/10.1175/WAF-D-16-0137.1, 2017b.
Skamarock, W. C., Klemp, J. B., Dudhia, J., Gill, D. O., Liu, Z., Berner, J., Wang, W., Powers, J. G., Duda, M. G., Barker, D., and Huang, X.-Y.: A Description of the Advanced Research WRF Model Version 4.1, No. NCAR/TN-556+STR, NCAR, https://doi.org/10.5065/1dfh-6p97, 2019.
Smirnova, T. G., Brown, J. M., Benjamin, S. G., and Kenyon, J. S.: Modifications to the Rapid Update Cycle land surface model (RUC LSM) available in the weather research and forecasting (WRF) model, Mon. Weather Rev., 144, 1851–1865, https://doi.org/10.1175/MWR-D-15-0198.1, 2016.
Smith, N. H. and Ancell, B. C.: Ensemble sensitivity analysis of wind ramp events with applications to observation targeting, Mon. Weather Rev., 145, 2505–2522, https://doi.org/10.1175/MWR-D-16-0306.1, 2017.
Smith, N. H. and Ancell, B. C.: Variations in parametric sensitivity for wind ramp events in the columbia river basin, Mon. Weather Rev., 147, 4633–4651, https://doi.org/10.1175/MWR-D-19-0019.1, 2019.
Song, F., Feng, Z., Ruby Leung, L., Houze, R. A., Wang, J., Hardin, J., and Homeyer, C. R.: Contrasting spring and summer large-scale environments associated with mesoscale convective systems over the U.S. Great Plains, J. Climate, 32, 6749–6767, https://doi.org/10.1175/JCLI-D-18-0839.1, 2019.
Spassiani, A. C. and Mason, M. S.: Application of Self-organizing Maps to classify the meteorological origin of wind gusts in Australia, J. Wind Eng. Ind. Aerodyn., 210, 104529, https://doi.org/10.1016/j.jweia.2021.104529, 2021.
Thompson, G. and Eidhammer, T.: A study of aerosol impacts on clouds and precipitation development in a large winter cyclone, J. Atmos. Sci., 71, 3636–3658, https://doi.org/10.1175/JAS-D-13-0305.1, 2014.
Torn, R. D., Hakim, G. J., and Snyder, C.: Boundary conditions for limited-area ensemble Kalman filters, Mon. Weather Rev., 134, 2490–2502, https://doi.org/10.1175/MWR3187.1, 2006.
Torn, R. D., Romine, G. S., and Galarneau, T. J.: Sensitivity of dryline convection forecasts to upstream forecast errors for two weakly forced MPEX cases, Mon. Weather Rev., 145, 1831–1852, https://doi.org/10.1175/MWR-D-16-0457.1, 2017.
Wilczak, J. M., Stoelinga, M., Berg, L. K., Sharp, J., Draxl, C., McCaffrey, K., Banta, R. M., Bianco, L., Djalalova, I., Lundquist, J. K., Muradyan, P., Choukulkar, A., Leo, L., Bonin, T., Pichugina, Y., Eckman, R., Long, C. N., Lantz, K., Worsnop, R. P., Bickford, J., Bodini, N., Chand, D., Clifton, A., Cline, J., Cook, D. R., Fernando, H. J. S., Friedrich, K., Krishnamurthy, R., Marquis, M., McCaa, J., Olson, J. B., Otarola-Bustos, S., Scott, G., Shaw, W. J., Wharton, S., and White, A. B.: The Second Wind Forecast Improvement Project (WFIP2): Observational Field Campaign, B. Am. Meteorol. Soc., 100, 1687–1700, https://doi.org/10.1175/BAMS-D-18-0035.1, 2019.
Willis, D. J., Niezrecki, C., Kuchma, D., Hines, E., Arwade, S. R., Barthelmie, R. J., DiPaola, M., Drane, P. J., and Hansen, C. J., Inalpolat, M.: Wind energy research: State-of-the-art and future research directions, Renew. Energy, 125, 133–154, 2018.
Xia, G., Draxl, C., Berg, L. K., and Cook, D.: Quantifying the Impacts of Land Surface Modeling on Hub-Height Wind Speed under Different Soil Conditions, Mon. Weather Rev., 149, 3101–3118, https://doi.org/10.1175/MWR-D-20-0363.1, 2021.
Yang, B., Qian, Y., Berg, L. K., Ma, P. L., Wharton, S., Bulaevskaya, V., Yan, H., Hou, Z., and Shaw, W. J.: Sensitivity of Turbine-Height Wind Speeds to Parameters in Planetary Boundary-Layer and Surface-Layer Schemes in the Weather Research and Forecasting Model, Bound.-Lay. Meteorol., 162, 117–142, https://doi.org/10.1007/s10546-016-0185-2, 2017.
Yang, B., Berg, L. K., Qian, Y., Wang, C., Hou, Z., Liu, Y., Shin, H. H., Hong, S., and Pekour, M.: Parametric and Structural Sensitivities of Turbine-Height Wind Speeds in the Boundary Layer Parameterizations in the Weather Research and Forecasting Model, J. Geophys. Res.-Atmos. 124, 5951–5969, https://doi.org/10.1029/2018JD029691, 2019.
Yang, Q., Berg, L. K., Pekour, M., Fast, J. D., Newsom, R. K., Stoelinga, M., and Finley, C.: Evaluation of WRF-predicted near-hub-height winds and ramp events over a pacific northwest site with complex terrain, J. Appl. Meteorol. Clim. 52, 1753–1763, https://doi.org/10.1175/JAMC-D-12-0267.1, 2013.
Zack, J., Natenberg, E., Young, S., Van Knowe, G., Waight, K., Manobainco, J., and Kamath, C.: Application of ensemble sensitivity analysis to observation targeting for short-term wind speed forecasting in the Tehachapi region winter season, Lawrence Livermore Natl. Lab. Tech. Rep. LLNL-TR-42, Lawrence Livermore National Lab. (LLNL), Livermore, CA, USA, 32 pp., https://doi.org/10.2172/1124905, 2010.