the Creative Commons Attribution 4.0 License.
the Creative Commons Attribution 4.0 License.
 | 09 Mar 2022
Input torque measurements for wind turbine gearboxes using fiber-optic strain sensors
Unai Gutierrez Santiago
Alfredo Fernández Sisón
Henk Polinder
Jan-Willem van Wingerden
Accurate knowledge of the input torque in wind turbine gearboxes is key to improving their reliability. Traditionally, rotor torque is measured using strain gauges bonded to the shaft. Transferring the resulting signal from the rotating shaft to a stationary data acquisition system while powering the sensing devices is complex and costly. The magnitude of the torques involved in wind turbine gearboxes and the high stiffness of the input shaft pose additional difficulties. This paper presents a new alternative method to measure the input torque in wind turbine gearboxes based on deformation measurements of the static first-stage ring gear. We have measured deformation using fiber-optic strain sensors based on fiber Bragg gratings because of their advantages compared to conventional electrical strain gauges. The present study was conducted on a Siemens Gamesa Renewable Energy gearbox with a rated power of 6 MW, in which a total of 54 fiber-optic strain sensors were installed on the outer surface of the first-stage ring gear. The gear mesh forces between the planets and the ring gear cause measurable deformations on the outer surface of the stationary ring gear. The measured strains exhibit a dynamic behavior. The strain values change depending on the relative position of the strain sensors to the planet gears, the instantaneous variations of the input torque, and the way load is shared between planets. A satisfactory correlation has been found between the strain signals measured on the static ring gear and torque. Two signal processing strategies are presented in this paper. The first procedure is based on the peak-to-peak strain values computed for the gear mesh events, and therefore torque can only be estimated when a gear mesh event is detected. The second signal processing procedure combines the strain signals from different sensors using a Coleman coordinate transformation and tracks the magnitude of the fifth harmonic component. With this second procedure, it is possible to estimate torque whenever strain data of all sensors are available, leading to an improved frequency resolution up to the sampling frequency used to acquire strain data. The method presented in this paper could make measuring gearbox torque more cost-effective, which would facilitate its adoption in serial wind turbines and enable novel data-driven control strategies, as well as a more accurate assessment of the consumed fatigue life of the gearboxes throughout their operation.
- Article
(11749 KB) - Full-text XML
- BibTeX
- EndNote


Scientists have long been warning us that we face a significant challenge regarding our climate. Renewable energies can play a pivotal role in reducing carbon emissions to enable a sustainable future. In the last decades, wind energy has seen a remarkable growth. Wind energy is already the second source of power generation in the EU when ranked according to installed capacity (WindEurope.org, 2019). In Europe (EU27 + UK), the total installed capacity of wind power reached 220 GW in 2020, of which 194 GW is onshore wind. With 458 TWh generated, wind power covered 16 % of Europe's electricity demand in 2020 (WindEurope.org, 2021). It is essential to reduce the levelized cost of energy (LCOE) from wind to guarantee further deployment of wind turbines towards the needed energy transition. Therefore, the LCOE has become one of the critical drivers for wind energy research in industry and academia.
In onshore wind energy, around 75 % of turbines have a geared drivetrain (van Kuik et al., 2016). The gearbox transfers the torque generated by the blades from the slow-speed rotor to the higher-speed generator. In the overall breakdown of costs, the gearbox is one of the main contributors because of the associated capital expenditure and the considerable contribution to operation and maintenance costs (Stehly et al., 2018). Gearbox reliability is improving, but gearboxes continue to be the largest wind turbine downtime source (Spinato et al., 2009) and generally do not reach the desired design life of 20 years (Sheng, 2013; Musial et al., 2007). Therefore, improving gearbox reliability would lead to a significant reduction in the LCOE from the wind.
Drive train subsystem interactions and the effect of control strategy on gearbox loading are not fully known (van Kuik et al., 2016). The flexibility of the gearbox components influences the drivetrain's dynamic behavior and, therefore, the loading (Helsen et al., 2011). Traditional engineering models used for the simulation of gearbox input loads do not include this influence. Complex physically derived models have been built to study gearbox dynamics but have not been used together with whole turbine models (Struggl et al., 2015; Girsang et al., 2014; Peeters et al., 2006). Current wind turbine design codes lack insight into the dynamic behavior of the internal drive train components. It is, therefore, highly desirable to be able to measure the dynamic torque from the rotor acting on the gearbox accurately and reliably. This torque will be referred to as the gearbox input torque.
A case study presented by Winergy and Siemens PLM Software (Egeling et al., 2021) showed that supervisory control and data acquisition (SCADA) data were not able to precisely capture the torque fluctuations caused by the dynamic wind turbine operation, for example during a brake event, and concluded that it is necessary to perform a direct measurement of the actual torque. The traditional method to measure torque is based on bonding strain gauges to the rotating shaft. The strain gauges convert the deformation caused by the torque into a change in electrical resistance. Transferring the resulting signal from the rotating shaft to a stationary data logging system and powering the data acquisition devices is difficult and costly. In wind turbine gearboxes, the main shaft's deformation is small because of its high stiffness, which typically results in a low signal-to-noise ratio. These drawbacks have limited the use of such measurements to laboratory environments (Guo et al., 2017), validation and certification of experimental wind turbines, and troubleshooting exercises (Rosinski and Smurthwaite, 2010). More recently, Zhang et al. (2018) explored different alternatives to measure torque in wind turbine drivetrains and added that a long‐term measurement of torque is considered to be nonpractical or economically not feasible.
Fiber-optic sensors have several advantages compared to electrical strain gauges (Kreuzer, 2006); the main ones for wind turbine applications are the following: (1) the signal-to-noise ratio of optical sensors is higher compared to conventional sensors, (2) they are immune to electromagnetic interference because they use light, and (3) many strain sensors can be accommodated in a single fiber. Because of these qualities, fiber-optic sensors have become popular in other wind turbine components. For example, fiber-optic sensors are used in wind turbine blades for condition monitoring and design optimization purposes (Glavind et al., 2013).
The present paper develops a new method to measure the input torque of wind turbine gearboxes. The proposed method measures strain directly in the fixed frame. In this study, a total of 54 strain sensors were installed on the outer surface of the first-stage ring gear. We have used fiber-optic strain sensors to overcome the main limitations of electrical strain gauges. The study was conducted using a Siemens Gamesa Renewable Energy (SGRE) gearbox manufactured by Gamesa Energy Transmission (GET). The gearbox is a three-stage gearbox, where the first and second are planetary stages, and the third is a parallel stage, with a rated power of 6 MW and a weight of approximately 44 000 kg.
The main contribution of this paper is to develop a new method to measure input torque in wind turbine gearboxes based on deformations in the fixed frame. The difficulties related to measuring on a rotating shaft are overcome by measuring on the outer surface of the ring gear using fiber-optic strain sensors to explore their advantages compared to conventional electric strain gauges. An experimental demonstration was performed on a full-scale wind turbine gearbox in a back-to-back test bench. The applicability of this method to determine the load sharing between planet gears is also explored.
The remainder of this paper is organized as follows: Sect. 2 gives a background on the fundamental principles used to measure torque from a static part in the gearbox, fiber-optic sensing, and the test setup used for the experiments. Section 3 describes a signal processing procedure to estimate torque based on peak strain values of each individual sensor, and Sect. 4 describes an alternative procedure based on a Coleman coordinate transformation to combine the instantaneous strain values of all sensors. Section 5 discusses the results obtained with both signal processing procedures. Finally, Sect. 6 draws the main conclusions of this work and suggests recommendations for future work.
2.1 Gearbox fundamentals
The primary function of the gearbox is to transfer the power generated by the wind from the main shaft supporting the rotor hub to the generator. In this transfer, the gearbox has to provide the needed increase in rotational speed. This speed increase is achieved in several stages. A variety of gearbox architectures have been used in commercial wind turbines, most of which combine planetary and parallel gear stages. Up to a rated power of around 2 MW, the most widely used configuration consists of an epicyclic planetary stage followed by two helical parallel stages, also known in the industry as PHH or 1P2H. For more powerful turbines with larger rotor diameters (from around 3 to 8 MW), a gearbox configuration with two planetary stages and a single parallel stage has become dominant and is referred to as PPH or 2P1H.
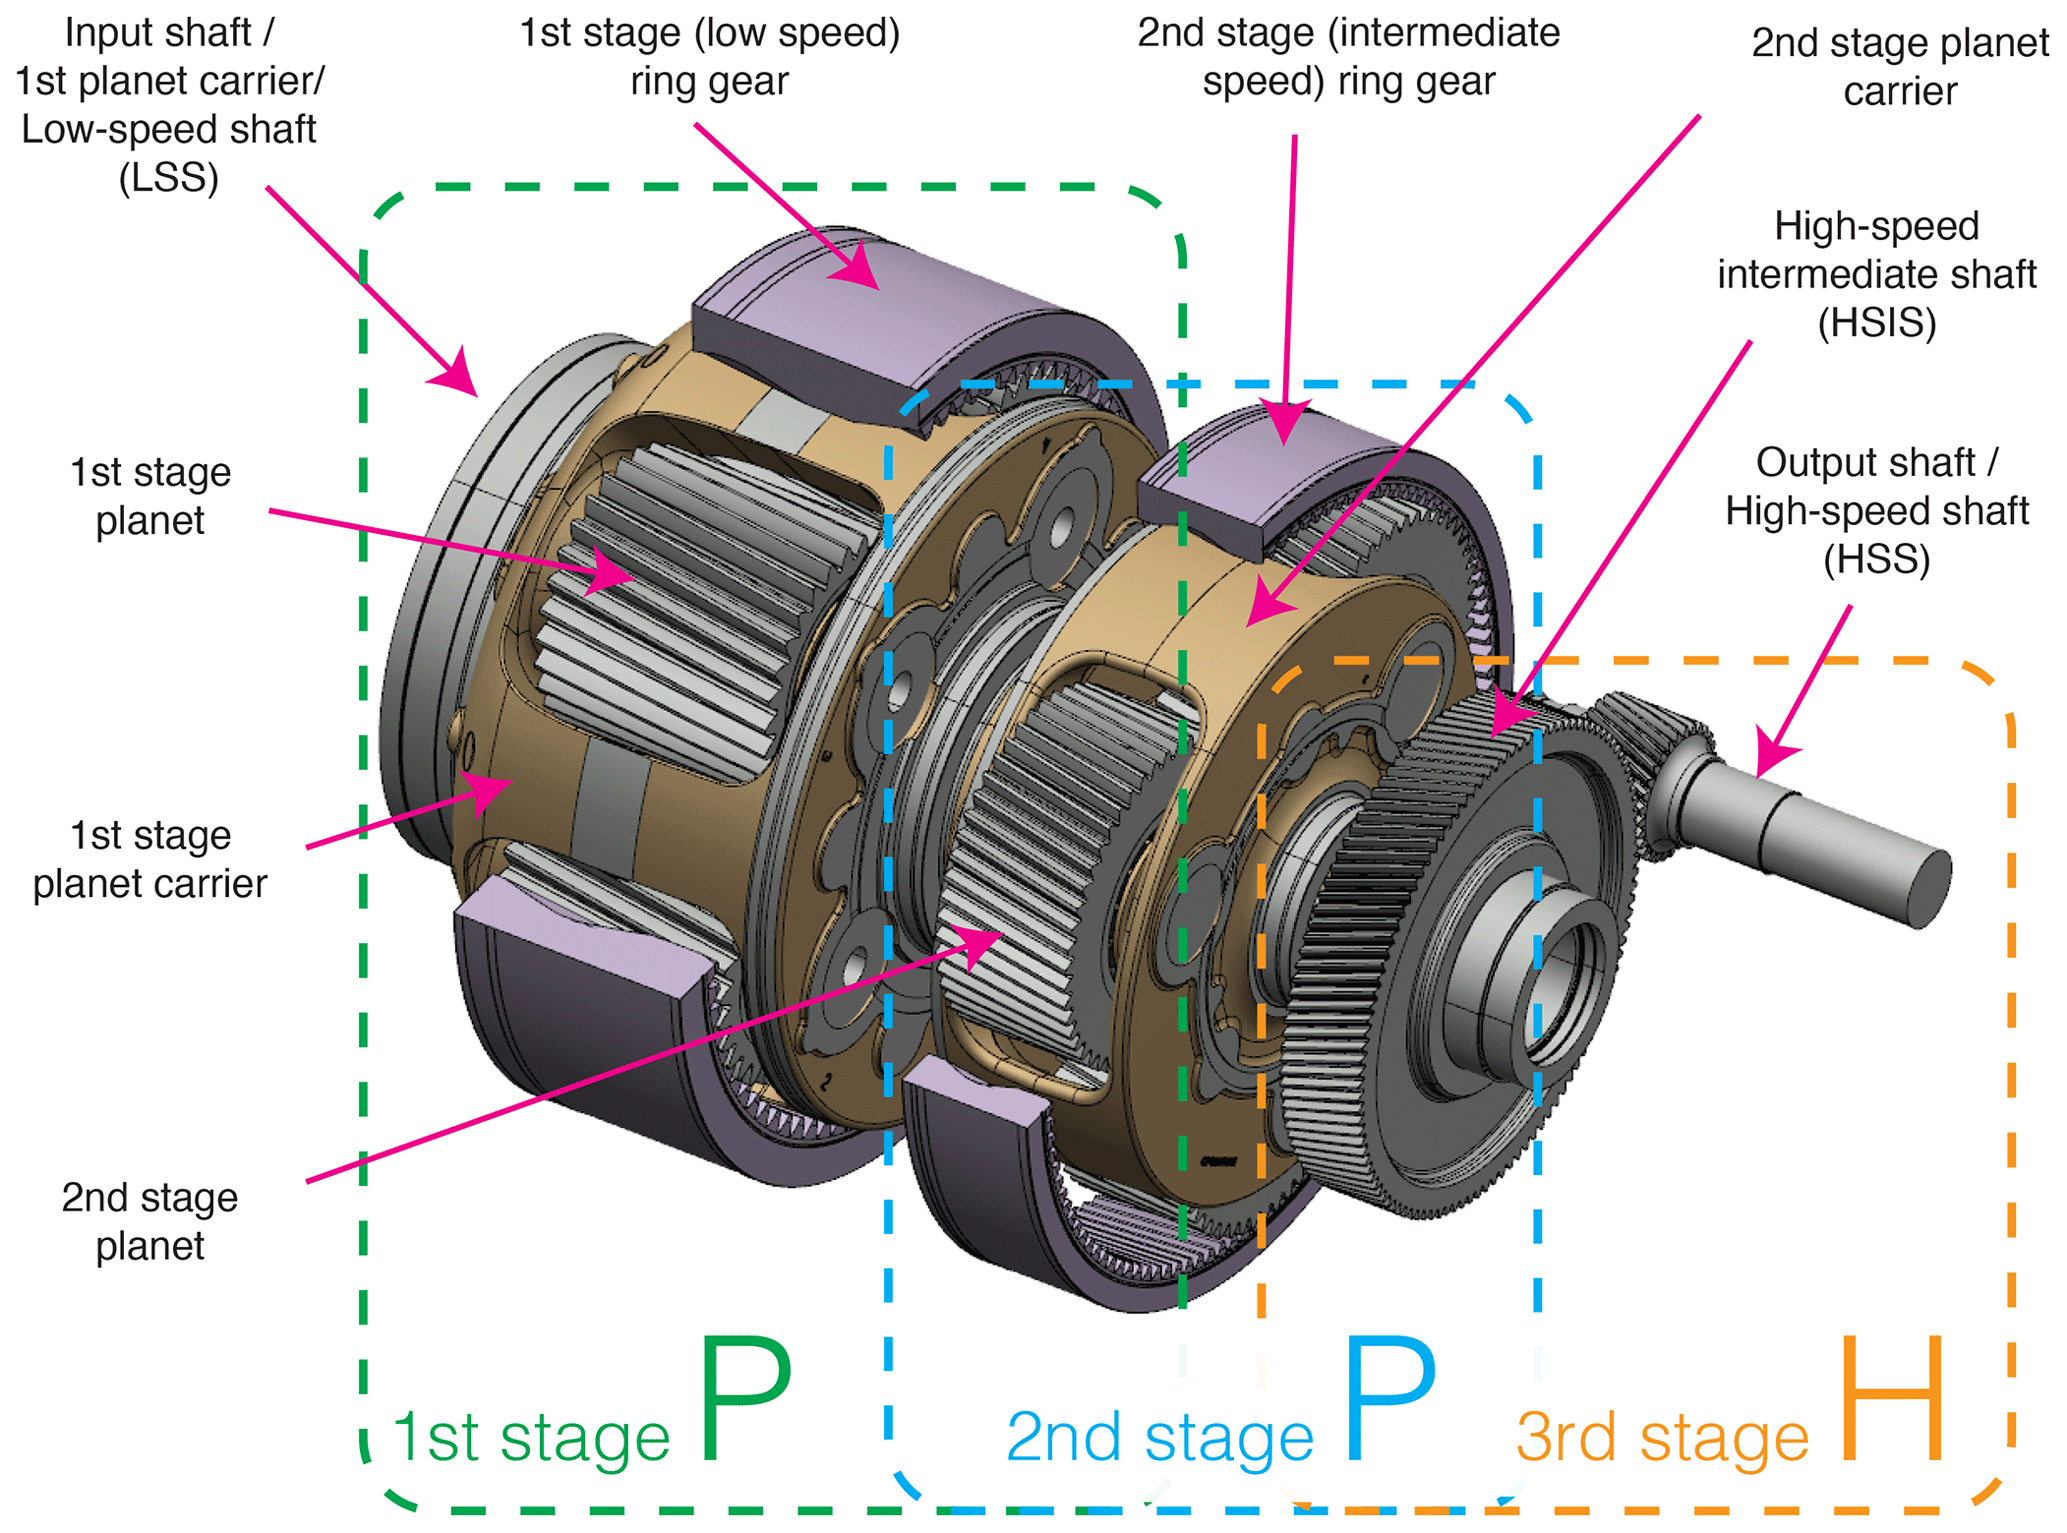
Figure 1Assembly drawing of shafts and gears from the three-stage Siemens Gamesa Renewable Energy gearbox (PPH configuration).
The present study was conducted on a SGRE gearbox manufactured by GET with a rated power of 6 MW. This gearbox has a PPH configuration. A drawing of the shafts and gears in this gearbox is shown in Fig. 1. The structural housings of the gearbox have been omitted for clarity. For even more powerful turbines, due to several factors like size constraints and the need to increase torque density, the industry is evolving to gearbox architectures with three planetary stages.
Regardless of the number of downstream planetary stages, the method presented in this paper can be applied to all gearbox configurations where the first stage is an epicyclic planetary stage with a stationary ring gear. In these gearboxes, the main shaft of the wind turbine is connected to the input or low-speed shaft (LSS) of the gearbox, which is the first-stage planet carrier. Figure 2 shows a section view of the first stage of the gearbox used in this study. When the planet carrier rotates, it transfers the input torque to the planet shafts. The planet wheels can rotate around the planet shafts and mesh simultaneously with the ring gear and the sun gear to achieve an increase in speed between the input (planet carrier) and the output (sun gear). The radial and tangential components of the mesh forces acting on the ring gear, resulting from the pressure angle of the gears, are shown in Fig. 2, where they are denoted as Fti for the tangential component and Fri for the radial component of the ith planet. The axial component of the gear mesh forces, resulting from the helix angle, has been omitted in this representation. These gear mesh forces deform the teeth of the ring gear and are then transmitted through the body of the ring to the reacting interfaces.
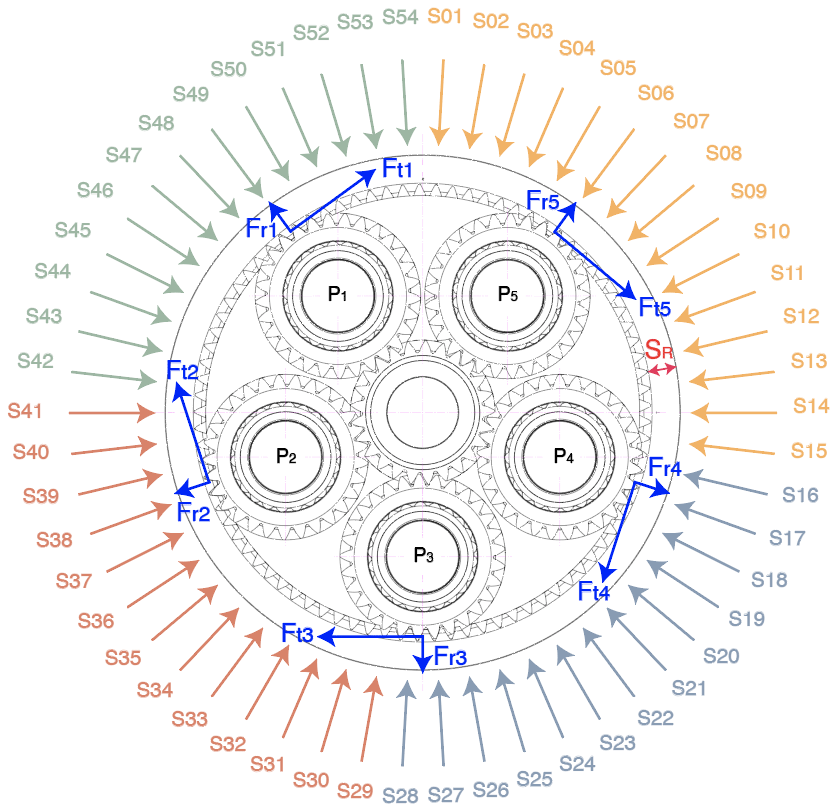
Figure 2Rotor side view of the middle section of the first planetary stage with the angular location of the strain sensors (S01 to S54). SR is the ring gear rim thickness, and Fti and Fri are the tangential and radial gear mesh loads from the ith planet (Pi).
The first-stage ring gear is the most expensive component of the gearbox in modern wind turbine gearboxes. Gearbox manufacturers strive to make the rim of the ring gear as thin as possible while complying with the minimum thickness requirements set by their design rules and gear rating standards like ISO 6336-1 (ISO, 2019). The rim thickness for the first-stage ring gear is defined as SR (see Fig. 2). Significant deformations are expected on the outer surface of the ring gear when the planets mesh with the ring gear because the rim is relatively thin. The research presented in this paper explores if and how strain measurements in the outer surface of the first ring gear can be used to derive the gearbox input torque.
2.2 Test bench setup
Wind turbine gearboxes are typically tested in a back-to-back arrangement. Two gearboxes are connected through the low-speed shaft (LSS) to reproduce the torques generated by wind turbine rotors in a cost-effective manner. Figure 3 shows the layout of the back-to-back test bench used for the present study, where electric motors produce the driving and braking torques. In the back-to-back configuration, a second gearbox is needed to reduce the rotating speed of the electric motor that acts as a driver and to increase the torque (referred to as gearbox 2 in Fig. 3). The input or driving motor is typically controlled to reach the desired running speed, and the driven motor is controlled to provide the specified braking torque, thus achieving the desired test conditions on gearbox 1.
Nevertheless, the gearbox operates at different boundary conditions compared to the wind turbine drivetrain configuration. The three main differences between a wind turbine and a back-to-back test bench are the following: (1) in a back-to-back test bench torque is the only controlled input load excitation; (2) the stiffness of the mechanical interfaces are different from the ones used in the nacelle of a wind turbine (mainframe, input or main shaft, and high-speed-shaft coupling); and (3) there is a lack of a tilt angle in the test bench, and the gearboxes are positioned with the main axis in a horizontal plane. Despite these differences, we consider the back-to-back test bench results representative of the wind turbine behavior when it comes to input torque.
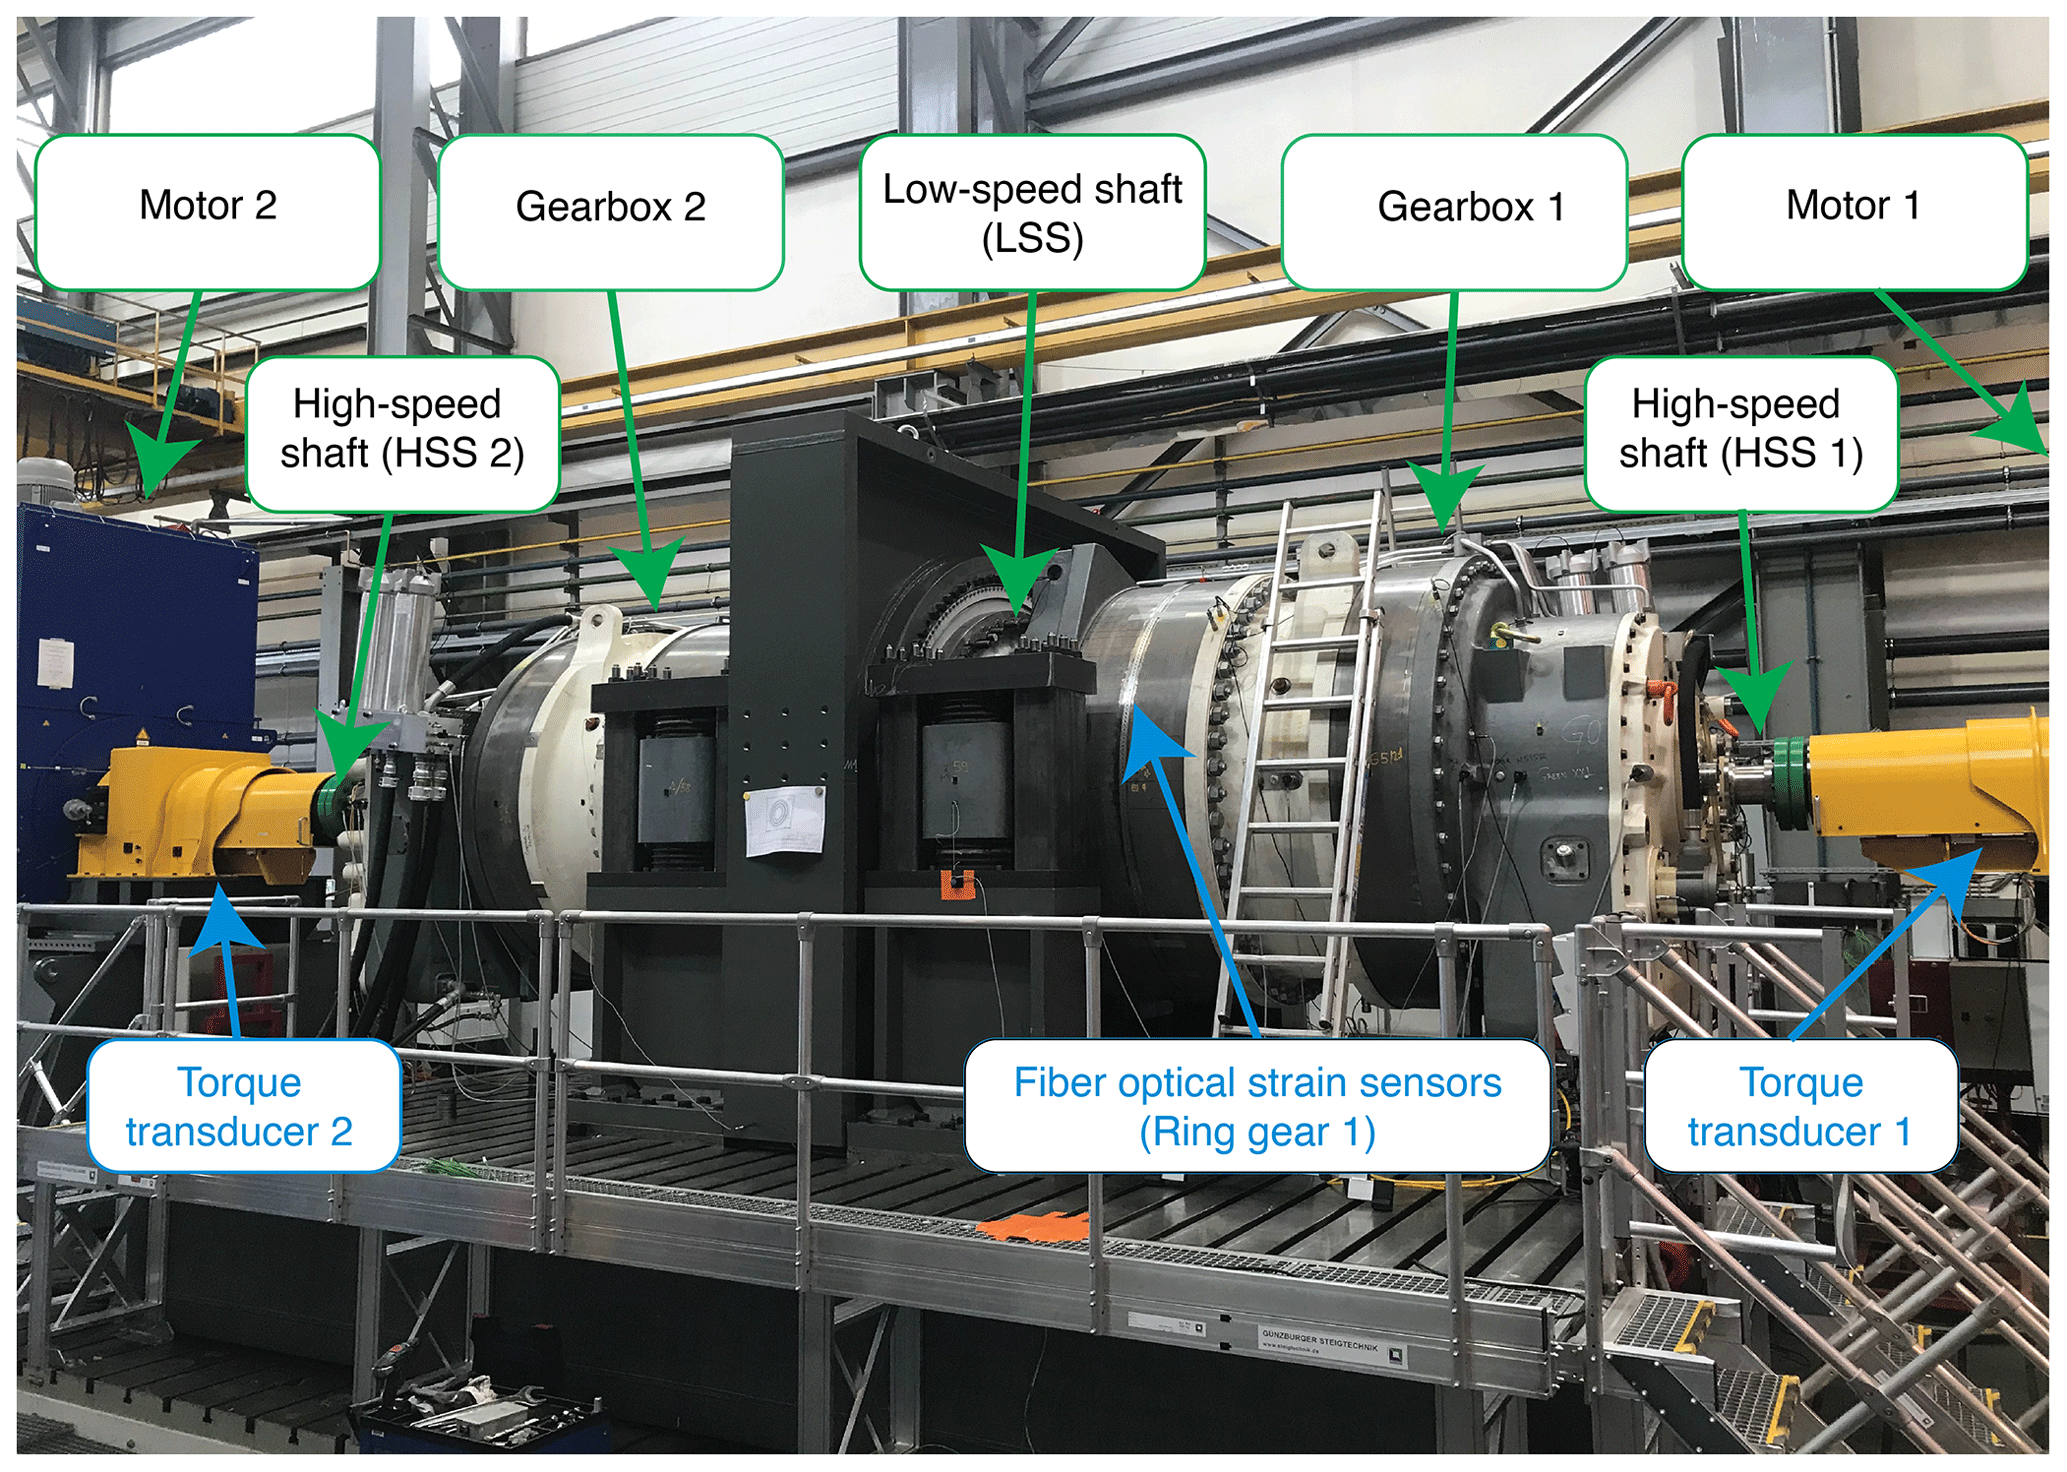
Figure 3SGRE gearboxes on a back-to-back test bench (property of DMT GmbH & Co. KG). The first-stage ring gear of gearbox 1 was instrumented with fiber-optic strain sensors.
A full-scale gearbox with a rated nominal power of 6 MW was instrumented using fiber-optic sensors. The position of the fiber-optic sensors can be seen in Fig. 3 on the outer surface of the first-stage ring gear of gearbox 1. All tests presented in this study were performed on the back-to-back test bench shown in Fig. 3, property of the company DMT GmbH & Co. KG (dmt group.com, 2021) at Krefeld (Germany) with electric motors of a rated power of 7.5 MW.
2.3 Fiber-optic sensors
The fiber-optic strain sensors used in the present study are based on fiber Bragg gratings (FBGs). These FBGs are a periodic variation of the refractive index of the fiber's core. At each refraction change, a small amount of light is reflected, and all the reflected light combines into one large reflection at the wavelength where the grating period satisfies the Bragg condition. The FBG is transparent for the light at wavelengths other than the grating wavelength, making it possible to integrate a large number of sensors in one fiber. The Bragg relation is
with n the index of refraction and Δ the period of the index of refraction of the FBG. The parameters n and Δ depend on the temperature and axial strain at the grating. When a full spectrum is inserted into the fiber, a specific wavelength is reflected at each FBG sensor. The strain and temperature at each FBG can be determined by measuring the change in wavelength. The FBGs used in this study have a theoretical sensitivity to strain of 1.19 pm wavelength shift per micrometer per meter strain, and the sensitivity to temperature is 27.9 . Several FBGs can be integrated into a single optical fiber. In practice, the total amount of sensors per fiber has to be chosen taking into account the deformations and temperatures to be measured to prevent wavelengths from different gratings from overlapping. The gratings are sensitive to the strain in the axial direction of the fiber.
For the present study, four optical fibers were installed with 14 FBGs accommodated on each fiber. Out of the resulting 56 gratings, 54 gratings were used to measure strain in the positions shown in Fig. 2. The remaining two gratings were dedicated to temperature measurements. These two gratings were placed in the vicinity of strain sensors S02 and S29 with a small tube around the FBGs to prevent straining the fiber. However, the installation was not successful, and it was not possible to gather reliable temperature data from these two FBGs. The four optical fibers were installed on the outer surface of the first-stage ring gear, at the middle section along the width of the ring gear in the axial direction, as shown in Fig. 3. The middle section was chosen to minimize the local effects of the bolted joints at the rotor and generator side. The fibers were installed tangentially to the middle section, covering a complete revolution along the outer perimeter of the ring gear. Figure 2 shows the radial and angular location of all the strain sensors with the corresponding labels in a rotor side section view. Due to the placement of the fibers, the FBGs measure the deformation of the outer surface of the ring gear in the tangential direction of Fig. 2. The four different colors for the sensor labels indicate how the FBGs were grouped into separate fibers (S01 to S15 in fiber number 1, S16 to S28 in fiber number 2, S29 to S41 in fiber number 3, and S42 to S54 in fiber number 4). The four optical fibers were connected to an optical interrogator. The interrogator sends a full spectrum of light into each fiber and acquires the reflected light to quantify the shift of wavelength from each grating. Three analog signals were added to associate the fiber-optic strain measurements with the gearbox operating conditions: two torque transducers installed at the high-speed-shaft (HSS) couplings (see Fig. 3) and an inductive sensor providing a once-per-revolution pulse of the input shaft (see Fig. 4). The purpose of this inductive sensor is to provide information on the angular position of the input shaft and, therefore, the relative position of the planet carrier and the planets.
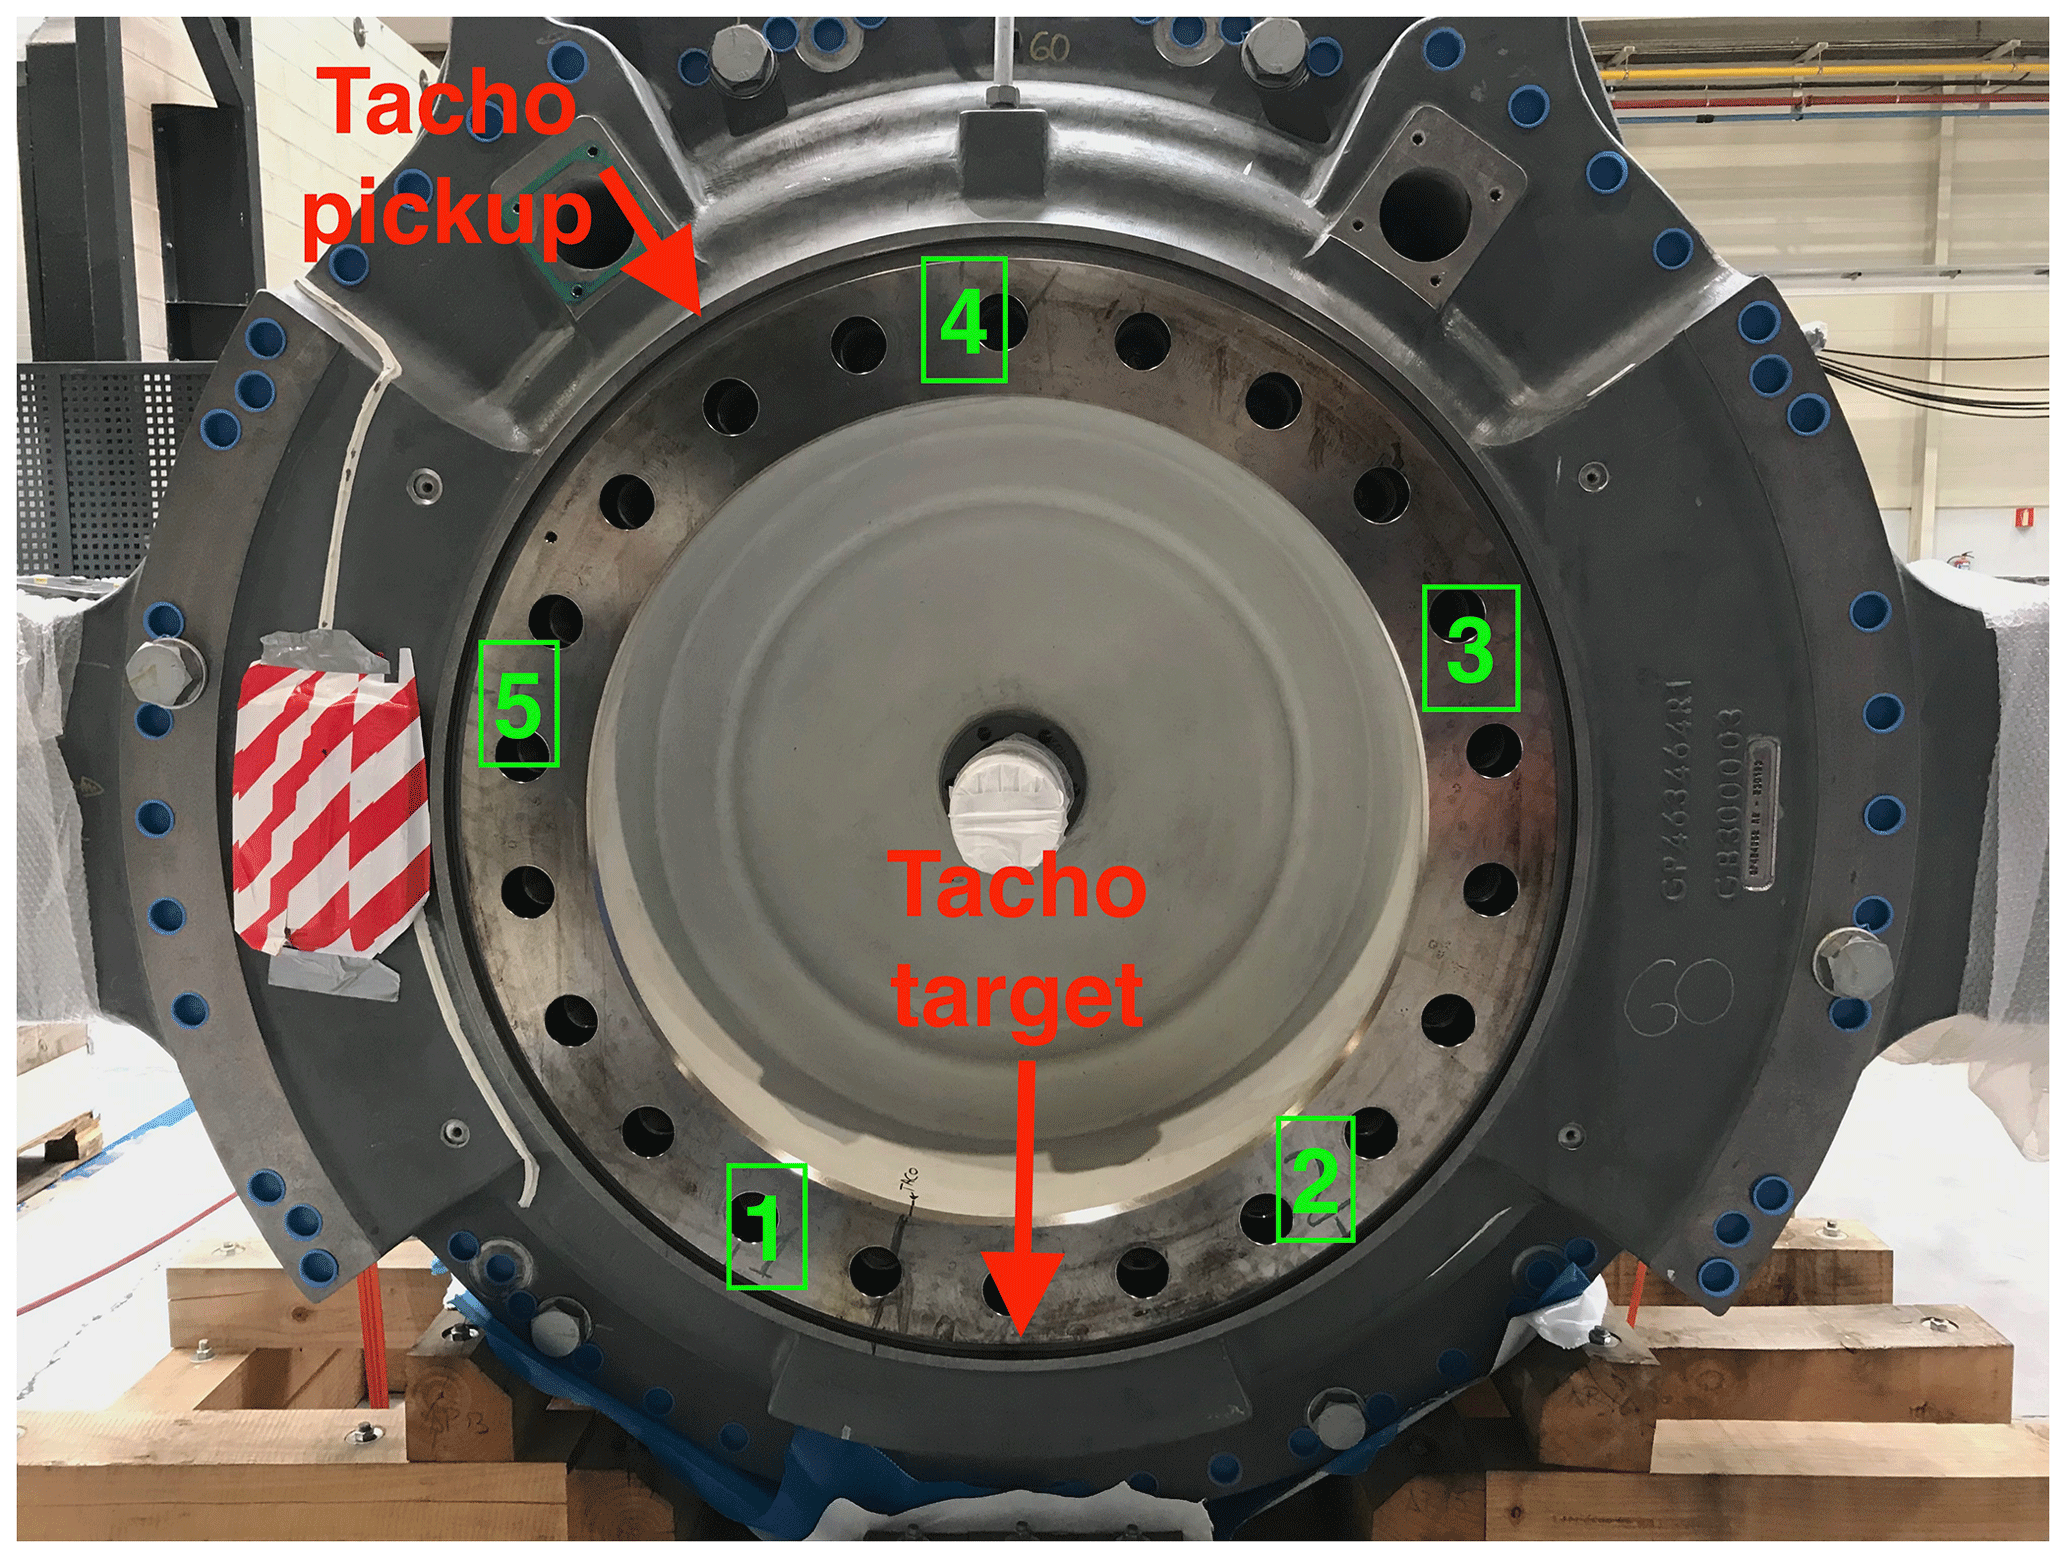
Figure 4Position of planets and input shaft marker, stationary inductive sensor, and rotating target. Tacho is short for tachometer.
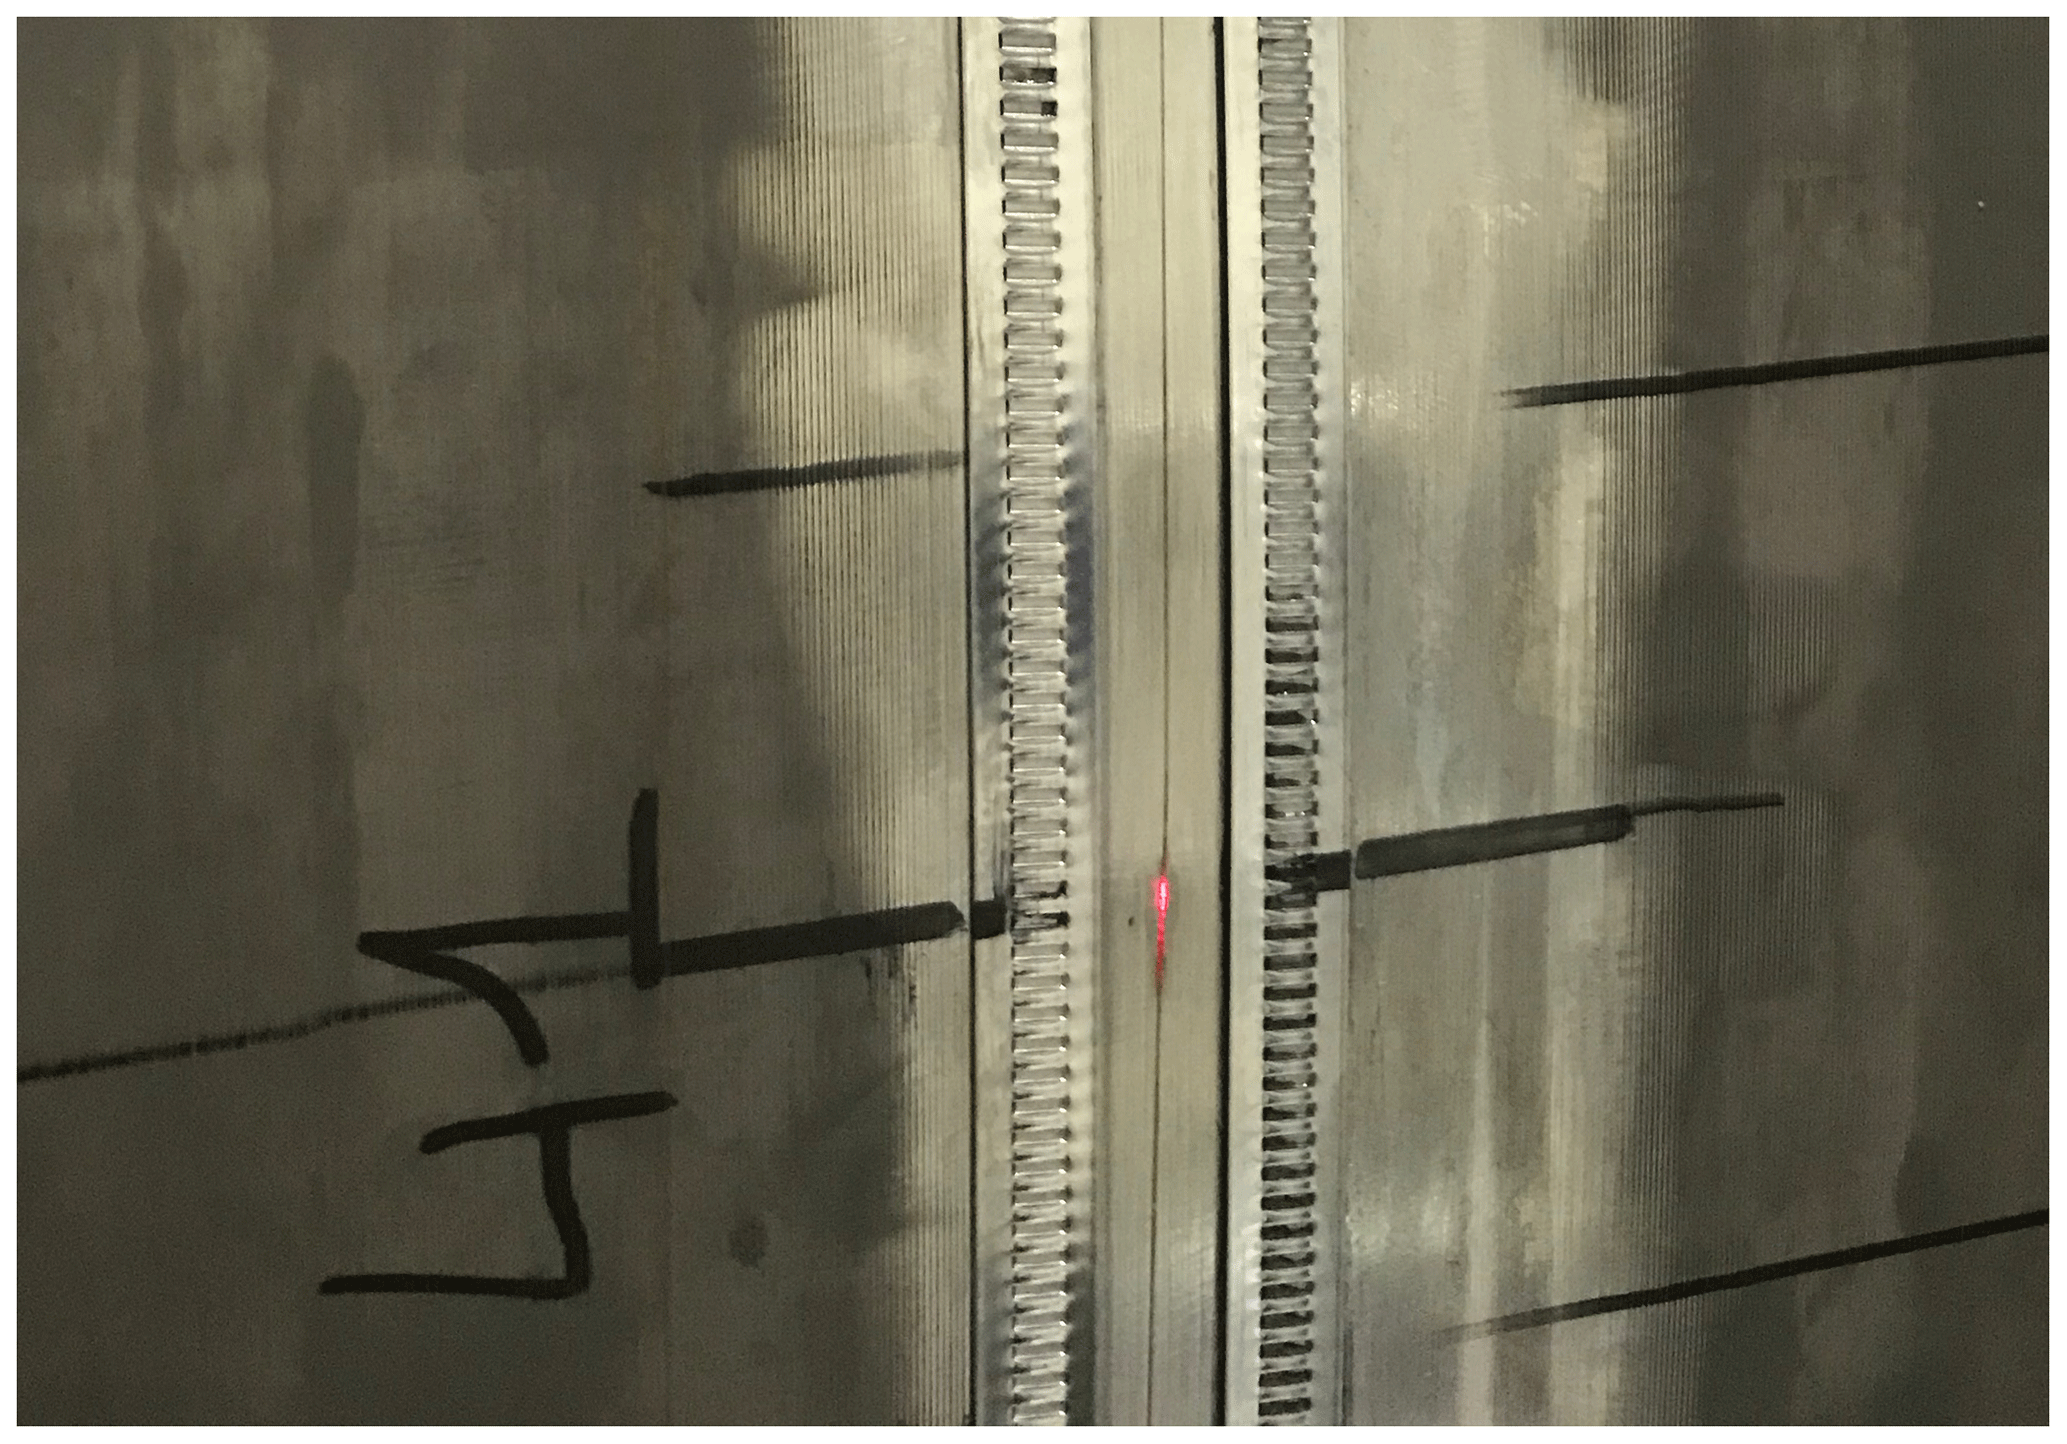
The fiber-optic sensors were supplied and installed by the company Sensing360 B.V. (sensing360.com, 2021). Before installing the fibers, the outer surface of the ring gear was sanded to improve the bonding between the fiber and the ring gear. The fibers were glued to the ring gear's outer surface using a cyanoacrylate adhesive. Figure 5 shows a naked optical fiber with an illuminated fiber Bragg grating (S41) due to the exposure to a colored laser beam. The polished surface needed for the installation of the fibers can be observed in Fig. 5.
2.4 Experiments
The results presented in this study were obtained during tests performed for the validation campaign of the SGRE gearboxes. In order to characterize the relationship between torque and strain, the instrumented gearbox was run under different stationary speed and torque conditions. During this torque vs. strain calibration process, 20 short tests were performed where the torque level was increased in 5 % increments from 5 % to 100 % of the nominal, while the gearbox rotational speed was kept constant and equal to the nominal value.
After the stationary calibration tests, the gearbox was run under dynamic torque conditions to collect strain data and evaluate the torque estimation procedures. In particular, two different tests with variable torque will be presented. First, a test with a linearly increasing torque reference command was performed. Then, a second test was conducted where the torque level was changed in steps as the test bench controller allowed. During both variable torque tests, the reference speed command was kept constant.
2.5 Data acquisition and signal pre-processing
Data from the fiber-optic sensors were logged directly by an optical interrogator, and data from the analog signals were logged by a separate data acquisition system. Both systems are independent, but the data were time-stamped using the POSIX(R) (IEEE, 2008) time which allowed for time synchronization of sufficient accuracy. A sampling frequency of 2500 Hz was used to collect data from all 54 strain sensors.
Two preprocessing steps were applied to the signals from fiber-optic sensors. First, the data were cleaned from glitches caused by the interrogator. A sudden drop in the value was observed in some of the logged signals. These drops were due to hardware communication errors and could be easily detected and removed. After the glitches in the data were removed, a moving average filter was applied. The combined resolution of each strain sensor and the data acquisition system was found to be approximately 0.6 µϵ. The strain data signal can jump from one sample to the next in a set of fixed values separated by the sensor resolution. A moving average filter was applied to the 54 strain signals to filter this effect. The moving average was realized using a window size of seven samples.
After the above-mentioned preprocessing steps, strain signals were detrended to remove the effect of temperature on the measured shifts in wavelengths of the FBGs; see Sect. 2.3. Once the long-term shift caused by temperature had been removed, the remaining signal was considered to be caused entirely by the strain imposed from the planet gear mesh events.
For each of the tests performed in the back-to-back test bench, described in Sect. 2.2 and 2.4, data were acquired and logged from the 54 fiber-optic strain sensors and the three analog signals described in Sect. 2.3.
3.1 Identification of strain peaks caused by gear mesh events
When the gearbox was tested under stationary torque and speed conditions, the individual signals from each fiber-optic strain sensor exhibited a positive or tensile strain peak every time a planet meshed with the ring gear in the vicinity of the sensor. Figure 6 shows the acquired strain signal of the individual sensor S01 during one revolution of the low-speed shaft. Each full revolution of the input shaft is marked by a pulse from the inductive sensor in orange, and five positive or tensile strain peaks are observed, corresponding to the meshing of the five planets in blue. A large tensile deformation occurs when a planet passes below the measurement location. As the low-speed shaft keeps turning, the strain diminishes, reaching compression. First, a local minimum is observed; then, the strain briefly recovers but drops again until a global minimum is reached. The strain keeps increasing from this global minimum until the next tensile peak.
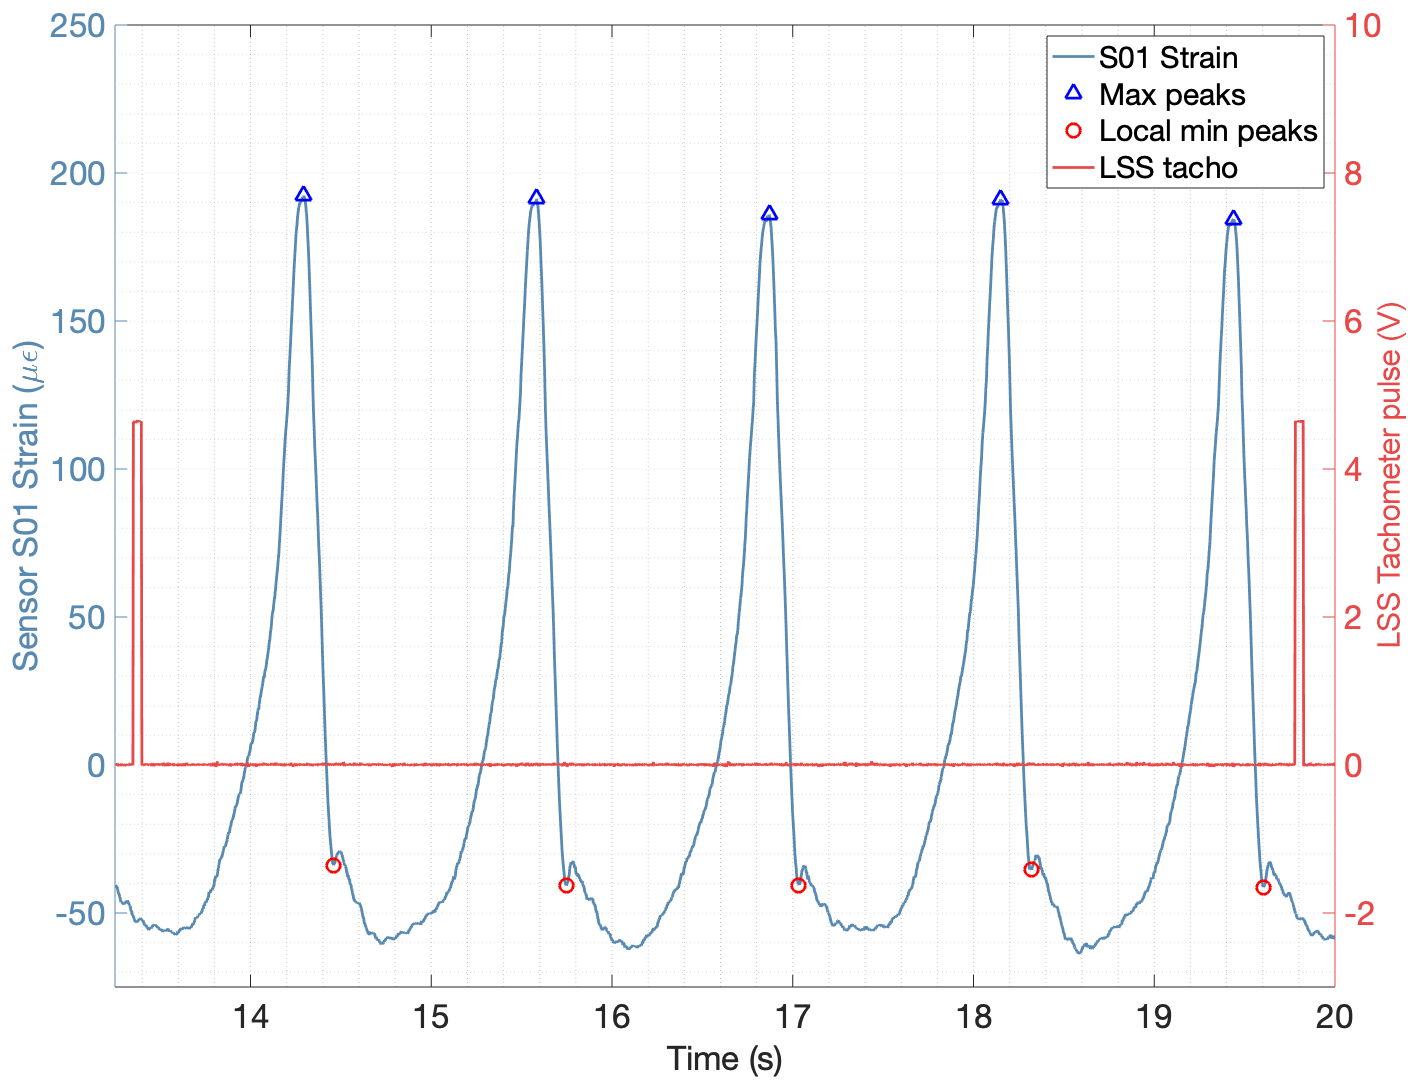
Figure 6Sensor S01 strain signal (left axis) during a single revolution of the input shaft (right axis) with detected peaks.
In order to study the relationship between torque and strain, 20 tests were performed running the gearbox under stationary speed and torque conditions. While the gearbox rotational speed was kept constant and equal to the nominal speed, the torque was increased in 5 % increments from 5 % to 100 %. In each test step, the strain signals of all 54 sensors were measured and logged for 4 min. The magnitude of the strain difference or peak-to-peak value between the detected maxima and local minima peaks was computed for each of the 54 strain sensors for all 20 test steps. This magnitude will be referred to as the peak-to-peak value. The local minima were chosen because the time difference from the maxima to the corresponding local minima is in the range of the gear mesh cycle, and it is believed to be more representative of the gear mesh forces. Figure 7 shows the average peak-to-peak values computed for five tests at different torque levels using the local minima. The peak-to-peak value of each sensor is plotted according to the corresponding sensor angular location (rotor side view) shown in Fig. 2.
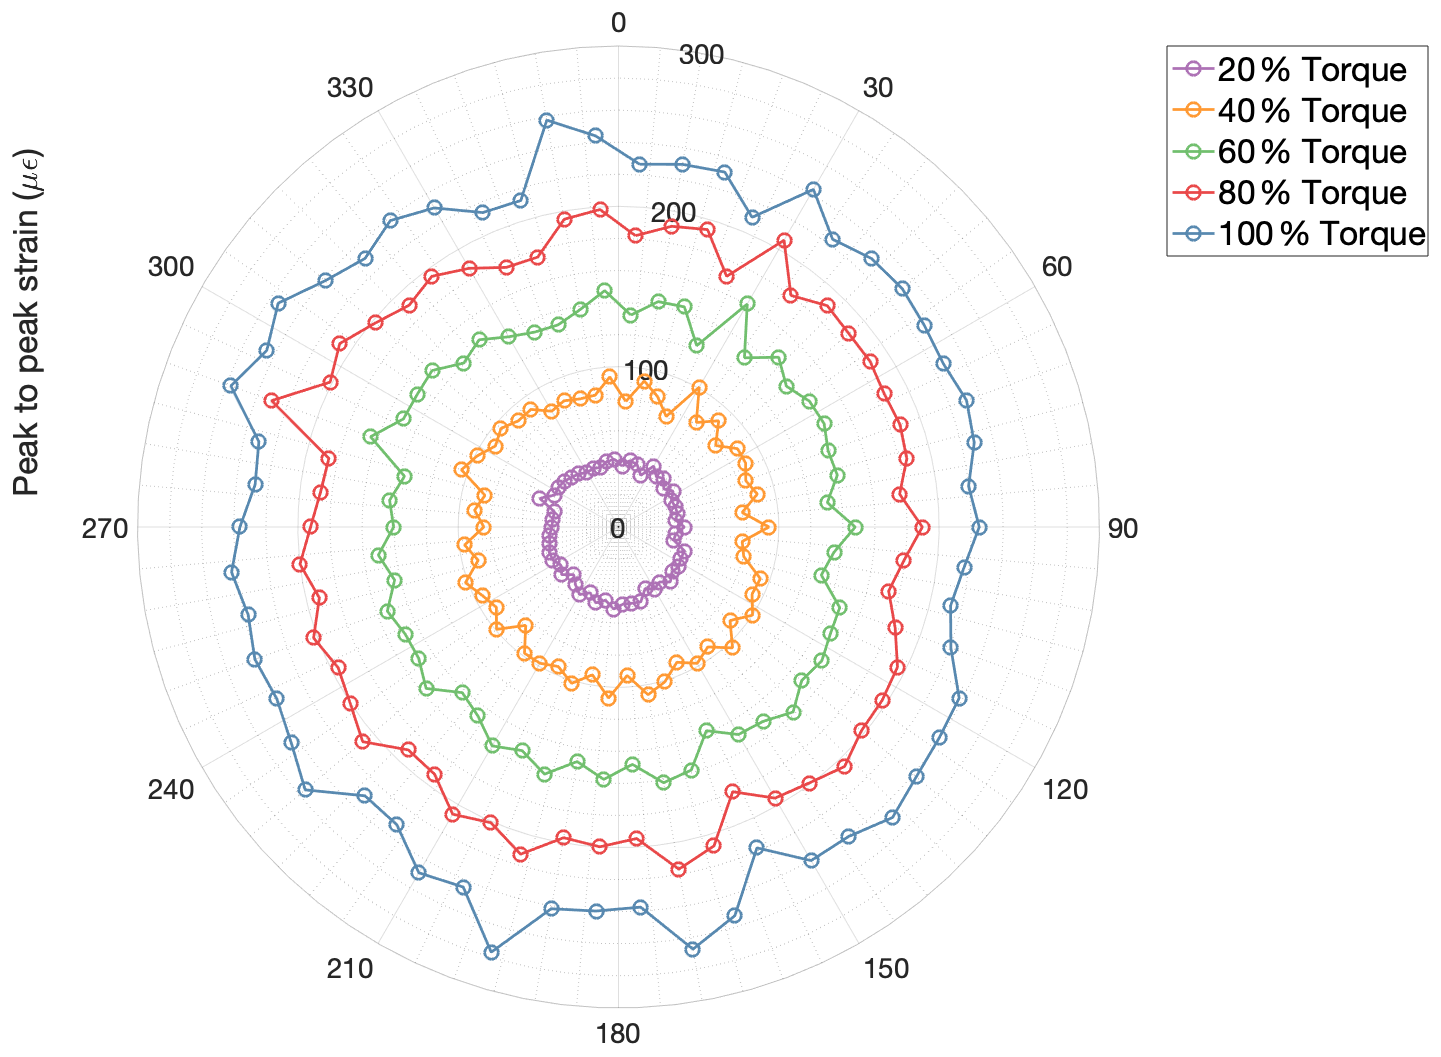
Figure 7Average peak-to-peak strain values of all 54 sensors for five different torque levels (20 %, 40 %, 60 %, 80 %, and 100 % torque).
The input torque was not measured directly and was calculated using the torque data from the torque transducers installed in the high-speed shafts (see Fig. 3). The efficiency of both gearboxes was assumed to be the same, and the LSS or input torque was computed as the average of both HSS torques multiplied by the gear ratio. The torque signals were averaged for the time segments between the tensile and compression peaks.
3.2 Relationship between peak-to-peak strain values and torque
Having measured strain on 54 locations on the outer surface of the static first-stage ring gear, and with the simultaneous data available from the torque transducers installed at both high-speed shafts, the following section shows how the measured strain signals can be correlated with the input torque.
Each measurement location has its own individual behavior with respect to torque, as can be seen in Fig. 7. A regression polynomial can be computed using the least-squares criterion for each individual strain sensor to fit the peak-to-peak values with the torque. A linear, a quadratic, and a cubic fit of torque vs. peak-to-peak were investigated for comparison purposes. Figure 8 shows the average peak-to-peak values vs. torque for three different measurement positions together with the cubic polynomial approximations. Only the cubic regressions are shown for clarity purposes, and similar regressions can be produced for every individual sensor as described in Sect. 3.1. When analyzing the different order regressions, the linearity of the peak-to-peak vs. torque behavior was observed to be different in each measurement location. The sensors S04, S17, and S53 were chosen for Fig. 8 because the difference in their behavior is representative of the largest differences observed. Several factors were expected to play a role in the torque to deformation relationship, e.g., the lack of symmetry of the housings connected to the ring gear, the different relative position between the strain sensors and the gear teeth, and the possibility to have different load distributions across the face width for different angular positions. However, the differences in linearity observed for different sensors are not fully understood by the authors yet. Sensors S04, S17, and S53 were chosen for Fig. 8 because the difference in the peak-to-peak vs. torque behavior was more pronounced. Sensor S04 exhibited a lower more linear response, while sensors S17 and S53 had a larger response but lower linearity. However, it is possible to achieve a satisfactory fit for all points by increasing the order of the regression polynomial.
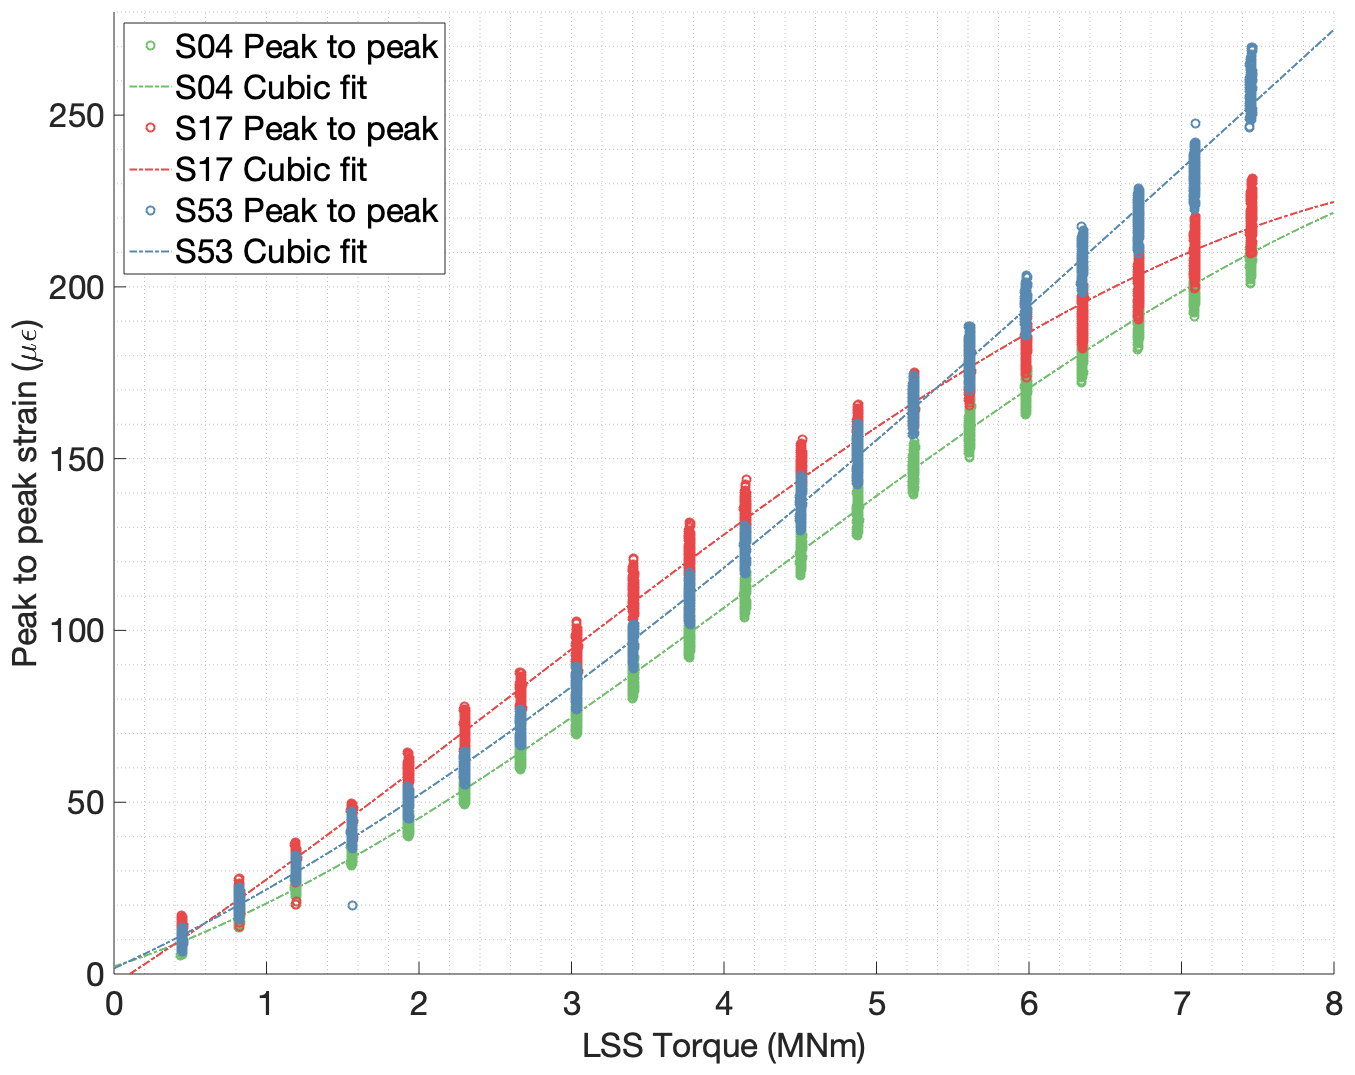
Figure 8Peak-to-peak strain values of all detected gear mesh events of strain sensors S04, S17, and S53 vs. torque in the low-speed shaft.
3.3 Load sharing between planets
A polynomial fit of the average torque can be derived using the peak-to-peak values from each strain sensor. To extend this result for a dynamic situation, the load sharing between planets has to be known. The strain signals exhibit a highly dynamic nature, and peak-to-peak values change with time. These changes can be due to changes in torque and possibly also due to changes in load sharing between planets.
The gear rating standard ISO 6336-1 (ISO, 2019) defines the planet load share factor Kγ as the load carried by the planet gear carrying the higher load divided by the average load of all planets. Since a satisfactory fit has been found between the average torque and the average peak-to-peak values, the following expression is proposed to derive Kγ of a particular planet from the measured peak-to-peak strain values
where is the average peak-to-peak value from a particular planet i, and is the average peak-to-peak value of all planets. It is possible to assign peak-to-peak values to individual planets because the position of the planets relative to the once-per-revolution pulse is known (see Fig. 4). The meshing sequence of the planets is fixed if the sense of rotation is known. The spacing between strain sensors is not an integer multiple of the number of planets, so with the instrumentation setup used in this study, it is not possible to compare strain peaks in different positions simultaneously. Figure 9 shows the resulting average Kγ for each strain sensor position obtained computing Eq. (2) with the average peak-to-peak values.

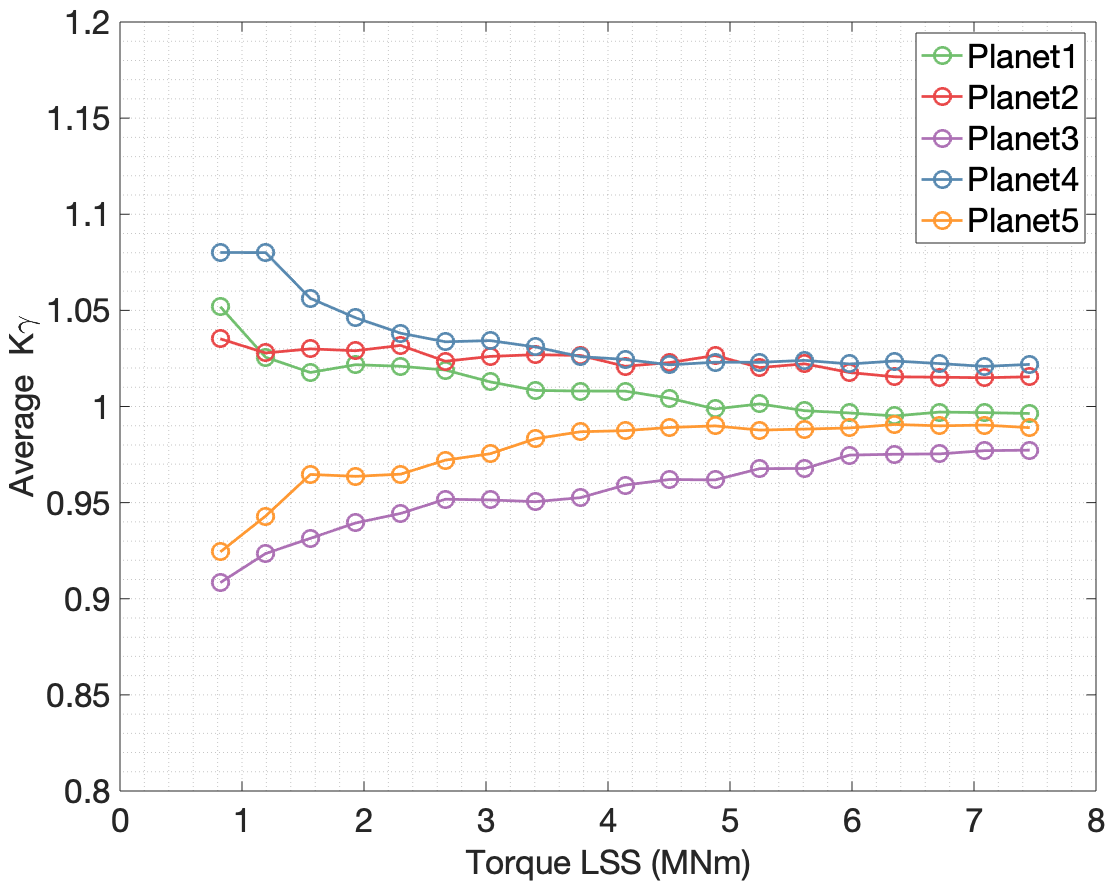
Using the correlation of peak-to-peak values vs. torque and the average planet load share Kγ, an approximation of the instantaneous torque can be made. Figure 10 shows the average Kγ values of the five planets for their corresponding average torque values. As can be seen in Fig. 10, the load sharing coefficient between planets depends on the gearbox input torque value. An improvement of Kγ was observed, with Kγ closer to one, as the torque in the gearbox increases. In order to avoid a second linear regression, both data fitting steps can be merged into one. First, each detected mesh event is assigned to its corresponding planet. Then a regression polynomial is computed from the peak-to-peak strain values to torque for each individual planet.
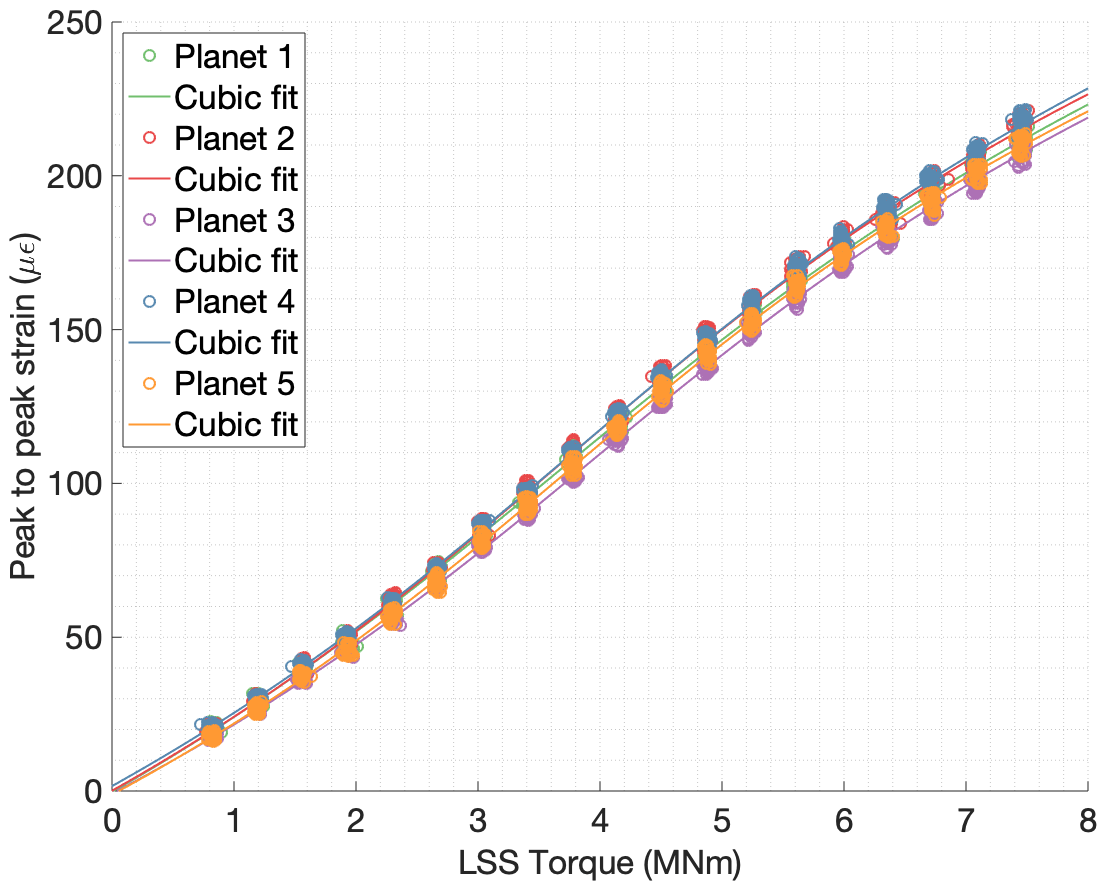
Figure 11Peak-to-peak strain values of sensor S52 vs. torque in the low-speed shaft separated for each planet and their corresponding cubic fit.

Figure 12Peak-to-peak strain values of sensor S52 vs. torque in low-speed shaft separated for each planet (zoom for higher toque range).
3.4 Torque estimation procedure using peak-to-peak strain values
With the approximation to Kγ presented in Sect. 3.3, torque can be estimated when a mesh event is detected. The procedure is represented in Fig. 13 and can be summarized as follows.
- Step 0
-
Calibration phase. Learn the peak-to-peak vs. torque correlation for each planet and each measurement location to produce n⋅p regression polynomials; n is the number of strain sensors and p is the number of planets.
- Step 1
-
Detect peaks. For a new dataset of strain signals, for every individual strain signal, detect gear mesh events and identify their associated maximum and minimum peak strain values to compute the peak-to-peak value.
- Step 2
-
Assign planet. With the information from the once-per-revolution input shaft pulse, assign the detected gear mesh event to the corresponding planet that caused the strain.
- Step 3
-
Torque estimation. Evaluate the corresponding regression polynomial to compute a torque value from the peak-to-peak value (taking into account the strain sensor and the individual planet involved in the gear mesh).
- Step 4
-
Sort according to time.Repeat steps 1 to 3 for all mesh events detected in all strain sensors and sort the estimated torque values from individual mesh events according to the time when the gear mesh event was detected.

With the data processing strategy for torque estimation based on peak-to-peak values presented in Sect. 3, torque can only be evaluated when a gear mesh event between a planet and the ring gear is detected. To overcome this limitation, an alternative procedure has been developed based on a coordinate transformation of the strain signals, followed by an analysis and tracking of the harmonic components. This procedure combines the information from different strain sensors to exploit the signal information between mesh events.
The Coleman transformation or Fourier coordinate transformation can transform the equations of motion from a rotating coordinate system to a non-rotating coordinate system. In wind turbines, the Coleman transformation is also referred to as the multiblade coordinate transformation (MBC). The term MBC was adopted from helicopter theory (Johnson, 1994) and is widely used to analyze the dynamics of the wind turbine rotors (Bir, 2008; van Solingen and van Wingerden, 2015).
For the instrumentation setup used in the present study with 54 strain sensors, the Coleman transformation can be particularized to the following equations:
where δs(t) is the strain of the sth FBG sensor for a given time t and ψs(t) is the assigned angular position of the sensor at that time t (see Sect. 2.3). The angle ψs(t) is defined as the relative angle between the angular location of each sensor according to Fig. 2 and the angular location of the input shaft. The angular location of the input shaft determines the angular position of the planet carrier and, therefore, the five planets. The angular location of the input shaft is also known as the azimuth angle of the rotor. The coefficients Pnc(t) and Pns(t) can be computed for any integer multiple of n and for any time t when strain data of all sensors are available.
For low values of n, where the Nyquist criterion is satisfied, the expressions in Eqs. (3) and (4) are equivalent to the sine and cosine coefficients of a Fourier series decomposition of the resulting periodic function δ(ψ). The function δ(ψ) is a discrete representation of the strain of the 54 measurement points δ as a function of their assigned angle ψ. Figure 14 shows the signal values δs for all 54 strain sensors against their assigned angle ψs for a given time sample t0. In this case, t0 corresponds to a time sample when the start of the once-per-revolution pulse was detected. The strain values of tests with different torque levels are shown in Fig. 14 using strain data samples that correspond to the same angular position.
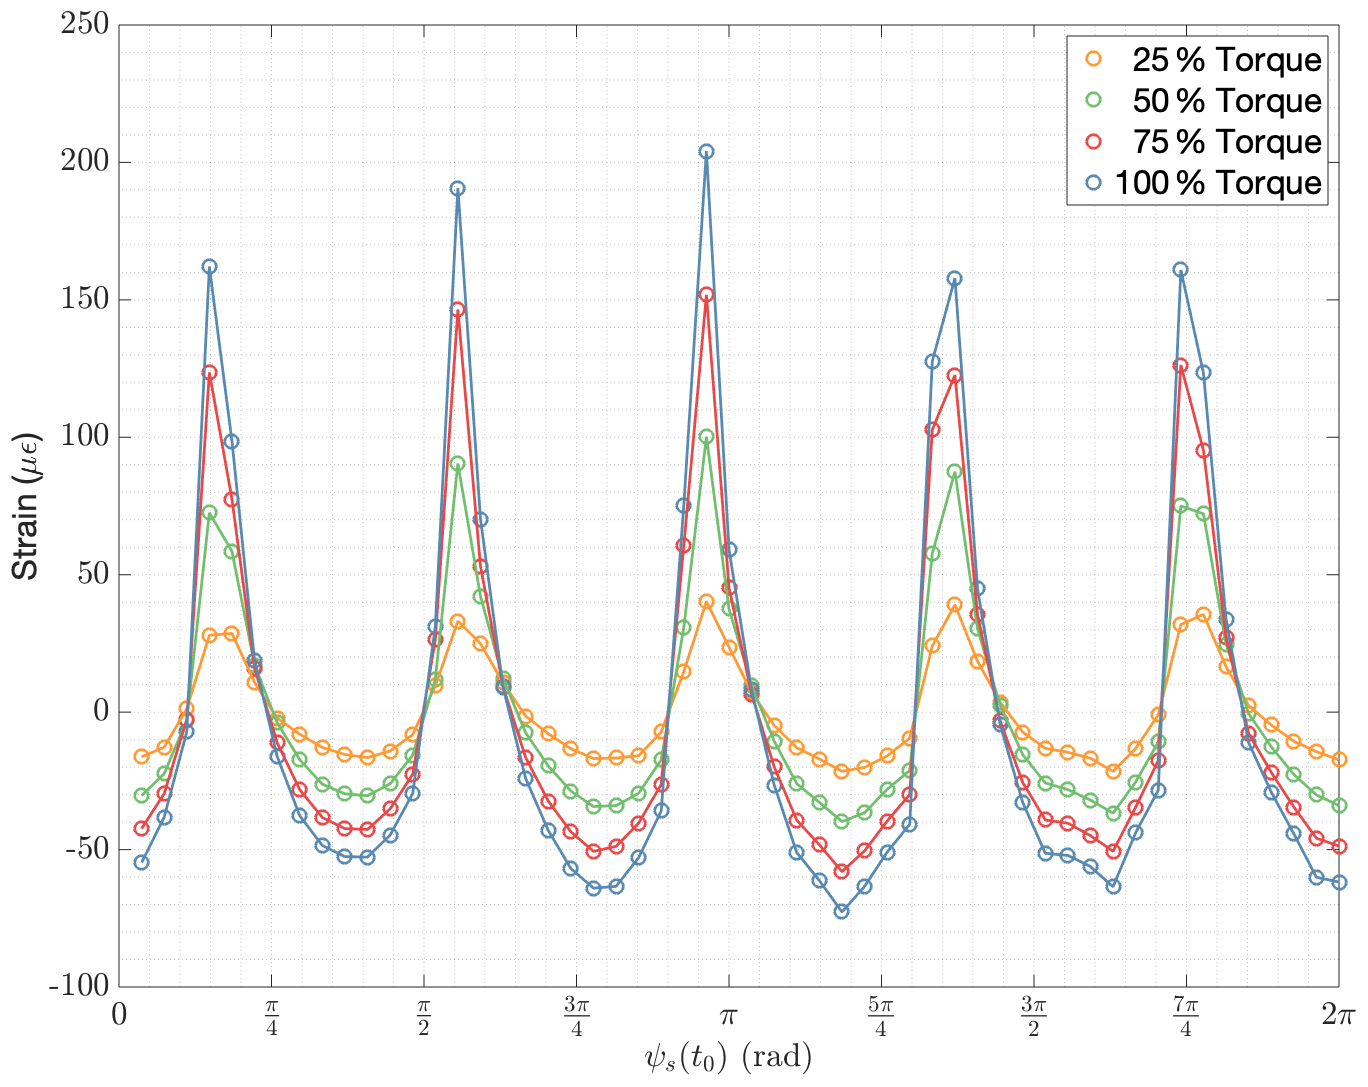
Figure 14Instantaneous signal values of all 54 strain sensors for four different torque levels (25 %, 50 %, 75 %, and 100 % Torque).
The 54 strain sensors are equally spaced around the full revolution of the ring gear, and therefore the function δ(ψ) is a periodic function with a period of 2π. Its Fourier series decomposition is defined as a sum of the basis functions ϕn(ψ) times complex coefficients pn:
In the field of rotating machinery, the frequency defined by the time needed to complete a full revolution of the shaft (2π rad) is called the fundamental frequency, and the integer multiples of this frequency are called harmonic frequencies. The magnitude and phase of the complex coefficients pn can be computed as follows:
It is shown in Sect. 3.2 that each strain sensor has an individual relationship to torque. The Coleman transformation, Eqs. (3) and (4), combines the information from different strain sensors. A scaling or weighting factor was introduced to guarantee that all sensors have an equal contribution. To achieve these scaling factors the signals of each sensors were evaluated for complete revolutions of the input shaft. The strain signal from an individual strain sensor during a complete revolution of the input shaft is shown in Fig. 6. The power spectrum of an individual strain signal is dominated by the fifth harmonic component. This harmonic component can also be obtained from a Fourier series decomposition if we consider δs(t) is a periodic function of time with fundamental frequency of , where T is the time needed to complete a full rotation of the input shaft. The Fourier series decomposition for the strain of each individual sensor as a function of time can be expressed as
The complex coefficients asn are the nth harmonic component of the sth strain sensor. Figure 15 shows a comparison between the raw strain signal of a single FBG, sensor number 01 (S01), and the fifth harmonic component during a complete revolution of the low-speed input shaft. Two different torque levels (25 % and 100 %) are plotted in Fig. 15 to illustrate the effect of torque. Higher integer multiples of the fifth harmonic have a lower but significant contribution. For the calibration phase, tests were performed at 20 different torque levels, and the magnitude () was computed for every full revolution measured using the following equation:
The relationship between torque and the magnitude of the fifth harmonic of each sensor was investigated for all the 20 torque levels. Again, the low-speed shaft torque value was derived from the measurements of the test bench torque transducers located at the high-speed shafts. A regression polynomial was computed for each individual strain sensor fitting the values to the torque using the leas-squares criterion. Figure 16 shows the magnitude values of four different FBGs, for all revolutions of the input shaft measured during the 20 different load steps, against the average torque in the low-speed shaft during those revolutions. A linear, a quadratic, and a cubic fit of torque vs. for each sensor s were realized to evaluate the linearity of each sensor; however, for clarity only the cubic fit is shown in Fig. 16.

Figure 15Original strain signal of sensor S01 for one shaft revolution vs. reconstructed signal using the fifth harmonic component a5 (two load cases are compared with 25 % torque in red and 100 % torque in blue).
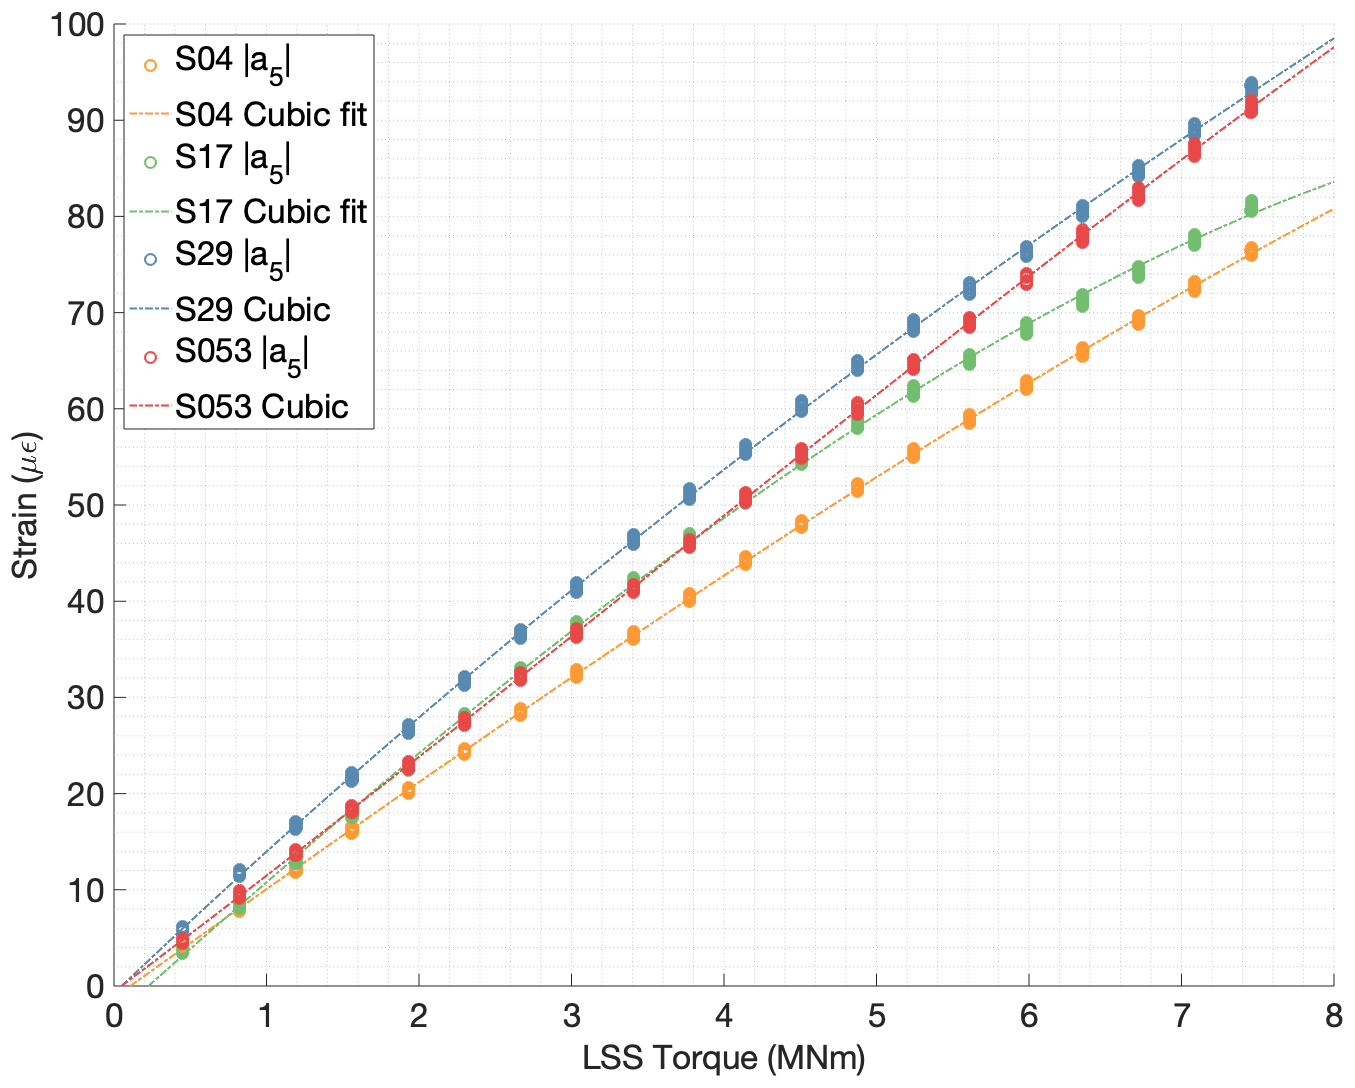
Figure 16Magnitude of fifth harmonic of four strain sensors S04, S17, S29, and S53 vs. torque in low-speed shaft.
A good correlation was found for all 54 strain sensors between torque and the magnitude value of the fifth harmonic component, and therefore these values were used to scale or weight the strain signals. For a full revolution of the input shaft, all sensors witnessed the same torque, and the signals of each strain sensors were scaled to have the same magnitude of the fifth harmonic component. The weighting factors were computed using the following expression:
Once every sensor is multiplied by its corresponding scaling factor, the weighted Coleman transformation can be written as follows:
The magnitude and phase of the weighted complex coefficients pwn can then be computed with equivalent expressions to Eqs. (6) and (7) as follows:
The once-per-revolution pulse signal is obtained from the inductive sensor shown in Fig. 4. The azimuth of the shaft in known when a pulse is detected, but it can only be interpolated between pulses. The assigned angle ψs was linearly interpolated between full revolutions of the input shaft. Attempts made to correlate the phase ∠pwn (Eq. 14) with torque were not successful. A phase delay caused by the torsional deformation of the planet carrier was expected because the once-per-revolution pulse is measured at the rotor side flange of the planet carrier, and the strain sensors are placed in the middle section of the ring gear. However, the accuracy of the angular position was not good enough to characterize the effect of torque on ∠pwn.
The azimuth angle of the shaft is not strictly needed to compute the magnitudes of the harmonic components. Since the 54 strains sensors are equally spaced around the outer circumference of the ring gear, the relative angle between the angular location of the sensors and the azimuth of the shaft (ψs(t)) can be substituted in Eqs. (11) and (12) by the fixed angular location of each sensor, denoted as ψ0s. Figure 17 shows the magnitudes of the 5th, 10th, 15th, and 20th harmonic components (, , , and ) plotted against the torque levels measured by the test bench torque transducers for all the revolutions measured during the calibration tests. A satisfactory correlation was found between the magnitude values of these harmonic components and torque.
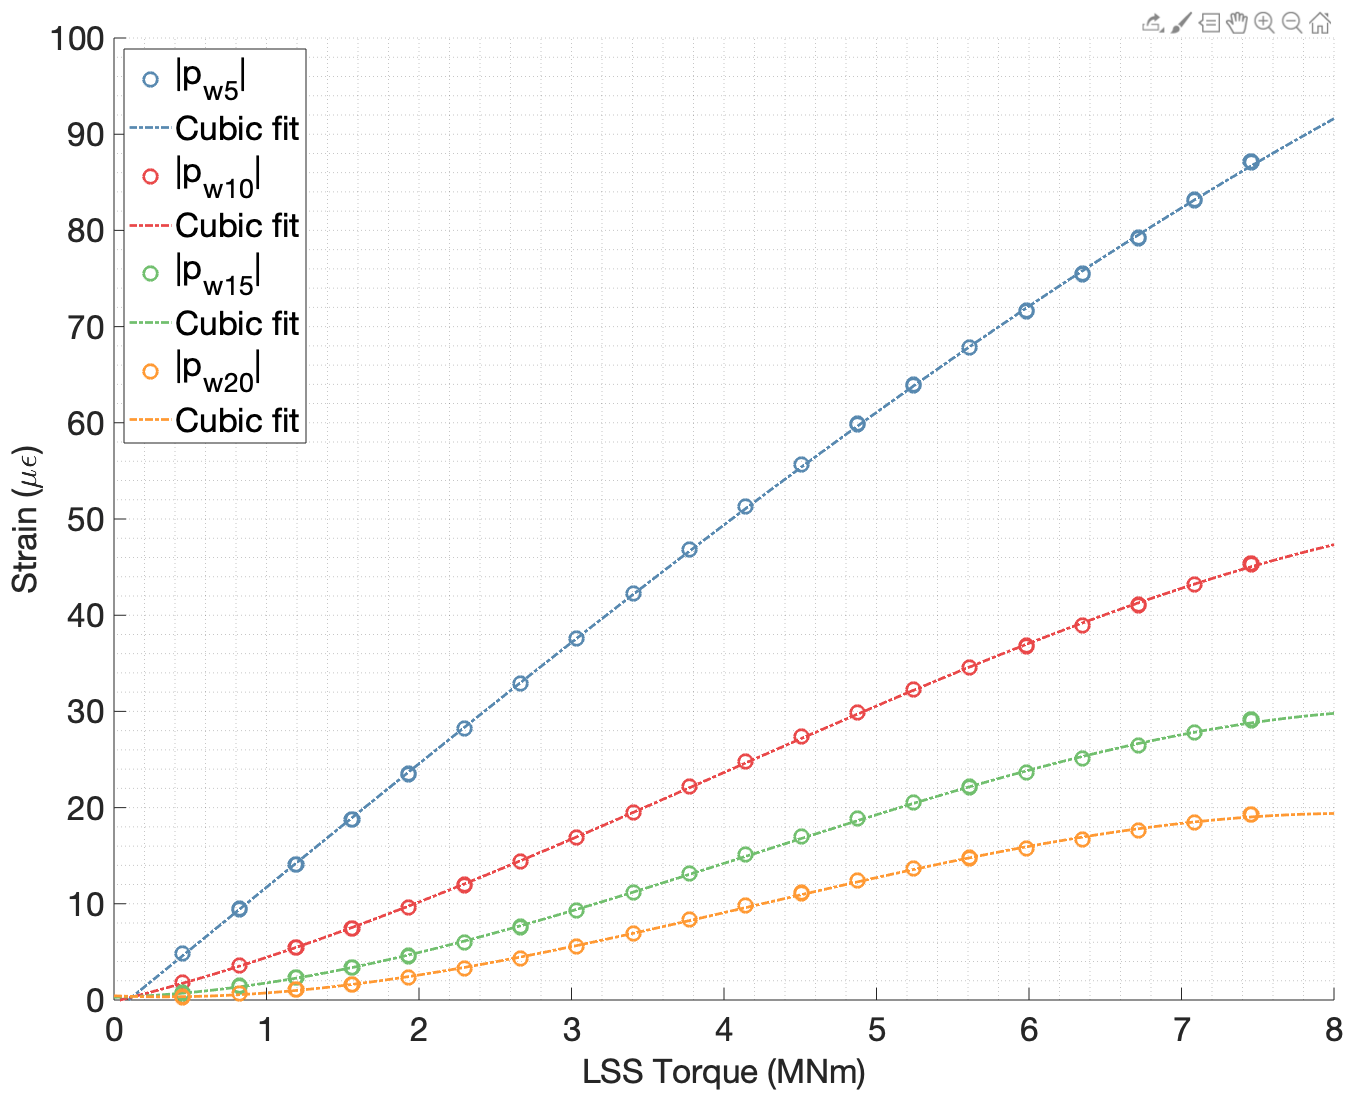
Figure 17Magnitudes of the 5th, 10th, 15th, and 20th harmonic components of all 54 weighted sensors vs. torque in low-speed shaft.
4.1 Torque estimation procedure with a coordinate transformation
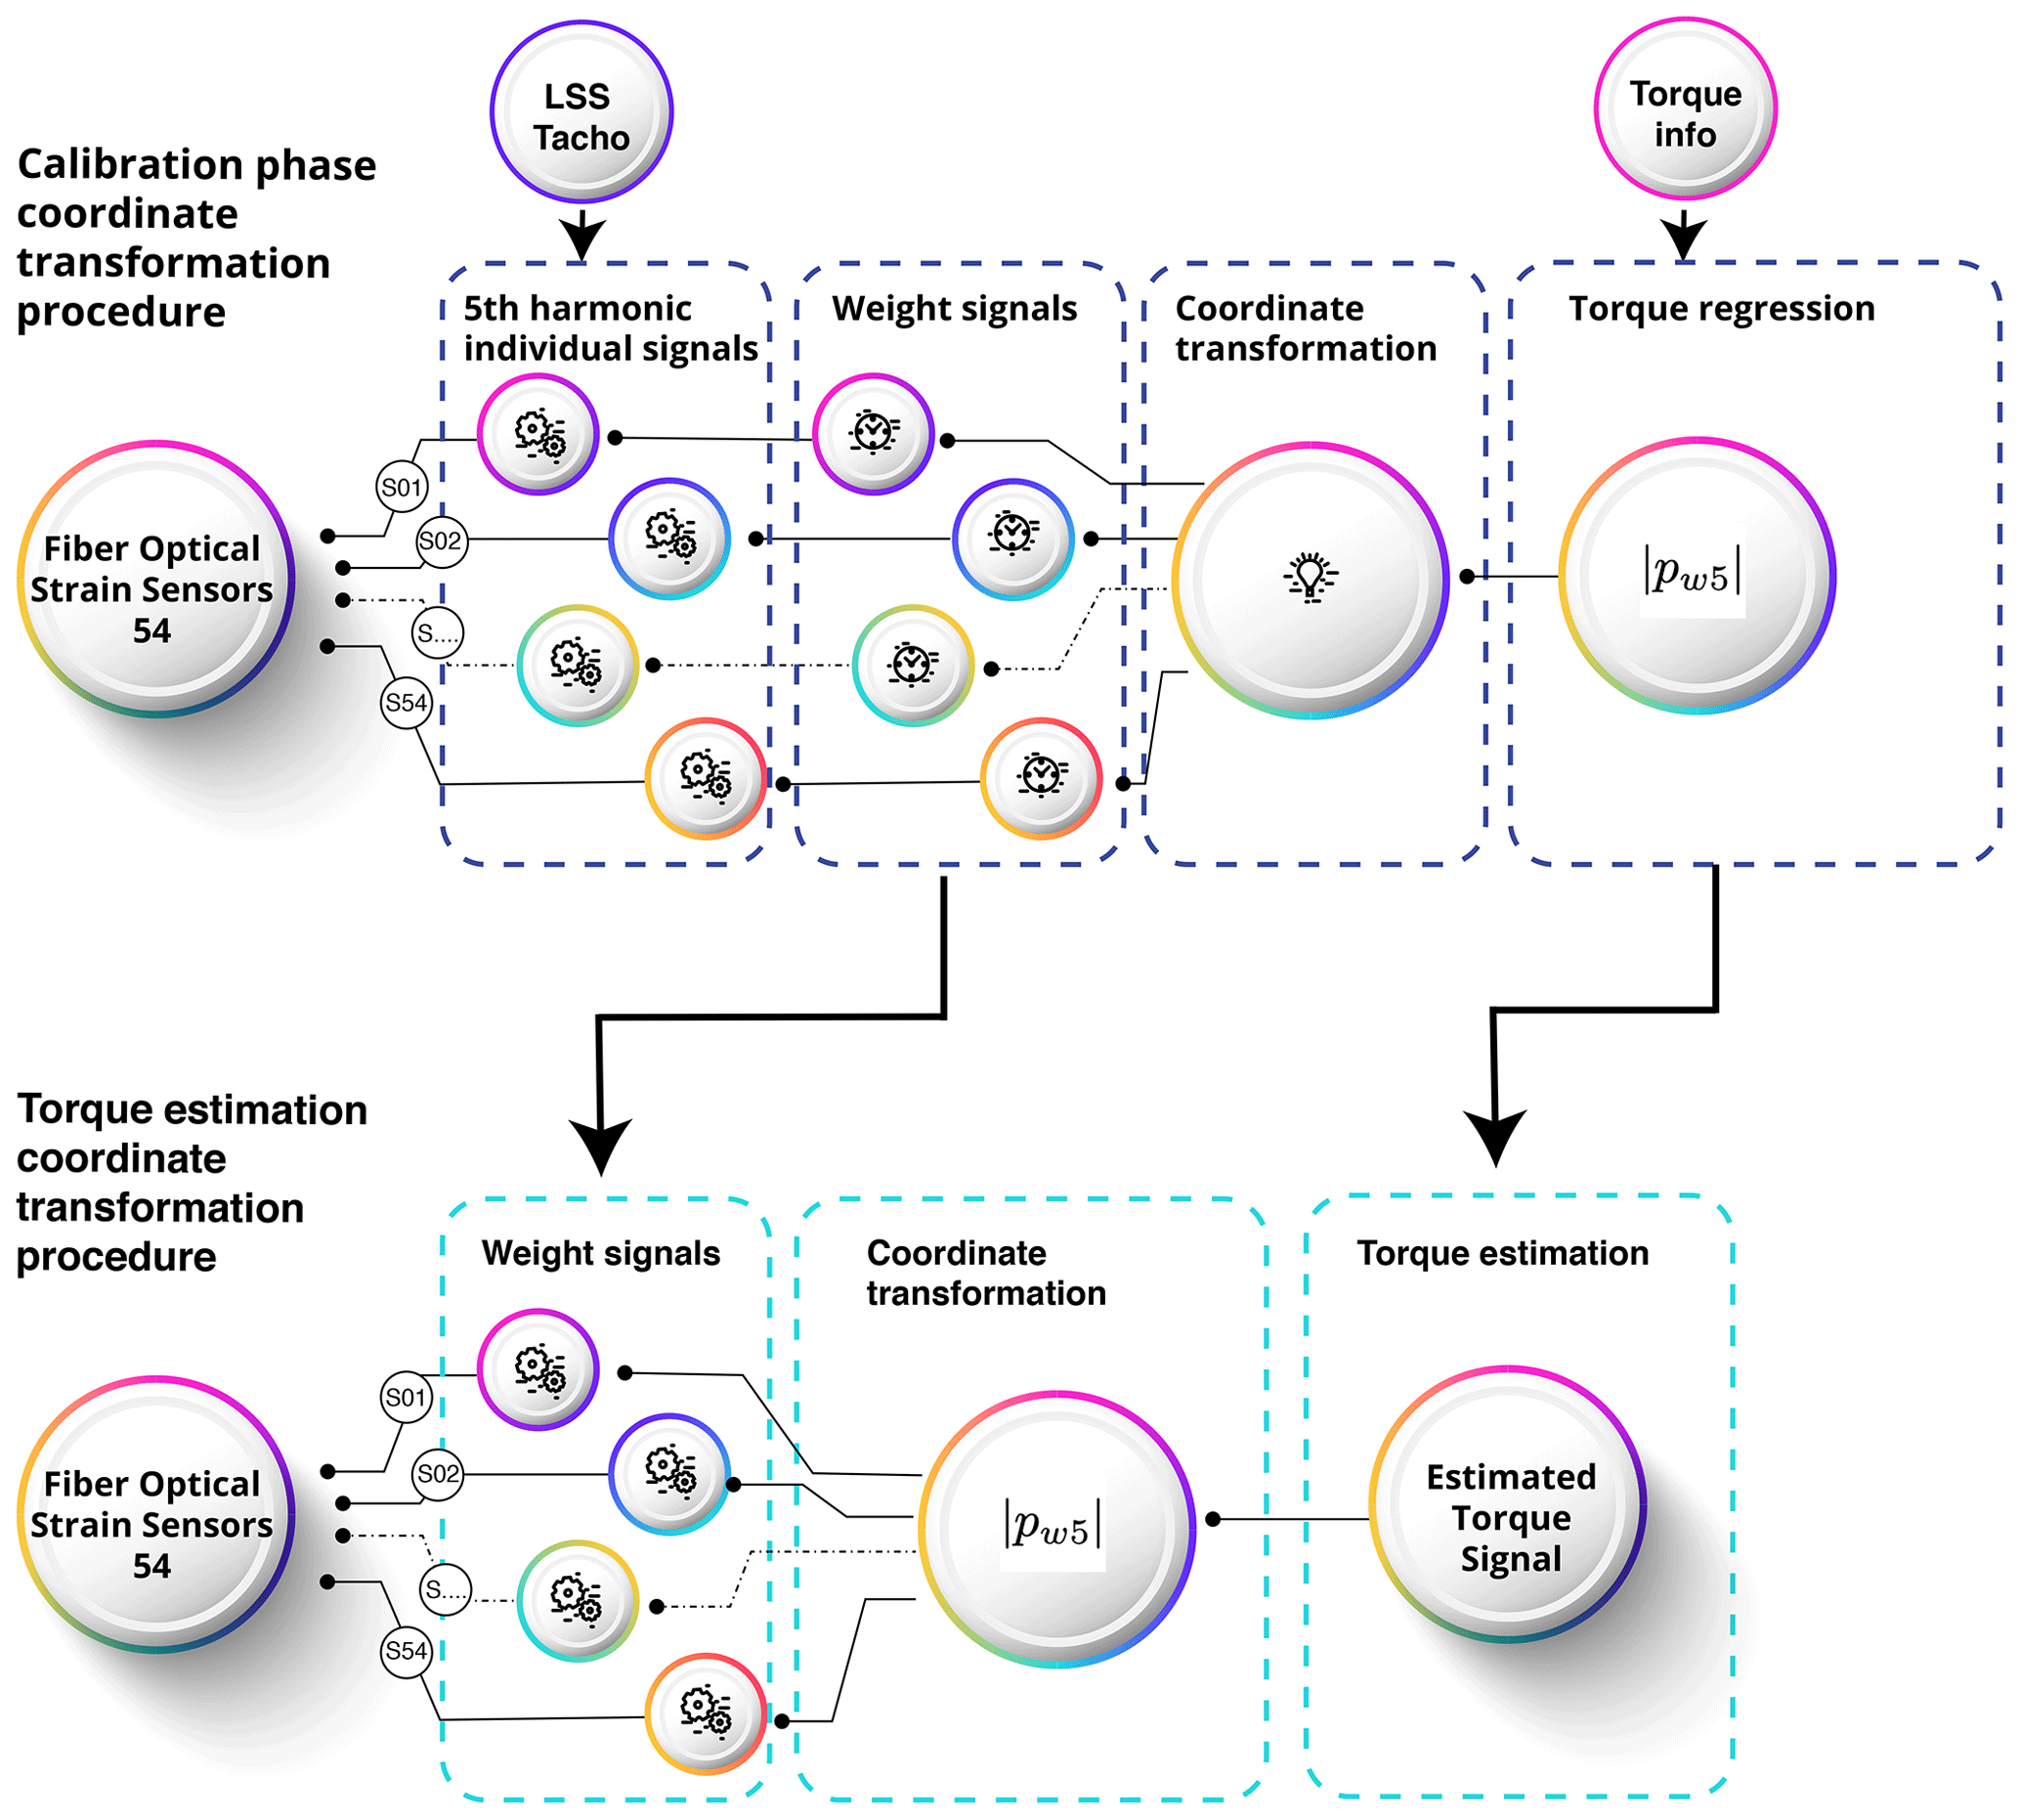
A graphical representation of the procedure to estimate torque using the Coleman coordinate transformation and the magnitude value of all 54 weighted sensors is shown in Fig. 18. The full procedure to estimate torque for every time sample can be summarized as follows.
- Step 0
-
Calibration phase. Perform tests with known torque to learn the strain vs. torque behavior. For each test, compute the magnitude of the 5th harmonic component of all the individual strain signals. Compute the scaling factors ws. Weight or scale the strain sensors so that all sensors have an equal magnitude of the fifth harmonic component for a given torque. Combine the weighted strain values of all 54 sensors and compute the magnitude of the fifth harmonic component for each available time sample . Find a regression polynomial between LSS torque and the magnitude of the fifth harmonic component of the combined strains.
- Step 1
-
Weight signals. For a new test where strain data have been logged, apply the weighting factor to all the strain sensors.
- Step 2
-
Coordinate transformation. For each time sample, apply the Coleman transformations to the weighted strain values to obtain pwnc(t) and pwns(t) using Eqs. (11) and (12) and compute the magnitude of the fifth harmonic component using Eq. (13).
- Step 3
-
Torque estimation. Evaluate the regression polynomial to estimate torque from the combined magnitude of the fifth harmonic component of all 54 weighted instantaneous strain values.
This section will discuss the main findings gathered during the development of the proposed method to measure input torque in wind turbine gearboxes. Torque estimation results obtained using data from two dynamic load tests will be analyzed to illustrate the key differences between the two alternative procedures presented in Sects. 3 and 4.
Both procedures rely on a calibration phase, where the instrumented gearbox was operated under torque conditions known from other measurements. In the present study, 20 short tests with different stationary reference torque levels were performed to fit the strain to torque relationship (see Sects. 3 and 4). Once the calibration phase had been accomplished, strain data were collected for tests with dynamic torque conditions. Figure 19 shows the estimated torque measurements during a test with a linearly increasing torque command. The torque estimate using peak-to-peak strain values is shown in blue, and the torque estimate using the coordinate transformation is shown in red. Figure 20 shows the torque estimates achieved for a test where the torque level was changed in steps. Starting from a middle value, the torque reference was changed to a lower and upper value. During both dynamic tests, the reference speed was kept constant. For clarity, a detailed window of 1 s is shown to compare the estimates of both tests.
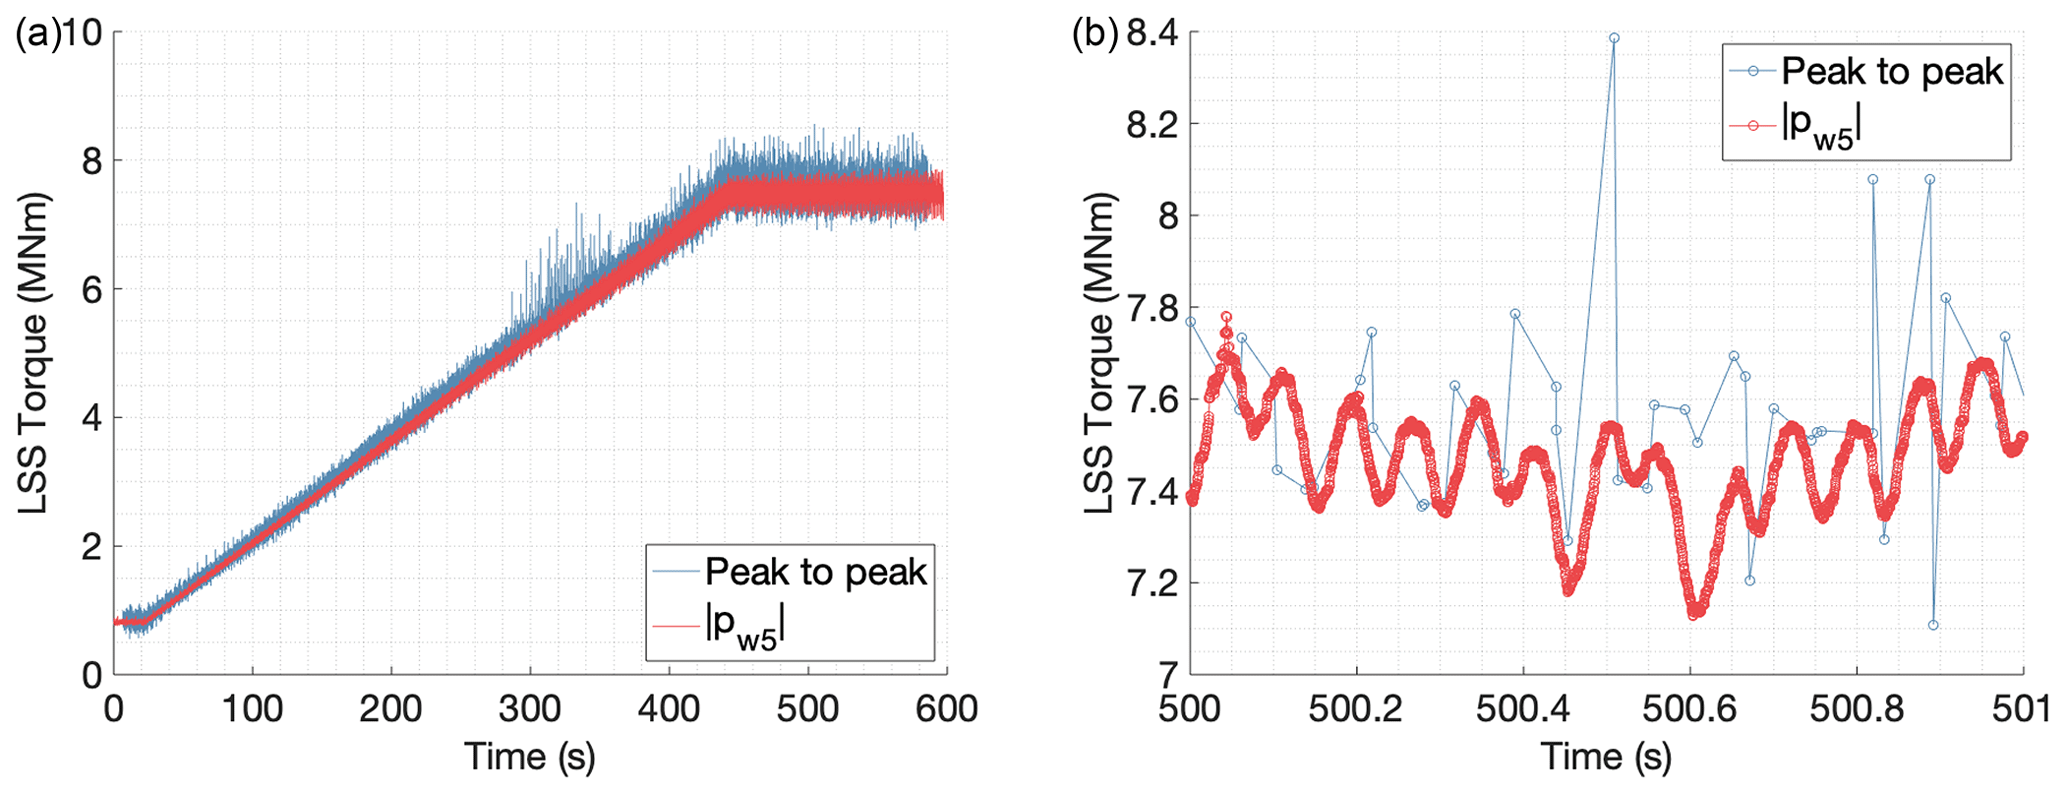
Figure 19Torque estimates for a test with variable torque (ramp); results for the entire test in panel (a) and 1 s detail in panel (b).

Figure 20Torque estimates for a test with variable torque (steps); results for the entire test in panel (a) and 1 s detail in panel (b).
-
Temporal resolution.
In the signal processing alternative based on peak values of strain, torque can only be evaluated when there is a gear mesh event between a planet and the ring. Therefore, the frequency resolution of the estimated torque depends on the gear mesh frequency of the first stage and the number of strain sensors used. The second signal processing strategy combines the simultaneous information of different strain sensors using a coordinate transformation. This allows tracking the magnitude of the harmonic components of the combined weighted strain values. With a total of 54 strain sensors equally spaced around the first-stage ring gear (see Fig. 2), the gearbox input torque can be estimated for each available time sample, which results in a frequency resolution equal to the sampling frequency used to acquire the strain data. The difference in frequency resolution of the estimated torque from both procedures can be seen in the 1 s windows of Figs. 19 and 20.
For future implementations of the method presented in this paper, it is possible to achieve a trade-off between spatial resolution and frequency resolution, selecting the sampling frequency and the number of sensors. If a lower number of strain sensors was to be used, for example, if we halve the number of sensors to 26, then by taking two consecutive strain samples of each sensor, we can still compute the magnitude of the fifth harmonic component, and the resulting frequency resolution of the torque estimate would be half the sampling frequency used to acquire strain data. If the number of sensors is low, the accuracy of the magnitude of the fifth harmonic component has to be considered. In the extreme, with a single strain sensor, it would only be possible to evaluate the input torque once every revolution, which would result in a significantly lower temporal resolution.
-
Load sharing between planets (average and instantaneous Kγ).
The procedure based on peak-to-peak strain values allows exploring how the load is shared between planets. An inductive sensor was added to the instrumentation to provide a once-per-revolution pulse, making the mesh sequence of planets known. Therefore, it is possible to assign peak-to-peak values to individual planets. The load share between planets can be computed using Eq. (2). However, in the setup presented in this paper, the number of strain sensors is not an integer multiple of the number of planets. When a strain peak caused by the gear mesh of a planet is detected in a given strain sensor, the rest of the strain sensors do not observe the peaks caused by the mesh of the other planets simultaneously. Therefore, only an average Kγ (planet load share factor) can be extracted for each measurement position, and the true instantaneous load sharing between planets could not be evaluated. In the procedure based on peak-to-peak strain values, knowledge of the instantaneous load sharing between planets is needed to estimate the dynamic torque value. The instantaneous torque value was approximated, assuming that the instantaneous value of Kγ is equal to the average. A larger variation of torque was observed in the torque estimates produced by the peak-to-peak procedure shown in Figs. 19 and 20. The authors believe that the approximation made for Kγ is the main reason to justify the larger torque variations. Since the average Kγ is used, if the instantaneous load sharing between planets is worse than the average (higher instantaneous Kγ values), the torque variations would be overestimated.
-
Sensing of shaft's azimuth angle and real-time capability.
The fact that a complete revolution of the input shaft has to be measured in the signal processing alternative based on peak-to-peak strain values to assign the suitable planet to the detected strain peaks is also responsible for the delay in the peak-to-peak torque estimates shown in Figs. 19 and 20. Torque can only be evaluated after the first pulse of the input shaft inductive sensor is detected when the peak-to-peak procedure is used. On the other hand, the procedure based on the coordinate transformation can be accomplished without the inductive sensor because the azimuth angle of the shaft is not needed to compute the magnitude of the harmonic components. This can simplify the instrumentation setup and enable estimating torque in real time.
-
Weighting of individual strain sensors.
An important finding during the calibration phase of both processing strategies was that each measurement location showed a slightly different sensitivity to torque (see Figs. 8, 10, 14, and 17). Several factors can play a role in explaining this. On one hand, installing the strain sensors is a manual process, and differences in how the fibers are glued to the surface of the ring gear and small positioning errors are expected. On the other hand, the ring gear is connected to structural gearbox components with highly asymmetric stiffness. This lack of symmetry is most pronounced for the FBG sensors close to the torque reaction arms in the housing on the rotor side of the ring gear, shown in Figs. 3 and 4. Because of the reasons mentioned above, differences in stiffness are expected. However, the difference in the linearity of the torque–strain relationship is not fully understood by the authors yet. In any case, it is possible to achieve a satisfactory fit for all measurement points by increasing the order of the regression polynomial, and therefore an accurate torque estimate can be achieved. To compensate for the different sensitivity of each measurement location, we have used the average magnitude of the fifth harmonic component of the individual strain signals as a basis for weighting the strain values. All 54 sensors are weighted to exhibit the same relationship to torque. This makes it possible to combine the sensors.
-
Accuracy.
In the experimental setup used for this study, a direct torque measurement in the input shaft was not available, the torque transducers were installed in the high-speed shafts, and therefore a quantitative evaluation of the torque estimates could not be performed. For future work, a direct comparison between the method presented in this study and a calibrated direct measurement is suggested.
In the signal processing alternative based on the Coleman transformation, the weighted strain values of all the sensors are combined to compute the magnitude of the fifth harmonic component for each available time sample . The torque is estimated using the regression polynomial between LSS torque and . Figure 17 shows that higher-order harmonics (10, 15, and 20) can also be correlated with torque. The procedure presented in this paper could be extended to consider these magnitudes and combine them to achieve higher-accuracy torque estimates. Again, a quantitative analysis of the accuracy of the estimates could not be performed with the instrumentation setup available and is recommended for future work.
Finally, it is worth noting that the potential effect that non-torque loads could have on the method presented in this study could not be evaluated. The test bench used to run the experiments (see Sect. 2.2) is a back-to-back gearbox test bench where only torque and speed can be controlled. The effect of these non-torque loads in four-point-mount gearboxes is expected to be small. However, to fully demonstrate the applicability of the presented methodology in a wind turbine installation, it is suggested to investigate the behavior of the presented method in a test bench with non-torque loading capabilities, i.e., axial forces and bending moments. Other research topics like the real-time processing capability and the long-term behavior of the calibration also need to be addressed to develop this method for use in serial production wind turbines.
This paper develops a new method to measure the input rotor torque of wind turbine gearboxes. The proposed method is based on strain measurements of the static first-stage ring gear. Measuring in the static frame overcomes the main drawback of traditional methods, which measure the strain of rotating components. Fiber-optic strain sensors were used because they offer a higher signal-to-noise ratio, are immune to electromagnetic interference, and allow a more straightforward installation because multiple strain sensors can be accommodated in a single fiber.
A satisfactory correlation was found between the strain signals measured on the static first-stage ring gear and torque. Two signal processing strategies have been presented in this paper for determining input rotor torque. The first is based on the peak-to-peak strain values assigned to the gear mesh events. The second is based on a coordinate transformation of all the strain signals, followed by tracking the magnitude of the fifth harmonic component. Torque estimation results obtained using both signal processing alternatives were presented and analyzed in Sect. 5 for two tests with dynamic torque conditions. The procedure based on the peak-to-peak strain values of the gear mesh events can only estimate torque when a gear mesh event is detected. The strain peak-to-peak values can be assigned to individual planets using an additional inductive displacement sensor that provides a once-per-revolution pulse, and therefore the load sharing between planets can be explored. With the second procedure, based on a Coleman coordinate transformation, it is possible to estimate torque whenever strain data of all sensors are available, leading to an improved frequency resolution up to the sampling frequency used to acquire strain data.
For future work, a direct comparison between the method presented in this study and a calibrated direct torque measurement, on the input shaft, is suggested to assess the accuracy of the new method quantitatively. The present study is based on measurements taken on a gearbox back-to-back test bench where only torque and speed can be controlled. The effects of non-torque loads, i.e., axial forces and bending moments, need to be researched to fully demonstrate the applicability of the presented methodology in a wind turbine installation.
The method presented in this paper could make measuring gearbox torque more cost-effective, facilitating its adoption in serial wind turbines. This is important since accurate knowledge of the input torque is key to improving gearbox reliability. Furthermore, implementing a torque measurement on each serial wind turbine would permit novel data-driven control strategies, which can improve drivetrain loading. Having an accurate measurement of the input torque throughout the service history of the gearbox would also enable an improved assessment of the consumed fatigue life of the gearbox components. This knowledge could lead to future design improvements, which would, in turn, lead to higher reliability and lower cost of energy.
Due to confidentiality agreements with research collaborators, research data supporting this publication can only be made available to bona fide researchers subject to a non-disclosure agreement. Details of the data and how to request access are available from the 4TU.ResearchData repository at https://doi.org/10.4121/c.5491152 (Gutierrez Santiago, 2021a). The datasets from the 20 tests performed for the calibration phase presented in Sects. 3 and 4 of this paper can be found in https://doi.org/10.4121/14891910.v1 (Gutierrez Santiago, 2021b). Data from the dynamic torque tests presented in Sect. 5 can be found in https://doi.org/10.4121/14892234.v1 (Gutierrez Santiago, 2021c). Additionally a dataset from a test performed at nominal speed and torque conditions is available at https://doi.org/10.4121/14892258.v1 (Gutierrez Santiago, 2021d). Please request access to the datasets via email to u.gutierrezsantiago@tudelft.nl.
UGS conducted the tests and performed the data analysis presented in the paper. All authors provided important input to this research work through discussions, through feedback, and by improving the paper.
The contact author has declared that neither they nor their co-authors have any competing interests.
Publisher’s note: Copernicus Publications remains neutral with regard to jurisdictional claims in published maps and institutional affiliations.
We would like to sincerely acknowledge the support of Siemens Gamesa Renewable Energy and TU Delft, which made this research possible, and the collaboration with Sensing 360 B.V. and DMT GmbH & Co. KG.
This research has been supported by Siemens Gamesa Renewable Energy.
This paper was edited by Amir R. Nejad and reviewed by Jonathan Keller and Hongkun Zhang.
Bir, G.: Multiblade Coordinate Transformation and Its Application to Wind Turbine Analysis: Preprint, NREL, 2008 ASME Wind Energy Symposium, Reno, Nevada, 7–10 January 2008, available at: https://www.osti.gov/biblio/922553 (last access: 30 April 2021), 2008. a
dmt group.com: DMT GmbH & Co. KG, available at: https://www.dmt-group.com, last access: 30 April 2021. a
Egeling, T., Hidding, E., Hövelbrinks, N., Endemann, D., Uhlending, M., Bonnet, P., Dekkers, R., Hendicx, W., and Vandermeulen, W.: Digital gearbox use case, available at: https://www.winergy-group.com/en/DigitalGearboxUseCase, last access: 24 November 2021. a
Girsang, I. P., Dhupia, J. S., Muljadi, E., Singh, M., and Pao, L. Y.: Gearbox and Drivetrain Models to Study Dynamic Effects of Modern Wind Turbines, IEEE T. Ind. Appl., 50, 3777–3786, https://doi.org/10.1109/TIA.2014.2321029, 2014. a
Glavind, L., Olesen, I., Skipper, B., and Kristensen, M.: Fiber-optical grating sensors for wind turbine blades: a review, Opt. Eng., 52, 1–10, https://doi.org/10.1117/1.OE.52.3.030901, 2013. a
Guo, Y., Keller, J., Zhang, Z., and Lucas, D.: Planetary Load Sharing in Three-Point- Mounted Wind Turbine Gearboxes: A Design and Test Comparison, 3rd Conference for Wind Power Drives Aachen, Germany, 7 to 8 March 2017, https://www.nrel.gov/docs/fy17osti/67394.pdf (last access: 30 April 2021), 2017. a
Gutierrez Santiago, U.: Input Torque Measurements for Wind Turbine Gearboxes Using Fiber Optical Strain Sensors, 4TU.ResearchData, collection, https://doi.org/10.4121/c.5491152, 2021a. a
Gutierrez Santiago, U.: Processed calibration data sets (20 steps) for torque estimation in Wind Turbine Gearboxes Using Fiber Optical Strain Sensors, 4TU.ResearchData [data set], https://doi.org/10.4121/14891910.v1, 2021b. a
Gutierrez Santiago, U.: Dynamic torque data files used in the discussion of torque estimation in Wind Turbine Gearboxes Using Fiber Optical Strain Sensors, 4TU.ResearchData [data set], https://doi.org/10.4121/14892234.v1, 2021c. a
Gutierrez Santiago, U.: Data set at nominal torque used for torque estimation of Wind Turbine Gearboxes Using Fiber Optical Strain Sensors, 4TU.ResearchData [data set], https://doi.org/10.4121/14892258.v1, 2021d. a
Helsen, J., Vanhollebeke, F., De Coninck, F., Vandepitte, D., and Desmet, W.: Insights in wind turbine drive train dynamics gathered by validating advanced models on a newly developed 13.2 MW dynamically controlled test-rig, Mechatronics, 21, 737–752, https://doi.org/10.1016/j.mechatronics.2010.11.005, 2011. a
IEEE: IEEE Standard for Information Technology – Portable Operating System Interface (POSIX(R)), IEEE Std 1003.1-2008 (Revision of IEEE Std 1003.1-2004), 1–3874, https://doi.org/10.1109/IEEESTD.2008.4694976, 2008. a
ISO: 6336-1:2019 Calculation of load capacity of spur and helical gears – Part 1: Basic principles, introduction and general influence factors, available at: https://www.iso.org/standard/63819.html (last access: 30 April 2021), 2019. a, b
Johnson, W.: Helicopter Theory, Dover Publications, New York, ISBN 13 9780486682303, 1994. a
Kreuzer, M.: Strain Measurement with Fiber Bragg Grating Sensors, HBM, http://www.ae.metu.edu.tr/seminar/strain-gage/FBG.pdf, (last access: 30 April 2021), 2006. a
Musial, W., Butterfield, S., and McNiff, B.: Improving Wind Turbine Gearbox Reliability, European Wind Energy Conference Milan, Italy, 7–10 May 2007, https://www.nrel.gov/docs/fy07osti/41548.pdf (last access: 30 Aprril 2021), 2007. a
Peeters, J., Vandepitte, D., and Sas, P.: Structural analysis of a wind turbine and its drive train using the flexible multibody simulation technique, Proceedings of the International Conference on Noise and Vibration Engineering (ISMA2006), 18–20 September 2006, ISBN 9781629939278, 2006. a
Rosinski, J. and Smurthwaite, D.: 61400-4:2012 Wind turbines – Part 4: Design requirements for wind turbine gearboxes, Gear Solutions, available at: https://gearsolutions.com/media/uploads/uploads/assets//PDF/Articles/Feb_10/0210_JRdynamics.pdf (last access: 30 April 2021), 2010. a
sensing360.com: Sensing 360 B.V., available at: https://sensing360.com (last access: 30 Aprril 2021), last access: 30 April 2021. a
Sheng, S.: Report on Wind Turbine Subsystem Reliability – A Survey of Various Databases (Presentation), NREL, available at: https://www.osti.gov/biblio/1090149 (last access: 30 Aprril 2021), 2013. a
Spinato, F., Tavner, P., van Bussel, G., and Koutoulakos, E.: Reliability of wind turbine subassemblies, IET Renewable Power Gen., 3, 387–401, https://doi.org/10.1049/iet-rpg.2008.0060, 2009. a
Stehly, T., Beiter, P., Heimiller, D., and Scott, G.: 2017 Cost of Wind Energy Review, available at: https://www.nrel.gov/docs/fy18osti/72167 (last access: 30 Aprril 2021), 2018. a
Struggl, S., Berbyuk, V., and Johansson, H.: Review on wind turbines with focus on drive train system dynamics, Wind Energy, 18, 567–590, https://doi.org/10.1002/we.1721, 2015. a
van Kuik, G. A. M., Peinke, J., Nijssen, R., Lekou, D., Mann, J., Sørensen, J. N., Ferreira, C., van Wingerden, J. W., Schlipf, D., Gebraad, P., Polinder, H., Abrahamsen, A., van Bussel, G. J. W., Sørensen, J. D., Tavner, P., Bottasso, C. L., Muskulus, M., Matha, D., Lindeboom, H. J., Degraer, S., Kramer, O., Lehnhoff, S., Sonnenschein, M., Sørensen, P. E., Künneke, R. W., Morthorst, P. E., and Skytte, K.: Long-term research challenges in wind energy – a research agenda by the European Academy of Wind Energy, Wind Energ. Sci., 1, 1–39, https://doi.org/10.5194/wes-1-1-2016, 2016. a, b
van Solingen, E. and van Wingerden, J.: Linear individual pitch control design for two-bladed wind turbines, Wind Energy, 18, 677–697, https://doi.org/10.1002/we.1720, 2015. a
WindEurope.org: Wind energy in Europe in 2018: Trends and statistics, available at: https://windeurope.org/intelligence-platform/product/wind-energy-in-europe-in-2018-trends-and-statistics/ (last access: 30 April 2021), 2019. a
WindEurope.org: Wind energy in Europe 2020 Statistics and the outlook for 2021–2025, available at: https://windeurope.org/intelligence-platform/product/wind-energy-in-europe-in-2020-trends-and-statistics/, last access: 30 April 2021. a
Zhang, H., Ortiz de Luna, R., Pilas, M., and Wenske, J.: A study of mechanical torque measurement on the wind turbine drive train – ways and feasibilities, Wind Energy, 21, 1406–1422, https://doi.org/10.1002/we.2263, 2018. a