the Creative Commons Attribution 4.0 License.
the Creative Commons Attribution 4.0 License.
 | 20 Jul 2023
A data-driven reduced-order model for rotor optimization
Nicholas Peters
Christopher Silva
John Ekaterinaris
For rotor design applications, such as wind turbine rotors or urban air mobility (UAM) rotorcraft and flying-car design, there is a significant challenge in quickly and accurately modeling rotors operating in complex, turbulent flow fields. One potential path for deriving reasonably accurate but low-cost rotor performance predictions is available through the application of data-driven surrogate modeling. In this study, an initial investigation is undertaken to apply a proper orthogonal decomposition (POD)-based reduced-order model (ROM) for predicting rotor distributed loads. The POD ROM was derived based on computational fluid dynamics (CFD) results and utilized to produce distributed-pressure predictions on rotor blades subjected to topology change due to variations in the twist and taper ratio. Rotor twist, θ, was varied between 0, 10, 20, and 30∘, while the taper ratio, λ, was varied as 1.0, 0.9, 0.8, and 0.7. For a demonstration of the approach, all rotors consisted of a single blade. The POD ROM was validated for three operation cases: a high-pitch or a high-thrust rotor in hover, a low-pitch or a low-thrust rotor in hover, and a rotor in forward flight at a low speed resembling wind turbine operation with wind shear. Results showed that reasonably accurate distributed-load predictions could be achieved and the resulting surrogate model can predict loads at a minimal computational cost. The computational cost for the hovering blade surface pressure prediction was reduced from 12 h on 440 cores required for CFD to a fraction of a second on a single core required for POD. For rotors in forward flight, cost was reduced from 20 h on 440 cores to less than a second on a single core. The POD ROM was used to carry out a design optimization of the rotor such that the figure of merit was maximized for hovering-rotor cases and the lift-to-drag effective ratio was maximized in forward flight.
- Article
(7757 KB) - Full-text XML
- BibTeX
- EndNote


In fields such as wind energy and urban air mobility (UAM), it is common practice for rotor analysis to include fluid–structure interactions, structural dynamics, vehicle component sizing, topology optimization, flight simulation, etc. For each of these tasks, it is essential that there exists a model capable of providing load predictions to a reasonable degree of fidelity for a variety of rotor configurations. One approach to obtaining these load predictions is through mid-fidelity design tools. Over the years, numerous such modeling software programs have been developed. For UAM, examples include the Comprehensive Analytical Model of Rotorcraft Aerodynamics and Dynamics (CAMRAD) (Johnson, 1992), Rotorcraft Comprehensive Analysis System (RCAS) (Saberi et al., 2004), and Comprehensive Hierarchical Aeromechanics Rotorcraft Model (CHARM) (Quackenbush et al., 1999). Additionally, modeling software such as Fatigue, Aerodynamics, Structures, and Turbulence (FAST) (Jonkman and Buhl, 2005); BLADED (DNV, 2018); and HAWC2 (Larsen and Hansen, 2007) have been developed for wind turbine design applications. Through leveraging these analysis tools, numerous subtopics of interest have been investigated, ranging from multi-rotor performance prediction (Liew et al., 2020; Conley and Shirazi, 2021) to aeroelasticity (Kecskemety and McNamara, 2016; Yeo et al., 2018). When applied to the early stages of rotor optimization, typically mid-fidelity tools provide an excellent path to identifying a limited design space from which an optimal solution can be obtained. Yet, there still remain significant limitations to mid-fidelity analysis tool sets when applied to rotor operation in complex flow fields. These limitations become particularly pronounced when considering that many UAM rotorcraft will likely have rotors operating in vortex-dominated, highly turbulent flow fields, particularly those rotorcraft proposed for operation in multi-rotor configurations or in close proximity to buildings. For wind energy applications, a greater subtopic of concern relates to the optimization of grid layout for wind farms as well as the aeroelastic effects of turbines in yaw. As more rotorcraft and wind turbine designs begin to account for these operating conditions, uncertainty in mid-fidelity tools has led to a broadening of optimal design spaces found in the early stages of the conceptual design process.
One potential solution for narrowing this design space is to apply computational fluid dynamics (CFD). Numerous solvers (mStrand – Lakshminarayan et al., 2017; SU2 – Morelli et al., 2021; OpenFOAM – Nuernberg and Tao, 2018; etc.) have been developed to help streamline the process of CFD simulation of rotors. Specifically for wind turbine applications, significant progress has been made by the National Renewable Energy Laboratory (NREL) in streamlining the progress of completing large-eddy simulation (LES) atmospheric boundary layer simulations coupled with wind turbines through their OpenFAST tool sets (Jonkman, 2013). Through leveraging such tool sets, studies of isolated rotors have been shown to be capable of resolving flow fields relevant for performance and loads of isolated rotors in hover/forward flight (Fitzgibbon et al., 2020), during rotorcraft pitch-up maneuvers (Abhishek et al., 2011), and in rotor–ship wake interactions (Crozon et al., 2018). Many recent publications have demonstrated the feasibility of deploying such modeling techniques for wind turbine applications. Often in these works, the computational cost is reduced through modeling turbine blades with actuator line and disk-based approaches as opposed to body-fitted grids (Camp and Cal, 2019; Houck et al., 2022). In work completed by Sood et al. (2022), high-fidelity LESs were completed for five different inflow conditions of the Lillgrund wind farm. Close comparisons were then drawn between CFD computations and field measurements for turbine power production, loading, and wake recovery. Further work completed by Stanly et al. (2022) demonstrated recent improvements in actuator line modeling have led to significant advancements in rotor load predictions when coupled with LES models, allowing for comparisons within 1 % for rotor power requirements.
However, for engineering tasks that require hundreds if not thousands of iterations such as design optimization, full CFD modeling is not a viable option. Despite significant advancements in both the hardware (Chau, 2019) and the software (Wang and Zhai, 2016) rotorcraft CFD simulations still remain too computationally expensive for many engineering tasks. For a detailed comprehensive CFD analysis of a full-scale rotorcraft or wind turbine, computational expense commonly requires simulation on large computer clusters with run times ranging from days to weeks (Neerarambam et al., 2021). It is this resource and time limitation that has led to a desire for devising CFD-based surrogate models. While currently available computational resources limit the number of CFD simulations during conceptual design to a few tens of runs, recent studies have shown that by retaining a truncated subset of dominant flow features, a useful and meaningful reduced-order model (ROM) can be constructed (Colella et al., 2021; Liu et al., 2021). In a recent example from Sengers et al. (2022), LESs were first completed for a single isolated turbine where rotor configuration was modeled numerically with an actuator disk. Simulations were completed while varying inflow conditions into the actuator disk. Solutions from these LESs were leveraged to construct a ROM which mapped inflow conditions to the overall normalized wake center deficit, vertical position with respect to hub height, and vertical extension of the wake. A comparison of the ROM to new LESs showed the ROM was capable of producing accurate predictions for parametric definitions of the turbine's wake. Further studies have additionally demonstrated the feasibility of generating meaningful surrogate models for turbine wake flows (Ashwin Renganathan et al., 2022; De Cillis et al., 2021). Yet, while such a ROM may be useful for optimizing the grid layout of wind farms, for the design optimization of the rotor itself, greater emphasis must be placed on achieving an accurate representation of the rotor's surface load distribution. Such a ROM would allow for the consideration of peak rotor loading, rotor radial loading, rotor stall, etc., all in the earliest stages of the rotor design process.
As such, in this study, an example of a ROM-based surrogate model for distributed surface loading on rotors will be presented. The objective of this study is to present a framework with which design engineers can improve insight into a domain given limited sampling and to efficiently inform regions of interest for future sampling. This ROM was constructed in a two-step process. First, a low-rank subspace was identified. This subspace can be found using a variety of modal decomposition methods such as proper orthogonal decomposition (POD), dynamic mode decomposition (DMD) (Schmid, 2010), and spectral proper orthogonal decomposition (SPOD) (Sieber et al., 2016). These methods are all based on the assumption that the flow field of interest can be decomposed into a limited set of dominant characteristics (Ma et al., 2000). In the present work, the POD algorithm was utilized to identify a low-rank subspace. Once a subspace was identified, an interpolation scheme was then applied to make predictions, rather than to characterize the field (Ali et al., 2017). Recent work has shown that these ROM-based surrogate models are able to retain a high degree of fidelity while operating at a minimal computational cost. Examples of areas of ROM application include wake modeling (Ali and Cal, 2020; Zehtabiyan-Rezaie et al., 2022; Hamilton et al., 2018), combustion (Chang et al., 2019), turbine blade modeling (Jin et al., 2017), boundary layer ingestion (Cinquegrana and Vitagliano, 2021), and store separation (Peters et al., 2021, 2022a, b, 2023). Work completed by De Cillis et al. (2022b) demonstrated the derivation of a DMD-based ROM for rotor wake predictions. In this study, LESs were completed for flow impinging on a wind turbine. The DMD algorithm was then deployed to extract leading spatial and temporal modes which were further leveraged to construct a ROM for the turbine's wake. Additional work completed by De Cillis et al. (2022a) and Ali et al. (2016) has demonstrated how similar ROMs can be derived while leveraging POD modes. Meanwhile, others have focused instead on deploying deep-learning-based models for turbulent fluctuation predictions in the wake (Ali et al., 2021).
While previous studies have applied POD-, DMD-, or neural network (NN)-based ROMs to isolated bodies and airfoils with varying inflow conditions, there have been few demonstrations of modeling surface pressure distributions for three-dimensional moving bodies, particularly once variation in surface topology is considered. A significant contributing factor to this absence of literature is that data-driven modeling relies heavily on the assumption that dominant physics for the system of interest are comprehensively captured in the training dataset. For this reason many applications of data-driven ROMs, while valuable demonstrations, rely on two-dimensional flows (airfoil load prediction; Yonekura and Suzuki, 2021), steady-state assumptions (supersonic flows; Dreyer et al., 2021), or systems where symmetry/periodicity boundary conditions can be leveraged (rotor–stator modeling; Cizmas and Palacios, 2003) such that CFD computational expense is minimized and the number of sample points can be maximized. For rotorcraft applications of CFD-based data-driven ROMs, whether they be POD, DMD, or even NN based, the computational expense is comparatively large, resulting in a minimal sampling of the domain. As such, the POD ROMs demonstrated in this study will need to extract meaningful information from a relatively small number of samples.
Typically, there are two ways in which a parametric-interpolation-based POD ROM could fail to produce meaningful predictions. The first potential situation could be through the POD algorithm being incapable of representing the space with a limited expansion of modes. Ultimately POD mode retention could be expanded to several hundreds of modes. However, this high mode count often results in more challenging interpolations. Typically, while initial POD modes can smoothly be correlated to design parameters, higher mode numbers are often more stochastic, resulting in more challenging interpolations. The other way a POD ROM may fail to provide accurate predictions is through undersampling a sufficiently non-linear design space. If a design space is found to be highly non-linear, then the total number of CFD simulations required to derive a model may no longer warrant or even justify the construction of a ROM. Analogous limitations exist for DMD and NNs, which often require very large datasets for training and significant computing resources. However, ROMs based on DMD, POD, or NNs possess similar accuracy in reproducing CFD data (Peters et al., 2022c; Raissi et al., 2019).
To investigate POD ROM capability in the field of rotor pressure load predictions, a POD ROM was derived and tested under three operating conditions for a single, isolated blade. The isolated blade was chosen in order to replicate wind turbine or helicopter rotor operation at a reasonable computational cost. Isolated rotor blades however have been employed in both experimental (Ramasamy et al., 2009) and theoretical studies for detailed investigation of characteristic features such as the tip vortex. With each demonstration case, design space complexity was increased to test POD ROM reconstruction and interpolation capability. In each scenario, the rotor blade's taper ratio and twist were varied to construct 16 CFD simulations using the OVERFLOW solver (Buning et al., 1988). A POD ROM was constructed from these cases, validated against three additional combinations of taper and twist, and then employed to achieve a design optimization of the rotor blade.
While the results of this study will demonstrate the derived surrogate models are capable of producing accurate distributed-load predictions, identified solutions should not be viewed as true optimal solutions. Despite the validation of each surrogate model, it is important to note that identified optimal solutions often exist within highly non-linear subsections of the domain. As such, in the absence of further validation, identified optimal locations should be viewed as regions of high interest for future sampling rather than true optimal points. To help illustrate this point, the surrogate-model-identified optimal solution for forward flight was compared against five additional CFD simulations. These additional CFD simulations both validate the surrogate-model-derived optimal solution and attempt to identify solution variation near the computed optimal point. Given the comparable high level of non-linearity of the domain for forward flight compared to hovering cases and good performance of the hovering ROMs, only the forward-flight optimal solution will be compared to further CFD simulation.
In this work, for hovering-rotor demonstration cases, figures of merit and slices for the coefficient of pressure at the radial station of the blade are used as metrics for ROM prediction accuracy. For the forward-flight demonstration case, both the lift-to-drag effective ratio and integrated sectional coefficients of thrust are used as metrics for ROM prediction accuracy. With these three ROMs, the study aims to provide insight into the capabilities of POD ROMs for distributed-load predictions and rotor performance prediction given a variation in blade topology over a variety of standard rotor operating conditions.
The rest of this paper is organized as follows. The CFD simulation case setup, grid generation methods, and optimization algorithm are all outlined in the “Numerical approach” section first. The “ROM approach” section then outlines the modal decomposition and interpolation schemes used in this work. The “Results and discussion” section provides an overview of the study's findings. Results are split between hovering-rotor and forward-flight demonstration cases. In the final section, Conclusions, closing remarks are summarized along with future applications of work.
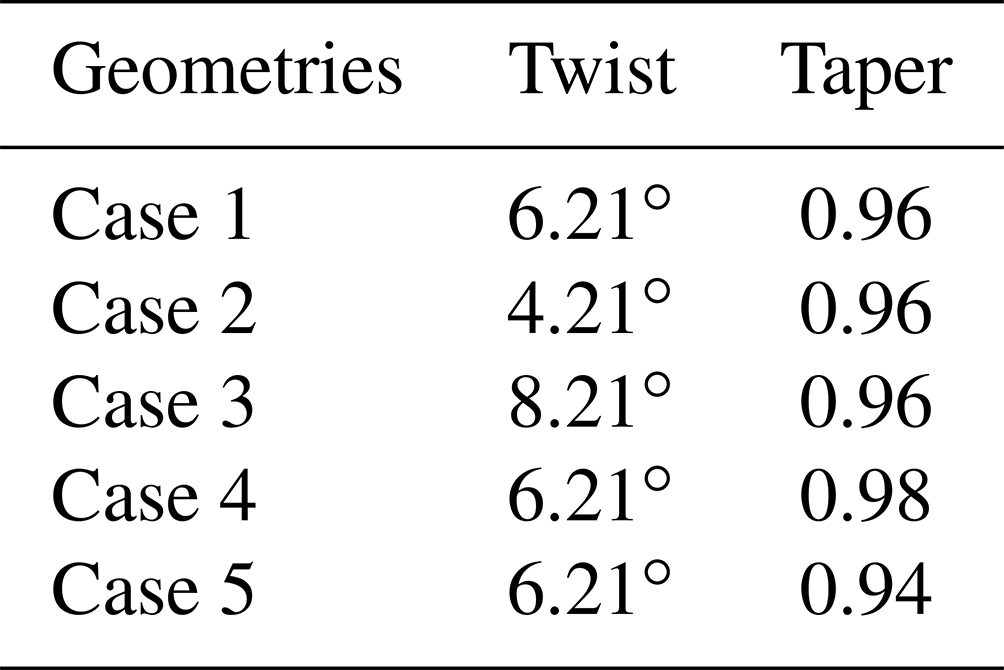
Before this study could begin, a procedure was required for efficiently generating rotor blade grids given a linear variation in the parameters of taper ratio and twist. This procedure was necessary not only for generating grids for CFD simulation but also for applying the POD ROM for iterative design optimization. As such, a procedure was developed over the course of this study which allows for a parametric definition of rotor blades. The procedure starts by reading a single input file that holds the definition of the rotor blade's twist (θ), taper (λ), sweep, dihedral, and airfoil cross-section at a number of spanwise stations. These input file formats can be obtained either from National Aeronautics and Space Administration (NASA) Design and Analysis of Rotorcraft (NDARC) (Johnson, 2015) geometry files or from CAMRAD. A PLOT3D (Walatka, 1990) file is then generated for the rotor's Cartesian surface grid. With the meshing algorithm defined, the study began generating the 16 blades, as defined in Table 1, and 3 validation grids, as outlined in Table 2. Each blade consisted of 276 chordwise and 128 spanwise nodes for a total surface cell count of 34 944. All 16 blades had a mean chord of 0.3048 m (1 ft) and a radius of R=3.048 m (10 ft). Examples of blades from cases c1 and c16 can be seen in Fig. 1. After surrogate models were derived and local optimal points were obtained, five additional blades were generated to validate the surrogate model optimal solution found for rotors in forward flight. These additional blades included one geometry to validate the local optimal point found, two to identify local variation in the lift-to-drag effective ratio with respect to twist, and two to identify local variation in the lift-to-drag effective ratio with respect to taper. A summary of these additional geometries are provided in Table 3.
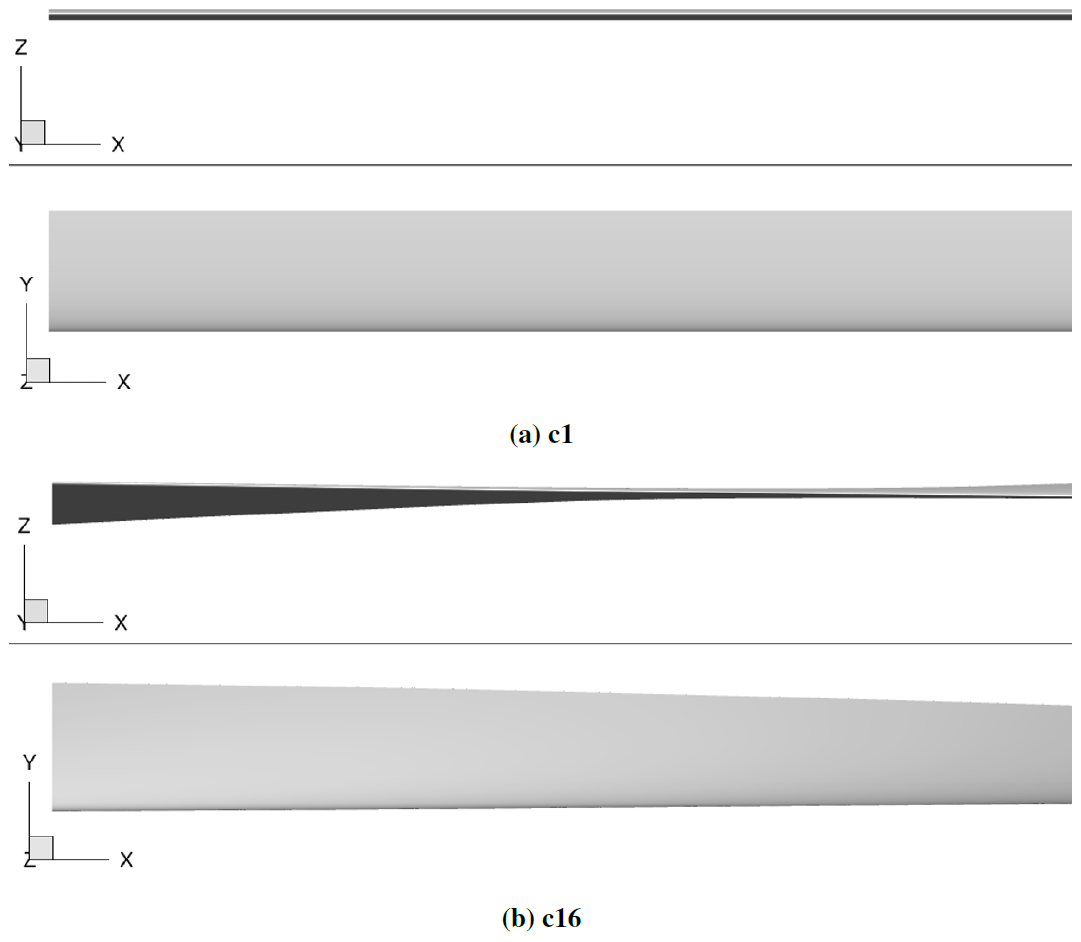
Figure 1Comparison of two geometries used in this study. Panel (a) shows θ=0∘ and λ=1.0. Panel (b) shows θ=30∘ and λ=0.7.
Table 1The 16 geometries used for derivation of the POD ROM in both hover and forward flight.
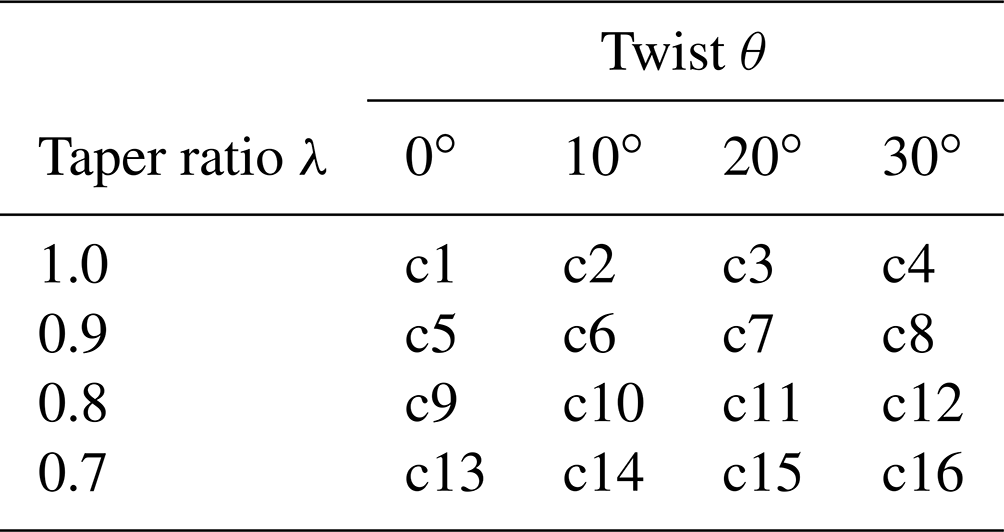
Table 2The three geometries used for validation of the POD ROM in both hover and forward flight.
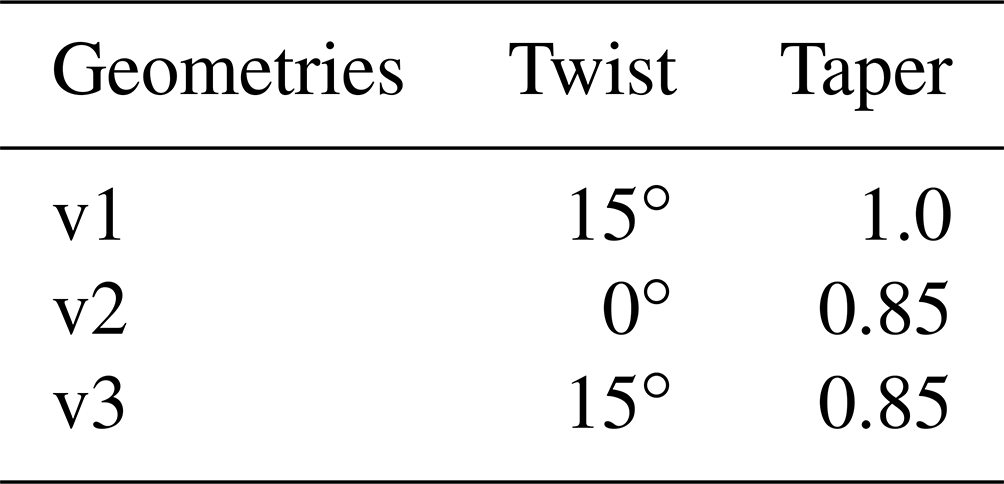
Table 3The five geometries used for comparing the POD ROM optimal solution against CFD simulation.
Each rotor was limited to a single blade to simplify rotor geometry and limit the influence of variables not represented in the POD ROM affecting blade pressure distributions. It should be noted that this geometric constraint is not consistent with blade counts found on rotorcraft, and thus typical rotor performance for UAM aircraft may not be represented in the current study. Nonetheless, this geometric constraint still allows for pressure distributions representative of those found for blades in hover and forward flight to be modeled, thus allowing the study to efficiently identify a POD ROM's applicability to the field of rotorcraft engineering. The selected geometries produce a constrained domain within which a POD ROM can be tested for its ability to reconstruct typical load distributions found on blades and to model their evolution as a blade's twist and taper ratio vary.
To generate closed surfaces for the rotor's root and tip faces, the Chimera Grid Tools (CGT) WINGCAP software was used (Chan, 2005; Rogers et al., 1998). The CGT is a tool set developed by NASA for the purpose of pre- and post-processing of chimera overset grids (Benek et al., 1986), particularly for use in NASA's OVERFLOW CFD solver. Volume grids were generated from the surface meshes using CGT's hyperbolic grid generator HYPGEN (Chan et al., 1993) software. An example of the HYPGEN-generated extrusion is shown in Fig. 2. The total near-body volume cell count for each case is 3.5 million. Normal spacing at the surface was at a y+ of 1, and growth was limited to a rate of 1.2. A Cartesian background mesh was then constructed with pressure far-field boundary conditions extending 15 rotor radii from origin. The SAMCart solver was used for the background mesh.
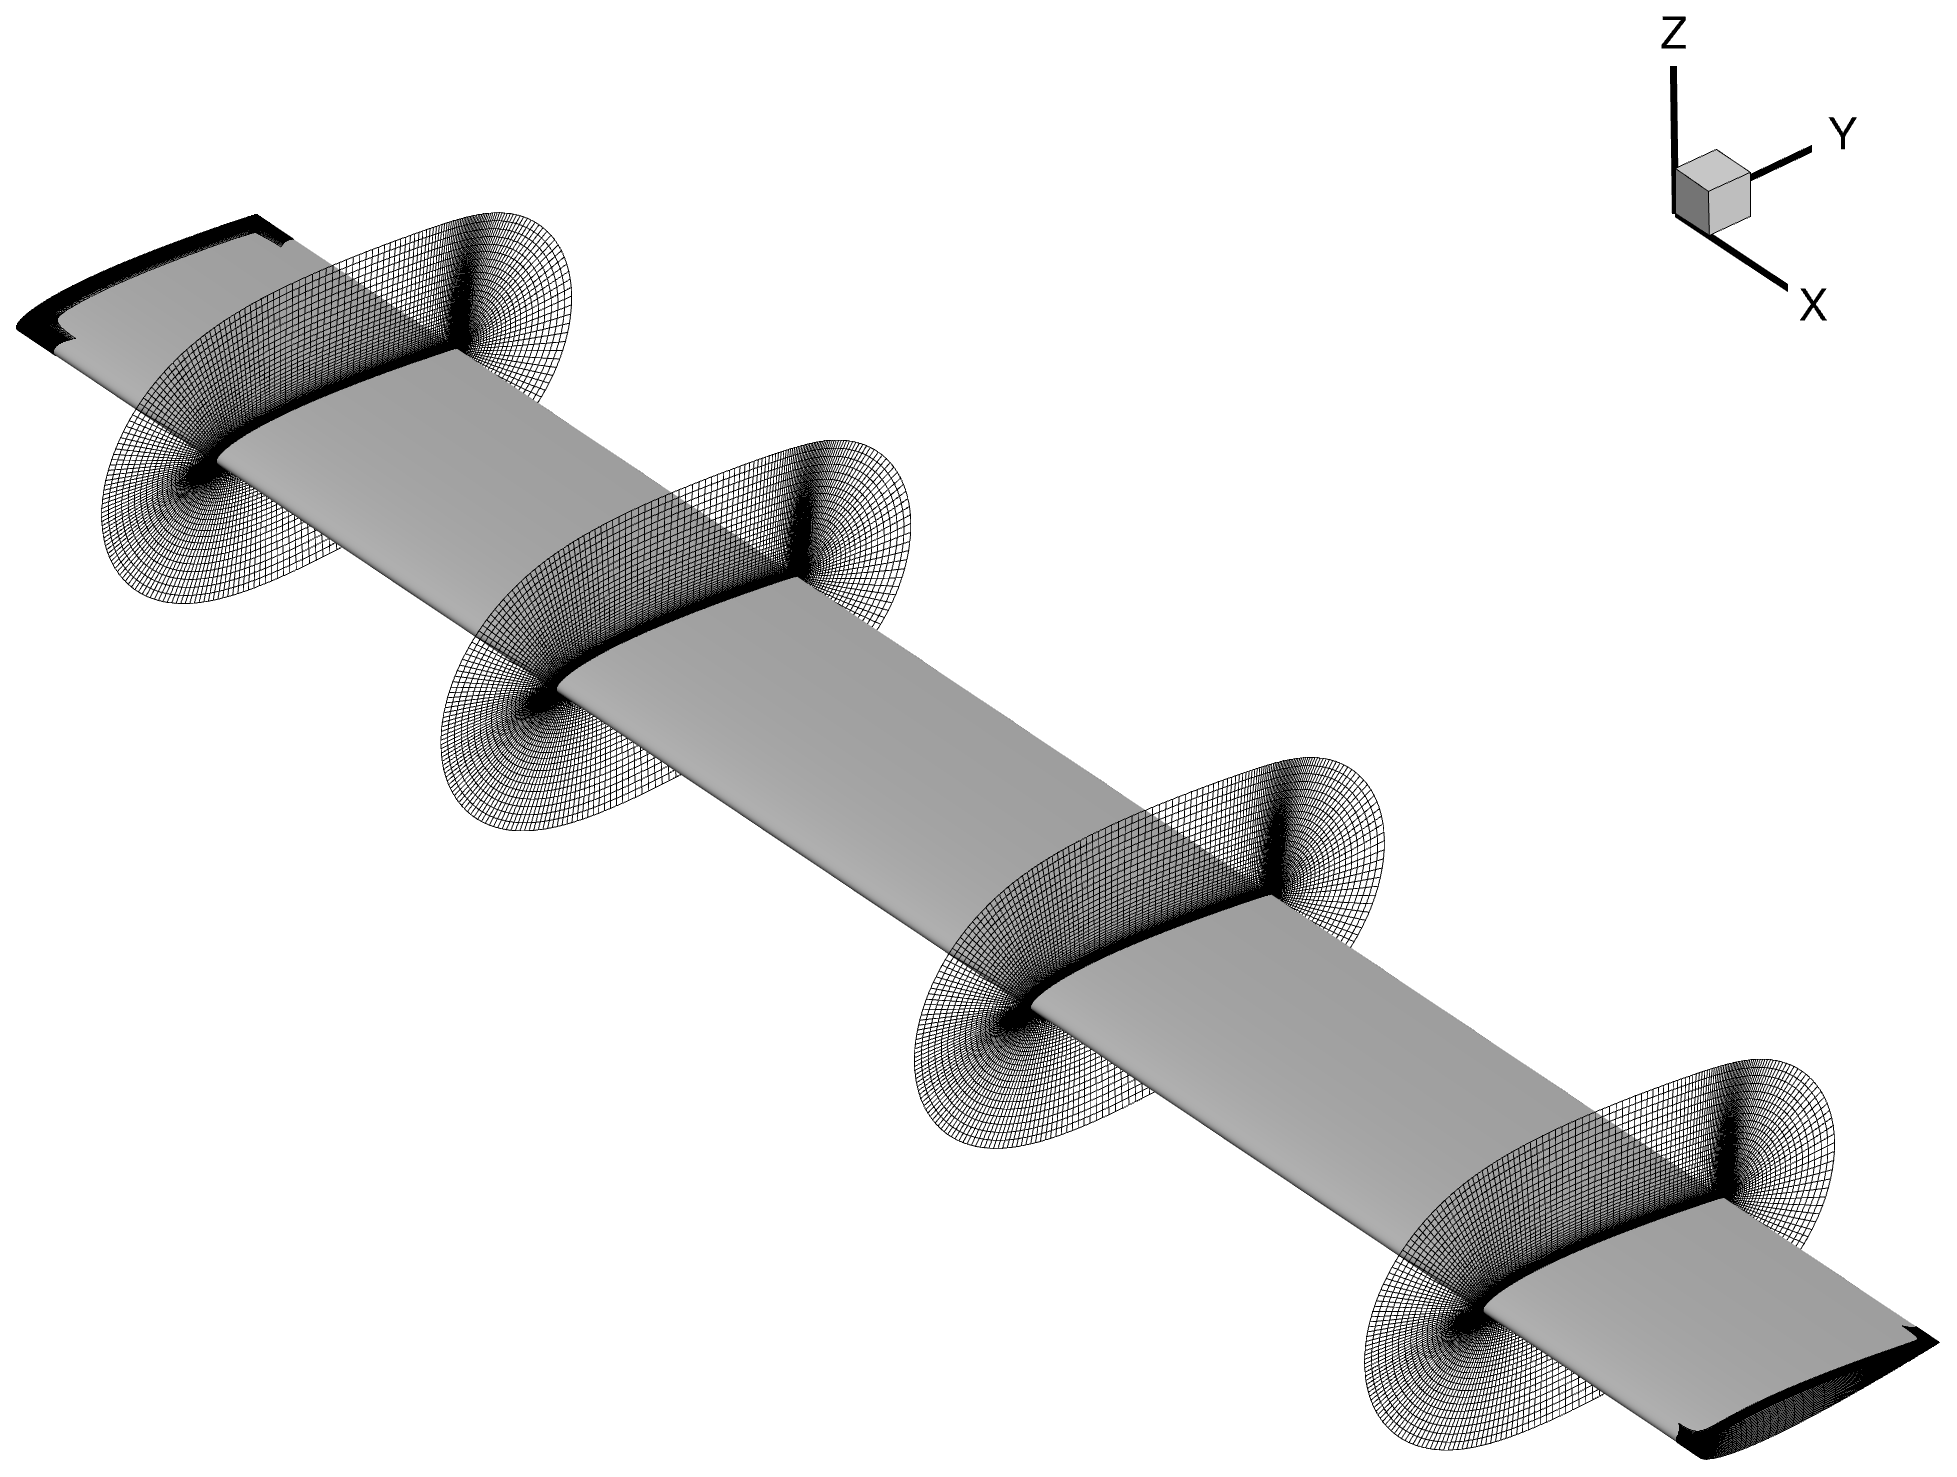
Figure 2Example of blade volume mesh generated for rotor geometry c1, shown as slices of volume mesh at radial positions of , 0.57, and 0.86. Surface grids generated for rotor tip and root faces are additionally depicted.
For numerical simulation, the OVERFLOW CFD solver was used. OVERFLOW was developed by NASA and uses a series of structured, overset grids to model fluid flows. For turbulence modeling, the one-equation Spalart–Allmaras model was used with curvature corrections (Spalart and Allmaras, 1992). Second-order temporal and spatial accuracy was used. To assist in case setup, the CREATE-AV Helios modeling tool was used (Wissink et al., 2016; Sankaran et al., 2010). The Helios code takes a modular approach to numerical simulation in which users are allowed to interchange meshing and solver algorithms and thus allows for a broader flexibility for the code to be applied to a variety of topics (Wissink et al., 2018; Anusonti-Inthra, 2018; Ho et al., 2019). For the hovering-rotor cases, five startup revolutions were completed before extracting rotor surface pressures. For the forward-flight cases, eight rotor revolutions were completed before extracting rotor surface pressures. Startup revolutions were selected such that periodic solutions were obtained. Clearly, because of these requirements, the cost of the CFD simulations is high. Each forward-flight CFD simulation required 12 h to compute on 440 cores.
For the high-thrust hovering rotor, 16 CFD simulations covering geometries outlined in Table 1 were completed with a fixed collective of 8∘. These cases were used to construct the first POD ROM. This ROM was then validated against the three additional validation rotor geometries outlined in Table 2. For the low-thrust hovering rotor, CFD simulations were again completed, covering geometries outlined in Table 1 with a fixed collective of 4∘. A POD-ROM-based surrogate model was constructed and validated for all three validation geometries. For the rotor in forward flight, the same simulations were completed with a fixed collective of 4∘ and free-stream flow of M=0.1 moving in the positive x-axis direction. For all CFD simulations, a tip Mach number of Mtip=0.5 was used. For this study, no cyclic pitching or flapping motion was prescribed for the blade. Additionally, the rotor is not trimmed for the balancing of forces or moments, and all rotors are considered to be rigid rotors.
The surrogate model based on the POD ROM was subsequently used to optimize the blade's twist and taper ratio such that either the hovering figure of merit (FM) or the forward-flight lift-to-drag effective ratio () would be maximized. To undergo this optimization, three blade surface grids were first generated. The first grid was generated using the current iteration's solution for optimal twist and taper ratio. Two additional grids were then generated: the first used a 0.1 % increase in twist, while the second used a 0.1 % increase in taper ratio. Solutions for distributed pressures were obtained using the derived POD ROM, from which loads were integrated and used to solve for either the FM or the of each blade. First derivatives for either FM or with respect to twist and the taper ratio were solved using a first-order Euler approximation and were used to select new optimal twist and a new optimal taper ratio through the usage of a steepest-descent algorithm. A criterion of 0.1 % change in solution was selected as a stopping condition.
In this study, FM was computed using Eq. (1). To compute both the coefficient of thrust, CT, and the coefficient of torque, CQ, blade distributed-surface-pressure solutions were numerically integrated. For rotors in forward flight, integrated sectional coefficients of thrust were plotted from azimuth 0 to 360∘. While viscous CFD solutions were obtained in this study, shear stresses were not utilized when computing integrated loads for either the POD ROM or CFD. Given that the objective of this study was to provide an initial investigation of POD ROM distributed-load prediction capability for rotor blades, expanding the POD ROM to include multi-directional shear loads was not warranted in the current work.
For the rotor in forward-flight cases, was computed by first integrating distributed pressure loads for mean rotor lift L during the blades' rotation. Distributed pressure loads were then integrated to find mean power P required by the rotor during the blades' rotation. Once again, viscous loads were not utilized when computing integrated loads for either the POD ROM or the CFD predictions. The formulation used to compute is shown in Eq. (2), where v is forward velocity.
In this section, the methodology used for ROM-based surrogate model construction will be outlined. The method used in this study consisted of two steps. The modal decomposition method will be reviewed first. Next, the interpolation approach used in this study to construct the surrogate model from the POD ROM modes will be reviewed.
3.1 Proper orthogonal decomposition
The POD was introduced as a method for extracting a low-dimensional subspace which captures the majority of the variance, often referred to as energy, from the full phase space (Holmes et al., 1996). While there exist numerous formulations for POD, in this paper the snapshot method as introduced by Sirovich (1987) will be used. In this approach any scalar of the flow field can be represented by the sum of the scalar's time average, , and n orthonormal POD modes Φi(x) times the temporal coefficient ai(t). Note that in this summary of the POD algorithm, x represents not just spatial positions in the computational domain but also additional variations in twist and the taper ratio of the rotor. In this study, surface pressure solutions were used to formulate the snapshot matrix. The relationship is shown below, where .
To obtain Φi(x), the a snapshot matrix u(x,t) is first formed. In this matrix, the row space holds spatial information while the column space holds temporal information. The perturbation matrix, , is calculated by subtracting the snapshot matrix's time average. The POD modes are then found through a singular value decomposition (SVD) of , where the subset of modes Φi is extracted from U. In Eq. (4), U contains the eigenvectors for times its transpose, VT contains the eigenvectors of the transpose of times itself, and Σ contains the singular values of the SVD.
The process of reducing the dimensionality of the dataset down to a low-rank subspace has been described in numerous publications (Brunton and Kutz, 2019; Holmes et al., 1996). For the present study, the process of selecting an adequate subspace was based on energy retention. For this approach, the number of modes which must be retained is dependent on the behavior of the singular values, s, found in the diagonal of the Σ matrix. Given that s is little more than the square of the eigenvalues of , this then serves as a representation of how much of the snapshot matrix's energy, E, is being captured by each mode. The amount of energy being captured in each mode can then be visualized by plotting the ratio of each singular value si to the sum of s denoted at . The objective is then to retain a subset of modes, n, such that Eq. (5) is satisfied.
Once a POD model of the form of Eq. (3) has been constructed for the surface loads of various cases, an interpolation scheme is needed in order to make use of these modes for intermediate case predictions.
3.2 Two-dimensional surface map interpolation
In order to produce a continuous representation of the temporal coefficients, a two-dimensional mapping was constructed. During the construction of these mappings, the objective was to produce a continuous representation for the temporal coefficients. This continuous representation was provided by relating twist θ and the taper ratio λ to the temporal coefficients ai(t).
Note that for the two-dimensional surface mapping method, it is an inherent requirement that the two variables selected combine to produce a unique definition of each snapshot. In the case of this study, selection of interpolation parameters becomes trivial. By selecting λ and θ as the mapping variables, any location on the snapshot matrix could be uniquely identified and a spline surface could be fit for each mode's temporal coefficients. The advantage is that this method is relatively simple, accurate, and computationally inexpensive to setup. There is no training requirement as in neural networks, and there are no large matrix inversions to make; additionally the user has a much greater degree of control over how the mapping can be constructed – whether with a polynomial, linear, or logarithmic fit depending on the prior knowledge of the problem at hand.
In this section, the results for CFD simulation, the POD ROM reconstruction, and necessary validations of the ROM and surrogate models will be presented. Results are primarily split between the hovering and forward-flight demonstration cases. These two sections will each be further split into three additional sections showing CFD simulation results, POD ROM reconstruction results, and POD ROM validation results.
4.1 Hovering-rotor cases
In the first two scenarios of POD ROM rotor blade modeling, an isolated rotor blade in hovering conditions is used. With these two demonstration cases, the study was able to first test for the most basic operating conditions that a rotorcraft-based POD ROM would be required to model. For an isolated rotor blade in hover after the initial transients are removed, time variance can be neglected, and thus the focus of the analysis is limited to POD ROM capability for the accuracy of both the reconstruction and the prediction of the spatial characteristics of the domain. This truncation of the time domain leads to the additional advantage of minimizing the size of the snapshot matrix required for the POD ROM to model. As opposed to time-varying systems, such as rotors in forward flight, where numerous snapshots are required per sampling point of the domain to accurately capture the time dynamics of each CFD simulation, for the hovering rotor only a single snapshot is required per sampling point. This relatively small snapshot matrix both minimizes the computational expense of deriving the POD ROM and helps to limit information content in the system, thus maximizing the ability of each POD mode to retain a high percentage of the total energy.
By reducing the rotor collective to vary between high- and low-thrust hovering-rotor scenarios, there is an overall increase in design space non-linearity and spatial information complexity within the domain. In this demonstration case, the influence that this increased complexity has on POD ROM capability to both replicate and predict rotor load distributions are investigated. Evidence for the increased complexity of spatial information can be found when comparing rotor pressure distributions between high- and low-thrust configurations. For the high-thrust case, the rotor's wake is convected downstream rapidly. This results in the rotor wake having a smaller degree of influence on the overall rotor pressure distributions. The coefficients of pressure were taken at the radial station on the rotor for case c4 (λ=1.0, θ=30∘) and are plotted in Fig. 3a to demonstrate the largely smooth variations in surface pressure of the blade. These relatively small gradients in surface pressure typically result in smaller POD mode retention counts required to comprehensively represent the system.
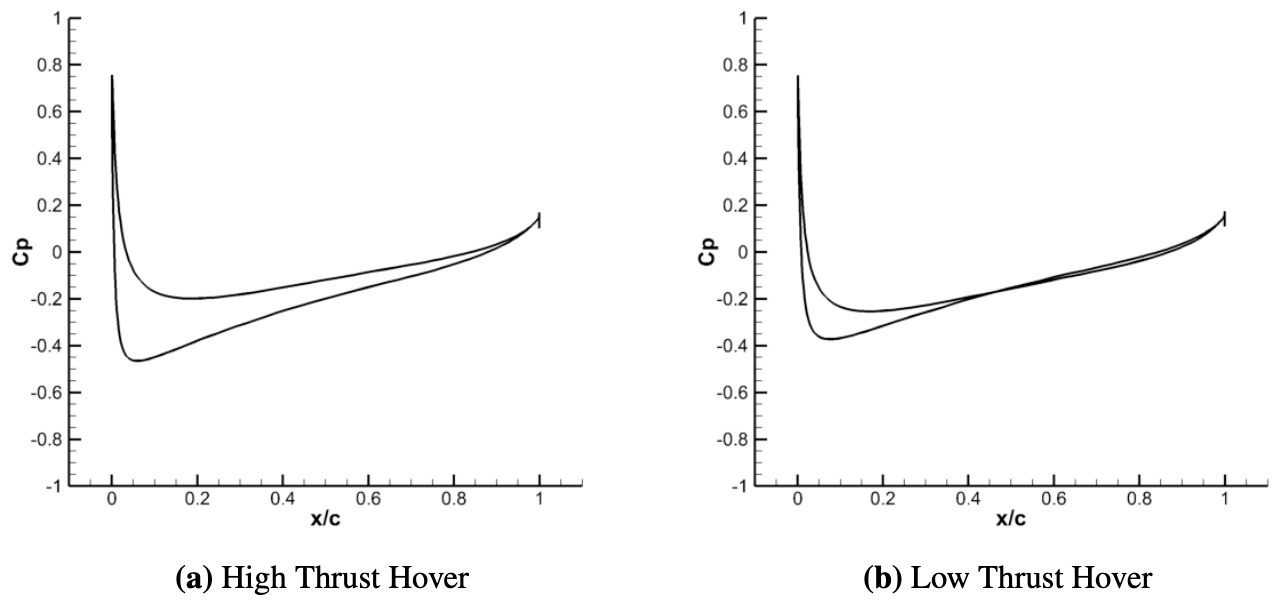
Figure 3Coefficients of pressure at as computed through CFD for both high-thrust hover (a) and low-thrust hover (b). Comparison is shown for sample geometry c4.
This is in contrast to the low-thrust hovering cases where distributed loads vary to a larger degree in the spanwise direction, particularly at the rotor's tip, caused by the blade's wake being convected away at a slower rate. As a result, there is a significant increase in tip wake interactions with the rotor's pressure distribution. Results for low-thrust hovering-rotor coefficients of pressure at the radial station for case c4 (λ=1.0, θ=30∘) are plotted in Fig. 3b. These results demonstrate that the non-linearity of coefficients of pressure distributions at the radial station has increased.
This increase in complexity may lead to a significant modeling challenge for POD-based surrogate ROMs. As more spatial information is introduced into the domain, energy content may become distributed over a larger range of POD modes. Yet, for an interpolation-based surrogate POD ROM to make accurate predictions of a domain, a limited number of POD modes should be retained. While initial POD modes can typically be related well to parameters of interest of the domain, modes associated with higher mode counts tend to be stochastic, making derivation of meaningful interpolation models rigorous. Thus, by applying the POD ROM to both high- and low-thrust hovering cases, the study investigates the influence that this increased spatial complexity has on the capability of the POD ROM to replicate the domain with a minimal POD mode retention count.
An alternative approach to distributed-pressure-load modeling could be to avoid modal decomposition methods altogether and deploy a kernel-based learning method in the form of a convolutional neural network (CNN). A significant advantage that CNN models have over POD models is their ability to extract features from a dataset at various scales and translations. Once a flow feature is identified, such as rotor vortex rings (Abras and Hariharan, 2022) or shockwaves (Liu et al., 2019), the feature can be either identified or replicated at various positions and scales within the domain of interest with minimal computational effort. Given these characteristics, CNNs have historically shown relatively few limitations in their capability to replicate training datasets in comparison to modal decomposition-based methods.
However, while CNNs have shown an enhanced capability to extract meaningful features from complex datasets, there exist significant challenges in deriving a network capable of utilizing these features for meaningful predictions. These challenges become particularly pronounced when deriving CNN models from a sparse sampling of the domain. Typically, to learn meaningful relationships between parameters of interest and the dynamics of the domain, a sufficiently large sampling of the domain must be obtained. Such large sampling may be possible in the case of either two-dimensional or three-dimensional steady-state CFD simulations. Yet, for unsteady three-dimensional CFD simulations with multi-body motion, as is required for UAM rotorcraft CFD modeling, computational expense greatly limits the capability to obtain the required sampling of a domain. Additionally, there is also a significant computational expense associated with deriving CNN models compared to POD models. Both hovering-rotor POD ROMs were derived in less than a second of computing time. Meanwhile, a CNN derived by the study for a similar rotor performance prediction application required over 12 h of computing time despite being deployed to a graphical processing unit (GPU). Given the limited domain sampling capability associated with CFD simulations of the UAM field and significant computational expense associated with deriving CNNs, the application of ROM modeling techniques to UAM rotorcraft at present remains largely limited to modal decomposition-based methods.
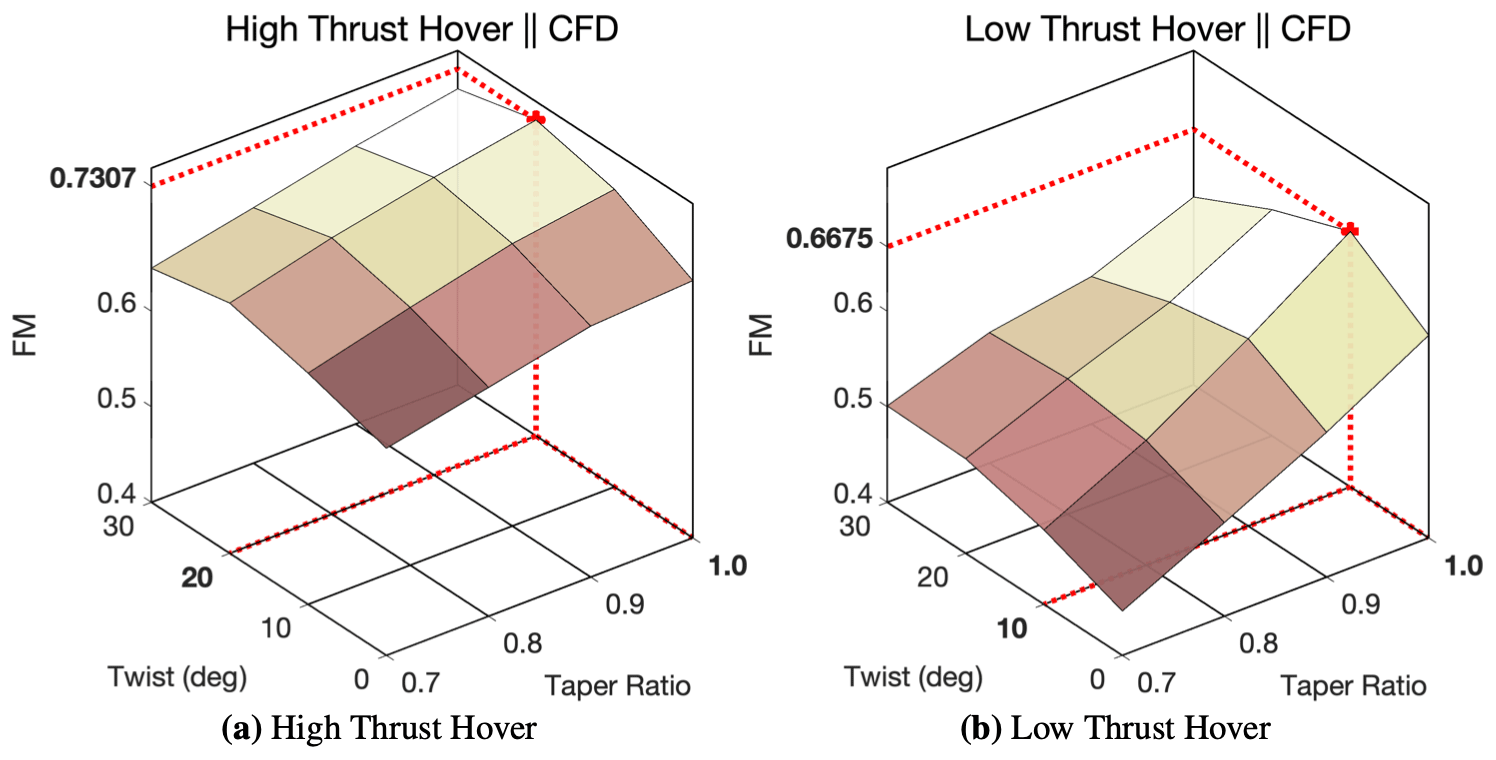
Figure 4Surface plot of FM with respect to θ and λ for both high-thrust hover (a) and low-thrust hover (b) based on the 16 CFD runs for each case.
In addition to an increase in complexity of the surface pressure distribution, there is a significant influence that the rotor collective has on the range of load distributions within the design space. When observing surface plots for the integrated figure of merit (FM) of both high- and low-thrust demonstration cases (Fig. 4), a series of key observations can be drawn. First and foremost is the increased range of FM, and thus increased range of pressure distributions, that the POD ROM is required to model. For the rotor in high-thrust, hover FM varies from 0.65 to 0.73. Yet, by decreasing the rotor collective, the range of FM for the low-thrust hovering rotor nearly doubles, resulting in FM varying from 0.45 to 0.67. Note that the minimums and maximums for the domains are found from the sparse CFD simulation sampling of the domain and may not necessarily reflect true local optimal solutions of the respective domains.
Based on the limited number of CFD runs (16 for each case), Fig. 4 also demonstrates how reducing the rotor collective can lead to an increase in design space non-linearity. In Fig. 4a, gradients of FM with respect to θ and λ are shown to be minimal. The FM is shown to have a near-uniform decrease radially from the local optimum in the design space, thus resulting in a largely linear relationship between FM and the rotors λ and θ. For the high-thrust-rotor maximum, FM can continuously be found near θ=20∘ as λ goes from λ=1.0 to λ=0.7. For the high-thrust hovering rotor, a local optimum of FM=0.7307 is found at λ=1.0 and θ=20∘ through sparse sampling of the domain with CFD simulation.
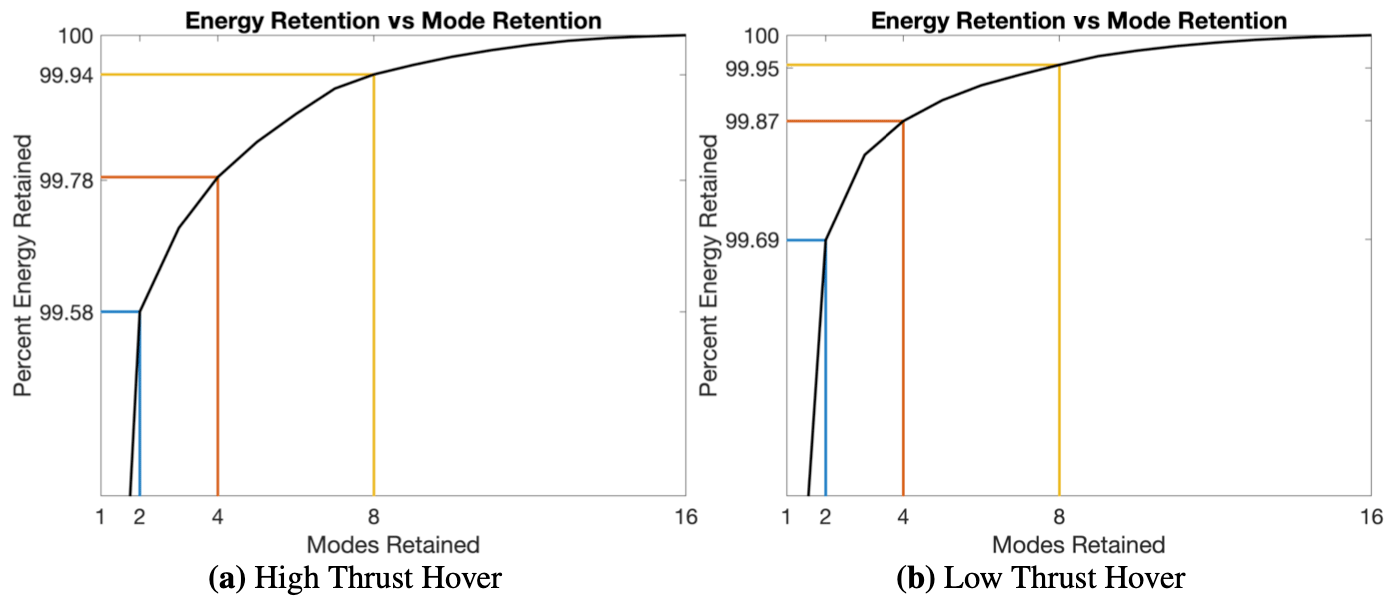
Figure 5Percent energy retention per retained mode count for two, four, and eight POD modes. Results are shown for both high-thrust hover (a) and low-thrust hover (b).
As the collective is decreased for the low-thrust-rotor FM (Fig. 4b), FM is shown to both be varying non-uniformly radially from the local optimum and have a varying local optimal θ as λ goes from 1.0 to 0.7. When λ=1.0, local optimal θ is found to be around θ=10∘, while λ=0.7 results in a local optimal twist of θ=30∘. Thus, λ and θ are shown to have varying, non-linear influences over the domain of interest. While this increase in non-linearity will not lead to deterioration in the reconstruction capabilities of POD ROMs, as it does not necessarily produce more complex spatial information, it will ultimately create a more challenging modeling requirement for POD ROMs to produce accurate distributed-load predictions. The characteristic of having multiple variables with widely varying degrees of influence on the system is commonplace for many practical rotorcraft applications including hysteresis modeling, aeroelasticity, controls, etc. If a multi-variable data-driven model is to be successfully derived for rotorcraft applications, it must be capable of efficiently extracting the relationship each design variable has with rotor surface loads, whether that relationship is linear, quadratic, logarithmic, etc. For the low-thrust hovering rotor, a local optimum of FM=0.6675 is found at λ=1.0 and θ=10∘ through sparse sampling of the domain with CFD simulation.
4.1.1 Hovering ROM reconstruction
After completing all 16 high-thrust hovering-rotor CFD simulations, solutions for surface pressure were compiled to form a single snapshot matrix. The POD algorithm was then used on this snapshot matrix after which an energy retention criterion was prescribed as outlined in Eq. (5). The percent energy retention per POD mode retention count can be found in Fig. 5a. Given the limited number of snapshots used to define the design space and thus the increased ability of POD modes to retain energy, a relatively large energy retention criterion of 99.9 % was set, after which it was determined that only eight POD modes were required to produce the desired energy retention. This procedure was then repeated for the low-thrust-rotor demonstration case, and results for the percent energy retention per POD mode retention count can be found in Fig. 5b. Results of this analysis demonstrated that despite the increase in complexity of the spatial information in the domain, the POD algorithm still appears to be capable of efficiently capturing this information in a limited mode retention count. It should be noted that for both high- and low-thrust hover configurations, pressure distributions do not vary in the azimuth direction, which greatly reduces the distribution of energy over the POD modes.
Once a POD mode retention count of eight was selected, POD modes were projected back to the domain to evaluate POD ROM reconstruction capability. In evaluating load reconstruction capabilities of surface pressure distribution for case c4, shown in Fig. 6 for both collective cases of hover, it can be seen that loads are being modeled with a reasonable degree of fidelity in comparison to CFD. Pressure coefficient distributions at the radial station are shown to be correctly accounted for with the reduced representation. To assist in demonstrating a comparable level of ROM fidelity over all radial stations of the blade, local contributions to the coefficient of thrust were computed at each radial station of the blade. Results of this analysis, shown in Fig. 7, demonstrate that a reasonably accurate representation is achieved at all radial stations. Furthermore, results showed that the maximum percent error between CFD and ROM surface pressures for all 16 reconstructions for all radial stations was 1 %. This deviation for both high- and low-thrust hovering cases was located at the stagnation location near the radial station of the blade. Historically, modeling flow features with large gradients through modal decomposition techniques with minimum mode retention counts has proven challenging, particularly as these gradients move within the domain. For the case of the hovering rotor, the largest pressure gradients in the domain occur at the stagnation location. The spatial position of this location on the blade then varies as a function of θ, λ, and . Yet, despite these challenges, the results of this study show that leading-edge gradients are captured with sufficient accuracy, so FM is still being modeled with a reasonable degree of fidelity. The maximum percent error for reconstructed FM for both high- and low-thrust hover was 0.41 %. Percent errors in FM reconstructions are shown in Table 4.
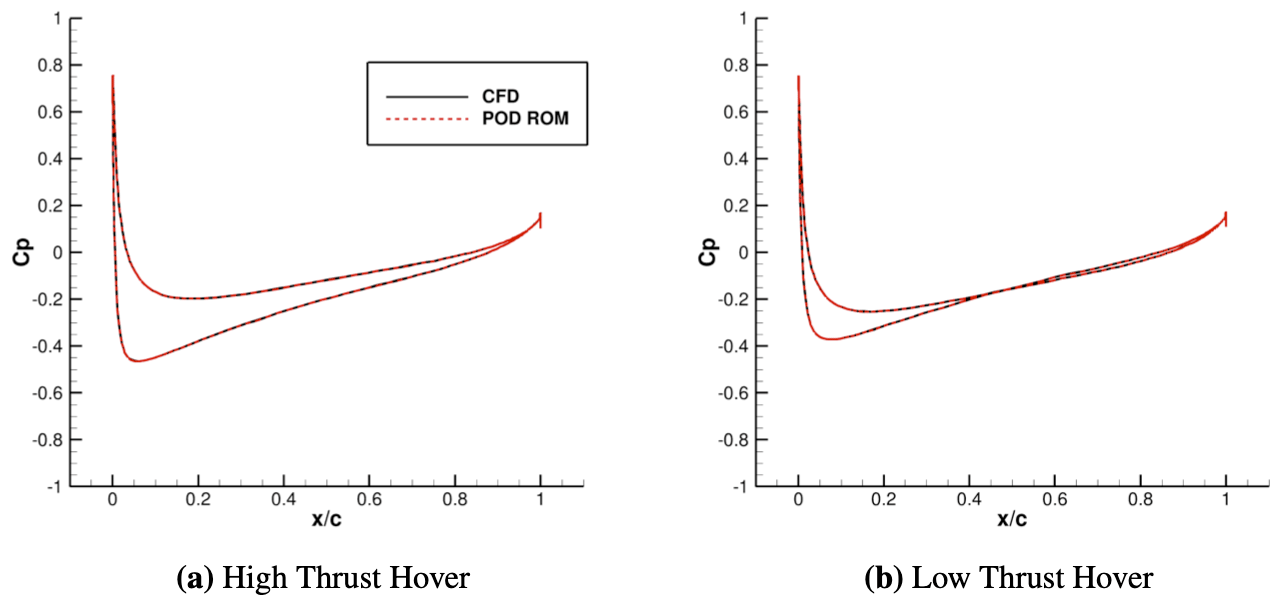
Figure 6Comparison between the POD ROM and CFD for slices of coefficient of pressure at . Comparison is shown for sample geometry c4 in both high-thrust hover (a) and low-thrust hover (b).
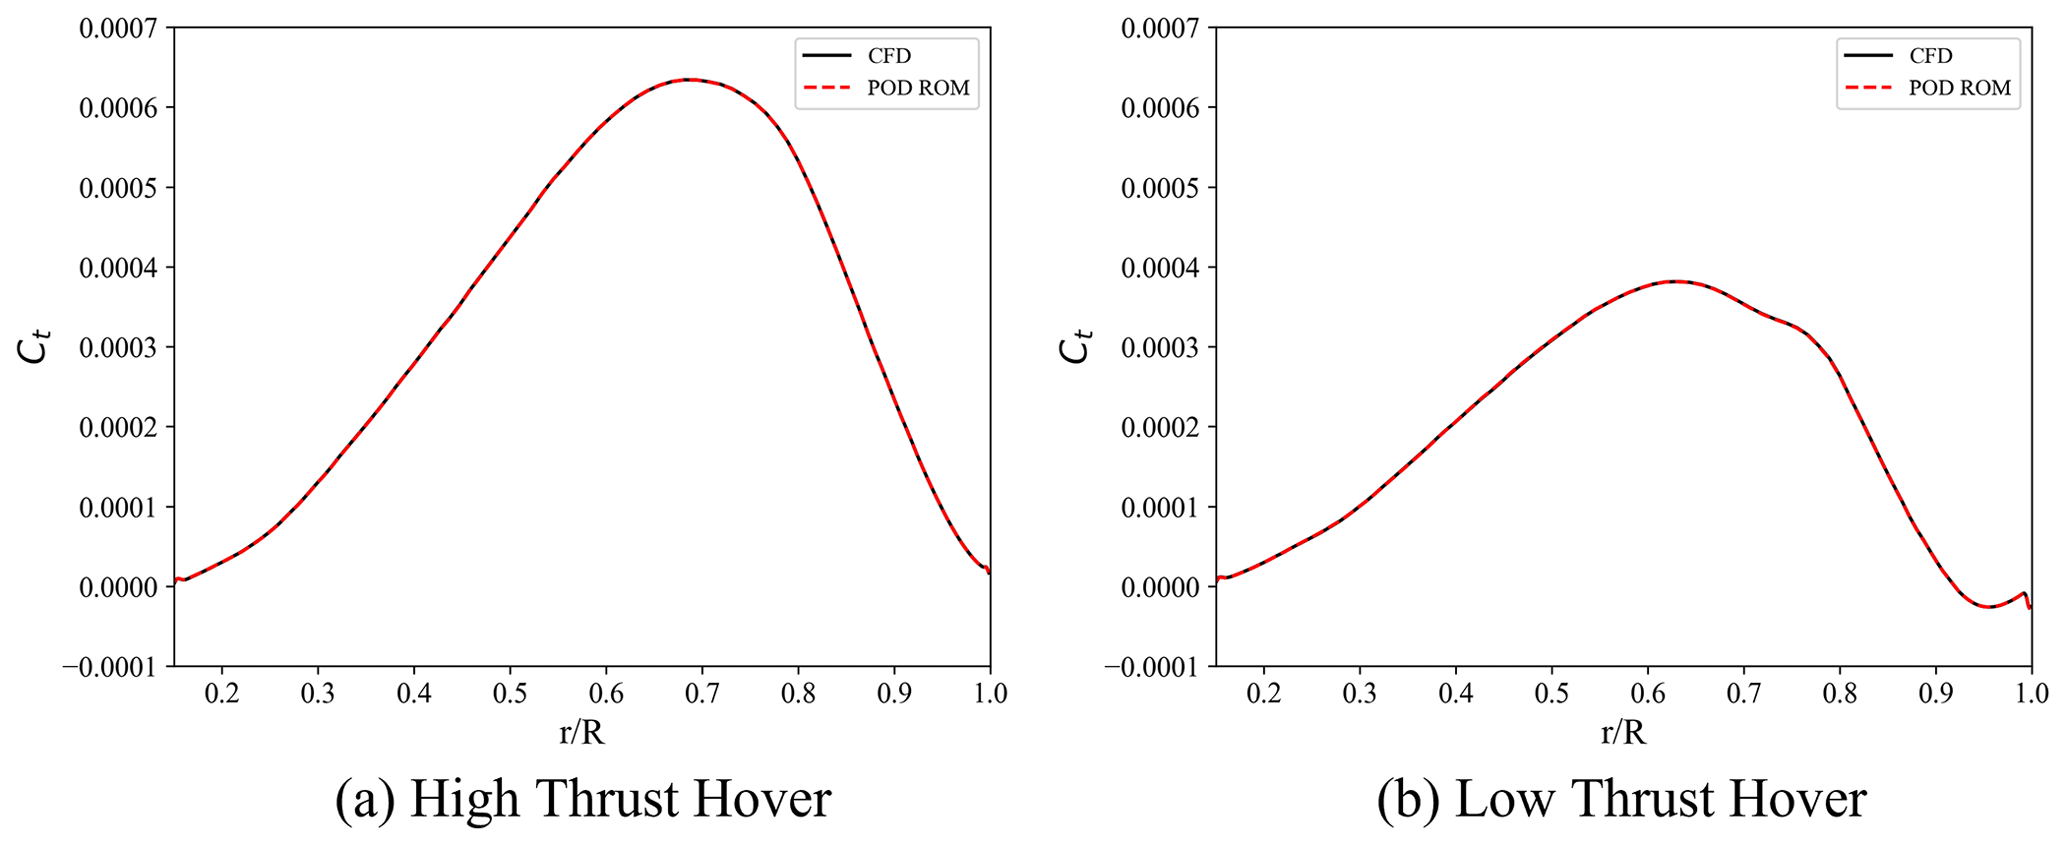
Figure 7Comparison between the POD ROM and CFD for the spanwise distribution of the coefficient of thrust. Comparison is shown for sample geometry c4 in both high-thrust hover (a) and low-thrust hover (b).
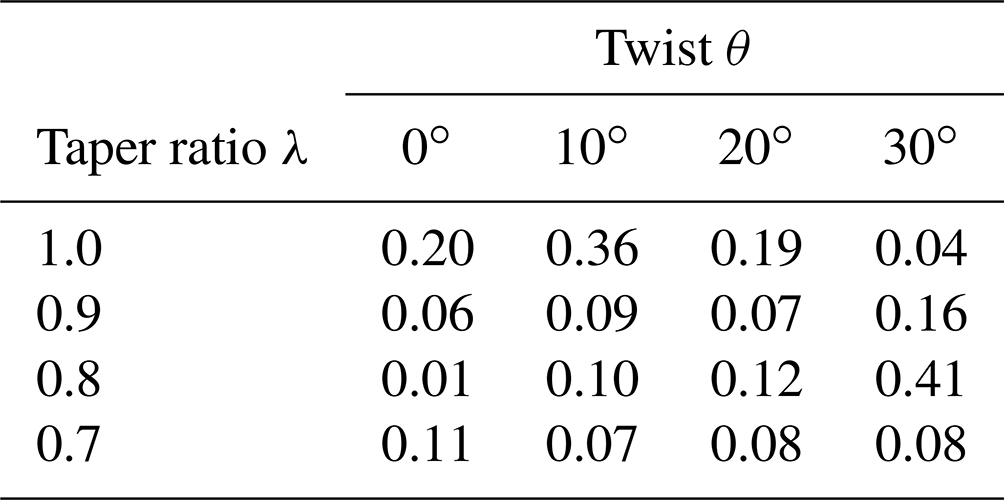
Table 4Maximum percent error between CFD- and POD-ROM-computed FM for geometries c1 to c16.
4.1.2 Hovering ROM validation
After constructing the POD ROM and comparing reconstructions to CFD solutions, the study then moved to quantify POD ROM predictive capabilities for the geometries outlined in Table 2 for both high- and low-thrust demonstration cases. This validation was completed in two steps. First, distributed coefficients of pressure were compared between POD ROM prediction and CFD simulation, after which these loads were integrated to identify FM. When comparing surface pressure distributions for both high- and low-thrust hover, it was found that with a minimum mode count the POD ROM was capable of providing reasonable full-distributed-load predictions for all three validation geometries. When considering prediction, results for validation of the ROM with case v3, presented in Figs. 8 and 9, demonstrate that while near-exact predictions can be achieved for the high-thrust hovering configuration, in low-thrust hover, small discrepancies exist between CFD simulation and ROM prediction near to 0.9.
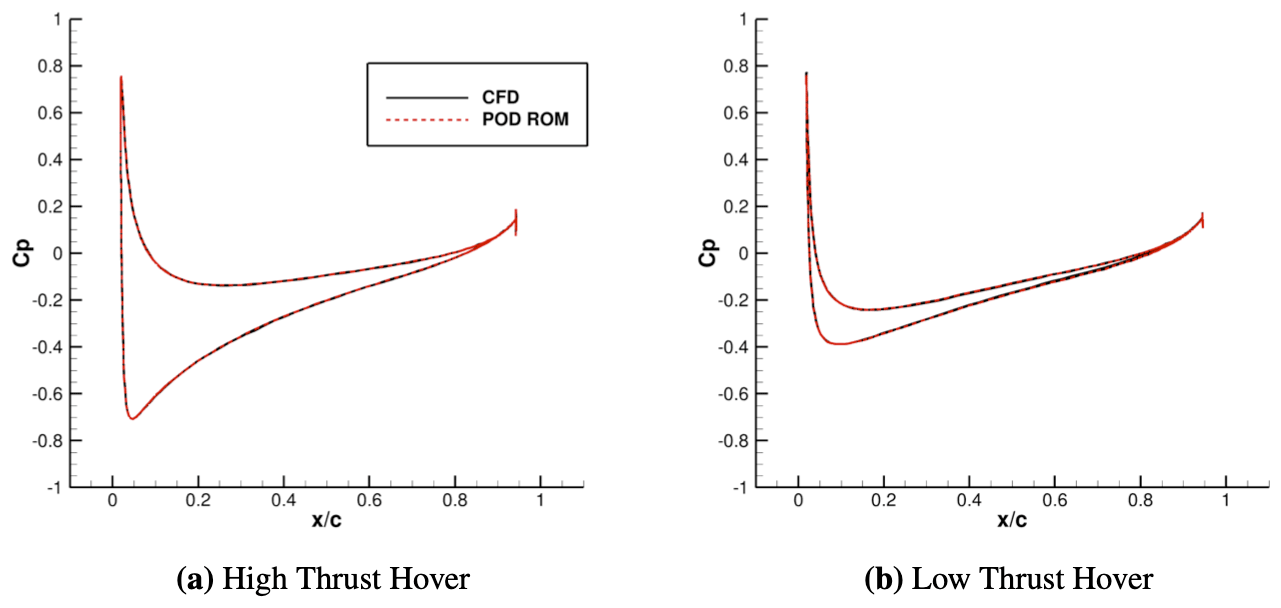
Figure 8Comparison between the POD ROM and CFD for slices of the coefficient of pressure at . Comparison is shown for validation geometry v3 in both high-thrust hover (a) and low-thrust hover (b).
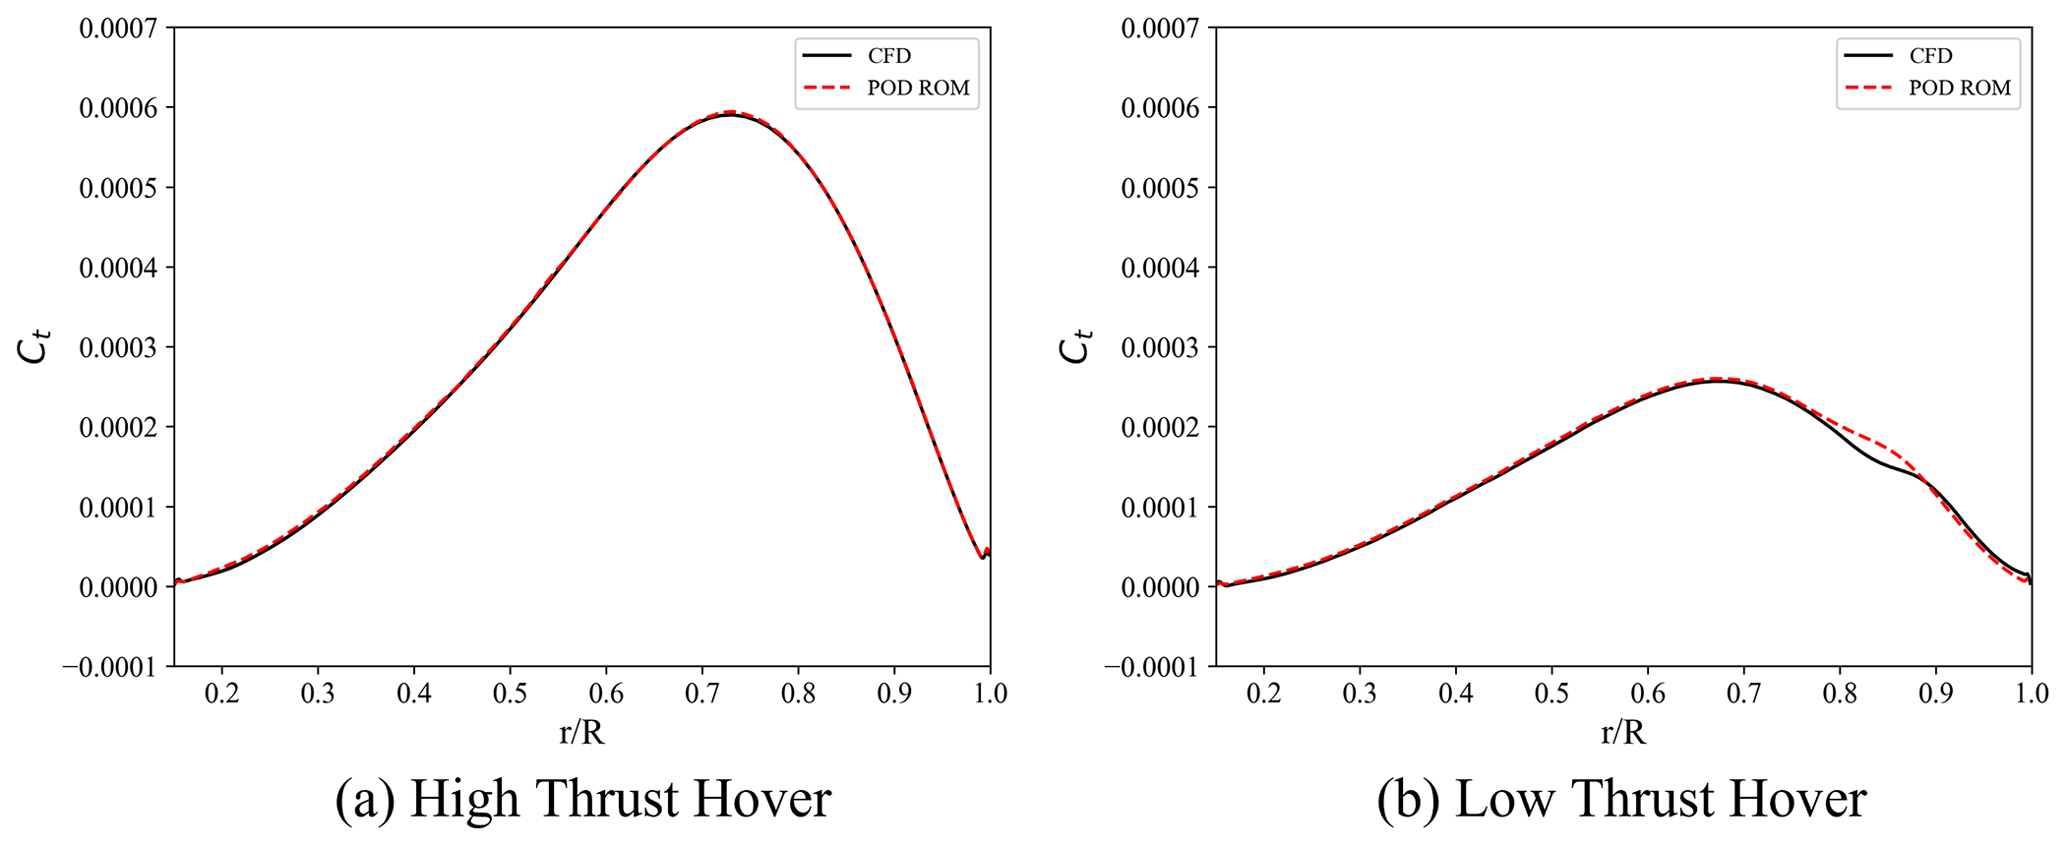
Figure 9Comparison between the POD ROM and CFD for the spanwise distribution in the coefficient of thrust. Comparison is shown for sample geometry v3 in both high-thrust hover (a) and low-thrust hover (b).
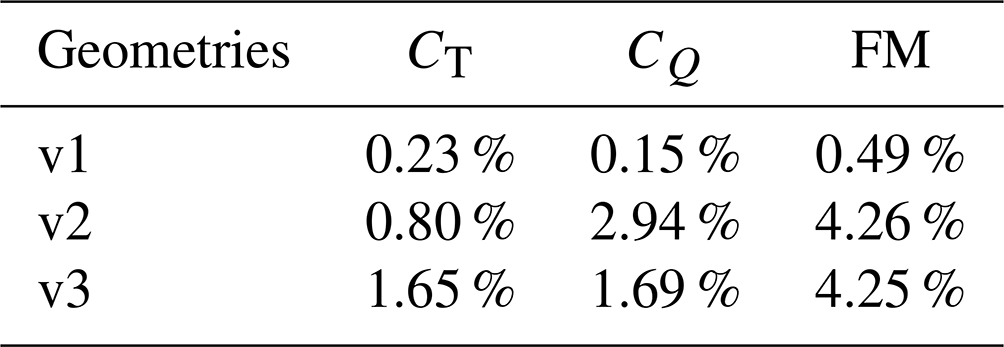
These predicted surface pressures were then integrated to find FM. When comparing this FM to CFD for the high-thrust hover cases, it was found that for all three validation geometries the percent error never exceeded 1 %, thus providing strong evidence that a POD ROM can be efficiently deployed to model a rotor blade's full distributed load with a reasonable degree of fidelity. A summary of prediction capabilities for the POD ROM is shown in Table 5.
Table 5Summary of percent errors in the coefficient of thrust, torque, and figure-of-merit predictions using the POD ROM derived for high-thrust hover.
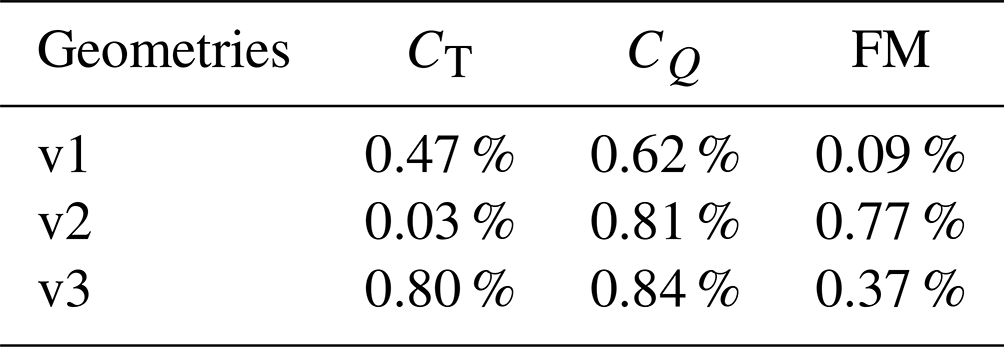
However, the same level of fidelity in integrated load comparison was not achieved once the rotor collective was decreased. While the percent error for validation geometry v1 was limited to 0.5 %, the same level of fidelity was not achieved for validation geometries v2 and v3 as shown in Table 6. Surface pressure prediction errors once again never exceed a maximum of 1.5 % for the low-thrust hover. Yet, this error is shown to now occur over a sufficiently larger region of the blade, thus resulting in a significant increase in integrated load error, raising FM prediction error from 0.77 % and 0.37 % for cases v2 and v3 of the high-thrust hover to 4.26 % and 4.25 % for the low-thrust hover. Results of the low-thrust-rotor case show that the capability of a POD ROM to make accurate load predictions is highly dependent on how well sampled the domain of interest is.
Table 6Summary of percent errors in the coefficient of thrust, torque, and figure-of-merit predictions using the POD ROM derived for low-thrust hover.
While this conclusion may be intuitive, properly achieving a level of sufficient sampling is not. Even in this relatively simple demonstration, it has been observed that by simply varying the rotor's collective, there was a significant increase in design space complexity. Driving this variation in complexity is the increased influence of rotor tip vortices on the wake, resulting in increased complexity in load distributions near the rotor's tip. The effects of the rotor tip vortices on POD ROM prediction capability can be observed as increased ROM prediction error in the near-tip region of the rotor. While this increase in complexity was not limiting to POD ROM reconstruction capabilities, it was shown to cause a significant deterioration in POD ROM prediction capabilities. Thus, as the design space complexity increased and domain sampling remained the same, an undersampling of λ in the low-thrust hover domain became apparent. These results highlight how often this task of achieving sufficient sampling of a domain may become an iterative task, requiring a further refinement of the sampling of the domain. To construct a more accurate ROM in the case of low-thrust hover, further sampling with new λ values in this domain is required.
Yet, even with the limited sampling on the domain, the POD ROM still provides reasonably accurate predictions once accounting for the significant reduction in computational expense in evaluating each validation case. For both high- and low-thrust hover, surface pressures as computed by CFD required 12 h of computing time across 440 cores. Meanwhile, the POD ROM was capable of making comparable predictions of surface pressures in just a fraction of a second on a single core. In addition, prior CFD sampling of the low-thrust hover domain indicated that local optimal FM was consistently located at λ=1.0 and thus resulted in an optimization dependent on finding an optimal θ. For the case of low-thrust hover, it was identified that the POD ROM was capable of providing reasonably accurate predictions for variations in θ. Given this prior knowledge of the domain and the significant reduction in computational expense, it became possible to directly apply this POD ROM to carry out a design optimization of the rotor blade to derive a local maximum of FM. Results showed that an optimal geometry of θ=21.7∘ and λ=1.0 for high-thrust hover and θ=10∘ and λ=1.0 for low-thrust hover could be found while taking 1 min of compute time on a single core. A total of 20 iterations were required to obtain the optimal solution. However, it should be noted that these optimal solutions found should not be viewed as true local optimal solutions. Despite the low prediction error identified during validation, the optimal solutions obtained still exist within a relatively non-linear subsection of the computational domain, a region which may require further sampling to sufficiently model. As such, the optimal solutions identified should rather be viewed as regions of interest for future sampling. Nonetheless, these results show that by sampling a given design space a POD ROM can be efficiently derived such that a low-cost and accurate model of the blade's surface pressures can be obtained and practically deployed to a relevant rotor design task.
In addition to providing an efficient means of identifying local optimal positions within a domain, the significant reduction to computational expense additionally provides the capability to efficiently obtain an increased understanding of the design space of interest. Given the high expense of CFD modeling, only a limited sampling of any domain of interest can be achieved. Yet, the results of this study have demonstrated how this limited sampling can be leveraged to obtain reasonably accurate, low-cost models capable of providing an increased understanding of the domain of interest. When analyzing surface plots for FM as computed via CFD, only a limited representation of the domain can be achieved. However, by leveraging a validated POD ROM, orders of magnitude more sampling points of the domain can be achieved, thus producing an increased resolution of the domain of interest. To demonstrate this capability, 900 additional samples of the domain were obtained via surface pressure predictions provided by the POD ROM and blade geometries generated through the study's grid generation algorithm. Results of this analysis are presented in Fig. 10. While this further analysis indicated that the local optimum of both CFD and POD ROM representation of the low-thrust hover domain results in the same local optimal FM, results for high-thrust hover highlight how a POD ROM can be leveraged to help possibly identify previously unknown optimal locations within the design space.
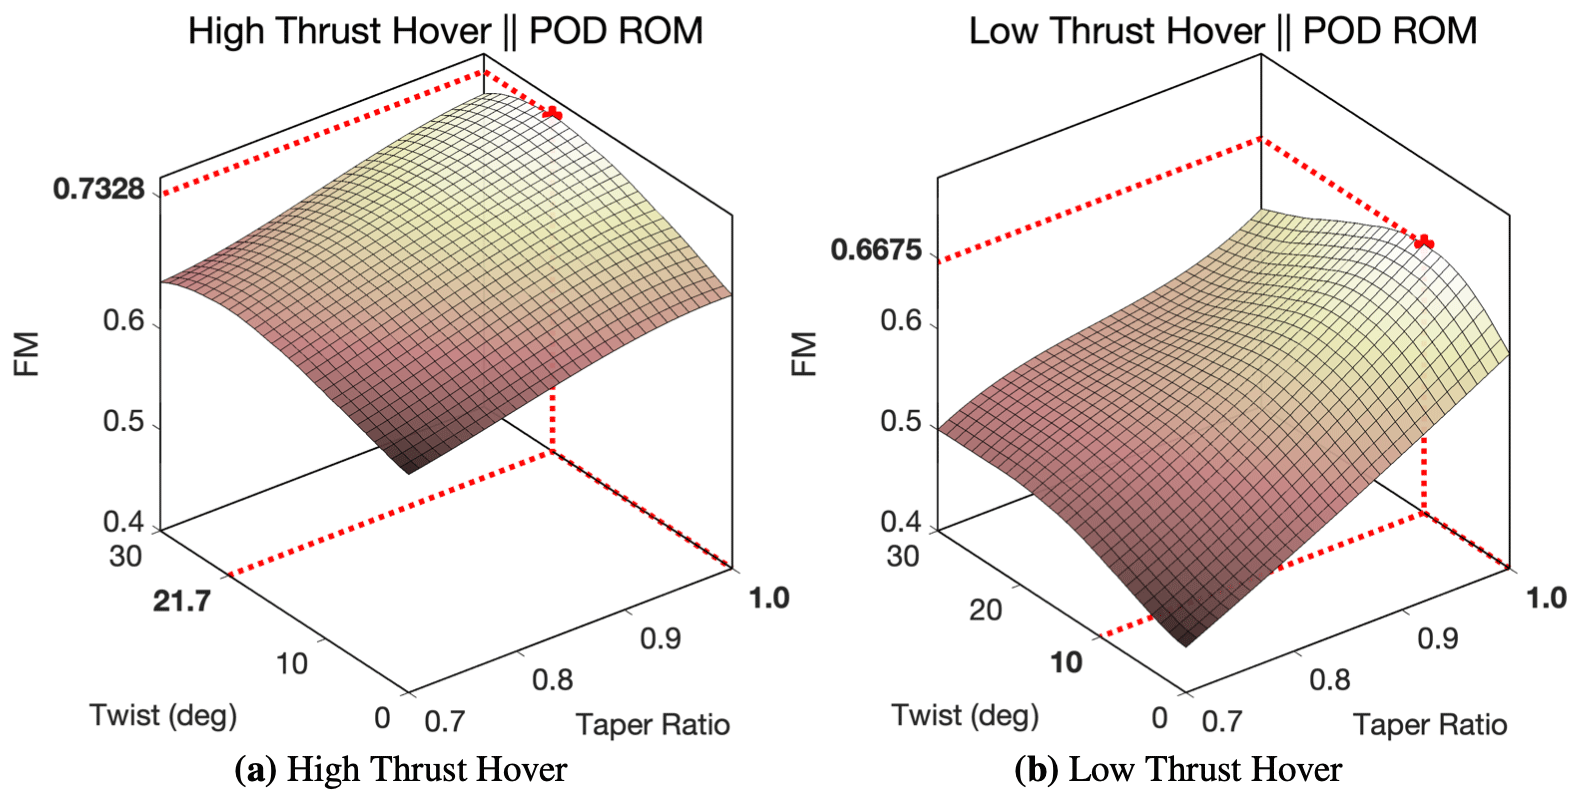
Figure 10Surface plot of FM with respect to θ and λ as computed through the POD ROM derived for high-thrust hover (a) and low-thrust hover (b).
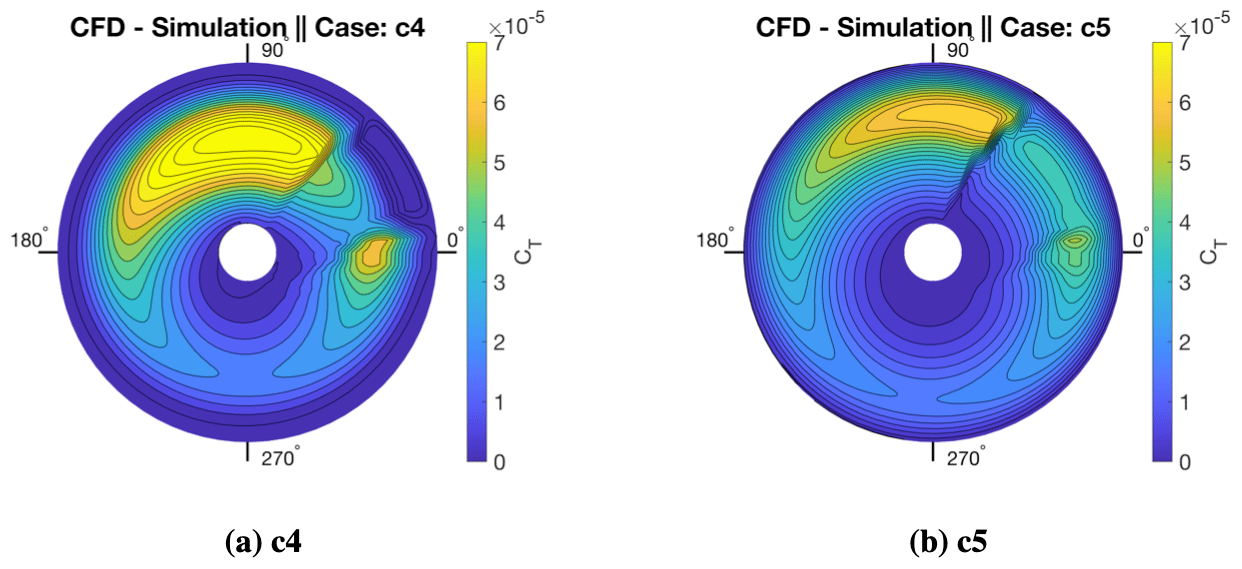
Figure 11Contours of CT as the blade rotates from an azimuth of 0 to 360∘. Incoming flow is entering from the 180∘ direction while blade is rotating counterclockwise.
4.2 Forward flight
Up to this point in the study, the focus has been placed on hovering-rotor blades. Given that these cases would produce a pressure distribution that is invariant to changes in the azimuth, the study could limit the focus of POD ROM modeling capability to spatial information and thus limit the snapshot matrix to a set of 16 snapshots. However, for practical implementation, it is essential to demonstrate the applicability of ROMs for both spatially varying and time-varying domains. As such, in this section, a POD-ROM-based surrogate model will be used for the prediction of the load distribution of a rotor in forward flight.
There are numerous challenges that may arise for extending the POD ROM to rotors in forward flight. The most prevalent of these is an increase in the non-linear relationship between design variables and surface pressures. To construct contour plots shown in Fig. 11, CT is computed locally at each radial station of the rotor at azimuth increments of 4.5∘. As shown in Fig. 11, case c4 (λ=1.0, θ=30∘) and case c5 (λ=0.9, θ=0∘) have widely differing CT distributions between an azimuth of 0–60∘ and a spanwise position up to . This variation is a result of flow separation occurring as the blade travels counterclockwise past the zero-azimuth position. From Fig. 11 it can be seen that through varying θ and λ, the degree to which flow will separate on the blade will vary greatly. This flow separation and reattachment provide a significant increase in dataset complexity which could potentially exacerbate the issue of the POD ROM either not having enough sample points to make meaningful interpolations or not being capable of representing the system with low mode retention counts. The latter of these issues will be addressed in the next section.
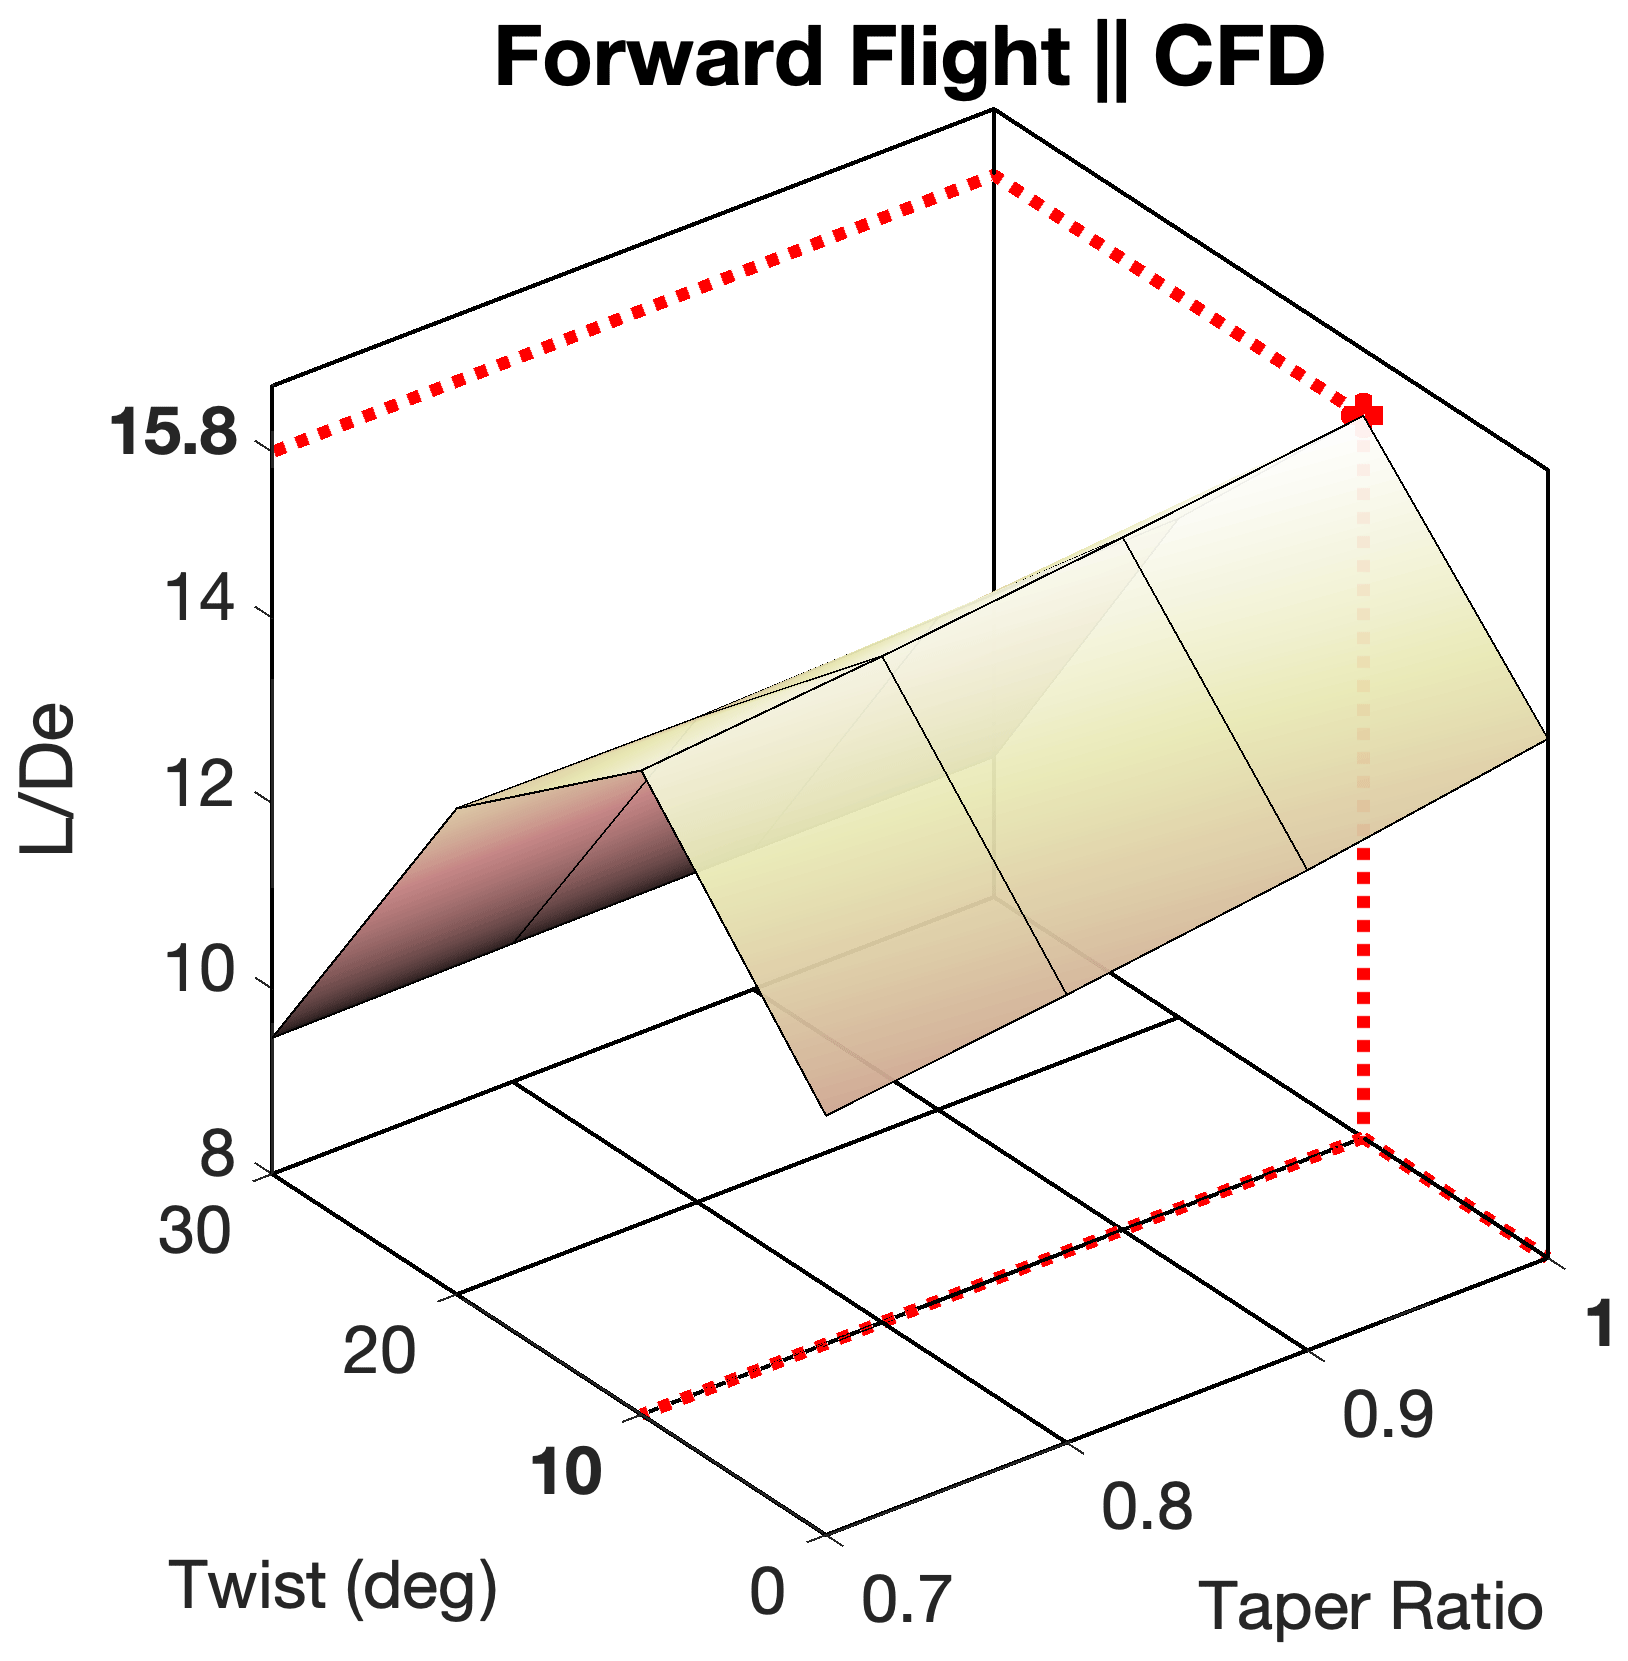
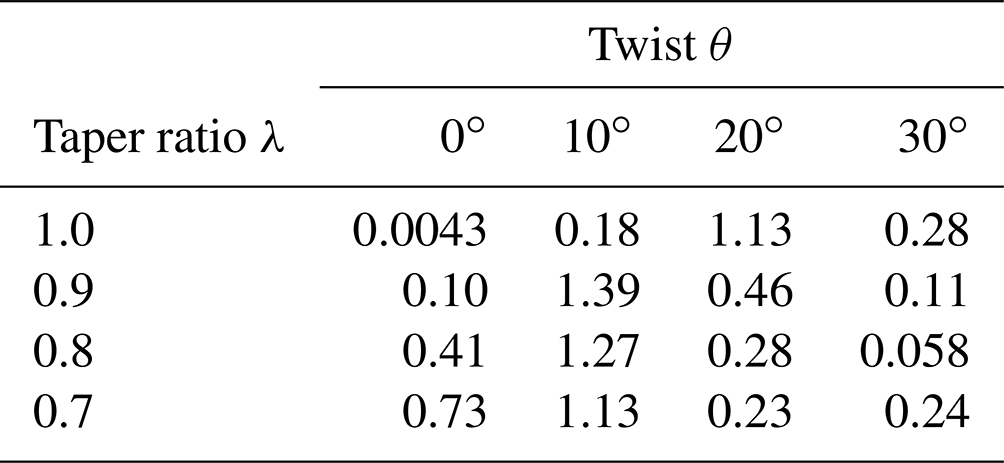
Contributing to the difficulties of modeling the forward-flight case are the differing influences λ and θ have on rotor . In Fig. 12 as computed from integrated CFD-modeled pressure loads is plotted versus λ and θ. Results demonstrate the significant parabolic influence θ has over blade load distributions. Rotor is shown to exponentially decrease as θ deviates from 10∘. This relationship is in contrast to the linear and relatively small influence λ has on . For the hovering-rotor cases, the POD ROM was shown capable of modeling a multi-variable system with each variable holding a varying degree of influence over the system. Yet, the forward-flight case provides a more extreme case of multi-variable modeling wherein there is clearly a dominant term in the domain. Thus, the modeling challenge present in the forward-flight case will include demonstrating that while the POD ROM is truncating low-energy information from the system, it does not truncate interdependencies between input parameters and blade surface pressure distributions.
4.2.1 Forward-flight ROM reconstruction
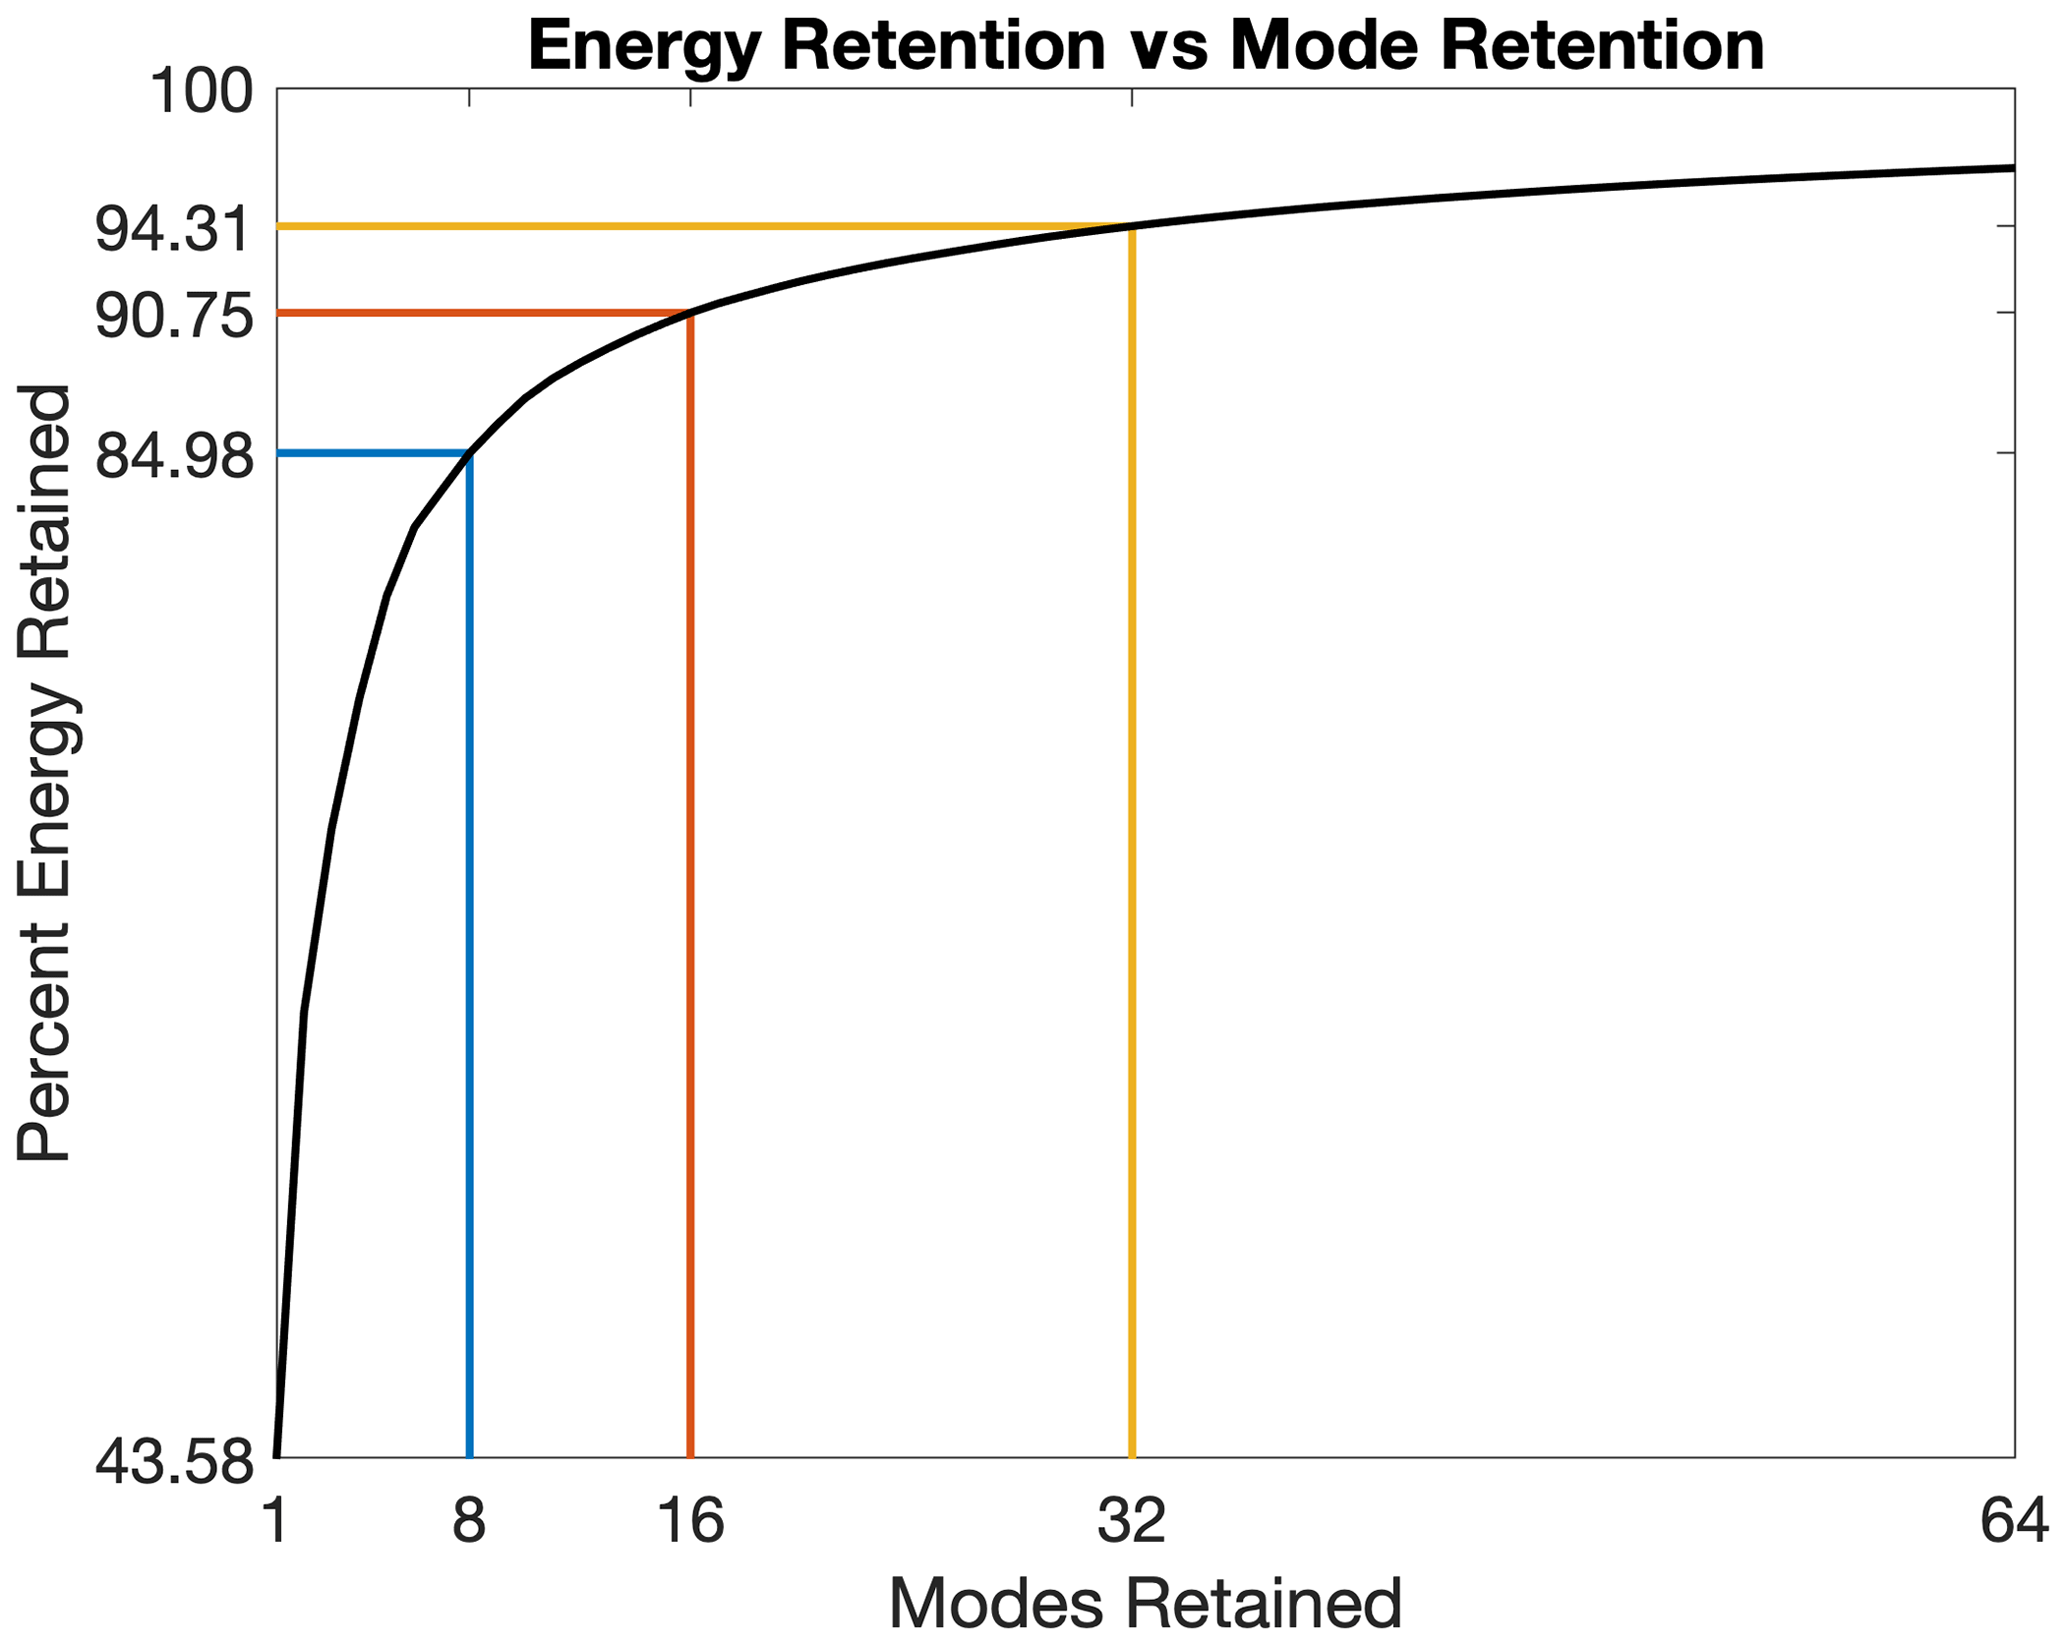
After all 16 forward-flight CFD simulations were completed, a single snapshot matrix was formed. To form this snapshot matrix, solutions for rotor pressure distributions were written every 4.5∘ such that sufficient resolution would be obtained to model both separation and reattachment flow at the correct azimuth angles. It should be noted that a sensitivity study comparing azimuth step size and ROM prediction capability was not completed in this work. Rather, the step size for variation in azimuth was selected to be comparable with step sizes utilized in typically leveraged reduced-representation rotor models such as actuator-line-based models. As a result, for each CFD simulation, 74 snapshots for rotor surface pressures were retained corresponding to a single snapshot matrix with 1184 snapshots. After completing this snapshot matrix, the POD algorithm was used and the percent energy retention per POD mode retention count was plotted, and results are presented in Fig. 13. Given the significant increase in energy content in the system in comparison to the hovering-rotor cases, energy retention was decreased to 90 % so as to avoid retaining an excessive number of POD modes. It was identified that 16 POD modes were required to hit this energy retention criterion.
After undergoing the POD algorithm and identifying the number of retained POD modes, the study projected these modes back to the original snapshot matrix to identify how well the domain of interest is represented with the selected mode count. Reconstructions and reconstruction error can be found in Figs. 14 and 15. This observation provides two important conclusions. First, through the addition of flow separation and a varying azimuth angle, the energy content in the training dataset has been expanded. This expansion in energy content has led to an increase in the mode retention count required to obtain independent reconstructions.
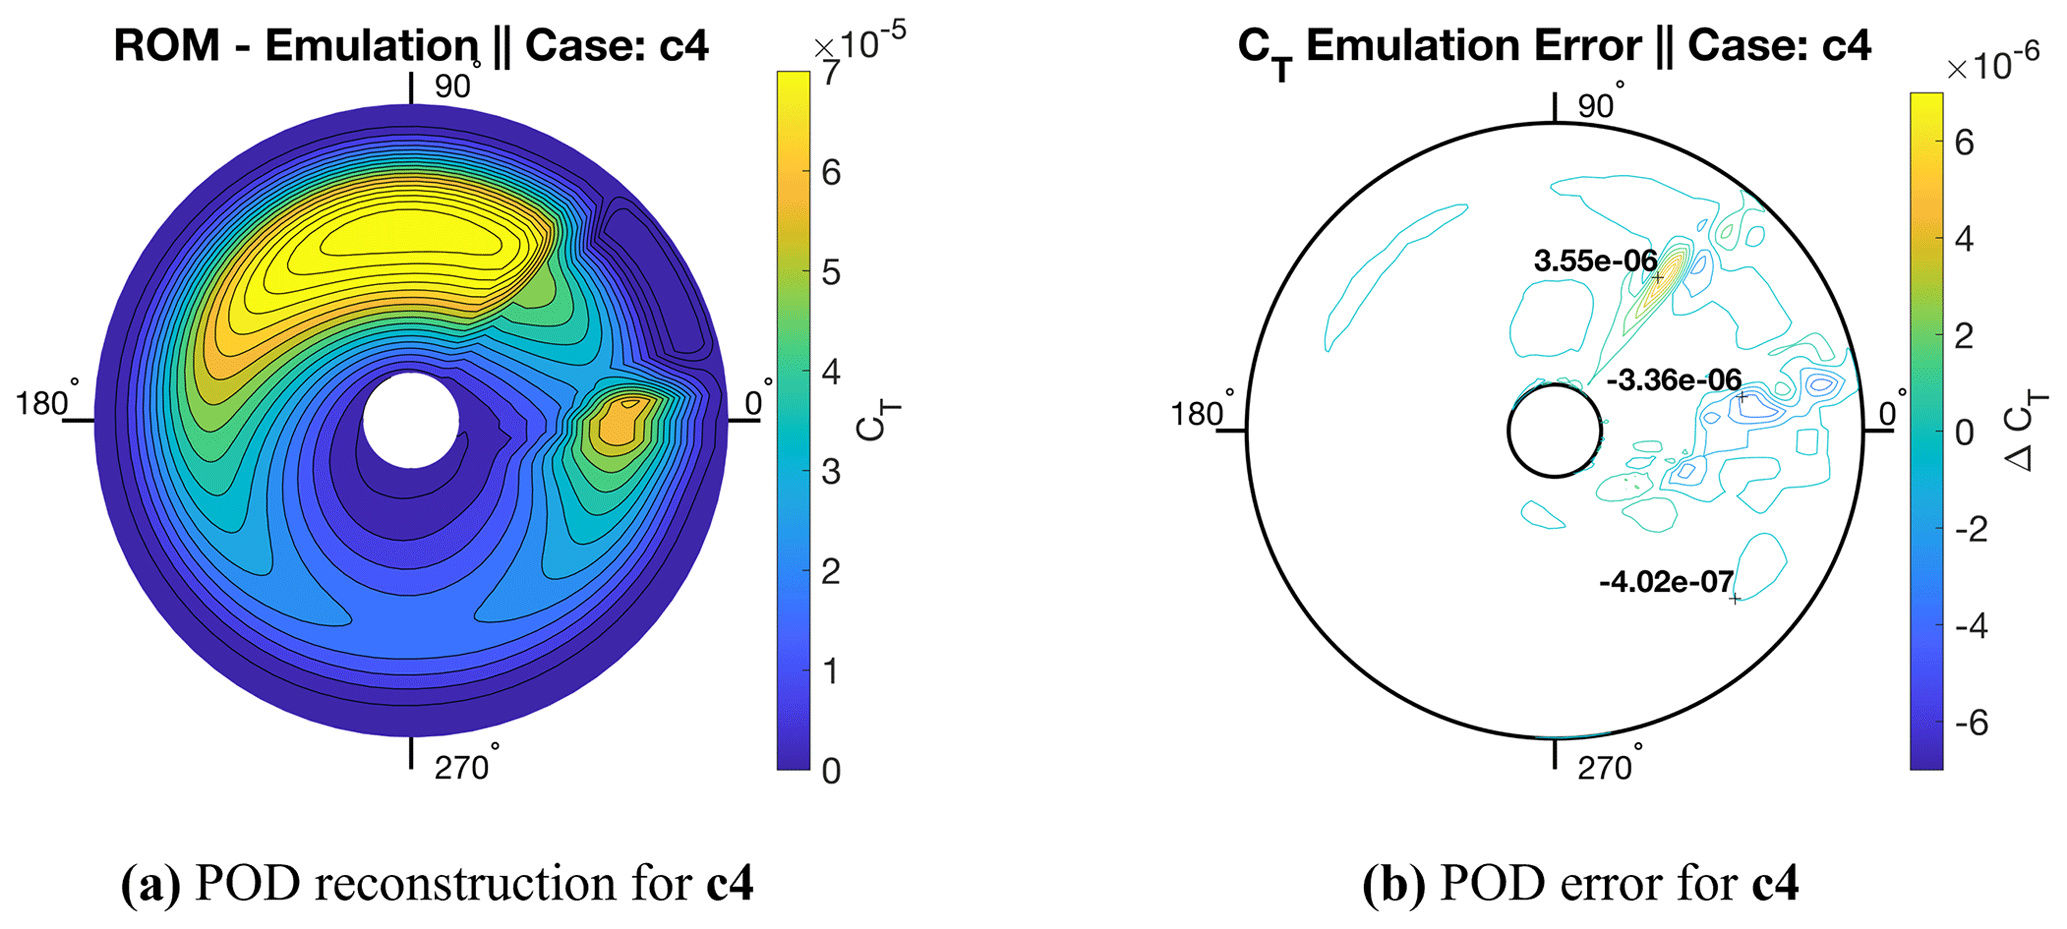
Figure 14Contours of POD reconstruction for the CFD data of Fig. 11a and error for CT as the blade rotates from an azimuth of 0 to 360∘. Incoming flow is entering from the 180∘ direction while the blade is rotating counterclockwise.
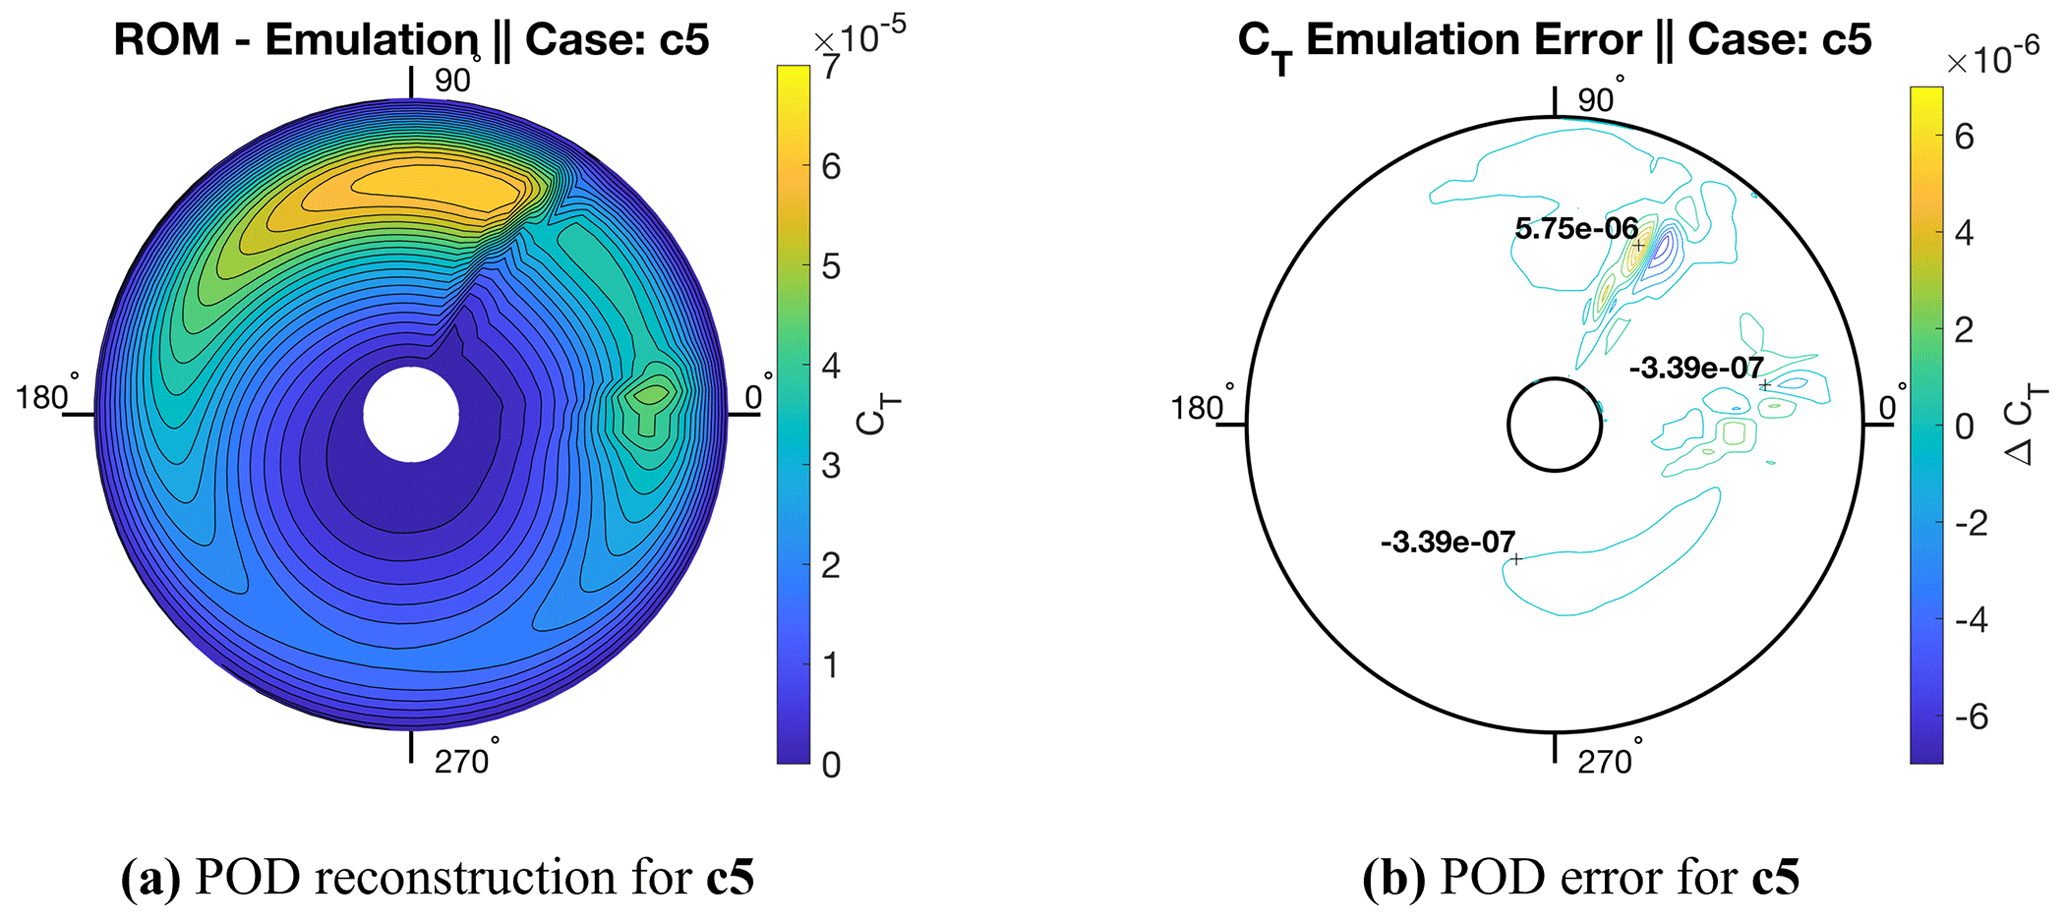
Figure 15Contours of POD reconstruction for the CFD data of Fig. 11b and error for CT as the blade rotates from an azimuth of 0 to 360∘. Incoming flow is entering from the 180∘ direction while the blade is rotating counterclockwise.
A second important observation is that despite the expansion in energy content, POD is shown to be capable of representing the full rotor disks of all 16 geometries with only 16 modes. For accurate reconstructions, modes retained were limited to modes with reasonably smooth variation with respect to θ and λ. These results highlight that the POD algorithm appears to be exceptionally well suited for applications modeling periodic pressure distributions of rotors. The maximum percent error of CT found for reconstructions of all 16 geometries was found to be below 0.1 %. Not only sectional CT values but also integrated values for were shown to be modeled accurately. The maximum percent error for reconstructions of all 16 geometries was found to be 1.39 %. Percent errors for all 16 geometries are outlined in Table 7. In the following section, the effect of increased distributed-load complexity on POD ROM prediction capabilities will be demonstrated.
Table 7Maximum percent error between CFD- and POD-ROM-computed for geometries c1 to c16.
4.2.2 Forward-flight ROM validation
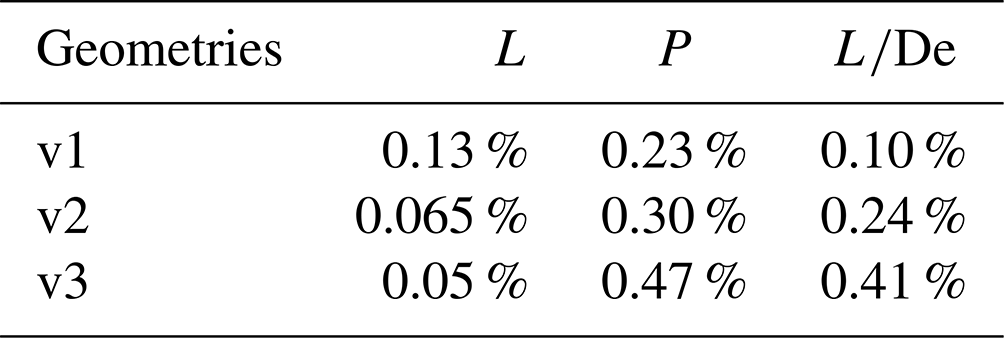
Further validation of the POD ROM in forward-flight predictions is produced for geometries v1, v2, and v3 and compared to CFD simulation. Both prediction and error contours of sectional CT for all three validation geometries are summarized in Fig. 16. Results show that for all three validation cases, the POD ROM makes reasonably accurate predictions for CT across the rotor's complete cycle. For the vast majority of the motion of the blade, load distributions are being predicted almost exactly. The distributed-load prediction error is largely limited to the correct prediction of flow separation and reattachment azimuth angle positions. Results demonstrate that once the flow is either separated or attached, the POD ROM is capable of producing reasonably accurate distributed-load predictions. In addition to comparing rotor disk CT, rotor performance predictions via integrated are compared between CFD simulation and POD ROM emulation. Results, shown in Table 10, demonstrate that the POD ROM is capable of providing reasonably accurate rotor performance predictions subject to variations in both twist and the taper ratios of the rotor. The maximum percent error never exceeds 0.50 % compared to CFD simulation.
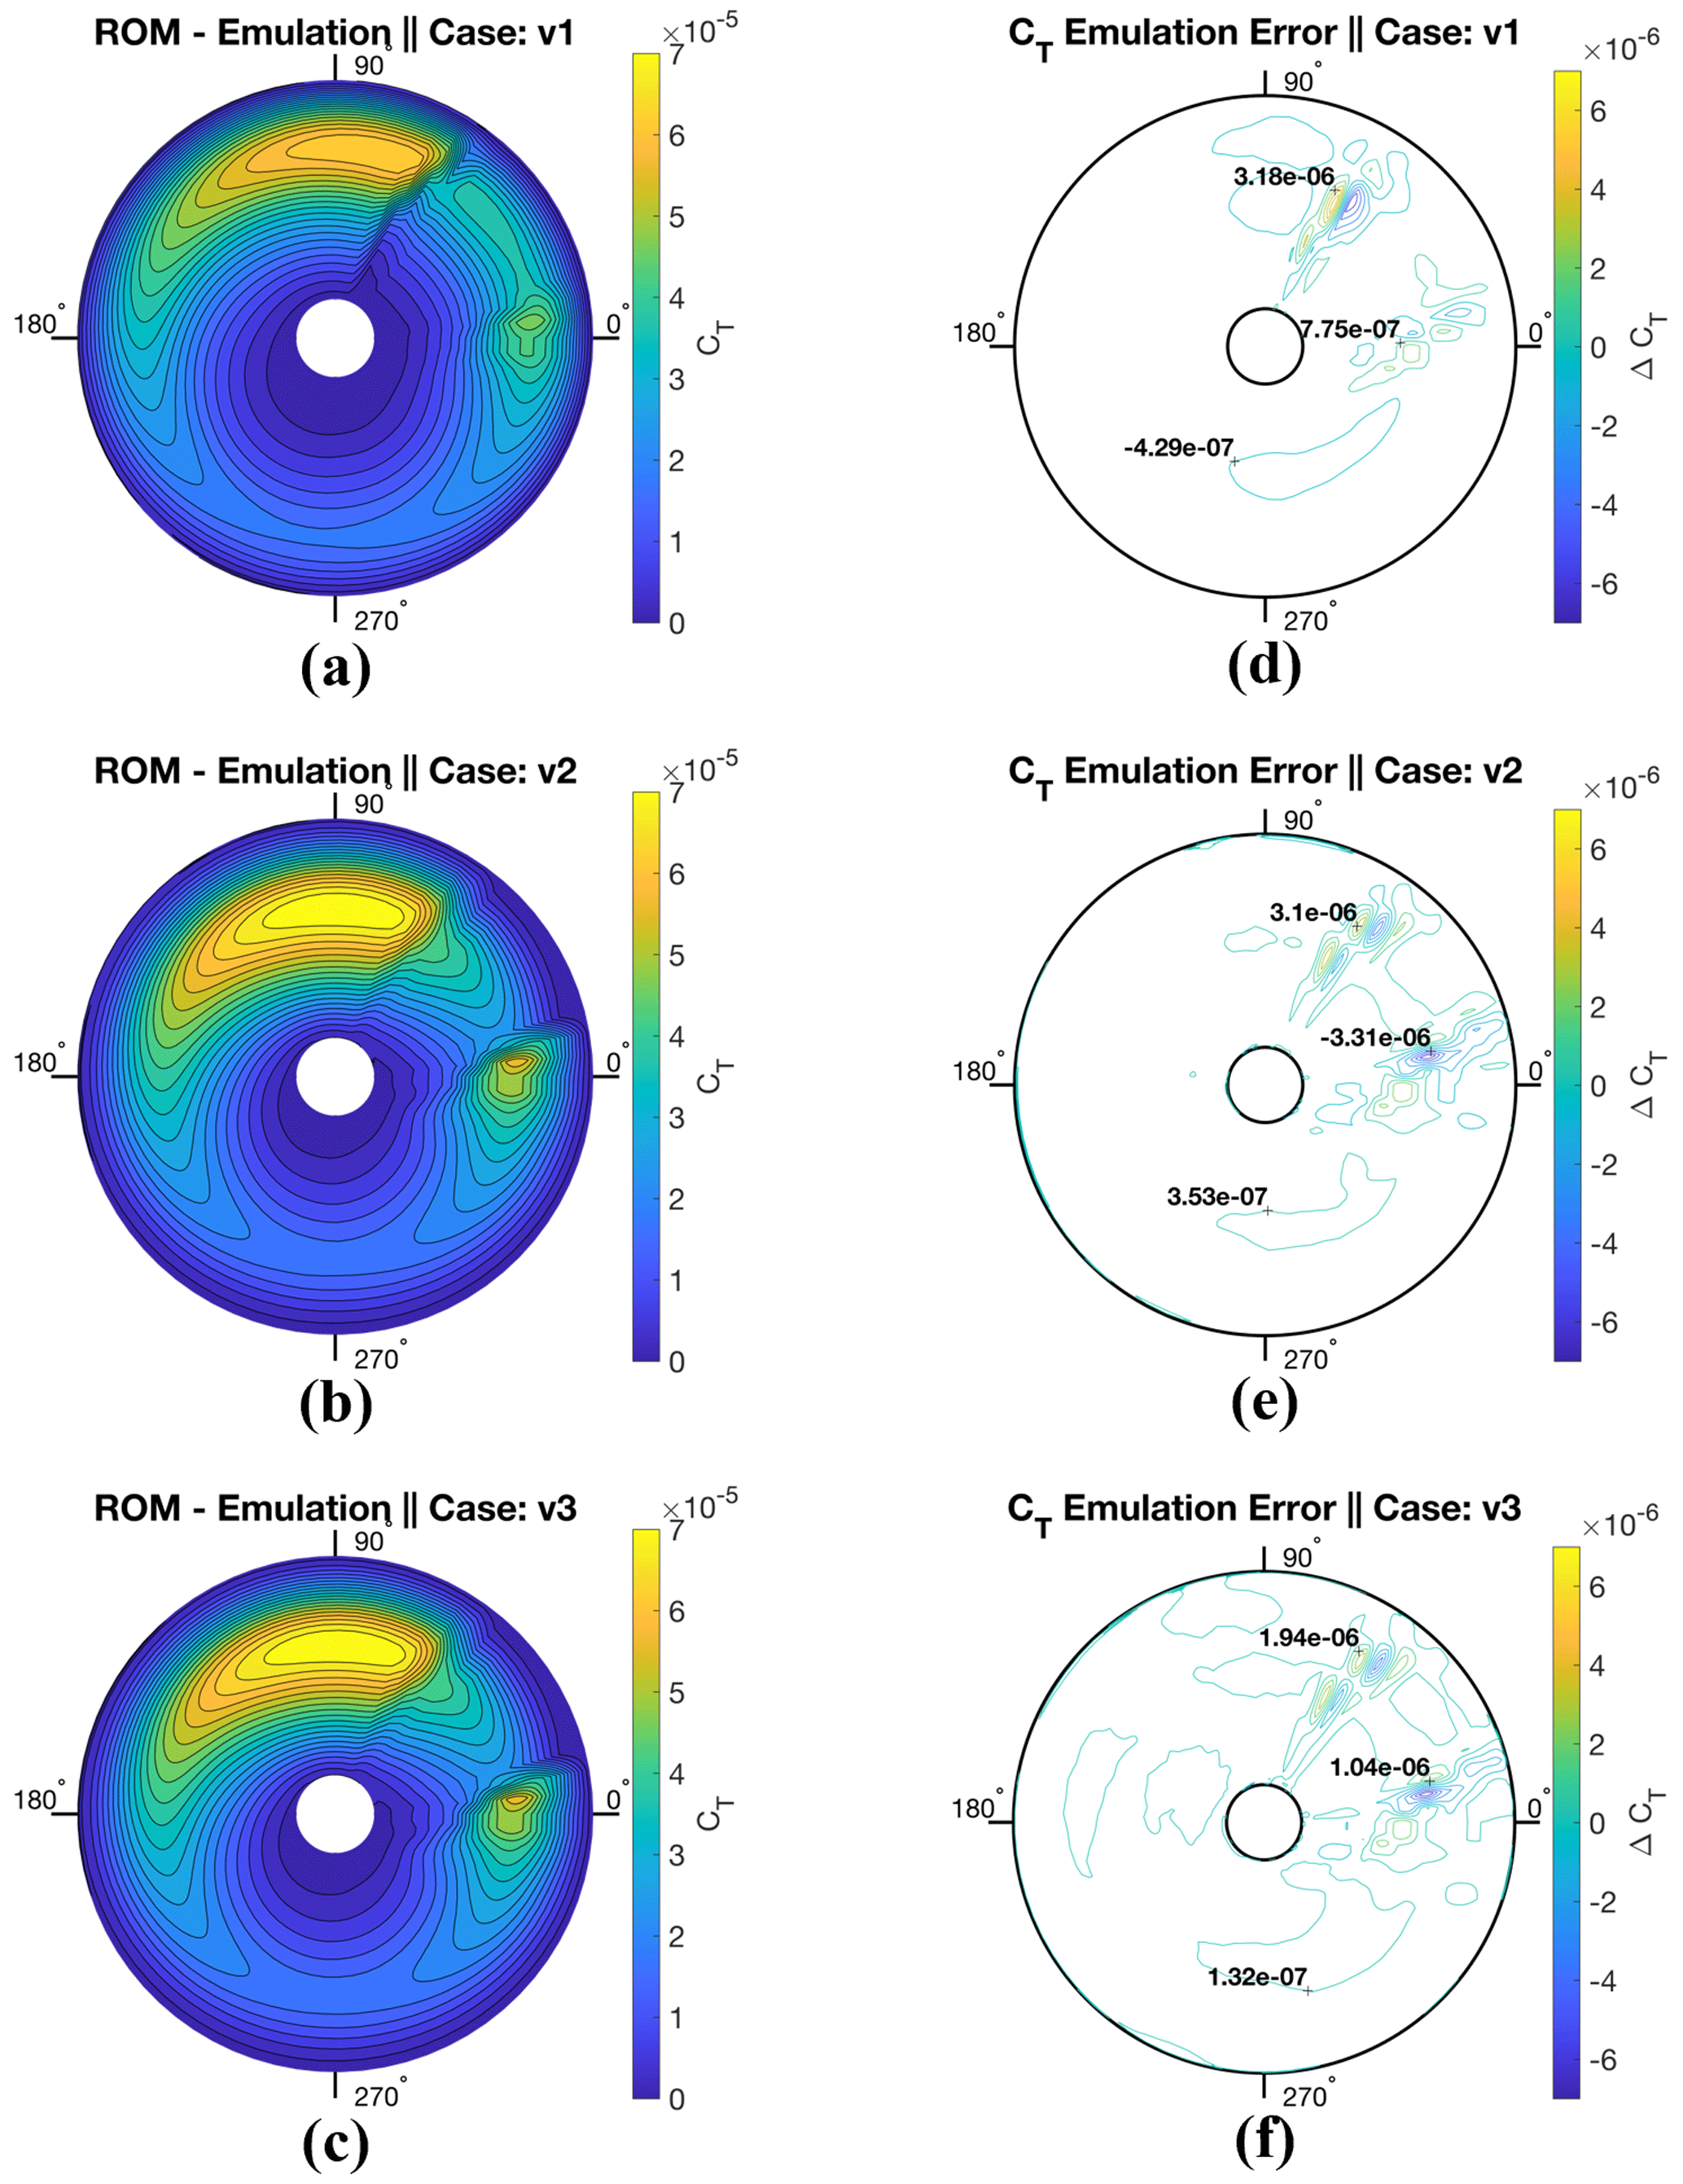
Figure 16Contours of POD ROM prediction and error compared to CFD using 16 sample cases for the rotor's coefficient of thrust, CT, as the blade rotates from an azimuth of 0 to 360∘. Incoming flow is entering from the 180∘ direction while the blade is rotating counterclockwise.
These observations underline the two critical takeaways from this study. First, if a modal decomposition algorithm is to be deployed for surface pressure modeling, it must be capable of efficiently representing a complex domain. In this study, it has been shown that for a wide variety of operating conditions, the POD algorithm performs exceptionally well at representing rotor surface pressures with minimum mode retention counts.
The second observation is that for the application of the POD ROM to rotor surface pressure modeling, a subspace must be sufficiently sampled such that the influence of design variables on load distributions is fully captured. It is important to note that prior knowledge of a system, particularly when applied to UAM aircraft, may be limited. As such, prior understanding of the required sample size may not be held, and an iterative approach must be taken to find the sufficient sampling size required for a POD ROM. When investigating the high-thrust rotor, this study found that 16 samples were sufficient to provide near-exact predictions for surface pressures. Yet, when considering the low-thrust rotor it was identified that while efficient reconstructions could be made through POD, more sampling conditions were required for accurate interpolations. This was due to an increase in design space complexity with respect to λ.
For the case of a rotor in forward flight, it was found that similarly to high-thrust rotors, the design space could be represented exceptionally well with the 16 sampling cases. Yet, a deeper analysis of POD modes demonstrates that the total number of CFD sampling cases required to model the rotor's disk could be further reduced. In Fig. 18a through c, variation in POD modes 1, 2, and 8 with respect to θ and λ is plotted. Results indicate that initial POD modes linearly vary within the system, while for mode counts 8 and up the mode relationship to design variables becomes significantly non-linear. These results highlight that the majority of the energy for the rotor in forward flight varies linearly. To demonstrate the dominance of linearly determined variance in the system, a POD ROM was derived from retaining just four sampling points, cases c1, c4, c13, and c16, thus producing only a linear mapping. In Fig. 17, CT errors are presented for all three validation cases once only four sampling conditions are used. Results for sectional CT integrated from the POD ROM surface pressure predictions are comparable to those obtained when using all 16 CFD simulation sampling points. Results, presented in Table 8, also demonstrate that an accurate representation of total integrated lift can be obtained from the derived model with percent errors for rotor lift predictions never exceeding 1 %. Yet, while rotor lift predictions were shown to retain a reasonable degree of fidelity, there was a significant deviation in rotor power predictions. Thus, the results of this analysis indicated that rotor lift performance is dominated by linearly varying high-energy POD modes, while rotor drag performance is dominated by the non-linear low-energy POD modes.
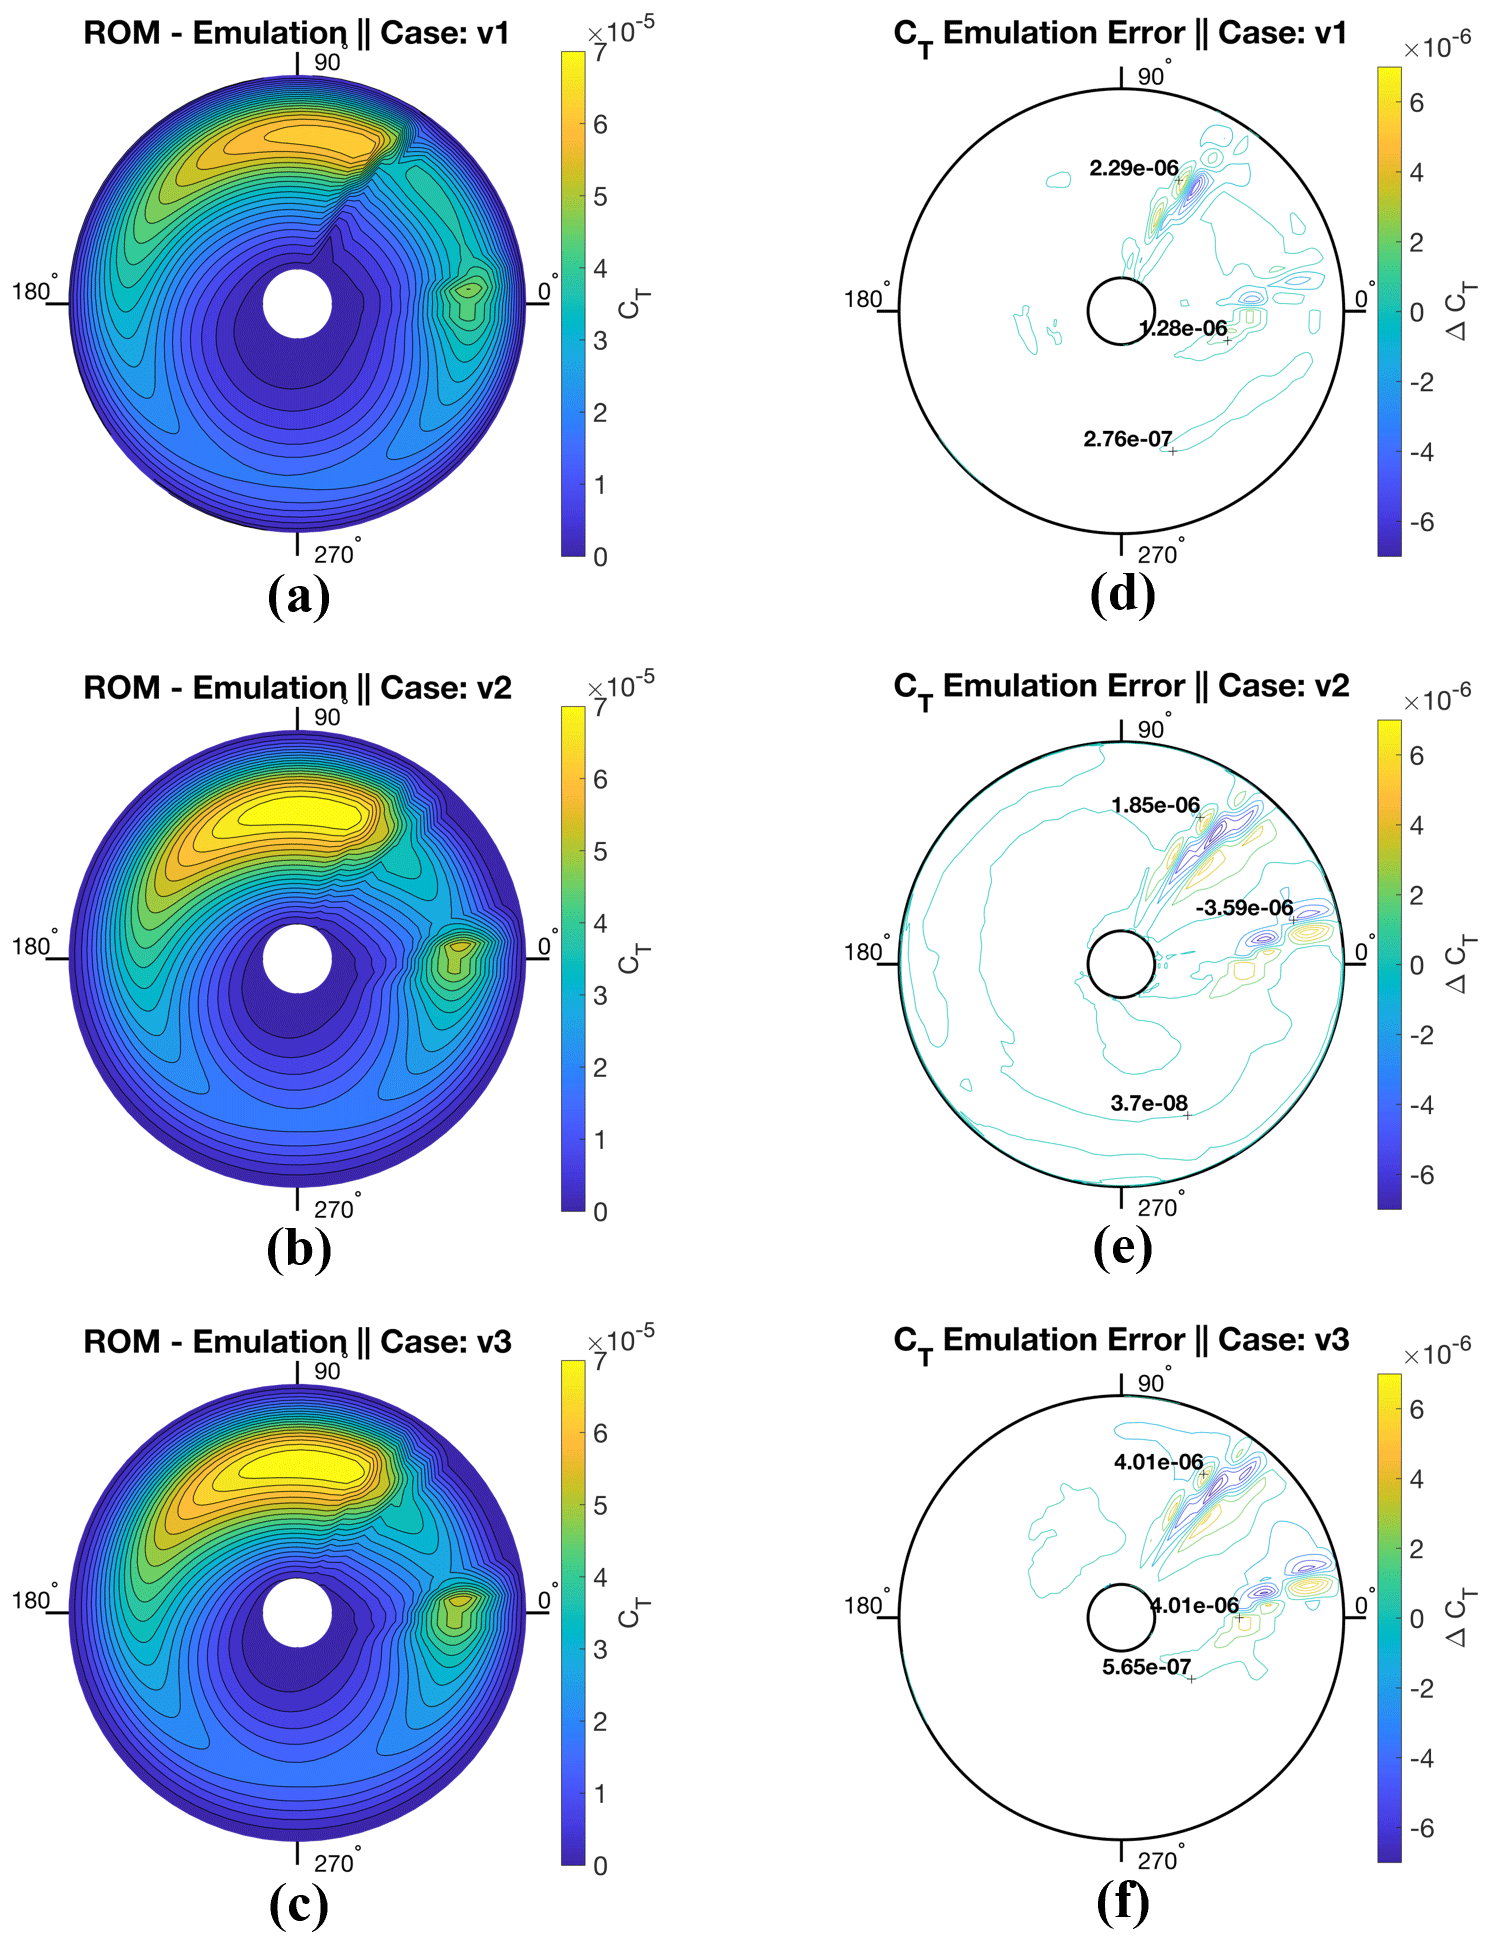
Figure 17Contours of POD ROM prediction and error compared to CFD using four sample cases for the rotor's coefficient of thrust, CT, as the blade rotates from an azimuth of 0 to 360∘. Incoming flow is entering from the 180∘ direction while the blade is rotating counterclockwise.
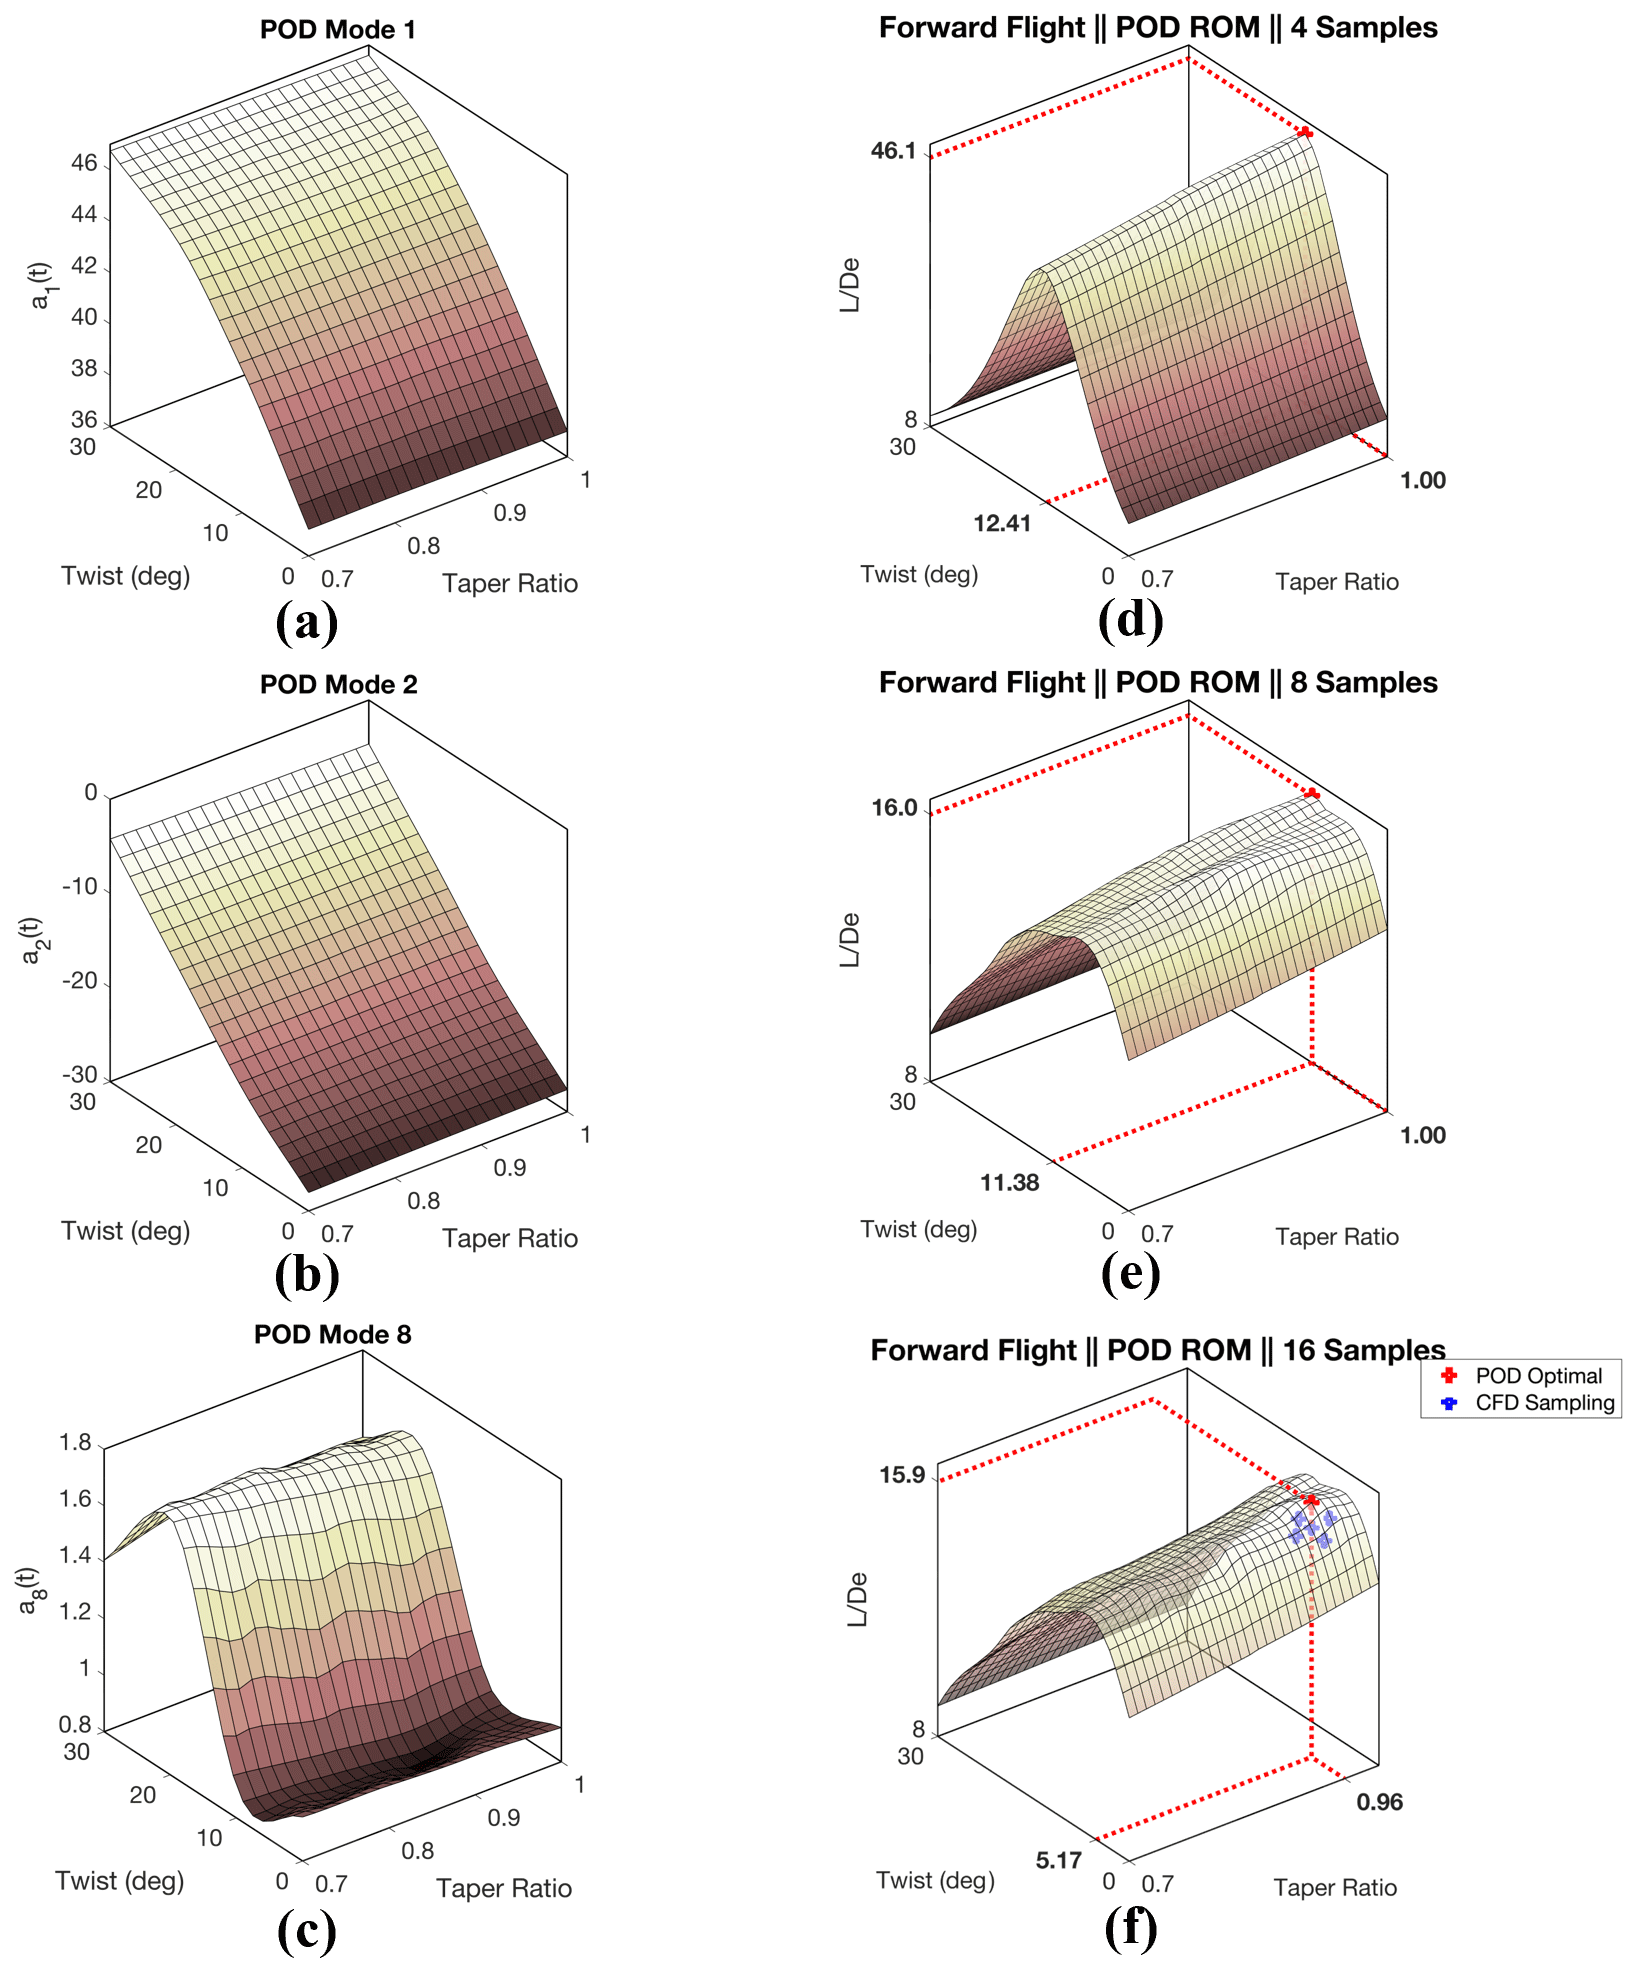
Figure 18(a–c) Surface plots showing both linear and spline representation of POD modes 1, 2, and 8. (d–f) Surface plot of with respect to θ and λ as computed through the POD ROM derived from 4 sampling points (d), 8 sampling points (e), and 16 sampling points (f).
Table 8Summary of percent errors in lift (L), power (P), and predictions using the POD ROM from four training points.
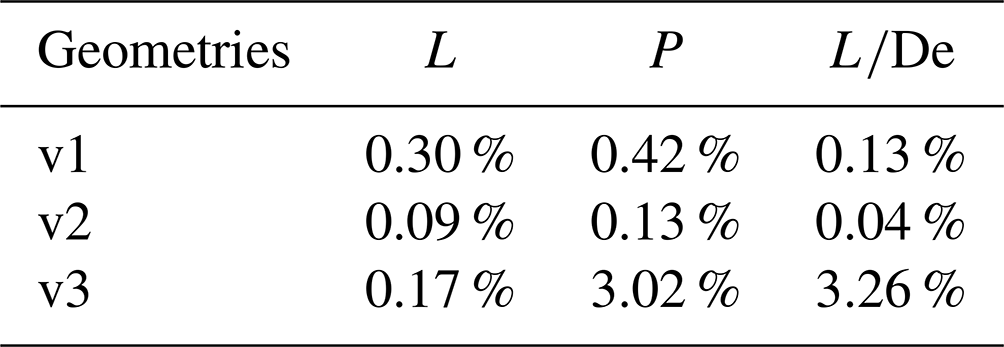
To improve power performance predictions of the POD ROM, the number of sampling points can be increased such that an accurate representation of the non-linear variation in the low-energy POD modes can be obtained. It should be noted that this non-linear variation is limited to variation in the θ space. As such, to achieve this increased representation of low-energy POD mode variation, a combination of four θ and two λ sampling points were retained such that a POD ROM was derived from cases c1, c2, c3, c4, c13, c14, c15, and c16. Results for rotor performance predictions with this POD ROM are presented in Table 9 and demonstrate that despite halving the number of sampling points from 16 to 8, similar levels of fidelity for rotor performance predictions can still be achieved.
Table 9Summary of percent errors in lift (L), power (P), and predictions using the POD ROM from eight training points.
Just as in the hovering cases, there was a significant reduction in computational expense obtained when using the reduced model. The POD ROM evaluation of rotor surface pressures across the entire periodic motion took a fraction of a second on a single core. Meanwhile, the CFD simulation required 20 h on 440 cores. Once the reduced model was applied to the design optimization of the rotor such that local optimal was obtained, an optimal solution was found within 10 min of computing time on a single core. Results of this optimization, along with surface mappings constructed from obtaining 900 additional rotor performance predictions of the domain, are plotted in Fig. 18 for the POD ROM derived from 4, 8, and 16 CFD sampling points. All three optimization results hint at a significant capability of the POD ROM to efficiently extract meaningful information from a domain of interest with limited sampling such that a greater understanding of the design space can be obtained. In Fig. 18d, it is shown that despite only ever sampling the corners of the domain and thus deriving linear relationships, the non-linear influence that θ holds over rotor performance can still be captured. While this influence is exaggerated in magnitude, resulting from inconsistencies in modeling power requirements, the overall trend of this influence is preserved such that a previously unknown local optimal solution in the area of θ=12.4∘ and λ=1 can be obtained. By doubling the sampling size from four to eight, shown in Fig. 18e, it can be seen that not only can a relevant local optimal design point be identified but also a higher level of fidelity can be achieved for performance predictions. Through further increasing sampling of the domain, shown in Fig. 18f, it is hinted that there perhaps exist additional local optimal solutions within the design space as θ goes from 6 to 12∘ and λ goes from 0.7 to 1. While the POD ROM derived from all 16 sampling points identified a local optimal solution of at θ=6.21∘ and λ=0.96, the second optimal solution found using this model was at θ=11.5∘ and λ=1. The second optimal solution found using the POD ROM derived from 16 sampling points was less than a single degree off from the optimal solution obtained using only 4 sampling points.
However, caution must be exercised even when the POD ROM derived from all 16 sampling points is leveraged for optimization. Results presented in Table 10 demonstrate a reasonable degree of fidelity in ROM-integrated performance predictions for a variety of test cases. However, in Fig. 18f it is observed that there exists a significant increase in the complexity of the design space near the identified optimal point. It is further observed that, unlike in previous cases, this increased complexity is not limited to variations in θ but additionally appears in λ, leading to several local optimal solutions being predicted. While previous steps were taken to validate the surrogate model, results presented in Fig. 18f indicate all three validation cases exist within the largely linearly varying sub-region of the domain. Of additional concern is the low rate of CFD sampling that exists within the range θ=5∘ to 15∘ and λ=0.9 to 1.0, a sub-region of the domain with just two CFD samplings. As such, it becomes challenging to know if local optimal points identified are truly meaningful insights into the design space or simply the result of erroneous superpositioning of POD modes.
Table 10Summary of percent errors in lift (L), power (P), and predictions using the POD ROM from 16 training points.
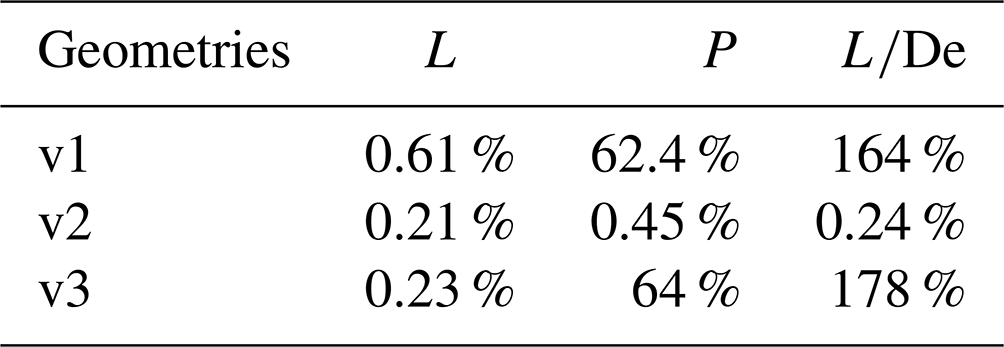
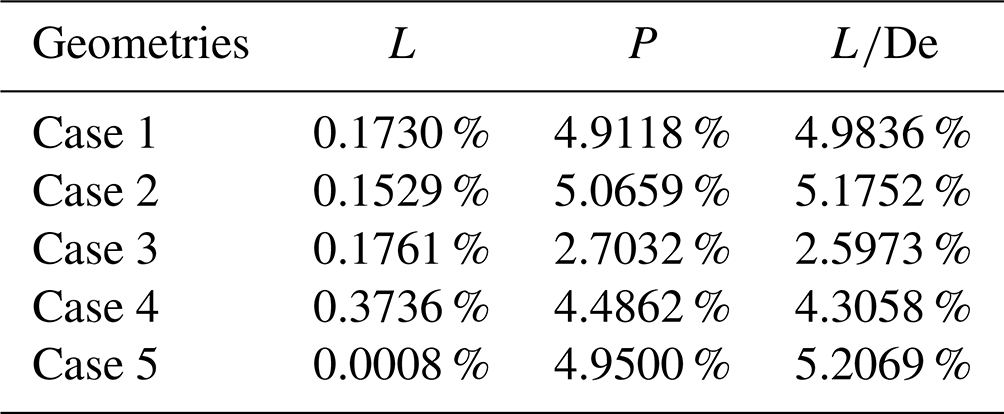
To address this concern and gain further insight into the domain, five additional CFD simulations were completed. Rotor geometries for each case are summarized in Table 3. Percent error between POD ROM and CFD simulation performance predictions are presented in Table 11. Additionally, for all five additional simulations are plotted in Fig. 18f. Results indicate that concerns regarding undersampling are valid. It is demonstrated that, as a result of erroneous POD mode superpositioning by the ROM, emulated non-linearities with respect to λ are non-physical. Rather, was found to continuously increase as λ increases. Once again, it was identified that while rotor lift performance metrics could adequately be modeled, noticeable discrepancies existed with respect to the power required.
Table 11Summary of percent errors in lift (L), power (P), and predictions using the POD ROM from 16 training points compared to geometries outlined in Table 3.
The results of this final analysis demonstrate a common theme of caution which must be exercised whenever a data-driven ROM is implemented. In some cases, a derived ROM may be capable of providing further insight into the domain than the limited sampling may allow. For example, results presented in Fig. 18d indicated that there existed a local optimal twist solution around a twist of ∼12∘. Further sampling of the domain indicated that this insight into the design space was largely correct. In other cases, the derived ROM may improperly predict non-physical features providing incorrect insight. Results presented in Table 11 clearly indicate that the POD ROM is improperly modeling λ's influence on the domain. Yet, even in this case, further analysis indicated the POD ROM was still providing potentially improved insight into the domain. By only observing the CFD simulation results in Fig. 12, there appears to be a linear transition from θ=10 to 0∘. Yet, further CFD samplings presented in Table 11 indicated that there is potentially a rapid increase in before plateauing at around 5∘ twist. This phenomenon is additionally observed in the POD ROM predictions for constant λ=0.7, 0.8, 0.9, and 1.0. Additionally, this further sampling seemed to indicate a true local optimal solution similar to results predicted in Fig. 18d and e. These results appear to back the claim that erroneous superpositioning of POD modes when 16 samples are leveraged is leading to increases in local error in limited regions of the domain. However, to validate these findings, once again further sampling is required. As is the case with any data-driven model, it becomes essential that insight gained when leveraging the ROM is validated against additional sampling. As such, derived ROMs must be viewed by design engineers as useful tools for informing future sampling of the domain rather than taken as final predictions.
In this study, a POD ROM was applied to three demonstration cases for distributed-pressure-load predictions of a single-blade model rotor. Namely, these cases were high-thrust hovering rotor, low-thrust hovering rotor, and rotor in forward flight. For each of these cases, the blade twist and taper ratio were varied such that 16 blade geometries were used. All three POD-based surrogate ROMs were shown to produce highly accurate predictions for surface pressure distributions. For both high-thrust-rotor and forward-flight ROMs, the maximum integrated load coefficient prediction error was below 1%. The error was increased for the low-thrust-rotor ROM but still limited to below 4.3 %. When the POD ROM was implemented, the computational expense was significantly decreased. For the hovering rotor, the expense was reduced from 12 h on 440 cores for CFD simulation to just a fraction of a second on a single core for ROM predictions. For the forward-flight rotor, the expense was reduced from 20 h on 440 cores to less than a second on a single core when the POD ROM was implemented. The expense was reduced to the extent that a design optimization became feasible for both hovering and forward-flight demonstration cases. Results demonstrated how a POD ROM could be efficiently derived and deployed to model a complex design space to a high degree of fidelity. Additionally, it was demonstrated how this surrogate model could be both leveraged to quickly find potential optimal design points within the space and used to gain an enhanced understanding of the domain of interest.
While the present work provides strong evidence for the feasible application of POD ROMs to wind turbines and rotorcraft, there are still several future steps remaining for understanding POD ROM difficulties in rotor modeling. POD ROM modeling of multiblade rotors with realistic geometries and control surface coupling could be attempted. Future steps should also be taken to include wind farms operating with multiple rotor configurations. Additionally, CFD simulations should be completed using more complex operating conditions, such as turbulent inflows. By including these two modeling choices, a broader range of length scales will be introduced into the training dataset, thus testing POD-based surrogate ROMs' capability for efficiently extracting meaningful information in increasingly complex domains.
Codes are available upon request.
We will provide access to datasets upon request.
NP ran all CFD simulations and generated all surrogate models presented for this study. JE provided valuable insight during the generation of surrogate models, and CS assisted in devising relevant demonstration cases of surrogate modeling applied to rotors.
The contact author has declared that none of the authors has any competing interests.
Publisher's note: Copernicus Publications remains neutral with regard to jurisdictional claims in published maps and institutional affiliations.
The authors would like to thank Andrew Wissink and Ethan Romander for their insight into best practices when using the OVERFLOW and CREATE-AV Helios codes. The authors would additionally like to thank Haley Cummings, Ethan Romander, and William Warmbrodt of the NASA Ames Aeromechanics Branch for their invaluable feedback on this paper.
This paper was edited by Jennifer King and reviewed by two anonymous referees.
Abhishek, A., Ananthan, S., Baeder, J., and Chopra, I.: Prediction and Fundamental Understanding of Stall Loads in UH-60A Pull-Up Maneuver, J. Am. Helicopt. Soc., 56, 1–14, https://doi.org/10.4050/JAHS.56.042005, 2011. a
Abras, J. and Hariharan, N. S.: Machine Learning Based Physics Inference from High-Fidelity Solutions: Vortex Classification and Localization, in: AIAA Scitech 2022 Forum, 3–7 January, San Diego, CA, p. 310, https://doi.org/10.2514/6.2022-0310, 2022. a
Ali, N. and Cal, R. B.: Data-driven modeling of the wake behind a wind turbine array, J. Renew. Sustain. Energ., 12, 033304, https://doi.org/10.1063/5.0004393, 2020. a
Ali, N., Kadum, H. F., and Cal, R. B.: Focused-based multifractal analysis of the wake in a wind turbine array utilizing proper orthogonal decomposition, J. Renew. Sustain. Energ., 8, 063306, https://doi.org/10.1063/1.4968032, 2016. a
Ali, N., Cortina, G., Hamilton, N., Calaf, M., and Cal, R. B.: Turbulence characteristics of a thermally stratified wind turbine array boundary layer via proper orthogonal decomposition, J. Fluid Mech., 828, 175–195, https://doi.org/10.1017/jfm.2017.492, 2017. a
Ali, N., Calaf, M., and Cal, R. B.: Clustering sparse sensor placement identification and deep learning based forecasting for wind turbine wakes, J. Renew. Sustain. Energ., 13, 023307, https://doi.org/10.1063/5.0036281, 2021. a
Anusonti-Inthra, P.: Full Vehicle Simulations for a Coaxial Rotorcraft using High-Fidelity CFD/CSD Coupling, in: 2018 AIAA Aerospace Sciences Meeting, 8–12 January, Kissimmee, FL, p. 0777, https://doi.org/10.2514/6.2018-0777, 2018. a
Ashwin Renganathan, S., Maulik, R., Letizia, S., and Iungo, G. V.: Data-driven wind turbine wake modeling via probabilistic machine learning, Neural Comput. Appl., 34, 6171–6186, https://doi.org/10.1007/s00521-021-06799-6, 2022. a
Benek, J. A., Steger, J. L., and Dougherty, F. C.: Chimera: a grid-embedding technique, Vol. 85., No. 64, Arnold Engineering Development Center, Air Force Systems Command, United States Air Force, https://apps.dtic.mil/sti/pdfs/ADA167466.pdf (last access: November 2021), 1986. a
Brunton, S. L. and Kutz, J. N.: Data-Driven Science and Engineering: Machine Learning, Dynamical Systems, and Control, Cambridge University Press, https://doi.org/10.1017/9781108380690, 2019. a
Buning, P., Chiu, I., Obayashi, S., Rizk, Y., and Steger, J.: Numerical Simulation of the Integrated Space Shuttle Vehicle in Ascent, in: 15th Atmospheric Flight Mechanics Conference, 15–17 August 1988, Minneapolis, MN, USA, Minneapolis, MN, 4359, https://doi.org/10.2514/6.1988-4359, 1988. a
Camp, E. H. and Cal, R. B.: Low-dimensional representations and anisotropy of model rotor versus porous disk wind turbine arrays, Phys. Rev. Fluids, 4, 024610, https://doi.org/10.1103/PhysRevFluids.4.024610, 2019. a
Chan, W. M., Chiu, I. T., and Buning, P. G.: User's Manual for the HYPGEN Hyperbolic Grid Generator and the HGUI Graphical User Interface, NASA TM-108791, NASA, https://ntrs.nasa.gov/citations/19940011311 (last access: November 2021), 1993. a
Chan, W. M.: Advances in Software Tools for Pre-Processing and Post-Processing of Overset Grid Computations, in: Proceedings of the 9th International Conference on Numerical Grid Generation in Computational Field Simulations, 11–18 June 2005, San Jose, California, 2005. a
Chang, Y.-H., Zhang, L., Wang, X., Yeh, S.-T., Mak, S., Sung, C.-L., Jeff Wu, C., and Yang, V.: Kernel-Smoothed Proper Orthogonal Decomposition–Based Emulation for Spatiotemporally Evolving Flow Dynamics Prediction, AIAA J., 57, 5269–5280, https://doi.org/10.2514/1.J057803, 2019. a
Chau, R.: Process and Packaging Innovations for Moore's Law Continuation and Beyond, in: 2019 IEEE International Electron Devices Meeting (IEDM), 7–11 December, San Francisco, CA, 1–1, https://doi.org/10.1109/IEDM19573.2019.8993462, 2019. a
Cinquegrana, D. and Vitagliano, P. L.: A Reduced Order Model for Boundary Layer Ingestion Map Prediction at Fan Inlet of Rear-Mounted Engine Nacelle, in: AIAA Scitech 2021 Forum, 11–15 January 2021, p. 0993, https://doi.org/10.2514/6.2021-0993, 2021. a
Cizmas, P. G. and Palacios, A.: Proper Orthogonal Decomposition of Turbine Rotor-Stator Interaction, J. Propuls. Power, 19, 268–281, https://doi.org/10.2514/2.6108, 2003. a
Colella, M., Saltari, F., Pizzoli, M., and Mastroddi, F.: Sloshing reduced-order models for aeroelastic analyses of innovative aircraft configurations, Aerosp. Sci. Technol., 118, 107075, https://doi.org/10.1016/j.ast.2021.107075, 2021. a
Conley, S. and Shirazi, D.: Comparing Simulation Results from CHARM and RotCFD to the Multirotor Test Bed Experimental Data, in: AIAA Aviation 2021 Forum, virtual event, p. 2540, https://doi.org/10.2514/6.2021-2540, 2021. a
Crozon, C., Steijl, R., and Barakos, G.: Coupled Flight Dynamics and CFD-Demonstration for Helicopters in Shipborne Environment, Aeronaut. J., 122, 42–82, https://doi.org/10.1017/aer.2017.112, 2018. a
De Cillis, G., Cherubini, S., Semeraro, O., Leonardi, S., and De Palma, P.: Data Driven Modal Decomposition of the Wake Behind an NREL 5-MW Wind Turbine, in: 14th European Conference on Turbomachinery Fluid dynamics & Thermodynamics, European Turbomachinery Society, https://doi.org/10.3390/ijtpp6040044, 2021. a
De Cillis, G., Cherubini, S., Semeraro, O., Leonardi, S., and De Palma, P.: Stability and optimal forcing analysis of a wind turbine wake: Comparison with POD, Renew. Energy, 181, 765–785, https://doi.org/10.1016/j.renene.2021.09.025, 2022a. a
De Cillis, G., Semeraro, O., Leonardi, S., De Palma, P., and Cherubini, S.: Dynamic-mode-decomposition of the wake of the NREL-5 MW wind turbine impinged by a laminar inflow, Renew, Energy, 199, 1–10, https://doi.org/10.1016/j.renene.2022.08.113, 2022b. a
DNV: Bladed User Manual: Version 4.9, Gerrad Hassan & Partners Ltd., Bristol, UK, https://media.oiipdf.com/pdf/f867bf2b-1102-4cbd-a5e4-b8704b373d91.pdf (last access: February 2022), 2018. a
Dreyer, E. R., Grier, B. J., McNamara, J. J., and Orr, B. C.: Rapid Steady-State Hypersonic Aerothermodynamic Loads Prediction Using Reduced Fidelity Models, J. Aircraft, 58, 663–676, https://doi.org/10.2514/1.C035969, 2021. a
Fitzgibbon, T., Woodgate, M., and Barakos, G.: Assessment of Current Rotor Design Comparison Practices based on High-Fidelity CFD Methods, Aeronaut. J., 124, 731–766, https://doi.org/10.1017/aer.2019.162, 2020. a
Hamilton, N., Viggiano, B., Calaf, M., Tutkun, M., and Cal, R. B.: A generalized framework for reduced-order modeling of a wind turbine wake, Wind Energy, 21, 373–390, https://doi.org/10.1002/we.2167, 2018. a
Ho, J. C., Jayaraman, B., and Yeo, H.: Coupled Computational Fluid Dynamics and Comprehensive Analysis Calculations of a Gimballed Tiltrotor, AIAA J., 57, 4433–4446, https://doi.org/10.2514/1.J057394, 2019. a
Holmes, P., Lumley, J. L., and Berkooz, G.: Turbulence, Coherent Structures, Dynamical Systems and Symmetry, in: Cambridge Monographs on Mechanics, Cambridge University Press, https://doi.org/10.1017/CBO9780511622700, 1996. a, b
Houck, D., deVelder, N., and Kelley, C.: Comparison of a mid-fidelity free vortex wake method to a high-fidelity actuator line model large eddy simulation for wind turbine wake simulations, J. Phys.: Conf. Ser., 2265, 042044, https://doi.org/10.1088/1742-6596/2265/4/042044, 2022. a
Jin, Y., Lu, K., Hou, L., and Chen, Y.: An adaptive proper orthogonal decomposition method for model order reduction of multi-disc rotor system, J. Sound Vibrat., 411, 210–231, https://doi.org/10.1016/j.jsv.2017.09.001, 2017. a
Johnson, W.: CAMRAD II, Comprehensive Analytical Model of Rotorcraft Aerodynamics and Dynamics, Johnson Aeronautics, Palo Alto, California, https://apps.dtic.mil/sti/pdfs/ADA090513.pdf (last access: November 2021), 1992. a
Johnson, W.: NDARC-NASA Design and Analysis of Rotorcraft, Tech. rep., https://ntrs.nasa.gov/citations/20170011656 (last access: November 2021), NASA Technical Report Number ARC-EDAA-TN46522, 2015. a
Jonkman, J.: The New Modularization Framework for the FAST Wind Turbine CAE Tool, in: 51st AIAA aerospace sciences meeting including the new horizons forum and aerospace exposition, 7–10 January 2013, Dallas Texas, p. 202, https://doi.org/10.2514/6.2013-202, 2013. a
Jonkman, J. M. and Buhl Jr., M. L.: Fast user's guide-updated august 2005, report NREL/TP-500-38230, NREL – National Renewable Energy Lab., Golden, CO, USA, https://doi.org/10.2172/15020796, 2005. a
Kecskemety, K. M. and McNamara, J. J.: Influence of wake dynamics on the performance and aeroelasticity of wind turbines, Renew. Energy, 88, 333–345, https://doi.org/10.1016/j.renene.2015.11.031, 2016. a
Lakshminarayan, V. K., Sitaraman, J., and Wissink, A. M.: Application of Strand Grid Framework to Complex Rotorcraft Simulations, J. Am. Helicopt. Soc., 62, 1–16, https://doi.org/10.4050/JAHS.62.012008, 2017. a
Larsen, T. J. and Hansen, A. M.: How 2 HAWC2, the user's manual, Risø National Laboratory, https://www.hawc2.dk/-/media/sites/hawc2/hawc2-download/hawc2-manual/manual_version_12-7.pdf?la=da&hash=43585868F8F94FC4EC38A2F719CE02E224CA2B38 (last access: November 2021), 2007. a
Liew, J., Urbán, A. M., and Andersen, S. J.: Analytical model for the power–yaw sensitivity of wind turbines operating in full wake, Wind Energ. Sci., 5, 427–437, https://doi.org/10.5194/wes-5-427-2020, 2020. a
Liu, H., Gao, X., Chen, Z., and Yang, F.: Efficient reduced-order aerodynamic modeling in low-Reynolds-number incompressible flows, Aerosp. Sci. Technol., 119, 107199, https://doi.org/10.1016/j.ast.2021.107199, 2021. a
Liu, Y., Lu, Y., Wang, Y., Sun, D., Deng, L., Wang, F., and Lei, Y.: A CNN-based shock detection method in flow visualization, Comput. Fluids, 184, 1–9, https://doi.org/10.1016/j.compfluid.2019.03.022, 2019. a
Ma, X., Karamanos, G., and Karniadakis, G.: Dynamics and low-dimensionality of a turbulent near wake, J. Fluid Mech., 410, 29–65, https://doi.org/10.1017/S0022112099007934, 2000. a
Morelli, M., Bellosta, T., and Guardone, A.: Development and preliminary assessment of the open-source CFD toolkit SU2 for rotorcraft flows, J. Comput. Appl. Math., 389, 113340, https://doi.org/10.1016/j.cam.2020.113340, 2021. a
Neerarambam, S., Bowles, P. O., Min, B.-Y., Lamb, D., Dunn, A. F., Frydman, J., Harrington, G., Lian, C., Kazlauskas, M., Wake, B. E., Joshi, N., Becker, N., Forsythe, J. R., Powers, R. W., Stratton, Z., Collins, C., Spyropoulos, J., Jayaraman, B., Simonetti, J., Foti, C., and Axtell, J.: An Overview of the Exhaust Gas Reingestion Challenges on the CH 53K King Stallion, in: AIAA Scitech 2021 Forum, 11–15 January, p. 0028, https://doi.org/10.2514/6.2021-0028, 2021. a
Nuernberg, M. and Tao, L.: Three dimensional tidal turbine array simulations using OpenFOAM with dynamic mesh, Ocean Eng., 147, 629–646, https://doi.org/10.1016/j.oceaneng.2017.10.053, 2018. a
Peters, N., Ekaterinaris, J. A., and Wissink, A. M.: A Mode Based Reduced Order Model for Supersonic Store Separation, in: AIAA Aviation 2021 Forum, virtual event, https://doi.org/10.2514/6.2021-2548, 2021. a
Peters, N., Ekaterinaris, J., and Wissink, A.: A Mode Based Reduced Order Model for Rotorcraft Separation, in: AIAA Scitech 2022 Forum, 3–7 January, San Diego, CA, https://doi.org/10.2514/6.2022-0312, 2022a. a
Peters, N., Wissink, A., and Ekaterinaris, J.: Machine learning-based surrogate modeling approaches for fixed-wing store separation, Aerosp. Sci. Technol., 133, 108150, https://doi.org/10.1016/j.ast.2023.108150, 2022b. a
Peters, N., Wissink, A., and Ekaterinaris, J.: On the construction of a mode based reduced order model for a moving store, Aerosp. Sci. Technol., 123, 107484, https://doi.org/10.1016/j.ast.2022.107484, 2022c. a
Peters, N., Ekaterinaris, J., and Wissink, A.: A Data-Driven Modeling Approach for Rotorcraft Store Separation, in: AIAA Scitech 2023 Forum, 23–27 January, Nartional Harbor, MD, https://doi.org/10.2514/6.2023-0233, 2023. a
Quackenbush, T., Wachspress, D., Boschitsch, A., and Curbishley, T.: A Comprehensive Hierarchical Aeromechanics Rotorcraft Model (CHARM) for General Rotor/Surface Interaction, CDI Report, Continuum Dynamics, https://www.worldcat.org/title/comprehensive-hierarchical-aeromechanics-rotorcraft-model-charm-for-general-rotorsurface-interaction-sbir-phase-ii-final-report/oclc/248058260 (last access: November 2021), 99–03, 1999. a
Raissi, M., Perdikaris, P., and Karniadakis, G.: Physics-informed neural networks: A deep learning framework for solving forward and inverse problems involving nonlinear partial differential equations, J. Comput. Phys., 378, 686–707, https://doi.org/10.1016/j.jcp.2018.10.045, 2019. a
Ramasamy, M., Johnson, B., and Leishman, J.: Turbulent Tip Vortex Measurements Using Dual-Plane Stereoscopic Particle Image Velocimetry, AIAA J., 478, 1826–1840, https://doi.org/10.2514/1.39202, 2009. a
Rogers, S., Cao, H., and Su, T.: Grid Generation for Complex High-Lift Configurations, in: 29th AIAA, Fluid Dynamics Conference, 15–18 June, Albuquerque, NM, p. 3011, https://doi.org/10.2514/6.1998-3011, 1998. a
Saberi, H., Khoshlahjeh, M., Ormiston, R. A., and Rutkowski, M. J.: Overview of RCAS and Application to Advanced Rotorcraft Problems, in: American Helicopter Society 4th Decennial Specialists' Conference on Aaeromechanics, 21–23 January, San Francisco, CA, 2004. a
Sankaran, V., Sitaraman, J., Wissink, A., Datta, A., Jayaraman, B., Potsdam, M., Mavriplis, D., Yang, Z., O'Brien, D., Saberi, H., et al.: Application of the Helios Computational Platform to Rotorcraft Flow Fields, AIAA J. 1230, 2010, https://doi.org/10.2514/6.2010-1230, 2010. a
Schmid, P. J.: Dynamic mode decomposition of numerical and experimental data, J. Fluid Mech., 656, 5–28, https://doi.org/10.1017/S0022112010001217, 2010. a
Sengers, B. A. M., Zech, M., Jacobs, P., Steinfeld, G., and Kühn, M.: A physically interpretable data-driven surrogate model for wake steering, Wind Energ. Sci., 7, 1455–1470, https://doi.org/10.5194/wes-7-1455-2022, 2022. a
Sieber, M., Paschereit, C. O., and Oberleithner, K.: Spectral Proper Orthogonal Decomposition, J. Fluid Mech., 792, 798–828, https://doi.org/10.1017/jfm.2016.103, 2016. a
Sirovich, L.: Turbulence and the dynamics of coherent structures. I. Coherent structures, Q. Appl. Math., 45, 561–571, https://doi.org/10.1090/qam/910462, 1987. a
Smagorinsky, J.: General Circulation Experiments with the Primitive Equations: I. The Basic Experiment, Mon. Weather Rev., 91, 99–164, https://doi.org/10.1175/1520-0493(1963)091<0099:GCEWTP>2.3.CO;2, 1963.
Sood, I., Simon, E., Vitsas, A., Blockmans, B., Larsen, G. C., and Meyers, J.: Comparison of large eddy simulations against measurements from the Lillgrund offshore wind farm, Wind Energ. Sci., 7, 2469–2489, https://doi.org/10.5194/wes-7-2469-2022, 2022. a
Spalart, P. and Allmaras, S.: A One-Equation Turbulence Model for Aerodynamic Flows, in: 30th Aerospace Sciences Meeting and Exhibit, 6–9 January, Reno, NV, p. 439, https://doi.org/10.2514/6.1992-439, 1992. a
Spalart, P. R.: Comments on the Feasibility of LES for Wings, and on a Hybrid RANS/LES Approach, in: Proceedings of first AFOSR international conference on DNS/LES, Greyden Press, https://cir.nii.ac.jp/crid/1571698599231647232 (last access: November 2021), 1997.
Stanly, R., Martinez-Tossas, L. A., Frankel, S. H., and Delorme, Y.: Large-eddy simulation of a wind turbine using a filtered actuator line model, J. Wind Eng. Indust. Aerodynam., 222, 104868, https://doi.org/10.1016/j.jweia.2021.104868, 2022. a
Walatka, P. P.: PLOT3D User's Manual, vol. 101067, NASA, https://ntrs.nasa.gov/citations/19900013774 (last access: November 2021), 1990. a
Wang, H. and Zhai, Z. J.: Advances in building simulation and computational techniques: A review between 1987 and 2014, Energ. Build., 128, 319–335, https://doi.org/10.1016/j.enbuild.2016.06.080, 2016. a
Wissink, A. M., Sitaraman, J., Jayaraman, B., Roget, B., Lakshminarayan, V. K., Potsdam, M. A., Jain, R., Bauer, A., and Strawn, R.: Recent Advancements in the Helios Rotorcraft Simulation Code, in: 54th AIAA Aerospace Sciences Meeting, 4–8 January, San Diego, CA, p. 0563, https://doi.org/10.2514/6.2016-0563, 2016. a
Wissink, A. M., Jayaraman, B., Tran, S. A., Jain, R., Potsdam, M. A., Sitaraman, J., Roget, B., and Lakshminarayan, V. K.: Assessment of Rotorcraft Download Using Helios v8, in: 2018 AIAA Aerospace Sciences Meeting, 8–12 January, Kissimmee, FL, p. 0026, https://doi.org/10.2514/6.2018-0026, 2018. a
Yeo, H., Bosworth, J., Acree Jr., C., and Kreshock, A. R.: Comparison of CAMRAD II and RCAS Predictions of Tiltrotor Aeroelastic Stability, J. Am. Helicopt. Soc., 63, 1–13, https://doi.org/10.4050/JAHS.63.022001, 2018. a
Yonekura, K. and Suzuki, K.: Data-Driven Design Exploration Method using Conditional Variational Autoencoder for Airfoil Design, Struct. Multidisciplin. Optimiz., 64, 613–624, https://doi.org/10.1007/s00158-021-02851-0, 2021. a
Zehtabiyan-Rezaie, N., Iosifidis, A., and Abkar, M.: Data-driven fluid mechanics of wind farms: A review, J. Renew. Sustain. Energ., 14, 032703, https://doi.org/10.1063/5.0091980, 2022. a