the Creative Commons Attribution 4.0 License.
the Creative Commons Attribution 4.0 License.
 | 24 Aug 2023
Damping analysis of floating offshore wind turbines (FOWTs): a new control strategy reducing the platform vibrations
Matteo Capaldo
Paul Mella
In this paper, the coupled dynamics of the floating platform and the wind turbine rotor are analyzed. In particular, the damping is explicitly derived from the coupled equations of the rotor and floating platform. The analysis of the damping leads to the study of instability phenomena, thus obtaining the explicit conditions that lead to the non-minimum phase zero (NMPZ). Two NMPZs are analyzed, one related to the rotor dynamics and the other one to the platform pitch dynamics. The latter introduces a novelty, and an explicit condition is provided in this work for its verification. In the second part of the paper, from the analysis of the damping of the floating platform, a new strategy for the control of floating offshore wind turbines (FOWTs) is proposed. This strategy allows one to impose on the controller an explicit level of damping in the platform pitch motion that adapts with wind speed and operating conditions without changing the period of platform pitching. Finally the new strategy is compared to one without compensation and one with a non-adapting compensation by performing aero-hydro-servo-elastic numerical simulations of a reference FOWT. Generated power, motions, blade pitch and tower base fatigue are compared, showing that the new control strategy can reduce fatigue in the structure without affecting the power production.
- Article
(6276 KB) - Full-text XML
- BibTeX
- EndNote


Wind energy is an important source of renewable energy, and it has very high potential both onshore and offshore. In terms of installed capacity, onshore wind is still the largest contributor. However, the new annual offshore installed capacity is estimated to exceed 30 GW by 2030 in order to stay on track for a net zero/1.5 ∘C pathway (Lee et al., 2022). There is a growing interest in floating offshore foundations. In fact, floating offshore wind turbines (FOWTs) would allow us access to good wind resource locations that are not suitable for fixed-bottom foundations.
In that context, the levelized cost of energy (LCOE) of offshore wind farms needs to be decreased to be competitive with respect to onshore wind. This is especially true for the FOWTs. One effective way to achieve this objective is to investigate different strategies for the control of FOWTs. As explained in Bianchi et al. (2007), the minimization of the LCOE involves a series of partial objectives: energy capture, mechanical loads and power quality. These objectives are actually closely related and sometimes conflicting, and they should not be pursued separately. Hence, it is a question of finding a well-balanced compromise among them. Considering FOWTs, this optimization problem increases in complexity since the motions of the floating platform interact with the feedback control loop. Moreover, the coupling between the platform motions, the rotor dynamics and the blade pitch control can lead to oscillating (not damped) steady-state or even to unstable conditions (Larsen et al., 2007).
These phenomena can be classified into two families: one is related to undesired motions of the platform, even if the system is still stable. These are the non-minimum phase zeros (NMPZs). They are associated with the zeros of the transfer function describing the system. The other family is associated with the damping of the system, which is related to the poles of the transfer function, and can affect the system stability.
The nature and the set of control parameters leading to these phenomena can vary from one platform design to another, e.g., a barge, spar, semi-sub or tension-leg platform. However, for each of the platforms, there exist sets of design and control parameters leading to undesired behaviors (Fleming et al., 2014).
Bottom-fixed control strategies normally consider a squared law for the electrical torque control (below-rated wind speeds) and a set of integral and proportional coefficients (the pitch scheduling) to control the rotational speed by the blade pitch and operate the wind turbine in the desired steady-state conditions (above-rated wind speeds) (Lopez-Queija et al., 2022). This control strategy allows one to operate the wind turbine in steady-state conditions for a large set of wind speeds, typically from 3 to 25 m s−1.
To adapt this control strategy to FOWTs, a first compensation is considered in this work. It aims at solving the NMPZ effects caused by the blade pitch on the rotor rotational dynamics. This solution has already been introduced in Fischer (2013) and Stockhouse et al. (2021), and it is, in this work, analytically developed. The study of the NMPZs brings us to a new NMPZ phenomenon, described for the first time in this work. This is the NMPZ caused by the blade pitch on the platform dynamics. This new phenomenon is analytically developed, leading to the explicit condition to verify it. However, the compensations proposed in the literature and adopted in this work can not correct it.
A second compensation considered in this work aims at solving the issue of the coupling between the platform motions and the rotor dynamics, leading to non-damped oscillations of the systems. This phenomenon can even be amplified when the bottom-fixed pitch control is considered for a floating wind turbine. The issue comes from the fact that in above-rated wind speed, the blade pitch regulates the speed by increasing the angle of attack to feather. For an FOWT, when the platform has a forward motion, the rotor experiences an increasing wind speed; this means an increasing aerodynamic torque, which tends to accelerate the rotor. Consequently, the blade pitch control increases the angle of attack to feather and, hence, reduces the aerodynamic torque and regulates the rotor speed. However, it also reduces the rotor thrust, which induces a further forward motion. So the blade pitch control amplifies the original forward motion of the platform because the floating platform surge and pitch natural frequencies are in the bandwidth of the blade pitch controller.
Solutions exist to avoid this phenomenon. The first one and the most common in the literature is to reduce the blade pitch control proportional and integral gains in order to reduce its bandwidth and to exclude the platform pitch and surge natural frequencies (Jonkman et al., 2008; Larsen et al., 2007). However, this solution does not completely solve the problem, and, moreover, it results in having a less reactive blade pitch control that allows important overspeeds of the rotor. Alternative methods use additional sensing, such as nacelle fore–aft acceleration measurements or platform gyroscopes, to improve the performance of the pitch controller. In Abbas et al. (2022), the authors introduce a correction of the blade pitch control proportional to the platform pitch velocity in order to decouple the rotor dynamics from the platform pitch motions. An explicit form for the compensating parameter is proposed to obtain this decoupling, considering the first-order linear expression of the rotor dynamics variation with respect to the platform pitch. Here, we also propose a correction of the blade pitch control proportional to the platform pitch velocity. However, differently from Abbas et al. (2022), we propose to take advantage of the coupling between platform dynamics and rotor dynamics in order to define an explicit value of the platform pitch damping, obtained by compensating for the blade pitch. The two strategies arrive at different expressions of the proportional coefficients. This difference leads to coefficients with opposite signs.
The control strategy proposed in this work shares some similarities to the ones introduced in Lenfest et al. (2020) and Lackner (2009). In Lenfest et al. (2020), the platform pitch damping and the compensation parameter are investigated with a purely numerical approach. Here, we propose a mathematical frame and an explicit formulation for the compensation parameter related to this damping, which depends on the system properties. As introduced in Lackner (2009), we also use the platform pitch velocity to adjust the rated speed set point in order to reduce platform motions. The rated generator speed is no longer a constant value but a function of the platform pitch velocity, and the blade pitch is used to damp the floating platform pitch. However, differently from Lackner (2009), the ratio between proportional and integral gains of the correction can be considered different for the platform pitch motion and the rotor speed.
Higher-order controllers, such as a linear quadratic regulator (LQR), are applied and evaluated in Ma et al. (2018). A disturbance-accommodating controller (DAC) is evaluated in Menezes et al. (2018), and it is coupled with individual pitch control (IPC) in Namik et al. (2011). A nonlinear pitch and torque controller using wind preview are designed in Sarkar et al. (2020a) and Schlipf et al. (2013), giving promising results.
The novelty of this work is related to the FOWT damping analysis, i.e., the damping obtained by coupling the rotor and the platform pitch dynamics. This damping is explicitly derived from the coupled equations of the rotor and floating platform. This analysis leads to the study of the instability phenomena underlining the conditions leading to the NMPZ. One new NMPZ, never discussed before in the literature, is discovered and analyzed in this work. The domain of the instability of the platform is explicitly derived from the coupled system of equations. The control strategy proposed relies on this analysis, and it allows us to impose an explicit level of damping in the platform pitch motion on the controller without changing the period of platform pitching. The chosen strategy is then compared to one without platform pitch compensation (with detuning) and one that considers a single value of the compensation parameter for every wind speed and operating condition.
The paper is organized as follows. In Sect. 2, the equations of the FOWT system are described with the considered degrees of freedom and their coupling terms. Section 2.1 and 2.2 present the controller model and the state space considered in this work. The closed-loop feedback system is then analyzed in Sect. 2.3, leading to the definition of the conditions for the NMPZs. For this controller, a new control strategy dedicated to FOWTs, named ζplt fixed, is presented and analytically derived in Sect. 2.4 and 2.5. Some numerical tests are presented and commented on in Sect. 3.
The floating offshore wind turbine (FOWT) is represented by a system of 2 degrees of freedom, namely the rotor speed Ω and the platform pitch angle Φ, as reported in Fig. 1.
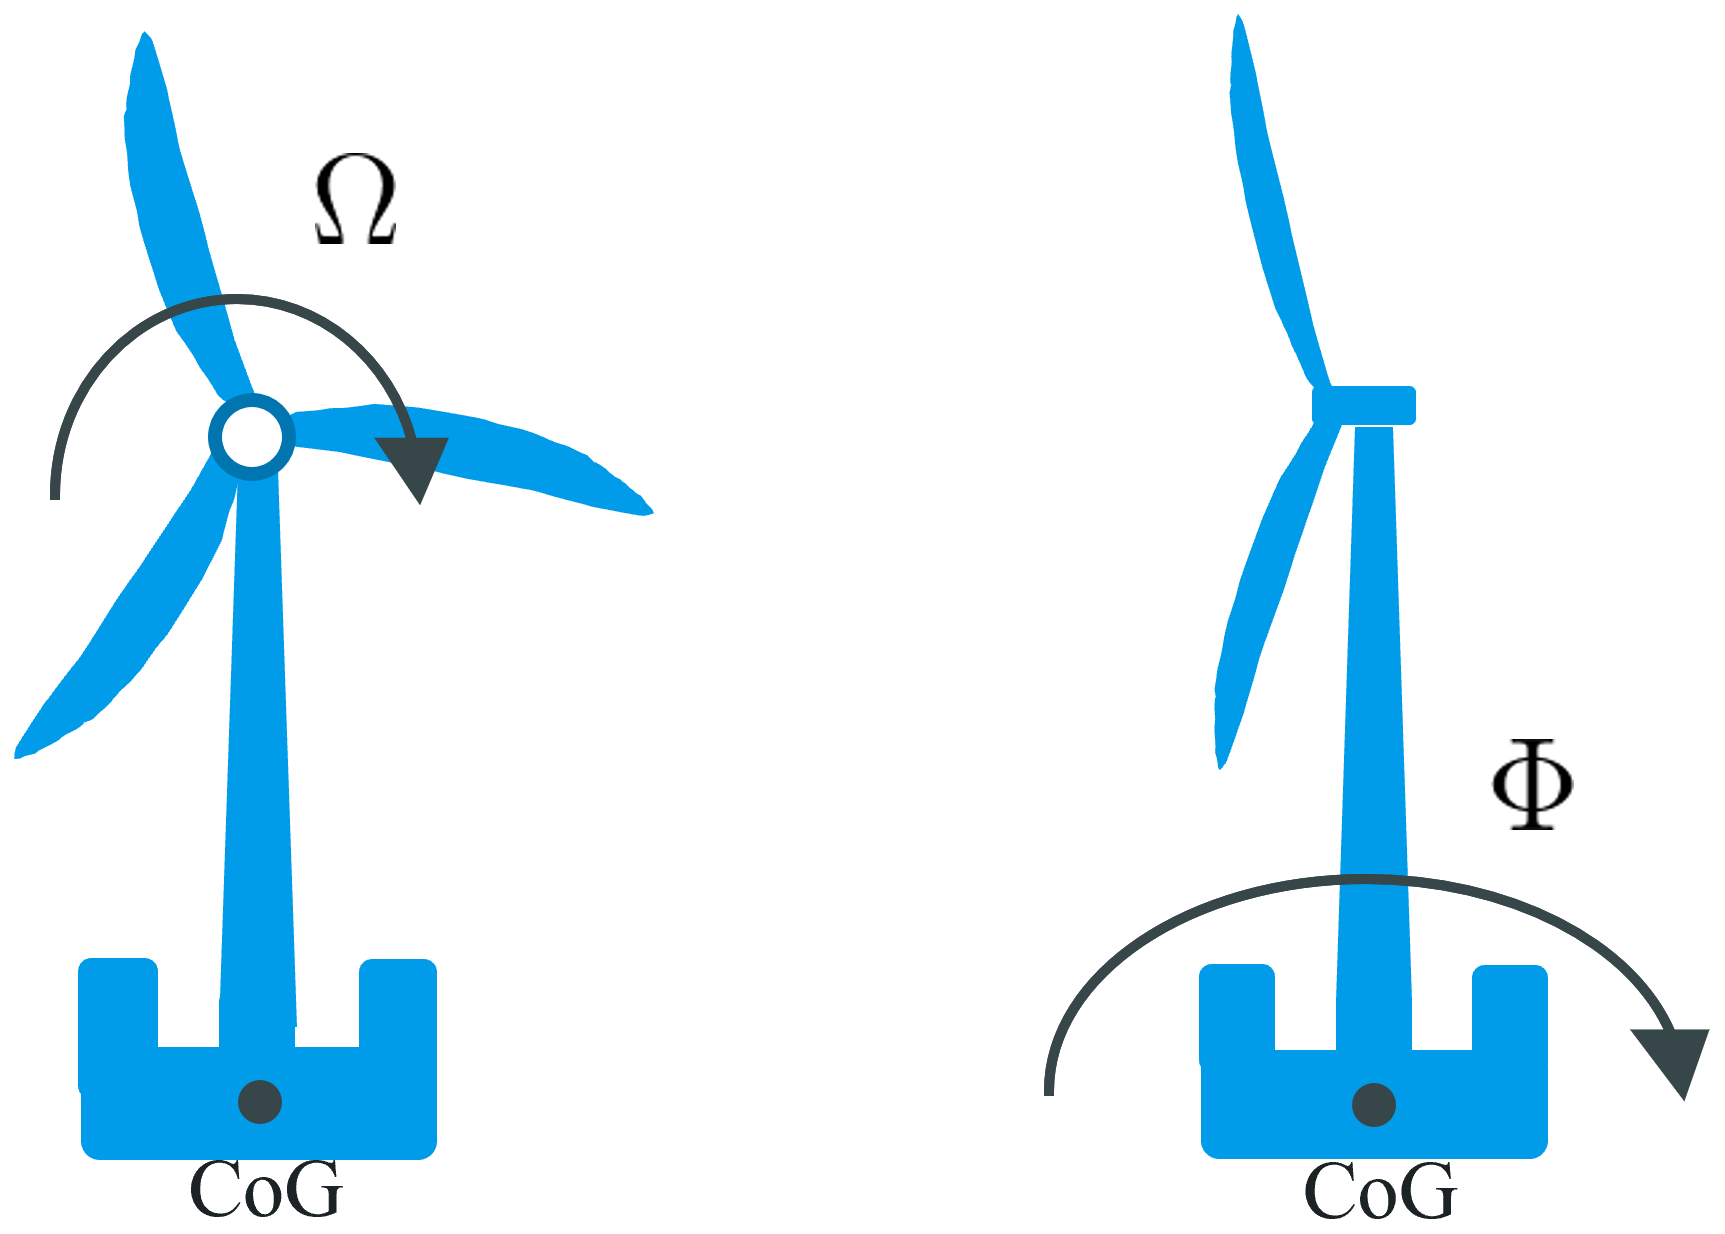
Figure 1A scheme of the considered system with 2 degrees of freedom, Ω around the rotor shaft and Φ around the center of gravity (CoG) of the system.
The surge degree of freedom is not considered in this model. In fact, the surge speed of the FOWT can be neglected with respect to the speed at nacelle generated by the pitch motion of the platform. This has already been mentioned in Sarkar et al. (2020b), where the authors remarked that the dynamics of the surge motion are much slower than those of the pitch. Hence, the surge can be considered to be a static offset in the position of the wind turbine without any effects on the controller.
Two control parameters, B (blade pitch) and τg (generator torque), and two external disturbances, V (wind speed) and W (wave elevation), are considered. For all the values that form a given operating point (namely ), the notation is adopted, with x being the small perturbation of a steady-state operating point .
The model is, then, based on two fundamental equations:
where Ωg is the generator speed, hereafter noted Ω; Ta and Tg are the aerodynamic and electric torques; Ng is the gearbox ratio; and Jr is the rotor inertia. Jt is the total system moment of inertia about the pitch rotation, Dt is the natural damping coefficient (assumed constant), Kt is a springlike restoring coefficient (mainly given by the mooring lines of the floating platform), ht is the height of the rotor (approximately the tower length), Fa is the aerodynamic force flowing from the rotor to the system and τwave is the overturning moment given by the waves.
Once a steady-state operating point is reached, the same two equations can be applied to any small variation x around this operating point. Equations (1) and (2) applied on X can be written as
The infinitesimal thrust and torques satisfy (using the same notation ) , , and (notice that we do not use the notation for Fa). By considering small perturbations of a steady-state operating point (given by ), it allows one to use the following linear forms:
The hypothesis of ϕ being small allows one to remove the terms , and .
The relative wind vr is the wind velocity in the rotor reference frame; it is computed from v by
Under the assumption of ϕ being small, represents the rotor fore–aft velocity in a fixed global reference frame.
Equations (1) and (2) applied to small perturbations of a steady-state point can therefore be expressed in the following linear form:
These coupled second-order equations yield the following four-dimensional state-space model:
where , (i.e., ), and , and
2.1 Control model description
The pitch controller model is described in this section.
The present control model considers ωr as the reference for ω and 0 as the reference for . It is based on several single-input–single-output (SISO) feedback loops. It can be seen as a multi-SISO:
-
proportional, ;
-
integral, ;
-
blade pitch (β) platform pitch compensation, ;
-
generator torque (τg) platform pitch compensation, .
Controllers described by the literature considering the same compensations (Abbas et al., 2022; Stockhouse et al., 2021) aim at maintaining ω steadily near its rated value by acting on the blade pitch β to vary the aerodynamic torque τa with the opposite sign with respect to the rotor infinitesimal speed , where the final goal is to obtain the same operational conditions as those of a bottom-fixed wind turbine. However, this strategy neglects the following phenomenon: the blade feather modifies the aerodynamic thrust Fa. Thus, a part of the opposing force on the platform is neglected. The strategy developed in this paper aims at minimizing ϕ variations with the constraint of maintaining a constant ω. Such a control strategy should reduce the loads on the structures (nacelle, tower and floater). Section 3 considers a full aero-hydro-servo-elastic model to verify this assumption. The performance of the control strategy is analyzed in a realistic FOWT environment reproduced by a numerical twin.
2.2 Global state-space description
For an FOWT, the objective of the pitch control is to remain in the equilibrium operating point. It translates to and . This objective allows one to justify the linear form of global Eqs. (1') and (2'). For constant inputs and , this operating point is reached by the appropriated pitch () and electric torque ().
The controller model is, here, introduced into the wind turbine state-space description. For small perturbations of this steady-state operating point, the PI controller described previously becomes
-
proportional,
-
integral,
-
blade pitch (β) platform pitch compensation,
-
generator torque (τg) platform pitch compensation,
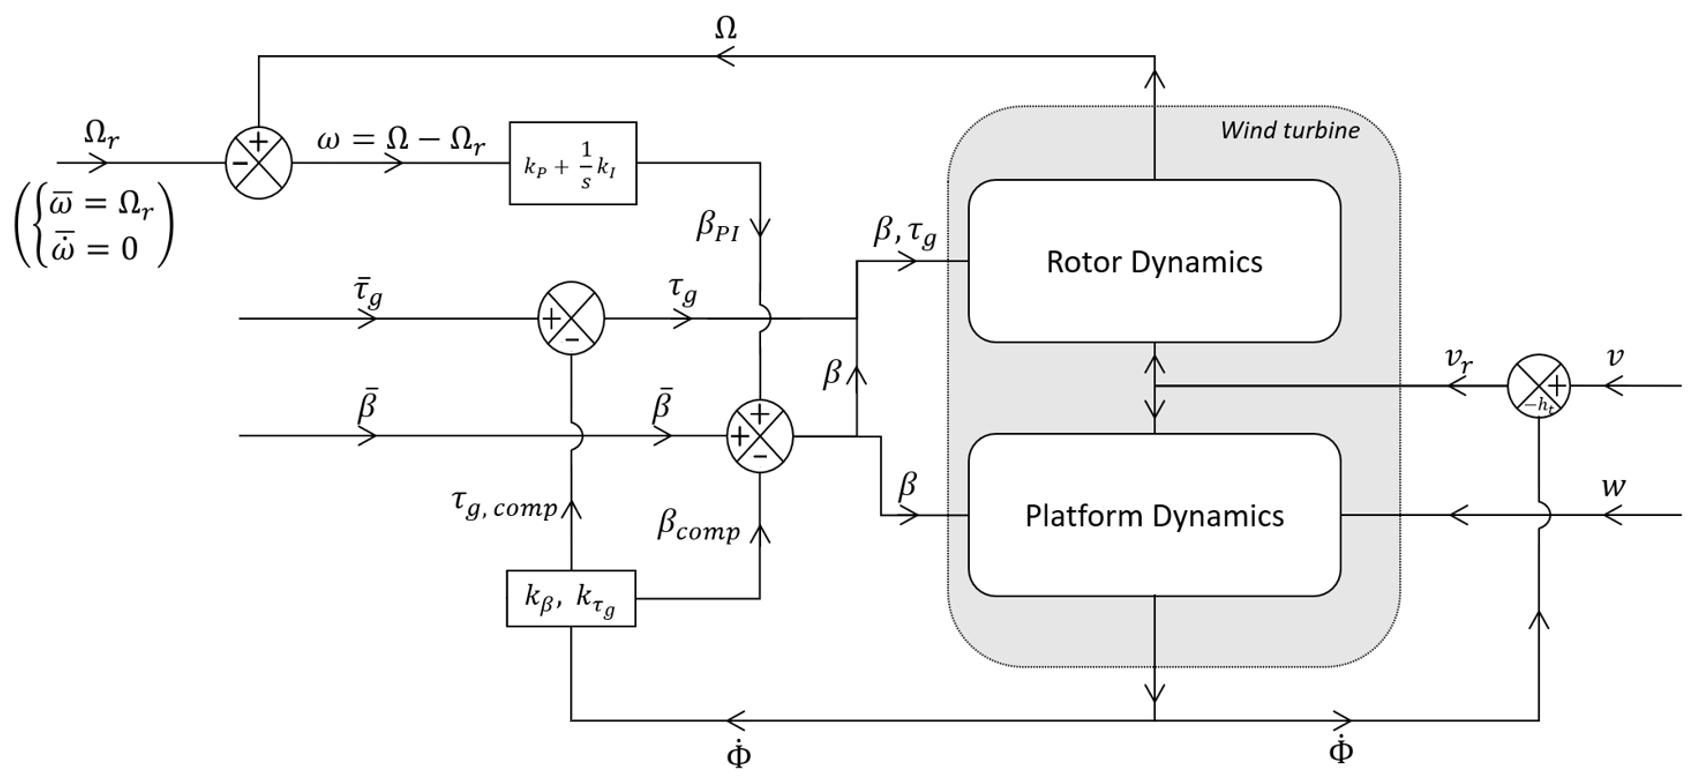
Figure 2 shows the entire picture of the controller model. This control strategy acts on the two dynamic systems, platform and rotor. Hence, one can appreciate how the bottom-fixed scheme acting on the rotor speed (ω) with a proportional integral scheme is then corrected by βcomp (Eq. 13) and τg (Eq. 14) that depend on the platform pitch speed error.
The linear expression of as a function of is , where
is the matrix of the control gains, and uc,ol is an optional additional control (open loop) that can be considered. This is useful to analyze the NMPZ in the next section. By replacing uc in Eq. (9), it leads to
which leads to defining the global matrix of the closed-loop system of equations:
The time domain system can be rewritten in the Laplace complex domain. Using the following notation, ![]() ,
Eq. (16) translates into
,
Eq. (16) translates into
By defining
and
it leads to
Here, G(s) is a 4×4 matrix. Every component of G(s) can be written as the quotient of a polynomial in s and χa(s).
2.3 Non-minimum phase-zero analysis and resolution (negative damping on the control)
This section analyzes the problem of negative damping by addressing the positions of the zeros of each component of G in the complex plane, i.e., the points where Eq. (21) is well defined but becomes
This translates the fact that s is an NMPZ if there exists a specific , such as, for any value of , the linear combination gives . Here, s is formally the complex Laplace variable so that formally . Even though Eq. (22) can be defined on the whole complex plane, only zeros with a strictly positive real part are NMPZs. The reader is referred to Hoagg and Bernstein (2007) for a complete description of NMPZs.
Physically is equivalent to an infinitesimal shifting along a specific direction of a steady-state point that can not be obtained with any infinitesimal shifting of the input. This phenomenon is better illustrated case by case.
For the rest of the section, an open-loop control on β is considered in order to highlight the NMPZ. Hence, βol is added to the multiple SISO as already described in Eq. (16). Since the feedback control on β can not erase the NMPZ condition, to lighten the formulas, the notation β will be used instead of βol in this section.
2.3.1 ϕ NMPZ: negative damping on ϕ control by β
The gain equation in the Laplace domain for β→ϕ control is obtained by projecting Eq. (21) on the axis and considering only a β perturbation, i.e., an input . The resulting equations are
The condition for the NMPZ on β→ϕ control is that N3,1 has a root with a real part strictly positive. Assuming that β=βf, the fine pitch, the previous derivatives are all negative. Hence, the root research of N3,1 leads to
Intuitively, this corresponds to an operating point where τa is rather influenced by β and Fa is rather influenced by ω. This NMPZ does not depend on parameters of the platform – it is only related to wind turbine generator (WTG) performances. However, the importance of the phenomenon is related to the platform properties. It is to be noted that this NMPZ has never been highlighted in the literature, and the controller model (with compensations of the platform motions) introduced in Sect. 2.1 in the feedback control loop does not prevent it. It results only from the characteristic of the FOWT system. Further work should focus on this phenomenon and should introduce corrections to prevent it in any FOWT system.
In the absence of NMPZ, i.e., Eq. (25) being false, increasing β from a steady-state operating point (i.e., setting d, d and dβ>0) will always imply a reduction in ϕ. In the presence of NMPZ, i.e., if Eq. (25) is true, the reduction or the increase in ϕ (with respect to the operating point) depends on the ratio between and .
When Eq. (25) is verified, it means that τa is more sensitive to blade pitch (β) than to rotational speed (ω), and Fa is more sensitive to ω than to β. Therefore, by increasing β, ω increases, and then it occasions Fa to decrease. Then, ϕ increases. If Eq. (25) is not verified, increasing blade pitch β from a steady-state operating point always reduces platform pitch ϕ. In practice, this effect can become an issue for a control algorithm mainly focused on ω stabilization, since it generates unexpected platform dynamics. For a more detailed approach of the initial undershoot phenomenon, the reader is referred to Hoagg and Bernstein (2007).
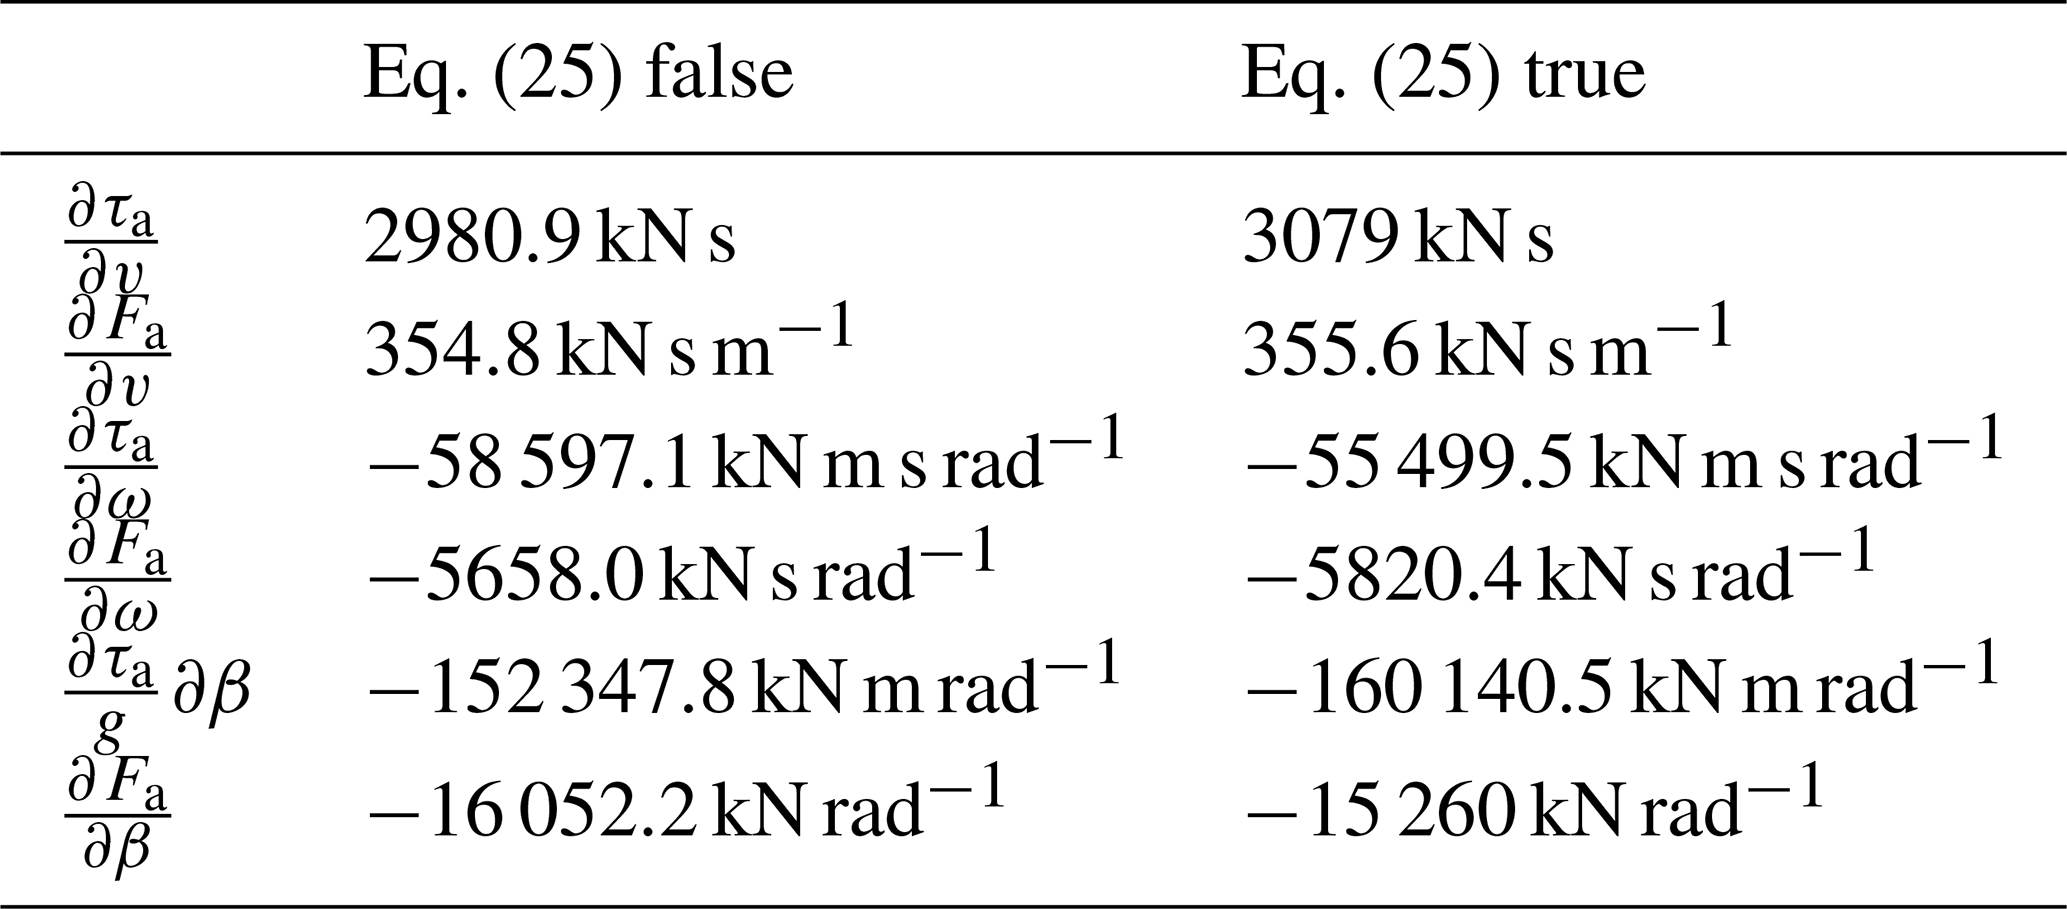
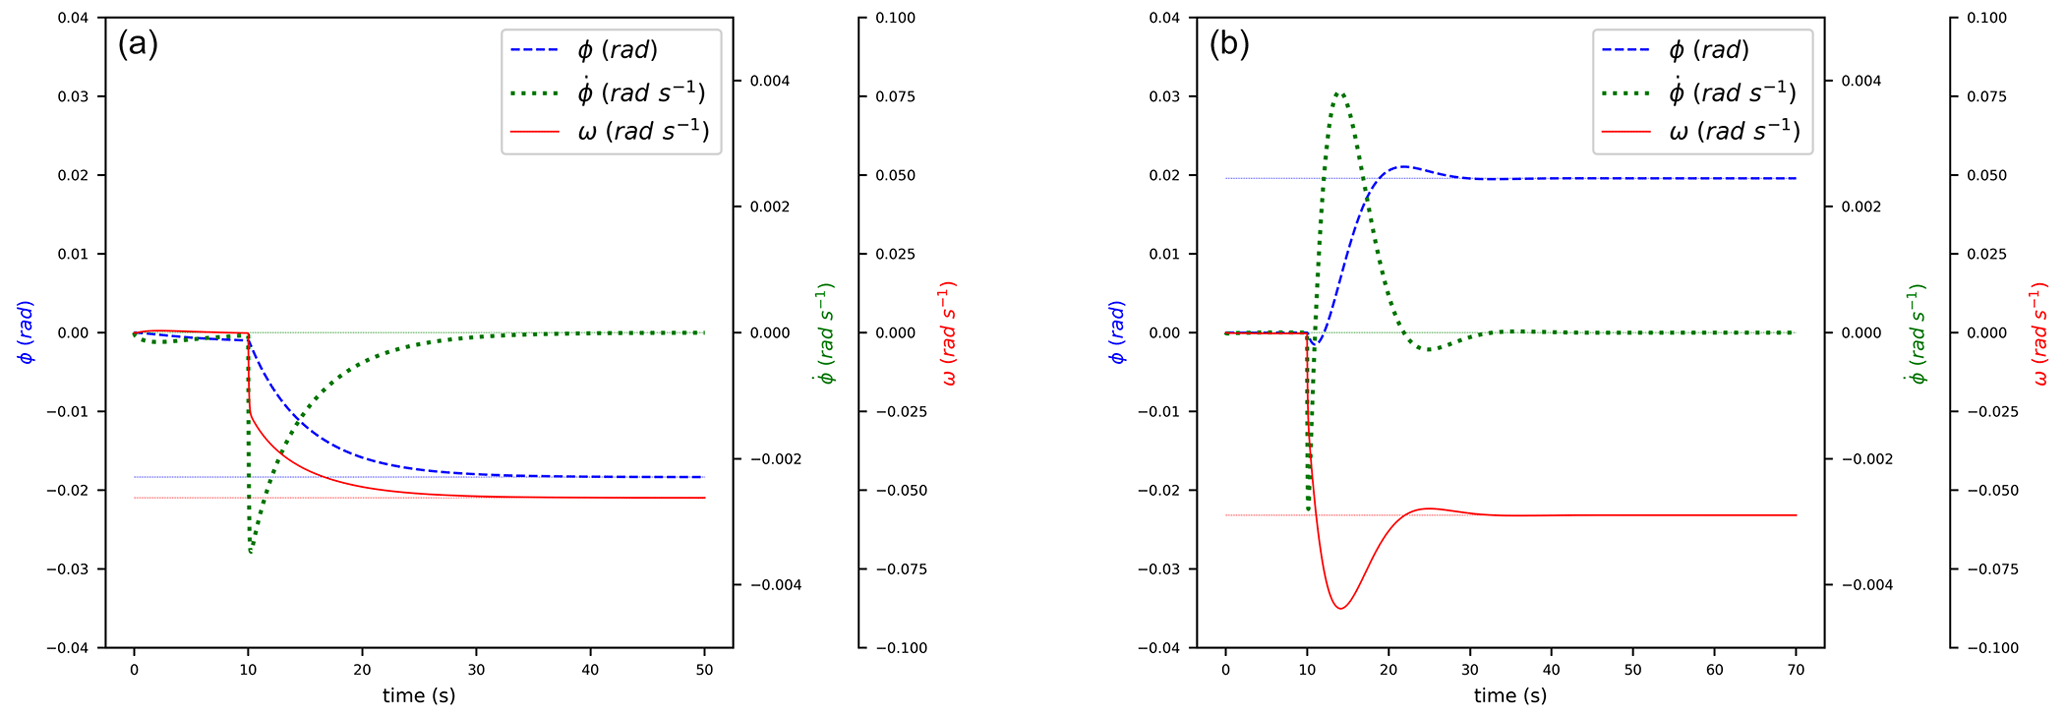
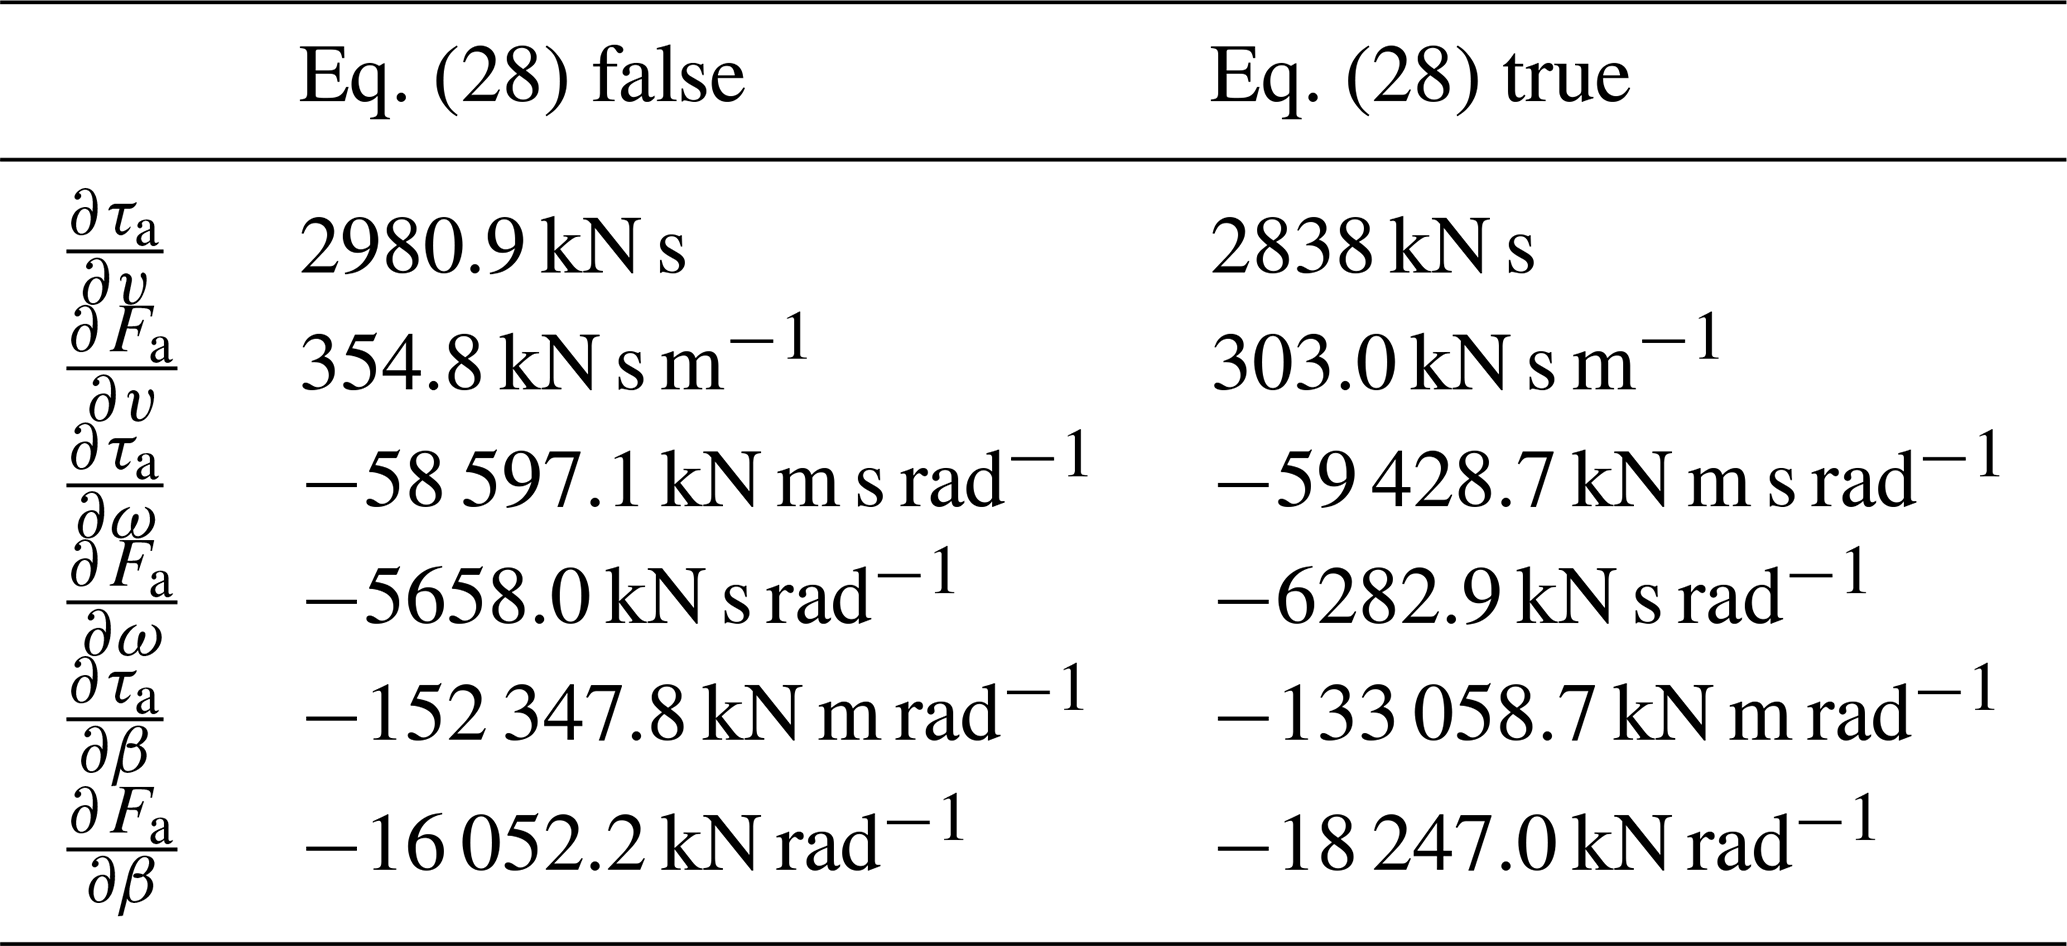
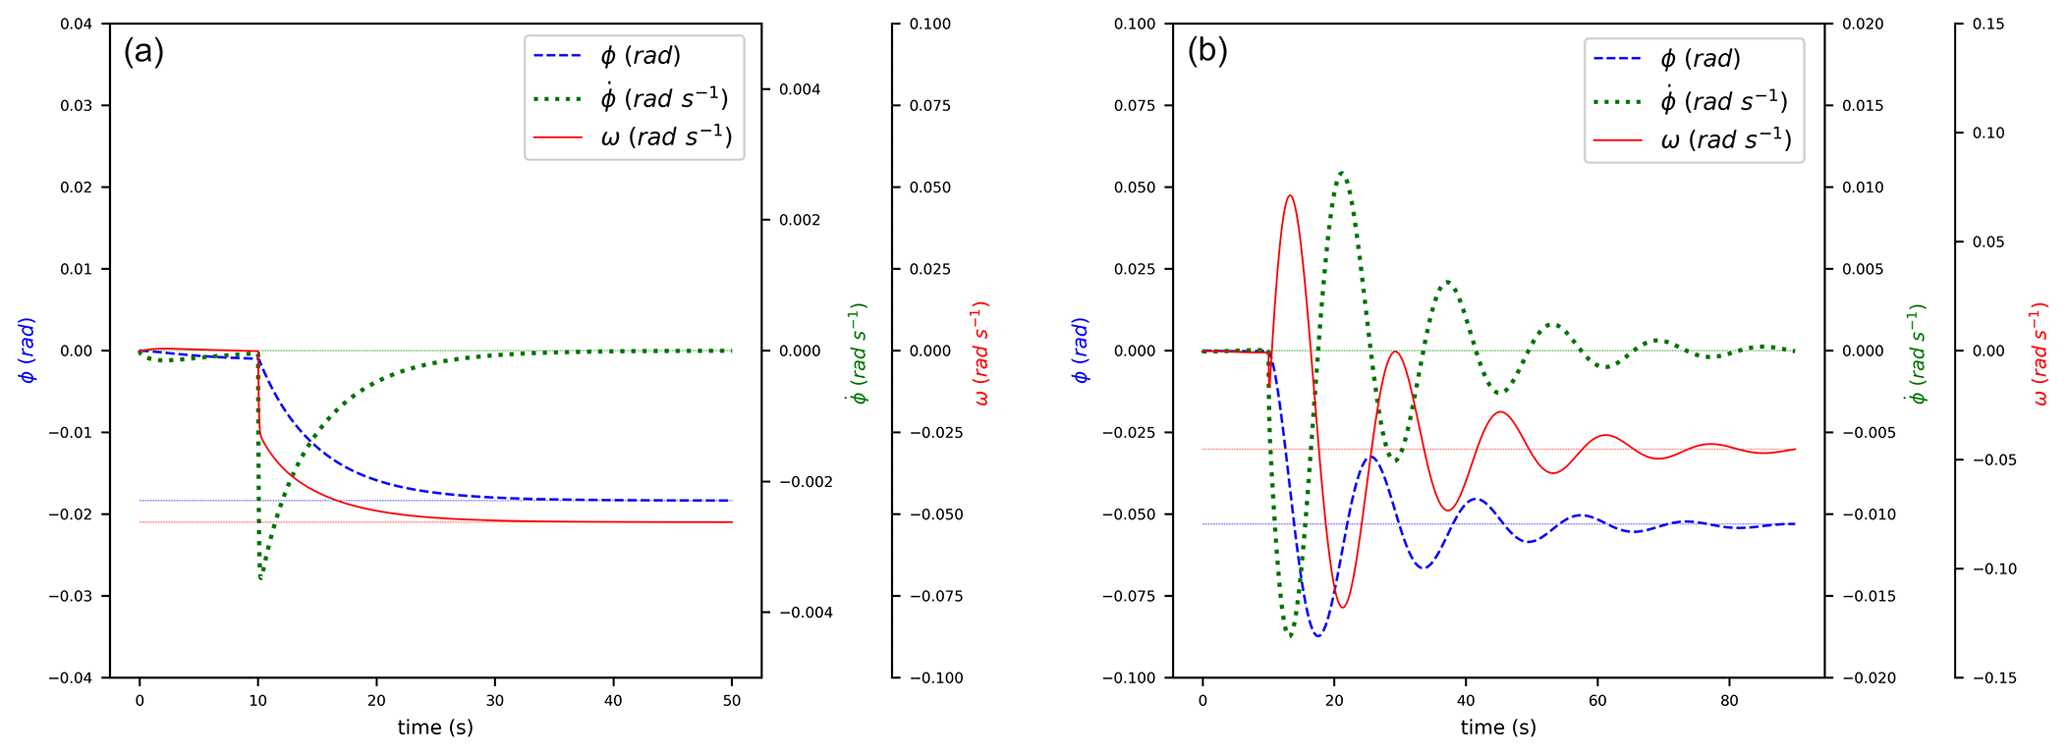
Figure 3 reproduces in the time domain ϕ and ω responses to a β-step input (at t=10 s); values (resumed in Table 1) are chosen arbitrarily so that Eq. (25) is false: ϕ decreases. On the right, values are chosen so that Eq. (25) is true: ϕ increases even though β has increased. The chosen values are not intended to simulate a real turbine but only to illustrate the described phenomena. Section 3 focuses on more realistic FOWT tests.
Table 1The set of parameters to show the NMPZ of Eq. (25). They are not intended to simulate a real turbine.
2.3.2 ω NMPZ: negative damping on ω control by β
The gain equation in the Laplace domain for β→ω control is given by
Hence the condition for NMPZ on β→ω control is
This corresponds with an operating point where τa is rather influenced by v and Fa is rather influenced by β. In the presence of NMPZ, i.e., if Eq. (28) is true, the sign of dω depends on the choice of d, d and dβ. Intuitively, the latter only happens when Eq. (28) is verified: increasing blade pitch will reduce Fa more than it increases τa (because Fa is rather influenced by β); thus will decrease and cause relative wind to increase. As τa is rather influenced by v, this will reduce ω in the end. In practice, this effect can become an issue if an ω control algorithm obtains the opposite result than what was expected.
In the absence of NMPZ, i.e., Eq. (28) being false, increasing β from a steady-state operating point will always imply reducing ω. In order to visualize this NMPZ, Fig. 4 shows ω responses to a β-step input (at t=10 s). On the left, parameters (Table 2) are chosen so that Eq. (28) is false: ω decreases. On the right, parameters are chosen so that Eq. (28) is true: at first ω increases even though β has increased.
Table 2The set of parameters chosen to show the NMPZ of Eq. (28). They are not intended to simulate a real turbine.
2.3.3 NMPZs and stability analysis
The comparison between Figs. 3 and 4 highlights what really happens after a step input, with and without NMPZ: at the beginning both ω and always decrease just after the step. However, when both NMPZ conditions, Eqs. (25) and (28), are false, those tendencies do not change. Conversely, when Eq. (25) is true, we observe that is so big that jumps into positive values. Similarly, when Eq. (28) is true, we observe that is so big that ω jumps (only for a short time) into positive values. NMPZ, as we have seen in the examples, can cause important shifts in and unexpected behaviors of both ω and ϕ.
NMPZ β→ϕ does not depend on the above-defined parameters. Consequently, the model in Sect. 2.1 does not prevent it. However Eq. (25) forecasts which operating points it affects. On the other hand, a wise choice of τg avoids β→ω NMPZ, which is the main reason why this compensation has already been introduced by Stockhouse et al. (2021) and in the controller model introduced in Sect. 2.1.
In order to complete the analysis of NMPZ phenomena related to FOWT systems, a hypothetical situation where both Eq. (25) and Eq. (28) are true has been simulated and reported in Fig. 5. At first, the dynamics are always the same: both and ω decrease, but soon they both diverge because of the NMPZ phenomena (combined with the closed-loop control). The pole–zero plots in Fig. 6 will lead to a better understanding of this instability. It is to be noted that corrections (without compensations τg and kβ) can delay this divergence but can not avoid it.
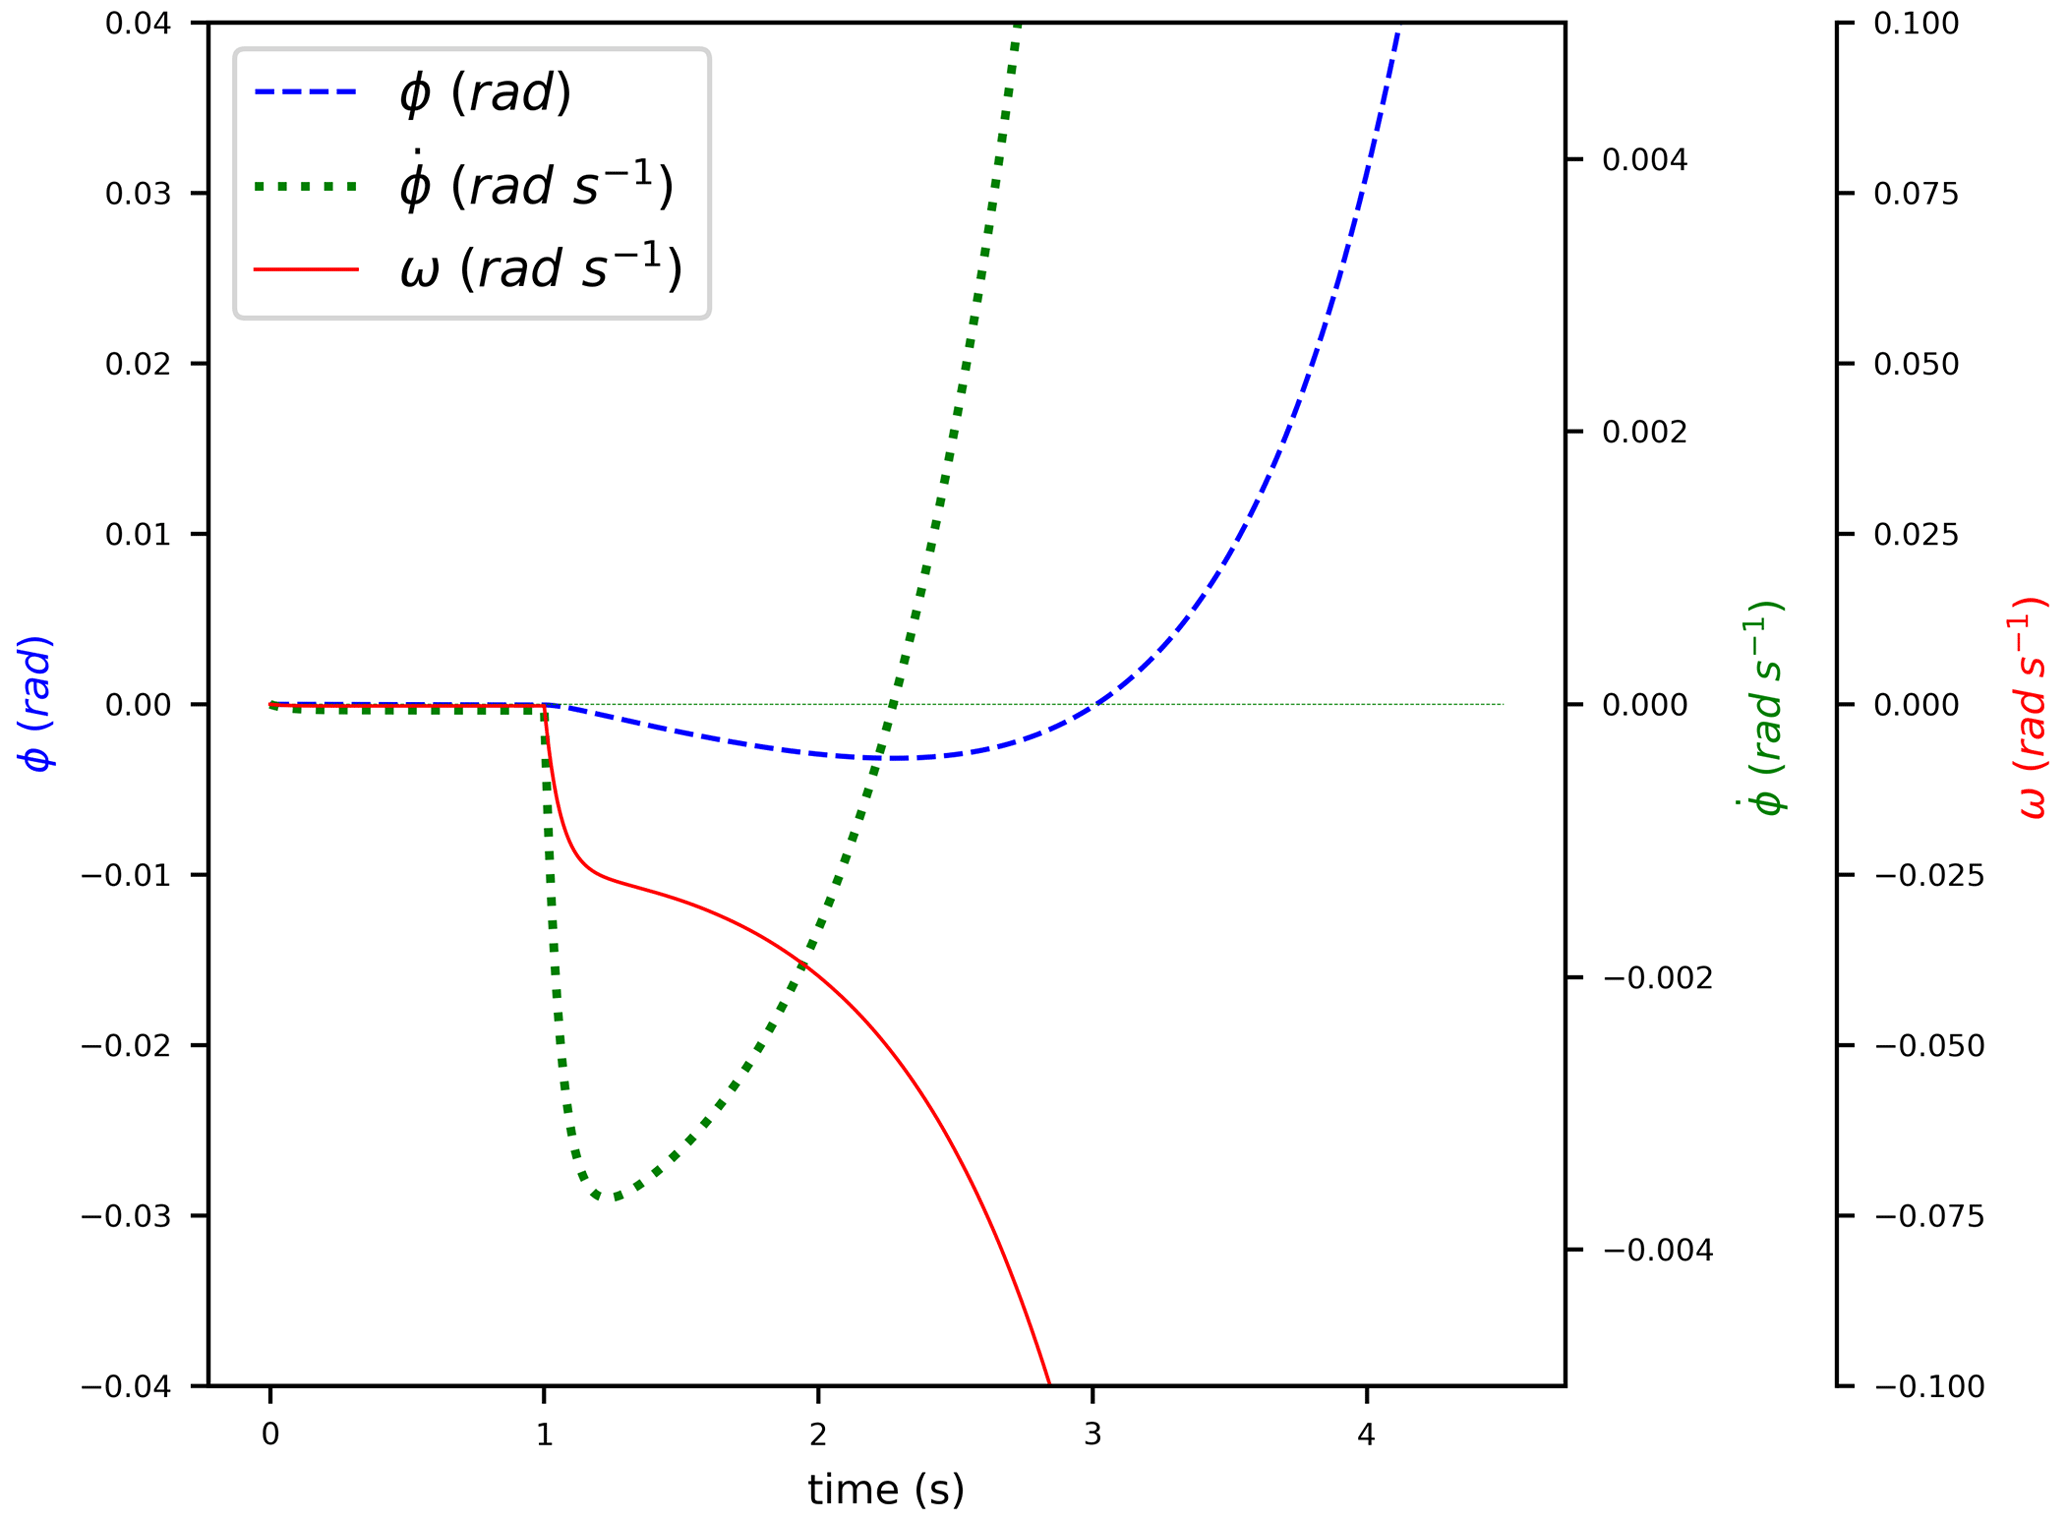
Table 3The set of parameters chosen to show the instability given by NMPZs of Eqs. (25) and (28). They are not intended to simulate a real turbine.
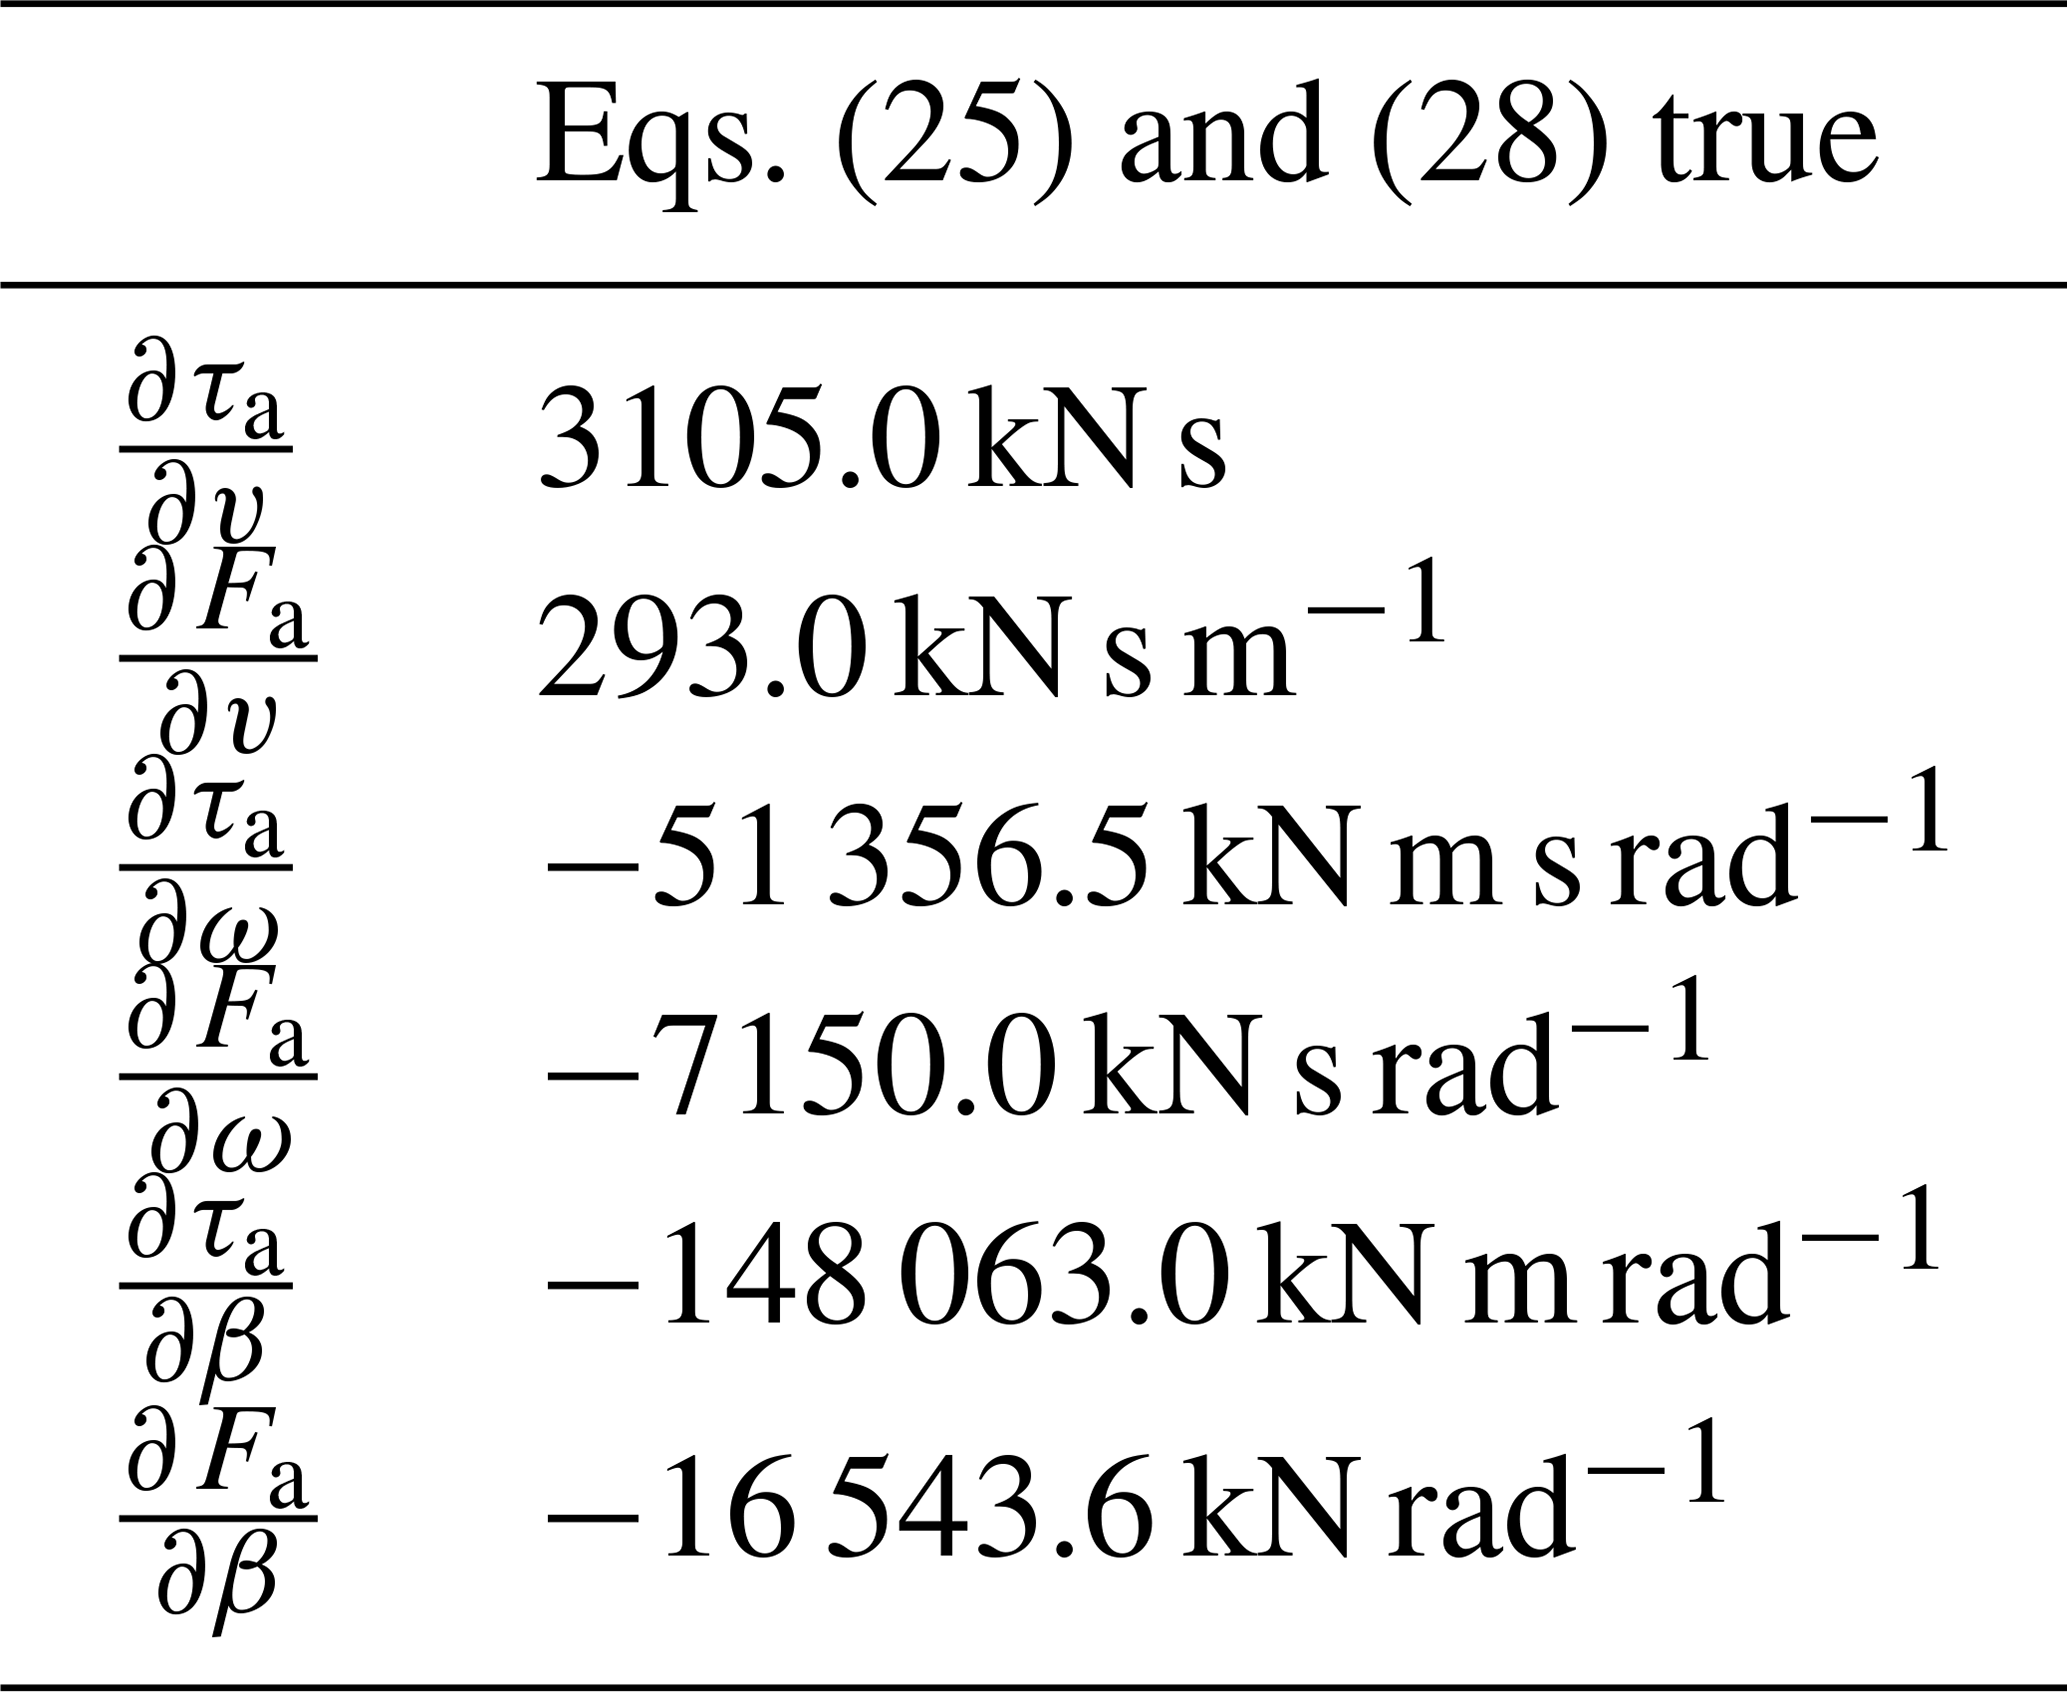
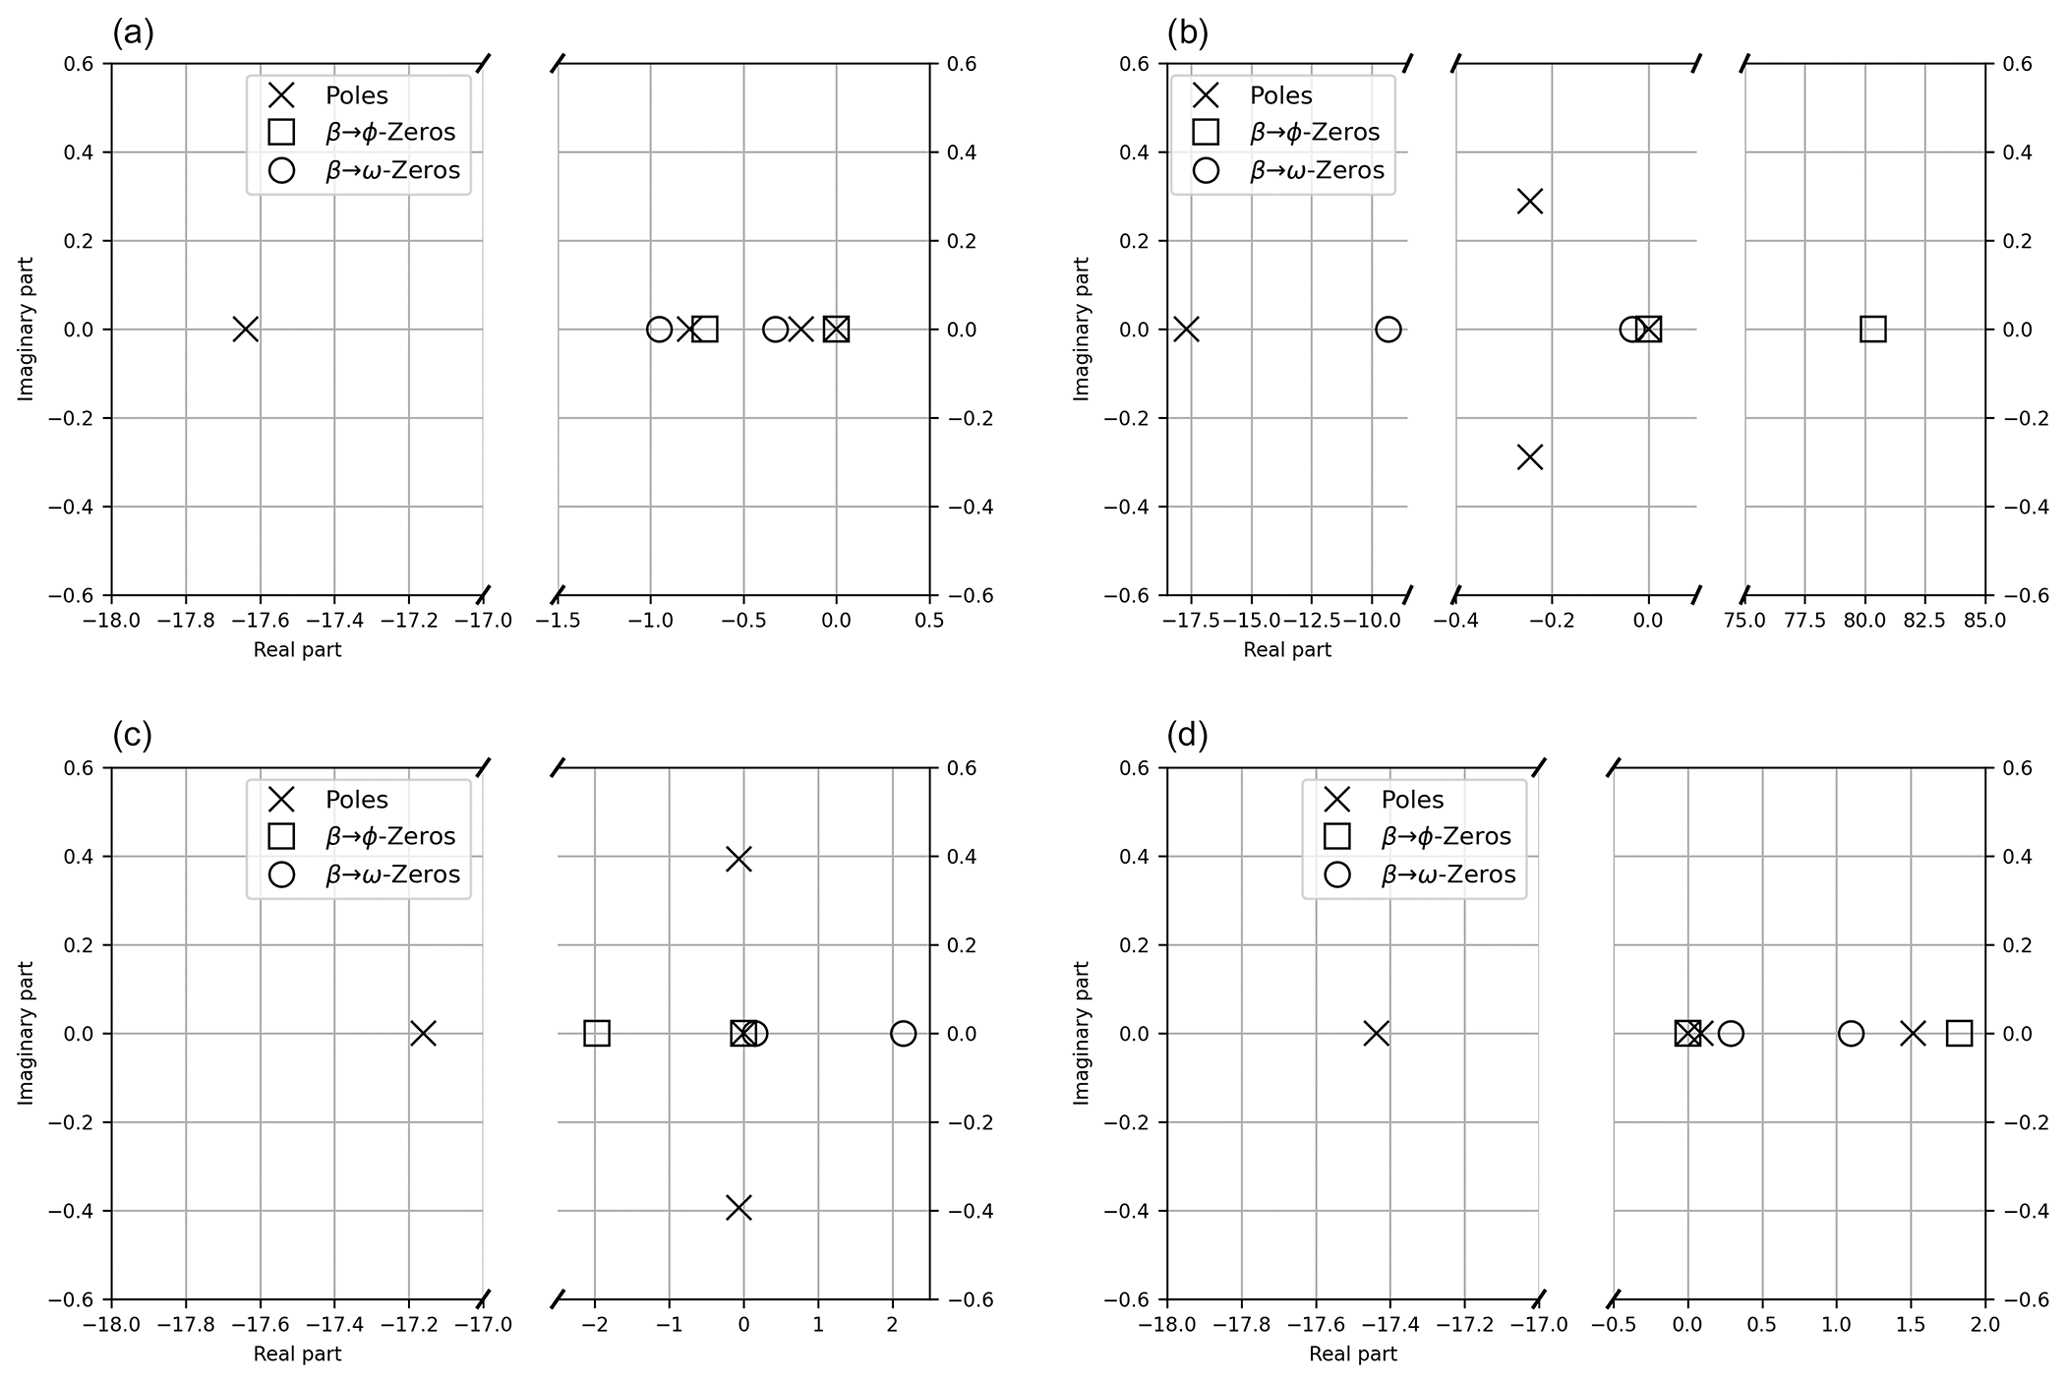
Figure 6Pole–zero analysis of the systems described in Tables 1, 2 and 3: (a) corresponds to a hypothetical situation where both Eq. (25) and Eq. (28) are false, (b) to a situation where only Eq. (25) is true, (c) to a situation where only Eq. (28) is true, and (d) to a situation where both Eq. (25) and Eq. (28) are true.
A pole–zero plot is a commonly used synthesis of both NMPZ and stability issues. The above case-by-case analysis highlighted the drawback of allowing a zero of the transfer function in the right half of the complex plane. Similarly, the stability of a system can be well synthesized by the position of the poles of the transfer function. Poles of the transfer function situated in the right half of the plane result in a global instability, such as the one observed in Fig. 5.
Figure 6 shows, for every hypothetical situation described above (see Tables 1, 2 and 3), the position of poles and zeros of the transfer functions G3,1, describing ϕ control by β (see Sect. 2.3.1), and G2,1, describing ω control by β (see Sect. 2.3.2). G3,1 and G2,1 have the same denominator, which is the complex polynomial χA; see Eq. (20). Thus, they have the same poles. Their numerators are respectively N3,1 and N2,1. In the upper-left plot, both Eq. (25) and Eq. (28) are false. There are no NMPZs: indeed, all the zeros are in the left half of the complex plane. In the upper-right plot, only Eq. (25) is true. All the zeros of N2,1 are in the left half of the complex plane, while one zero of N3,1 is in its right half: there is one NMPZ corresponding to the ϕ control by β. Similarly, in the lower-left plot, only Eq. (28) is true. Only two zeros of N2,1 are in the right half of the complex plane: those are NMPZs corresponding to the ω control by β. Finally, in the lower-right plot both Eq. (25) and Eq. (28) are true: there are zeros of N3,1 and of N2,1 in the right half of the complex plane. Moreover, in this case, we also find two poles of the transfer function in the right half of the complex plane: this is consistent with the time evolution plotted in Fig. 5, where one can observe an instability.
2.3.4 Compensation of the ω NMPZ
The issue related to the ω NMPZ has been presented in Sect. 2.3.2. Literature studies have addressed this NMPZ phenomenon and have suggested several control corrections. Due to the nature of this phenomenon, any correction concerning β control, introduced in Eq. (13) as d, can not completely prevent this NMPZ. However, detuning the PI controller (by lowering kP and kI gains) or using the β platform pitch compensation as suggested in Abbas et al. (2022) can mitigate the effect of NMPZ when Eq. (28) is true.
The complete prevention of the problem can be obtained by several sets of parameters that involve the WTG, the floating platform and the control setup. In fact, for this NMPZ, Eq. (14) of the controller model described in Sect. 2.1 allows one to avoid the NMPZ by choosing a well-suited value of . This compensation has already been introduced by Fischer (2013) and Stockhouse et al. (2021) with the formula
It is to be noted that, usually, it needs to be saturated because of turbine generator design constraints concerning the generator torque. Pole–zero plots are useful to get a better understanding of the choice of the parameter and more precisely the effect of varying the coefficient .
In the left plot of Fig. 7, positions of poles and zeros of the transfer function vary with . Both zeros, initially (i.e., with ) in the right half of the complex plane, end up in its left half: the NMPZ issue is solved. One should also note that the poles are also displaced but remain in the left half of the complex plane. The stability margin, however, might change. Thus, while choosing an explicit value of , one should take into account not only the position of the zeros but also that of the poles of the transfer function. Here, the stability margin is not maximized by the value chosen as an example.
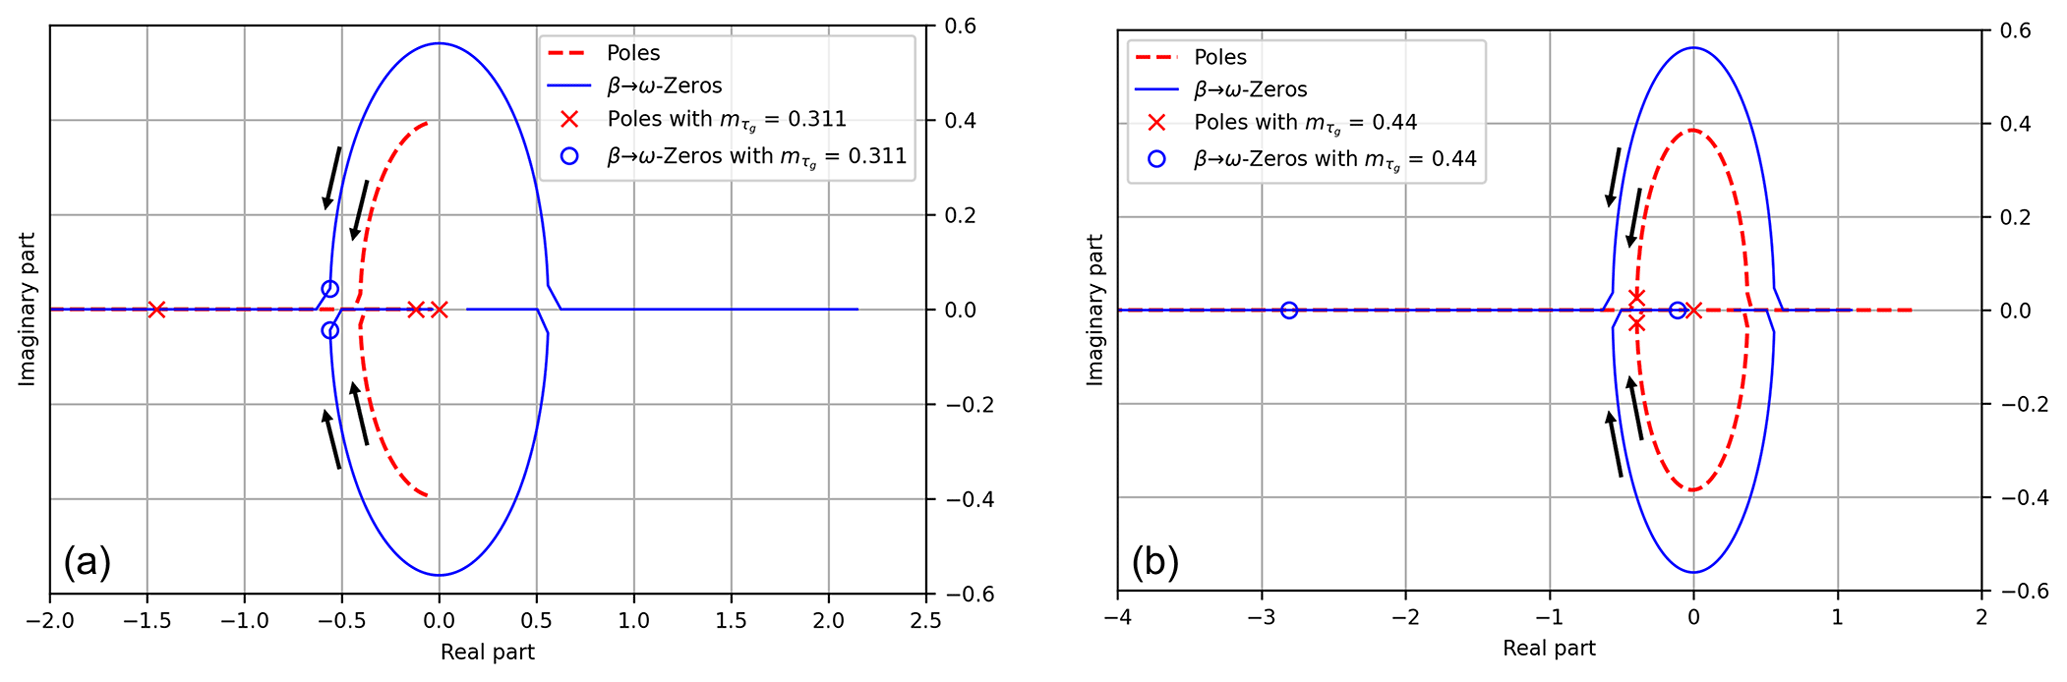
Figure 7Pole–zero analysis of the systems described in Tables 1 and 3, with the parameter varying from 0 to 1. According to the value of , zeros and poles of the system move from the right to the left half of the complex domain. Panel (a) corresponds to a hypothetical situation where, supposing , Eq. (25) would be true and Eq. (28) would be false (pole–zero plot reported in the upper right of Fig. 6b). Panel (b) corresponds to a situation where, supposing , both Eq. (25) and Eq. (28) would be true (pole–zero plot reported in Fig. 6d).
The right plot of Fig. 7 corresponds to an instability situation: initially (i.e., with ) not only are both zeros in the right half of the complex plane, but two poles are also there. Again, both the zeros and the poles are displaced as varies from 0 to 1. For a wisely chosen value of (here ), they both end up in the left half of the complex plane, and the stability margin can be maximized. In general, the choice of a value for should also take into account a possible saturation due to turbine generator design constraints.
2.4 Damping analysis
In Sect. 2.3 the issue of NMPZ, i.e., the issue of negative damping on the control/input side of the equation, is analyzed. The influence of the gains kP, kI, kβ and on the damping of the system (see Sect. 2.3) is investigated within the analytical framework set in the previous sections. The goal is to optimize (or tune) the stability of ω and ϕ responses to an external (v and w) disturbance. In other words, the goal is to obtain an explicit expression of the damping of the FOWT system with respect to the control parameters, kP, kI, kβ and , such that, for an imposed level of damping, one can obtain a value of the control parameters. This is a powerful result for the floating wind community and a novelty of this work with respect to the existing literature.
Considering the whole system, with both degrees of freedom ω and ϕ and their coupling, in the complex domain, leads to Eq. (21). The study of the damping is related to , defined in Eq. (20). The explicit form of χA is
where
The term in square parentheses represents the coupling term between the dynamics of the platform (ϕ) and the dynamics of the rotor (ω).
In this coupled form, it is complicated to explicitly determine the damping of the system. In the next paragraph, under a hypothesis, the coupled system can be separated into two second-order systems, one related to the rotor dynamics ω and the other one related to the floating dynamics ϕ. In particular, for the latter, it is possible to define a damping for the floating platform and obtain an explicit form for the compensation term kβ related to the imposed damping.
2.4.1 Simplified analysis of rotor dynamics
Defining a damping coefficient (or a damping ratio) requires us to reduce the global system to a second-order oscillatory system. Equations (16) and (17) couple rotor and platform pitch dynamics; they hence involve a fourth-order polynomial expression. In order to deal with rotor dynamics independently of the platform, it is supposed
For large FOWT systems, this hypothesis is, generally, respected. It implies
Under such assumptions, the linear form of Eq. (1) becomes
and the control is described by the PI controller: so that the resulting Laplace transform equation is
where, considering kI>0,
with
Thus, when all interactions with platform pitch are neglected, the rotor behaves like a second-order oscillatory system. The corresponding filter Grot is a second-order band-pass filter with cutoff angular frequency νrot.1
The above formulas enable one to obtain explicitly kI and kP.
They are well known: several controllers, such as in Abbas et al. (2022), are suggested to define
2.4.2 Simplified analysis of platform dynamics
Similarly to what is done in the previous paragraph, here the global system of Eqs. (1)–(2) is reduced to a second-order oscillatory system that allows us to have a better understanding of platform dynamics.
We consider , and we assume
The latter is the condition to decouple the global system. It enables us to consider the ϕ response independently of ω and as a second-order oscillatory system's degree of freedom. The resulting Laplace transform equation is
Here : the input array is reduced because only the damping in the output side is analyzed, and it is not necessary for this to consider any additional control input.
Aplt is the bottom-right part of A defined in Eq. (17).
Looking at the ϕ degree of freedom, Eq. (39) gives
with
i.e.,
Thus, when all interactions with rotor dynamics are neglected, the platform behaves like a second-order oscillatory system. The corresponding filter Gplt is a second-order low-pass filter with cutoff angular frequency defined by νplt and damping ratio defined by ζplt.
2.5 Artificial damping of the platform: ζplt-fixed strategy
By knowing the features of the FOWT, one can impose a given level of damping and obtain an explicit expression for kβ:
The strategy is such that kβ is a negative number instead of what is proposed in the literature.2 In Stockhouse et al. (2021), is introduced in order to erase at the first order the coupling between platform and rotor dynamics, and therefore kβ is positive, defined by
In Lackner (2009), a platform pitch control involving a parameter equivalent to kβ is assessed, and a numerical approach leads to defining kβ<0, as for Eq. (46), but in a unique way. Here, Eq. (46) provides the reader with an explicit value of kβ that is different for any turbine and floater characteristics and operating point.
2.5.1 Expected effect on platform dynamics
Figure 8 shows a Bode diagram of the second-order low-pass filter Gplt. In other words, it shows how the ζplt value can affect the damping of platform oscillations.
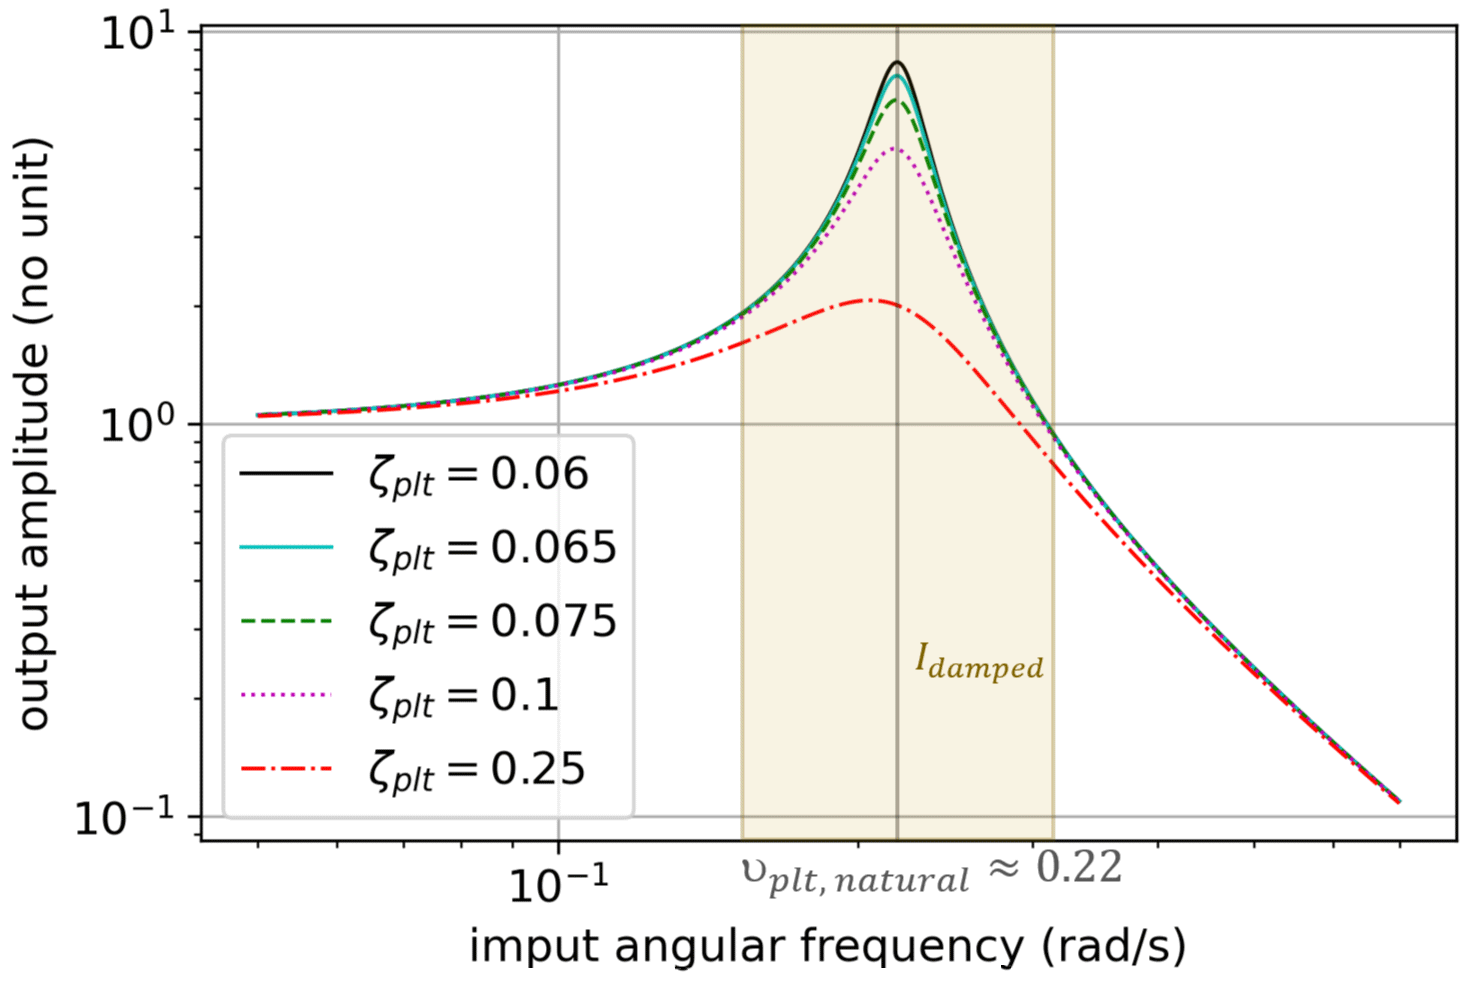
It can be observed that ζplt has a significant effect on the damping of platform oscillations only for angular frequencies . The yellow vertical band in Fig. 8 shows the interval of angular frequencies Idamped, arbitrarily defined by
which are directly damped when ζplt increases. Therefore, it is to be expected that the ζplt-fixed strategy will be well fitting to reduce platform motion and tower loads when their variations happen at an angular frequency ν∈Idamped.
2.5.2 Expected effect on rotor dynamics
In this part the first-order effect of the ζplt-fixed strategy on the rotor dynamics is analyzed. The state-space representation of the FOWT dynamics is given by Eq. (16). By considering a disturbance and open-loop input equal to 0 (i.e., ), this leads to the following linear equation, truncated at the first order:
where
Moreover, the following inequalities are verified for an above-rated operating point:
The first inequality comes from Eq. (29) (note that in Sect. 3, it is considered τg=0). The third inequality is a consequence of the assumption that the ζplt-fixed strategy aims at increasing the damping of the platform. This implies that
meaning that the first-order coupling between platform dynamics and rotor dynamics will increase when ζplt increases if the ζplt-fixed strategy is applied. Thus, if the characteristic time of platform dynamics is small enough, the equation truncated at the first order is valid, and it is to be expected that, at least for some tunings of the PI controller, the ζplt-fixed strategy would increase rotor speed variations.
In this section, it is analyzed how the new control strategy described in the previous section affects platform and rotor dynamics and, especially, tower loads and rotational speed.
The simulation tool used is OpenFAST v3.4.0 (https://github.com/OpenFAST/openfast (last access: 22 February 2022), and the FOWT model considered is the IEA 15 MW wind turbine mounted over the UMaine VolturnUS-S semi-submersible floater (Allen et al., 2020). Initially simple constant wind and monochromatic waves are tested in order to verify the analytical developments of the previous section. Then a test case more representative of the industrial design of FOWT is considered by testing a DLC1.2. For the latter, the simulation considers only one seed of 3600 s with aligned wind and irregular waves. For this time simulation, this is statistically equivalent to 600 s and six seeds.
3.1 Setup of the controller
The controller strategies are implemented in the ROSCO environment (ROSCO, 2021), modifying the existing pitch control. The rest of the controller remains basically the same. Values of kP, kI and kβ are continuously updated following the explicit expression given in Eqs. (36) and (46), then low-pass-filtered. After some tests, for all the considered simulations, ζrot=0.6 and νrot=0.01 are chosen for the PI controller's tuning. This choice ensures that most of the wave spectrum (which peaks at T≈11 s, i.e., ν≈0.57 rad s−1) and platform dynamics natural angular frequency (νplt≈0.22 rad s−1) fall outside of the Grot passband. This strategy is known in the literature as a detuning strategy. We consider here a very simplified version of the detuning strategy, since the tuning of the PI controller is not the main object of this article. Since the platform pitch control (βcomp) has a damping effect mainly on the frequencies close to the natural frequency of the platform, its tuning can reasonably be considered independent from the tuning of the PI controller, which is already well assessed in the literature. The blade pitch saturation defined in ROSCO is switched off in order to better observe the effect of the platform pitch control strategies. Moreover, τg compensation is not assessed in this section, as it has already been studied by Stockhouse et al. (2021). Hence, hereafter. The interactions between blade pitch saturation, or τg compensation, and the proposed blade pitch controller strategy should be investigated in future work.
3.2 Still wind and monochromatic wave
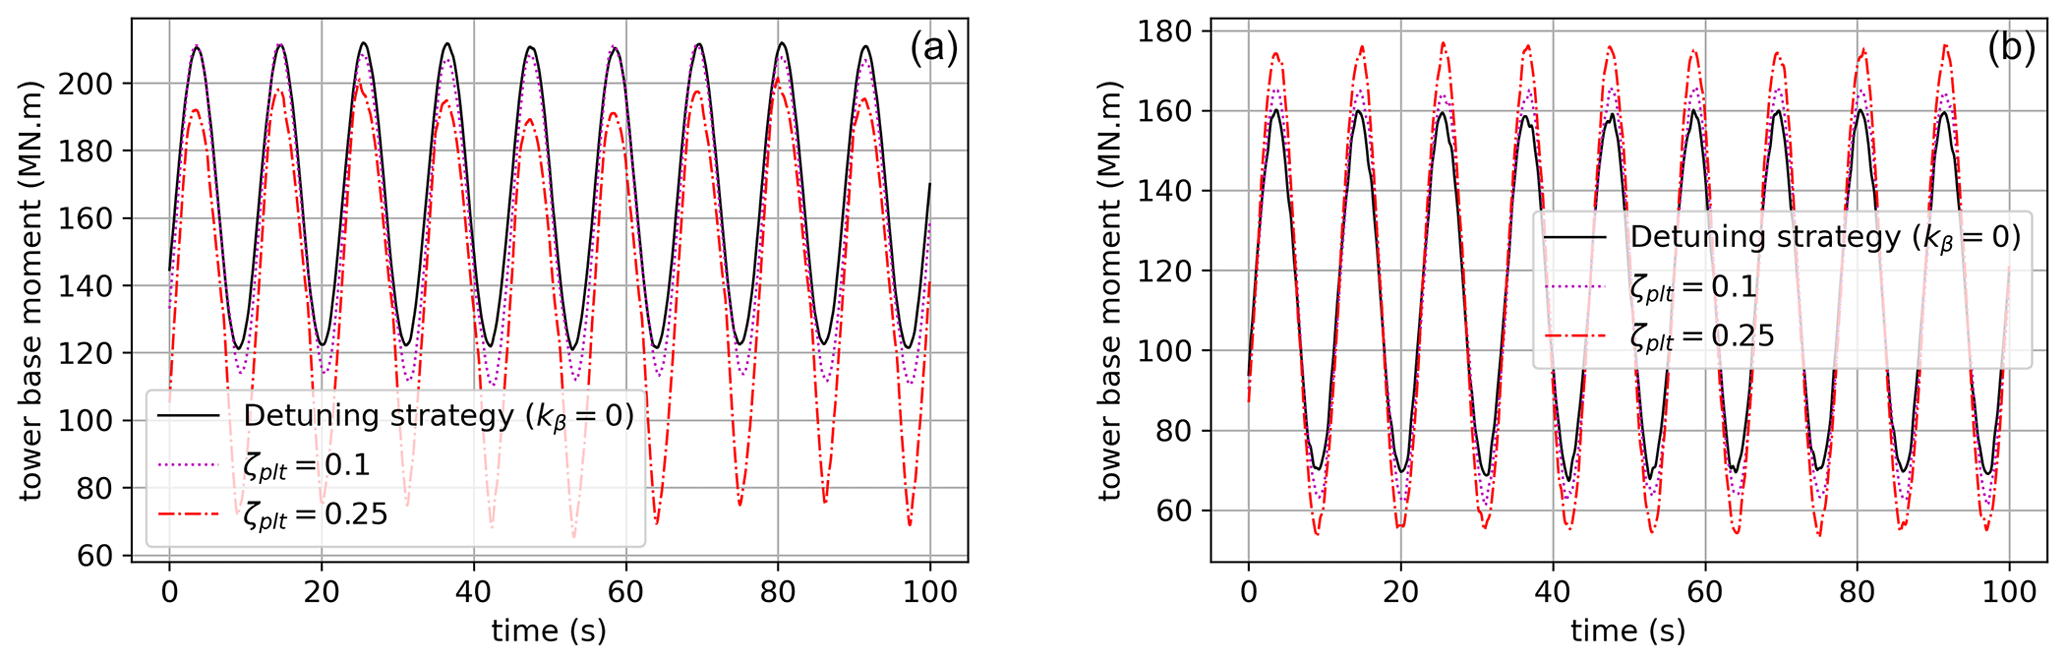
For the still wind and monochromatic wave condition, the ζplt-fixed strategy is compared to kβ=0, i.e., the detuning strategy. Two ζplt values are tested: ζplt=0.1 and ζplt=0.25.3 Thus, the platform is expected to behave like an under-damped second-order oscillatory system. Table 4 states external conditions for test cases with still wind and monochromatic wave. The platform is subjected to a monochromatic wave of a period of 11 s (a representative value for the fundamental period of a wave spectrum) and 28.75 s (the natural period of the platform). The wave height is the same, but in the corresponding linear model the resulting input's (τwave) amplitude is different (as it also depends on the wave period). Hereafter, results are plotted over time and are drawn for a 100 s time interval in a simulation of a long time period so that the operating point is reached. When necessary for a better understanding, results are reported for a longer interval.
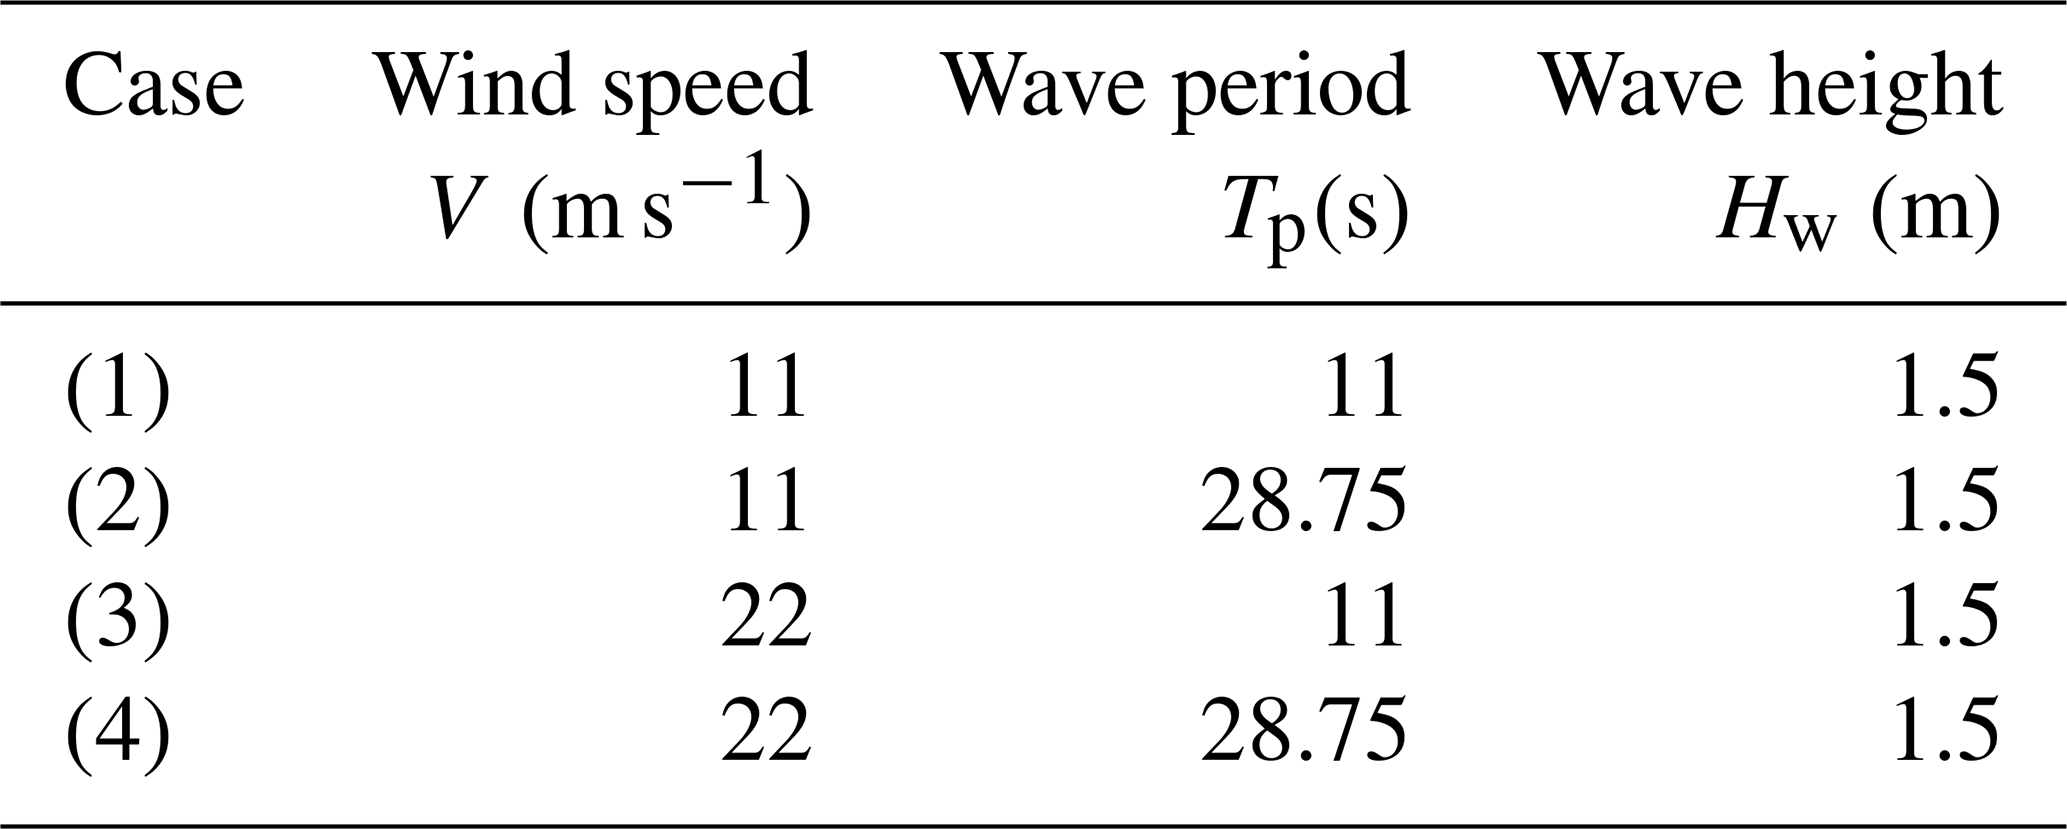
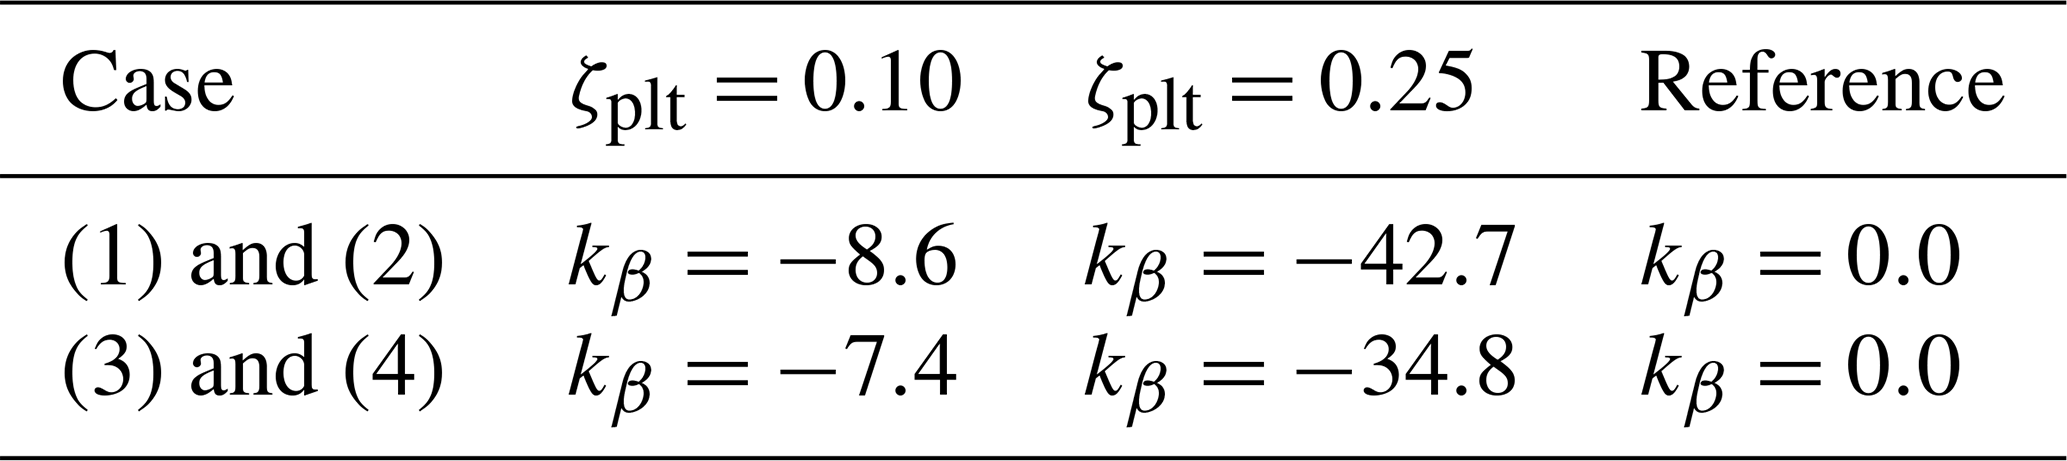
This test considers fixed operating points; thus, kP, kI and kβ have almost fixed values. Table 5 gives the mean value of kβ for test cases 1–4. Cases 1 and 2 as well as cases 3 and 4 are gathered together as they use the same mean value of kβ.
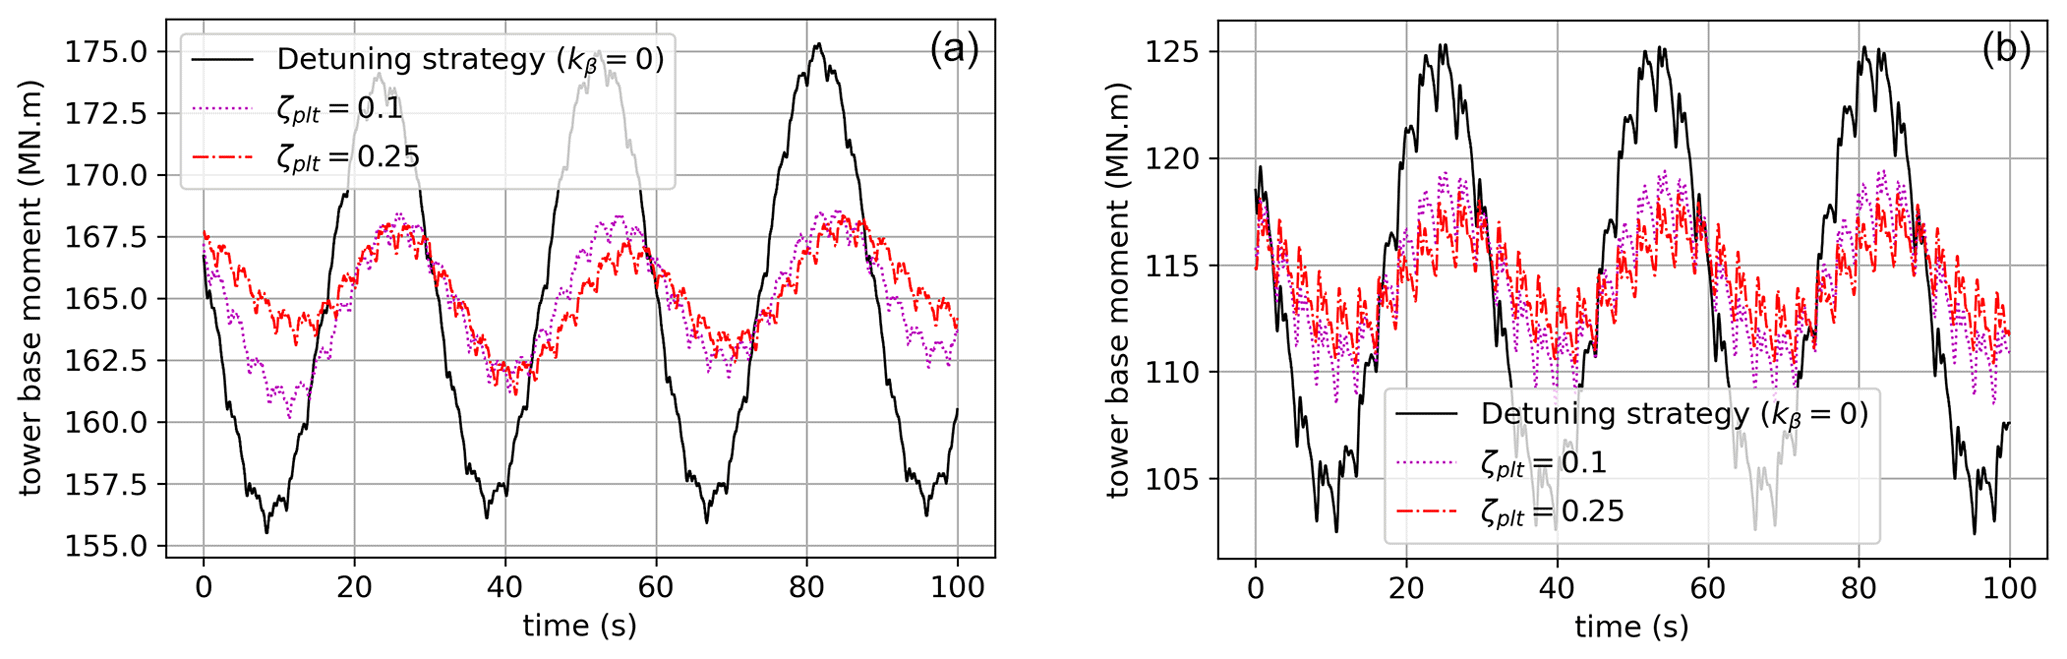
Figures 9 and 10 show the forced oscillations of the platform when it is subjected to several test cases (see Table 4). Increasing ζplt reduces platform oscillations, especially when the wave period is close to the natural period of the platform. Even though the system is much more complex in those simulations, this general behavior was forecast (see Sect. 2.5.1 and Fig. 8) by the damping analysis on the two-dimensional linear model described in Sect. 2.4.2. The damping effect is also shown in Figs. 12 and 13 where the tower base reaction moment is plotted over time. For the monochromatic wave with a period of 11 s, the damping of the ζplt-fixed strategy is not evident, while it becomes easily observable as soon as the input's frequency gets close to the platform's natural frequency.
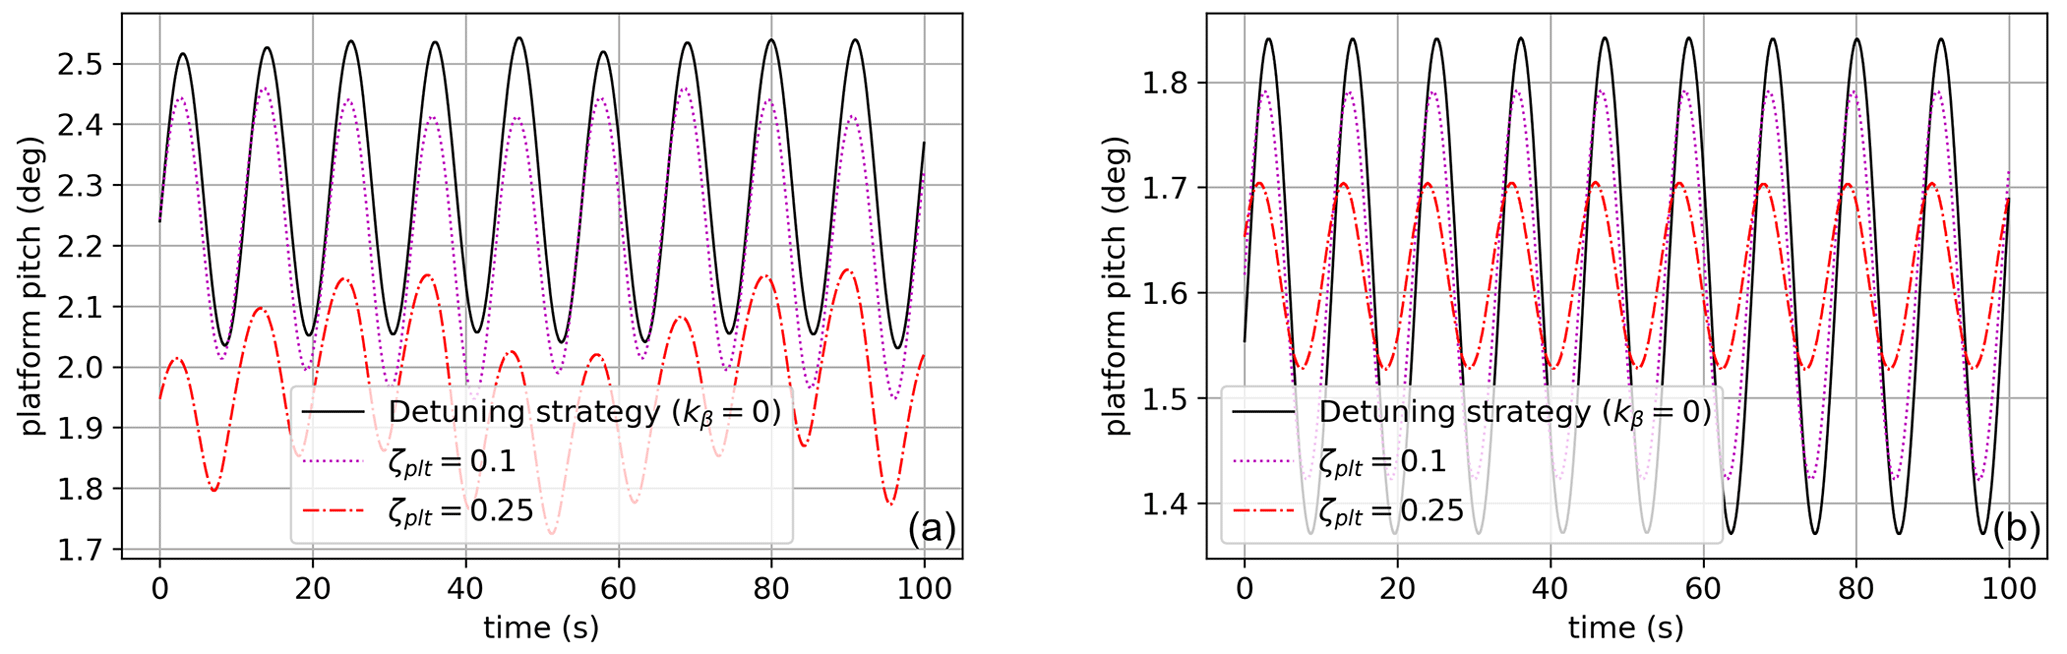
Figure 9Platform pitch Φ (deg) for a monochromatic wave of a period of 11 s (test case 1, a, and 3, b).
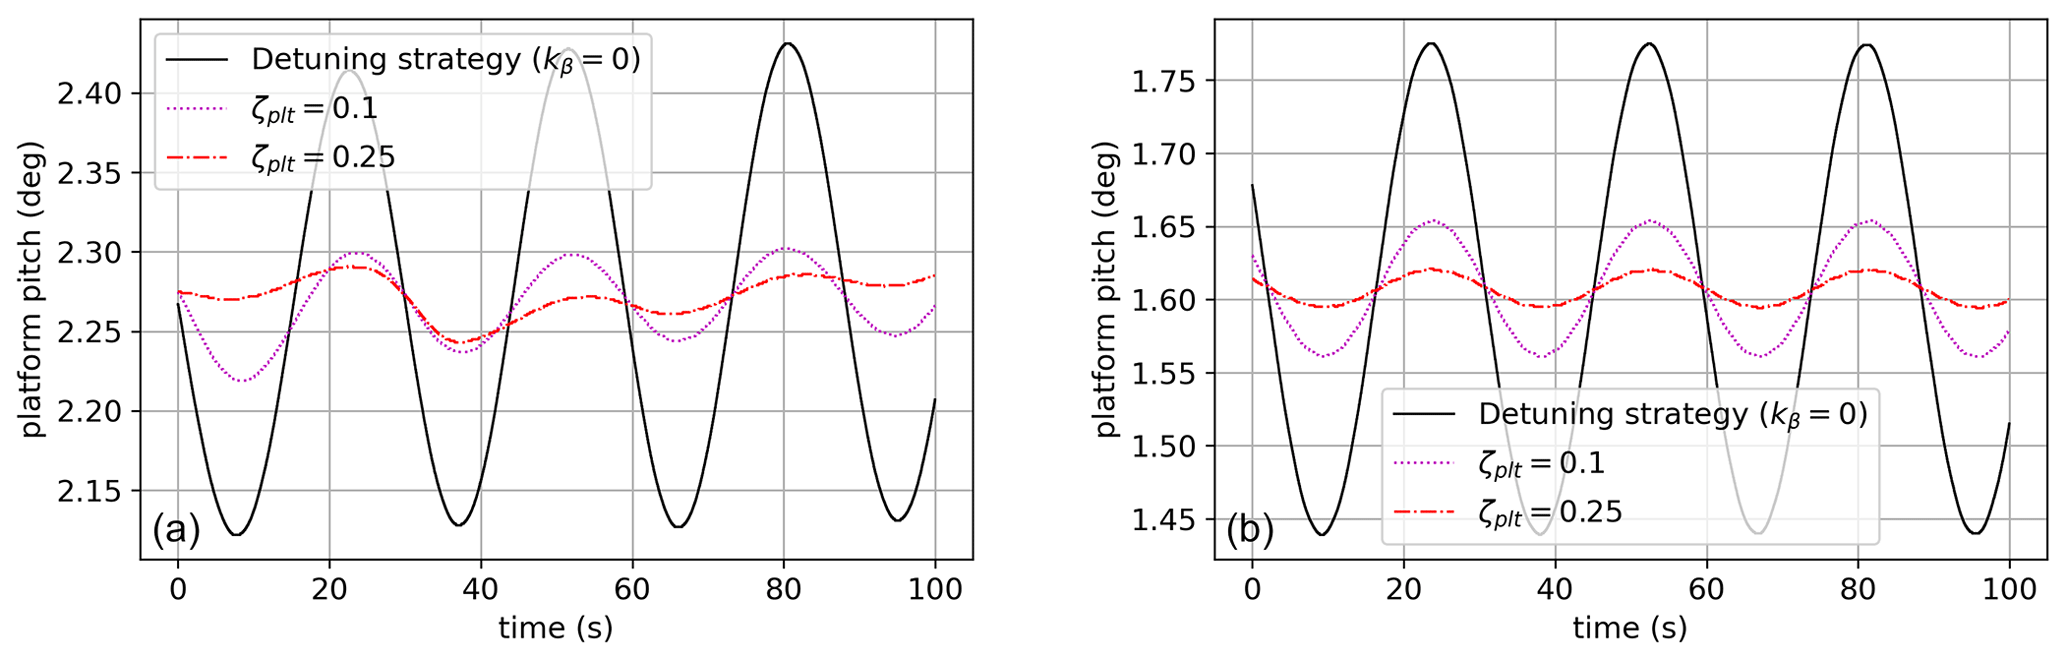
Figure 10Platform pitch Φ (deg) for a monochromatic wave of a period of 28.75 s (test case 2, a, and 4, b).
Figure 9 shows a reduction in the amplitude of the platform oscillations and also in the mean value. This was unexpected. It is motivated by the difference in the mean value of the blade pitch. In Fig. 11, one can see the high values in the peaks for ζplt=0.25 with respect to the other curves. The minima are comparable, and the mean is higher. This leads to a lower thrust force on average, which reduces the mean value of the platform pitch. The peaks in the blade pitch can be motivated by the combination of high demanded damping (ζplt=0.25) with the proximity to the rated wind speed (the controller is on the boundary of regions 2.5 and 3) and also the wave period. In fact, for case 2, where the wind speed is the same but the wave period is much higher, the mean value of the platform pitch does not change.
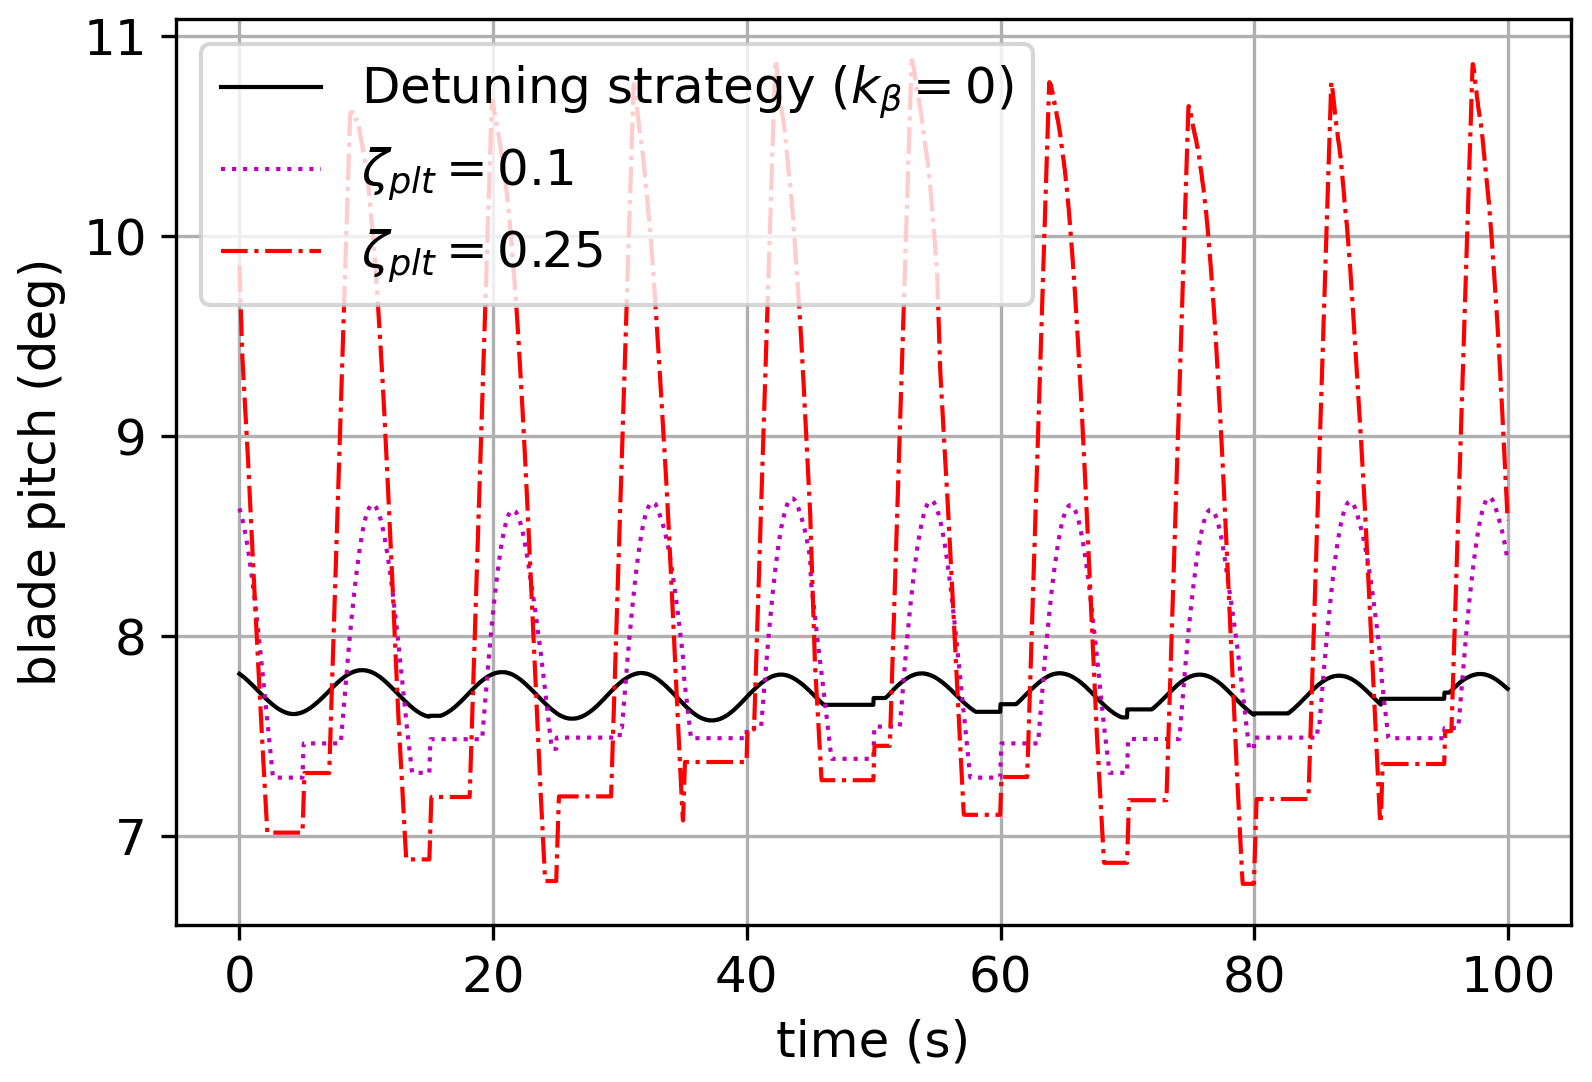
Figure 11Blade pitch (deg) evolution over time for a monochromatic wave of a period of 28.75 s (test case 1).
The ζplt-fixed strategy's effect on rotor dynamics is not easily described by a second-order linear equation: it involves the coupling between platform and rotor dynamics, which is analyzed at the first order in Sect. 2.5. From this analysis, the ζplt-fixed strategy was expected to increase the coupling between platform and rotor dynamics for a short characteristic time. In Figs. 14 and 15 it can be observed that for a short characteristic time (11 s) the ζplt-fixed strategy increases rotor speed variations but not for a longer characteristic time, such as 28.75 s (for which it behaves slightly better than for the kβ=0 strategy).
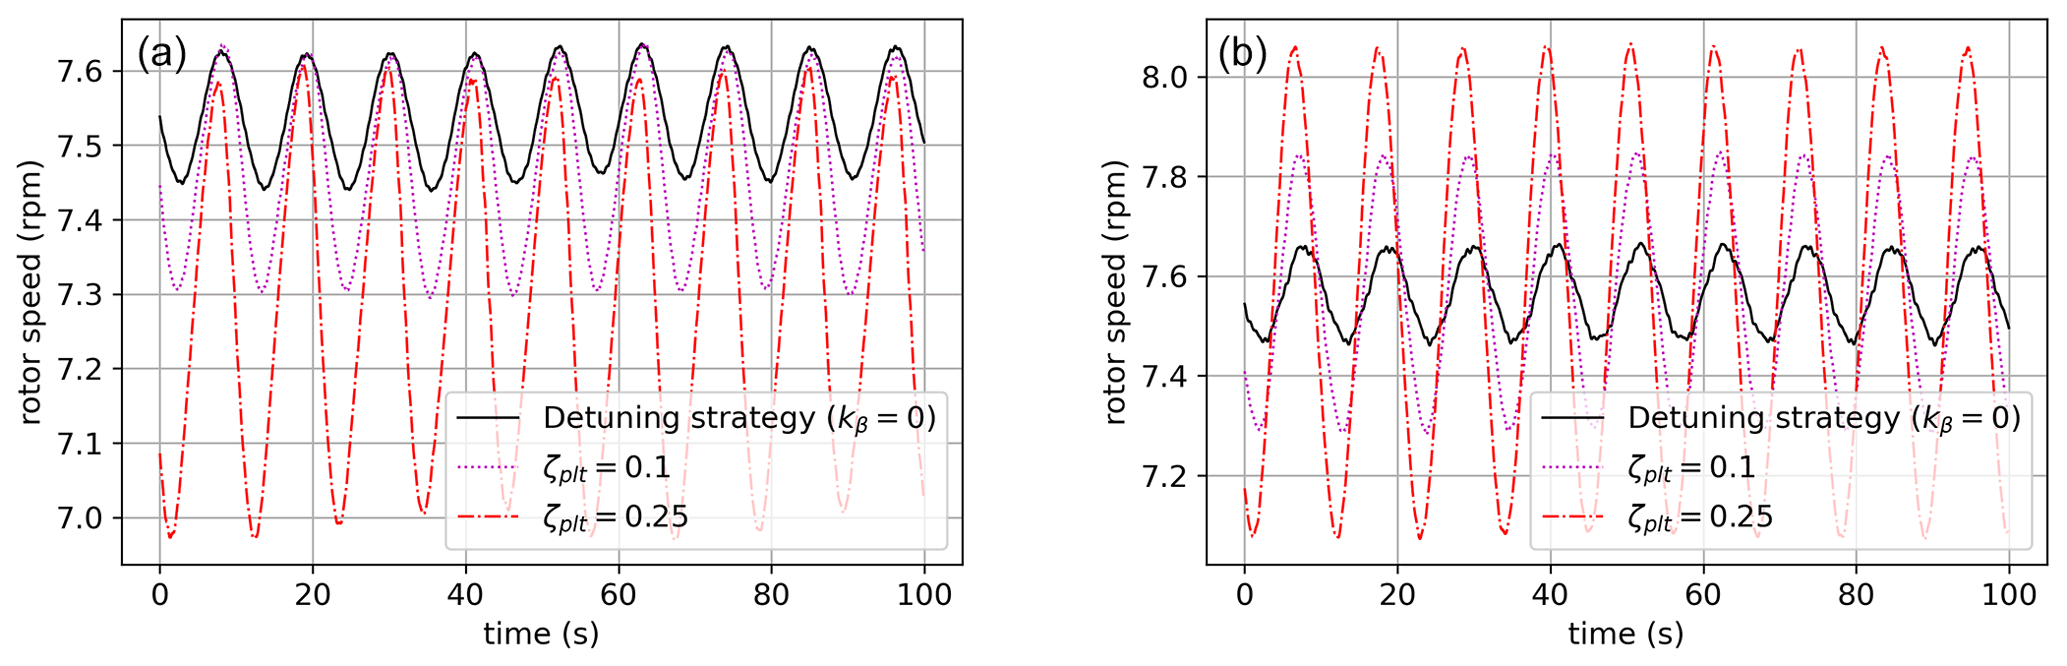
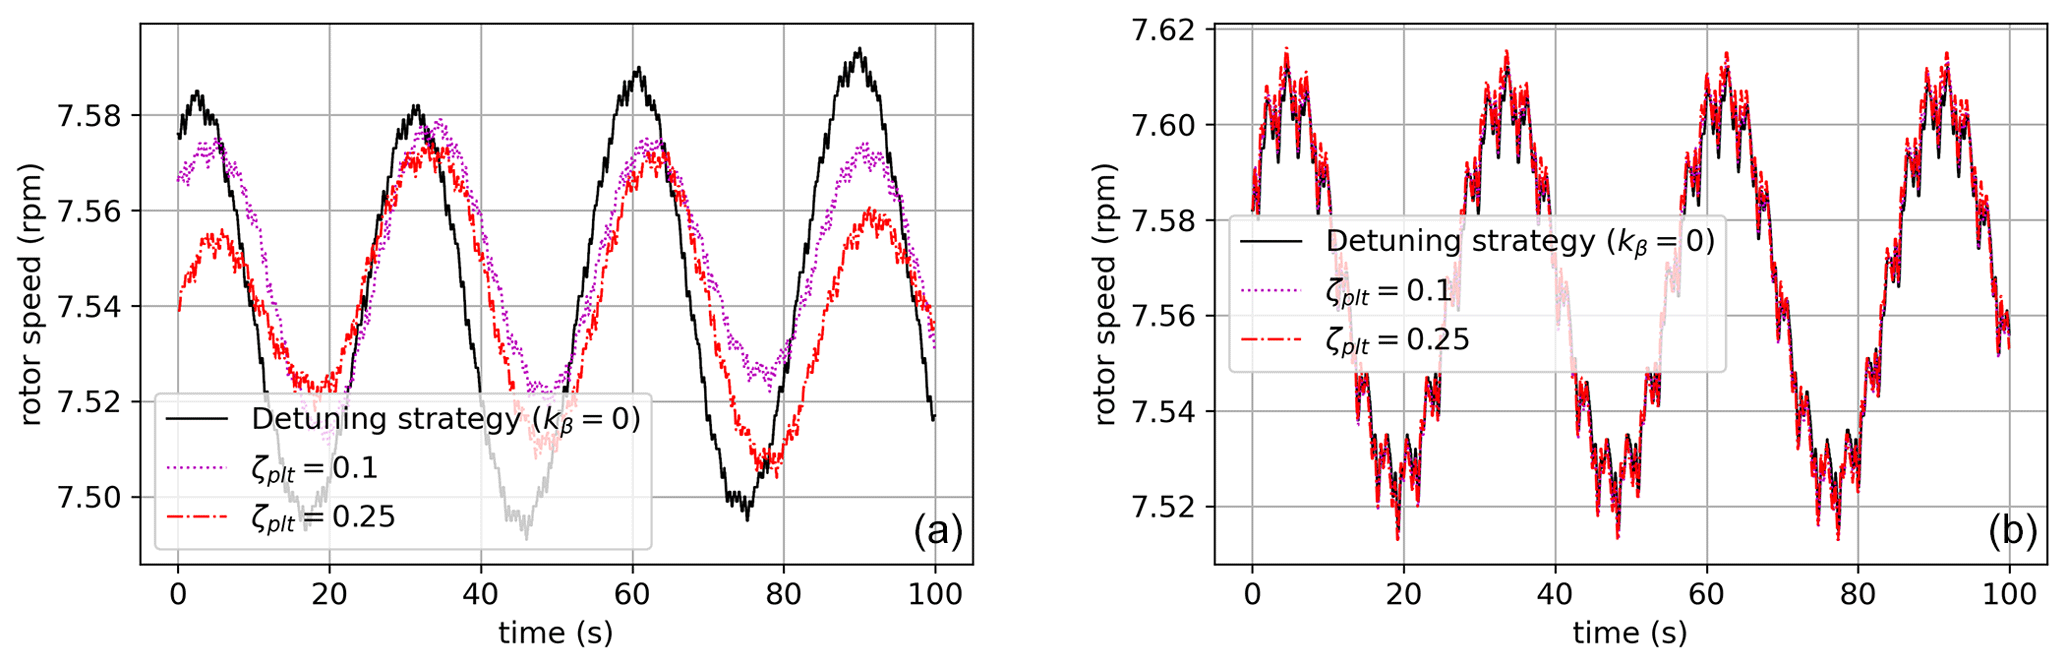
To conclude this part of the tests, the ζplt-fixed strategy performs very differently depending on the oscillatory frequency of the platform:
-
For angular frequencies , the ζplt-fixed strategy is very effective when it comes to the damping of platform oscillations, as seen in Sect. 2.5 (see Fig. 8). The tests highlight that the ζplt-fixed strategy is reducing both tower loads and rotor speed variations in turbulent wind conditions.
-
For angular frequencies outside the previous set, the ζplt-fixed strategy is less effective for damping platform oscillations. Tower load reduction by the ζplt-fixed strategy is therefore barely visible, whereas rotor speed variations are actually amplified, especially when comparing this strategy to the reference strategy.
3.3 DLC1.2 tests
The tests presented hereafter are more representative of what is typically done during the design or verification of offshore wind structures. They are inspired by DLC1.2, for normal power production in normal turbulence and a normal sea state, as described in the IEC standards. This kind of load case aims at assessing the fatigue design criteria.
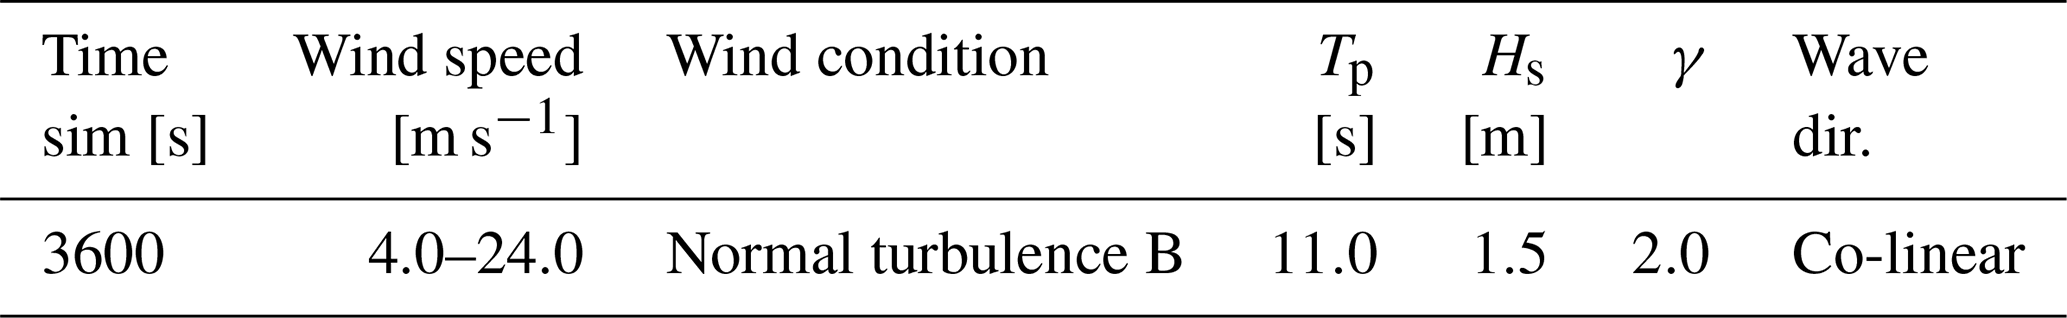
Kaimal's turbulence model is considered following IEC 61400 v.3 for a wind turbine of turbulence type B, for average wind speeds ranging from 4 to 24 m s−1, as described in Table 6. The wind box is generated by the TurbSim tool developed by the NREL. For the waves, JONSWAP distributions are considered with a significant wave height of Hs=1.5 m, wave period Tp=11.0 s and γ=2.0. Wind and waves are considered to be aligned in the same direction. All the degrees of freedom of the floating platform are allowed, including the surge motion. In other words, the numerical twin reproduces the actual motion of the FOWT, according to the accuracy of the chosen model. Tower and blades are fully deformable.
As with the previous test cases, the ζplt-fixed strategy is compared to the detuning strategy; i.e., kβ=0. Another term of comparison is considered in this section. The ζplt-fixed strategy considers a kβ that adapts to the wind and evolves during the simulation. This is different from what is implemented in the ROSCO controller (ROSCO, 2021), which considers one kβ, tuned only once for a given FOWT and applied for every wind speed. This strategy is considered in this section as a second term of comparison. For the latter, the kβ value is set to −9.35, i.e., the value tuned for this FOWT in https://github.com/NREL/ROSCO/blob/main/Test_Cases/IEA-15-240-RWT-UMaineSemi/DISCON-UMaineSemi.IN (last access: 1 December 2022).
The level of damping imposed on the platform is ζplt fixed =0.1. This value is found to be the most interesting to be tested for this floater-and-WTG configuration. Other tests with higher values of imposed damping show less interesting results. The choice of the right ζplt for each FOWT system is important and may require several iterations before a conclusion can be reached.
Table 7 details the strategies considered for the benchmark in this section, reporting the difference in the choice of the platform pitch compensation.
Table 7The controller strategies considered for the DLC1.2 tests.
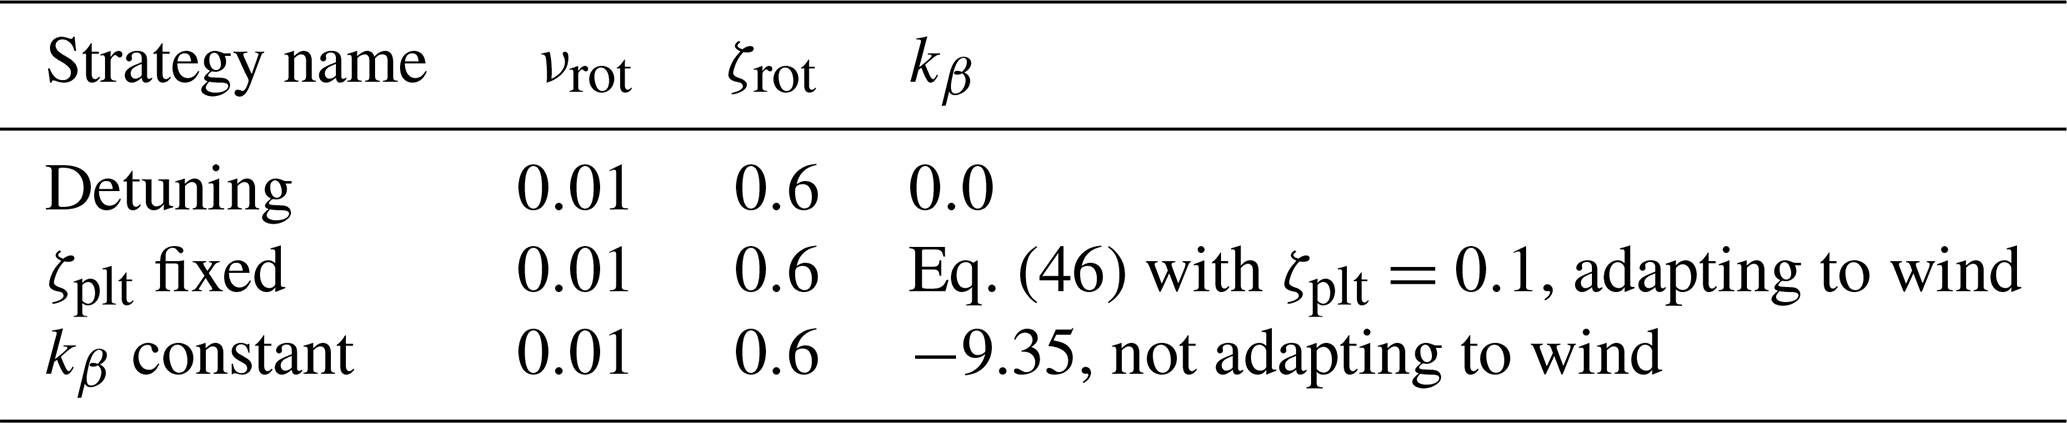
Figure 16 shows how kβ evolves for some cases of the simulation pool. The platform pitch compensation also takes place for the below-rated wind speeds, where it is the only source of pitch control. The behavior in below-rated wind speeds is more dynamic than in above-rated wind speeds, where the floating feedback is more stable. As remarked in Sect. 2.5, kβ for the ζplt-fixed strategy is a negative value.
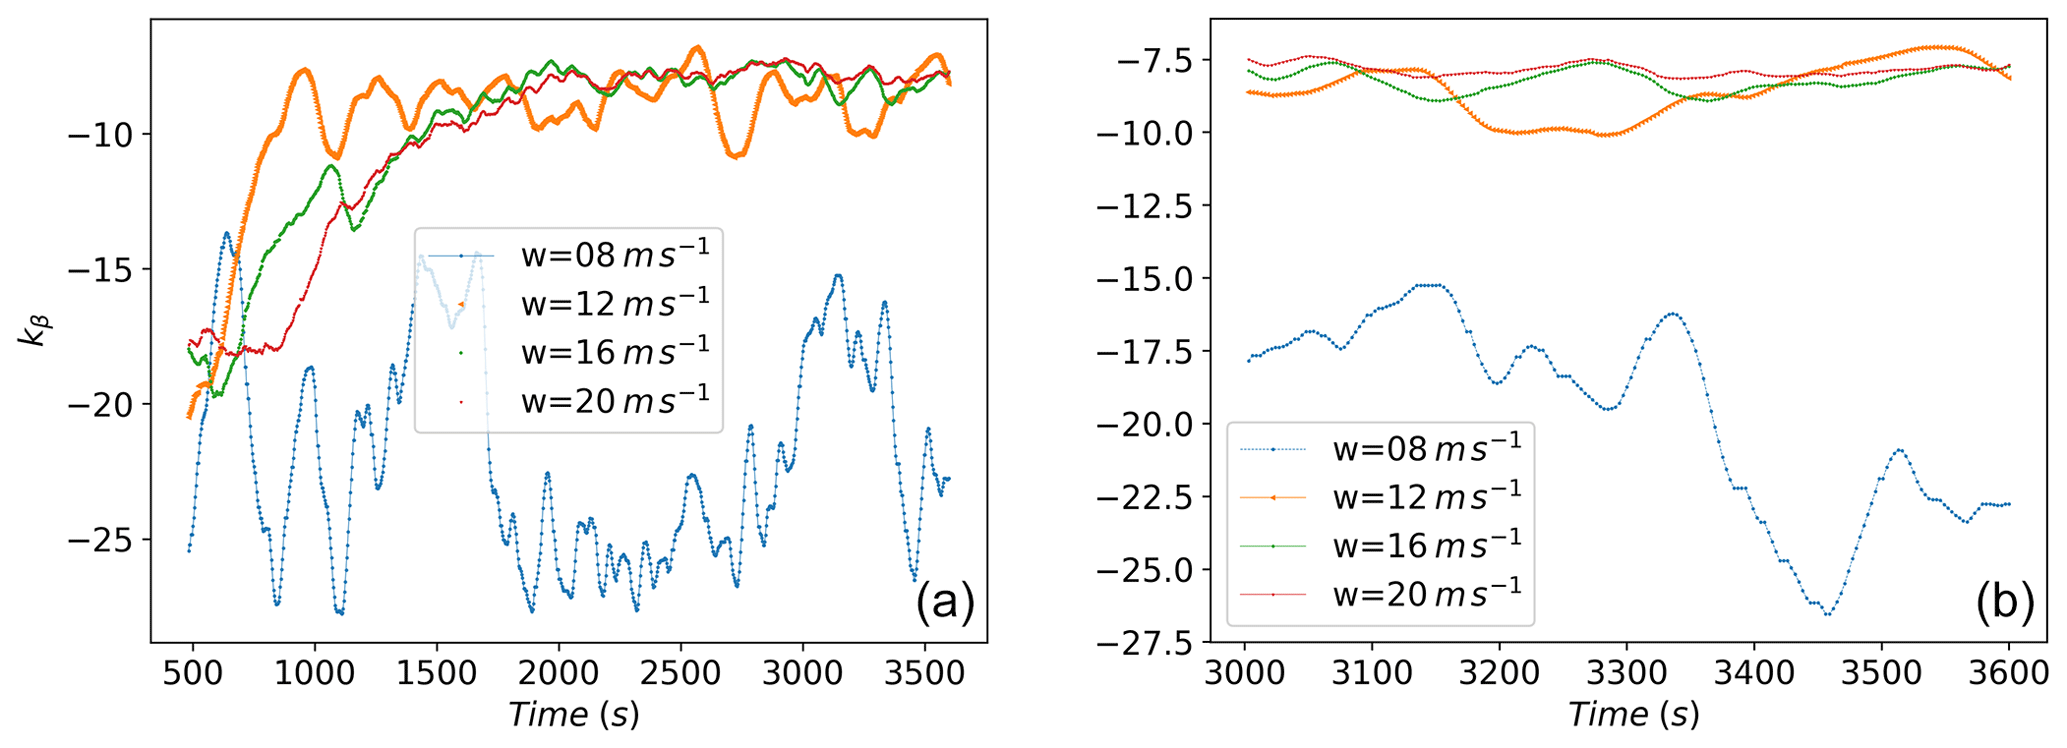
Figure 16The evolution of kβ for some of the simulations. Panel (b) is zoomed in to facilitate visualization.
From the time series of the tower bottom moment, a rainflow algorithm is used to count the cycles following the American Society for Testing and Materials (ASTM) normative (ASTM, 2017). The design equivalent load (DEL) is obtained by using a Wöhler's curve with a single slope of exponent m=3.0. Platform pitch, power, rotor speed, blade pitch, tower load and tower DEL results of the simulations for the comparison are resumed in Fig. 17. The ζplt-fixed strategy reduces platform pitch motion for all wind speeds when compared to the detuning strategy, and it gives comparable or better results with respect to the kβ-constant strategy. The three strategies give comparable results when looking at power generation, rotational speed and mean values of blade pitch. However, for the 20 m s−1 wind speed, the kβ constant shows an overspeed in the rotor (max rotor speed) and a higher value in the platform pitch standard deviation. This coupling among platform pitch motion, rotor speed and blade pitch affects the DEL at the tower base. It helps to show the benefit of considering a kβ that adapts to the wind speed and the different wind turbine operations, while considering a single kβ for the FOWT system has the potential to result in irregular performances.
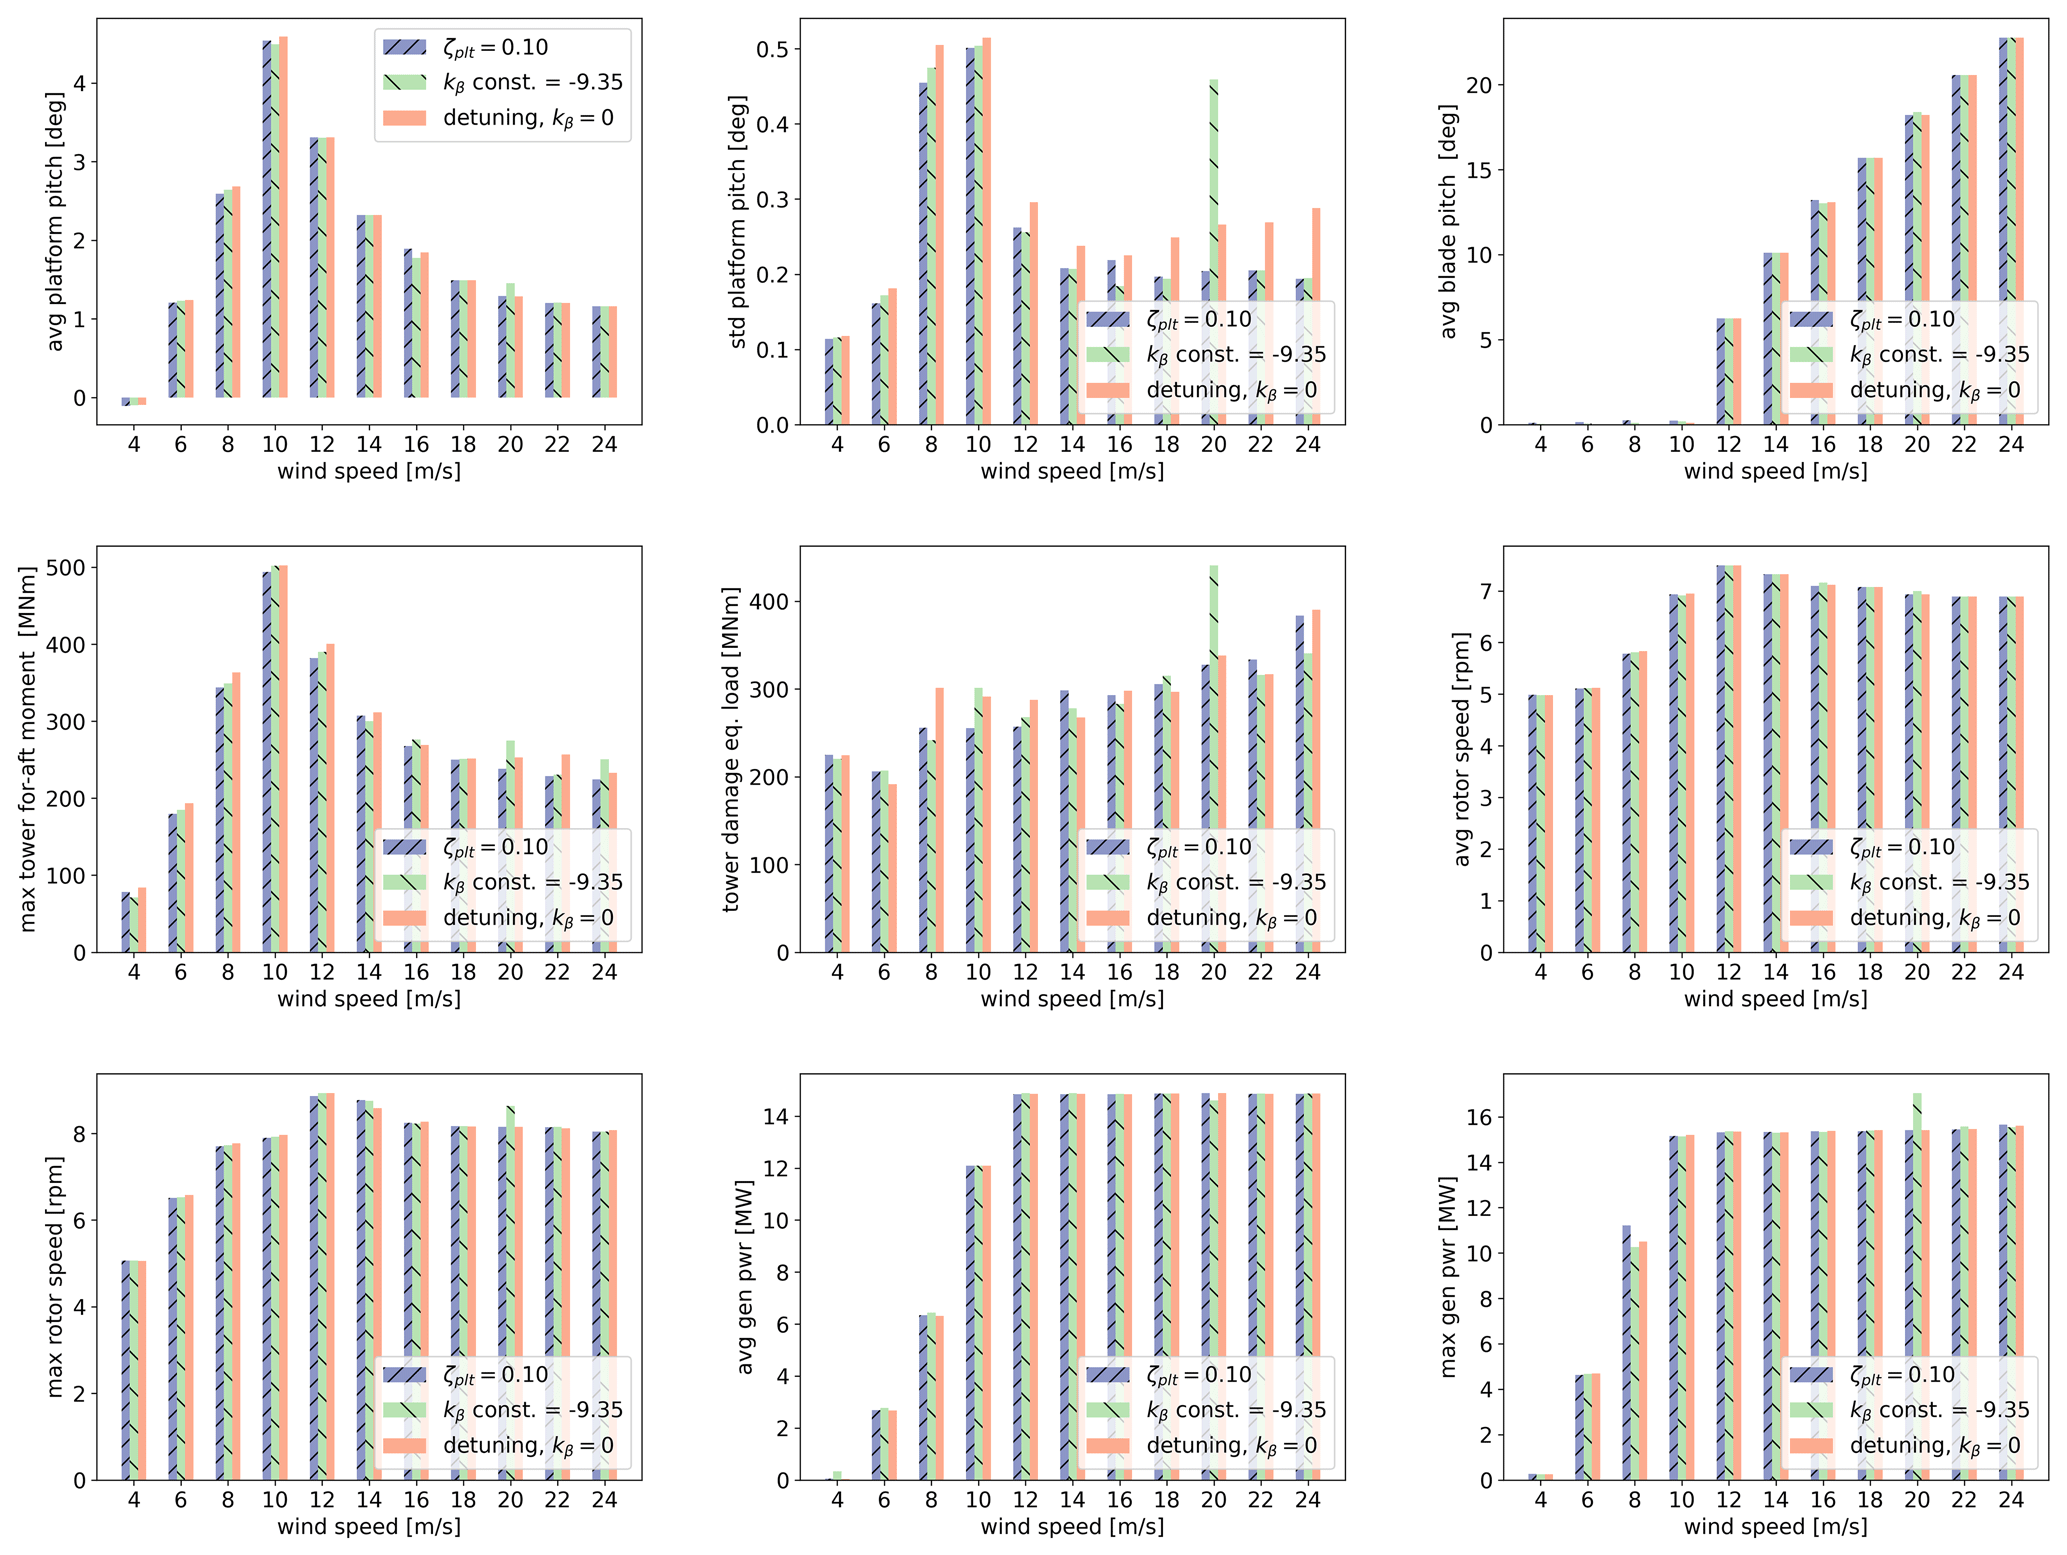
Figure 17Comparison results for the DLC1.2 for the UMaine floater with the IEA 15 MW WTG. Outputs show statistics for platform pitch (average and std), blade pitch, tower bending moment (max and damage equivalent load), rotor speed (average and max) and generator power (average and max).
Around rated wind speed, the ζplt-fixed strategy reduces loads in the tower and fatigue DEL when compared to the other two strategies. For high wind speeds, the gain is less evident, especially when comparing to the kβ-constant strategy, which has a lower DEL for 24 m s−1. On average there is a gain of around 15 % of the DEL with respect to the detuning strategy. This gain is less evident when compared to the kβ-constant strategy. Nevertheless the ζplt-fixed strategy seems to perform better around rated wind speeds, and it gives a more homogeneous performance than the kβ-constant strategy. Table 8 shows, for the 10 m s−1 case, a deeper comparison by reporting the statistics of the quantities of interest extracted from this simulation. For this wind speed, an extract of time series for some outputs of interest is shown in Fig. 18. It is intended to give a better view of the damping effect given by the ζplt-fixed strategy.
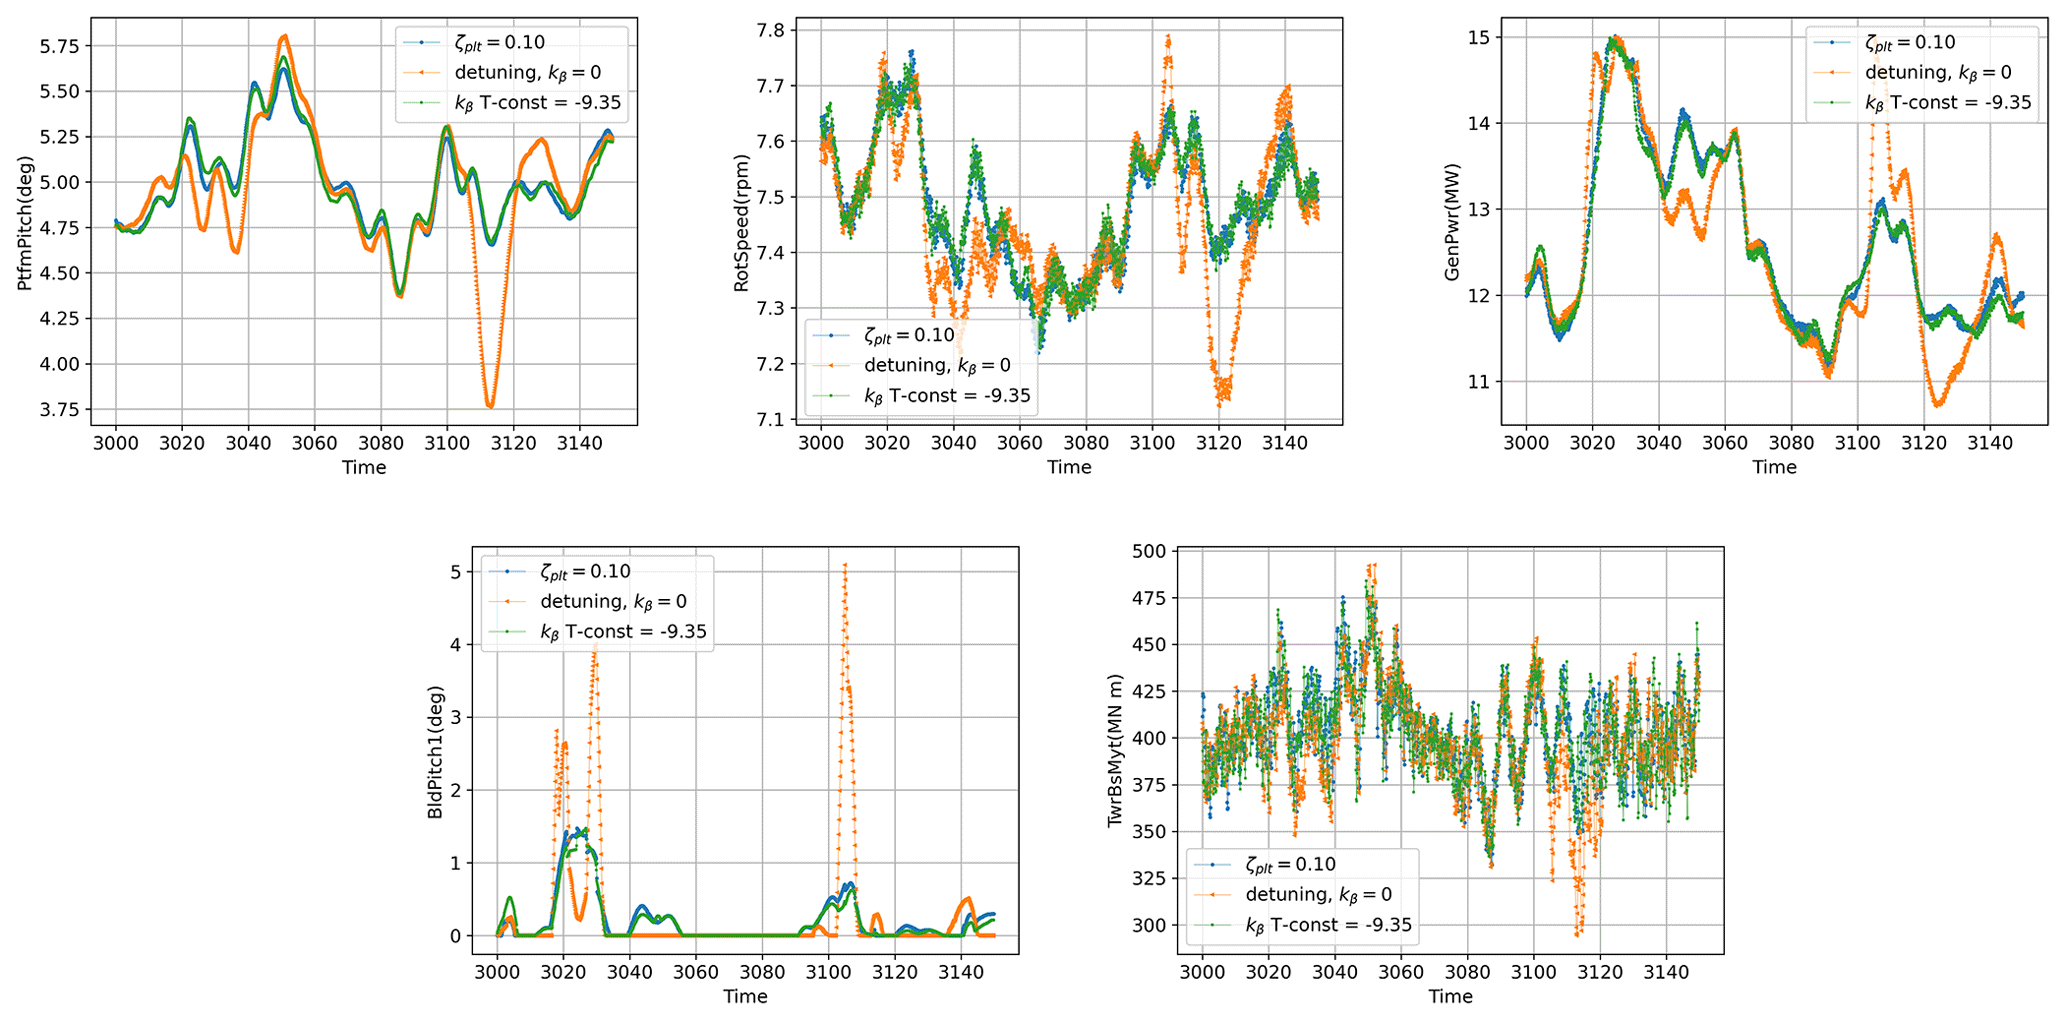
Figure 18An extract of the time series concerning the case with a mean wind speed at 10 m s−1. The ζplt-fixed, kβ-fixed and detuning control strategies are compared in the platform pitch, rotor speed, generator power, blade pitch and tower bending moment.
Figure 19 reports a deeper analysis of the fatigue damage. In fact, the stress in the tower bottom section is obtained by considering the design proposed by UMaine in Allen et al. (2020). Then, an offshore Wöhler's curve is considered with two slopes in the log–log domain: m=3.0 for loads with less than 1.0 million cycles and m=5.0 for loads with a higher number of cycles. These are typical values proposed by the DNV for offshore steel structures. This analysis leads to obtaining an estimation of the 25-year damage at the tower bottom. The gain is much more evident than the DEL. This is due to the second slope, m=5.0, which amplifies the changes in the load amplitudes. Offshore WTGs in production are mostly subjected to a very high number of cycles of small amplitudes. This figure also shows the effect of the turbulence on the fatigue. In fact, looking at the detuning strategy, up to 12 m s−1, the shape of the damage distribution follows the one of the thrust curve. However, since the turbulence is a percentage of the average wind speed, from 16 m s−1, the damage starts increasing again. In general, the ζplt-fixed strategy is more adapted than the other two strategies to the fatigue of the structures. It demonstrates a reduction of approximately 20 % in the cumulative damage compared to the kβ-constant strategy and of approximately 30 % compared to the detuning strategy.
Table 8Statistics for results concerning the case with a mean wind speed at 10 m s−1. For each quantity of interest, there is the comparison of the minimum, maximum, mean and standard deviation values produced by the ζplt-fixed, kβ-constant and detuning control strategies.
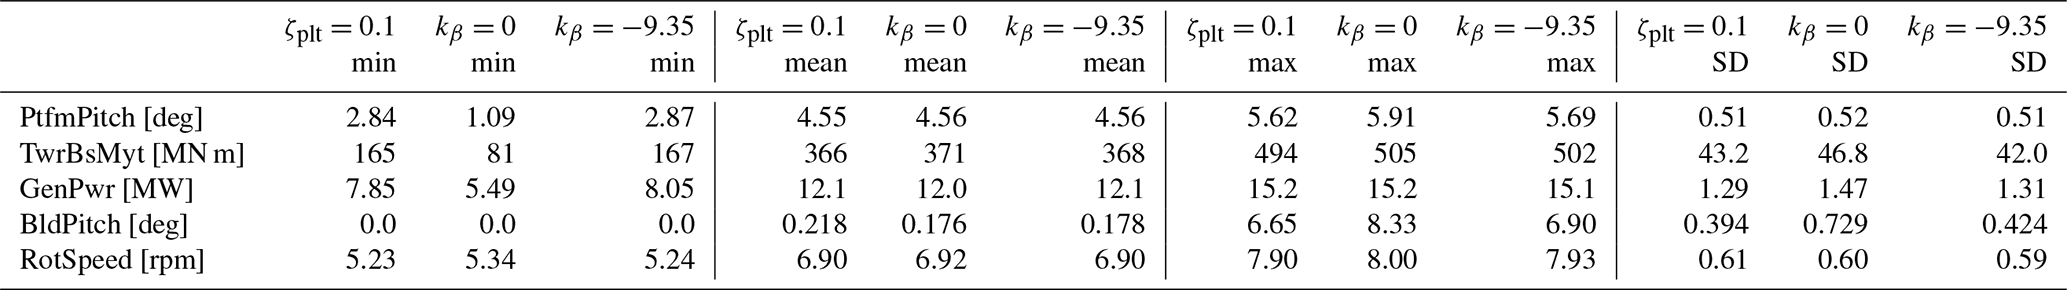
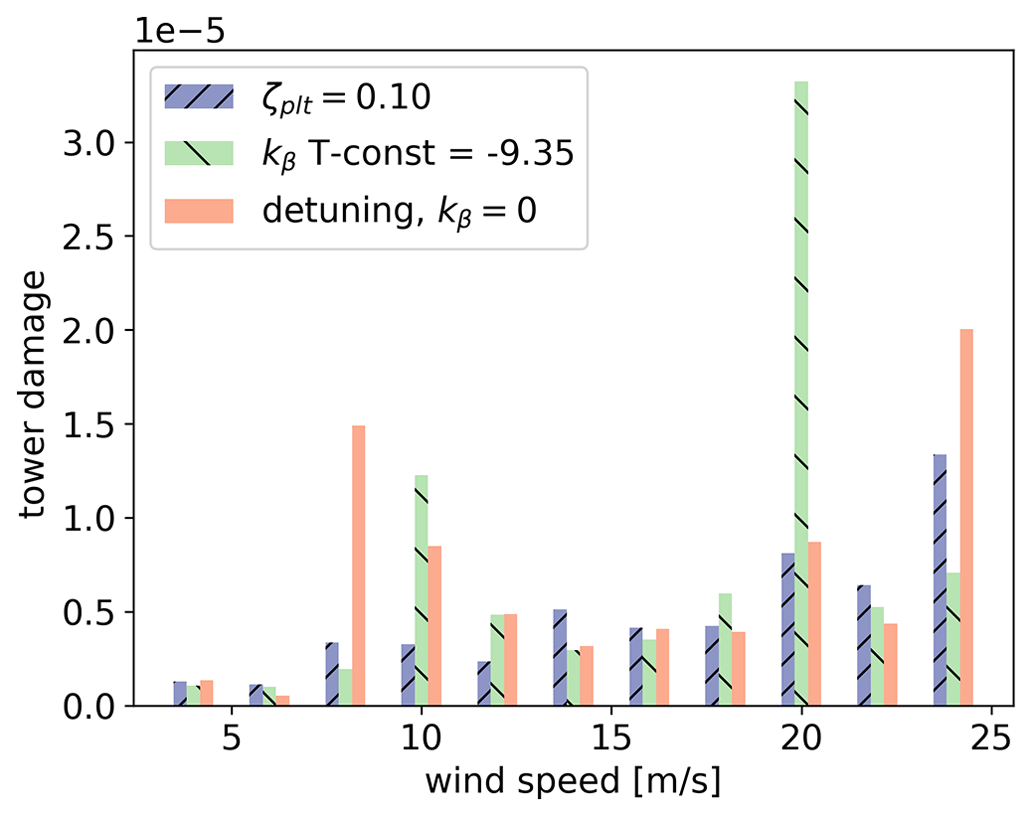
Figure 19The fatigue cumulative damage at the tower bottom by using rainflow counting and Miner's linear rule. The damage is obtained considering the tower base design proposed by UMaine and Wöhler's bi-linear curve with m=3.0 up to 106 cycles and m=5.0 after, as proposed by the DNV for offshore steel. The probability of occurrence of each wind is equal, without any Weibull distribution. ζplt=0.1 reduces about 20 % of the overall cumulative damage when compared to the kβ-constant strategy and about 30 % with respect to the detuning strategy.
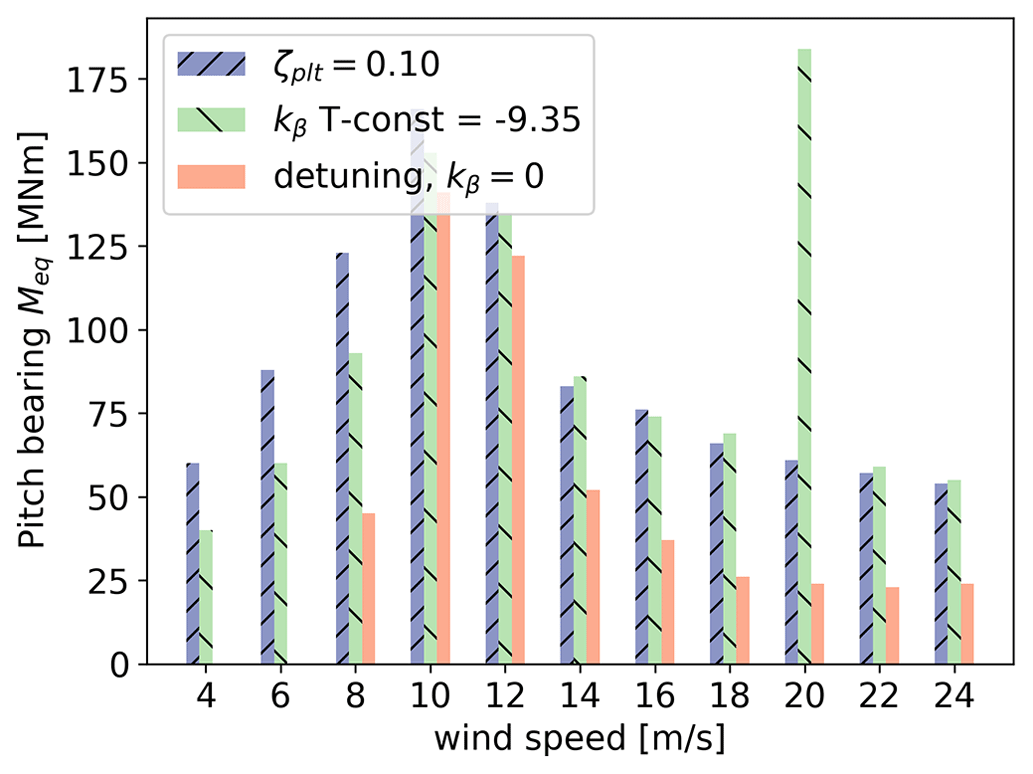
A specific fatigue analysis of the pitch bearing is realized by following Shan et al. (2021), where three methods to evaluate the fatigue of the pitch bearing are compared, leading to similar results. The second method is implemented here in order to quantify the increment in the pitch bearing fatigue caused by the ζplt-fixed and kβ-constant strategies with respect to the detuning strategy.
The bearing life is inversely proportional to the cube of the bearing loading. From the overturning moment acting on the bearing, the equivalent loading at N revolutions of the pitch bearing is given by
where i is the time step of the simulation. The discrete integral considers the product of the time series of the overturning moment Mi and the blade pitch variation Δβi, over the entire simulation. To take into account the fact that, for each wind speed, the mean blade pitch is different, the 90∘ of the pitch range is divided into 30 sectors, each one corresponding to a different zone of the bearing. This corresponds to considering a tooth function in the integral of Eq. (53), and it is well explained in Fig. 11 of Shan et al. (2021). Figure 20 reports the damage equivalent loading Meq given by the three strategies. Overall, the fatigue of the bearing is increased by introducing a platform pitch compensation when compared to the detuning strategy. This is an aspect of the control strategy to be considered, and it is an axis of improvement for future work. For the kβ constant, the instability problem taking place at 20 m s−1 between the blade pitch and platform dynamics is underlined by a strong increase in the fatigue of the pitch bearing.
The first part of this paper presents the analysis of the NMPZ related to the system of equations describing the dynamics of a floating offshore wind turbine (FOWT). The equation of the rotor dynamics and the one of the platform dynamics are analyzed in the complex domain to explicitly derive the conditions leading to their respective NMPZs. One of those NMPZs, i.e., the instability given by the blade pitch on the rotor dynamics, is already known in the literature, and a compensation already exists to avoid it. The other one, i.e., the instability given by the blade pitch to the platform dynamics, is a novelty in the community. The effects of the NMPZs are analyzed on two analytical examples: at the beginning both ω and always converge to the right solutions just after the first steps. When both NMPZ conditions are not verified, those tendencies do not change. However, when the NMPZ is verified, becomes so big that jumps into unexpected values without converging to the expected solution. Similarly, when the ω NMPZ condition is verified, becomes so big that ω oscillates before converging to the expected solution. NMPZs can cause important shifts in and unexpected behaviors of both ω and ϕ. For those examples, the position of poles and zeros of the transfer function in the complex domain is analyzed. The beneficial effect of the compensation for the ω NMPZ is shown by plotting the displacements of the poles and zeros from the right to the left part of the complex domain.
In the second part of the paper, the damping analysis is further investigated while proposing a new strategy control for FOWT, named ζplt fixed. This strategy is based on a compensation parameter kβ, which is proportional to the platform pitch velocity. It considers the coupling between the rotor dynamics and the floating platform dynamics. The idea behind this control strategy is to activate the blade pitch to damp the platform motions. An explicit expression linking kβ to ζplt (damping ratio imposed on the platform) is obtained by deriving a second-order filter from the equation of the platform dynamics.
This is different with respect to the existing platform pitch compensation strategies, which aim to decouple rotor and platform dynamics. The difference is underlined by the value of kβ, which is negative for the new control strategy, while it is positive for the ones existing in the literature. For each FOWT system, some iterations are necessary in order to find the optimum value for ζplt. The performances of the ζplt-fixed strategy are tested analytically and numerically by considering an OpenFAST numerical twin of the UMaine IEA 15 MW FOWT. For a test representative of the DLC1.2, the ζplt-fixed strategy allows us to reduce the loads at the tower foundation interface for all the considered wind speeds, without significant losses in terms of power production. When compared to a strategy considering a constant platform pitch compensation, it reduces fatigue damage by about 20 %, underlining the benefit of considering a kβ that adapts to the wind speed and the different wind turbine operations. The damage analysis shows a remarkable gain in terms of fatigue lifetime of the structure but also an increase in the use of the blade pitch bearing.
This work highlights the importance of defining proper controller strategies for FOWTs in order to reduce loads on the structure or to improve the performance. Accordingly, it is useful for helping the industry to achieve its objective in terms of LCOE reduction.
The original ROSCO controller code is available at this address: https://github.com/NREL/ROSCO (ROSCO, 2021). The modified version developed for this research and the data are the property of TotalEnergies OneTech. The availability will be evaluated upon request.
MC contributed to the original idea of the new control strategy, and the development of the numerical twin and the numerical tests, and he is the main contributor to the paper in terms of editing. PM developed the mathematical framework and contributed to the original idea of the new control strategy and to the editing of the paper.
The contact author has declared that neither of the authors has any competing interests.
Publisher’s note: Copernicus Publications remains neutral with regard to jurisdictional claims in published maps and institutional affiliations.
The authors are grateful for the support of the R&D Wind program of TotalEnergies OneTech, which made this research possible.
This paper was edited by Erin Bachynski-Polić and reviewed by three anonymous referees.
Abbas, N. J., Zalkind, D. S., Pao, L., and Wright, A.: A reference open-source controller for fixed and floating offshore wind turbines, Wind Energ. Sci., 7, 53–73, https://doi.org/10.5194/wes-7-53-2022, 2022. a, b, c, d, e, f
Ali, S. K., Li, Y., Nagamune, R., Zhou, Y., and Ur Rehman, W.: Platform motion minimization using model predictive control of a floating offshore wind turbine, Theor. Appl., 11, 100295, https://doi.org/10.1016/j.taml.2021.100295, 2021.
Allen, C., Viscelli, A., Dagher, H., Goupee, A., Gaertner, E., Abbas, N., Hall, M., and Barter, G.: Definition of the UMaine VolturnUS-S Reference Platform Developed for the IEA Wind 15-Megawatt Offshore Reference Wind Turbine, Technical report National Renewable Energy Laboratory, Golden, CO, USA, https://www.osti.gov/biblio/1660012 (last access: 1 December 2022), 2020. a, b
ASTM: E1049-85, A Standard Practices for Cycle Counting in Fatigue Analysis, https://www.astm.org/e1049-85r17.html (last access: 15 December 2022), 2017. a
Bianchi, F., De Battista, H., and Mantz, R.: Wind Turbine Control Systems: Principles, Modelling and Gain Scheduling Design, Springer, ISBN 978-1-84628-493-9, 2007. a
Jonkman, J.: Influence of Control on the Pitch Damping of a Floating Wind Turbine, Technical report National Renewable Energy Laboratory, Golden, CO, USA, https://www.nrel.gov/docs/fy08osti/42589.pdf (last access: 1 December 2022), 2008. a
Fischer, B.: Reducing rotor speed variations of floating wind turbines by compensation of non-minimum phase zeros, IET Renew. Power Gen., 7, 413–419, https://doi.org/10.1049/iet-rpg.2012.0263, 2013. a, b
Fleming, P., Pineda, I., Rossetti, M., Wright, A., and Arora, D.: Evaluating Methods for Control of an Offshore Floating Turbine, Proceedings Of The International Conference On Offshore Mechanics And Arctic Engineering – OMAE 2014, Vol. 9B, San Francisco, CA, https://doi.org/10.1115/OMAE2014-24107, 2014. a
Hoagg, J. B. and Bernstein, D. S.: Nonminimum-Phase Zeros, IEEE Contr. Syst. Mag., 27, 45–47, 2007. a, b
Lackner, M.: Controlling Platform Motions and Reducing Blade Loads for Floating Wind Turbines, Wind Engineering, 33, 541–554, https://doi.org/10.1260/0309-524X.33.6.541, 2009. a, b, c, d
Larsen, T. and Hanson, T.: A method to avoid negative damped low frequent tower vibrations for a floating, pitch controlled wind turbine, J. Phys. Conf. Ser., 75, 012073, https://doi.org/10.1088/1742-6596/75/1/012073, 2007. a, b
Lee, J. and Zhao, F.: GWEC, Global Wind Report 2022, https://gwec.net/wp-content/uploads/2022/03/GWEC-GLOBAL-WIND-REPORT-2022.pdf (last access: November 2022), 2022. a
Lenfest, E., Goupee, A., Wright, A., and Abbas N.: Tuning of Nacelle Feedback Gains for Floating Wind Turbine Controllers Using a Two-DOF Model, Proceedings Of The International Conference On Offshore Mechanics And Arctic Engineering – OMAE 2020, 3–7 August 2020, https://doi.org/10.1115/OMAE2020-18770, 2020. a, b
Lopez-Queija, J., Robles, E., Jugo, J., and Alonso-Quesada, S.: Review of control technologies for floating offshore wind turbines, Renew. Sust. Energ. Rev., 167, 112787, https://doi.org/10.1016/j.rser.2022.112787, 2022. a
Ma, Y. and Sclavounos, P.: Wave forecast and its application to the optimal control of offshore floating wind turbine for load mitigation, Renew. Energ., 128, 163–176, https://doi.org/10.1016/j.renene.2018.05.059, 2018. a
Menezes, E., Araújo, A., Rohatgi, J., and Foyo, P.: Active load control of large wind turbines using state-space methods and disturbance accommodating control, Energy, 150, 310–319, https://doi.org/10.1016/j.energy.2018.02.143, 2018. a
Namik, H. and Stol, K.: Performance analysis of individual blade pitch control of offshore wind turbines on two floating platforms, Mechatronics, 21, 691–703, https://doi.org/10.1016/j.mechatronics.2010.12.003, 2011. a
ROSCO: ROSCO Version 2.4.1, GitHub [code], https://github.com/NREL/ROSCO (last access: 19 July 2022), 2021. a, b
Sarkar, S., Fitzgerald, B., and Basu, B.: Nonlinear model predictive control to reduce pitch actuation of floating offshore wind turbines, IFAC PapersOnLine, 53, 12783–12788, https://doi.org/10.1016/j.ifacol.2020.12.1936, 2020a. a
Sarkar S., Chen L., Fitzgerald, B., and Basu B.: Multi-resolution wavelet pitch controller for spar-type floating offshore wind turbines including wave-current interactions, J. Sound Vib., 470, 115–170, https://doi.org/10.1016/j.jsv.2020.115170, 2020b. a
Schlipf, D., Sandner, F., Raach, S., Matha, D., and Cheng, P.: Nonlinear Model Predictive Control of Floating Wind Turbines, Proceedings Of The International Offshore and Polar Engineering Conference – ISOPE-I-13-191, Anchorage, Alaska, 30 June 2021, https://10.1109/ACC.2014.6858718, 2013. a
Shan, M., Jacobsen, J., and Adelt, S.: Field Testing and Practical Aspects of Load Reducing Pitch Control Systems for a 5 MW Offshore Wind Turbine, European Wind Energy Conference and Exhibition, EWEC, Vienna, Austria, 4–7 February 2013, 101–105, https://doi.org/10.24406/publica-fhg-383237, 2013. a, b
Stockhouse, D., Phadnis, M., Grant, E., Johnson, K., Damiani, R., and Pao, L.: Control of a Floating Wind Turbine on a Novel Actuated Platform, arXiv [preprint], https://doi.org/10.48550/arXiv.2110.14169, 2021. a, b, c, d, e, f, g, h
In the case of kI≤0, νrot and ζrot would be imaginary according to the formulas above. Grot would no longer be a band-pass filter.
In Abbas et al. (2022), βcomp is defined as in Stockhouse et al. (2021) but with the convention so that is negative. It would be positive with the convention used in this work and in Stockhouse et al. (2021).
For the readers more used to quality factors, the corresponding values are Q=5 and Q=2 respectively.