the Creative Commons Attribution 4.0 License.
the Creative Commons Attribution 4.0 License.
 | 04 Jan 2023
Sensitivity analysis of the effect of wind and wake characteristics on wind turbine loads in a small wind farm
Amy N. Robertson
Jason Jonkman
Wind turbines are designed using a set of simulations to determine the fatigue and ultimate loads, which are typically focused solely on unwaked wind turbine operation. These structural loads can be significantly influenced by the wind inflow conditions. Turbines experience altered inflow conditions when placed in the wake of upstream turbines, which can additionally influence the fatigue and ultimate loads. It is important to understand the impact of uncertainty on the resulting loads of both unwaked and waked turbines. The goal of this work is to assess which wind-inflow-related and wake-related parameters have the greatest influence on fatigue and ultimate loads during normal operation for turbines in a three-turbine wind farm. Twenty-eight wind inflow and wake parameters are screened using an elementary effects sensitivity analysis approach to identify the parameters that lead to the largest variation in the fatigue and ultimate loads of each turbine. This study uses the National Renewable Energy Laboratory (NREL) 5 MW baseline wind turbine, simulated with OpenFAST and synthetically generated inflow based on the International Electrotechnical Commission (IEC) Kaimal turbulence spectrum with the IEC exponential coherence model using the NREL tool TurbSim. The focus is on sensitivity to individual parameters, though interactions between parameters are considered, and how sensitivity differs between waked and unwaked turbines. The results of this work show that for both waked and unwaked turbines, ambient turbulence in the primary wind direction and shear are the most sensitive parameters for turbine fatigue and ultimate loads. Secondary parameters of importance for all turbines are identified as yaw misalignment, streamwise integral length, and the exponent and streamwise components of the IEC coherence model. The tertiary parameters of importance differ between waked and unwaked turbines. Tertiary effects account for up to 9.0 % of the significant events for waked turbine ultimate loads and include veer, non-streamwise components of the IEC coherence model, Reynolds stresses, wind direction, air density, and several wake calibration parameters. For fatigue loads, tertiary effects account for up to 5.4 % of the significant events and include vertical turbulence standard deviation, lateral and vertical wind integral lengths, non-streamwise components of the IEC coherence model, Reynolds stresses, wind direction, and all wake calibration parameters. This information shows the increased importance of non-streamwise wind components and wake parameters in the fatigue and ultimate load sensitivity of downstream turbines.
- Article
(4813 KB) - Full-text XML
- BibTeX
- EndNote


This work was authored by the National Renewable Energy Laboratory, operated by Alliance for Sustainable Energy, LLC, for the U.S. Department of Energy (DOE) under contract no. DE-AC36-08GO28308. Funding provided by U.S. Department of Energy Office of Energy Efficiency and Renewable Energy Wind Energy Technologies Office. The views expressed in the article do not necessarily represent the views of the DOE or the U.S. Government. The U.S. Government retains and the publisher, by accepting the article for publication, acknowledges that the U.S. Government retains a nonexclusive, paid-up, irrevocable, worldwide license to publish or reproduce the published form of this work, or allow others to do so, for U.S. Government purposes.
When examining the feasibility of a wind farm design for a desired location, simulation models are run to assess the loading that the turbines will encounter given the conditions of that site. These simulation models include a large number of parameters to try to represent the complex conditions the turbine will encounter, and often much of this wind characterization is not available. It is therefore useful to identify those parameters that have the most significant influence on the load response to prioritize measurement campaigns and analysis studies. The focus of this paper is to identify the parameters that have the most influence on the load responses of wind turbines when situated in a farm environment.
This paper builds off our previous work and case studies related to the sensitivity of loads on a single wind turbine in isolation. Our first study focused on assessing the sensitivity of wind inflow parameters on a single turbine (Robertson et al., 2019). To perform this work, a sensitivity analysis methodology was developed, which employs elementary effects (EE) to provide a sensitivity estimate, requiring significantly fewer simulations than a full sensitivity analysis. For more information on why this method was chosen, including a review of other methods and the benefits and drawbacks of the EE method, see Robertson et al. (2019). This EE-based sensitivity approach has been employed in all subsequent studies, including the one considered in this paper. The single-turbine inflow study found that the primary parameters of importance to the fatigue and ultimate loading of the National Renewable Energy Laboratory (NREL) 5 MW baseline wind turbine under normal operation were turbulence in the primary wind direction and shear, followed by veer, streamwise (u-direction) integral length, and the exponent and u components of the International Electrotechnical Commission (IEC) coherence model. The second case study focused on assessing the sensitivity of the aerodynamic parameters of the wind turbine blades, such as lift and drag coefficients as well as unsteady aerodynamic parameters (Shaler et al., 2019). That study found the primary parameters of importance to be blade-twist and lift coefficient distributions (both outboard and inboard), followed by the maximum lift coefficient location, blade chord length, and drag coefficient distributions. The most recent study built upon the blade aerodynamics study to include additional turbine properties such as blade-mass and pitch imbalance, blade and tower centers of mass, and stiffness and damping uncertainty on the wind turbine loads (Robertson et al., 2019). In that study the authors found the primary parameters of importance to be yaw misalignment and outboard lift coefficient distribution, followed by inboard lift distribution, blade-twist distribution, and blade-mass imbalance.
To perform the case studies, an extensive literature review was conducted to identify the appropriate parameters to study and the bounds over which to vary them. Refer to Robertson et al. (2019) to learn about previous efforts in the sensitivity of loads in wind turbines based on wind and aeroelastic parameters. Building off the methods and findings from those previous studies, the work in this paper assesses how waked turbine fatigue and ultimate load sensitivity differs from that of unwaked turbines for varying wind inflow and wake conditions. Many other studies have been conducted to understand loads on downstream turbines, and researchers are in wide agreement that those in the wake of upstream turbines will have higher fatigue loads than the upstream turbines. Additionally, wind farm sensitivity analysis studies have been conducted for cost modeling and optimization purposes (Rezaei et al., 2020; Diaz et al., 2020; Martin et al., 2016; Dykes et al., 2014) as well as wind farm power (Tautz-Weinert et al., 2019). These papers tend to focus on the wind farm as a whole and do not distinguish between waked and unwaked turbine impact. However, the authors were unable to find research regarding the sensitivity of how downstream turbine loads differ based on the wind and aerodynamic parameters.
In this work, the inflow study that was previously conducted for a single turbine is expanded to include several turbines in a small wind farm. Additionally, parameters that affect the wind turbine wake evolution, such as yaw misalignment and model parameters that change wake evolution, are included. An additional wind inflow parameter, air density, is also added. This work aims to highlight the relative importance of inflow and wake parameters for fatigue and ultimate load sensitivity. This is accomplished by developing metrics to assess the sensitivity of several turbine load measurements and assessing how this sensitivity changes with varying inflow and wake conditions. The sensitivity is assessed using the EE method developed in the first case study, considering a wide range of possible wind inflow and wake conditions. Based on the sensitivity values, a threshold is used to determine when a sensitivity value is classified as a “significant event”. Next, the significant events triggered by varying each parameter are analyzed, along with which aeroelastic quantities of interest (QoIs) are most affected. The results from this work can be used to better inform the turbine design process and site suitability analyses and to help identify important measurement quantities when designing wind farm experiments.
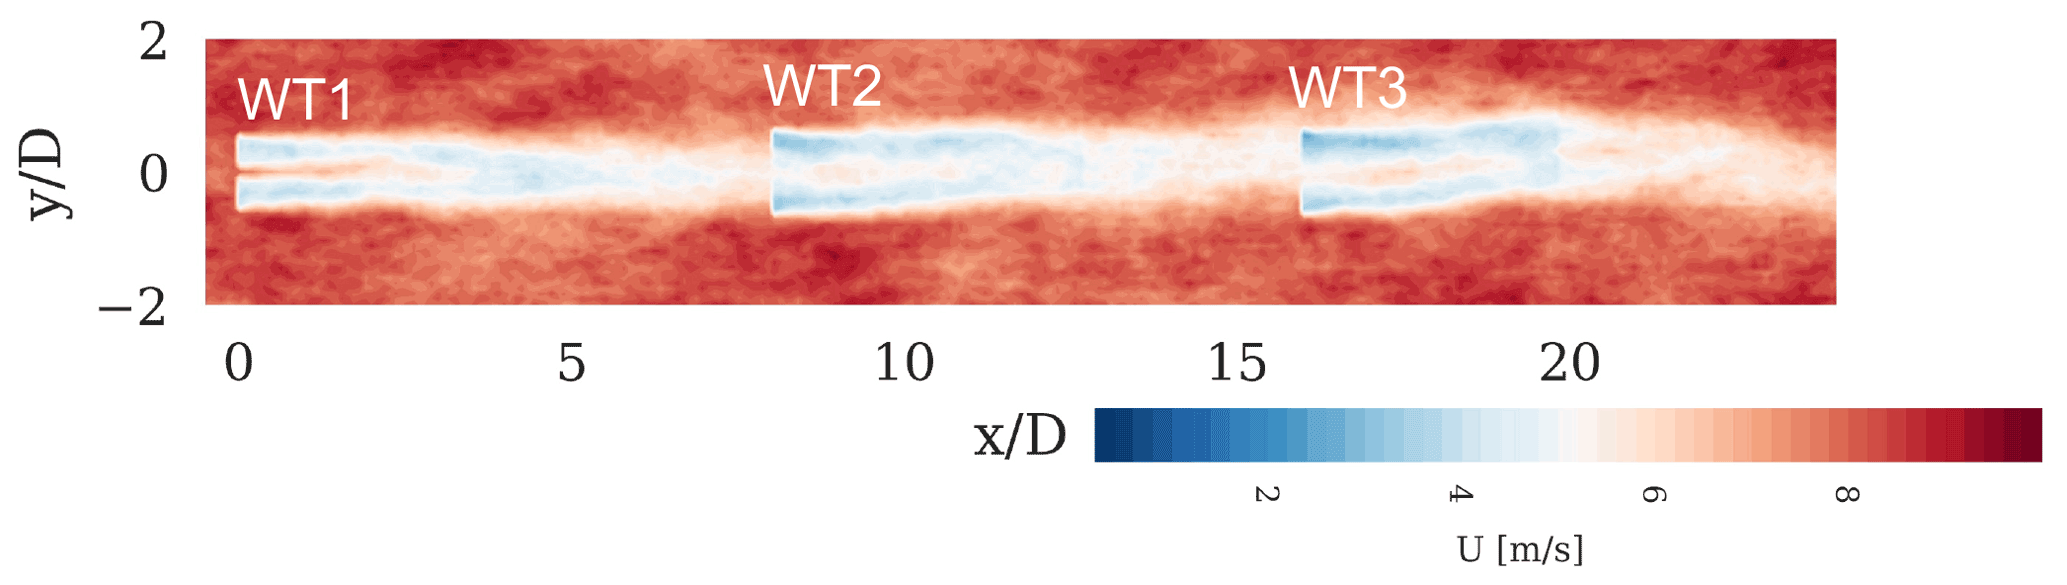
Figure 1Instantaneous two-dimensional flow visualization of a three-turbine (WT1–WT3) FAST.Farm simulation in turbulent inflow, sampled at hub height and colored by velocity magnitude.
To identify the inflow wind and wake parameters that structural loads of waked and unwaked utility-scale wind turbines are most sensitive to, a sensitivity analysis based on an EE methodology was used. The procedure is summarized in the following section, but first there are several caveats to this work that must be noted. (1) Only the NREL 5 MW reference turbine was considered; thus, this study does not examine the dependency of the sensitivity findings on the size and design of the turbine. (2) Only normal turbine operation was considered; gusts, start-ups, shutdown, and parked or idling events were not included, which can often lead to the high loading experienced by a turbine. (3) Input parameter variation was done independently, with no joint-probability functions or conditioning based on any parameter other than wind speed. Developing joint-probability distributions across the large number of parameters considered was not feasible. (4) Only three laterally aligned turbines were considered, as opposed to a more extensive wind farm, so some wind farm effects such as deep array effects were not present. Despite these caveats, this work still provides insight into the sensitivity of fatigue and ultimate loads based on the variation of a wide range of wind inflow and wake conditions.
2.1 Wind turbine model and tools
The sensitivity study was performed considering a small wind farm with three laterally aligned NREL 5 MW reference wind turbines (Jonkman et al., 2009) separated by 7 rotor diameters in the zero-degree wind direction, as shown in Fig. 1. Parameter sensitivity was assessed using simulations from FAST.Farm, a multiphysics engineering tool that accounts for wake interaction effects on turbine performance and structural loading in wind farm applications based on advancements to the dynamic wake meandering (DWM) model. FAST.Farm is an extension of the NREL software OpenFAST, which solves the aero-hydro-servo-elastodynamics of individual turbines (OpenFAST, 2021; Jonkman and Shaler, 2021).
Each wind turbine was modeled in OpenFAST, using the NREL 5 MW reference turbine as a representative turbine. This is an upwind three-bladed horizontal-axis turbine with a 90 m hub height and 126 m rotor diameter. AeroDyn, the aerodynamic module of OpenFAST, was applied to calculate the aerodynamic loads on the rotor using blade-element momentum (BEM) theory with advanced corrections, including unsteady aerodynamics. ElastoDyn, a combined multibody and modal structural approach that includes geometric nonlinearities, was used to represent the flexibility of the blades, drivetrain, and tower. Tower influence on the flow and nacelle blockage, as well as drag on the tower, were not considered. The NREL 5 MW turbine baseline controller was modeled as a variable-speed collective pitch controller using a Bladed-style dynamic library in ServoDyn. OpenFAST simulation results were used to compute the EE values for each QoI, as discussed in Sect. 3.
Past work has shown that the sensitivity of loads to input parameter variation is influenced by the wind speed and associated wind turbine controller response (Robertson et al., 2019). Therefore, this study considered three different hub-height wind speeds with means of 8, 12, and 18 m s−1, representing below-, near-, and above-rated wind speeds, respectively. Wind inflow was synthetically generated using TurbSim (Jonkman, 2014), which creates time-varying two-dimensional turbulent flow fields that are convected through the domain using Taylor's frozen turbulence hypothesis. Turbulence was simulated using the Kaimal turbulence spectrum with an exponential coherence model. TurbSim generation involves two stages of simulations, one each for the low-resolution and high-resolution domains of FAST.Farm and using the suggested FAST.Farm discretization recommendation (Jonkman and Shaler, 2021). The low-resolution TurbSim domain throughout the wind farm had a spatial resolution of 10, 20, and 25 m for the below-, near-, and above-rated wind speeds, respectively, and a temporal resolution of 0.1 s to match the suggested high-resolution FAST.Farm discretization. A high-resolution TurbSim domain around each wind turbine was then generated for each turbine, derived from the hub-height time series extracted from the low-resolution TurbSim domain with a spatial resolution of 5 m and temporal resolution of 0.1 s. Many turbulence seeds were used for each input parameter variation to ensure any variation in results was independent of the selected turbulent seed. The number of seeds was determined via a seed convergence study that considered each QoI. The generated inflows were used as input to FAST.Farm using a simulation time of 600 s after an initial 600 s transient period was removed.
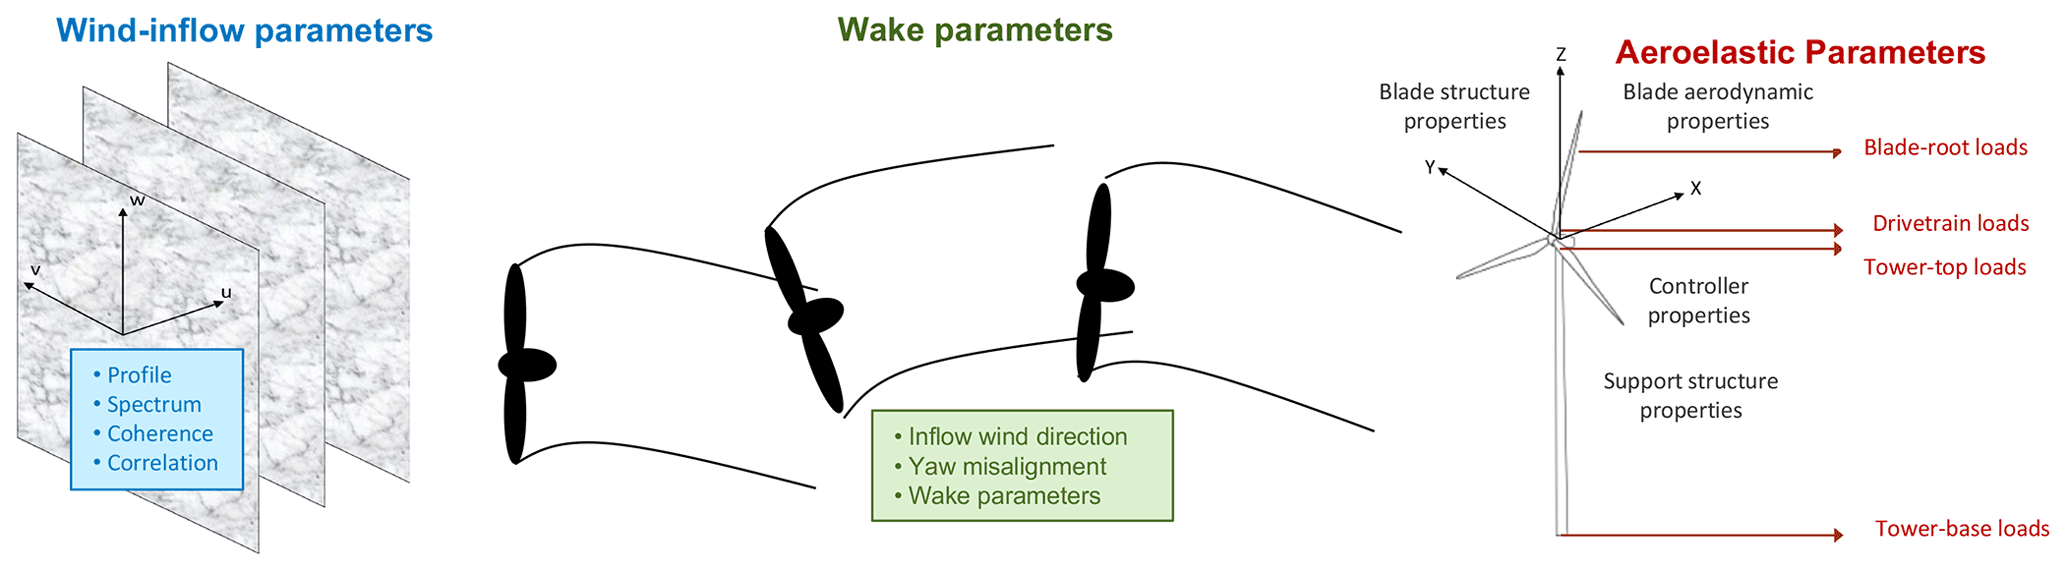
Figure 2Potential sources of uncertainty in a wind turbine and wind farm load analysis. Includes wind inflow conditions, wake parameters, and the associated load QoI.
2.2 Case study description
In previous case studies (Robertson et al., 2019), ambient wind inflow parameters were identified that significantly influence the loading of a single wind turbine. This study extends that work by identifying the inflow and wake parameters most influencing downstream wind turbines in a small wind farm. The ambient wind inflow input parameters were selected to be the same ones used in our previous work (Robertson et al., 2019). Additional wake parameters were added that relate to turbine wake evolution/meandering. Though more parameters could exist, for this study only those parameters believed to have the largest affect for normal operation for a conventional utility-scale wind turbine were included, as categorized in Fig. 2.
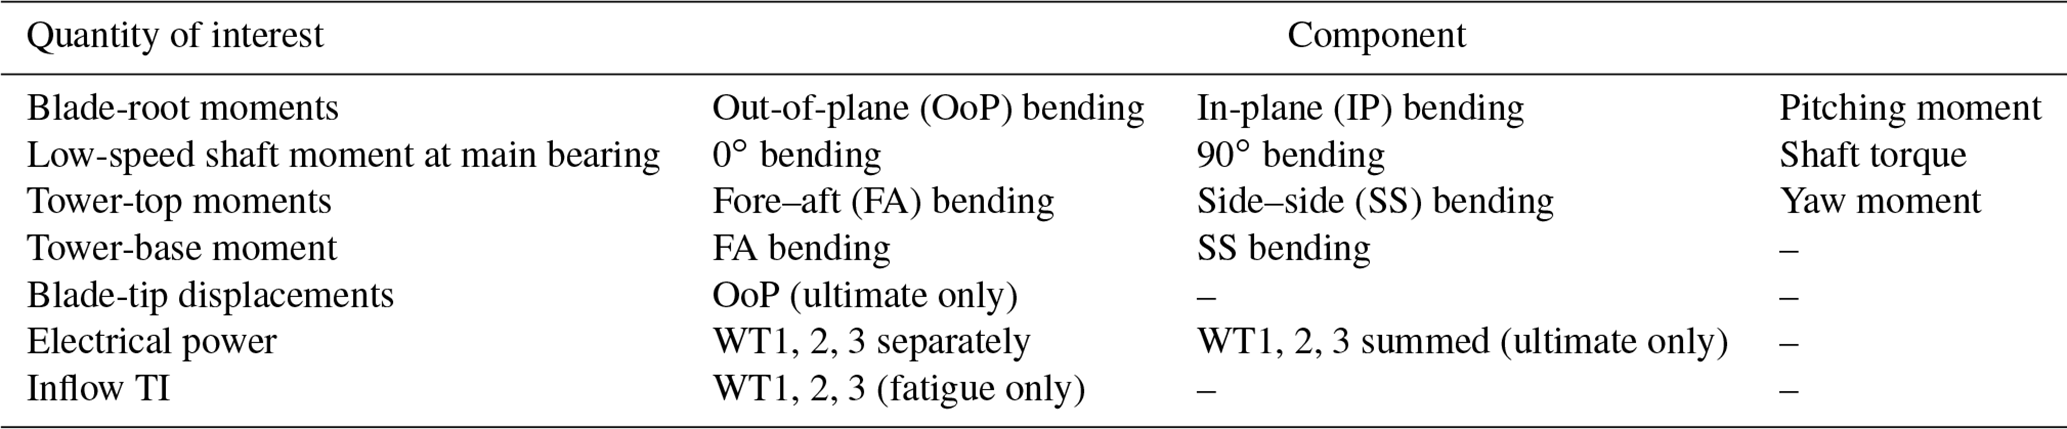
Many QoIs were identified, as detailed in Table 1, including the blade, tower, and drivetrain moments; blade-tip displacement; rotor power; and inflow turbulence intensity (TI) of each turbine. Inflow TI, which is often related to fatigue loads, was computed using Eq. (1) (where t is the turbine number, u is the streamwise component of the wind speed, and σ(u) and represent the standard deviation and time average of u) and treated in the sensitivity assessment as if it were a fatigue load. The total wind farm electrical power, which is important to the cost of wind energy, was treated in the sensitivity assessment as if it were an ultimate load.
The fatigue loads were calculated using aggregate damage equivalent loads (DELs) of the QoI response across all turbulence seeds for a given set of short-term parameter values. For the bending moments, the ultimate loads were calculated as the largest vector sum of the first two listed components. The ultimate loads were calculated using the average of the global absolute maximums across all turbulence seeds for a given set of parameter values. See Robertson et al. (2019) for more details on the fatigue and ultimate load calculations. All quantities associated with electrical power and inflow TI were excluded from the count of significant events but were examined for other purposes. The QoI sensitivity of each input parameter was examined using the procedure summarized in Sect. 3.
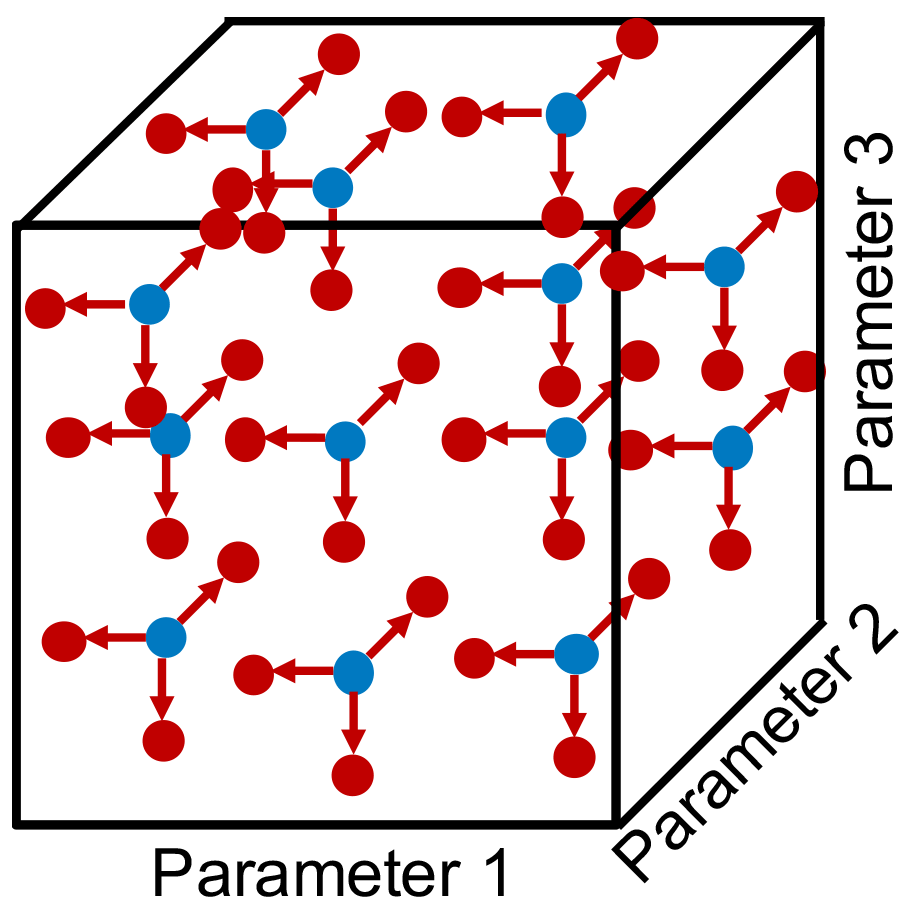
Figure 3Radial EE approach representation for three input parameters. Blue circles indicate starting points in the parameter hyperspace. Red points indicate variation in one parameter at a time.
An EE method (Gan et al., 2014; Martin et al., 2016; Saranyasoontorn and Manuel, 2006) was used to assess which parameters have the largest influence on turbine loads. This is a simple methodology for screening parameters, based on a one-at-a-time approach where each parameter is varied independently while all other parameters remain fixed. In this way, the EE method is a local sensitivity approach because the influence of a single parameter is calculated without considering interaction with other parameters. The change in response QoI based on the change in the input parameter was used to compute a derivative, which together with the possible range of the input parameter variation was used to assess the sensitivity of the parameter. This variation and derivative computation was performed several times for each parameter at different points in the hyperspace of all input parameters, as shown in Fig. 3. In this way, the EE approach used in this work is considered a global sensitivity method because it concerns the interactions between different parameters (Robertson et al., 2019). This method and evaluation process are further discussed by Robertson et al. (2019).
When considering the EE method, each wind turbine QoI, Y, was represented as a function of different characteristics of the inflow and wake input parameters, U, as follows:
where I is the total number of input parameters. For a given sampling of U, the EE value of the ith input parameter was found by varying only that parameter by a normalized amount, Δ:
where
Because of the normalization of U, clarified below, the EE value (EEi) can be thought of as the local partial derivative of the output (Y) with respect to an input (ui), scaled by the range of that input. Thus, the EE value has the same unit as the output QoI.
In a radial sensitivity approach, the EE value is calculated for all input parameters at a given point, R, in the parameter hyperspace by varying each parameter individually from that point. A representative schematic of this approach is depicted in Fig. 3. Each variation is performed for ±10 % of the range over which the parameter may vary (). This ±10 % range ( normalized or dimensional) is used to ensure the finite-difference calculation occurs over an appropriate range to meet the linearity assumption required by this method. Note that this is different than the original EE methodology, which creates a trajectory by varying each new parameter from the Δ point of the previous parameter. The process is repeated for R starting points in the input parameter hyperspace (blue points in Fig. 3), creating a set of R different calculations of the EE value for each parameter. The R starting points are determined using Sobol numbers (blue circles in Fig. 3), which ensures a wide sampling of the input hyperspace.
Because the EE value is analogous to a sensitivity level, a higher value for a given input parameter indicates more sensitivity. Here, the most sensitive parameters were identified by defining a threshold value, above which an individual EE value would be considered significant. The threshold was set individually for each QoI and turbine and defined as . Here, was the mean of all EE values across all starting points R, inputs I, and wind speed bins B for each QoI, and σ was the standard deviation of these EE values.
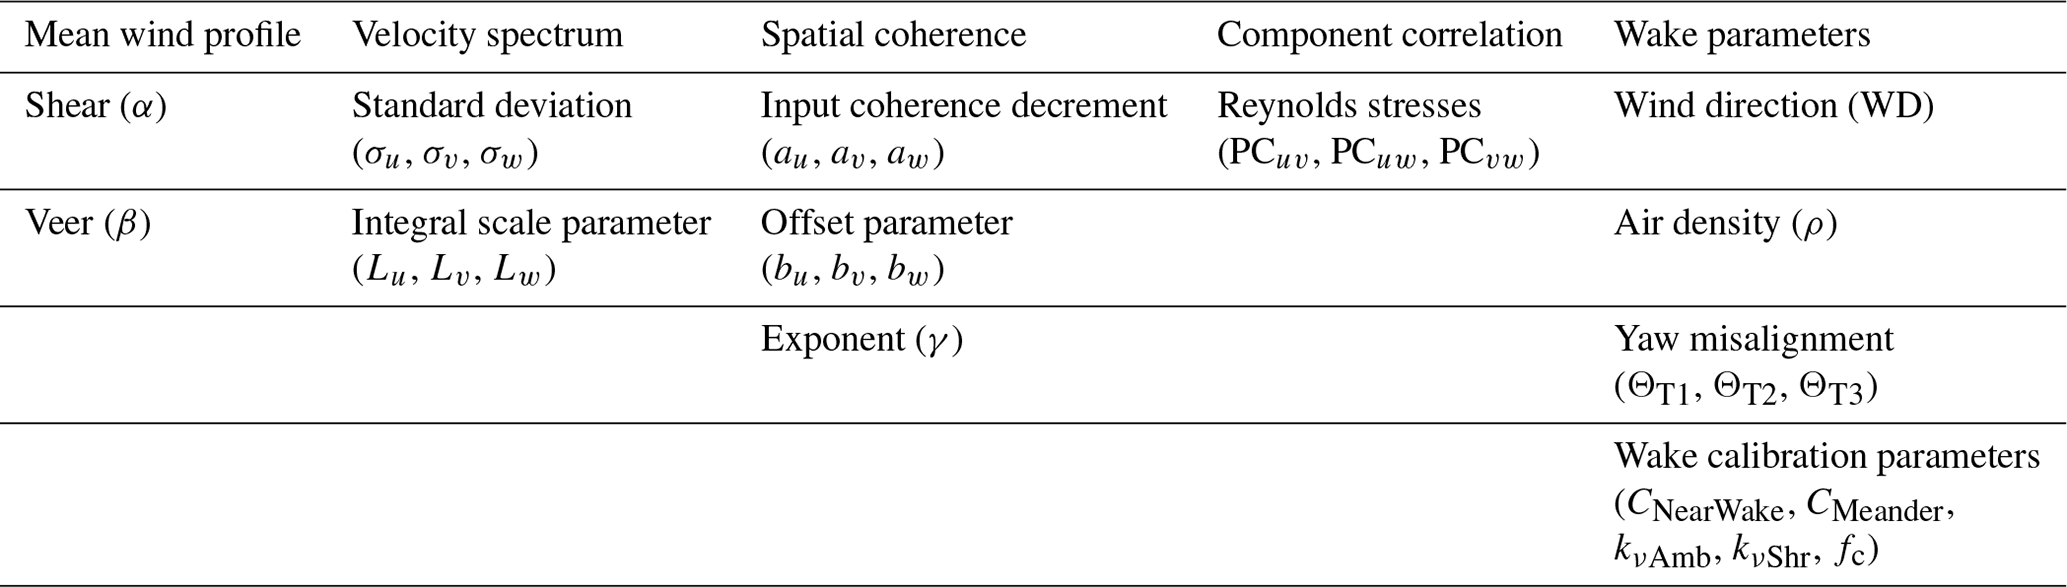
Table 3Wind inflow parameter ranges separated by wind speed bin. The nominal value prescribed by IEC for category B turbulence is specified in the “IEC” row.
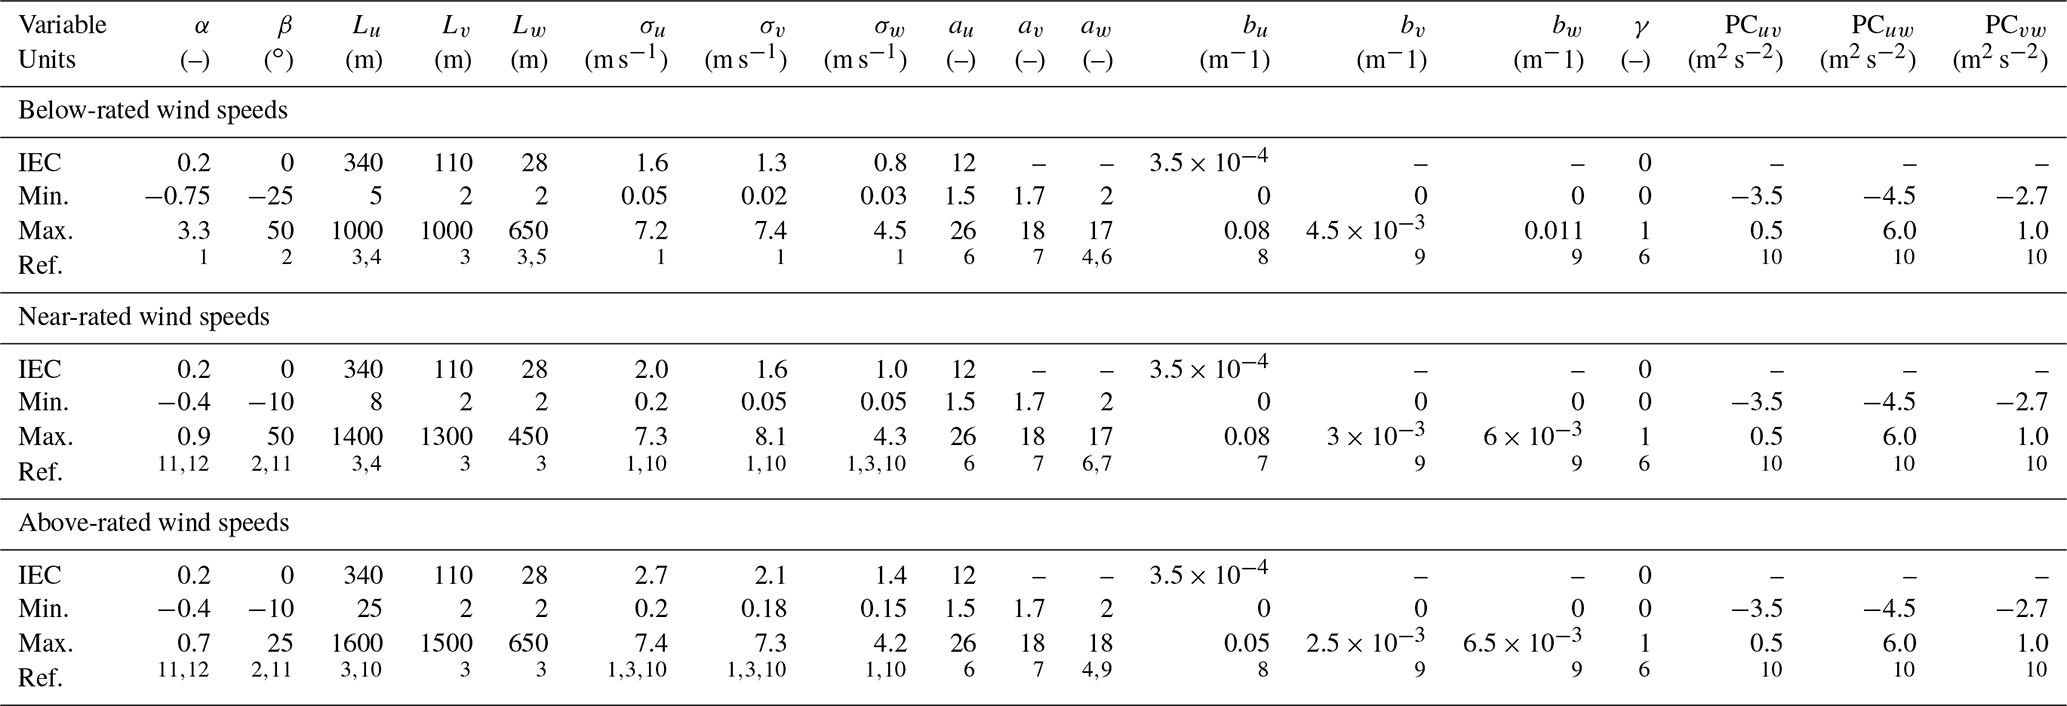
1 Cli (2014). 2 Walter et al. (2019). 3 Nelson et al (2003). 4 Solari and Piccardo (2001). 5 Teunissen (1970). 6 Solari (1987). 7 Saranyasoontorn and Manuel (2006). 8 Saranyasontoorn et al. (2004). 9 Jonkman et al. (2009). 10 Kelley (2011). 11 Dimitrov et al. (2015). 12 Moroz (2017).
Table 4Wake parameter ranges separated by wind speed bin.
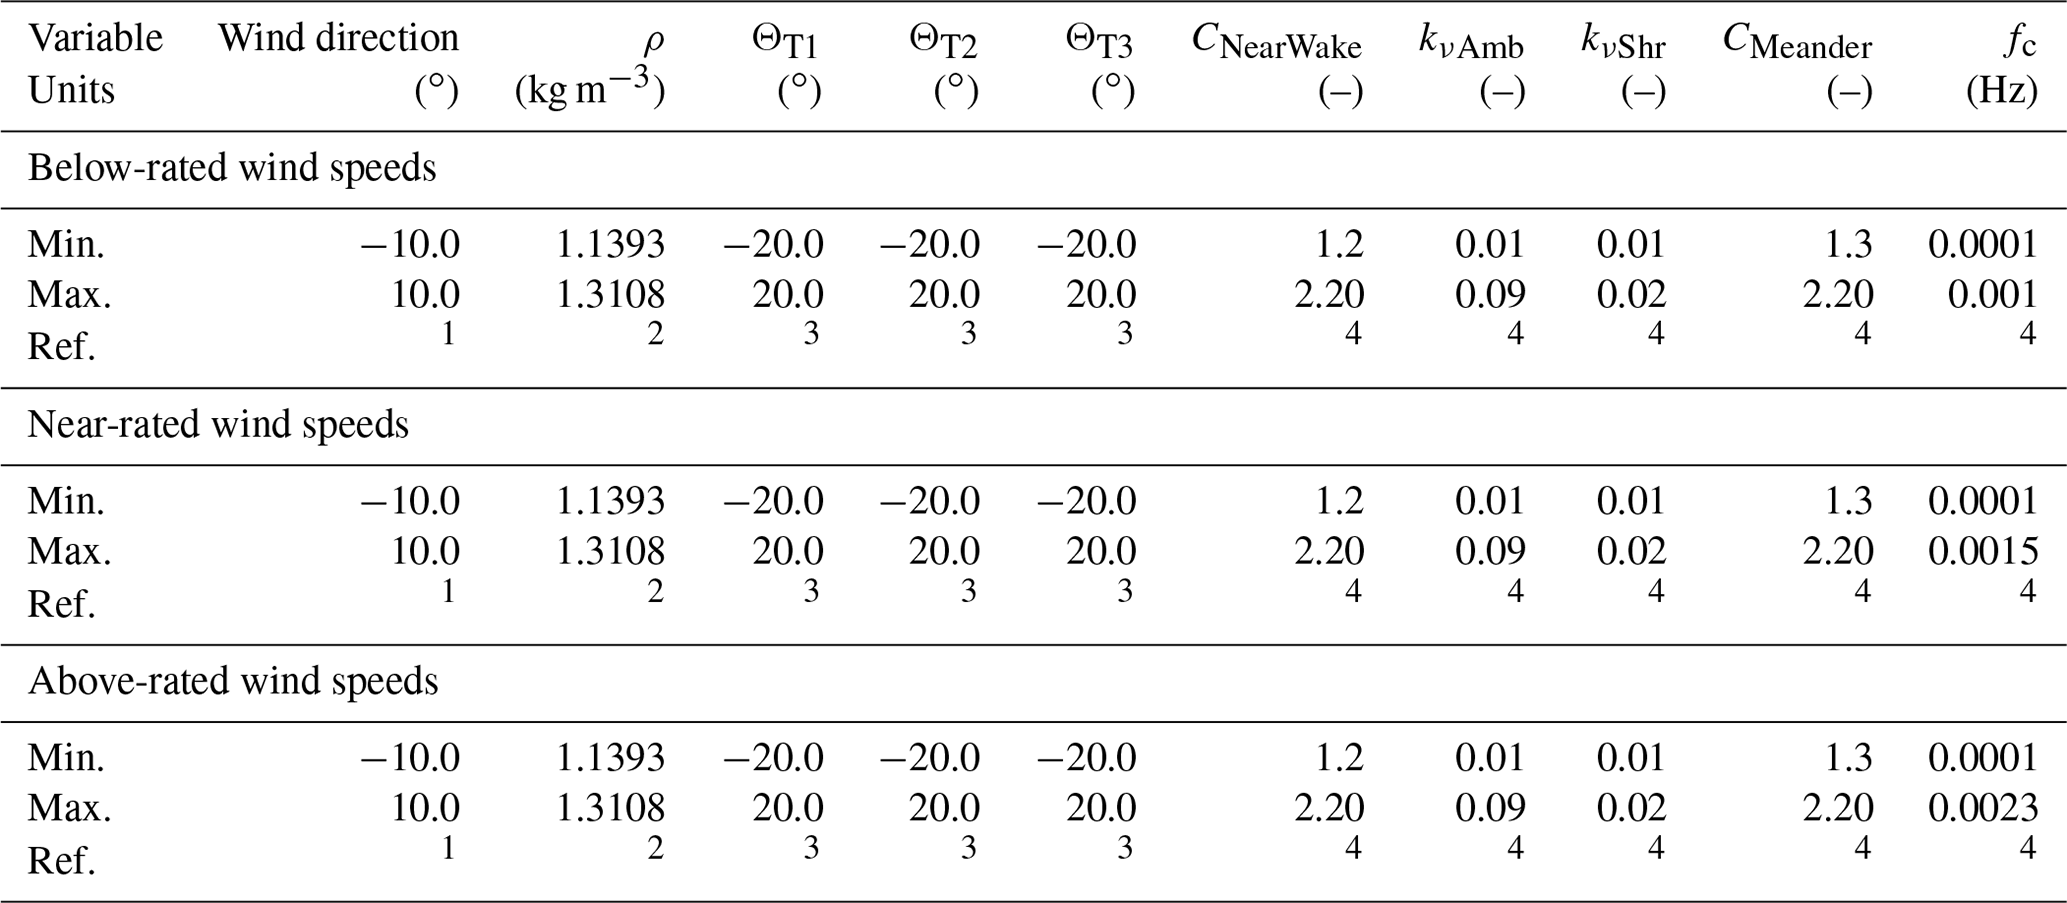
1 Gaumond et al. (2014). 2 Ulazia et al. (2019). 3 Quick et al. (2017). 4 Doubrawa et al. (2018).
3.1 Parameters
A total of 28 input parameters represented the wind inflow and wake conditions, considering the mean wind profile, velocity spectrum, spatial coherence, component correlation, and wake parameters, as summarized in Table 2. The wind inflow parameters were detailed in previous work (Robertson et al., 2019). Wind direction was used to introduce lateral offset distances for downstream turbines, with the zero-degree direction indicating flow directly down the row of turbines. Wind direction was simulated by changing the locations of the wind turbines in the FAST.Farm simulations. This way, the same inflow turbulence files could be used for various wind direction values. Changing the wind direction does not result in a mean yaw misalignment of the wind turbines; the yaw misalignment is considered an independent parameter. Air density was specified in AeroDyn and represents the change due to temperature or humidity variations. Yaw misalignment was specified by rotating the nacelle-yaw angle of each wind turbine individually in ElastoDyn. Wake calibration parameters are FAST.Farm user-specified parameters that modify wake dynamics evolution and meandering. CNearWake adjusts the wake deficit and expansion correction for the otherwise neglected pressure gradient zone directly behind the rotor in the near wake. CMeander influences the spatial averaging used to calculate how the wake meanders and specifically defines the cutoff wave number for the spatial filter. kνAmb and kνShr modulate the relative contribution of the ambient turbulence and wake shear layer to the eddy viscosity. fc defines the cutoff frequency for the low-pass time filter used in the wake evolution model to ensure high-frequency fluctuations do not pass into the quasi-steady wake-deficit increment model.
To understand the sensitivity of a given parameter, a range over which that parameter may vary must be defined, as summarized in Tables 3 and 4. A literature search was done to identify the range for each of the parameters across varying land-based installation sites, with additional details provided in Robertson et al. (2019). When possible, parameter ranges were set based on wind speed bins. If no information on wind speed dependence was found, the same values were used for all bins. Many of these ranges were chosen based on our previous study (Robertson et al., 2019). Air density ranges were based on the work of Ulazia et al. (2019) and represent the changes due to temperature or humidity variations. The wind direction was chosen based on the work of Gaumond et al. (2014), which looked at wind direction uncertainty in experimental measurements. Yaw misalignment ranges were based on the work of Quick et al. (2017). For the wake parameters, ranges were chosen based on a calibration study used to determine the default FAST.Farm parameters (Doubrawa et al., 2018).
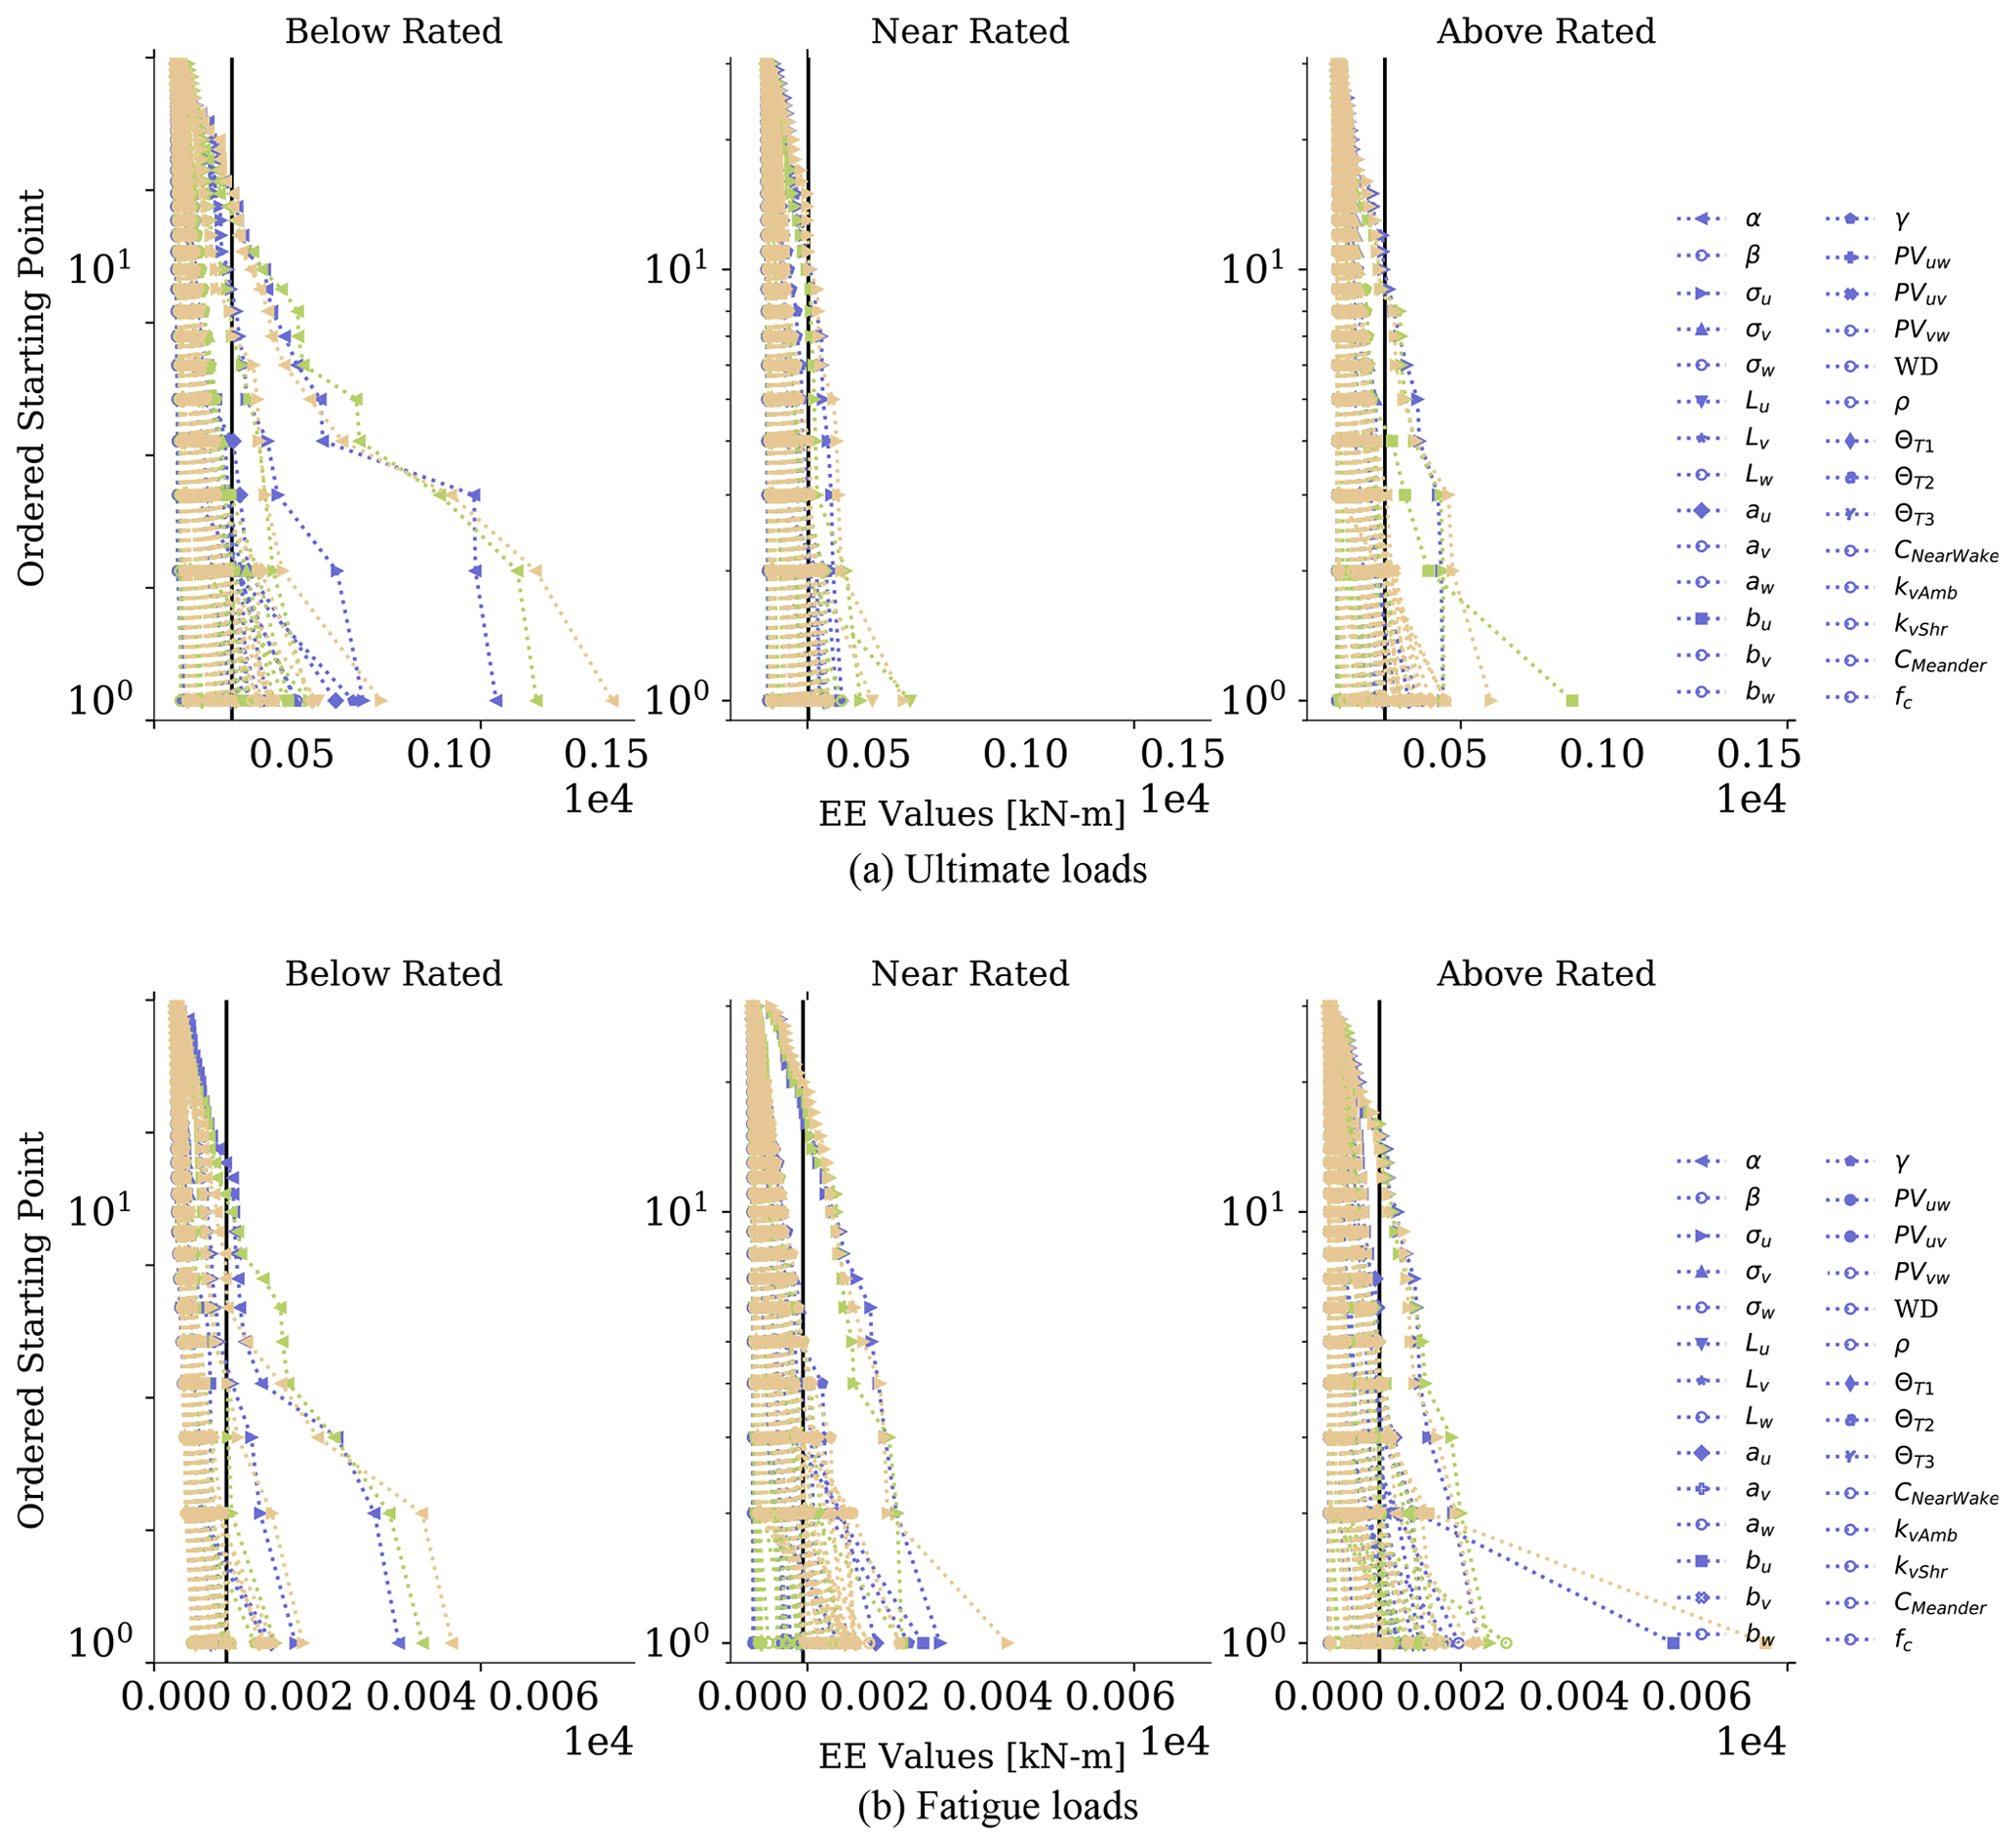
Figure 4Exceedance probability plot of (a) ultimate and (b) fatigue load EE values for blade-root pitching moments. Each subplot shows a different wind speed bin. Each line represents a different input parameter and wind turbine (blue for WT1, green for WT2, and yellow for WT3). Each symbol represents a different point in the hyperspace, with the same symbols being used for each wind turbine (line color). Unique symbols are used for parameters that primarily contributed to the significant events count. The vertical lines on each plot correspond to the threshold value used to identify significant events.
The EE value was calculated for each of the 28 input parameters (I) at 30 different starting points (R) in the input parameter hyperspace. The number of starting points was determined through a convergence study on the average EE value. At each of the considered points, 50 TurbSim simulations for 50 turbulence seeds (S) were run. The number of turbulence seeds was determined based on a convergence study of the fatigue and ultimate load metrics at the midpoint range value and ±10 % of the range for all QoIs. Based on these parameters, the total number of TurbSim simulations performed was , where J was the number of input parameters that required a new TurbSim simulation and B was the number of wind speed bins considered. The total number of FAST.Farm simulations performed was .
To demonstrate how EE values can vary for a given input parameter and QoI, ordered EE value results of blade-root pitching fatigue and ultimate loads are shown in Fig. 4. Here, input parameters were plotted independently of each other to compare the behavior between parameters. Each line represents a different input parameter, with each point representing a different location in the hyperspace. Additionally, each subfigure represents a different wind speed bin, and each line color represents a different wind turbine. For each line, the EE values for each point were ordered from smallest to largest, and the point was assigned a value from 1 to 30, one for each starting point in the hyperspace, corresponding to the y-axis value in the figure. The vertical lines on each plot correspond to the threshold value, used to identify significant events. Markers above this threshold line were included in the significant events tally, discussed next. From these plots, it was seen that the shear exponent heavily dominates the results, especially for the below-rated wind conditions. This was seen in previous work (Robertson et al., 2019) and was largely due to the sizable range considered for this value. These plots also demonstrate the differences in EE values across wind turbines. For instance, the maximum EE value for ultimate loads at below-rated conditions was due to the shear parameter for all turbines. However, this EE value was 32 % higher for WT3 compared to the value for WT1, thus demonstrating the potential differences in parameter importance for waked conditions.

Figure 5Significant parameter count from ultimate (a, c) and fatigue (b, d) loads. Each color represents a different wind turbine. The top row (a, b) shows the significant event counts for all turbines, and the bottom row (c, d) shows the percent difference in significant event counts for WT2 and WT3 relative to WT1. For the Θ input parameters, the values in panels (c) and (d) can extend to nearly ±100 %. However, the axes of these figures have been reduced to better focus on the impact of more input parameters.
To identify the most sensitive parameters, a tally was made of the number of times an EE value exceeded the threshold for each QoI. The resulting tallies are shown in Fig. 5, with the ultimate load tally on the left (a, c) and the fatigue load tally on the right (b, d). The top panels (a, b) show the cumulative values for each turbine. These results indicate substantial sensitivity to the u-direction turbulence standard deviation (σu) and vertical wind shear (α) for all wind turbines. These results were expected based on our past studies (Robertson et al., 2019) and the parameters of importance in the IEC design standards. Consideration of the lower tally values in this plot highlights the secondary level of importance of yaw misalignment (), streamwise u-direction integral length (Lu), u-direction components of the IEC coherence model (au and bu), and the IEC coherence model exponent (γ). As expected, wake calibration parameters have no effect on the unwaked turbine but do appear with significant events for the waked turbines. An additional insight shown here that was not seen in the previous study is the changing effect of yaw misalignment for downstream turbines. Results for each turbine show high sensitivity to that turbine's yaw misalignment. However, there was little to no dependence on the yaw misalignment of other turbines. It was expected that the yaw misalignment of a downstream turbine would not affect an upstream turbine result but less expected that the reverse was not also true (i.e., that the yaw misalignment of an upstream turbine has little to no effect on the sensitivity of the turbine directly downstream of it considering recent work on wake steering in the wind energy community). There was a slight effect of ΘT2 on WT3, but this effect was minimal, especially relative to the effect of ΘT3 on WT3. The primary and secondary importance parameters were the same for fatigue and ultimate loads, as well as for each turbine, with WT1 results being consistent with the results in Robertson et al. (2019). The distinctions between “primary”, “secondary”, and “tertiary” parameters of importance were mostly made by visually inspecting the significant count results.
However, the relative importance of these parameters between fatigue and ultimate loads and between wind turbines does change, as shown in Fig. 5c and d. Here, the differences between the waked and unwaked turbine response were explored by showing the difference in the percentage a certain parameter makes up of the total number of significant event counts for that turbine, relative to WT1. These values were computed using Eq. (5), where t=2 or 3, and i is the input parameter being varied.
The percent difference results show when input parameters lead to a higher or lower percentage of significant event counts in waked turbines, relative to the unwaked turbine. For ultimate loads, WT2 and WT3 show reduced sensitivity for many of the input parameters but also increased sensitivity for parameters that show little to no significance for the unwaked turbine, such as lateral wind components and wake parameters. Similar results were seen for fatigue results. From here, tertiary effects can be identified for waked turbines. Tertiary effects for ultimate loads show the importance of veer (β), non-streamwise components of the IEC coherence model (aw and bv), Reynolds stresses (PCuv, PCuw, and PCvw), wind direction (WD), air density (ρ), and several wake calibration parameters (CMeander, kν,Amb, kν,Shr, and fc). For WT1 and WT2, these tertiary parameters accounted for 3.2 % and 3.6 % of the total significant events count, respectively, and nearly triple that for WT3, with 9.0 % of the significant events resulting from tertiary parameters. This suggests that the importance of these other parameters would likely grow if additional wind turbines were added to the wind farm. Tertiary effects for fatigue loads show the importance of vertical turbulence standard deviation σw, lateral and vertical wind integral lengths (Lv and Lw), lateral and vertical wind components of the IEC coherence model (aw, bv, and bw), Reynolds stresses (PCuw and PCvw), wind direction (WD), and all wake calibration parameters (CNearWake, CMeander, kν,Amb, kν,Shr, and fc). For WT1, these tertiary parameters accounted for 4.1 % of the total significant events count. For WT2 and WT3, this percentage increases to 5.4 % and 5.3 % of the significant events, respectively. These results indicate the increased influence of non-streamwise inflow components, including wake meandering, in fatigue and ultimate load sensitivity of waked turbines.
Table 5Percentage of contribution to total number of significant events for fatigue and ultimate loads. Cells are colored by the percentage value, with darker blue representing a higher percentage.
The increased importance of non-streamwise inflow components, including wake meandering, on waked turbines was further made by comparing the percentage of contribution to the total number of significant events for fatigue and ultimate loads for each turbine, shown in Table 5. These results show that most of the tertiary parameters contribute at least twice as much to the significant events count for waked turbines compared to unwaked turbines. This indicates that, though still tertiary parameters, fatigue and ultimate loads of waked turbines were generally twice as sensitive to non-streamwise inflow components.
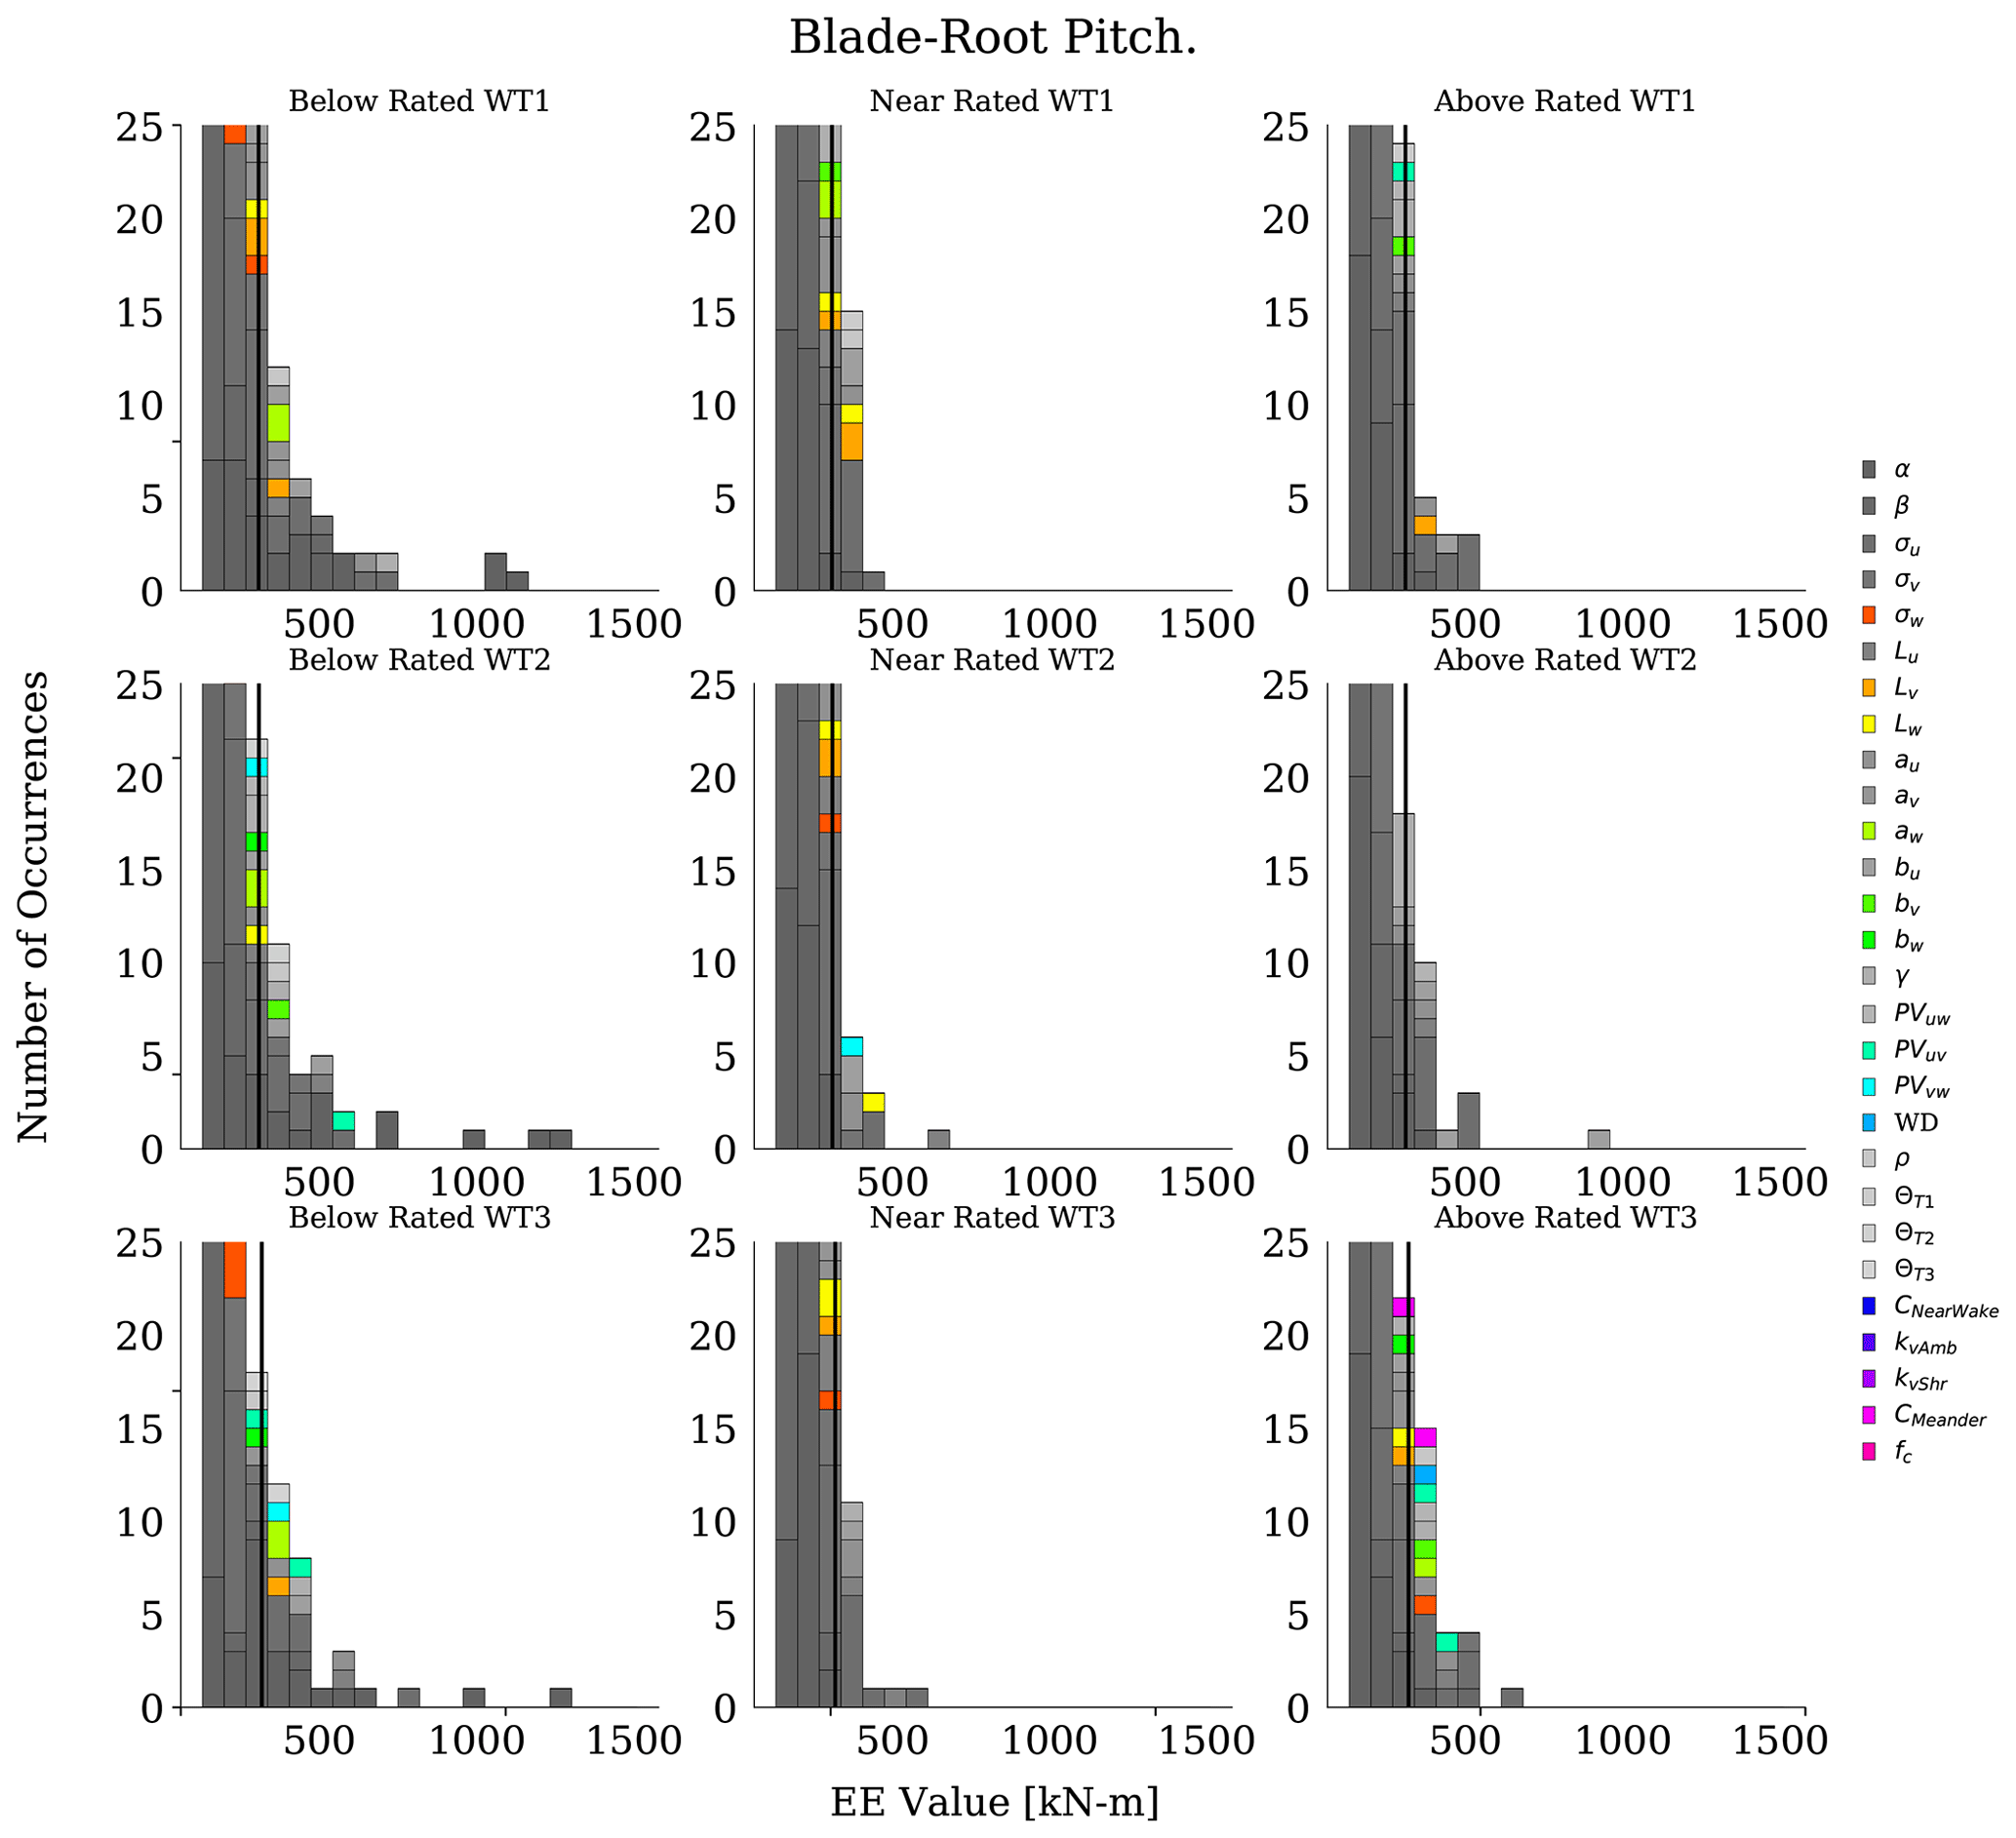
Figure 6Histograms of ultimate load EE values for the blade-root pitching moment. Each subplot shows one wind speed bin and wind turbine and includes all input parameters. Each column of subplots corresponds to a wind speed bin, and each row of subplots corresponds to a wind turbine. The vertical lines on each plot correspond to the threshold value used to identify significant events. The y axis has been limited to focus on results contributing to significant event count.

Figure 7Histograms of fatigue load EE values for the blade-root pitching moment. Each graph shows one wind speed bin and wind turbine and includes all input parameters. Each column of subplots corresponds to a wind speed bin and each row of subplots corresponds to a wind turbine. The vertical lines on each plot correspond to the threshold value used to identify significant events. The y axis has been limited to focus on results contributing to significant event count.
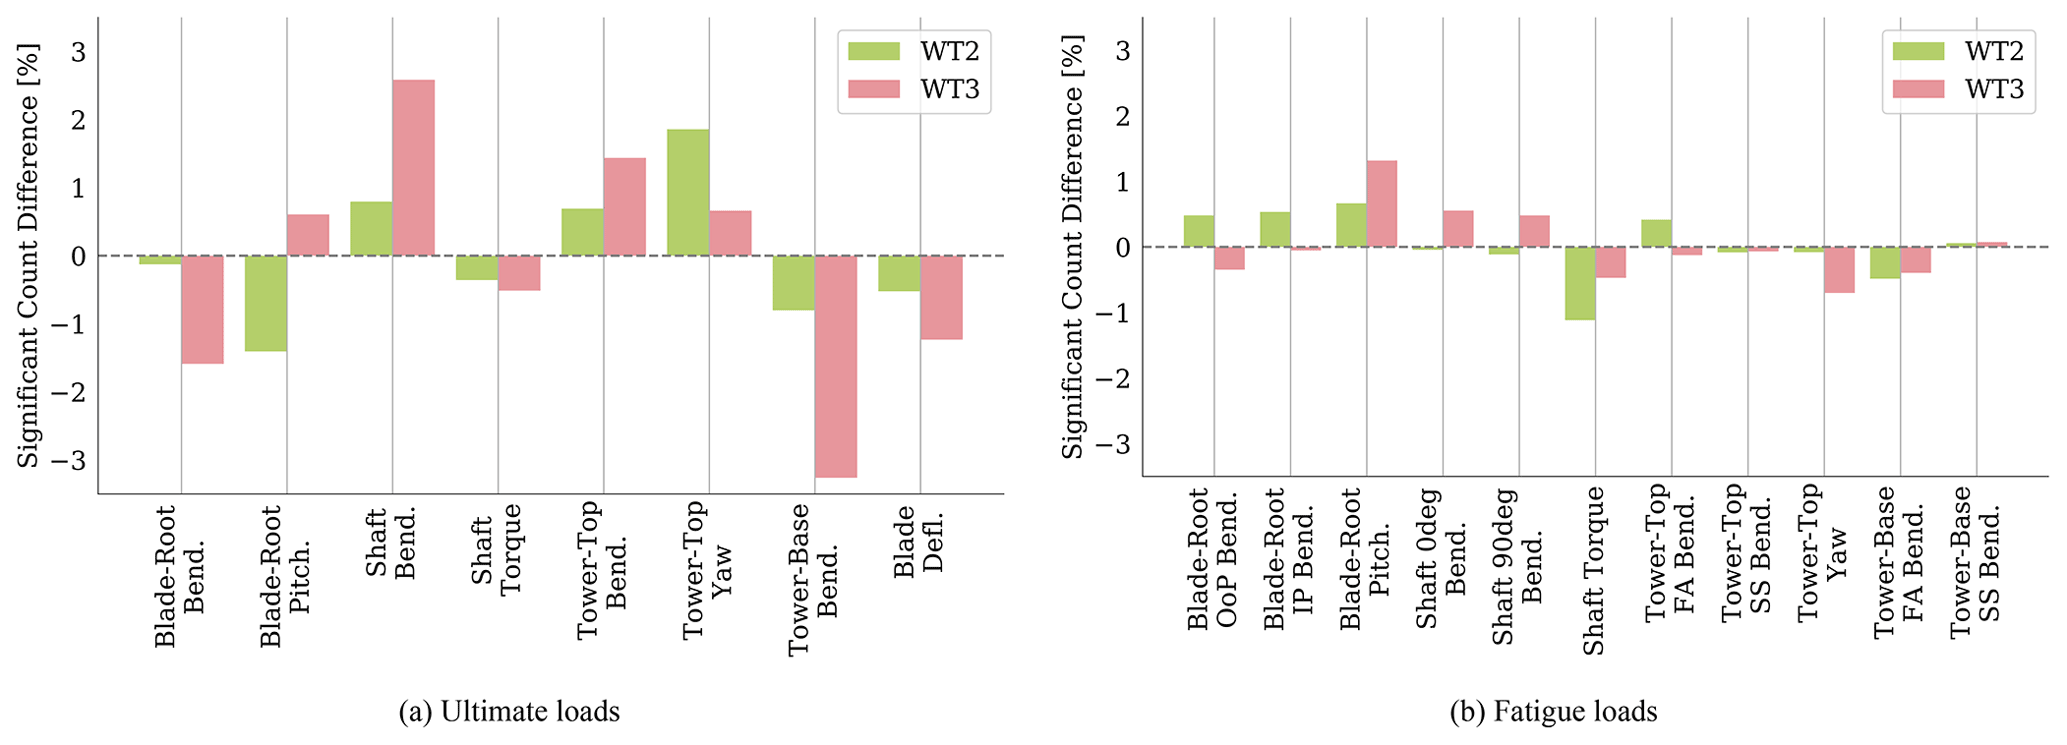
Figure 8The percent difference in significant event counts for WT2 and WT3 relative to WT1, based on QoI.
Histogram plots of blade-root pitching moment EE values are shown in Figs. 6 and 7 for ultimate and fatigue loads, respectively. The histograms show the contribution from all input parameters, with wind speed bins and turbines shown in separate subplots. Here, tertiary parameters are highlighted in bright colors to better recognize when they contribute to the significant event count. For ultimate loads, the distribution of outliers was consistent across the turbines, with most outliers occurring at below-rated wind speeds. Tertiary effects do, however, occur the most for WT3, in particular at above-rated wind speeds. Similar results were seen for the fatigue load results in Fig. 7, with overall distributions remaining consistent across the turbines but tertiary effects occurring the most for WT3 and near-rated wind speeds.
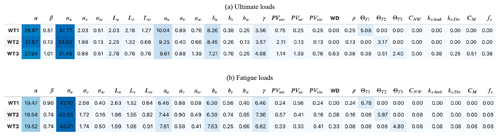
Table 6Tabulated results for the number of ultimate load significant events for each input parameter, separated by QoI. Cells are colored by the count value, with darker blue representing a more positive count and darker red representing a more negative count. Results for WT1 show the absolute number of significant events, while results for WT2 and WT3 show the number of significant events relative to WT1.
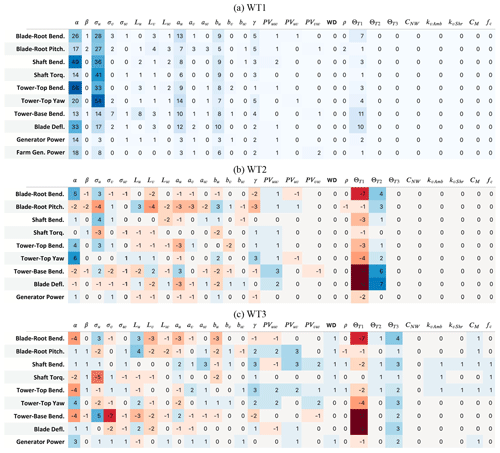
To further investigate which QoIs were influenced by the input parameters, Table 6 shows tabulated results for the number of ultimate load significant events for each input parameter, separated by QoI. Results for WT1 show the absolute number of significant events, while results for WT2 and WT3 show the number of significant events relative to WT1. Table 6a shows the absolute value, whereas Table 6b and c show the difference from WT1 results for the waked turbines. Similar results are shown in Table 7 for fatigue loads. For all turbines, the top three QoIs that contribute to load sensitivity were tower-top bending, tower-top yaw moment, and low-speed shaft bending, though the exact ranking was different for all turbines. For each turbine, 14 %–18 % of the significant events result from these load channels. The frequency with which QoI triggered significant events differs, as summarized in Fig. 8, which shows the percent difference in significant event counts for WT2 and WT3 relative to WT1 as calculated by Eq. (5), but based on QoI instead of input parameter. For WT2, the most differences occur for blade-root pitching moment, reduced by 1.5 %, and tower-top yaw moment, increased by 1.8 %. For WT3, the most differences occur for tower-base bending moment, reduced by 3.3 %, and shaft bending moment, increased by 2.6 %. Similar results were seen for fatigue results, though to a lesser extent.
Table 7Tabulated results for the number of fatigue load significant events for each input parameter, separated by QoI. Cells are colored by the count value, with darker blue representing a more positive count and darker red representing a more negative count. Results for WT1 show the absolute number of significant events, while results for WT2 and WT3 show the number of significant events relative to WT1.
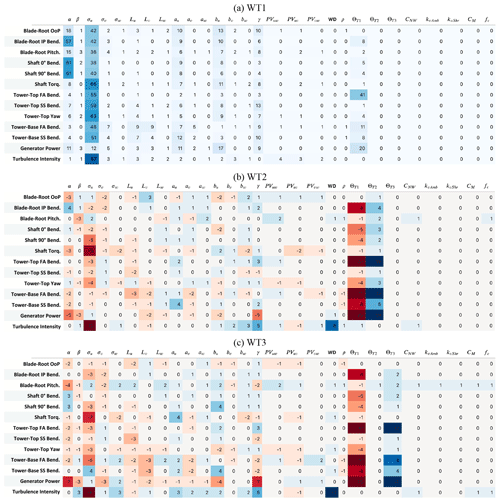
When looking only at the contribution of tertiary parameters in Table 6b and c, blade-root pitching moment stands out the most for all turbines, though nearly twice as much for WT3 compared to WT1. Overall, WT3 loads were up to 8 times more sensitive to tertiary parameter variation as compared to WT1, with this highest increase occurring for low-speed shaft bending ultimate loads. Tower-top bending, tower-top yaw moment, and low-speed shaft bending contributed the most to load sensitivity for all turbines. Though the top QoIs were the same, the exact ranking and number of events differed.
Table 7 shows tabulated results for the number of fatigue load significant events for each input parameter, separated by QoI. For all turbines, the top three QoIs that contribute to load sensitivity were blade-root in-plane bending, low-speed shaft 0∘ bending, and low-speed shaft 90∘ bending. For each turbine, 26 %–28 % of the significant events result from these load channels. The QoIs that were most sensitive for WT1 were in-plane blade-root moment and low-speed shaft bending. For waked turbines, the most sensitive QoIs were in-plane blade-root bending moment, inflow TI, and 0∘ low-speed shaft bending. For WT3, inflow TI was the most sensitive QoI. When considering Fig. 8b, the highest increase in QoI sensitivity was for blade-root pitching, with WT3 resulting in 2.5 times as many significant events from tertiary parameters compared to WT1.
This work aimed to highlight the relative importance of inflow and wake parameters for fatigue and ultimate load sensitivity. This was accomplished by developing metrics to assess the sensitivity of several turbine load measurements and assessing how this sensitivity changes with varying inflow and wake conditions. The sensitivity was assessed using an elementary effects method, considering a wide range of possible wind inflow and wake conditions. From these sensitivity values, a thresholding method was used to determine when a sensitivity value was classified as a “significant event”. From this, the number of significant events triggered by varying each parameter was analyzed, along with which aeroelastic quantities of interest were most effected. The results from this work can be used to better inform the turbine design process and site suitability analyses and to help identify important measurement quantities when designing wind farm experiments.
The results of this work show that for both waked and unwaked turbines, ambient turbulence in the primary wind direction and shear were the most sensitive parameters for turbine fatigue and ultimate loads. Secondary parameters of importance for all turbines were identified as yaw misalignment, u-direction integral length, and u components of the International Electrotechnical Commission (IEC) coherence model, as well as the exponent. The tertiary parameters of performance differ between waked and unwaked turbines. Tertiary effects for ultimate loads of waked turbines were veer, non-streamwise components of the IEC coherence model, Reynolds stresses, wind direction, air density, and several wake calibration parameters; these tertiary effects account for up to 9.0 % of the significant events for waked turbines. For fatigue loads, the tertiary effects of waked turbines were the vertical turbulence standard deviation, lateral and vertical wind integral lengths, lateral and vertical wind components of the IEC coherence model, Reynolds stresses, wind direction, and all wake calibration parameters; tertiary effects account for up to 5.4 % of the significant events of waked turbines. This information shows the increased importance of non-streamwise wind components and wake parameters in fatigue and ultimate load sensitivity of downstream turbines. Additionally, the most affected quantities of interest differed between waked and unwaked turbines.
The source code for all simulation software used in this work is available for download at https://github.com/OpenFAST/openfast (OpenFAST, 2017). Note that this is a research code, and the version available here may not be the exact version used for this work. This code is developed and maintained by NREL.
The large number of simulations performed for this work resulted in a resulting dataset that is too large to be practically shared. Interested parties may contact the authors for more information.
KS led the investigation. ANR developed the EE methodology approach used in the parameter study. JJ provided the conceptualization and supervision for this project. KS prepared the article with support from ANR and JJ.
The contact author has declared that none of the authors has any competing interests.
Publisher’s note: Copernicus Publications remains neutral with regard to jurisdictional claims in published maps and institutional affiliations.
The research was performed using computational resources sponsored by the U.S. Department of Energy's Office of Energy Efficiency and Renewable Energy and located at the National Renewable Energy Laboratory.
This research has been supported by the U.S. Department of Energy, National Renewable Energy Laboratory (contract no. DE-AC36-08GO28308). Funding was provided by the Department of Energy Office of Energy Efficiency and Renewable Energy Wind Energy Technologies Office.
This paper was edited by Michael Muskulus and reviewed by two anonymous referees.
Clifton, A.: 135 m Meteorological Towers at the NWTC, Instrumentation, Data Acquisition and Processing (Draft), https://wind.nrel.gov/MetData/Publications/ (last access: 5 August 2019), 2014. a
Diaz, S., Carta, J. A., and Castaneda, A.: Influence of the Variation of Meteorological and Operational Parameters on Estimation of the Power Output of a Wind Farm with Active Power Control, Renew. Energ., 159, 812–826, https://doi.org/10.1016/j.renene.2020.05.187, 2020. a
Dimitrov, N., Natarajan, A., and Kelly, M.: Model of Wind Shear Conditional on Turbulence and Its Impact on Wind Turbine Loads, Wind Energy, 18, 1917–1931, 2015. a
Doubrawa, P., Annoni, J., Jonkman, J., and Ghate, A.: Optimization-Based Calibration of FAST.Farm Parameters Against SOWFA, in: AIAA SciTech Forum, 36th Wind Energy Symposium, 8–12 January 2018, AIAA, Kissimmee, FL, USA, https://doi.org/10.2514/6.2018-0512, 2018. a, b
Dykes, K., Ning, A., King, R., Graf, P., Scott, G., and Veers, P.: Sensitivity Analysis of Wind Plant Performance to Key Turbine Design Parameters: A Systems Engineering Approach, in: AIAA SciTech Forum, 13–17 January 2014, AIAA, National Harbor, Maryland, USA, 1–26 pp., https://doi.org/10.2514/6.2014-1087, 2014. a
Gan, Y., Duan, Q., Gong, W., Tong, C., Sun, Y., and Chu, W.: A Comprehensive Evaluation of Various Sensitivity Analysis Methods: A Case Study with a Hydrological Model, Environ. Modell. Softw., 51, 269–285, 2014. a
Gaumond, M., Réthoré, P.-E., Ott, S., Peña, A., Bechmann, A., and Hansen, K. S.: Evaluation of the Wind Direction Uncertainty and Its Impact on Wake Modeling at the Horns Rev Offshore Wind Farm, Wind Energy, 17, 1169–1178, doi10.1002/we.1625, 2014. a, b
Jonkman, B.: TurbSim User's Guide v2.00.00, Tech. Rep. NREL/TP, October 2014, National Renewable Energy Laboratory, Golden, CO, USA, https://www.nrel.gov/wind/nwtc/assets/downloads/TurbSim/TurbSim_v2.00.pdf (last access: 2 January 2023), 2014. a
Jonkman, J., Butterfield, S., Musial, W., and Scott, G.: Definition of a 5 MW Reference Wind Turbine for Offshore System Development, Tech. Rep. NREL/TP-500-38060, February 2009, National Renewable Energy Laboratory, Golden, CO, USA, https://www.nrel.gov/docs/fy09osti/38060.pdf (last access: 2 January 2023), 2009. a, b
Jonkman, J. M. and Shaler, K.: FAST.Farm User's Guide and Theory Manual, Tech. Rep. NREL/TP-5000-78485, April 2021, National Renewable Energy Laboratory, Golden, CO, USA, https://www.nrel.gov/docs/fy21osti/78485.pdf (last access: 2 January 2023), 2021. a, b
Kelley, N.: Turbulence-Turbine Interaction: The Bases for the Development of the TurbSim Stochastic Simulator, Tech. Rep. NREL/TP-5000-52353, November 2011, National Renewable Energy Laboratory, Golden, CO, USA, https://www.nrel.gov/docs/fy12osti/52353.pdf (last access: 2 January 2023), 2011. a
Martin, R., Lazakis, I., Barbouci, S., and Johanning, L.: Sensitivity Analysis of Offshore Wind Farm Operation and Maintenance Cost and Availability, Renew. Energ., 85, 1226–1236, 2016. a, b
Moroz, E.: Time to Upgrade the Wind Turbine Suitability Process, 22–25 May 2017, AWEA WindPower, Anaheim, CA, USA, 2017. a
Nelson, L. D., Manuel, L., Sutherland, H. J., and Veers, P. S.: Statistical Analysis of Wind Turbine Inflow and Structural Response Data from the LIST Program, Journal of Solar Energy Engineering, 125, 541–550, https://doi.org/10.1115/1.1627831, 2003. a
OpenFAST: openfast documentation, GitHub, https://github.com/OpenFAST/openfast (last access: 1 May 2021), 2021. a
Quick, J., Annoni, J., King, R., Dykes, K., Fleming, P., and Ning, A.: Optimization Under Uncertainty for Wake Steering Strategies, J. Phys. Conf. Ser., 854, 1–10, https://doi.org/10.1088/1742-6596/854/1/012036, 2017. a, b
Rezaei, M., Mostafaeipour, A., Saidi-Mehrabad, M., Qolipour, M., Sedaghat, A., Arabnia, H. R., and Momeni, M.: Sensitivity Analysis of Criteria to Optimize Wind Farm Localizing: A Case Study, Wind Engineer., 44, 294–312, https://doi.org/10.1177/0309524X19849848, 2020. a
Robertson, A. N., Shaler, K., Sethuraman, L., and Jonkman, J.: Sensitivity analysis of the effect of wind characteristics and turbine properties on wind turbine loads, Wind Energ. Sci., 4, 479–513, https://doi.org/10.5194/wes-4-479-2019, 2019. a, b, c, d, e, f, g, h, i, j, k, l, m, n, o, p
Saranyasoontorn, K. and Manuel, L.: On the Study of Uncertainty in Inflow Turbulence Model Parameters in Wind Turbine Applications, 44th AIAA Aerospace Sciences Meeting and Exhibit, 9–12 January 2006, AIAA, Reno, NV, USA, 2006. a, b
Saranyasontoorn, K., Manuel, L., and Veers, P. S.: A Comparison of Standard Coherence Models for Inflow Turbulenc with Estimates from Field Measurements, J. Sol. Energ., 126, 1069–1082, 2004. a
Shaler, K., Jonkman, J., and Hamilton, N.: Effects of Inflow Spatiotemporal Discretization on Wake Meandering and Turbine Structural Response Using FAST.Farm, J. Phys.-Conf. Ser., 1256, 012023, https://doi.org/10.1088/1742-6596/1256/1/012023, 2019. a
Solari, G.: Turbulence Modelling for Gust Loading, J. Struct. Eng., 113, 1550–1569, 1987. a
Solari, G. and Piccardo, G.: Probabilistic 3-D Turbulence Modeling for Gust Buffeting of Structures, Probabilist. Eng. Mech., 16, 73–86, 2001. a
Tautz-Weinert, J., Yurusen, N. Y., Melero, J. J., and Watson, S. J.: Sensitivity Study of a Wind Farm Maintenance Decision – A Performance and Revenue Analysis, Renew. Energ., 132, 93–105, https://doi.org/10.1016/j.renene.2018.07.110, 2019. a
Teunissen, H.: Characteristics of the Mean Wind and Turbulence in the Planetary Boundary Layer, Phd thesis, University of Toronto, Toronto, Canada, http://resolver.tudelft.nl/uuid:40e61f5a-17f5-4641-bb35-9d8dcff95eec (last access: 2 January 2023), 1970. a
Ulazia, A., Sa'enz, J., Ibarra-Berastegi, G., González-Rojí, S. J., and Carreno-Madinabeitia, S.: Global Estimations of Wind Energy Potential Considering Seasonal Air Density changes, Energy, 187, 1–11, https://doi.org/10.1016/j.energy.2019.115938, 2019. a, b
Walter, K., Weiss, C., Swift, A., Chapman, J., and Kelley, N. D.: Speed and Direction Shear in the Stable Nocturnal Boundary Layer, J. Sol. Energ. Engineering, 131, 1–7, https://doi.org/10.1115/1.3035818, 2019. a