the Creative Commons Attribution 4.0 License.
the Creative Commons Attribution 4.0 License.
 | 30 Mar 2023
Evolution of eddy viscosity in the wake of a wind turbine
Ryan Scott
Luis Martínez-Tossas
Juliaan Bossuyt
Nicholas Hamilton
Raúl B. Cal
The eddy viscosity hypothesis is a popular method in wind turbine wake modeling for estimating turbulent Reynolds stresses. We document the downstream evolution of eddy viscosity in the wake of a wind turbine from experimental and large-eddy-simulation data. Wake eddy viscosity is isolated from its surroundings by subtracting the inflow profile, and the driving forces are identified in each wake region. Eddy viscosity varies in response to changes in turbine geometry and nacelle misalignment with larger turbines generating stronger velocity gradients and shear stresses. We propose a model for eddy viscosity based on a Rayleigh distribution. Model parameters are obtained from scaling the eddy viscosity hypothesis and demonstrate satisfactory agreement with the reference data. The model is implemented in the curled wake formulation in the FLOw Redirection and Induction in Steady State (FLORIS) framework and assessed through comparisons with the previous formulation. Our approach produced more accurate flow field estimates with lower total error for the majority of cases.
- Article
(3340 KB) - Full-text XML
- BibTeX
- EndNote


Accurate wake modeling is essential for optimizing wind plant layouts and creating effective control strategies (Veers et al., 2022; Meyers et al., 2022). Hybrid wake models balance the accuracy of high-fidelity simulations with the computational efficiency of analytic models to facilitate wind plant design studies. Unlike superposition-based approaches (Hamilton et al., 2020), hybrid wake models adopt a combined Reynolds-averaged Navier–Stokes (RANS)-analytic framework to solve a linearized or parabolic representation of the mass and momentum equations (Martínez-Tossas et al., 2019, 2021; Bastankhah et al., 2021). This allows hybrid wake models to include additional physics beyond the scope of typical engineering wake models without incurring substantial computational costs. While wake model development is an active area (Porté-Agel et al., 2020; Bastankhah et al., 2021, 2022), in the context of wind plant design, the applicability of these models is largely dependent on their ability to predict wake recovery on the order of turbine row spacing (Meyers et al., 2022). Subtle differences in estimating wake losses at this scale have an outsized impact on assessing the effectiveness of control strategies (Bay et al., 2022). Improving far-wake representation without adding significant computational cost is needed to consider future wind plant design and operation strategies.
Hybrid wake models are often employed as design tools to evaluate the effectiveness of wake loss mitigation strategies such as wake steering, a popular approach for mitigating wake losses achieved by yawing or tilting the turbine rotor. While wake steering allows wind plant operators to increase net power production, the wake generated by a misaligned turbine introduces additional complexity requiring more advanced models (Martínez-Tossas et al., 2019; Zong and Porté-Agel, 2020). In particular, the formation of a counter-rotating vortex pair downstream of a misaligned turbine leads to substantial wake deformation and displacement (Howland et al., 2016; Bastankhah and Porté-Agel, 2016; Scott et al., 2020; Bossuyt et al., 2021). The curled wake formulation implemented in FLORIS (FLOw Redirection and Induction in Steady State) (NREL, 2022a) was developed to model the effects of nacelle misalignment via yaw or tilt by using a collection of vortices shed from the rotor plane (Martínez-Tossas et al., 2019, 2021). In order to maintain a balance of precision and efficiency, this model solves a simplified version of the Reynolds-averaged Navier–Stokes equations with turbulence approximated by an effective eddy viscosity.
Eddy viscosity is responsible for relating the mean flow gradients and turbulent kinetic energy to turbulent stress formation. In a wind turbine wake, eddy viscosity relates gradients in the local momentum deficit to Reynolds stress formation. Ultimately, eddy viscosity in wake models determines the wake diffusion rate and is directly responsible for predicting wake longevity. Eddy viscosities are typically determined through a mixing length model and assumed to either maintain a constant value (Martínez-Tossas et al., 2019, 2021; van der Laan et al., 2023) or linearly increase with wake expansion (Shapiro et al., 2020; Bastankhah et al., 2022). Alternatively, a three-dimensional eddy viscosity can be modeled with a scalar function tuned to the turbulent production and dissipation of calibration flow (van der Laan et al., 2015; van der Laan and Andersen, 2018). This scalar functions acts as a turbulence length scale limiter which allows the model to represent localized behavior in the near wake and at the wake edges as well as improving velocity deficit estimation. If high-resolution data are available, such as from large eddy simulations (LESs) or RANS models, eddy viscosities may be obtained by directly solving the Boussinesq approximation or higher-order closure models (Schmelzer et al., 2020; Baungaard et al., 2022). Eddy viscosities may also be obtained from measured or simulated flows via a linear regression between the strain rate tensor and turbulent shear stress tensor (Rockel et al., 2016; Bai et al., 2012). Across techniques, prior descriptions of eddy viscosity have relied on a global approach to represent turbulence in both the background and wake flows conflating boundary layer phenomena occurring at large scales with localized wake behavior. Additionally, Rockel et al. (2014, 2016) and Kadum et al. (2019, 2021) found the eddy viscosity and intermittency of a floating offshore turbine was affected by wave-induced pitch motion which is not present in current models. Finally, the streamwise behavior of eddy viscosity has yet to be quantified in a parametric study spanning multiple inflow conditions, turbine sizes, and misalignment angles.
Here we propose a model to describe eddy viscosity as a function of downstream distance, inflow conditions, and turbine operating parameters. We isolate wake flow from its background by subtracting the inflow velocity profile. We document the evolution of the eddy viscosity coefficient in the wake of a wind turbine for a range of conditions. Eddy viscosities are obtained from wind tunnel experiments with scaled turbine models and LESs performed in the Simulator for On/Offshore Wind Farm Applications (SOWFA) (Churchfield et al., 2012). Details regarding the theoretical background may be found in Sect. 2. Specifics on wind tunnel facilities, LES procedures, and data processing are provided in Sect. 3. Findings and model development are presented in Sect. 4 with concluding remarks following in Sect. 5.
The Reynolds-averaged Navier–Stokes equations for incompressible flow are presented in tensor notation as
where ρ is the fluid density, p the pressure, and fi is the force exerted by the turbine rotor. Here and in subsequent formulations, mean quantities are expressed as (u) and turbulent fluctuations about the mean as primed (u′). Ensemble-averaging is denoted with an overbar, and subscript indices represent the streamwise (u), vertical (w), and spanwise (v) velocity components in x, z, and y, respectively. Viscous terms are neglected as the wake flow is dominated by turbulent stresses, and unsteady terms are omitted as the wake is considered stationary.
The eddy viscosity hypothesis relates turbulent stresses to turbulent kinetic energy and the rate of strain tensor. This relationship is introduced as
where is the turbulent stress tensor, k is the turbulent kinetic energy, and Sij is the rate of strain tensor. Eddy viscosity is written as νT and acts as a constant of proportionality. In a wind plant, the streamwise-vertical components of the Reynolds stress are responsible for the majority of energy flux into the plant (Porté-Agel et al., 2020; Scott et al., 2020) allowing Eq. (2) to be described in terms of mean flow components:
Note that, in the presence of high-veer Coriolis forces or nacelle yaw, the streamwise-lateral stresses are of similar order. In these instances, we expect comparable eddy viscosity magnitudes could be obtained from the streamwise-lateral components. We propose and νTSij can be decomposed into background and wake flow components, denoted with subscripts “B” and “w”, respectively:
where νT,B and νT,w are specific to the background and wake flows assuming both have analogous behavior such that independent values of νT can be assigned. Isolating the wake flow in this manner allows computing the wake contribution to Reynolds stresses as the difference between the flow upstream and downstream of the turbine. Since eddy viscosity relates the turbulent stress tensor to the rate of strain tenor, we can estimate this difference as the product of eddy viscosity and the wake rate of strain tensor. The resulting background and wake Reynolds stresses are
The total turbulent stress tensor, , in the wake region can be reconstructed by adding the Reynolds stresses introduced by the wake Eq. (7) to the background flow Eq. (6) following Eq. (4) to produce
In a fully developed boundary layer, Sij|B is assumed not to vary in the streamwise direction and behave as a function of the wall-normal direction only. Therefore, νT,B is independent of x. Once the wake is fully recovered, the velocity deficit is no longer present; i.e., Sij|w=0 and the eddy viscosity hypothesis reduces to that of the background flow:
Thus our efforts focus on modeling νT,w in the range where the wake flow exists. Because we consider the background and wake flows separately, νT,w is determined by evaluating
where x is given a distance downstream of the turbine. By performing this computation at multiple locations, we can detail the streamwise nature of eddy viscosity. A key assumption of independent wake flow is neglecting ground interactions, so the wake maintains a symmetric distribution of turbulent stresses at each downstream location. While this assumption holds for theoretical wakes, real turbines operate at a fixed distance above the ground over a variety of surfaces. The consequences of neglecting these ground interactions are detailed in the results and discussion.
3.1 Experimental setup
Experimental data were collected through a series of wind tunnel experiments conducted by Bossuyt et al. (2021) in the Portland State University wind tunnel depicted in Fig. 1. The tunnel test section measures 5 m long with a cross section of 1.2×0.8 m. Inflow to the test section was conditioned with vertical strakes to produce a logarithmic boundary layer following Cal et al. (2010) and Hamilton and Cal (2015). Chains measuring 0.005 m were placed across the tunnel at fixed intervals of 0.1 m to maintain the boundary layer profile throughout the test section. A single scaled model turbine was positioned in the center of the tunnel 3.5 m downstream of the strakes. The model turbine measured 0.084 m in height with a rotor diameter of 0.08 m and was manufactured via 3D printing using a 3D Systems ProJet MJP 3600 printer. A Faulhaber 1016SR motor measuring 0.01 m in diameter was used as a DC generator. Turbine operation was controlled by means of a variable resistance potentiometer tuned such that the tip-speed ratio measured λ≈4, CT≈0.65, and CP≈0.15 for a hub-height inflow velocity of 6.5 m s −1. The Reynolds number based on model turbine diameter was 3.3×10⁴ for the chosen inflow velocity, and the measured turbulence intensity was 11 %. A reference case was created by orienting the model turbine normal to the inflow. Four yaw and tilt angles of ±10 and ±20∘ were considered by rotating the model turbine about its base. As a consequence, tilt misalignment varied nacelle elevation between 0.0045 m lower or higher and 0.026 m downstream or upstream, respectively. Stereoscopic particle image velocimetry (SPIV) measurements were recorded in the wake of a single model wind turbine at downstream distances of 2, 3, 5, and 7 rotor diameters. Inflow conditions were captured by removing the model turbine and recording free stream behavior. Neutrally buoyant aerosolized diethylhexyl sebacate seeding particles were maintained at constant density throughout the experiment. Measurement planes were oriented perpendicular to the mean flow and captured using two 4 M pixel CCD cameras in conjunction with a Litron Nano double-pulsed Nd:YAG (532 nm, 1200 mJ, 4 ns duration) laser; 1500 image pairs spanning 0.24×0.18 m were recorded at a rate of 4 Hz. Images were processed in LaVision DaVis 8.4 with decreasing multipass kernels of 48×48 and 24×24 px at 50 % overlap for a spatial resolution of 0.001 m. Further details pertaining to the experimental setup including inflow profile measurements and turbine characterization are available in Bossuyt et al. (2021).
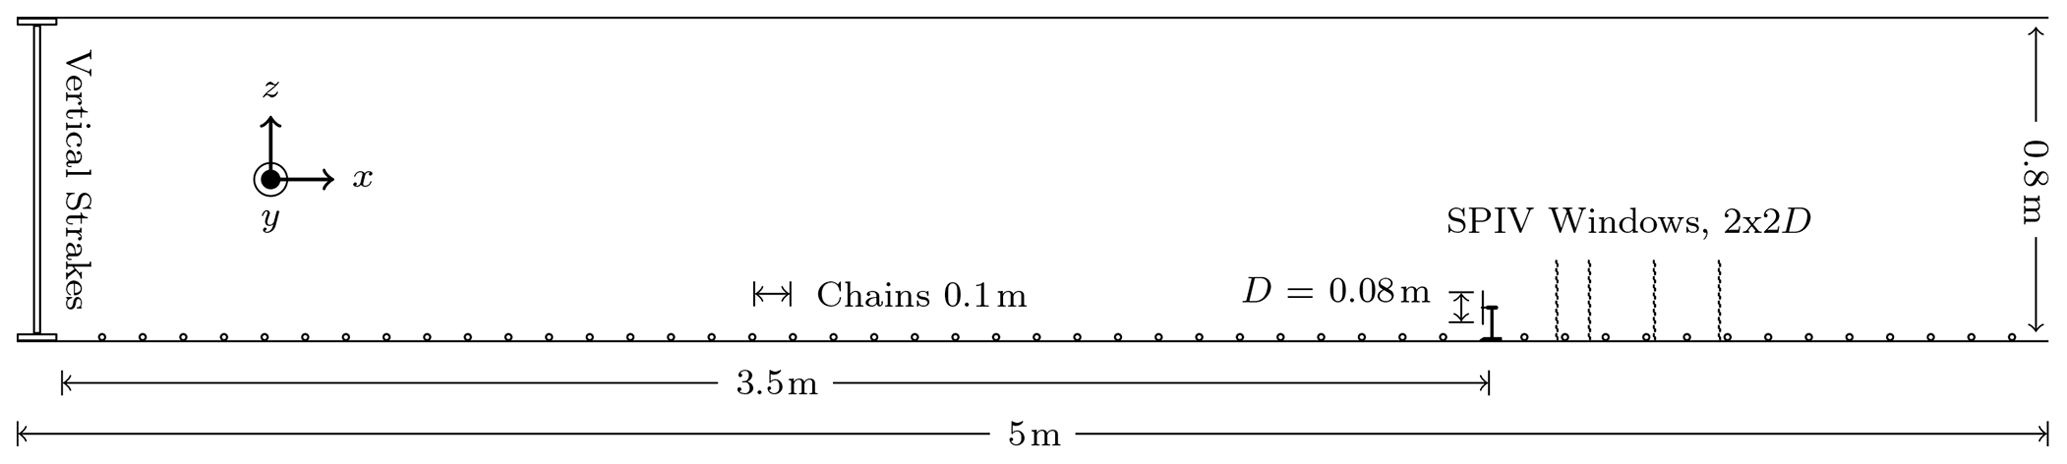
Figure 1Portland State University wind tunnel with experimental apparatus and measurement locations to scale. Chains are shown at 2× scale to enhance visibility. All dimensions in meters unless otherwise noted.
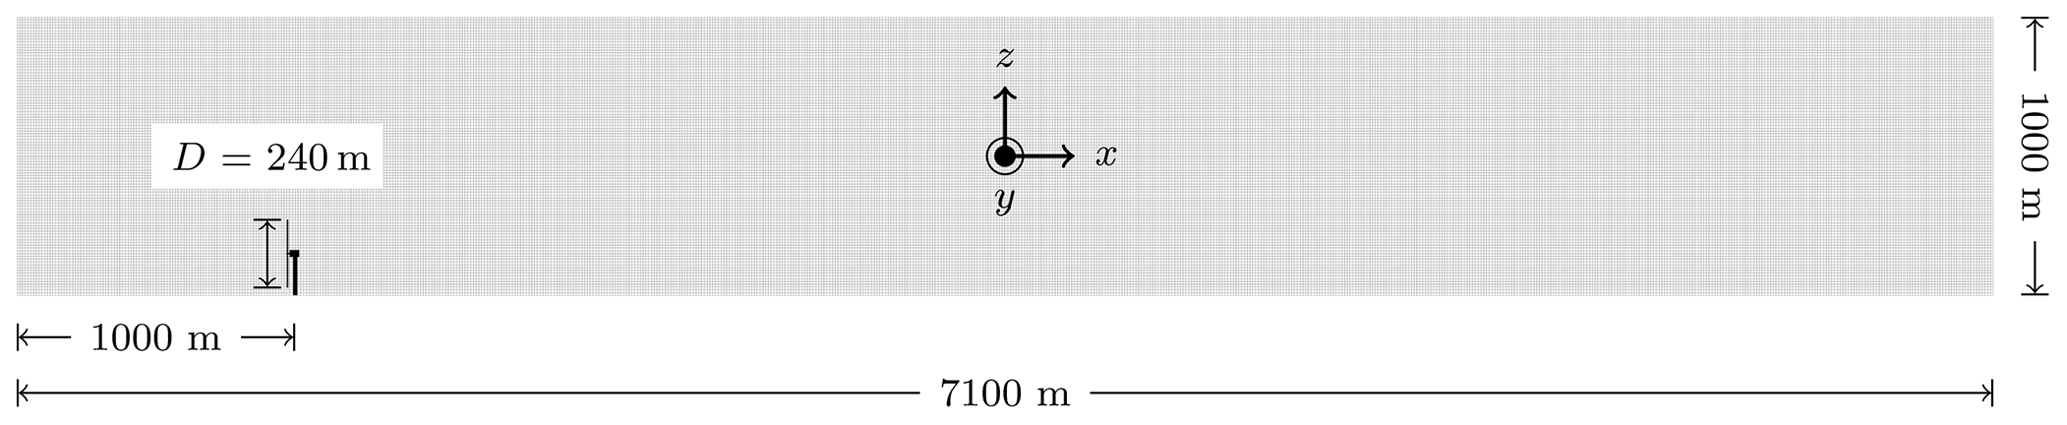
Figure 2IEA-15 MW LES domain with turbine and grid spacing to scale. All dimensions in meters unless otherwise noted.
3.2 LES setup
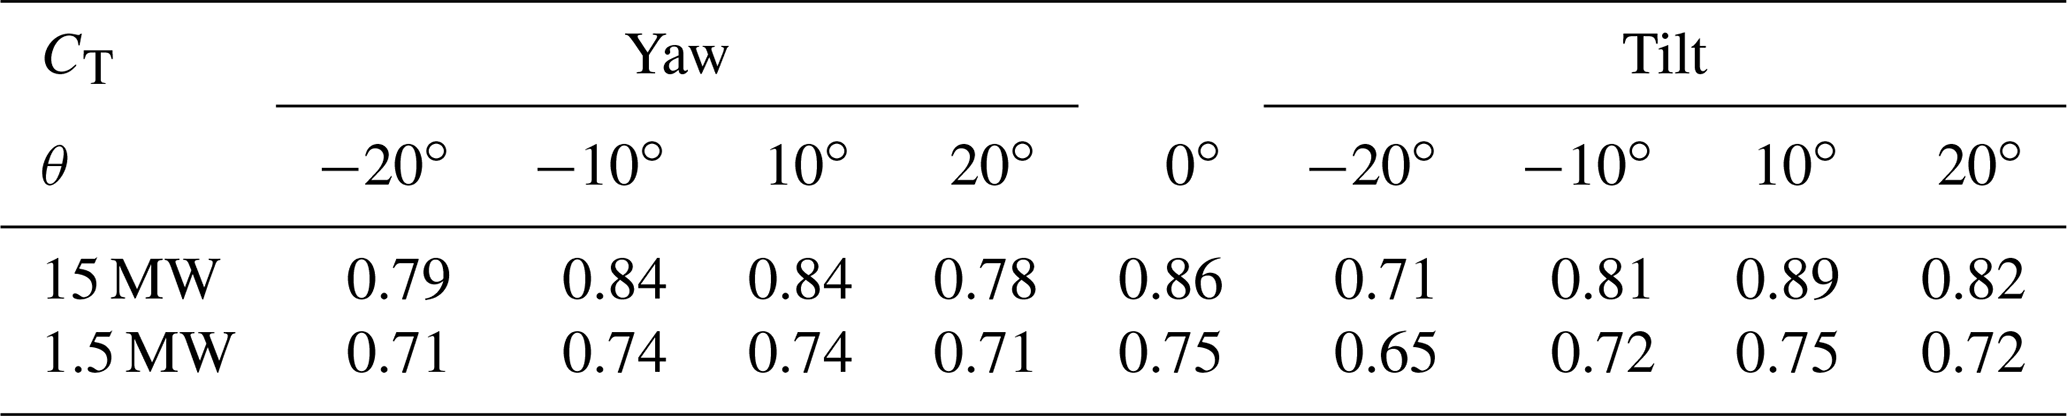
LES data were obtained from a series of SOWFA-6 (NREL, 2022c) simulations with the IEA-15 MW (Gaertner et al., 2020) reference turbine and a 1.5 MW turbine shown in Figs. 2 and 3, respectively. The IEA-15 MW reference turbine rotor diameter measures 240 m and the hub height 150 m. The 1.5 MW turbine rotor diameter was 77 m and the hub height 80 m. Turbine behavior was simulated with the actuator disk model through OpenFAST coupling (NREL, 2022b). Yaw and tilt misalignments of ±10 and ±20∘ were imposed by rotating the turbine nacelle. The total domain size measured (7100; 3000; 1000) m for the 15 MW cases and (3000; 3000; 1000) m for the 1.5 MW cases with a grid resolution of 10 m. Two levels of mesh refinement were added for the 1.5 MW cases to increase grid resolution in the turbine vicinity, so the 15 and 1.5 MW cases shared similar grid resolution across the rotor. The first refinement zone spanned (2310; 390; 300) m and was located at (690; 1320; 0) m. The secondary refinement measured (2160; 310; 250) m and was located at (770; 1350; 0) m. Grid resolution was increased to 5 m in the first zone and again to 2.5 m in the second. A single turbine was located at (1000; 1500; H) m for all SOWFA-6 simulations. A neutral atmospheric boundary layer inflow was generated with a 20 000 s precursor simulation on each base domain with a hub-height inflow velocity of 8 m s−1 and a surface roughness of 0.15 m. Hub-height turbulence intensities were computed from turbulent kinetic energy and averaged from to . Mean turbulence intensity for the 15 MW cases was 6.2±0.3 %, and mean turbulence intensity for the 1.5 MW cases was 8.4±0.2 %. Inflow to the domain was driven by a pressure gradient which was adjusted at each time step to maintain the desired hub-height velocity (Churchfield et al., 2012). The measured thrust coefficients for each turbine configuration at the specified condition are presented in Table 1. In each simulation, 500 s was allotted for startup transients followed by 3000 s of data collection.
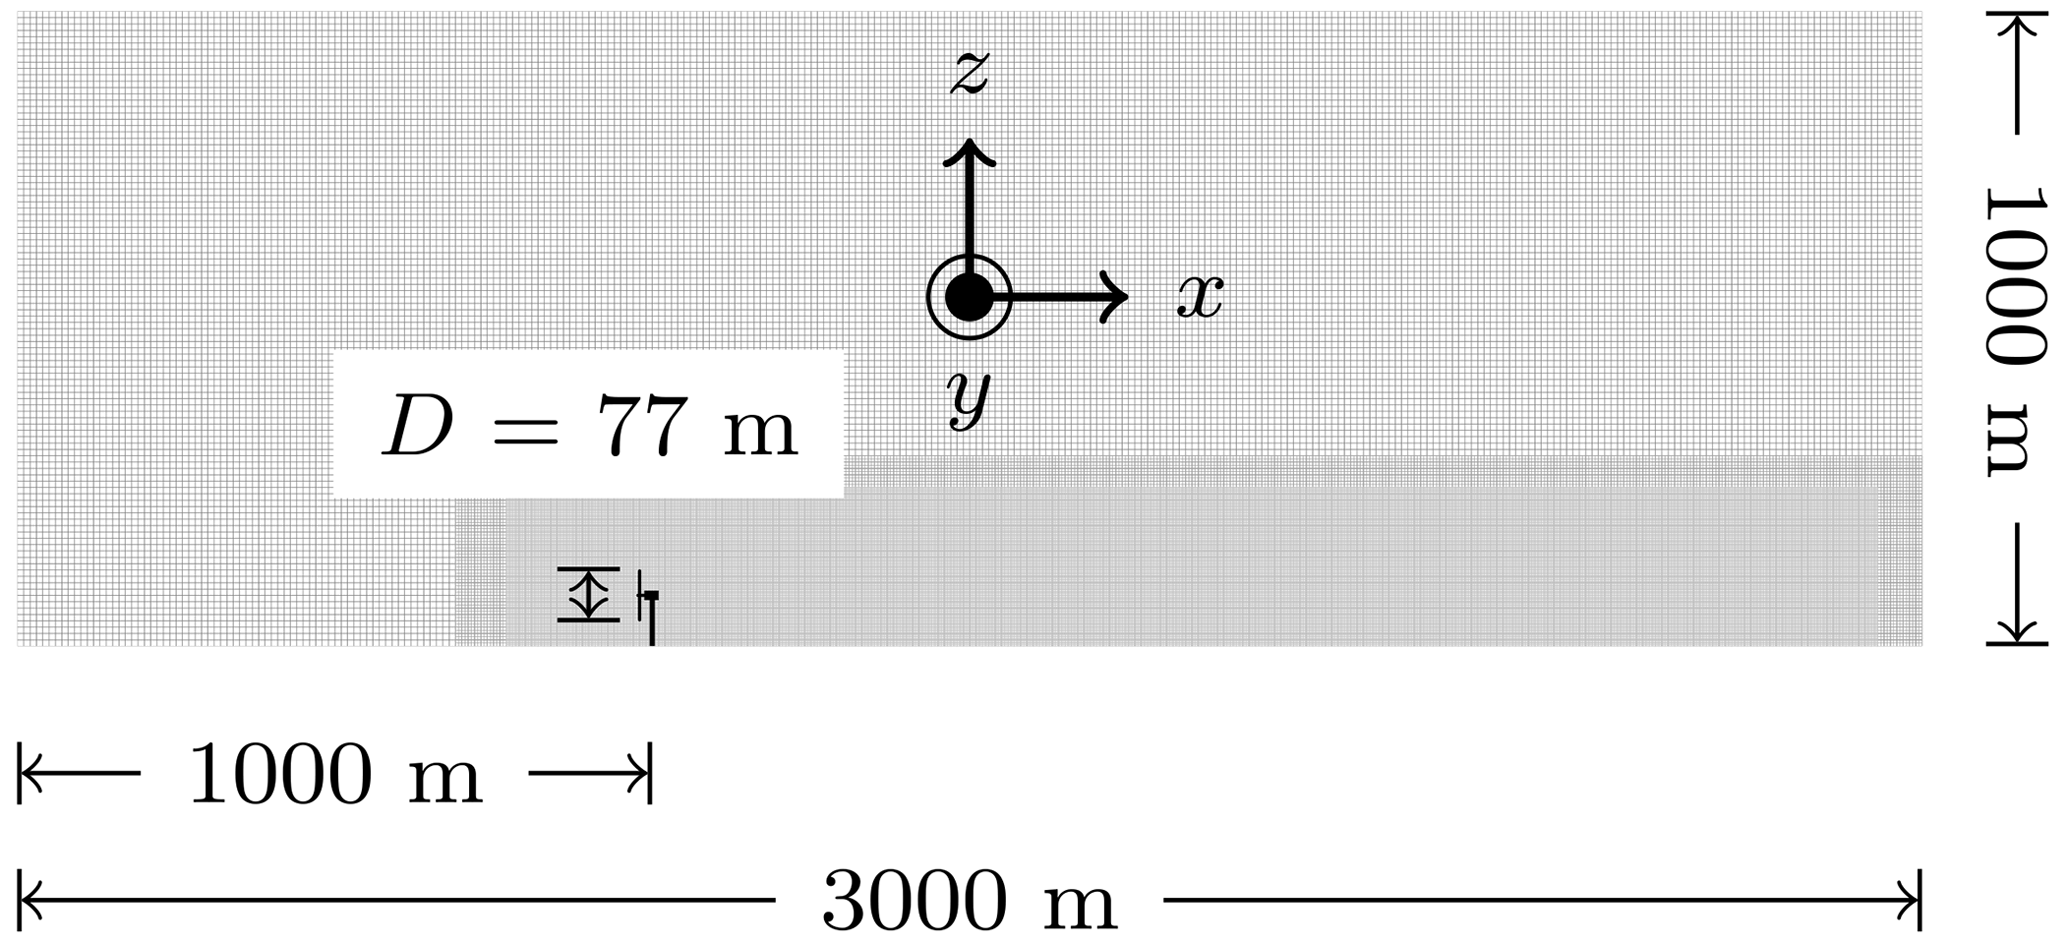
Figure 31.5 MW LES domain with turbine, mesh refinement zones, and grid spacing to scale. All dimensions in meters unless otherwise noted.
Table 1Time-averaged thrust coefficients for the 15 and 1.5 MW LES cases.
4.1 Streamwise evolution of eddy viscosity
Eddy viscosity values are obtained at each downstream location from the slope of a least squares linear regression between S13|w and . Wake flow is isolated downstream of the turbine following Eqs. (4) and (5). Both S13|B and are obtained from the reference plane at X for experimental data, then as streamwise averages spanning D through D for simulation data. In the experimental setup, upstream of the turbine by design and is not included in S13|B. Furthermore, is found to be at least 2 orders of magnitude less than across all data sets. However, its contribution to S13|w is included for completeness. Example planes of the streamwise-vertical component of the velocity gradient tensor and its corresponding component of the Reynolds stress tensor are shown in Fig. 4. Slope fit error is computed with the standard regression error and presented as shaded 95 % confidence bounds on νT,w in Fig. 4. Since ground interactions introduce substantial strain near the surface, data below a height of are discarded to ensure eddy viscosities reflect wake rather than surface phenomena. Additionally, only data contained within (y±1.15 D, ) are considered at each streamwise location, so the measurement area is consistent across all data sets. Neglecting LES data outside this area does not influence the quality of the linear regression as quantities outside the wake are near zero from Eq. (10).
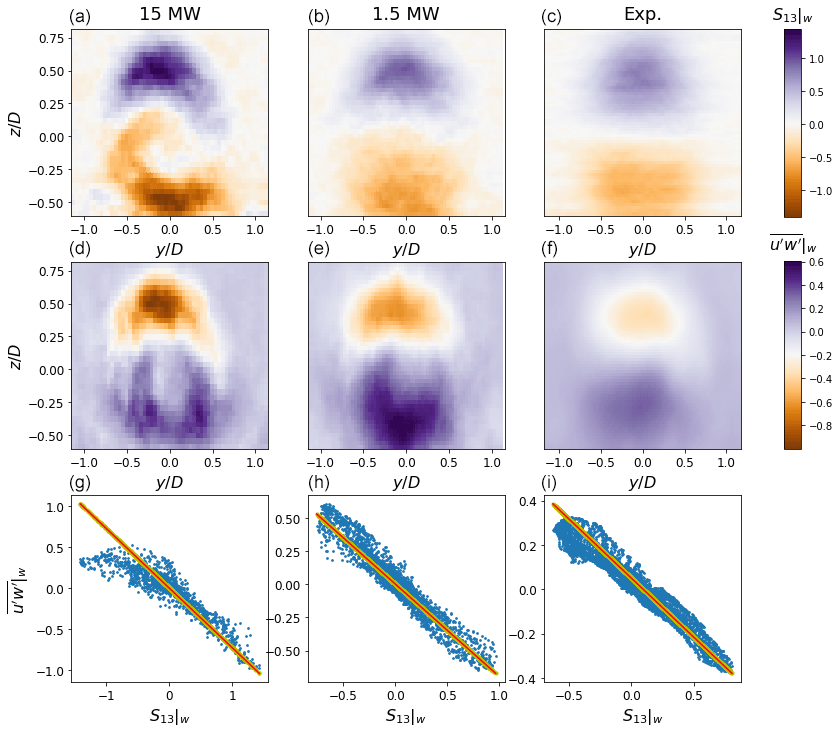
Figure 4Contours of streamwise velocity in y–z planes of S13|w (a–c) and (d–f) with the corresponding linear fit (g–i) at for the aligned turbine cases. The 1.5 MW (b, e, h) and scaled model turbine (c, f, i) display symmetry in both S13|w and as the wakes from these turbines are unimpeded. The 15 MW turbine (a, d, g) produces a greater velocity deficit than the smaller turbines and exhibits additional strain near the ground due to its low rotor ground clearance.
Eddy viscosity evolves downstream of the turbine as the wake flow recovers, highlighted in Fig. 5. Here, is normalized relative to the maximum value for each case to facilitate consistent comparisons across cases. Immediately downstream of the turbine rotor, , the flow is dominated by the momentum deficit and pressure gradients from turbine operation. Shear stresses are small in this region and develop downstream as energy is converted from mean flow gradients into turbulence. A linear relationship is present between S13,w and with negligible average fit errors below 1 % of . S13|w peaks just behind the rotor and begins to decay as the initial momentum deficit recovers. Eddy viscosity displays a convex increase in response to the decreasing rate of strain coupled with increasing turbulent stresses.
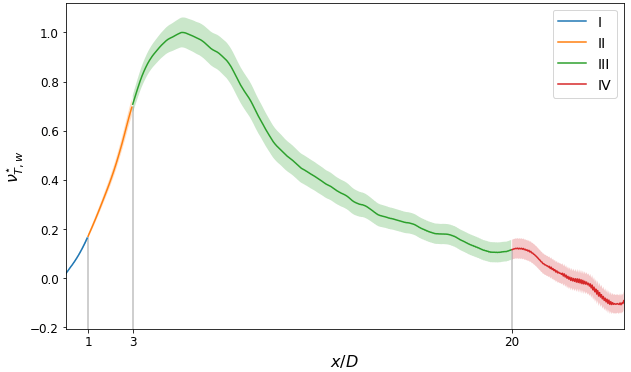
Figure 5Normalized wake eddy viscosity for the aligned 15 MW LES case. Slope fit error is represented with shading. Color denotes portions of the wake governed by similar terms in Eq. (1). Downstream locations where driving terms transition are indicated with vertical lines.
From , the momentum deficit recovers and strain transfers to turbulence with maximum shear stresses present near . Linear regression error is low here as well with average fit errors near 2 % of . S13|w diminishes from continued wake recovery while Reynolds stresses continue to develop. However, after peaks near , wake eddy viscosity is driven by the rate of momentum recovery relative to turbulent dissipation.
Beyond, the remaining velocity deficit is recovered and turbulence follows the energy cascade towards small scales. Since S13|w and are decreasing, a shift from concave to convex curvature is visible in Fig. 5. As the wake dissipates, the quality of the linear fit decreases as shown by increasing regression error magnitudes in Fig. 5 up to 10 % of . The rate of strain is small, , but remains as long as turbulent fluctuations are present in the wake. Eddy viscosity reaches its maximum here as the mechanisms for continued growth have deteriorated and νT,w is now driven by exclusively Reynolds stress decay. At large downstream distances, , the wake flow has dissipated and both S13|w and are near zero. As the wake has returned to the background flow, performing a linear regression on wake flow components produces erroneous values. This is not the case for the background flow which is treated separately.
Based on these observations, we propose the streamwise behavior of eddy viscosity in the wake may be modeled as a Rayleigh function:
where A parameterizes amplitude and σ is the scale parameter. A is determined by performing a scale analysis on the eddy viscosity hypothesis in which each component of Eq. (3) is written in terms of their respective units. By selecting a velocity scale Us, a length scale ls, and noting , we can write
Rearranging to isolate eddy viscosity yields
The wake velocity scale is selected as following Bastankhah and Porté-Agel (2016), where CT is the turbine thrust coefficient and UB is the mean inflow velocity at hub height. The length scale is selected as ls∼R, where R is the rotor radius. Note that radius is selected rather than diameter as both the rate of strain tensor and shear stresses are symmetric about the wake center. Additionally, the chosen velocity scale is derived from 1 D momentum theory to estimate the mean velocity in the far wake. Substituting the velocity and length scales into Eq. (13) yields an expression for the eddy viscosity magnitude:
where CT is the turbine thrust coefficient, UB is the inflow velocity at hub height, and R is the rotor radius. Radius is selected rather than diameter as both the rate of strain tensor and shear stresses are symmetric about the wake center. The scale parameter σ is obtained by substituting A and fitting Eq. (11) to the eddy viscosity curves for aligned turbines. The parameter σ represents a characteristic distance of where the wakes achieve a fully developed far-wake state. Substituting for A and σ into Eq. (11) produces
where and σ=5.5. A constant offset of 0.01 is added to prevent immediately behind the rotor and far downstream as this would imply wake diffusion is absent. This scaling nondimensionalizes eddy viscosity from each data set and demonstrates agreement across the range of turbine sizes in Fig. 6.
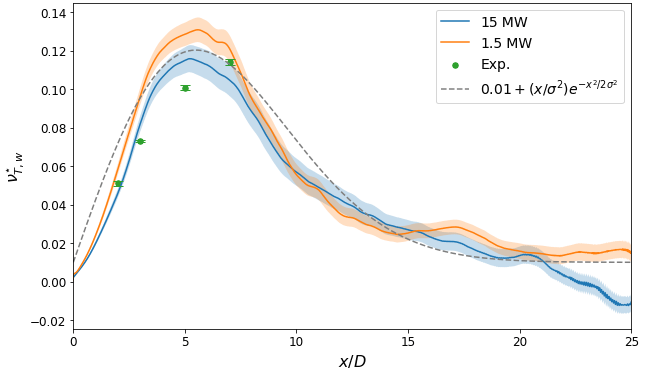
Figure 6Scaled streamwise wake eddy viscosity for aligned turbine cases with fit error and the proposed model Eq. (15). Note that experimental measurements only extend to 7 D downstream so long as wake recovery is exclusively from simulated data. Curves are depicted for SOWFA-6 LES cases as the streamwise resolution is sufficiently high.

Figure 7Scaled streamwise wake eddy viscosities for 15 MW (a), 1.5 MW (b), and scaled model turbine (c) cases. Nacelle misalignment reduces peak eddy viscosity by modifying wake recovery. Large misalignment angles produce weak wakes with strong counter-rotating vortex pairs and low-peak eddy viscosities. Note that experimental data are only available to 7 D downstream and yawed cases contain two measurements at and .
4.2 Eddy viscosity of misaligned turbines
The impact of nacelle misalignment on eddy viscosity is presented in Fig. 7. Despite the presence of the counter-rotating vortex pair, the streamwise evolution of eddy viscosity is consistent with earlier trends. However, introducing wake deflection reduces the peak viscosity magnitude as the momentum deficit from a misaligned turbine is lower than that of a turbine operating in nominal conditions. Additionally, the formation of the counter-rotating vortex pair downstream of a misaligned turbine serves to deform and deflect the wake accelerating its recovery and lowering νT(x). This is particularly the case for 20∘ tilt with the 15 MW reference turbine since the large deflection angle and turbine aspect ratio combine to drive the wake into the ground where it experiences rapid dissipation.
In the proposed formulation, nacelle misalignment is accounted for by varying the thrust coefficient. Yet this parameter alone is insufficient to capture the dynamics of the curled wake as evidenced by the departure of the eddy viscosity curves for yawed and tilted turbines from the unmodified case. While the normal velocity imparted by the counter-rotating vortex pair increases , this term remains at least 2 orders of magnitude below and as such has a negligible effect on eddy viscosity. The primary drivers are variations in Reynolds shear stress and surface interactions with the ground resulting from wake deflection. Under yaw misalignment, the wake experiences asymmetric growth as momentum is entrained into the wake center by the counter-rotating vortex pair (Howland et al., 2016; Bastankhah and Porté-Agel, 2016; Scott et al., 2020; Bossuyt et al., 2021). Asymmetric expansion forces the lower portion of the wake close to the ground where it experiences additional strain leading to heightened Reynolds shear stresses. Ground interactions are inherent to tilt misalignment as this approach directs the wake either up into the boundary layer where it is advected by the mean flow or into the ground (Fleming et al., 2014; Annoni et al., 2017; Scott et al., 2020; Bossuyt et al., 2021). The extent of additional strain from surface interactions depends on the wake expansion rate, nacelle deflection angle, height of the bottom tip above the ground, and local surface characteristics. Describing this interaction is beyond the scope of the present work, although such a study is well warranted.
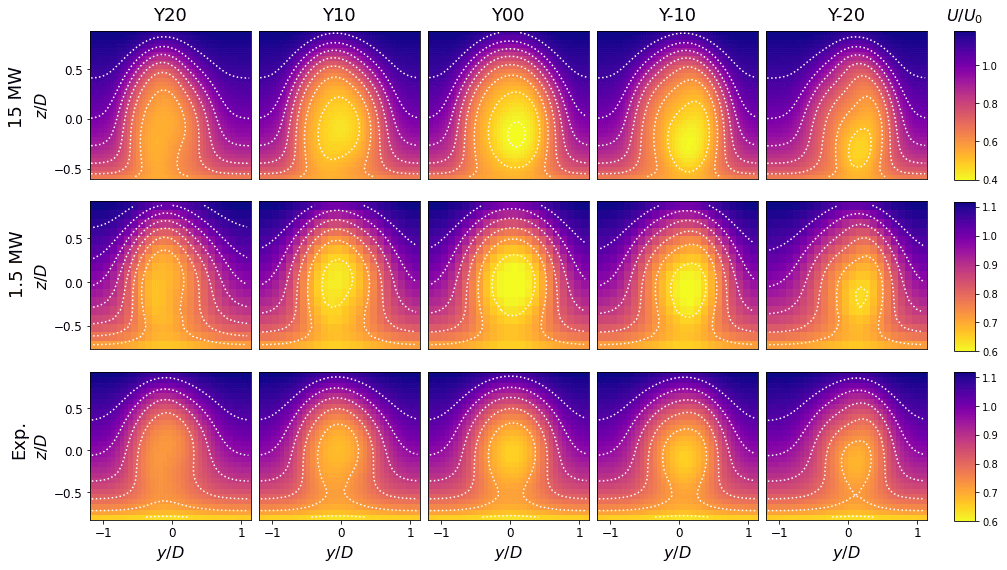
Figure 8FLORIS streamwise flow fields across yaw angles at for 15 MW (top panels), 1.5 MW (middle panels), and scaled model turbine (bottom panels) inputs. Wake deformation is visible for yawed cases since the curled wake model includes the counter-rotating vortex pair.
4.3 Model implementation
The proposed model Eq. (15) is incorporated within the FLORIS curled wake formulation to assess the effectiveness of including a high-fidelity eddy viscosity representation in wake modeling applications. For the experimental comparison, the boundary layer height in FLORIS was reduced to match the wind tunnel layer height described by Bossuyt et al. (2021). Streamwise flow fields were computed for each turbine type, misalignment angle, and inflow velocity. Contours of streamwise velocity in y–z planes of each case are presented at in Fig. 8 (yaw) and Fig. 9 (tilt). Quantitative comparisons are computed as error between flow field estimates and the corresponding experimental or simulation data with
where ℓ2 is the Euclidean norm, Ux is the measured or simulated streamwise flow field at a given downstream location x, and Ux,F is the flow field estimate at x. Error using the proposed model is presented for each case in Fig. 10.
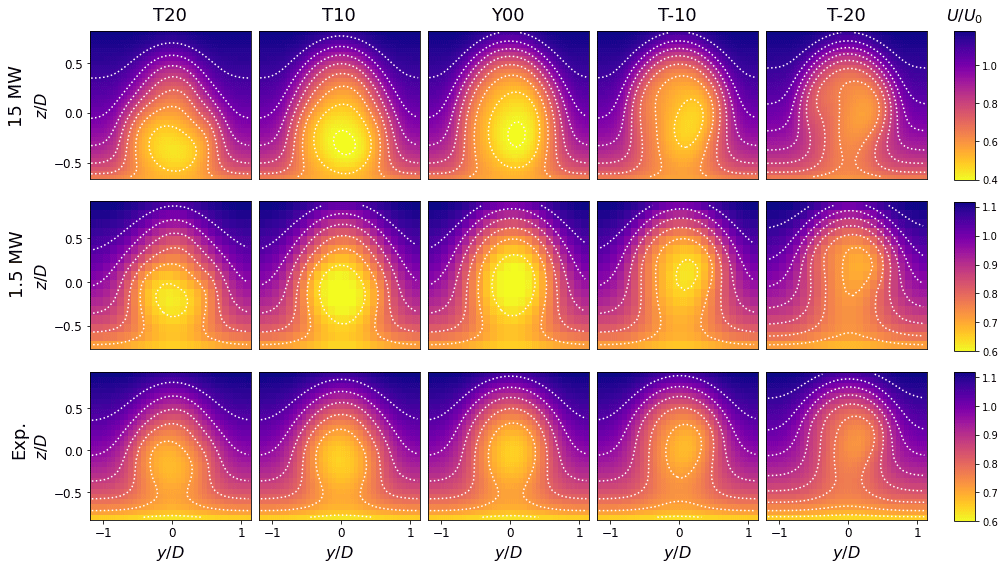
Figure 9FLORIS streamwise flow fields across tilt angles at for 15 MW (top panels), 1.5 MW (middle panels), and scaled model turbine (bottom panels) inputs. The curled wake model captures the effects of tilt misalignment with asymmetric wake deformation observed across turbine sizes.
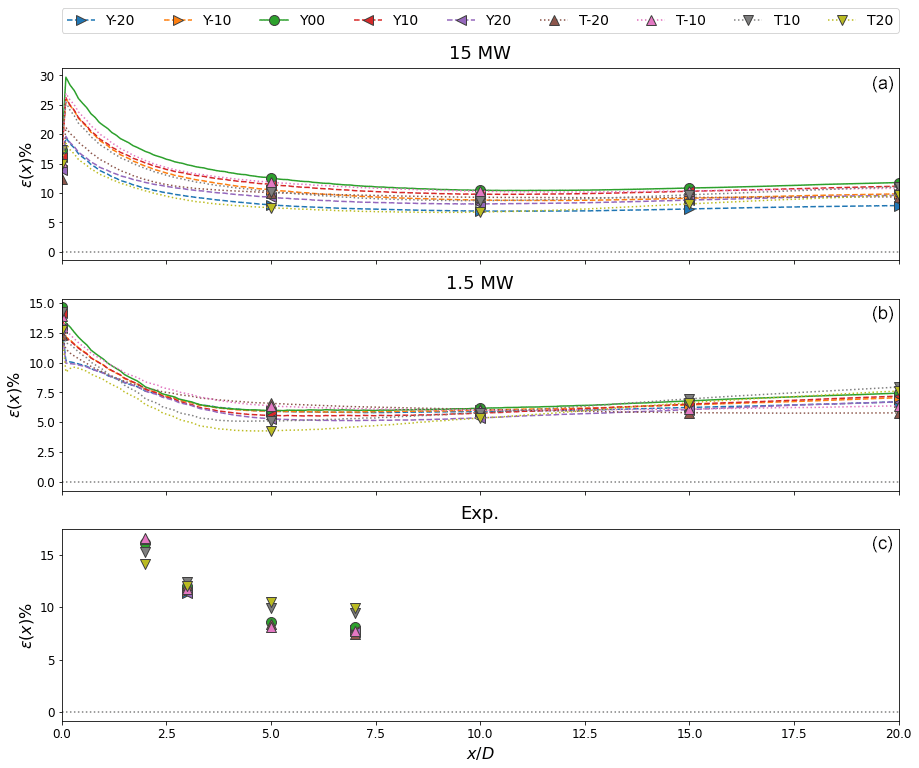
Figure 10FLORIS streamwise flow field error from the proposed model for 15 MW (a), 1.5 MW (b), and scaled model turbine (c) inputs. Error is greatest in the near wake as FLORIS is not designed to represent near-wake phenomena. Flow field error decreases downstream of the turbine reaching a minimum near . In the far wake, error increases from overpredicting the wake velocity deficit.
Maximum error occurs immediately downstream of the turbine as FLORIS is not designed to represent near-wake phenomena. Non-zero error is expected from comparing a wake modeling utility with experimental or LES data. Additionally, because the curled wake model uses a mirror condition at the ground to satisfy no-slip, estimated flow fields have a steeper boundary layer profile than the reference data. Aligned turbine cases produce the greatest errors since the proposed model overpredicts near-wake diffusion. Similarly, low misalignment angles are similar to typical turbine operation and the proposed model underestimates the velocity deficit for these cases as well. Overall, flow field error decreases with distance behind the turbine and reaches a minimum by . However, beyond error increases since the proposed model limits turbulent stress formation and thus wake diffusion. Error increases the fastest under positive tilt deflection since wakes in this scenario are deflected into the ground.
4.4 Model comparison
Comparisons between the proposed model and existing formulation are considered to evaluate the impact of increasing eddy viscosity fidelity in the curled wake model. Contours of streamwise velocity in y–z planes are presented in Figs. 13–15. Flow field error is computed for the current formulation following Eq. (16) and shown in Fig. 11. Relative error between flow field estimates is presented in Fig. 12 and calculated with
where ℓ2 is the Euclidean norm, Ux is the measured or simulated streamwise flow field at a given downstream location x, is the flow field estimate computed with the existing formulation, and is the flow field estimate computed with the proposed model.
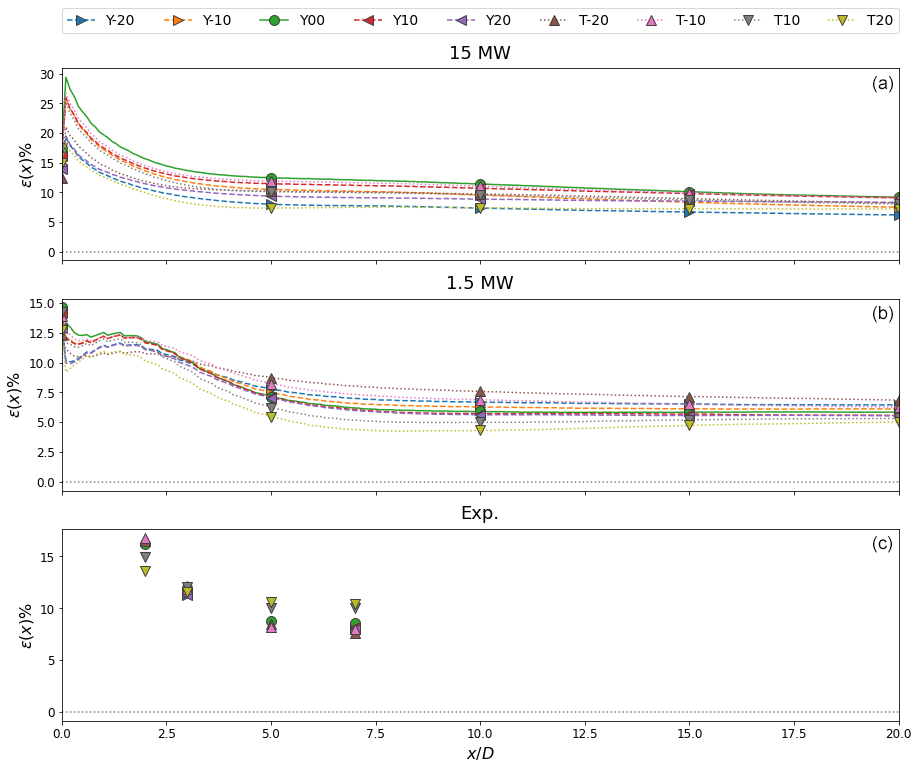
Figure 11FLORIS streamwise flow field error using the existing formulation for the 15 MW (a), 1.5 MW (b), and scaled model turbine (c) inputs. Maximum error is present directly behind the turbine with a secondary peak near for the 1.5 MW cases. Error decreases with distance downstream for all cases except positive tilt angles which attain a local minima near .
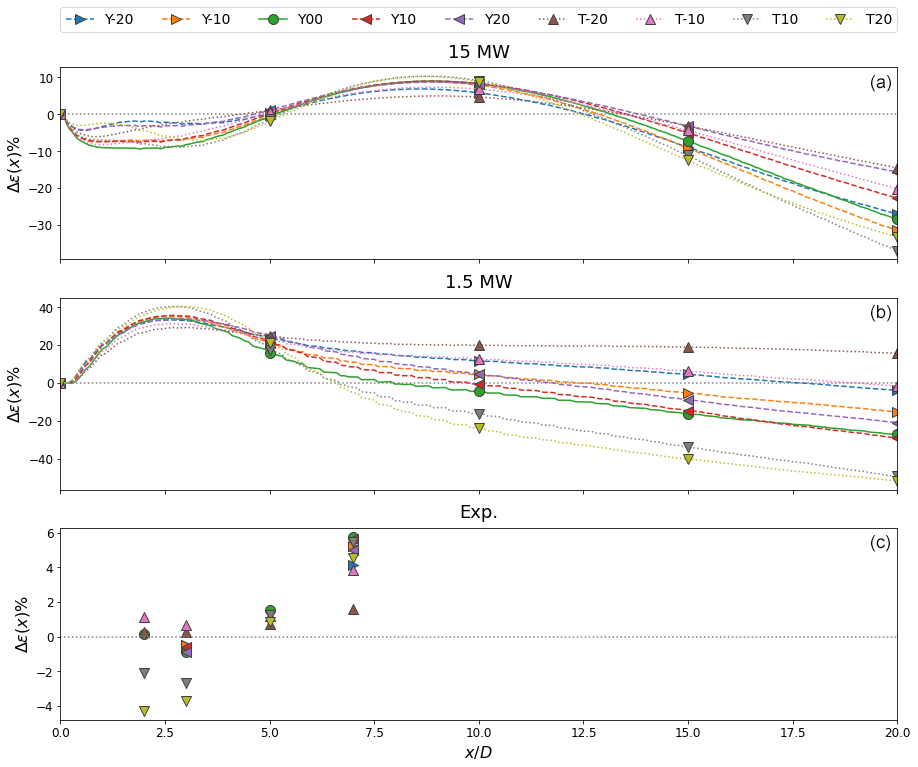
Figure 12Relative error between eddy viscosity formulations for the 15 MW (a), 1.5 MW (b), and scaled model turbine (c) cases. Positive values indicate regions where the proposed model reduces flow field error relative to the proposed formulation while negative values show areas where the proposed model introduces additional error.
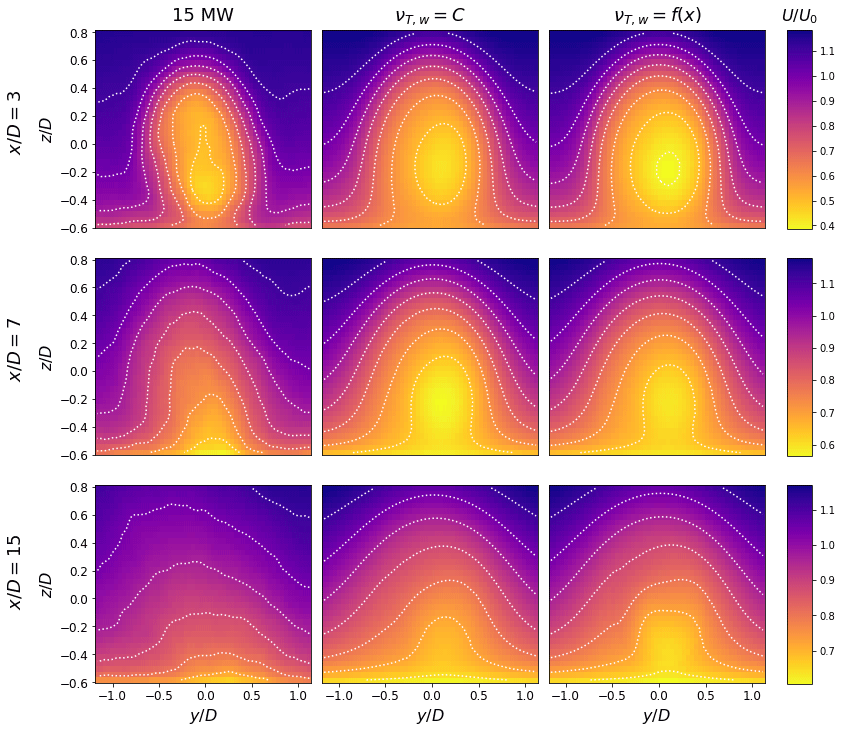
Figure 13Contours of streamwise velocity in y–z planes for the aligned 15 MW turbine. Both formulations capture the near-wake profile but overpredict the far-wake velocity deficit.
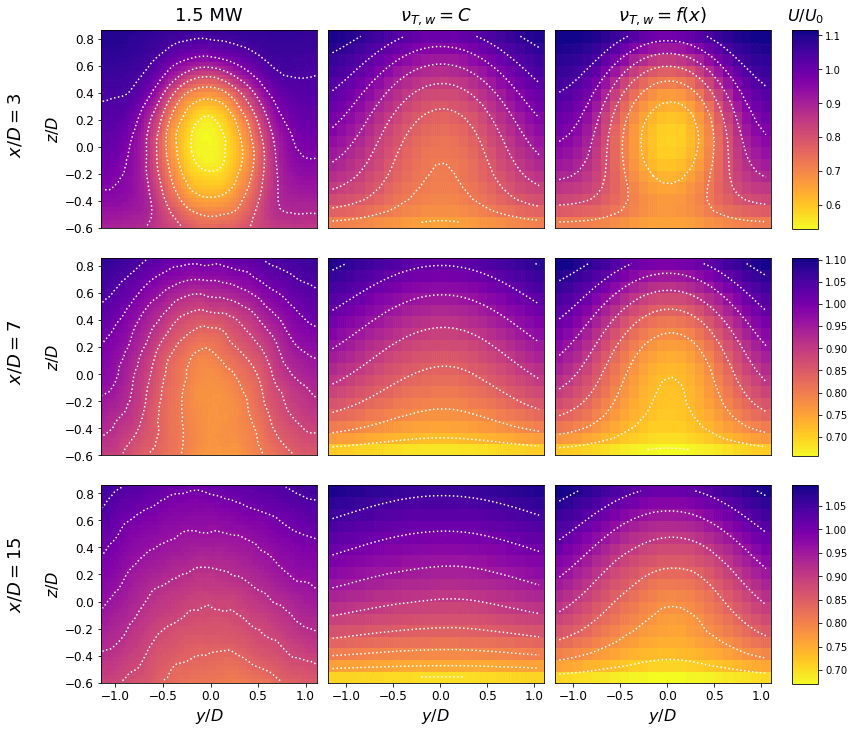
Figure 14Contours of streamwise velocity in y–z planes for the aligned 1.5 MW turbine. The proposed model replicates the near-wake velocity deficit as well as the far-wake profile, while the current formulation underpredicts at all downstream locations. The velocity gradient introduced by the mirror condition in the curled wake model is visible at and .
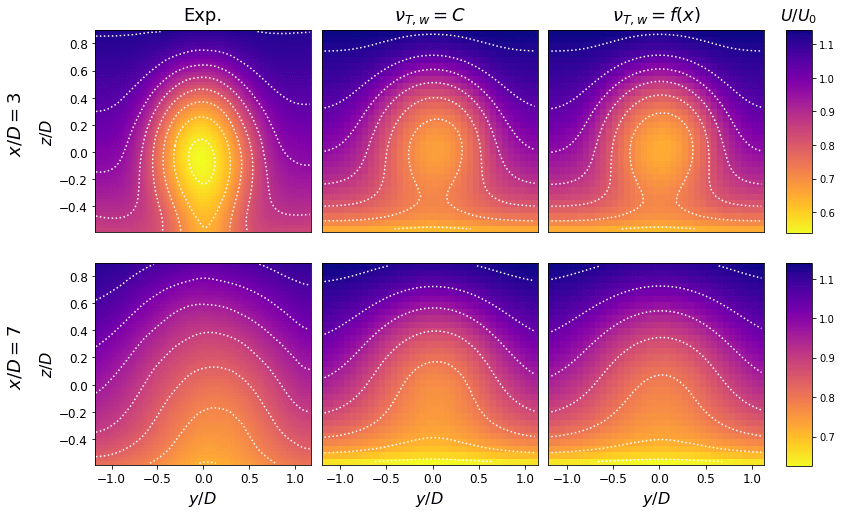
Figure 15Contours of streamwise velocity in y–z planes for the aligned scaled model turbine. Here both formulations miss the near-wake velocity deficit but recreate the velocity profile at . Despite scaling the boundary layer height in FLORIS, the gradient produced by the mirror condition in the curled wake model is visible at .
Error peaks immediately downstream of the turbine with a secondary peak visible near for the 1.5 MW cases. As noted previously, such errors are expected as FLORIS is not designed to model near-wake phenomena. The presence of a secondary peak for the 1.5 MW turbine implies the assigned eddy viscosity value and thus near-wake diffusion is too high. There is not a clear trend between nacelle misalignment and error with the current approach. Because the existing formulation maintains a constant eddy viscosity, error is relative to how well the prescribed value represents wake diffusion for a given turbine. For the 15 MW cases, the aligned turbine produces the greatest error, while for the 1.5 MW cases, positive tilt deflection results in greater error. Flow field error decreases with distance behind the turbine for all cases except positive tilt deflection, which results in increased wake diffusion by directing the wake into the ground.
Qualitatively, the proposed model captures the wake shape and velocity deficit as shown in Figs. 13–15. However, both formulations overpredict the far-wake velocity deficit for the 15 MW turbine with a lingering momentum deficit visible in Fig. 13. Despite its large velocity deficit, the 15 MW turbine has low ground clearance such that the wake experiences shear from the ground and dissipates within a relatively short distance. Consequently, the total error for the 15 MW cases is large compared to the relative error between eddy viscosity formulations. Further downstream, the impact of the curled wake mirror condition is apparent with a region of low velocity extending up from the ground into the wake flow. Since the boundary layer profile is assigned by the curled wake model, this region is present in all flow field estimates.
The proposed model outperforms the existing formulation for the majority of cases. Although relative error is inconsistent in the near wake, our model reduces net error for . Because the proposed model limits Reynolds stress production, and thus wake diffusion, it is less accurate far downstream of the turbine due to overpredicting the wake velocity deficit. While nacelle misalignment is not accounted for in either formulation outside of the thrust coefficient, the proposed model produces less error for negative tilt misalignment at all downstream locations. Under these circumstances, the wake is deflected into the boundary layer and advected downstream rather than deformed. As such, it maintains a coherent structure and lingering velocity deficit which the proposed model reproduces. The improvement in flow field prediction for these cases is attributed to better representation of Reynolds stress formation and is not assumed to convey additional fidelity in modeling the impact of the counter-rotating vortex pair on wake recovery. The notable exception is for positive tilt angles where the wake is directed into the ground. As discussed previously, the proposed model overpredicts the wake velocity deficit leading to comparatively large errors.
We presented the streamwise evolution of eddy viscosity in the wake of a wind turbine for various turbine types in a neutral boundary layer. Eddy viscosities were obtained from a linear correlation between the rate of strain and turbulent stress tensors in the wake. Wake flow was isolated from the background by subtracting the inflow profile. Eddy viscosities were then nondimensionalized through scale analysis which produced satisfactory agreement between data sets.
In the near wake, eddy viscosity depends on mean flow gradients and is governed by the rate of strain tensor. Immediately behind the rotor, the velocity deficit is at its maximum and recovers in the near wake as momentum is entrained from the surrounding flow. The strain induced by near-wake momentum recovery is responsible for the initial increase in eddy viscosity. Turbulent shear stresses, however, take time to form, which provides eddy viscosity with consistent growth as turbulence is produced in the wake. Here, eddy viscosity is driven by the interplay between the remaining rate of strain tensor and Reynolds shear stress formation. In the far wake, eddy viscosity mimics turbulent decay as the wake dissipates. Reduced eddy viscosities were observed for deflected wakes as misaligned turbines extract less power from the inflow. The formation of the counter-rotating vortex pair was linked to asymmetric wake expansion which in turn produced complex surface interactions between the wake flow and ground. Wake deformation from the counter-rotating vortex pair and the ground invalidate the requirement of a symmetric turbulent stress distribution needed to apply the eddy viscosity hypothesis. As a consequence, further work is needed to characterize the far-wake recovery of misaligned turbines.
A model for the streamwise evolution of eddy viscosity was proposed based on a Rayleigh probability density function. The model was incorporated into the FLORIS curled wake model and compared to the existing eddy viscosity formulation. The proposed model outperformed the existing approach with a net improvement in estimating experimental and LES flow fields. The model performed best for cases where the wake maintained a coherent structure and velocity deficit far downstream. However, our model underestimated the initial velocity deficit and far-wake recovery. Because the model limits eddy viscosity in the far wake, turbulent stress formation and thus diffusion are constrained leading to higher-velocity deficits in the far wake. While an empirical modification to the underlying Rayleigh function is possible, a more robust description of far-wake recovery is needed to address this shortcoming.
Our model improves upon current formulations by capturing the streamwise evolution of eddy viscosity. This approach reduces net error in flow field estimation when incorporated into the FLORIS curled wake model. Representing the exchange between rate of strain and Reynolds stresses increases wake modeling fidelity and will allow hybrid wake modeling utilities to better-predict wake recovery in wind plant settings. Further parameterization to include multiple turbulence intensities, turbine thrust coefficients, and atmospheric stabilities would ensure the proposed model performs across settings. Additionally, future work can resolve the discrepancies reported for nacelle misalignment. Describing surface interactions in terms of turbine operating parameters and roughness height is one promising avenue for further refinement. Detailing the streamwise-lateral rate of strain and shear stress response to yaw, veer, and Coriolis forces is another potential avenue for improving upon the proposed model. We anticipate future developments in this area will lead to improved predictions of wind plant performance and enable the design of more efficient wind plants.
Interested parties may contact the corresponding author regarding code and data accessibility.
RS drafted the manuscript; LMT, NH, and RBC edited; JB performed the experimental data collection; RS, LMT, and NH performed the LES; RS, LMT, NH, and RBC contributed to the model development; RS and LMT implemented the model in FLORIS; LMT, NH, and RBC advised.
At least one of the (co-)authors is a member of the editorial board of Wind Energy Science. The peer-review process was guided by an independent editor, and the authors also have no other competing interests to declare.
Publisher's note: Copernicus Publications remains neutral with regard to jurisdictional claims in published maps and institutional affiliations.
The authors would like to thank Charles Meneveau for his insights on the theoretical portion of the work.
This work was authored in part by the National Renewable Energy Laboratory, operated by Alliance for Sustainable Energy, LLC, for the US Department of Energy (DOE) under contract no. DE-AC36-08GO28308. Funding was provided by the Department of Energy Office of Energy Efficiency and Renewable Energy Wind Energy Technologies Office. The views expressed in the article do not necessarily represent the views of the DOE or the US Government. The US Government retains and the publisher, by accepting the article for publication, acknowledges that the US Government retains a nonexclusive, paid-up, irrevocable, worldwide license to publish or reproduce the published form of this work, or allow others to do so, for US Government purposes.
A portion of the research was performed using computational resources sponsored by the Department of Energy's Office of Energy Efficiency and Renewable Energy located at the National Renewable Energy Laboratory.
This research has been supported by the Alliance for Sustainable Energy, LLC, for the US Department of Energy (DOE) under contract no. DE-AC36-08GO28308. Funding was provided by the Department of Energy Office of Energy Efficiency and Renewable Energy Wind Energy Technologies Office.
This paper was edited by Jens Nørkær Sørensen and reviewed by Paul van der Laan and one anonymous referee.
Annoni, J., Scholbrock, A., Churchfield, M., and Fleming, P.: Evaluating tilt for wind plants, in: IEEE 2017 American Control Conference (ACC), 24–26 May 2017, Seattle, WA, USA, 717–722, https://doi.org/10.23919/ACC.2017.7963037, 2017. a
Bai, K., Meneveau, C., and Katz, J.: Near-wake turbulent flow structure and mixing length downstream of a fractal tree, Bound.-Lay. Meteorol., 143, 285–308, 2012. a
Bastankhah, M. and Porté-Agel, F.: Experimental and theoretical study of wind turbine wakes in yawed conditions, J. Fluid Mech., 806, 506–541, 2016. a, b, c
Bastankhah, M., Welch, B. L., Martínez-Tossas, L. A., King, J., and Fleming, P.: Analytical solution for the cumulative wake of wind turbines in wind farms, J. Fluid Mech., 911, A53, https://doi.org/10.1017/jfm.2020.1037, 2021. a, b
Bastankhah, M., Shapiro, C. R., Shamsoddin, S., Gayme, D. F., and Meneveau, C.: A vortex sheet based analytical model of the curled wake behind yawed wind turbines, J. Fluid Mech., 933, A2, https://doi.org/10.1017/jfm.2021.1010, 2022. a, b
Baungaard, M., Wallin, S., van der Laan, M. P., and Kelly, M.: Wind turbine wake simulation with explicit algebraic Reynolds stress modeling, Wind Energ. Sci., 7, 1975–2002, https://doi.org/10.5194/wes-7-1975-2022, 2022. a
Bay, C. J., Fleming, P., Doekemeijer, B., King, J., Churchfield, M., and Mudafort, R.: Addressing deep array effects and impacts to wake steering with the cumulative-curl wake model, Wind Energ. Sci. Discuss. [preprint], https://doi.org/10.5194/wes-2022-17, in review, 2022. a
Bossuyt, J., Scott, R., Ali, N., and Cal, R. B.: Quantification of wake shape modulation and deflection for tilt and yaw misaligned wind turbines, J. Fluid Mech., 917, A3, https://doi.org/10.1017/jfm.2021.237, 2021. a, b, c, d, e, f
Cal, R. B., Lebrón, J., Castillo, L., Kang, H. S., and Meneveau, C.: Experimental study of the horizontally averaged flow structure in a model wind-turbine array boundary layer, J. Renew. Sustain. Energ., 2, 013106, https://doi.org/10.1063/1.3289735, 2010. a
Churchfield, M., Lee, S., Moriarty, P., Martinez, L., Leonardi, S., Vijayakumar, G., and Brasseur, J.: A large-eddy simulation of wind-plant aerodynamics, in: 50th AIAA aerospace sciences meeting including the new horizons forum and aerospace exposition, 9–12 January 2012, Houston, TX, USA, p. 537, https://doi.org/10.2514/6.2012-537, 2012. a, b
Fleming, P. A., Gebraad, P. M., Lee, S., van Wingerden, J.-W., Johnson, K., Churchfield, M., Michalakes, J., Spalart, P., and Moriarty, P.: Evaluating techniques for redirecting turbine wakes using SOWFA, Renew. Energy, 70, 211–218, 2014. a
Gaertner, E., Rinker, J., Sethuraman, L., Zahle, F., Anderson, B., Barter, G. E., Abbas, N. J., Meng, F., Bortolotti, P., Skrzypinski, W., Scott, G. N., Feil, R., Bredmose, H., Dykes, K., Shields, M., Allen, C., and Viselli, A.: IEA wind TCP task 37: definition of the IEA 15-megawatt offshore reference wind turbine, Tech. rep., NREL – National Renewable Energy Lab., Golden, CO, USA, https://doi.org/10.2172/1603478, 2020. a
Hamilton, N. and Cal, R. B.: Anisotropy of the Reynolds stress tensor in the wakes of wind turbine arrays in Cartesian arrangements with counter-rotating rotors, Phys. Fluids, 27, 015102, https://doi.org/10.1063/1.4903968, 2015. a
Hamilton, N., Bay, C. J., Fleming, P., King, J., and Martínez-Tossas, L. A.: Comparison of modular analytical wake models to the Lillgrund wind plant, J. Renew. Sustain. Energ., 12, 053311, https://doi.org/10.1063/5.0018695, 2020. a
Howland, M. F., Bossuyt, J., Martínez-Tossas, L. A., Meyers, J., and Meneveau, C.: Wake structure in actuator disk models of wind turbines in yaw under uniform inflow conditions, J. Renew. Sustain. Energ., 8, 043301, https://doi.org/10.1063/1.4955091, 2016. a, b
Kadum, H., Rockel, S., Hölling, M., Peinke, J., and Cal, R. B.: Wind turbine wake intermittency dependence on turbulence intensity and pitch motion, J. Renew. Sustain. Energ., 11, 053302, https://doi.org/10.1063/1.5097829, 2019. a
Kadum, H., Rockel, S., Viggiano, B., Dib, T., Hölling, M., Chevillard, L., and Cal, R. B.: Assessing intermittency characteristics via cumulant analysis of floating wind turbines wakes, J. Renew. Sustain. Energ., 13, 013302, https://doi.org/10.1063/5.0022699, 2021. a
Martínez-Tossas, L. A., Annoni, J., Fleming, P. A., and Churchfield, M. J.: The aerodynamics of the curled wake: a simplified model in view of flow control, Wind Energ. Sci., 4, 127–138, https://doi.org/10.5194/wes-4-127-2019, 2019. a, b, c, d
Martínez-Tossas, L. A., King, J., Quon, E., Bay, C. J., Mudafort, R., Hamilton, N., Howland, M. F., and Fleming, P. A.: The curled wake model: a three-dimensional and extremely fast steady-state wake solver for wind plant flows, Wind Energ. Sci., 6, 555–570, https://doi.org/10.5194/wes-6-555-2021, 2021. a, b, c
Meyers, J., Bottasso, C., Dykes, K., Fleming, P., Gebraad, P., Giebel, G., Göçmen, T., and van Wingerden, J.-W.: Wind farm flow control: prospects and challenges, Wind Energ. Sci., 7, 2271–2306, https://doi.org/10.5194/wes-7-2271-2022, 2022. a, b
NREL: FLORIS, Version 3.1, GitHub [code], https://github.com/NREL/floris (last access: 28 March 2023), 2022a. a
NREL: OpenFast, Version 3.1, GitHub [code], https://github.com/OpenFAST/openfast (last access: 28 March 2023), 2022b. a
NREL: SOWFA, Version 6.0, GitHub [code], https://github.com/NREL/SOWFA-6 (last access: 28 March 2023), 2022c. a
Porté-Agel, F., Bastankhah, M., and Shamsoddin, S.: Wind-turbine and wind-farm flows: a review, Bound.-Lay. Meteorol., 174, 1–59, 2020. a, b
Rockel, S., Camp, E., Schmidt, J., Peinke, J., Cal, R. B., and Hölling, M.: Experimental study on influence of pitch motion on the wake of a floating wind turbine model, Energies, 7, 1954–1985, 2014. a
Rockel, S., Peinke, J., Hölling, M., and Cal, R. B.: Wake to wake interaction of floating wind turbine models in free pitch motion: An eddy viscosity and mixing length approach, Renew. Energy, 85, 666–676, 2016. a, b
Schmelzer, M., Dwight, R. P., and Cinnella, P.: Discovery of algebraic Reynolds-stress models using sparse symbolic regression, Flow Turbul. Combust., 104, 579–603, 2020. a
Scott, R., Bossuyt, J., and Cal, R. B.: Characterizing tilt effects on wind plants, J. Renew. Sustain. Energ., 12, 043302, https://doi.org/10.1063/5.0009853, 2020. a, b, c, d
Shapiro, C. R., Gayme, D. F., and Meneveau, C.: Generation and decay of counter-rotating vortices downstream of yawed wind turbines in the atmospheric boundary layer, J. Fluid Mech., 903, R2, https://doi.org/10.1017/jfm.2020.717, 2020. a
van der Laan, M. and Andersen, S.: The turbulence scales of a wind turbine wake: A revisit of extended k–ϵ models, J. Phys.: Conf. Ser., 1037, 072001, https://doi.org/10.1088/1742-6596/1037/7/072001, 2018. a
van der Laan, M. P., Sørensen, N. N., Réthoré, P.-E., Mann, J., Kelly, M. C., Troldborg, N., Schepers, J. G., and Machefaux, E.: An improved k–ϵ model applied to a wind turbine wake in atmospheric turbulence, Wind Energy, 18, 889–907, 2015. a
van der Laan, M. P., Baungaard, M., and Kelly, M.: Brief communication: A clarification of wake recovery mechanisms, Wind Energ. Sci., 8, 247–254, https://doi.org/10.5194/wes-8-247-2023, 2023. a
Veers, P., Bottasso, C., Manuel, L., Naughton, J., Pao, L., Paquette, J., Robertson, A., Robinson, M., Ananthan, S., Barlas, A., Bianchini, A., Bredmose, H., Horcas, S. G., Keller, J., Madsen, H. A., Manwell, J., Moriarty, P., Nolet, S., and Rinker, J.: Grand Challenges in the Design, Manufacture, and Operation of Future Wind Turbine Systems, Wind Energ. Sci. Discuss. [preprint], https://doi.org/10.5194/wes-2022-32, in review, 2022. a
Zong, H. and Porté-Agel, F.: A point vortex transportation model for yawed wind turbine wakes, J. Fluid Mech., 890, A8, https://doi.org/10.1017/jfm.2020.123, 2020. a