the Creative Commons Attribution 4.0 License.
the Creative Commons Attribution 4.0 License.
 | 14 Apr 2023
Anomaly-based fault detection in wind turbine main bearings
Lorena Campoverde-Vilela
María del Cisne Feijóo
José Sampietro
Christian Tutivén
Renewable energy is a clean and inexhaustible source of energy, so every year interest in the study and the search for improvements in production increases. Wind energy is one of the most used sources of energy, and therefore the need for predictive maintenance management to guarantee the reliability and operability of each of the wind turbines has become a great study opportunity. In this work, a fault detection system is developed by applying an anomaly detector based on principal component analysis (PCA), in order to state early warnings of possible faults in the main bearing. For the development of the model, SCADA data from a wind park in operation are utilized. The results obtained allow detection of failures even months before the fatal breakdown occurs. This model requires (to be constructed) only the use of healthy SCADA data, without the need to obtain the fault history or install additional equipment or sensors that require greater investment. In conclusion, this proposed strategy provides a tool for the planning and execution of predictive maintenance within wind parks.
- Article
(4402 KB) - Full-text XML
- BibTeX
- EndNote


High consumption of fossil fuels increases environmental pollution and increases the effects of climate change. For this reason, it is important to deepen the study and development of renewable energies to achieve a green energy economy (Baloch et al., 2022; May, 2017). Some authors, such as Yii and Geetha (2017) and Kang et al. (2020), focus their research on the fact that technological innovation reduces environmental degradation and reduces the effects of pollution. It can be seen from the documents of the International Energy Agency of 2019 that the amount of renewable energy as a supply of the OECD (Organisation for Economic Co-operation and Development) reached 10.8 % of its primary energy. Similarly, renewable energy is expected to provide one-third of total energy generation by 2035. This growth motivates the study and implementation of new technologies and algorithms for their development (Q. Wang et al., 2022).
One of the topics that has caught the interest of many researchers is the development of new technologies that allow for improved maintenance management in wind turbines (WTs), since a good maintenance strategy is the basis for supporting production with reliability, safety, environmental preservation, and adequate costs. In addition, it guarantees continuous operation and avoids economic losses due to emergency stops or equipment damage (Velmurugan and Dhingra, 2015).
According to May et al. (2015), operating and maintenance costs regularly represent 30 % of the total cost of industrial plants, so poor management or maintenance generates additional costs that can significantly affect their operation and economy. Currently, there are different maintenance strategies, such as corrective, preventive, predictive, and proactive (Bahar et al., 2021; Velmurugan and Dhingra, 2015). In general, wind parks use preventive and corrective maintenance; however, considering industrial environments, where stops can cause large losses (Hu and Chen, 2020), predictive maintenance is becoming a method of growing interest, especially with its new approach geared toward the use of industry 4.0 standards. This new technology has allowed integration between physical and digital systems, facilitating the collection of a large amount of data (Borgi et al., 2017).
Hand in hand with this technology, artificial intelligence (AI) is used, which is based on a set of machines that, through defined algorithms, develop tasks that would normally require the intelligence of a person (Jakhar and Kaur, 2020). In addition, AI techniques such as machine learning (ML) are applied, which is defined as computational procedures that with the help of input values allow a machine to simulate human intelligence by adapting and learning from its environment without being explicitly programmed to do so (El Naga and Murphy, 2015). Within this branch there are different learning models, including normality models that are trained only with normal data without failures, i.e., healthy data, which represents a relevant advantage over a supervised model, which is trained with a history of previously labeled data between healthy or damaged and thus learns to predict the output value (Kotsiantis et al., 2006).
Processing and analysis of the data allow for a better understanding of the behavior and dynamics of the system. Predictive maintenance allows you to take advantage of this information to intervene only when the machine really needs it, providing advantages such as reduced maintenance costs, emergency stops, inventory, and an increase in the useful life of spare parts and production efficiency, among others (Peres et al., 2018; Sezer et al., 2018).
Table 1 shows scientific investigations based on the detection of failures classified according to the principal component or system of the WT, such as the gearbox, the pitch system, and the yaw system, among others. Similarly, Table 2 shows the research based on fault detection but classified according to the monitoring method used.
Jiang et al. (2019)Zhang et al. (2012)Teng et al. (2016)Feng et al. (2014)Dameshghi and Refan (2019)Kim et al. (2011)Borchersen and Kinnaert (2016)Astolfi et al. (2019)Rezamand et al. (2020)Guo et al. (2021)Oliveira et al. (2020)Ou et al. (2017)Dervilis et al. (2014)Vidal et al. (2020)Nguyen et al. (2015, 2018)Motlagh et al. (2021)Natili et al. (2021)Encalada-Dávila et al. (2021)Hu et al. (2018)Fuentes et al. (2020)Zhang et al. (2022)Chen et al. (2020)Table 1Papers based on the detection of faults classified according to the main component or system of the WT.

Table 2Papers of investigations based on fault detection but classified according to the monitoring method used.

For WTs, one of the predominant systems is the supervisory control and data acquisition (SCADA) and condition monitoring (CM) system (Artiago et al., 2018; Leite et al., 2018). CM systems are born from the need to guarantee a more controlled and safe operation. Most of these systems available on the market for WTs are mainly based on vibration measurements, or in some works, such as T. Wang et al. (2019) and Hammed et al. (2009), external variables and tower oscillations are also analyzed. This system allows moving from preventive maintenance to predictive maintenance, which, based on the study of behavior, allows a deviation to be detected, warning of a possible failure in the machine. However, its use requires the installation of additional sensors, which allow the acquisition and analysis of new variables, which causes an increase in the costs of operation, maintenance, and complexity. Regarding SCADA data, they have approximately 200 stored variables, which are acquired with a sampling frequency of 1 Hz, but, in general, to optimize space and bandwidth, the variables are only recorded every 10 min, storing the mean, standard deviation, minimum, and maximum values of each variable. This information, added to the work order records, results in the generation of complete operation histories, faults, and alarms for each WT.
Recently, there has been lot of interest in the analysis of SCADA data because although the system was not developed for condition monitoring, the extraction of relevant information through data analysis and processing can become a great alternative that allows one to ensure reliability, maintaining the costs and complexity of the machine, in this case WT. However, it is necessary to consider relevant points when using this information, such as the fact that there is great variability in the data due to changes in environmental conditions such as wind speed and direction, ambient temperature, and turbulence, among others. Also, as explained above, in most cases the data are stored only in 10 min intervals, so there is a loss of information. At the same time, work order history and entry are not always standardized and are prone to human error. Some researchers have already started to use SCADA data for fault detection in WTs using different tools and methodologies. As, for example, in Dao et al. (2018), methodologies based on SCADA data cointegration analysis are presented for condition monitoring and fault diagnosis, using data obtained from a single WT with a nominal power of 2 MW under environmental and operating conditions. In Xiang et al. (2021) an early warning model for fault detection is proposed, using a convolutional neural network (CNN) and an attention mechanism (AM) based on a long short-term memory (LSTM) neural network, where SCADA data are used as input variables and build the CNN and LSTM architecture, and AM is applied to strengthen the impact of important information. Furthermore, with respect to studies on bearing failures in WT, in Zhang and Wang (2014), a bearing failure detection method based on existing SCADA data is proposed using an artificial neural network (ANN). Similarly, in Encalada-Dávila et al. (2022), a methodology is shown that detects main bearing failures using a gated recurrent unit (GRU) neural network.
Early detection of main bearing failures of wind turbines is crucial to guarantee the reliability of the element, as well as a safer and more efficient operation in wind farms. The main bearing is one of the most critical components in a WT, and a failure in it can cause significant damage to other components, such as the gearbox, generator, and blades, and result in downtime and expensive repairs; see Carrol et al. (2016). Early detection of main bearing failures enables predictive maintenance, giving maintenance crews time to plan and schedule repairs during low-wind periods, minimizing the impact on energy production. Bearing damage in wind turbines can occur in different locations, including the rings, raceways, rollers, and cages. The most common types of bearing damage are related to heat release, which can result from friction, wear, and cracks; see Harris and Kotzalas (2006). All of these damage modes can significantly impact the lifetime of the bearing, which in turn can cause significant downtime and maintenance costs. Early detection of bearing damage through monitoring and detection of heat release can allow for timely repairs and maintenance, minimizing the impact on the bearing and other components and reducing downtime and maintenance costs. The methodology proposed in this work aims to detect heat release in the bearings, allowing for early detection and diagnosis of potential bearing damage.
Although the topic of fault detection in main bearings of wind turbines has been the focus of numerous studies, as can be seen from the aforementioned references, in this paper a novel approach to this problem is presented based on principal component analysis (PCA) and data mining of only SCADA data. It should be emphasized that the stated methodology relies only on exogenous variables (ambient temperature and wind speed) and the temperature of the main bearing (internal variable most related to the target component, the main bearing), facilitating the isolation of the faults that influence that one internal variable. In addition, all variables used in the strategy are readily available in all industrial-size wind farms (both older and newer), making it a practical and cost-effective solution for early fault detection. Cost is a critical factor in the renewable energy industry, and wind turbines are no exception. While advanced sensors and machine learning methods can provide more accurate and comprehensive data on wind turbine health, they also come with a higher price tag. In contrast, the proposed approach aims to offer a more affordable solution that can be easily adopted by wind farms that lack condition monitoring systems. This approach may be particularly beneficial for older wind turbines that lack the built-in sensors and monitoring capabilities of newer models. By extending the operation of wind turbines close to their expected service lifetime, the proposed approach can help wind farms generate more electricity and revenue over time. This not only improves the profitability of the wind park, but also increases the overall efficiency of the renewable energy sector. The longer a wind turbine operates, the more energy it generates, and the more emissions it can help offset. Furthermore, the proposed approach could help reduce the environmental impact of the renewable energy industry. Manufacturing new wind turbines requires significant amounts of energy and resources, so extending the life of existing turbines can help to reduce the need for additional production, promoting a more sustainable and circular economy for wind energy.
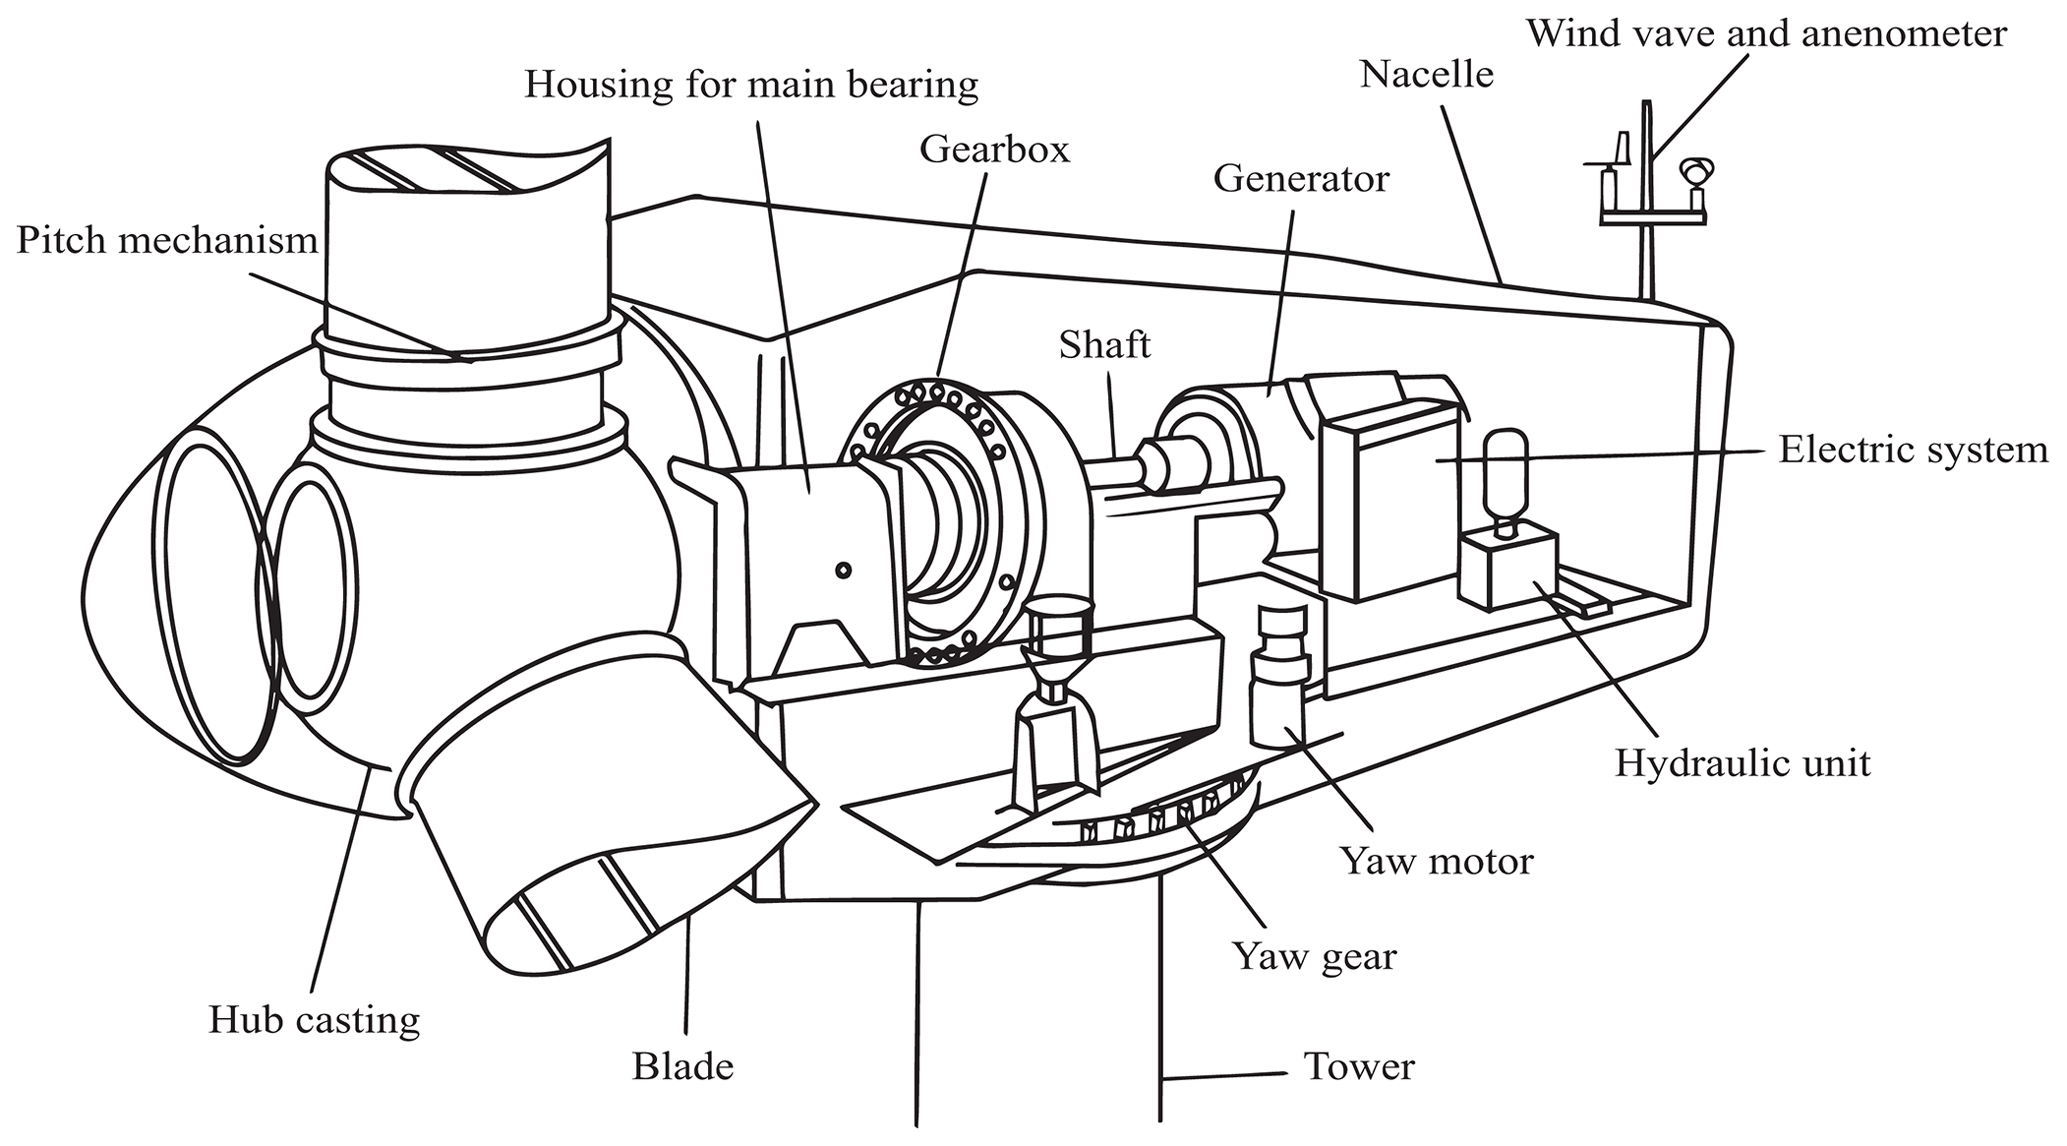
Figure 1Main components of WTs (Jiang et al., 2017).
The organization of this article is as follows. The general description of the wind park is described in Sect. 2. Section 3 presents the acquisition and analysis of the SCADA data used. In Sect. 4, the preprocessing of the data (data cleaning and variable selection) is presented. Then, in Sect. 5, the anomaly detection algorithm is shown. In Sect. 6, the indicators are analyzed, and the threshold value is defined. The results are presented and discussed in Sect. 7, and finally, in Sect. 8, the conclusions are detailed.
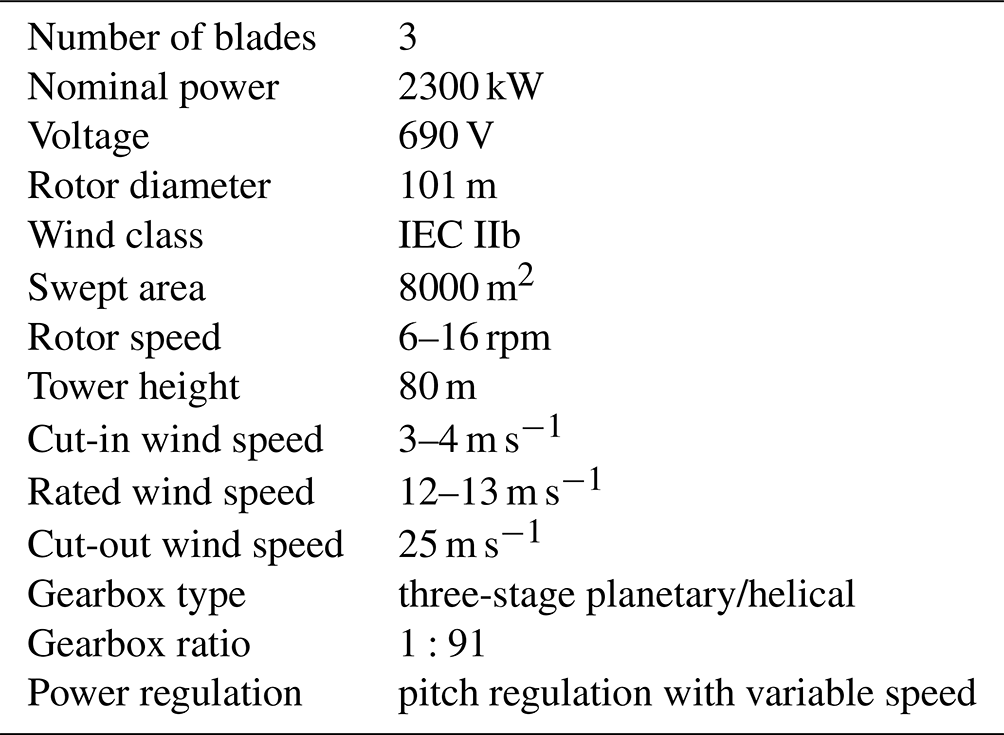
In this study, data are collected from a wind park composed of 18 WTs located in Poland. All WTs have the same characteristics, which are detailed in Table 3. Figure 1 shows the principal components of these WTs.
Table 3The main technological features of the type of WT in the wind park considered.
Technical details of the wind turbines under study are out of the scope for the analysis presented in this paper. However, it should be noted that wind turbine design and operation can impact the performance of fault detection methods. The book of Hansen (2015), on the aerodynamics of wind turbines, provides a comprehensive overview of wind turbine design and operation, including factors that can impact the accuracy of fault detection methods. Therefore, we encourage readers who are interested in the technical details of wind turbine design to refer to this resource.
Regarding the drivetrain configuration, three-point and four-point suspensions, which refer to one or two main bearings, respectively, are the most common wind turbine drivetrain architectures. In the three-point suspension configuration, which is the one used in the wind farm under study, the rotor is rigidly connected to the main shaft, which is supported by a single main bearing near the rotor. A shrink disk typically connects the downwind side of the shaft to the low-speed stage of the gearbox. The gearbox is supported by two torque arms that are connected to the bedplate elastically. These two torque arms, along with the single main bearing, provide a total of three points of support. Furthermore, there are different types of state-of-the-art main bearings, as fully explained in Wenske (2022). In particular, the turbines of this park are equipped with the so-called spherical-roller-bearing (SRB) type. SRBs are characterized by their outer raceways being a portion of a sphere. The rollers, in turn, are shaped so that they closely conform to the inner and outer raceways. This results in a bearing that is internally self-aligning and has a high radial load carrying capacity; please see Hart (2020) for a more detailed explanation.
Finally, each turbine is equipped with a SCADA system; thus, plant operators can get an overview of the entire wind park. The main features of the SCADA system are the following: use of the standard communication protocol OPC UA, standardized data structure according to IEC61400-25, alarm and data history, and online/offline trends. These SCADA-collected data are used in this work and are further explained in Sect. 3.
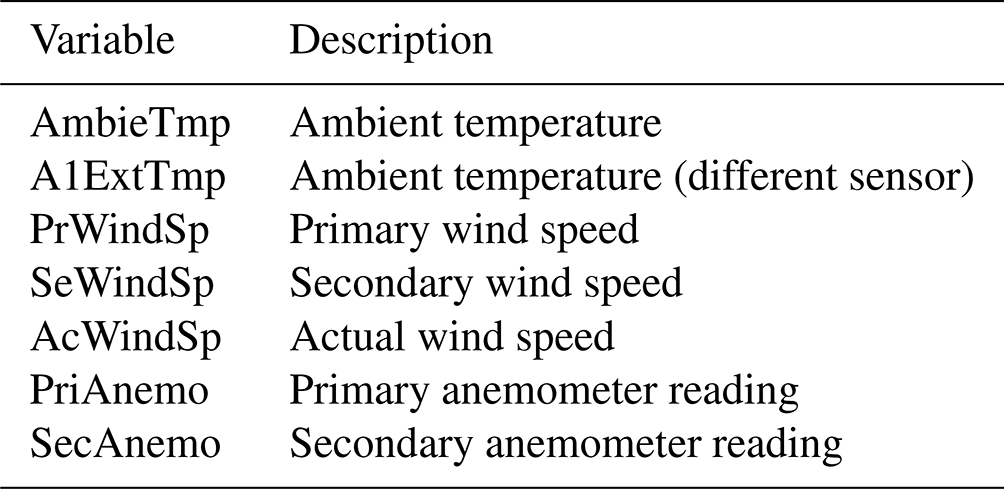
Wind Park SCADA data were recorded every 10 min from 1 January 2014 to 12 December 2019, obtaining the average, standard deviation, highest value, and lowest value of the data sampled from each variable. These variables can be divided into different groups: energy, hydraulic, climatic, control, and heat emanating from the elements (see Encalada-Dávila et al., 2021).
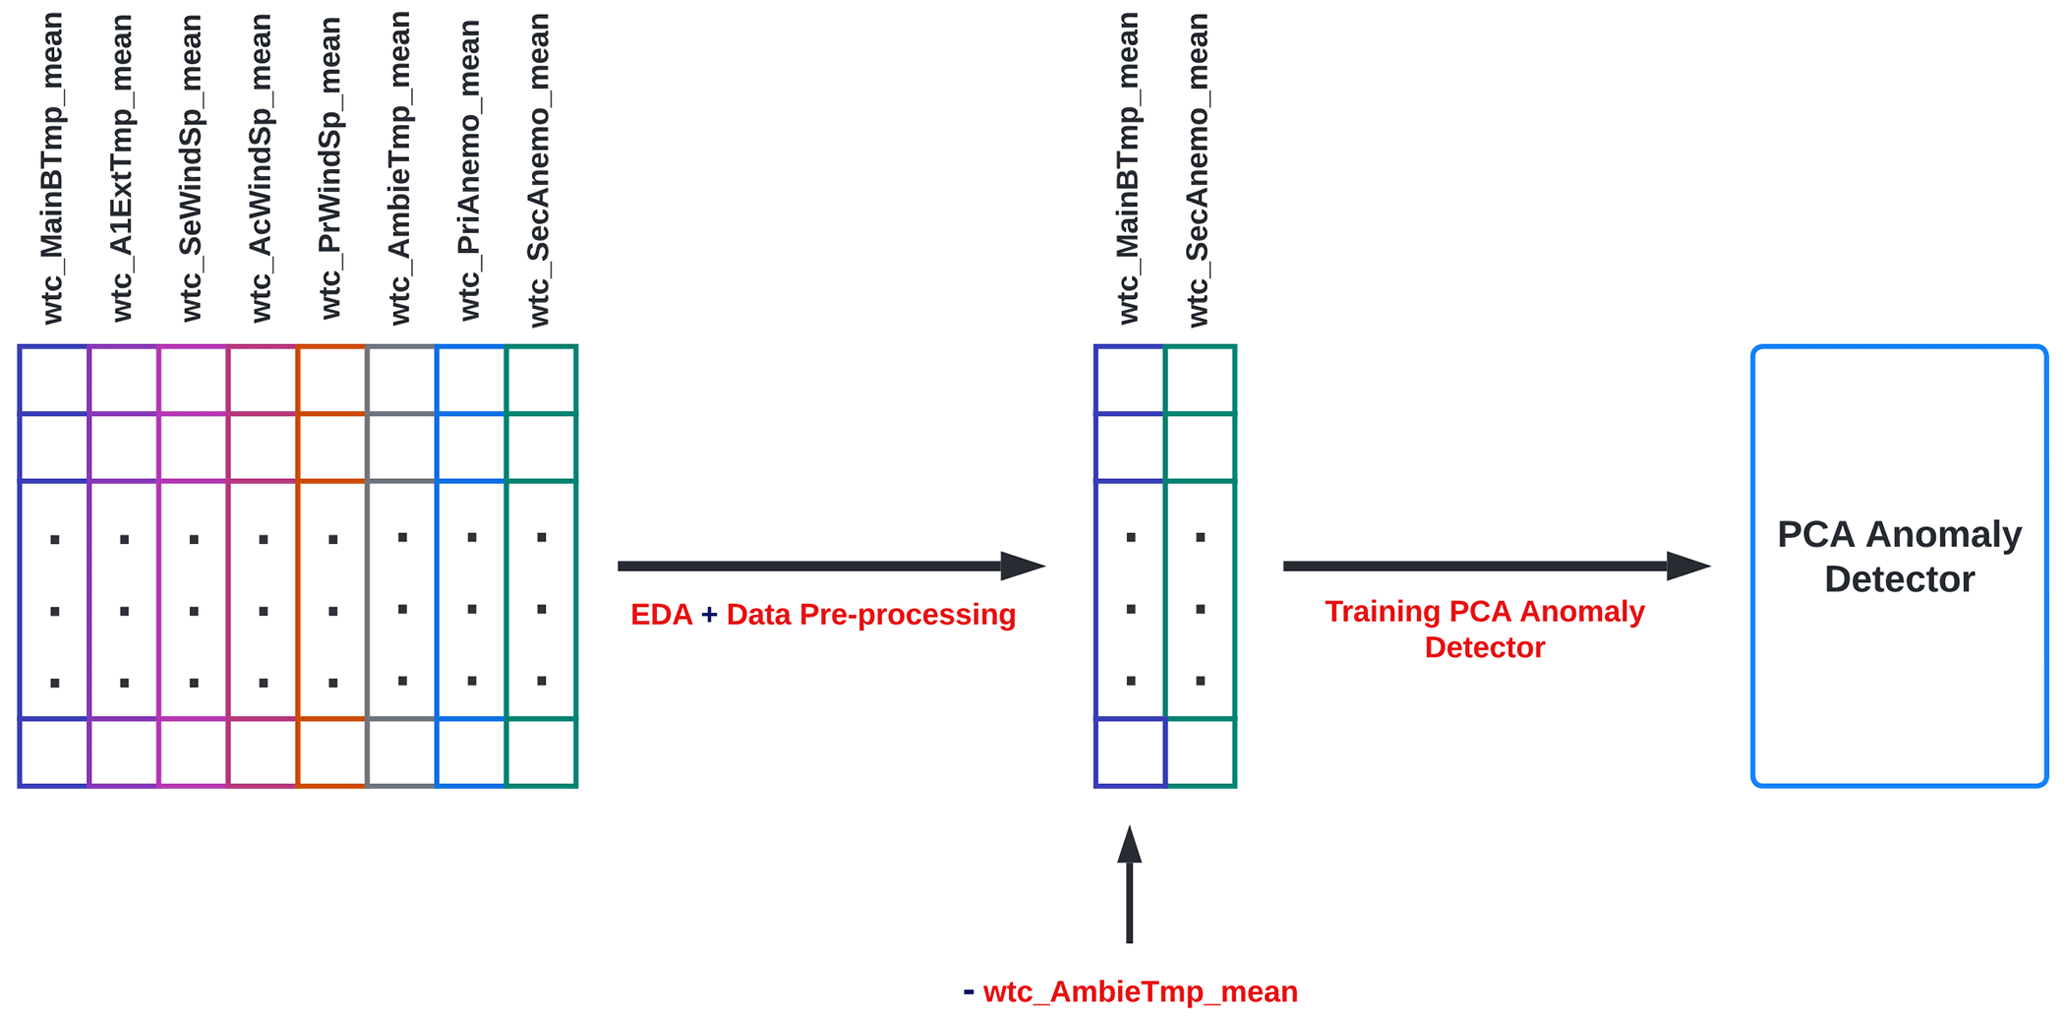
For the analysis and development of this work, it was decided to use only the mean of the external SCADA measurements (which can be broadly grouped into the so-called environmental variables; see Table 4) and the mean of the variable MainBTmp (low-speed shaft temperature), related to our failure of interest, with the objective that detection alerts are not affected by other types of failure other than the one under study. It is important to know that there is additional information (work orders) such as the maintenance and repair work carried out on each of the turbines, the dates on which they were carried out, and different references that help determine which elements were replaced or repaired. This information allows for the validation of the proposed methodology.
3.1 Data division
To avoid biases in the normality model to be developed, before analyzing the data and performing the data preprocessing, it is important to perform the data division.
The data division procedure is a crucial step in any deep learning model, as it has a very relevant effect on the whole process. To separate the data for this study, the training data are selected such that
-
the model is trained using only healthy data;
-
the model is trained using data from all operating regions of the WT – there is no selection of a specific region or conditions of operation, or specific year season; thus, the model is robust to all these variations.
As a result, a normality model is constructed that is tolerant to the various environmental and working conditions of WTs.
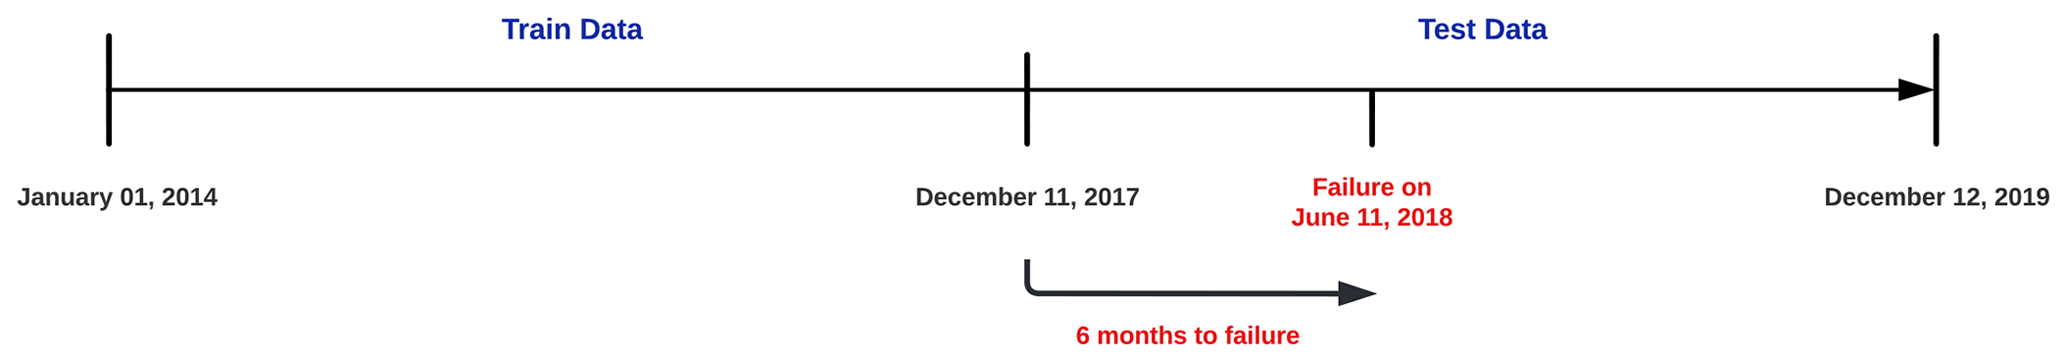
Based on the work orders, for this analysis, the selection of WT number 5 of the wind park (from now on denoted as “WT5”) is made, since it is known that in 2018 it suffered a failure of the main bearing, which is the failure of interest in this work.
For data division, it is taken into account that the main bearing failure occurs on 11 June 2018, and the model must be trained for at least 1 year to ensure that it is seasonally robust. Therefore, according to the conditions detailed above, the data used to train the model are selected from 1 January 2014 to 11 December 2017, while the test data are selected from 11 December 2017 to 12 December 2019, as shown in Fig. 2.

It is acknowledged that the availability of almost 3 years of data may not always be feasible. However, a data length of this magnitude was deemed necessary to fully capture the normal operating behavior of the main bearing and to establish a reliable baseline for fault detection. It was observed that when using 1 year of training data, the results were similar, but when the training data were reduced to only 6 months, the method was incapable of learning a normality model robust to all wind turbine operating scenarios; see Turnbull et al. (2022). Therefore, for the proposed approach, a minimum of 1 year of data is strongly recommended, and the methodology will significantly benefit from 2 or 3 years of available data.
Before performing the preprocessing of the data, the training data are explored to visualize the behavior of the different variables, as detailed in Sect. 3.2.
3.2 Exploratory data analysis
Exploratory data analysis (EDA) is a process of analyzing and understanding the input information and its structure, selecting relevant variables, cleaning outliers, etc. (Vanawat, 2021). That is, it seeks to explore the data and discover important information through statistical graphs or some other visualization method, ensuring the quality and efficiency of the subsequent analysis (Shin, 2020).
It should be noted that, in general, failure to perform an EDA on the study data set results in the development of inaccurate models due to data bias, which are missing or inconsistent values. Therefore, in this study, the EDA is based on understanding the behavior of each of the variables relevant to the study, taking into account that only training data are used. Figure 3 details the behavior of the eight selected variables, and the following deductions are obtained:
-
the plot of the MainBTmp variable shows seasonal variation as well as A1ExtTmp and AmbieTmp, indicating that the low-speed shaft temperature is altered by the environment temperature;
-
the graphs of the SeWindSp and SecAnemo variables show a very similar behavior – the same is observed for the variables AcWindSp and PrWindSp;
-
in general, all variables show an increase in variations in wind speed at the same stages, so the measurements could be affected by wind currents;
-
for the PriAnemo variable, it can be observed in its behavior that it is a staggered response, where from 2014 to the beginning of 2018 it remained at the value of 1.2 while the remainder remained at almost 0 – this variable can be interpreted as an on and off state, so it was decided to eliminate this variable, as it does not provide relevant information.
To correct for missing values, blanks, or outliers, preprocessing techniques must be used. For this reason, data preprocessing is proposed, which allows solving the problems mentioned above by converting them into quality data.
When working with SCADA data, there is the possibility that incomplete, inconsistent, unprocessed, or error-prone values may be present, so preprocessing is of great importance to ensure data quality through data cleaning and preparation (García and Luengo, 2015). In this study, data cleaning and variable selection preprocessing techniques are used and explained in detail in the next subsections.
4.1 Data cleaning
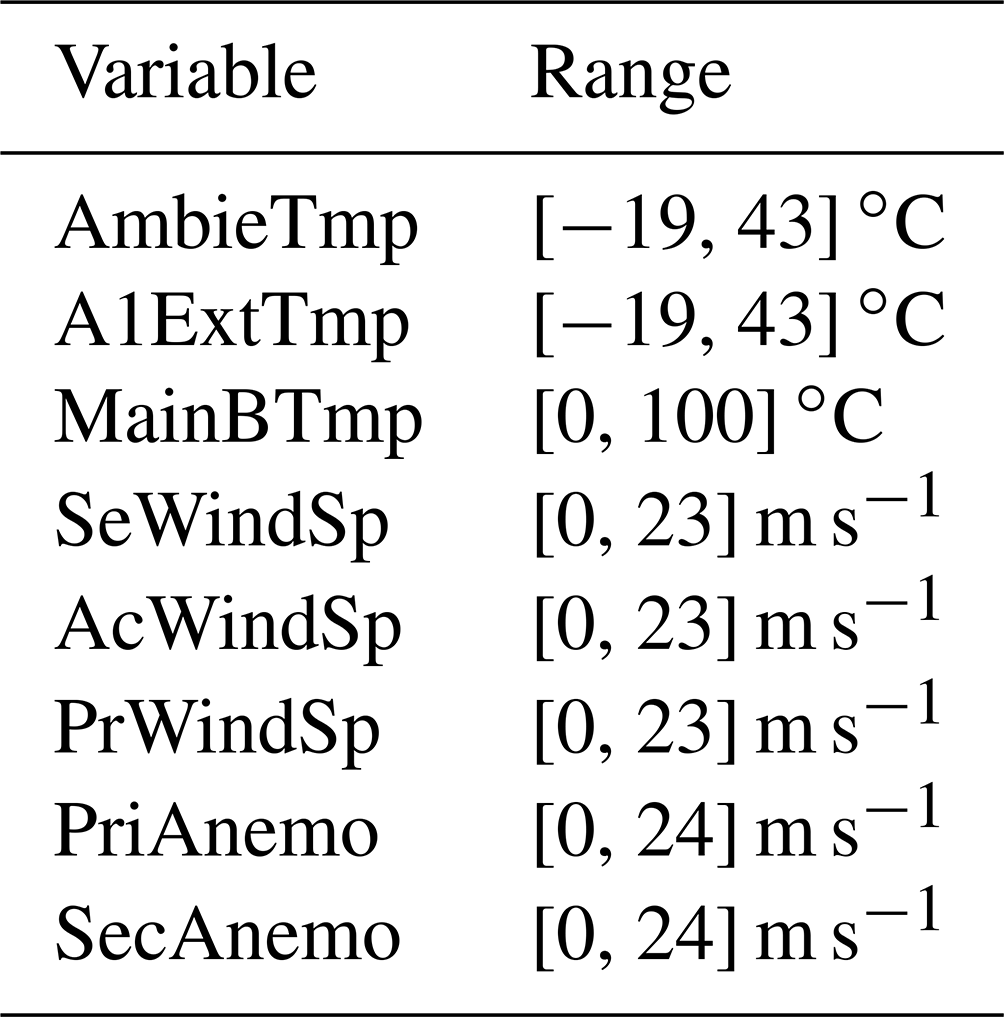
Data cleaning is based on the determination and correction of missing or atypical values, where data are treated to give coherence to the data set (Brownlee, 2020). Several forms of outlier identification are available. In our study, extreme values (outliers) were not systematically removed since doing so could lead to a loss of information related to fault detection, as stated in Encalada-Dávila et al. (2021). Instead, a strategy of defining ranges based on realistic values that can be obtained by different sensors was adopted. This approach, which allows potentially useful information to be retained while still addressing the issue of outliers, was chosen. To ensure appropriate definition of the ranges, non-restrictive criteria were used that were wide enough to encompass the majority of the observed data. By adopting this approach, it is almost ensured that the only outliers removed are those related to non-working sensors (not well calibrated or with faults) and/or due to problems with the communication of the data rather than outliers related to the underlying physical process being monitored. Table 5 shows the realistic possible values for each of the selected variables. All detected outliers are converted to missing values and subsequently filled with realistic values, preventing data waste and without introducing errors into the model.
Table 5Range of possible values for each of the variables under analysis.
The method described in Encalada-Dávila et al. (2021) is used for the imputation. To complete the missing data for two samples, the piecewise cubic Hermite polynomial interpolation method is used, which allows new values to be included, ensuring that the function will behave monotonically and that the first derivative will be continuous. Also, since there may be missing values at the boundaries, the closest data that follow or precede the missing values are used.
An example of the imputation strategy applied to complete the absent values in the low-speed shaft temperature is detailed in Fig. 4.
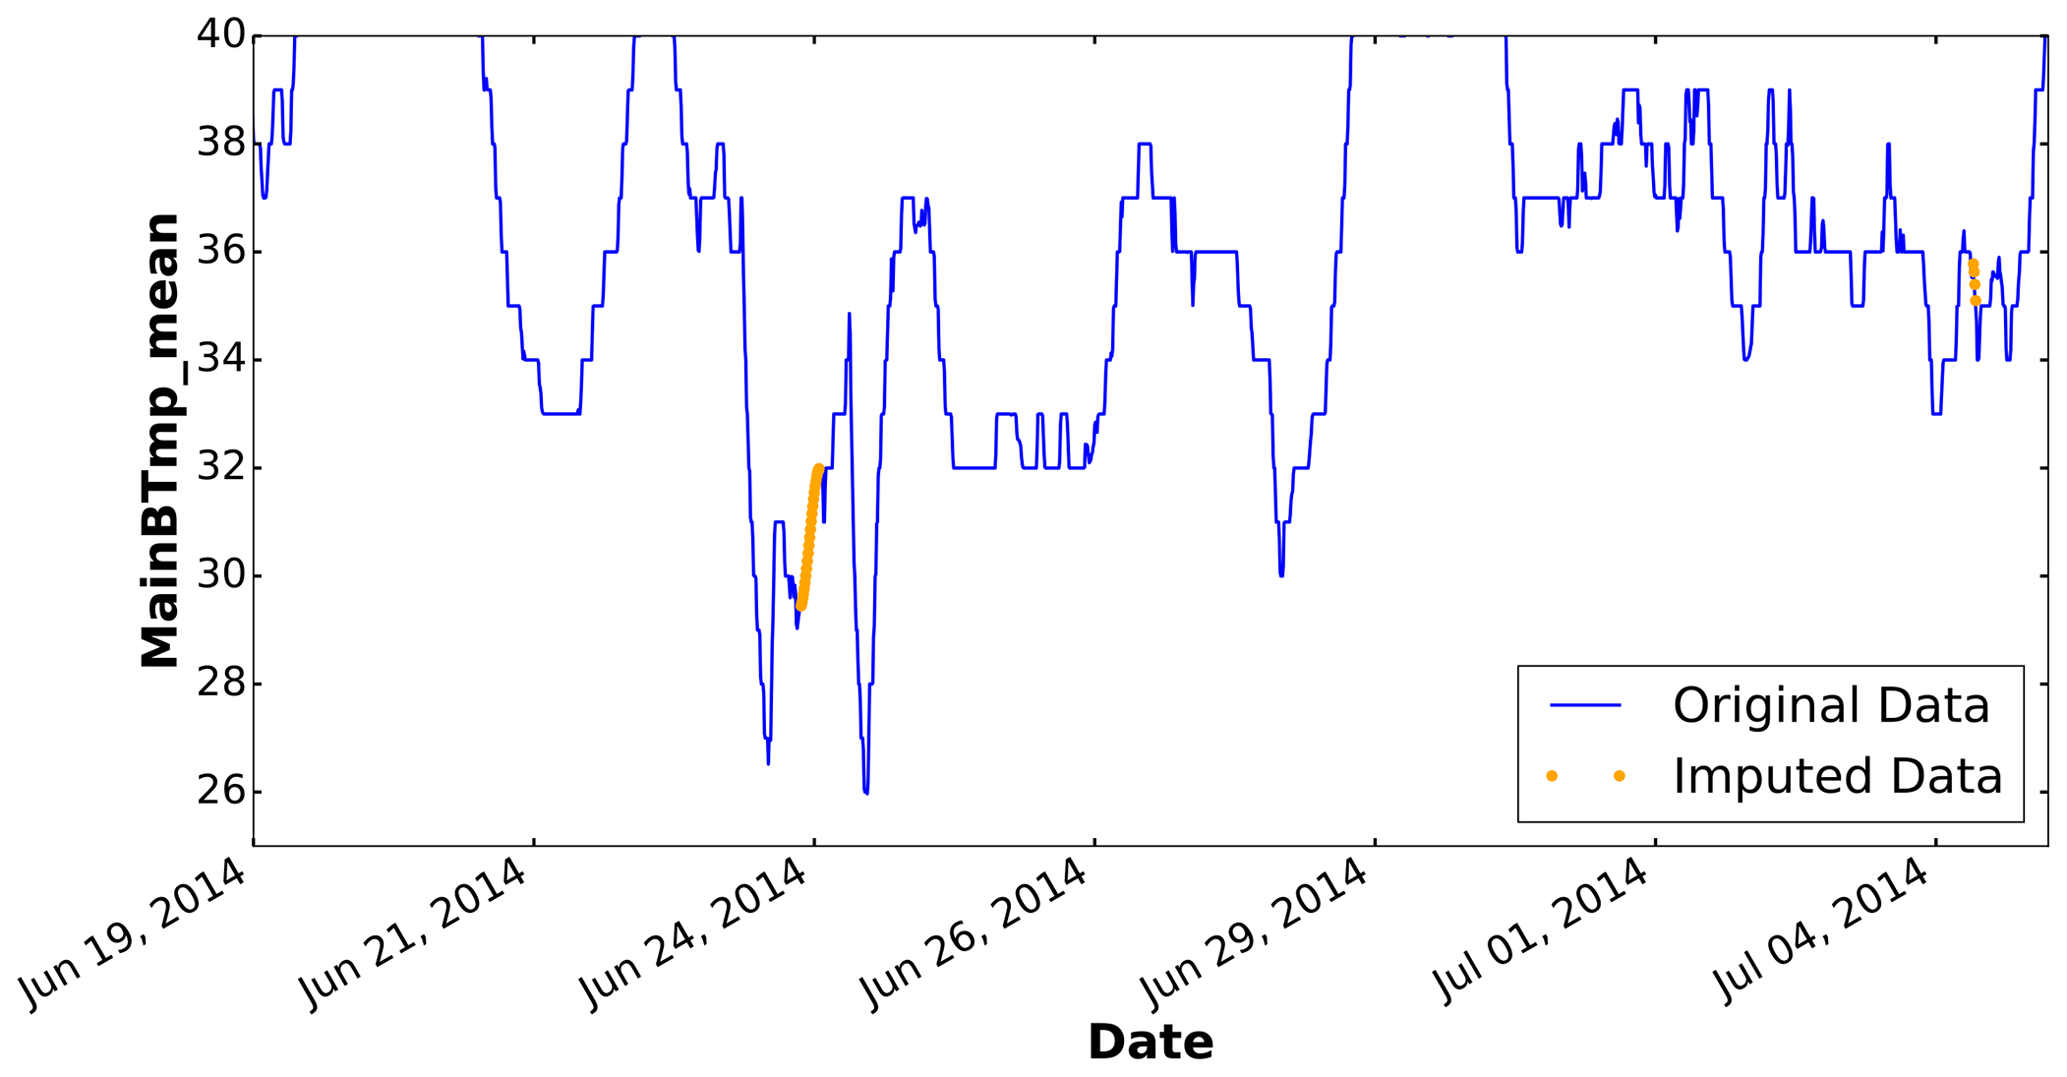
Figure 4Imputation strategy used to fill missing values in the low-speed shaft temperature (given in degrees Celsius).
4.2 Variable selection
Recall that in Sect. 3 a preselection of variables is carried out based on the use of exogenous variables and the variable most related to the failure under study, but when working with large data sets (in this case several years), a new process of selecting variables is needed to reduce the number of features, eliminating non-informative or redundant variables that may slow down the development and training of the model or can also introduce errors (Kim et al., 2011). Therefore, this procedure is carried out with the objective of improving the prediction efficiency of the model, providing faster and more reliable predictions.
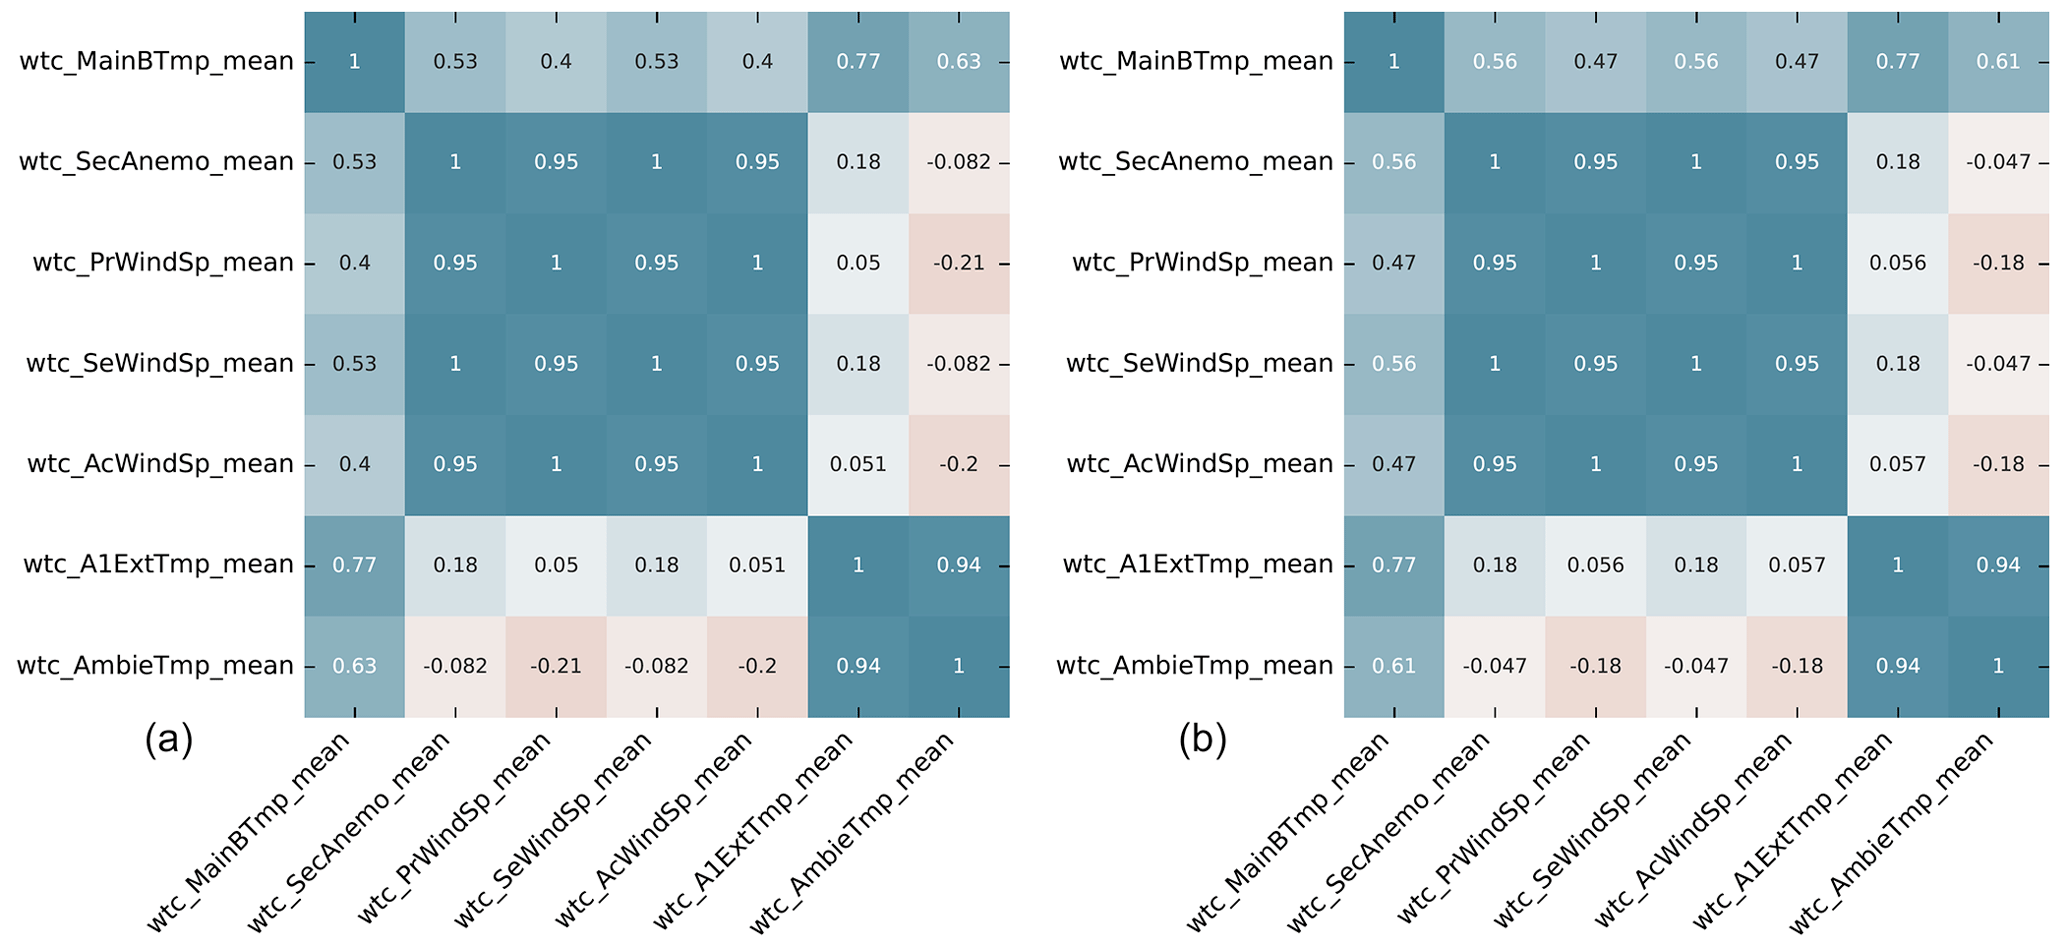
Figure 5Pearson correlation heat map of preselected variables (a) and Spearman correlation heat map of preselected variables (b).
One way to determine which variables are useful when training the model is through a correlation analysis, which allows one to know the relation between the variables. In this work, Pearson and Spearman are used. Both Pearson and Spearman correlation coefficients are measures of the strength and direction of a linear relationship between two variables. The Pearson correlation coefficient is used when both variables are continuous and have a linear relationship. It measures the degree to which two variables are linearly related and ranges from −1 (perfect negative correlation) to 1 (perfect positive correlation), with 0 indicating no correlation. The Pearson correlation coefficient assumes that the data are normally distributed. On the other hand, the Spearman correlation coefficient is preferred when the variables are not normally distributed or are ordinal (ranked). It measures the degree to which two variables are monotonically related, meaning that they move in the same direction but not necessarily at a constant rate. Like the Pearson coefficient, the Spearman correlation coefficient ranges from −1 to 1, with 0 indicating that there is no correlation.
According to Sabilla et al. (2019) depending on the coefficient value, it can be determined whether the correlation between two variables is strong or weak, considering a strong relationship for values from 0.50 to 0.69, a very strong relationship from 0.70 to 0.89, and an almost perfect relationship from 0.90 to 1.
For the selection of the variables that are to be analyzed and studied, in this work it has been decided to select variables with a correlation greater than +0.8 and less than −0.8, selecting one of them and eliminating the other, given that, as observed when analyzing the data, there are variables that offer the same information as others since they are highly correlated. Therefore, the selected variables are MainBTmp, SecAnemo, and AmbieTmp, which are described in Table 4. Figure 5 shows the correlation analysis performed between all variables.
It is important to consider that to avoid errors due to seasonality, the temperature of the low-speed shaft (MainBTmp) is subtracted from the environmental temperature (AmbieTmp). As you can see in Sect. 5, the model is trained with this new processed variable and the SecAnemo variable.
Principal component analysis (PCA) is a statistical technique widely used for the study of data in almost all scientific areas (Kurita, 2019). This method is based on determining the most significant base of a given data set to decrease its dimensionality for large data sets, simplifying the complexity of multidimensional spaces while keeping as much information as possible (Rodrigo, 2020). Its objective is to be able to differentiate which features are the most relevant, which are redundant, and which are just noise (Tibaduiza et al., 2011).
Suppose that there is a sample of n observations with dependent variables that are interrelated and have noise (Jolliffe and Cadima et al., 2016), where each has p variables or dimensions. PCA is expected to obtain hidden and meaningful data from these observations and filter out the noise. To achieve this purpose, PCA determines a set of new orthogonal variables called principal components, z, which are the result of linear combinations of the initial variables (Kurita, 2019).
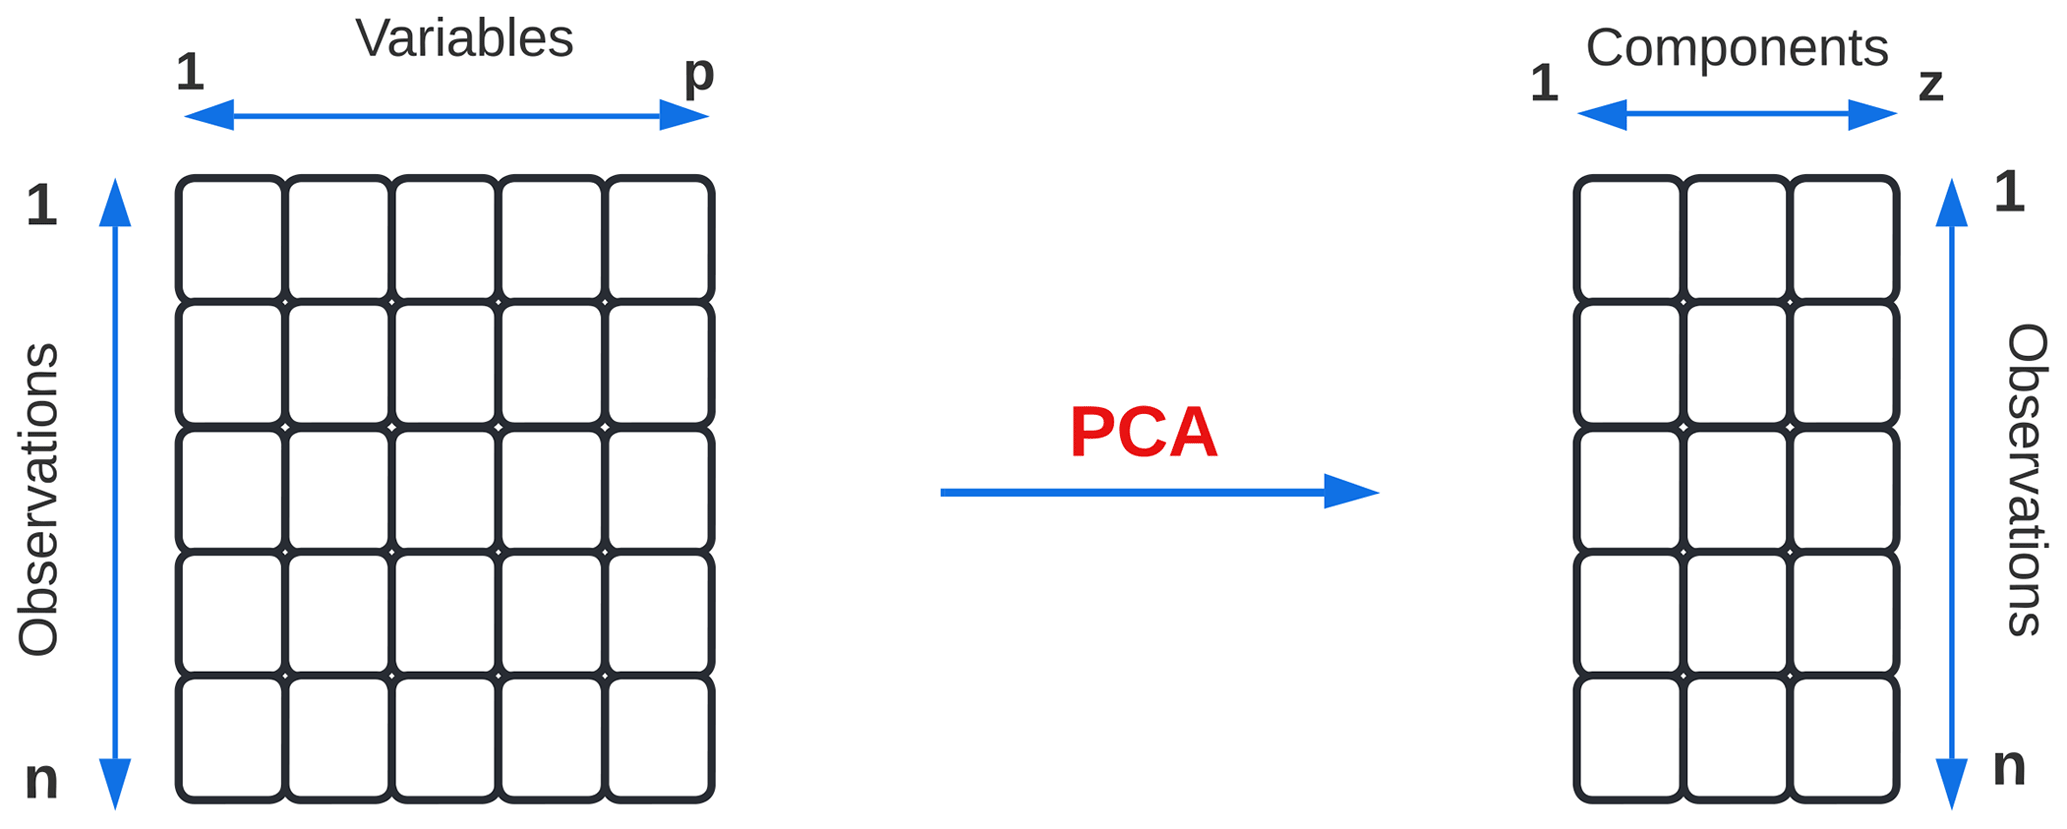
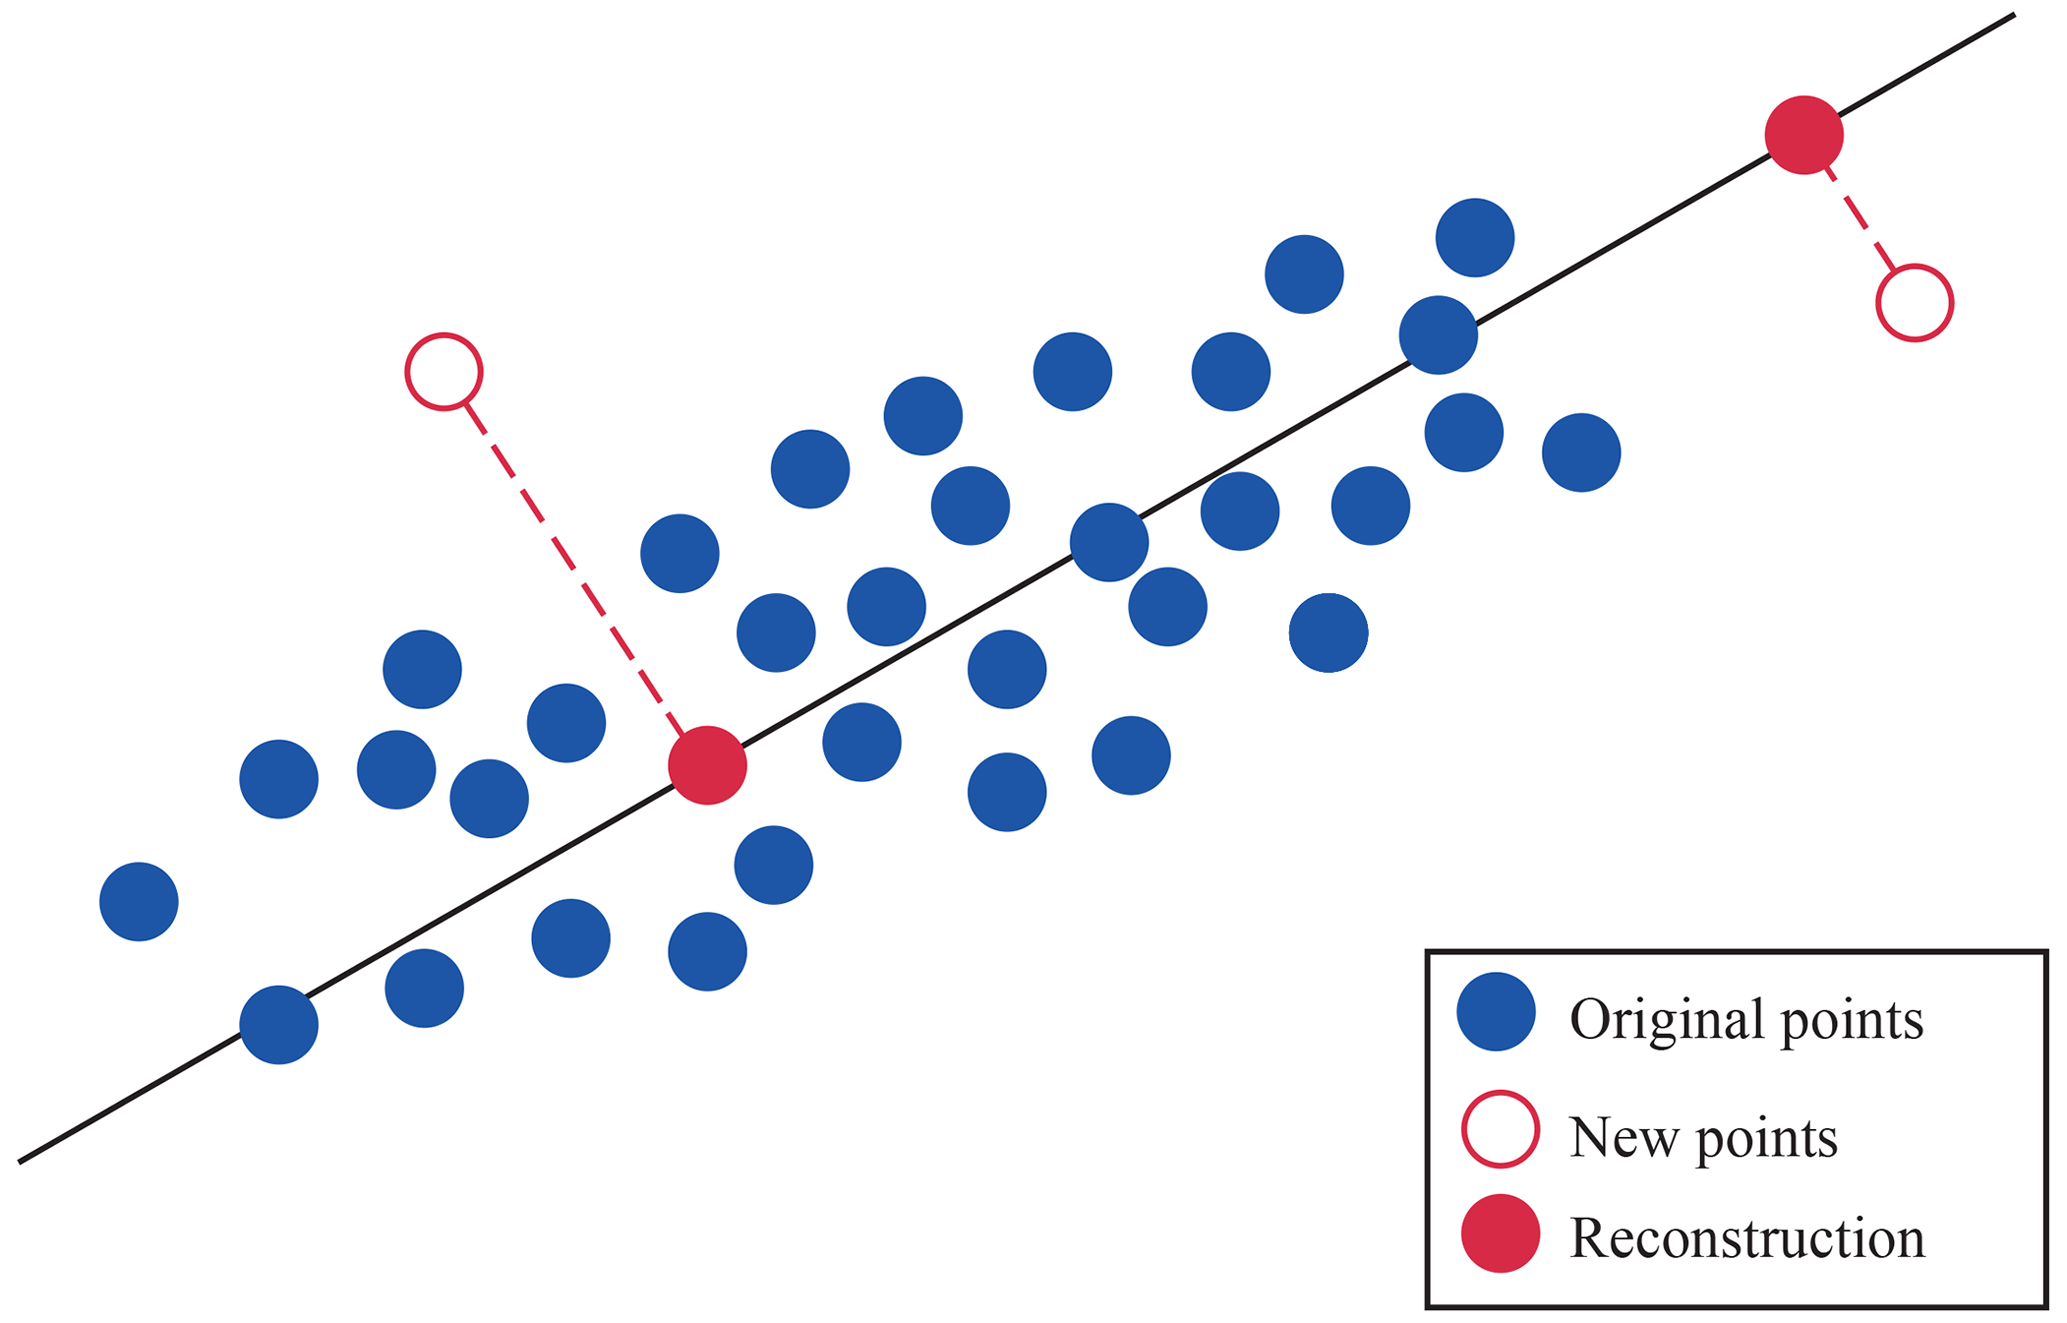
In short, with PCA it is possible to describe an observation for which p values were previously needed with only z values, where z<p, as shown in Fig. 6.
Suppose that there is a data set X=[x1, x2, …, xN], where each column is an observation n with p variables or dimensions. The mean vector of the sample and the sample covariance matrix Σ are defined in Eqs. (1) and (2), respectively, where the matrix , …, .
A principal component analysis stands to reason if the variables have strong correlations, as this is an indication of the presence of redundant information, and therefore few components could explain much of the total variance. The selection of the number of components is determined based on the percent of the variability that is considered appropriate. The first component collects the greatest possible variability of the original data, the second collects the maximum possible variability (in an orthogonal direction to the first one) not considered by the first, and the following components repeat it until an adequate variability is reached.
In Kurita (2019), the PCA technique is explained in greater depth, describing the mathematical formulas used to calculate each principal component and its projection in a new vector space.
One of the most important applications of PCA is its use in anomaly detection, where the normalized reconstruction error (RE) is used as a scoring level to determine whether a sample is healthy or anomalous. For this study, this technique is used, as described in Sect. 5.1.
5.1 Anomaly detection with PCA
Anomaly detection with PCA is an unsupervised statistical strategy to identify anomalous samples present in a set of data elements, based on RE results (Rodrigo, 2020). In particular, the goal is to decompose the source data set into its principal components and then reconstruct the original data using the necessary principal components.
For this work, the preselected variables are projected using the PCA strategy, obtaining three principal components.
Equation (3) describes the first principal component, where , …, aN1)T is a set of weights for linear combinations.
The vector of this component has a tendency in the direction of the observations with greater variance. The projection of each observation in that direction represents the value of the first component of that observation.
For the calculation of the following main components, the same principle is used iteratively until the original number of variables, considering that the vector of each next principal component will represent the next direction in which the data have more variance and that it should not be correlated with the previous component, which implies that the direction of their vectors is orthogonal to each other (Rodrigo, 2020).
Each new input is processed by the anomaly detector, where it first calculates the projection of the eigenvector and then the RE (Microsoft, 2021). The anomaly detection with PCA indicates that the anomalous elements will be the reconstructed data that differ the most from their original counterparts (see Fig. 7).
Let xn, where n=(1, 2, …, N) and xnϵℝd, be the set of data observations and the reconstruction produced based on an implicit variable of smaller dimension. Then, the RE is defined by Eq. (4).
In this study, the PCA method is used with the objective of identifying observations that differ from a large part of the values, these being the healthy data used for the training process. When using this approach, prefailure data (anomalies) are expected to have qualitatively distinct attributes from normal data. Therefore, the PCA anomaly detection model is trained only on data from one class (healthy samples), and subsequently predictions are made to find anomalies in the test data set.
Once the PCA anomaly detection algorithm has been created, all phases discussed above are represented in a diagram, as shown in Fig. 8. Unlike other approaches, such as the neural autoencoder, the main utility of using PCA as an anomaly detector is its simplicity. Figure 8 shows the data cleaning, variable selection, and training stages of the PCA anomaly detection model.
For FDI, a threshold is typically established. When the model's discovery of anomalies (outliers) exceeds the predetermined threshold, an alert is produced. However, given that the study only used available 10 min SCADA data, there may be an excessive number of false alarms, leading to alarm fatigue for WT operators. The FDI that is suggested to bypass this problem is computed in three phases, which are explained in this section. Weekly outliers are aggregated (counted) using the PCA anomaly detector approach, after which the exponential weighted moving average (EWMA) filter (Ratner, 2017) is applied to the weekly outlier count, and finally a threshold is defined.
6.1 Weekly gathering
SCADA samples for the current work are collected every 10 min, totaling 1008 samples per week. The anomaly detector with PCA algorithm's weekly grouping comprises counting the number of samples out of a total of 1008 that are labeled as anomalies. Formally, the number of samples identified as anomalies for the given ith week is counted and indicated as Ci.
6.2 Exponential weighted moving average (EWMA)
A well-known technique for smoothing historical data is the moving average (MA) approach (Hunter, 1986). The MA has several expansions, each with its own unique features, but their fundamental goal is still the same. In this work, a common MA extension known as EWMA is applied, which combines the calculation of the weight factor for the weighted moving average (WMA) and exponential moving average (EMA). A WMA assigns each observation the same weight, but an EWMA responds more strongly to recent sample changes. A parameter, α, must be defined to determine the importance of each sample in the EWMA calculation. This technique follows the starting time series more accurately, the higher the value of alpha. The weekly grouping time series, Ci, is applied to the EWMA formula used in this study as
where EWMA0 is the mean of previous data and α is the user-determined weight. One way to specify the parameter α is in terms of spans, generally known as an n-day EWMA,
In this work, s=4, indicating that 4-week groups are taken into account (around a month). Actually, the conclusions of McKinnon et al. (2020) have an impact on this choice. They evaluated three different moving windows, daily, weekly, and monthly, in their study of the impact of time history on WT failures using SCADA data. The weekly moving window performs best in terms of discovering failures compared to the others.
The FDI reports alarms when the total number of anomalies exceeds a specified threshold. The EWMA filter and weekly counting are then used. The EWMA over the mean (μ) and standard deviation (σ) of the training set is calculated. Recalling that values within 3 standard deviations of the mean make up roughly 99.7 % of a data set with an approximately normally distributed distribution, the so-called 3σ rule conveys a common heuristic that it is desirable to regard 99.7 % of probabilities as being close to certain. As a result, the criterion used in this study specifies that results greater than 3 standard deviations from the mean should be regarded as anomalies. Consequently, the threshold is stated as
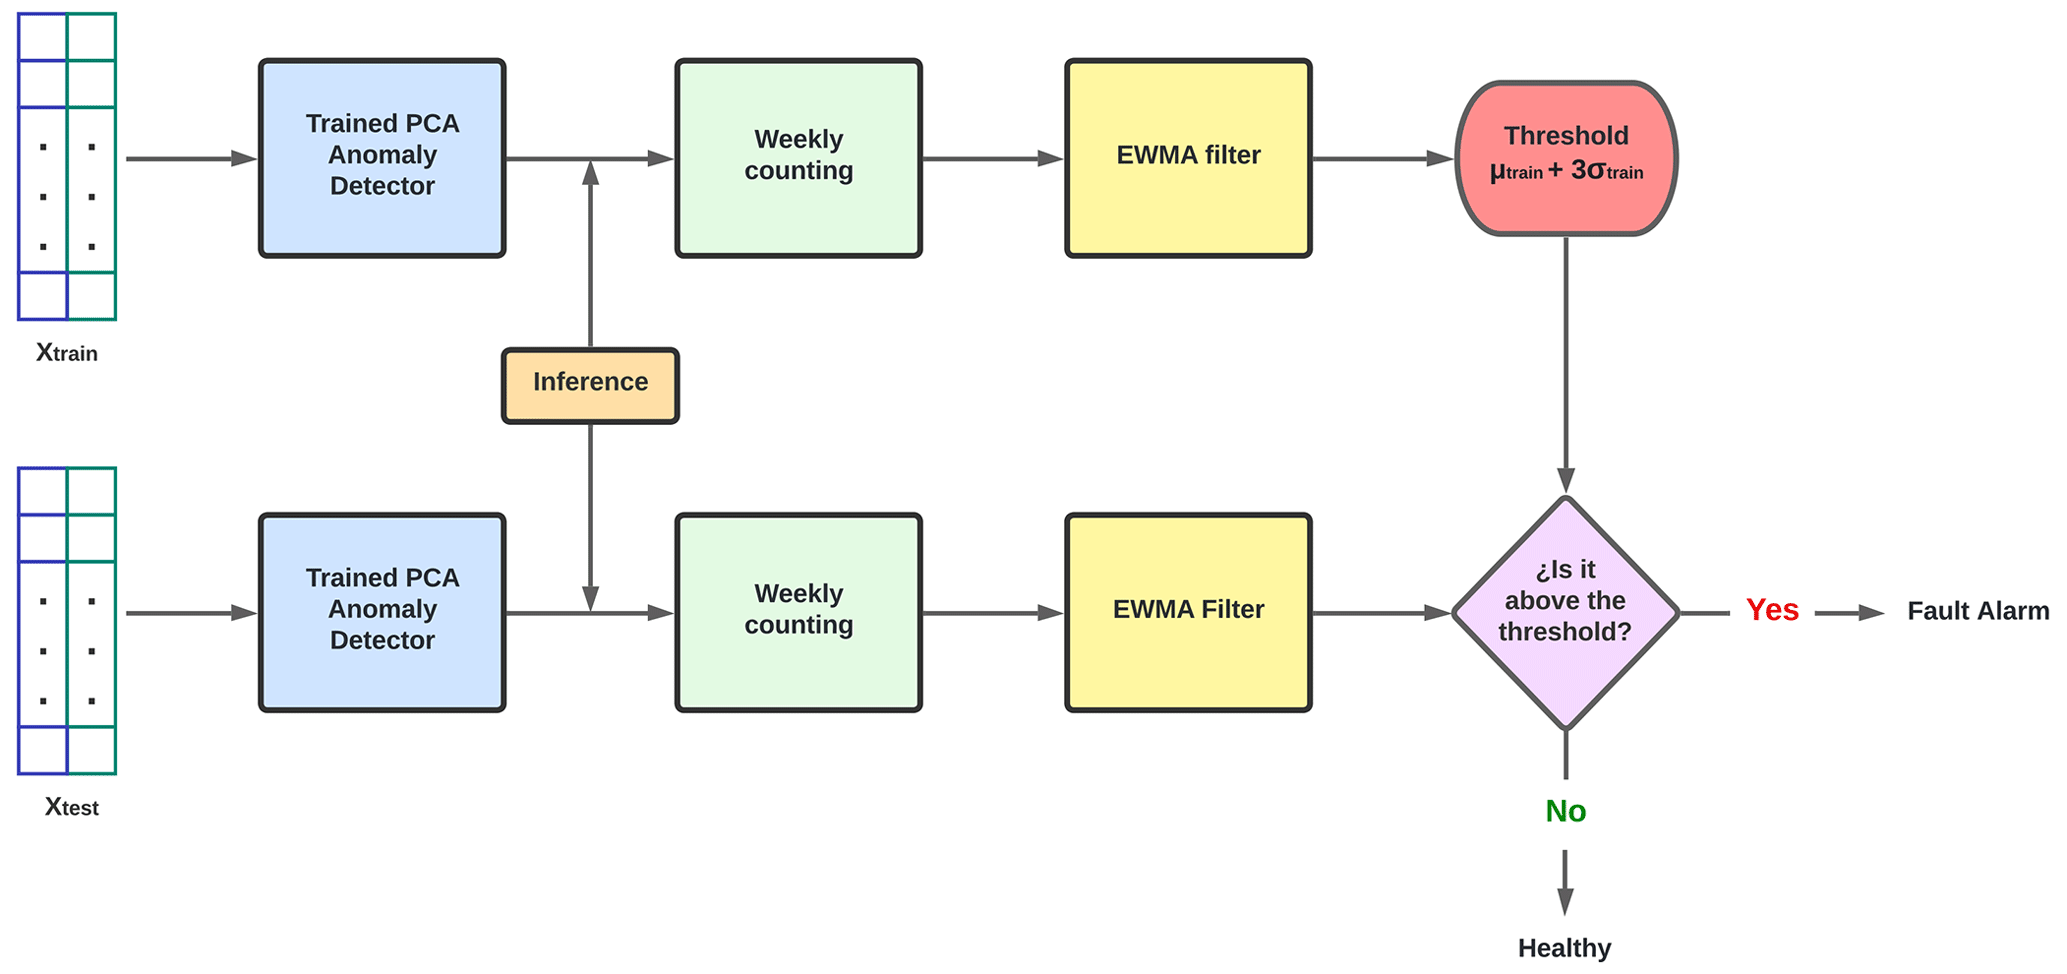
The flowchart shown in Fig. 9 describes the latter phases of the approach (from the model of the PCA anomaly detector already trained). The graphic shows how the inferences of Xtrain are grouped by week and then filtered to determine a threshold. Then the same procedure is used with the Xtest inferences, but this time the goal is to utilize the previously established threshold (from Xtrain) to trigger an alert when the output goes over it.
As a result of the proposed study, a predictive maintenance plan is developed to predict failures in the main bearing of the wind park. The model only needs healthy data to be trained and, as a result, allows for detecting anomalies before the fatal failure occurs.
Figures 10–12 show the figures of the weekly indicator, using the test data, for each of the 18 WTs, to which the detection threshold defined for the evaluation of the model is applied.
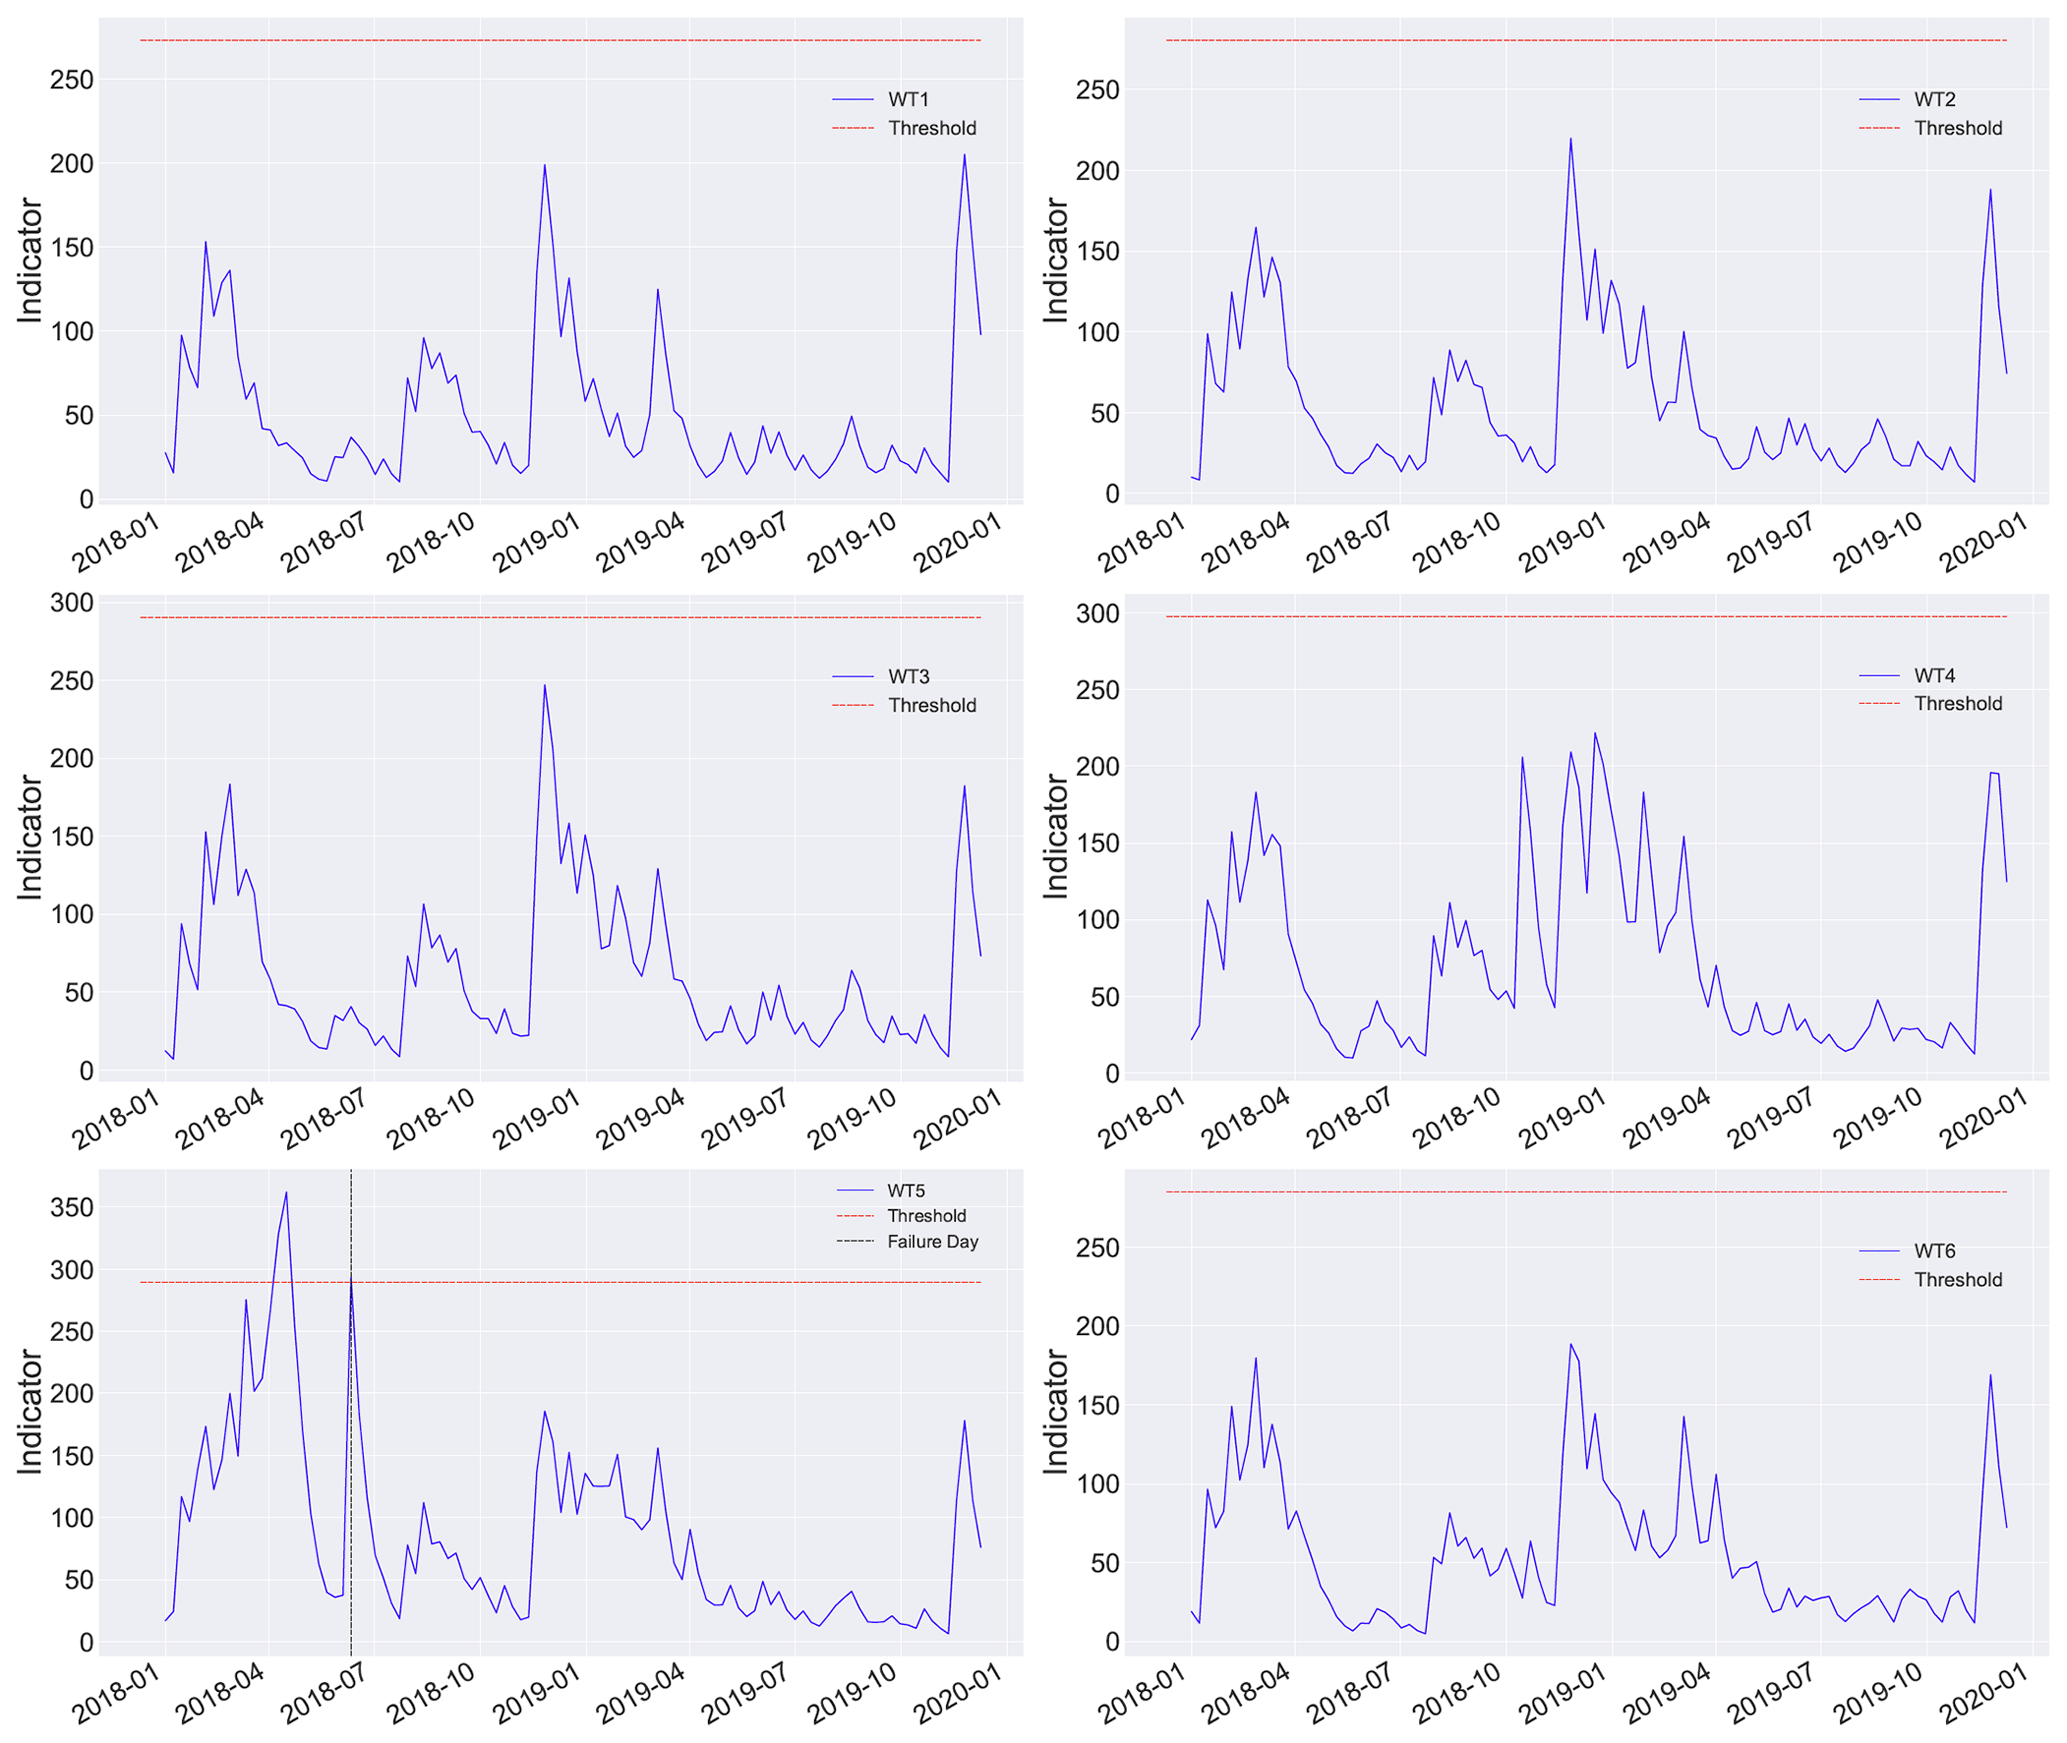


When analyzing the figure of each turbine, it can be seen that WT5 and WT16 have data above the established threshold, indicating the presence of alarms and predicting a failure during the indicated time.
In the case of the WT5 turbine, based on the information provided by the wind park, a work order was generated on 11 June 2018 for immediate maintenance of the WT5 turbine, corresponding to a main bearing failure (failure of interest in this study). Using the model, it can be seen in Fig. 10 that three alerts were generated. The first alert generated is given on 9 April 2018, the next on 16 April 2018, and the last on the day of failure (10 June 2018). This allows inferring that the system is capable of alerting about this type of failure months in advance, which allows corrective measures to be taken in time to avoid emergency shutdowns, additional costs, and loss of efficiency in energy production. Note that after peaks (Fig. 11, WT5), the signal drops sharply again for a long period. This is because the heat created from an initial failure mode (heating from an initial crack, friction, wear, etc.) is detected by the methodology, but its appearance is not continuous over time until the final breakdown. In contrast, when the failure mode advances, for example, when a crack propagates, the generated heat appears. When the crack remains still, no further heat is generated; thus, the alarm is set to off. However, cracks are already present and can advance at any time, leading to the possible failure of the component. Thus, in this methodology, whenever the alarm is on (even when it is set to off after a few weeks), it is highly recommended to check the specific WT.
It is significant that the proposed approach is designed specifically to detect (using only standard SCADA data, which are usually 10 min averaged) the possible heat generated from an initial failure mode, such as the initiation or propagation of the crack, friction, electrical discharge, and other failure modes associated with heat release. These types of failure typically result in a gradual and sustained increase in temperature (while they evolve) rather than sudden spikes or drops, which makes them detectable even with low sampling rates, as temperature variables have a low dynamic and still contain the information of the fault after being 10 min averaged. With respect to the use of the weekly average, it is intended to reduce false positives by smoothing out transient fluctuations in the data that are not indicative of actual anomalies. Although this averaging may limit the resolution of the approach, as it could smooth out subtle changes in the data that could be indicative of early-stage anomalies, this trade-off is necessary to minimize false alarms and ensure practical utility of the methodology (and avoid alarm fatigue).
On the other hand, analyzing the case of the WT16 turbine, the model generated the alert on 17 December 2018. And on 26 June 2019, the wind park registered a work order in this WT, due to the presence of a fault in the gearbox. Although this is not the failure of the study, the detection of this type of failure may be caused by the high relationship between the main components where failures were recorded (low-speed shaft and gearbox) and the use of variables or characteristics of the model that are mostly exogenous.
In summary, 18 wind turbines were examined, of which 16 were considered healthy and correctly classified as such. One turbine had the fault of interest and was correctly classified as faulty. Another turbine had a fault (which was not the fault of interest) and was classified as faulty, which could be considered a false alarm. However, in practice, the fact that an alarm was raised for a fault in a different component could still be useful, as it indicates the need for maintenance or further inspection. Therefore, in addition to the hit rate and error rate, the practical implications of false alarms should also be taken into account.
In this work, an anomaly detection system is developed and evaluated by principal component analysis (PCA), in order to obtain early warnings of possible failures in the main bearing of the WTs. The stated methodology only requires healthy data at the time of development of the model, and the achievements obtained show a functional and efficient system in the generation of alerts for the detection of failures. Among the main advantages of this system are the following:
-
it is not necessary to implement or purchase new sensors or additional systems, since only the data acquired by the SCADA system are used;
-
it is not necessary to have a turbine failure history, as this strategy is developed with a semi-supervised model that is developed with healthy information only;
-
for the training and evaluation of the model, data from a real wind park in production are used.
It can be concluded that the stated methodology works accurately and efficiently since, when tested over a year in a complete wind park, it raised alerts months before the fatal breakdown occurs without false alarms. In addition, it allows for the detection of failures of not only the main bearing but also nearby components, thus offering the industry the benefit of predictive maintenance for early planning, guaranteeing long-term safe and continuous operation, reducing downtime, emergency stops, and additional costs.
Finally, while our approach has shown promising results, there are several areas for future research. One limitation of our approach is its applicability to new data sets with different characteristics, as each WT depends on its own model trained with its own data. In future work, we plan to explore the use of transfer learning to overcome this limitation and develop models that can generalize to new data sets. The results demonstrate that the stated approach is effective in detecting a main bearing fault that resulted in a significant increase in temperature. Although only one failure was available in the investigated wind park data, which is insufficient for statistical analysis, any bearing fault leading to heat release might be detectable by the proposed strategy. However, to more extensively investigate the performance of the model, it is necessary to apply it to other wind parks with main bearing failure issues. Therefore, future work will test the model on a larger data set to assess its performance in different scenarios and draw more generalizable conclusions. While the main bearing temperature was found to be a suitable indicator for detecting faults in wind turbines, as also stated in a recent paper by Murgia et al. (2023), another limitation of the proposed approach is that it cannot precisely locate the fault or its severity. Further developments could be pursued in this direction, for instance, by incorporating high-sampling data and/or additional sensors to improve the precision of the fault location. However, this may come at the cost of increased complexity and expense, which we try to avoid in this work where the main objective is to contribute a cost-effective solution where all variables used are readily available in all industrial-size wind farms (both older and newer).
The codes used in this work are the intellectual property of the authors or the university they are associated with. In case of interest, please contact the authors.
Interested parties can contact the corresponding author to discuss data accessibility.
LCV contributed to the paper by performing data curation, conducting formal analysis, developing software, and preparing the original draft of the manuscript. MdCF contributed to the paper by conducting formal analysis, validating the results, creating visualizations, and preparing the original draft of the manuscript. YV contributed to the paper by conceptualizing the research, conducting formal analysis, securing funding for the project, and reviewing and editing the manuscript. JS contributed to the paper by conducting formal analysis, validating the results, and reviewing and editing the manuscript. CT contributed to the paper by conceptualizing the research, conducting formal analysis, and reviewing and editing the manuscript.
The contact author has declared that none of the authors has any competing interests.
Publisher's note: Copernicus Publications remains neutral with regard to jurisdictional claims in published maps and institutional affiliations.
In addition, the authors express their gratitude and appreciation to the Smartive company (http://smartive.eu/, last access: December 2022), as this work would not have been possible without their support and ceded wind park data.
This work is partially funded by the Spanish Agencia Estatal de Investigación (AEI), Ministerio de Economía, Industria y Competitividad (MINECO), and the Fondo Europeo de Desarrollo Regional (FEDER) through the research project PID2021-122132OB-C21.
This paper was edited by Paul Fleming and reviewed by Davide Astolfi, Markus Grebe, and one anonymous referee.
Artigao, E., Martín-Martínez, S., Honrubia-Escribano, A., and Gómez-Lázaro, E.: Wind turbine: A comprehensive review towards effective condition monitoring development, Appl. Energy, 228, 1569–1583, https://doi.org/10.1016/j.apenergy.2018.07.037, 2018. a
Astolfi, D., Castellani, F., and Natili, F.: Wind turbine generator slip ring damage detection through temperature data analysis, Diagnostyka, 20, 3–9, https://doi.org/10.29354/diag/109968, 2019. a
Bahar, K. P., Yıldız, G. B., and Soylu, B.: Predictive Maintenance System Integrated with Periodic Maintenance: Machine Learning and Classical Approaches, EasyChair, 5806 pp., https://wvvw.easychair.org/publications/preprint_download/GsVf (last access: April 2023), 2021. a
Baloch, Z. A., Tan, Q., Kamran, H. W., Nawaz, M. A., Albashar, G., and Hameed, J.: A multi-perspective assessment approach of renewable energy production: policy perspective analysis, Environ. Dev. Sustain., 24, 2164–2192, https://doi.org/10.1007/s10668-021-01524-8, 2022. a
Borchersen, A. B. and Kinnaert, M.: Model‐based fault detection for generator cooling system in wind turbines using SCADA data, Wind Energy, 19, 593–606, https://doi.org/10.1002/we.1852, 2016. a
Borgi, T., Hidri, A., Neef, B., and Naceur, M. S.: Data analytics for predictive maintenance of industrial robots, in: International Conference on Advanced Systems and Electric Technologies (IC_ASET), 14–17 January 2017, Hammamet, Tunisia, 412–417, https://doi.org/10.1109/ASET.2017.7983729, 2017. a
Brownlee, J.: Data preparation for machine learning: data cleaning, feature selection, and data transforms in Python, Machine Learning Mastery, https://machinelearningmastery.com/data-preparation-for-machine-learning/ (last access: April 2023), 2020. a
Carroll, J., McDonald, A., and McMillan, D.: Failure rate, repair time and unscheduled O&M cost analysis of offshore wind turbines, Wind Energy, 19, 1107–1119, https://doi.org/10.1002/we.1887, 2016. a
Chacón, A. and Märquez, F.: SCADA data analytics for fault detection and diagnosis of wind turbines, in: IEEE 7th International Conference on Control, Instrumentation and Automation (ICCIA), 23–24 February 2021, Faculty of Electrical and Computer Engineering, University of Tabriz, Tabriz, Iran, 1–6, https://doi.org/10.1109/ICCIA52082.2021, 2021. a
Chen, B., Xie, L., Li, Y., and Gao, B.: Acoustical damage detection of wind turbine yaw system using Bayesian network, Renew. Energy, 160, 1364–1372, https://doi.org/10.1016/j.renene.2020.07.062, 2020. a
Dahiya, R.: Condition monitoring of wind turbine for rotor fault detection under non stationary conditions, Ain Shams Eng. J., 9, 2441–2452, https://doi.org/10.1016/j.asej.2017.04.002, 2018. a
Dameshghi, A. and Refan, M. H.: Wind turbine gearbox condition monitoring and fault diagnosis based on multi-sensor information fusion of SCADA and DSER-PSO-WRVM method, Int. J. Simul. Model., 39, 48–72, https://doi.org/10.1080/02286203.2018.1476008, 2019. a, b
Dao, P. B.: Condition monitoring and fault diagnosis of wind turbines based on structural break detection in SCADA data, Renew. Energy, 185, 641–654, https://doi.org/10.1016/j.renene.2021.12.051, 2022. a
Dao, P. B., Staszewski, W. J., Barszcz, T., and Uhl, T.: Condition monitoring and fault detection in wind turbines based on cointegration analysis of SCADA data, Renew. Energy, 116, 107–122, https://doi.org/10.1016/j.renene.2017.06.089, 2018. a
Dervilis, N., Choi, M. , Taylor, S. G., Barthorpe, R. J., Park, G., Farrar, C. R., and Worden, K.: On damage diagnosis for a wind turbine blade using pattern recognition, J. Sound Vibrat., 333, 1833–1850, https://doi.org/10.1016/j.jsv.2013.11.015, 2014. a
El Naqa, I. and Murphy, M. J.: What Is Machine Learning?, Springer, https://doi.org/10.1007/978-3-319-18305-3_1, 2015. a
Encalada-Dávila, Á., Puruncajas, B., Tutivén, C., and Vidal, Y.: Wind Turbine Main Bearing Fault Prognosis Based Solely on SCADA Data, Sensors, 21, 2228, https://doi.org/10.3390/s21062228, 2021. a, b, c, d
Encalada-Dávila, Á., Moyón, L., Tutivén, C., Puruncajas, B., and Vidal, Y.: Early Fault Detection in the Main Bearing of Wind Turbines Based on Gated Recurrent Unit (GRU) Neural Networks and SCADA Data, IEEE/ASME Trans. Mechatron., 27, 5583–5593, https://doi.org/10.1109/TMECH.2022.3185675, 2022. a, b
Feng, Y., Qiu, Y., Crabtree, C. J., Long, H., and Tavner, P. J.: Use of SCADA and CMS signals for failure detection and diagnosis of a wind turbine gearbox, in: European Wind Energy Association Conference, EWEC 2011, 14–17 March 2014, Brussels, Belgium, https://eprints.whiterose.ac.uk/83334/7/2011 Feng, Qiu, Crabtree, Long, Tavner_EWEA.pdf (last access: April 2023), 2014. a
Fu, J., Chu, J., Guo, P., and Chen, Z.: Condition monitoring of wind turbine gearbox bearing based on deep learning model, IEEE, 7, 57078–57087, https://doi.org/10.1109/ACCESS.2019.2912621, 2019. a
Fuentes, R., Dwyer-Joyce, R. S., Marshall, M. B., Wheals, J., and Cross, E. J.: Detection of sub-surface damage in wind turbine bearings using acoustic emissions and probabilistic modelling, Renew. Energy, 147, 776–797, https://doi.org/10.1016/j.renene.2019.08.019, 2020. a
García, S. and Luengo, F. H.: Data Preprocessing in Data Mining, in: Intelligent Systems Reference Library, 1st Edn., Springer, Cham, 320 pp., https://doi.org/10.1007/978-3-319-10247-4, 2015. a
Guo, J., Liu, C., Cao, J., and Jiang, D.: Damage identification of wind turbine blades with deep convolutional neural networks, Renew. Energy, 174, 122–133, https://doi.org/10.1016/j.renene.2021.04.040, 2021. a
Guo, P., Fu, J., and Yang, X.: Condition monitoring and fault diagnosis of wind turbines gearbox bearing temperature based on kolmogorov-smirnov test and convolutional neural network model, Energies, 11, 2248, https://doi.org/10.3390/en11092248, 2018. a
Hameed, Z., Hong, Y. S., Cho, Y. M., Ahn, S. H., and Song, C. K.: Condition monitoring and fault detection of wind turbines and related algorithms: A review, Renew. Sustain. Energ. Rev., 13, 1–39, https://doi.org/10.1016/j.rser.2007.05.008, 2009. a
Hansen, M.: Aerodynamics of wind turbines. Editorial, Routledge, Taylor and Francis Group, https://doi.org/10.4324/9781315769981, 2015. a
Harris, T. A. and Kotzalas, M. N.: Essential Concepts of Bearing Technology. Editorial, Routledge, Taylor and Francis Group, ISBN 9780429123351, https://doi.org/10.1201/9781420006599, 2006. a
Hart, E., Clarke, B., Nicholas, G., Kazemi Amiri, A., Stirling, J., Carroll, J., Dwyer-Joyce, R., McDonald, A., and Long, H.: A review of wind turbine main bearings: design, operation, modelling, damage mechanisms and fault detection, Wind Energ. Sci., 5, 105–124, https://doi.org/10.5194/wes-5-105-2020, 2020. a
Hu, J. and Chen, P.: Predictive maintenance of systems subject to hard failure based on proportional hazards model, Reliab. Eng. Syst. Safe., 196, 106707, https://doi.org/10.1016/j.ress.2019.106707, 2020. a
Hu, Y., Li, H., Shi, P., Chai, Z., Wang, K., Xie, X., and Chen, Z.: A prediction method for the real-time remaining useful life of wind turbine bearings based on the Wiener process, Renew. Energy, 127, 452–460, https://doi.org/10.1016/j.renene.2018.04.033, 2018. a
Hubbard, P. G., Xu, J., Zhang, S., Dejong, M., Luo, L., Soga, K., and Minto, C.: Dynamic structural health monitoring of a model wind turbine tower using distributed acoustic sensing (DAS), J. Civ. Struct. Health Monit., 11, 833–849, https://doi.org/10.1007/s13349-021-00483-y, 2021. a
Hunter, J. S.: The exponentially weighted moving average, J. Qual. Technol., 18, 203–210, https://doi.org/10.1080/00224065.1986.11979014, 1986. a
Jakhar, D. and Kaur, I.: Artificial intelligence, machine learning and deep learning: definitions and differences, Clin. Exp. Dermatol., 45, 131–132, https://doi.org/10.1111/ced.14029, 2020. a
Jiang, G., He, H., Yan, J., and Xie, P.: Multiscale Convolutional Neural Networks for Fault Diagnosis of Wind Turbine Gearbox, IEEE, 66, 3196–3207, https://doi.org/10.1109/TIE.2018.2844805, 2019. a
Jiang, Z., Hu, W., Dong, W., Gao, Z., and Ren, Z.: Structural reliability analysis of wind turbines: A review, Energies, 10, 2099, https://doi.org/10.3390/en10122099, 2017. a
Jolliffe, I. T. and Cadima, J.: Principal component analysis: a review and recent developments, Philos. T. Roy. Soc. A, 374, 20150202, https://doi.org/10.1098/rsta.2015.0202, 2016. a
Joshuva, A. and Sugumaran, V. : A lazy learning approach for condition monitoring of wind turbine blade using vibration signals and histogram features, Measurement, 152, 107295, 984, https://doi.org/10.1016/j.measurement.2019.107295, 2020. a
Kang, J. N., Wei, Y. M., Liu, L. C., Han, R., Yu, B. Y., and Wang, J. W.: Energy systems for climate change mitigation: A systematic review, Appl. Energy, 263, 114602, https://doi.org/10.1016/j.apenergy.2020.114602, 2020. a
Karabacak, Y. and Özmen, N.: Common spatial pattern-based feature extraction and worm gear fault detection through vibration and acoustic measurements, Measurement, 187, 110366, https://doi.org/10.1016/j.measurement.2021.110366, 2022. a
Kim, K., Parthasarathy, G., Uluyol, O., Foslien, W., Sheng, S., and Fleming, P.: Use of SCADA data for failure detection in wind turbines, in: ASME 2011 5th International Conference on Energy Sustainability, 7–10 August 2011, Washington, DC, USA, https://doi.org/10.1115/ES2011-54243, 2011. a, b
Kotsiantis, S. B., Zaharakis, I. D., and Pintelas, P. E.: Machine learning: a review of classification and combining techniques, Artif. Intell. Rev., 26, 159–190, https://doi.org/10.1007/s10462-007-9052-3, 2006. a
Kurita, T.: Principal component analysis (PCA), in: Computer Vision: A Reference Guide, Springer, 1–4, https://doi.org/10.1007/978-3-030-03243-2_649-1, 2019. a, b, c
Leite, G. D. N. P., Araújo, A. M., and Rosas, P. A. C.: Prognostic techniques applied to maintenance of wind turbines: a concise and specific review, Renew. Sustain. Energ. Rev., 81, 1917–1925, https://doi.org/10.1016/j.rser.2017.06.002, 2018. a
Li, Y., Jiang, W., Zhang, G., and Shu, L.: Wind turbine fault diagnosis based on transfer learning and convolutional autoencoder with small-scale data, Renew. Energy, 171, 103–115, https://doi.org/10.1016/j.renene.2021.01.143, 2021. a
May, A., McMillan, D., and Thöns, S.: Economic analysis of condition monitoring systems for offshore wind turbine sub-systems, IET Renew. Power Generat., 9, 900–907, https://doi.org/10.1049/iet-rpg.2015.0019, 2015. a
May, N.: The impact of wind power support schemes on technology choices, Energy Econ., 65, 343–354, https://doi.org/10.1016/j.eneco.2017.05.017, 2017. a
McKinnon, C., Turnbull, A., Koukoura, S., Carroll, J., and McDonald, A.: Effect of time history on normal behaviour modelling using SCADA data to predict wind turbine failures, Energies, 13, 4745, https://doi.org/10.3390/en13184745, 2020. a
Microsoft: PCA-Based Anomaly Detection Component, https://docs.microsoft.com/en-us/azure/machine-learning/component-reference/pca-based-anomaly-detection, (last access: 7 March 2022), 2021. a
Motlagh, M. M., Bahar, A., and Bahar, O.: Damage detection in a 3D wind turbine tower by using extensive multilevel 2D wavelet decomposition and heat map, including soil-structure interaction, Structures, 31, 842–861, https://doi.org/10.1016/j.istruc.2021.01.018, 2021. a
Murgia, A., Verbeke, R., Tsiporkova, E., Terzi, L., and Astolfi, D.: Discussion on the Suitability of SCADA-Based Condition Monitoring for Wind Turbine Fault Diagnosis through Temperature Data Analysis, Energies, 16, 620, https://doi.org/10.3390/en16020620, 2023. a
Natili, F., Daga, A. P., Castellani, F., and Garibaldi, L.: Multi-Scale Wind Turbine Bearings Supervision Techniques Using Industrial SCADA and Vibration Data, Appl. Sci., 11, 6785, https://doi.org/10.3390/app11156785, 2021. a
Nguyen, C., Huynh, T., and Kim, J.: Vibration-based damage detection in wind turbine towers using artificial neural networks, Struct. Monit. Maint., 5, 507–519, https://doi.org/10.12989/smm.2018.5.4.507, 2018. a
Nguyen, T., Huynh, T., and Kim, J.: Numerical evaluation for vibration-based damage detection in wind turbine tower structure, Wind Struct., 21, 657–675, https://doi.org/10.12989/was.2015.21.6.657, 2015. a
Oliveira, M., Simas, E., Albuquerque, M., Santos, Y., da Silva, I., and Farias, C.: Ultrasound-based identification of damage in wind turbine blades using novelty detection, Ultrasonics, 108, 106166, https://doi.org/10.1016/j.ultras.2020.106166, 2020. a
Ou, Y., Chatzi, E. N., Dertimanis, V. K., and Spiridonakos, M. D.: Vibration-based experimental damage detection of a small-scale wind turbine blade, Struct. Control Health Monit., 16, 79–96, https://doi.org/10.1177/1475921716663876, 2017. a
Peres, R., Rocha, A., Leitao, P., and Barata, J.: IDARTS – Towards intelligent data analysis and real-time supervision for industry 4.0, Comput. Indust., 101, 138–146, https://doi.org/10.1016/j.compind.2018.07.004, 2018. a
Ratner, B.: Statistical and machine-learning data mining: Techniques for better predictive modeling and analysis of big data, in: 3rd Edn., CRC Press, Taylor & Francis Group, USA, ISBN 9781498797603, 2017. a
Ren, H., Liu, W., Shan, M., and Wang, X.: A new wind turbine health condition monitoring method based on VMD-MPE and feature-based transfer learning, Measurement, 148, 106906, https://doi.org/10.1016/j.measurement.2019.106906, 2019. a
Rezamand, M., Kordestani, M., Carriveau, R., Ting, D., and Saif, M.: A New Hybrid Fault Detection Method for Wind Turbine Blades Using Recursive PCA and Wavelet-Based PDF, IEEE Sensors J., 20, 2023–2033, https://doi.org/10.1109/JSEN.2019.2948997, 2020. a
Rodrigo, J. A.: Análisis de componentes princiaples PCA con Python, https://www.cienciadedatos.net/documentos/py19-pca-python.html (last access: 3 March 2022), 2020. a, b, c
Sabilla, S. I., Sarno, R., and Triyana, K.: Optimizing threshold using pearson correlation for selecting features of electronic nose signals, Int. J. Intell. Eng. Syst., 12, 81–90, 2019. a
Sezer, E., Romero, D., Guedea, F., Macchi, M., and Emmanouilidis, C.: An Industry 4.0-Enabled Low Cost Predictive Maintenance Approach for SMEs, in: IEEE International Conference on Engineering, Technology and Innovation (ICE/ITMC), 17–20 June 2018, Stuttgart, Germany, 1–8, https://doi.org/10.1109/ICE.2018.8436307, 2018. a
Shin, T.: An Extensive Step by Step Guide to Exploratory Data Analysis, https://towardsdatascience.com/an-extensive-guide-to-exploratory-data-analysis-ddd99a03199e (last access: 10 January 2022), 2020. a
Son, J., Kang, D., Boo, D., and Ko, K.: An experimental study on the fault diagnosis of wind turbines through a condition monitoring system, J. Mech. Sci. Technol., 32, 5573–5582, https://doi.org/10.1007/s12206-018-1103-y, 2018. a
Teng, W., Ding, X., Zhang, X., Liu, Y., and Ma, Z.: Multi-fault detection and failure analysis of wind turbine gearbox using complex wavelet transform, Renew. Energy, 93, 591–598, bhttps://doi.org/10.1016/j.renene.2016.03.025, 2016. a
Tibaduiza, D., Mujica, L., and Rodellar, J.: Comparison of several methods for damage localization using indices and contributions based on PCA, J. Phys.: Conf. Ser., 305, 012013, https://doi.org/10.1088/1742-6596/305/1/012013, 2011. a
Turnbull, A., Carroll, J., and McDonald, A.: A comparative analysis on the variability of temperature thresholds through time for wind turbine generators using normal behaviour modelling, Energies, 15, 5298, https://doi.org/10.3390/en15145298, 2022. a
Tutivén, C., Vidal, Y., Insuasty, A., Campoverde-Vilela, L., and Achicanoy, W.: Early fault diagnosis strategy for WT main bearings based on SCADA data and one-class SVM, Energies, 15, 4381, https://doi.org/10.3390/en15124381, 2022. a
Vanawat, N.: How To Perform Exploratory Data Analysis – A Guide for Beginners, https://www.analyticsvidhya.com/blog/2021/08/how-to-perform-exploratory-data-analysis-a-guide-for-beginners/ (last access: 10 January 2022), 2021. a
Velmurugan, R. S. and Dhingra, T.: Maintenance strategy selection and its impact in maintenance function: A conceptual framework, Int. J. Oper. Prod. Manage., 35, 1622–1661, https://doi.org/10.1108/IJOPM-01-2014-0028, 2015. a, b
Vidal, Y., Aquino, G., Pozo, F., and Gutiérrez-Arias, J. E. .: Structural health monitoring for jacket-type offshore wind turbines: Experimental proof of concept, Sensors, 20, 1835, https://doi.org/10.3390/s20071835, 2020. a
Wang, H., Wang, H., Jiang, G., Li, J., and Wang, Y.: Early fault detection of wind turbines based on operational condition clustering and optimized deep belief network modeling, Energies, 12, 984, https://doi.org/10.3390/en12060984, 2019. a
Wang, Q., Dong, Z., Li, R., and Wang, L.: Renewable energy and economic growth: new insight from country risks, Energy, 238, 122018, https://doi.org/10.1016/j.energy.2021.122018, 2022. a
Wang, T., Han, Q., Chu, F., and Feng, Z.: Vibration based condition monitoring and fault diagnosis of wind turbine planetary gearbox: A review, Mech. Syst. Signal Process., 126, 662–685, https://doi.org/10.1016/j.ymssp.2019.02.051, 2019. a
Wang, X., Zhang, L., and Heath, W. P.: Wind turbine blades fault detection using system identification-based transmissibility analysis, Insight, 64, 164–169, https://doi.org/10.1784/insi.2022.64.3.164, 2022. a
Wenske, J.: Wind Turbine System Design. Volume 1: Nacelles, drivetrains and verification. Editorial, IET –Institution of Engineering and Technology, https://doi.org/10.1049/PBPO142F, 2022. a
Xiang, L., Wang, P., Yang, X., Hu, A., and Su, H.: Fault detection of wind turbine based on SCADA data analysis using CNN and LSTM with attention mechanism, Measurement, 175, 109094, https://doi.org/10.1016/j.measurement.2021.109094, 2021. a, b
Xiuli, L., Xueying, Z., and Liyong, W. : Fault diagnosis method of wind turbine gearbox based on deep belief network and vibration signal, IEEE, SICE, Measurement, 148, 1699–1704, https://doi.org/10.1016/j.measurement.2019.106906, 2018. a
Yao, J., Liu, C., Song, K., Feng, C., and Jiang, D.: Fault diagnosis of planetary gearbox based on acoustic signals, Appl. Acoust., 181, 108151, https://doi.org/10.1016/j.apacoust.2021.108151, 2021. a
Yii, K. J. and Geetha, C.: The nexus between technology innovation and CO2 emissions in Malaysia: Evidence from granger causality test, Energ. Proced., 105, 3118–3124, https://doi.org/10.1016/j.egypro.2017.03.654, 2017. a
Zeng, X. J., Yang, M., and Bo, Y. F.: Gearbox oil temperature anomaly detection for wind turbine based on sparse Bayesian probability estimation, Int. J. Elect. Power Energ. Syst., 123, 106233, https://doi.org/10.1016/j.ijepes.2020.106233, 2020. a
Zhang, B., Zhang, F., and Luo, H.: Virtual shaft‐based synchronous analysis for bearing damage detection and its application in wind turbines, Wind Energy, 25, 1252–1269, https://doi.org/10.1002/we.2727, 2022. a
Zhang, P. and Lu, D.: A survey of condition monitoring and fault diagnosis toward integrated O&M for wind turbines, Energies, 12, 2801, https://doi.org/10.3390/en12142801, 2019. a
Zhang, Z., Verma,A., and Kusiak, A.: Fault analysis and condition monitoring of the wind turbine gearbox, IEEE, 27, 526–535, https://doi.org/10.1109/TEC.2012.2189887, 2012. a
Zhang, Z. Y. and Wang, K. S.: Wind turbine fault detection based on SCADA data analysis using ANN, Adv. Manufact., 2, 70–78, https://doi.org/10.1007/s40436-014-0061-6, 2014. a
- Abstract
- Introduction
- Wind park description
- Data description, acquisition, and analysis
- Data preprocessing
- Principal component analysis (PCA)
- Fault detection indicator (FDI)
- Results
- Conclusions
- Code availability
- Data availability
- Author contributions
- Competing interests
- Disclaimer
- Acknowledgements
- Financial support
- Review statement
- References