the Creative Commons Attribution 4.0 License.
the Creative Commons Attribution 4.0 License.
 | 29 Apr 2024
OC6 project Phase IV: validation of numerical models for novel floating offshore wind support structures
Will Wiley
Amy Robertson
Jason Jonkman
Cédric Brun
Jean-Philippe Pineau
Quan Qian
Wen Maoshi
Alec Beardsell
Joshua Cutler
Fabio Pierella
Christian Anker Hansen
Jie Fu
Lehan Hu
Prokopios Vlachogiannis
Christophe Peyrard
Christopher Simon Wright
Dallán Friel
Øyvind Waage Hanssen-Bauer
Carlos Renan dos Santos
Eelco Frickel
Hafizul Islam
Arjen Koop
Zhiqiang Hu
Jihuai Yang
Tristan Quideau
Violette Harnois
Kelsey Shaler
Stefan Netzband
Daniel Alarcón
Pau Trubat
Aengus Connolly
Seán B. Leen
Oisín Conway
This paper provides a summary of the work done within Phase IV of the Offshore Code Comparison Collaboration, Continued with Correlation and unCertainty (OC6) project, under International Energy Agency Wind Technology Collaboration Programme Task 30. This phase focused on validating the loading on and motion of a novel floating offshore wind system. Numerical models of a 3.6 MW horizontal-axis wind turbine atop the TetraSpar floating support structure were compared using measurement data from a 1:43-Froude-scale test performed in the University of Maine's Alfond Wind–Wave (W2) Ocean Engineering Laboratory. Participants in the project ran a series of simulations, including system equilibrium, surge offsets, free-decay tests, wind-only conditions, wave-only conditions, and a combination of wind and wave conditions. Validation of the models was performed by comparing the aerodynamic loading, floating support structure motion, tower base loading, mooring line tensions, and keel line tensions. The results show a relatively good estimation of the aerodynamic loading and a reasonable estimation of the platform motion and tower base fore–aft bending moment. However, there is a significant dispersion in the dynamic loading for the upwind mooring line. Very good agreement was observed between most of the numerical models and the experiment for the keel line tensions.
- Article
(3359 KB) - Full-text XML
- BibTeX
- EndNote


The objective of Phase IV of the Offshore Code Comparison Collaboration, Continued with Correlation and unCertainty (OC6) project is to evaluate the accuracy of load predictions and motions by modeling tools for a novel floating offshore wind turbine (FOWT).
The OC6 project is part of an ongoing effort under the International Energy Agency Wind Technology Collaboration Programme (IEA Wind) Task 30 to verify and validate offshore wind turbine modeling tools (IEA Wind, 2023). The foundational OC3 (Offshore Code Comparison Collaboration) project originated in 2005 as a verification of simulation tools capable of predicting the coupled dynamic loads and responses of FOWTs. Modeling tools that can accurately predict the loading are necessary to enable more reliable and optimized designs. The OC3 project (Jonkman and Musial, 2010) and its extension, the OC4 project (Jonkman et al., 2012; Robertson et al., 2013), focused on code-to-code comparisons for several fixed-bottom (monopile, tripod, jacket) and floating (spar buoy, semisubmersible) designs. The OC5 project (Robertson et al., 2015, 2016, 2017; Popko et al., 2018, 2019) compared simulation results to tank test data and measurements from a wind turbine in the Alpha Ventus offshore wind farm. The OC6 project focused on differences observed in previous projects between model predictions and measurements or phenomena not well understood. The first phase (Robertson et al., 2020; Wang et al., 2021) studied the loads associated with the slow-period surge and pitch motions in FOWTs, which are excited through nonlinear wave loading. The second phase (Bergua et al., 2022) focused on incorporating a more accurate soil–structure interaction model into the simulation tools that better represents the boundary conditions and damping in fixed-bottom systems. The third phase (Bergua et al., 2023) focused on validating the rotor aerodynamic loading for a FOWT undergoing large motions in the surge and pitch directions caused by the floating support structure. The implications of those large motions were also investigated for the near- and far-wake behavior (Cioni et al., 2023). The fourth phase is focused on validating the coupled dynamics of a novel floating wind turbine design with a streamlined floating support structure, which is different from traditional FOWT designs. It is also the first time, in these projects, that load predictions for the internal loading within the floating support structure are provided and compared to measurements.
Participants in OC6 Phase IV modeled a 1:43 scaled version of a 3.6 MW wind turbine atop the TetraSpar floating support structure designed by Stiesdal Offshore. The scaled model tested is representative of the full-scale demonstration project that was installed in Norway in July 2021 (Stiesdal Offshore, 2022). The testing campaign was performed by the University of Maine (Allen and Fowler, 2019). The OC6 Phase IV project followed a stepwise validation approach where the complexity was increased one step at a time to identify and understand potential differences between the experiment and the numerical models (validation) or differences between the numerical models (verification).
The group ran a series of simulations, including system equilibrium, surge offsets, free-decay tests, wind-only conditions, wave-only conditions, and a combination of wind and wave conditions. This paper summarizes the work done within the OC6 Phase IV project.
The organization of the remainder of the paper is as follows: Sect. 2 provides a description of the scaled model and the testing performed. Section 3 provides a description of the active participants involved in the OC6 Phase IV project and their modeling approach. Section 4 then summarizes the load cases that were performed for verification and validation. Finally, Sects. 5 and 6 provide some example results from the project and the conclusions drawn, respectively.
To validate the accuracy of predicting the loading and motion of a novel FOWT, measurement data were used from an experimental campaign conducted at the Harold Alfond Wind–Wave (W2) Ocean Engineering Laboratory of the Advanced Structures and Composites Center at the University of Maine (University of Maine, 2022) in December 2018 (Borg et al., 2019). All the quantities in this section are given at full scale, except when specified otherwise. The basin is 30 m long, 9 m wide, and 5 m deep (model scale) and is equipped with a 16-paddle wave maker opposite a beach and a bank of fans 7 m wide and 3.5 m tall (model scale). The testing used a 1:43-Froude-scale model of the 3.6 MW Siemens Gamesa wind turbine, with a rotor diameter of 129 m, atop the TetraSpar floating support structure (see Figs. 1a and 2a). The scaled model was thrust-matched, providing rotor thrust characteristics similar to the full-scale system in certain operating conditions. The configuration studied is representative of the one used in the full-scale demonstration project (Stiesdal Offshore, 2022).
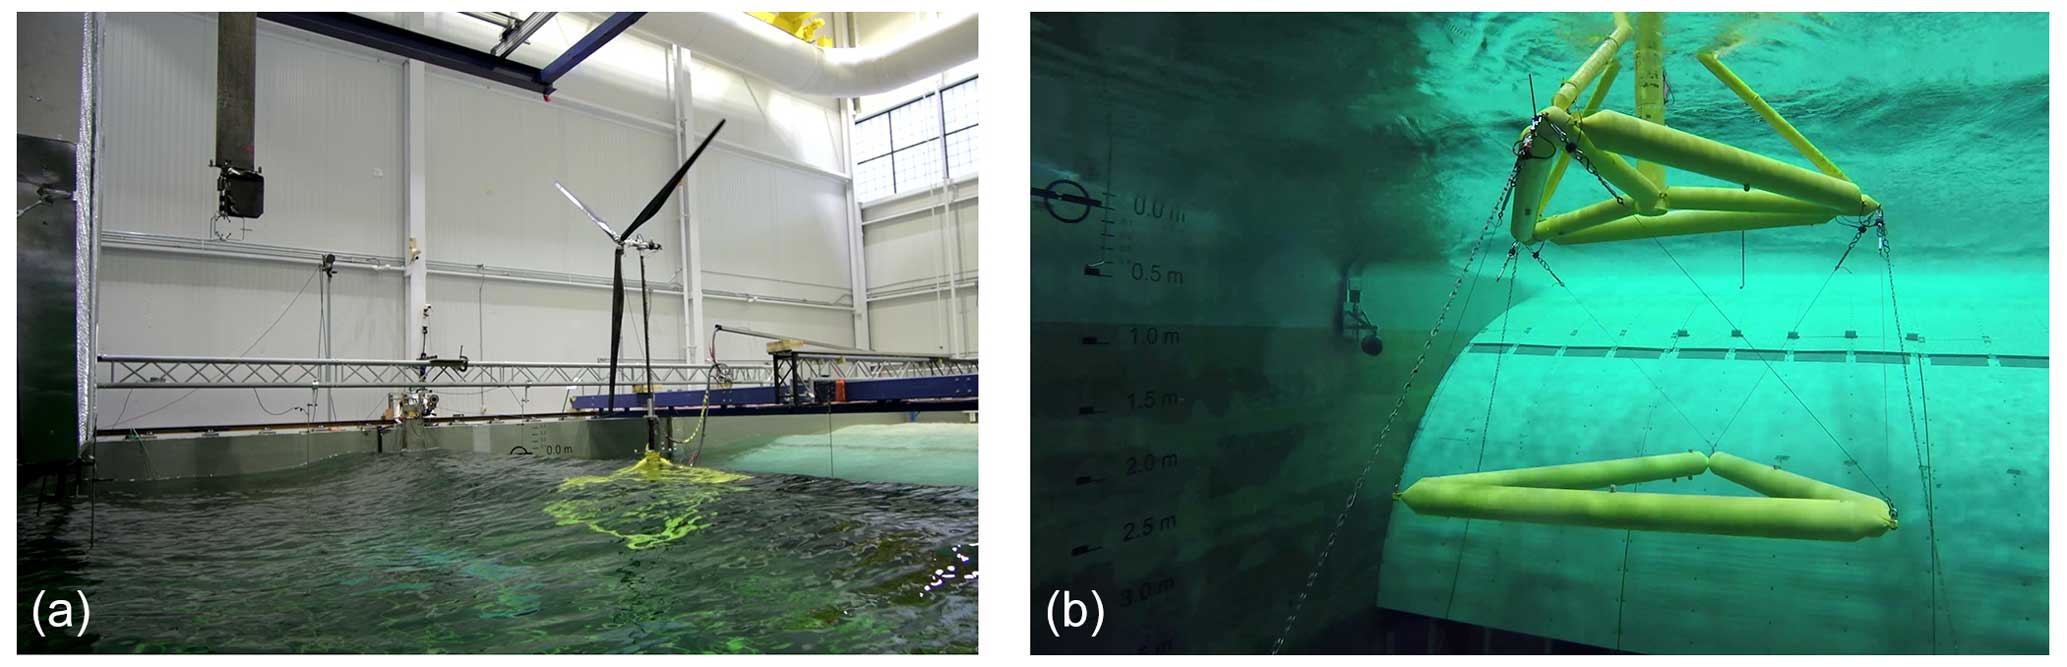
Figure 1(a) TetraSpar 1:43 scaled model during testing at the University of Maine. (b) Underwater view of the floating support structure. Pictures courtesy of the University of Maine.

Figure 2(a) Schematic representation of the model-scale system. (b) Perspective view of the TetraSpar floating support structure, with the nomenclature and coordinate system used in the project: CC, central column; DB, diagonal brace; HT, hull tri-brace; KL, keel line; KT, keel tri-brace; ML, mooring line; and RB, radial brace. (c) Top view of the TetraSpar floating support structure, with the coordinate system used in the project.
The TetraSpar is made of two separate structures: hull and keel (see Figs. 1b and 2b). The hull consists of a vertical central column directly beneath the wind turbine tower. At the base of the central column, there are three radial braces in the horizontal plane spaced 120° apart. Rigidity is given to this base with hull tri-braces and diagonal braces. The keel is made of three tri-braces in the horizontal plane. The hull has a tetrahedral shape, while the suspended keel has a triangular shape and acts as a system counterweight. Six taut cables, called keel lines, were used to link the buoyant hull and the ballasted keel. The floating support structure behaves as a rigid body when the keel lines remain in tension. The system features a spar-like stability with the whole system center of mass located below the center of buoyancy. The lower the center of mass, the higher the gravitational restoring moments in roll and pitch degrees of freedom. This behavior is achieved thanks to the location of the keel (37.9 m below the hull) and its large mass (80 % of the mass for the complete floating support structure).
All members are cylindrical tubes, and most of them are cone-shaped at one end (e.g., radial braces) or both ends (e.g., diagonal braces, hull tri-braces, and keel tri-braces). For reference, the hull tri-braces, keel tri-braces, and central-column cylinders are 4.3 m in diameter. The central column is 32.15 m long, the hull tri-braces are 52.18 m long, and the keel tri-braces are 64.30 m long. The hull center of mass is located 13.5 m b.m.s.l. (below mean sea level), while the keel center of mass is located 56.6 m b.m.s.l. The center of buoyancy of the floating support structure is located around 33.8 m b.m.s.l. along the central-column longitudinal axis. In the physical construction of the system (at both full scale and model scale), some members are linked by means of pin joints at one end (e.g., radial braces in the connection with the central column) or both ends (e.g., diagonal braces and hull tri-braces). The pin joints allow 1 rotational degree of freedom. This implies that bending moments in one direction would not be transferred through the kinematic joint, which would be an important consideration to study the loading within the hull. However, for this validation campaign, the structural properties (e.g., members' thickness distribution) were not known, and therefore it was not possible to assess such internal loading. Accordingly, participants considered the hull and keel to be distinct rigid bodies and only included the flexibility of the keel lines within the floater. The definition document of the OC6 Phase IV project (Wiley et al., 2023) provides information about the length and external diameter for all members (necessary to characterize the hydrostatic and hydrodynamic loads), the equivalent lumped mass and inertia for the hull and the keel to be included as rigid bodies, and the material properties for the keel lines. The total mass of the floating support structure (including the fairlead tension sensors) is 5.66×10⁶ kg, and the buoyancy is 6.13×10⁷ N. Due to the small water-plane area, the draft of the platform is very sensitive to the system mass and the support structure volume.
The mooring system consisted of three catenary mooring lines (ML1, ML2, and ML3 in Fig. 2b and c). Each of the three lines was made of two different sections: a lower section made of heavier chain and an upper section of lighter chain. The connection between the upper and lower chains for the upwind line (Mooring Line 2) was near the wave tank floor. This condition may be challenging for some numerical models (e.g., quasi-static mooring line models) because it makes the catenary equations more difficult to solve. The two downwind lines (Mooring Lines 1 and 3) had to be truncated in the testing due to space limitations in the wave tank. The same configuration was replicated in the numerical models. The water depth considered is 193.5 m. The upwind mooring line has a total length of around 700 m, while the two downwind lines are around 300 m in length.
During the testing, one umbilical cable was used to transfer data and power between the system and the carriage in the wave basin. The presence of this umbilical cable had a large impact on the surge restoring force relative to that of the mooring system. This resulted in a significant shift of the resting position, surge eigenfrequency, and system dynamics. One additional line was included in the numerical models to account for the umbilical cable. Detailed dimensions and properties for the mooring lines as well as the umbilical cable can be found in the definition document (Wiley et al., 2023).
The tower in the model test was made of aluminum and carbon fiber and was built to match a Froude-scaled first tower-bending eigenfrequency of the full-scale design. The sectional properties as well as the material properties are provided in the definition document (Wiley et al., 2023). The tower length was around 76 m, and its mass was 1.51×10⁵ kg. The resultant hub height was 88.27 m from the mean sea level. Hammer impact tests were performed to check the first tower-bending eigenfrequency. The rotor–nacelle assembly (RNA) was present in these tests. The first tower-bending frequency for a cantilevered condition (fixed–free) was 0.34 Hz in the fore–aft direction and 0.35 Hz in the side-to-side direction. For the floating-body (free–free) boundary condition, a higher tower-bending eigenfrequency is expected (but this was not tested directly).
The blades used in the testing were made of carbon fiber and were considered to be rigid in the numerical models. The blades were 61.1 m long and had a mass of 1.9×10⁴ kg. Information about the blade properties (e.g., twist, chord length, and airfoil thickness-to-chord ratio along the blade), airfoil polars (i.e., lift and drag coefficients for different angles of attack), blades' mass, and blades' center of gravity are provided in the definition document (Wiley et al., 2023). Properties of the nacelle as well as the complete RNA are also available in the definition document. The rotor shaft tilt angle was 0°, and the RNA mass was 2.62×10⁵ kg. The total mass for the system (RNA, tower, and floating support structure including the fairlead tension sensors) was 6.08×10⁶ kg, and the center of mass was located around 39.9 m b.m.s.l.
Table 1 shows the system damped natural frequencies for the floating system including the umbilical cable. These frequencies were obtained from free-decay tests performed in the platform's six degrees of freedom. The surge equilibrium position of the platform during the free-decay tests was significantly different (around 14 m more upwind) than the one observed in the wind and wave load cases, likely impacting the mooring stiffness. The reason for the different resting position is not known. When comparing the free-decay tests with and without the umbilical cable, the surge, sway, and yaw directions experienced significant changes in the damped natural frequencies (Wiley et al., 2023). These changes are due to the presence of the umbilical cable and the different resting positions with and without the umbilical cable. When comparing these two free-decay test configurations, it can be observed that the umbilical cable pulls the system around 17 m downwind.

The instrumentation that was used for the validation campaign measured structural loads (e.g., tower base bending moments, keel line tensions, and fairlead tensions in the mooring lines), motion (e.g., keel and hull six degrees of freedom), and environmental conditions (e.g., wave elevation and wind speed). Table 2 provides a summary of the instrumentation used. A complete list of the sensors used during the experimental campaign is also available in the definition document (Wiley et al., 2023).
Table 2Summary of instrumentation used within the OC6 Phase IV project.
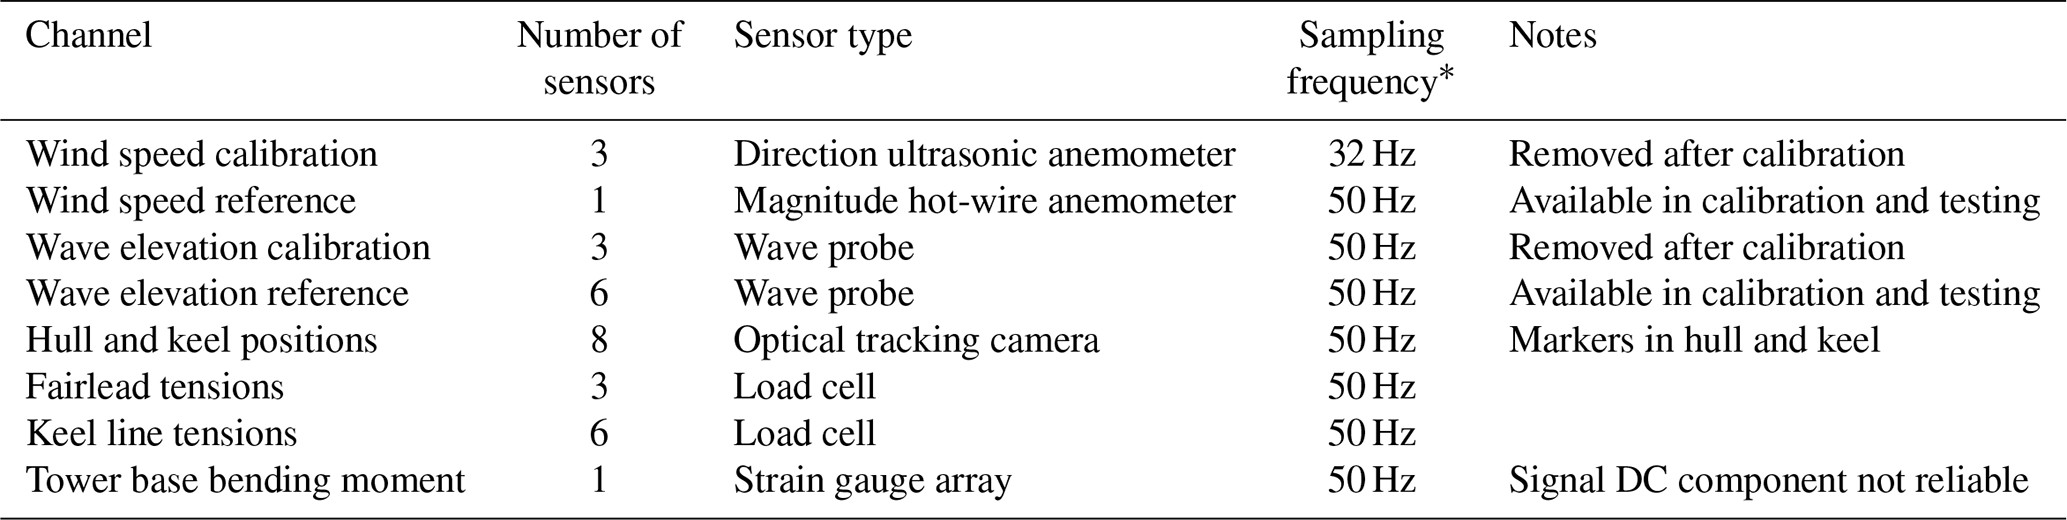
* Sampling frequency at model scale.
A total of 17 academic and industrial partners from 10 different countries participated in the OC6 Phase IV project. Those actively involved were Bureau Veritas (BVMO, France), the China State Shipbuilding Corporation (CSSC, China), Det Norsk Veritas (DNV, United Kingdom), the Technical University of Denmark (DTU, Denmark), the Dalian University of Technology (DUT, China), Électricité de France (EDF, France), Gavin & Doherty Geosolutions (GDG, Ireland), the Institute for Energy Technology (IFE, Norway), the Maritime Research Institute Netherlands (MAR, the Netherlands), the National Renewable Energy Laboratory (NREL, United States of America), Newcastle University (NU, United Kingdom), PRINCIPIA (PRI, France), Shell (SHELL, United States of America), the Hamburg University of Technology (TUHH, Germany), Universitat Politècnica de Catalunya (UPC, Spain), and Wood Group Kenny and University of Galway (together referred to as W&UG, Ireland).
The system studied in OC6 Phase IV requires a coupled aero-hydro-elastic approach. The participants used modeling approaches of different fidelity for the structural dynamics, aerodynamics, and hydrodynamics. Some participants decided to use more than one modeling approach, and some used different codes. A total of 19 numerical models were involved in this study. A list of the participants, codes, and the structural approach adopted is provided in Table 3. Most participants included the tower and keel line flexibility in their numerical models and could obtain the internal loading. Participants modeled the tower using a finite-element model (e.g., by means of a beam theory). Several participants then performed a modal reduction (e.g., the Craig–Bampton method; Craig and Bampton, 1968) to improve the computational efficiency. Different approaches can be adopted to model the keel lines depending on the code capabilities – for example, from higher to lower fidelity, cable elements, nonlinear springs, linear springs, or slender beams. Cable elements yield forces in tension and account for the proper mass distribution and line sagging. The nonlinear spring approach can potentially reproduce the same stiffness behavior, but the cable mass distribution is not included. Unlike the nonlinear spring approach, the linear springs yield forces in tension and compression (which is unphysical). The slender beam approach can provide the desired linear axial stiffness under tension and distributed mass. However, it also yields forces at compression and introduces some small stiffness in undesired directions (e.g., shear, bending, and torsion) not seen in the keel lines. Slack events in the keel lines require the use of a nonlinear approach (e.g., cable elements or nonlinear springs). However, potential slack in the keel lines was not observed during the testing (Borg et al., 2019), and any of the above proposed approaches should provide similar results.
Table 3Summary of participants, codes, and structural approach.
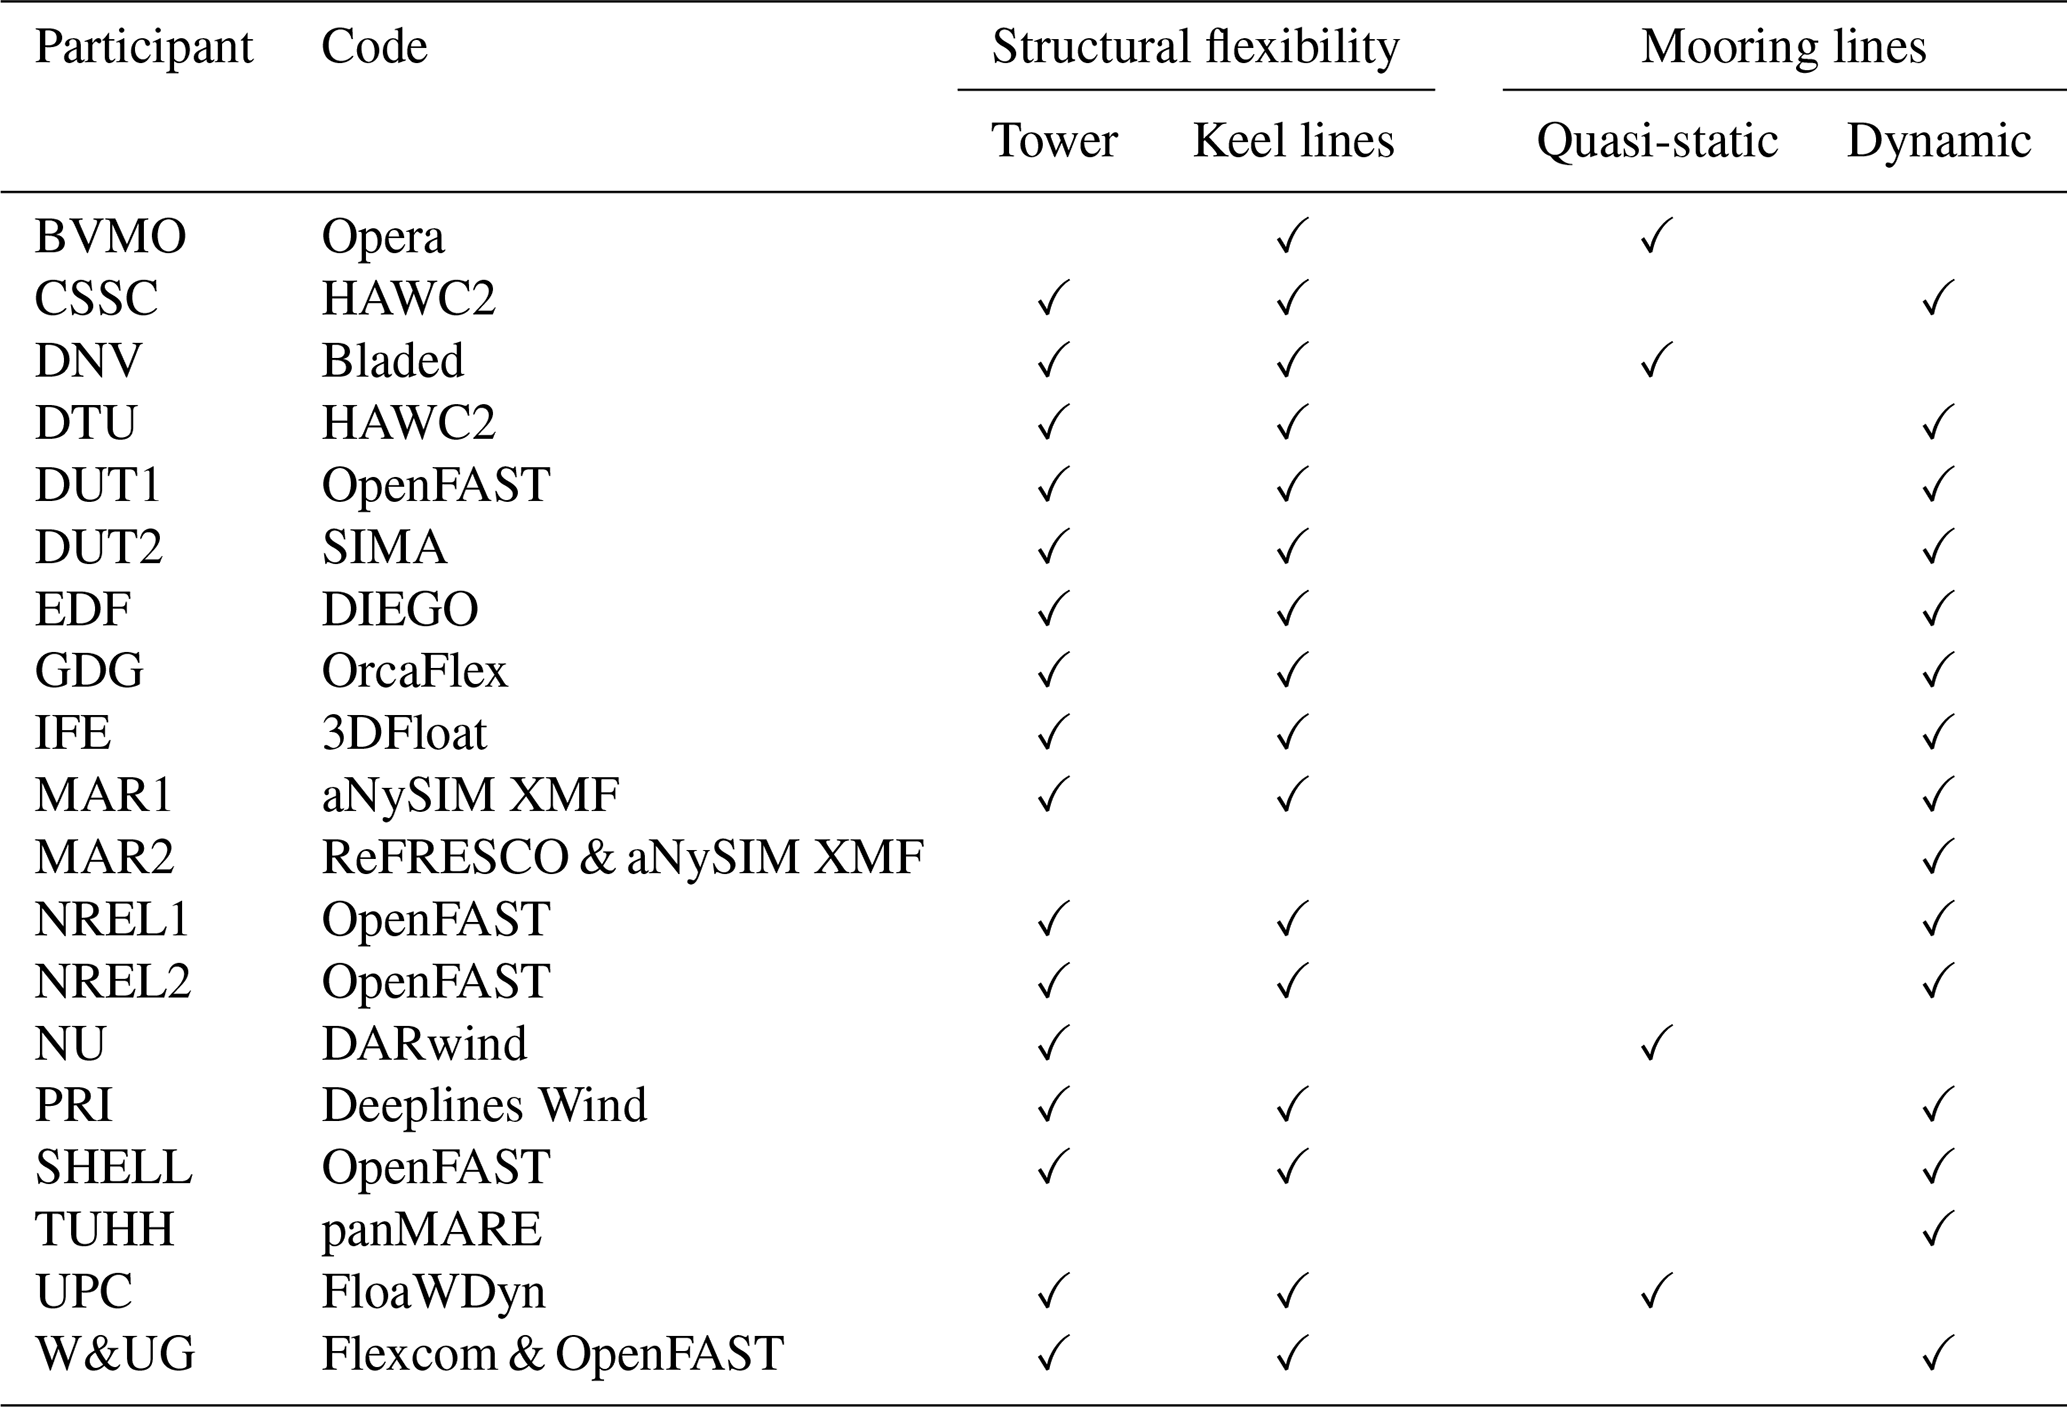
NREL used two numerical models (NREL1 and NREL2) with the only difference being the structural approach adopted. Similarly to OC6 Phase II (Bergua et al., 2022), NREL1 models the tower in the ElastoDyn module and the substructure (i.e., floater) in the SubDyn module, while NREL2 models the tower and substructure in the SubDyn module. The SubDyn module of OpenFAST (Jonkman et al., 2023) makes use of a modal reduction. When performing a modal reduction by means of the Craig–Bampton approach for a fixed-bottom system (e.g., system studied in the OC6 Phase II project) in SubDyn, the Guyan modes (also known as boundary modes) provide information about the static deflection and the Craig–Bampton modes (also known as internal or normal modes) provide information about the inherent dynamics. The Guyan modes are obtained with the interface node free, whereas the Craig–Bampton modes are obtained with the interface node fixed. When computing the Guyan and Craig–Bampton modes, the bottom (reaction node) is fixed or it accounts for the foundation compliance. For a floating system, the formulation is different (see Jonkman et al., 2023, for more details). In this case, the Guyan modes capture the rigid-body motion because there is no reaction node, and the Craig–Bampton modes (interface node fixed) capture the elastic modes. For a floating system, the elastic modes and the applied loads (e.g., gravitational loading, hydrostatic loading, hydrodynamic loading) in OpenFAST are expressed in a floating frame of reference. Currently, for a floating system in OpenFAST, the hydrostatic and external gravitational loads are computed based on the rigid-body motion (Guyan modes), the hydrodynamic loads are computed based on the rigid-body and elastic velocities and accelerations, and the mooring loads are computed based on the combined Guyan and Craig–Bampton modes (i.e., rigid-body motion and elastic deflections in the substructure). When modeling floating systems in OpenFAST, avoiding including structural parts in SubDyn that experience significant elastic deflections is recommended. Accordingly, the NREL2 model can be considered of lower fidelity than NREL1. Other participants using the OpenFAST code (e.g., DUT1 and SHELL) adopted a similar approach to NREL1. W&UG included the structural part in Flexcom rather than OpenFAST. Flexcom does not perform a modal reduction but instead computes the solution in the time domain using a direct integration method.
Most participants used a dynamic approach to account for the mooring lines in their numerical models (Table 3). The mooring line dynamic approach is usually based on a lumped mass approach where the lines are discretized into concentrated masses connected by massless springs with dampers in parallel. Only four participants (BVMO, DNV, NU, and UPC) used a quasi-static approach. For BVMO, NU, and UPC, the quasi-static approach relies on catenary formulations to compute the mooring line shape and tension at every time step, assuming instantaneous static equilibrium. DNV used a pre-computed lookup table with the quasi-static fairlead forces based on horizontal and vertical displacements. The main disadvantage of the quasi-static approach is that it neglects the mooring line inertial forces and the hydrodynamics (e.g., drag and added mass). The quasi-static approach may have difficulties reproducing the proper behavior when the line experiences significant motions or dynamic events (e.g., snap loads when a line becomes slack and it is suddenly under tension again, as observed in the OC5 Phase II project; Robertson et al., 2017).
Table 4 provides a list of the participants, codes, and aerodynamic approaches used. Participants in the project used models of different fidelity: blade element momentum (BEM) theory, free-vortex-wake (FVW) methods, and computational fluid dynamics (CFD). All BEM and FVW models used by participants are based on the lifting-line theory. The airfoil polar data provided in the definition document were used as input for these numerical models. The BEM approach relies on several corrections (e.g., dynamic inflow, skewed wake, blade-root and blade-tip losses, unsteady airfoil aerodynamics) to address the rotor aerodynamics and subsequent loads in different wind turbine operating conditions. Higher-fidelity models like FVW and CFD inherently account for these effects and are better suited to the study of situations like skewed flow caused by yawed inflow or rotor tilt. Moreover, these higher-fidelity models can provide insights about the wake behavior. MAR2 used a blade-resolved CFD approach and a surface mesh based on the blade geometry provided by the University of Maine.
Table 4Summary of participants, codes, and aerodynamic approach.
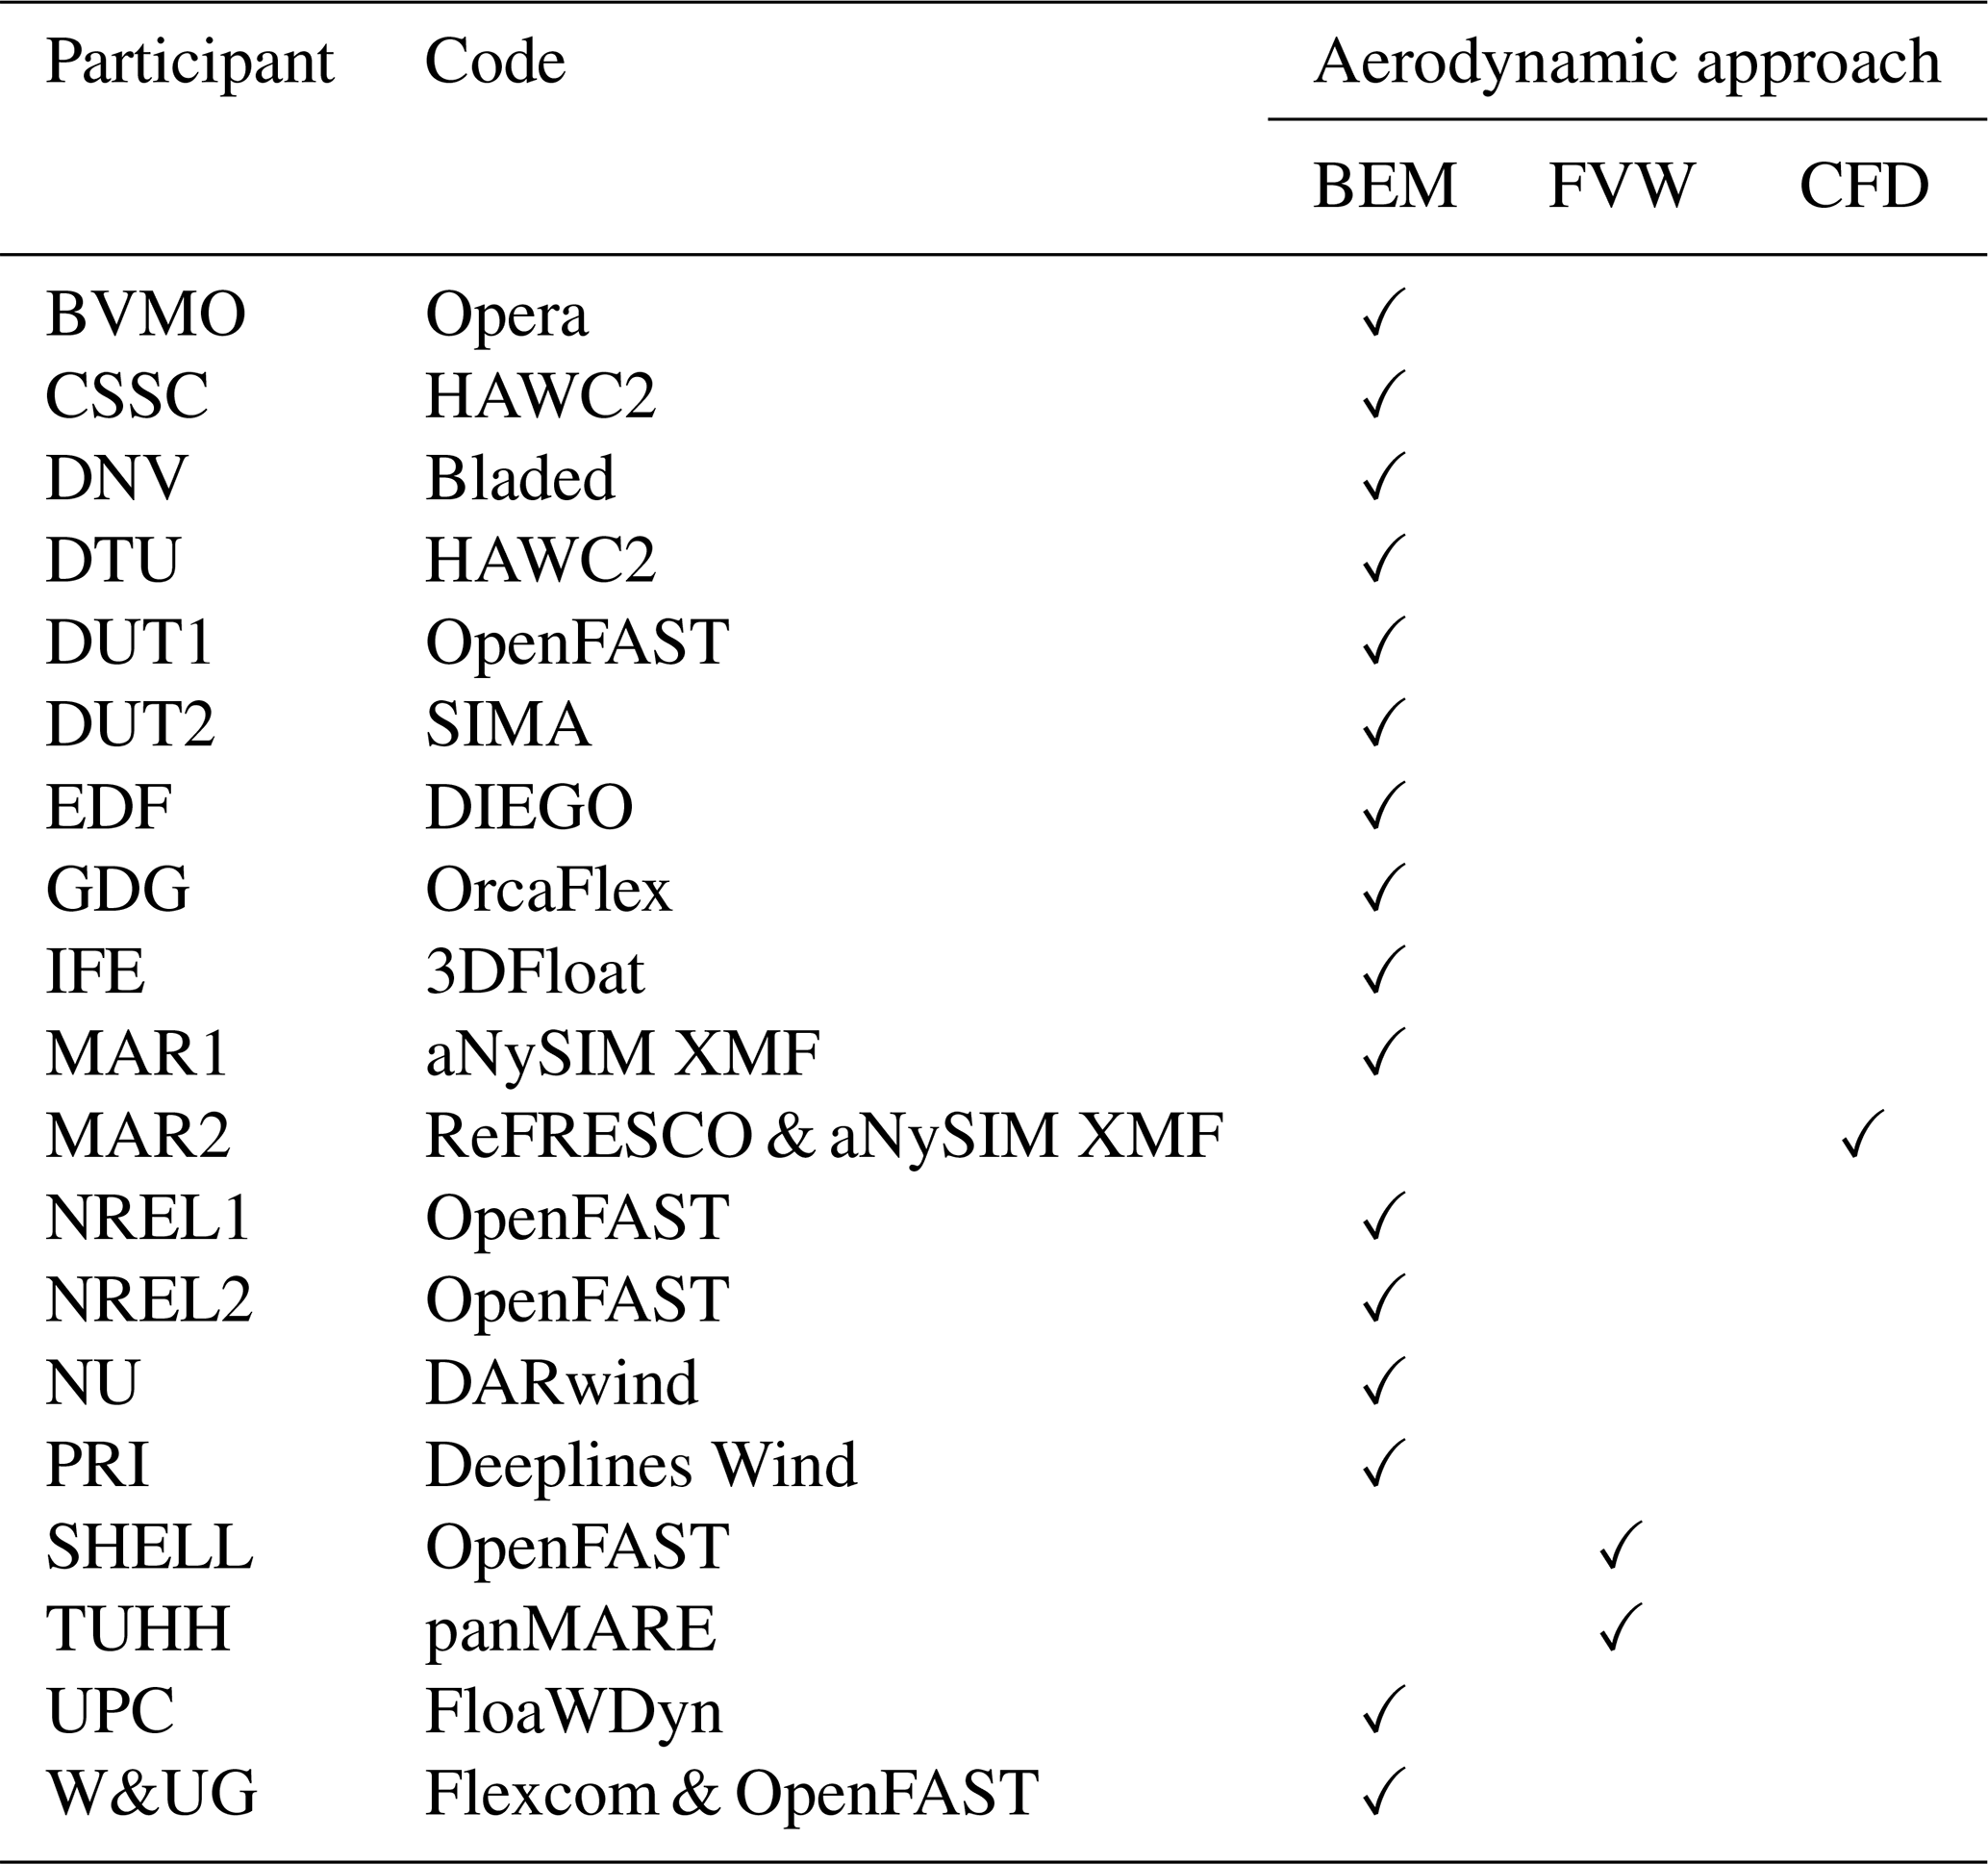
The numerical model used by SHELL was the same numerical model used by NREL1. The only difference was in terms of the aerodynamic model. SHELL used a FVW approach, whereas NREL used a BEM approach. For wind turbines in operating conditions, it was expected that SHELL and NREL1 would provide different responses due to the different aerodynamic approach. When the wind turbine is in idling or parked conditions, the aerodynamic induction model is disabled, and SHELL and NREL1 models should provide the same response.
The TetraSpar floating support structure is made of slender members. Due to the slender nature of the system, it is possible to use strip theory (e.g., using Morison's equation) to model the hydrodynamic loading. However, the Morison equation is more suitable for simple geometries, and the different junctions at the end of the braces could challenge the load estimation. For a floating system, it is necessary to account for the relative form of the Morison equation. Assuming, for the sake of simplicity, that the fluid and structure velocity are collinear and normal to the member, the relative form of the Morison equation can be expressed as Eq. (1).
where F is the force per unit length, uw is the fluid velocity, us is the structure velocity, is the fluid acceleration, is the structure acceleration, D is the cylinder outer diameter, ρ is the fluid density, Cd is the drag coefficient, Cp is the wave dynamic pressure coefficient (1 for circular members), and Ca is the added mass coefficient. The inertia coefficient (Cm) is related to the added mass and the wave dynamic pressure coefficients as follows: .
The first term in Eq. (1) corresponds to the drag force (that includes wave excitation forcing and damping), the second term corresponds to the Froude–Krylov force, the third term is the scattering force, and the fourth term is the added mass component. The combination of Froude–Krylov and scattering forces can also be referred to as the fluid inertia force.
Alternatively, it is possible to study the system by means of the boundary element method based on the potential-flow theory. In general, this method is used for large-volume structures and assumes small motions around the equilibrium position. The hydrodynamic properties are obtained in the frequency domain in tools like WAMIT (Lee and Newman, 2006), NEMOH (Babarit and Delhommeau, 2015), or HAMS (Liu, 2019) that compute the wave diffraction and radiation for three-dimensional floating structures.
Table 5 shows a comparison between strip theory and potential-flow theory. The potential-flow theory does not include viscous drag effects. To overcome this limitation, it is possible to use a hybrid model that accounts for the radiation–diffraction solution from the potential-flow theory augmented with Morison-based elements for the drag forces.

Table 6Summary of participants, codes, and hydrodynamic approach (ME, Morison equation; PF, potential flow; CFD, computational fluid dynamics).
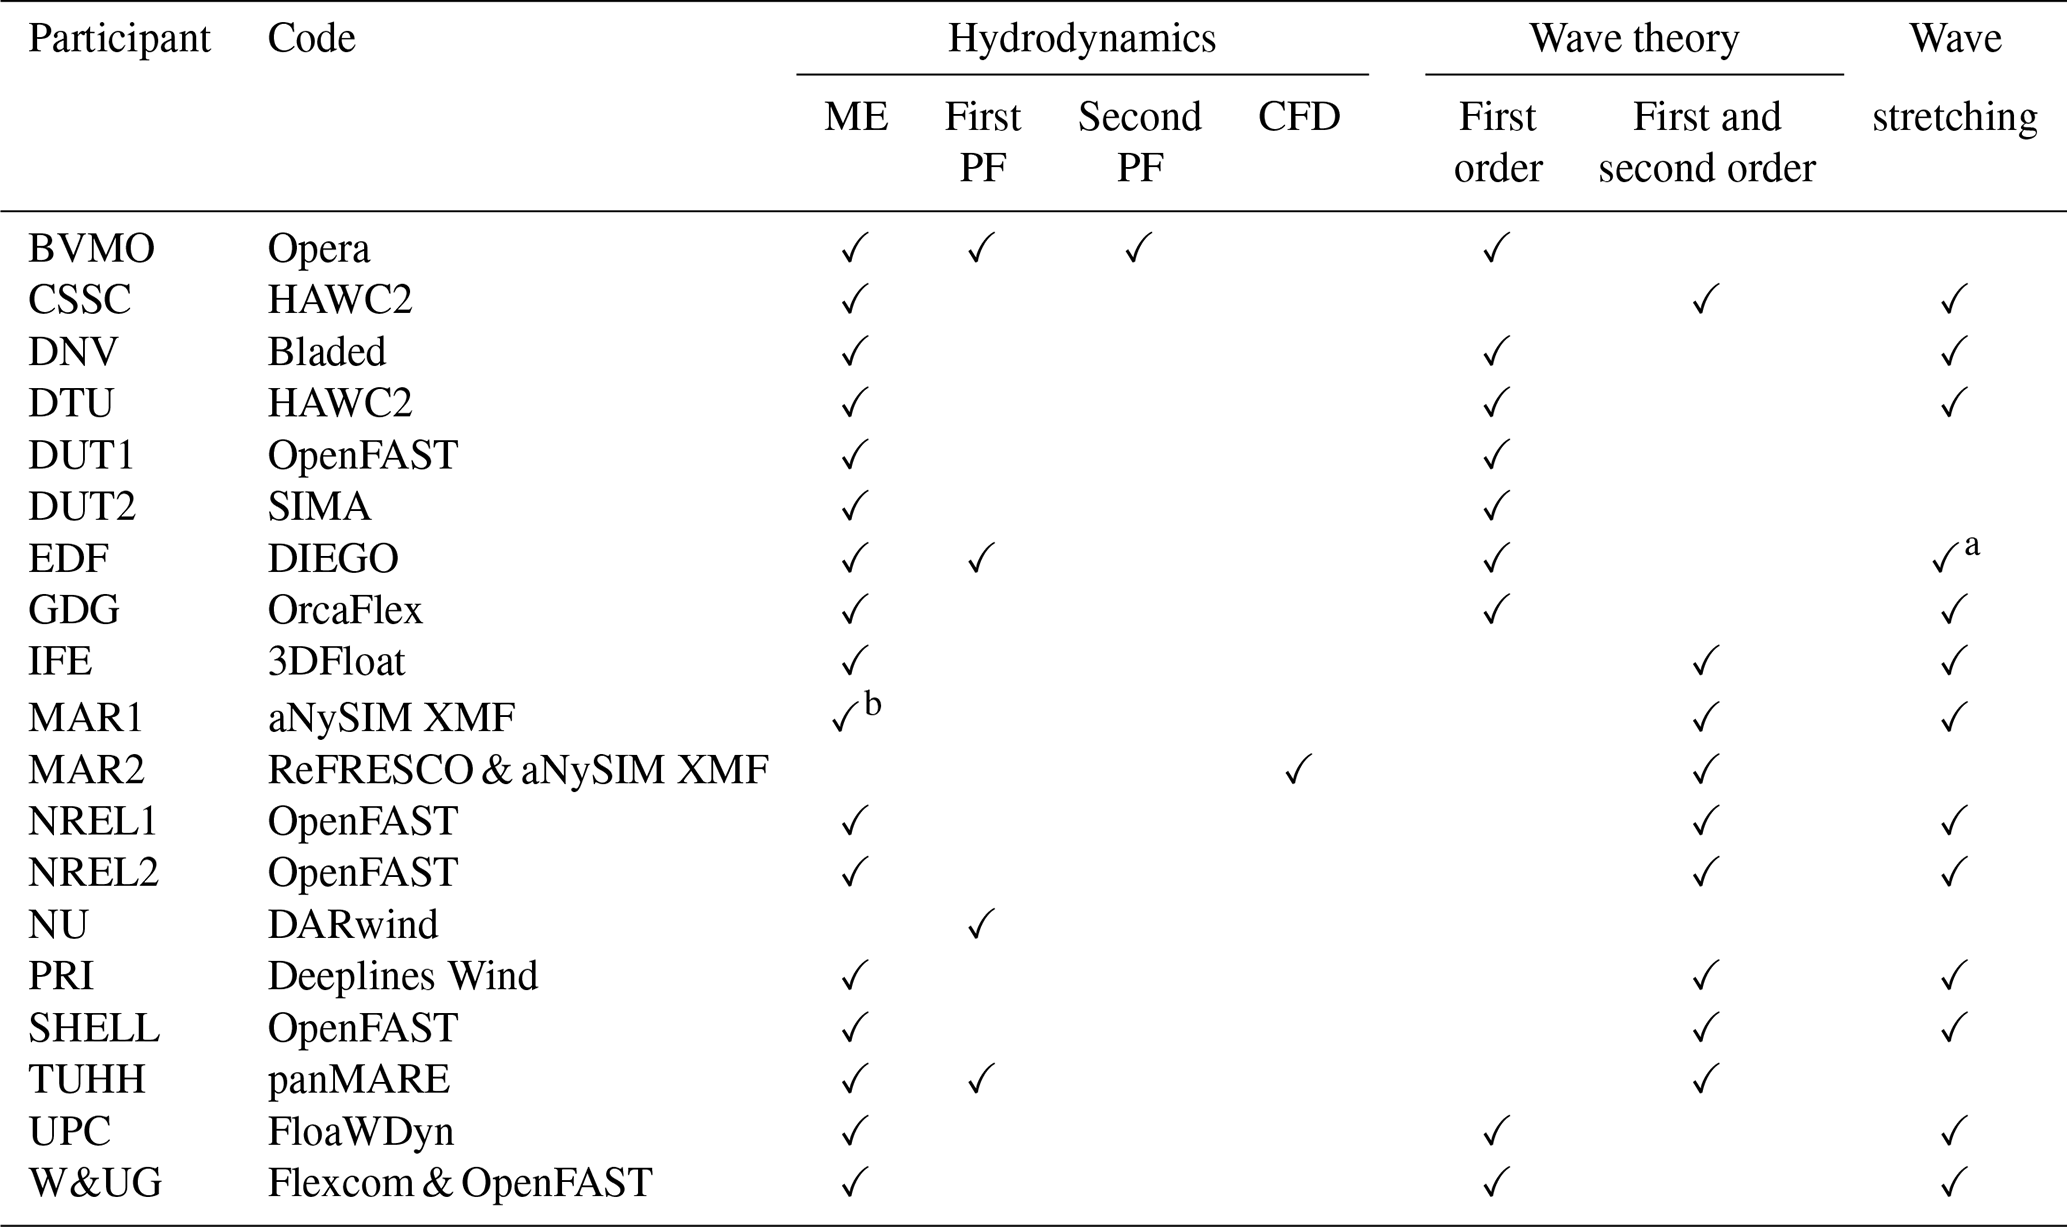
a Only included in irregular wave conditions. b Morison-based elements for the hull only account for the drag and Froude–Krylov forces. The added mass, scattering forces, and linear damping are obtained from a hydrodynamic database based on a potential-flow solution. It can be considered a hybrid model.
Table 6 provides a list of the participants, codes, and the hydrodynamic approach used. Most participants modeled the TetraSpar system by means of the Morison equation. Participants using the potential-flow theory, except NU, included the viscous drag component from Morison-based members. One participant (BVMO) used the linear potential-flow data for radiation and diffraction and added the second-order sum and difference frequency forces. These second-order terms (second PF) are nonlinear effects able to excite the floating system out of the wave linear region (covered by the first PF). The difference frequency forces account for the low-frequency range, including the mean and slow drift. The sum frequency forces can excite the floating system above the linear wave region. It is also important to note that the TetraSpar design has two bodies: hull and keel. It is common practice for the potential-flow method to assume rigid-body motion and apply the hydrostatic and hydrodynamic loads lumped at a point. However, to obtain the loads at the keel lines, it is necessary to discretize the system into at least two bodies. Some participants using the potential-flow method included two potential-flow bodies in their numerical models, while others included the hull as a potential-flow body and the keel as Morison elements.
Some participants used a linear hydrostatic stiffness while others used a nonlinear hydrostatic stiffness. Participants using the potential-flow theory (NU) and one participant using the hybrid approach (BVMO) included a linear hydrostatic stiffness computed at the undisplaced platform position. Some participants using the hybrid approach (EDF, TUHH) or the strip theory (DUT1, DUT2) computed the nonlinear hydrostatics at the instantaneous platform position up to the mean sea level. Most participants using the strip theory (CSSC, DNV, DTU, GDG, IFE, MAR1, NREL, PRI, SHELL, UPC, W&UG) and CFD (MAR2) computed the nonlinear hydrostatics at the instantaneous platform position up to the wetted surface.
Regarding the wave theory used, some participants used a linear superposition of Airy waves while others also included second-order wave kinematics (Sharma and Dean, 1981). In addition, wave stretching allows for the wave kinematics and hydrodynamic loads to be computed at all nodes up to the instantaneous free surface, unlike linear models without wave stretching, which compute wave kinematics and loads at nodes up to the mean sea level regardless of a wave crest or trough at a given time. Second-order wave kinematics and wave stretching are an extension to the strip-theory solution, and it is only considered by the Morison equation and hybrid models. Participants with Morison-based elements in their models used different wave stretching theories: vertical (EDF, GDG, IFE, NREL, SHELL), extrapolation (W&UG), and Wheeler (CSSC, DNV, DTU, MAR1, PRI, UPC).
Some participants (IFE, MAR1, NREL, PRI, SHELL, TUHH, and UPC) prescribed the wave elevation time series recorded during the experiment in their simulations, while other participants prescribed the wave spectrum or used statistical information to generate the waves (potentially with random phasing that did not match the experiment).
The information provided in Tables 3, 4, and 6 indicates the modeling approach adopted by each participant. The codes may have other capabilities not used in this project.
Numerical models were built at full scale, and the results, as well as the measurements and discussion, are presented at full scale using Froude scaling to upscale the measurements. MAR2, the only participant using a CFD code, simulated the system at model scale and upscaled the results using Froude scaling before providing them for comparison. This may allow the CFD approach to capture physics that are scale-dependent.
A stepwise validation procedure was performed in the OC6 Phase IV project that took advantage of the experimental campaign carried out by the University of Maine. The testing campaign used an open-loop control approach, where the rotor speed and the blade pitch angle were held constant. This configuration disregards potential dynamic effects due to the interactions between the rotor, the platform motions, and the wind turbine controller that could be present in a closed-loop approach.
Table 7 provides a summary of the simulations that are presented in Sect. 5, including the system equilibrium (Load Case 1.1), wind-only condition for rated thrust considering the floating system (Load Case 3.1) and a fixed boundary condition at the tower base (Load Case 3.4), wave-only conditions considering regular waves (Load Case 4.1), wave-only conditions considering irregular waves (Load Cases 4.2, 4.3, and 4.4), and a combination of wind and wave conditions (Load Cases 5.2, 5.3, and 5.4). The description provided in Table 7 for the wave-only conditions (e.g., rated, post-rated condition) corresponds to the representative sea state for a given wind condition.
Table 7OC6 Phase IV load case simulations (summary).

H: regular wave height; Hs: significant wave height; T: regular wave period; Tp: peak spectral wave period; γ: peak-enhancement factor; Vhub: average hub-height wind speed; TI: turbulence intensity; Ω: rotor speed; β: blade pitch angle; t: time.
Load case numbering is consistent with past phases of the OC3–OC6 projects. Some numbers are skipped because Table 7 only includes the load cases presented in Sect. 5. The list of all load cases studied can be found in the definition document (Wiley et al., 2023).
The system equilibrium was studied based on the initial measurements during the testing when the wind or wave loading had not yet been applied. During the testing, significant differences in the surge and heave resting positions were observed before applying wind and wave loads, depending on the load case (between −6.7 and +6.4 m in surge and 4 m range in heave from the origin of the coordinate system used). This introduces a significant uncertainty into the experimental results that may also impact the tension observed in the mooring lines, especially in Mooring Line 2. It is known that the umbilical cable used during the testing significantly moved the system downwind (by around 31 m compared to the resting position without the umbilical cable during the free-decay tests). This behavior is also replicated in the numerical models when including the umbilical cable in the system. However, this large surge offset is less than ideal. The umbilical cable, as well as the friction of the mooring lines with the bottom of the wave tank, could be introducing some hysteresis that may result in the different system resting conditions observed during the testing. The different position of the floating system also impacts the mooring system stiffness. For Load Case 1.1, participants considered still-water conditions in their numerical models and reported the static equilibrium of the system.
Load Cases 3.X were used to characterize the wind turbine aerodynamic thrust force. In Load Cases 3.1 and 3.4, the mean wind speed at the hub height was 9.89 m s−1 and the turbulence intensity was 2.4 %. The goal in the testing was to achieve a uniform inflow wind in the rotor area. The wind field generated did not cover the region next to the water (e.g., floater) due to the location of the fans. For Load Cases 3.X, participants considered spatially uniform steady winds and did not account for the aerodynamic drag in the floating support structure. During the testing, the rotor speed was kept constant at 12.2 rpm, and the blade pitch angle was set to −6.2° to match the target aerodynamic rotor thrust using the tower base bending moment as a proxy sensor. It is likely that the resultant aerodynamic thrust force during the testing in the wave basin with the blade pitch at 0° was not enough to match the target thrust, and it was decided to decrease the blade pitch angle. For a given wind speed and rotor speed, decreasing the blade pitch angle results in higher angles of attack. For the blade pitch angle of −6.2°, the angles of attack along the blade (e.g., from 25 % blade span to the blade tip) are mainly in the airfoil polars' nonlinear region (e.g., angles of attack between 9 and 14°). This means that the aerodynamic working point is around the stall region.
Load Cases 4.X were used to characterize the hydrodynamics of the system. These load cases were wave-only conditions with the system being loaded by waves, no inflow wind, and a parked wind turbine condition. Load Case 4.1 considered a regular wave for a severe sea state that can be considered representative of the wind turbine operating in the post-rated region. The regular wave height considered was 8.31 m, and the regular wave period was 12.41 s. Load Cases 4.2, 4.3, and 4.4 considered irregular waves. Load Case 4.2 can be considered a moderate sea state representative of the wind turbine operating in the rated region, while Load Case 4.3 can be considered a severe sea state representative of post-rated conditions. Load Case 4.4 addressed the system response for an extreme storm condition with a 50-year return period. The significant wave height and peak spectral wave period for these three irregular wave conditions are available in Table 7. In the definition of the testing campaign, the Torsethaugen wave spectrum was used. The Torsethaugen spectrum is a double-peaked wave spectrum model, best suited to North Sea conditions (Torsethaugen and Haver, 2004). When computing the wave spectrum from the measured waves, it was observed that the spectrum mainly featured one peak. Given the popularity and availability of the JONSWAP wave spectrum in the codes used by participants, it was decided to also provide the peak-enhancement factor to reproduce the proper wave elevation distribution by means of the JONSWAP spectrum (see Table 7). For reference, the definition document (Wiley et al., 2023) shows the comparison between the measured wave spectrum, the Torsethaugen spectrum, and the JONSWAP spectrum. Participants using statistical information to generate the irregular waves could use the JONSWAP or the Torsethaugen spectrum parameters available in the definition document.
Load Cases 5.X dealt with the system response for the combined wind and waves that were studied separately in Load Cases 3.X and Load Cases 4.X. For these load cases, participants considered spatially uniform unsteady winds based on the measured hub-height wind speed in the x direction.
Testing the 50-year storm condition with wind (e.g., Load Case 5.4) presented some challenges due to large platform sway and yaw offsets in the system. This behavior was not representative of the physical full-scale response. Froude scaling results in low Reynolds numbers and poor aerodynamic performance, often requiring chord lengths larger than the geometrically scaled values would suggest. It may be that the large chord lengths used along the scaled blades resulted in higher-than-expected resultant rotor radial loads in idling conditions. To limit the sway and yaw motion during the testing in the wave basin, a yaw stiffness bridle was added for these load cases. Additional insights about this arrangement can be found in the definition document (Wiley et al., 2023). When simulating the system with the rotor in idling conditions and the yaw bridle in place, several participants (e.g., DNV, DTU, NREL, W&UG) reported instability issues in their numerical models. The wind turbine experienced a coupled motion that involved the sway, roll, and yaw degrees of freedom. During idling conditions (89° blade pitch angle), disabling the aerodynamic induction model is recommended. Moreover, it is also recommended that the unsteady airfoil aerodynamics are disabled because the angles of attack along the blade are significant, placing the aerodynamic model in deep-dynamic-stall conditions where the conventional unsteady aerodynamic theory is not valid. The instabilities observed in some numerical models decreased when following these recommended practices, but they did not completely disappear. Some participants (e.g., DNV, DTU, NREL) decided to impose a constant rotor speed of 0.7 rpm to get rid of this instability. W&UG applied a higher axial stiffness to the yaw bridle (2 orders of magnitude stiffer) to alleviate these effects.
During the testing, the wind speed was measured by means of a hot-wire anemometer. The hot wire was located around 1.5 rotor diameters in front of the wind turbine rotor, at of the hub height, and a blade radius sideways. When looking at the recorded wind speed during Load Case 3.1, it was observed that the mean wind speed was 9.37 m s−1 (−5.0 %) instead of the expected 9.86 m s−1 from the calibration process performed without the wind turbine (ultrasonic anemometer placed at the hub-height location). Similarly, the recorded mean wind speed in Load Case 5.2 was 10.67 m s−1 (+8.2 %). In Load Case 5.3, the measured wind speed also deviated from the expected value (27.18 m s−1 (+8.2 %) instead of 24.05 m s−1). Participants in the project used the wind speed values recorded during the calibration process (Table 7) as input for their numerical models.
In this section, a comprehensive overview of the studied load cases shown in Table 7 is presented. Results for the aerodynamic loading, floating support structure motion, tower base loading, upwind fairlead tension, and keel line tensions are discussed.
5.1 Aerodynamic loading
Load Cases 3.X focus on ensuring that the aerodynamic models were implemented correctly. During the experimental testing in Load Case 3.1, the blade pitch angle was adjusted to match the rated aerodynamic rotor thrust. The blade pitch angle used during the testing (−6.2°) was also used by the participants, as it returned a similar output. Participants considered steady spatially uniform wind in their numerical models, while the experiment contained a residual amount of turbulence.
Figure 3 shows the aerodynamic rotor thrust, the Fairlead 2 tension, the tower base fore–aft bending moment, and the hull pitch motion. For the experiment, a gray rectangle indicative of 2 times the standard deviation (2σ) is also included.
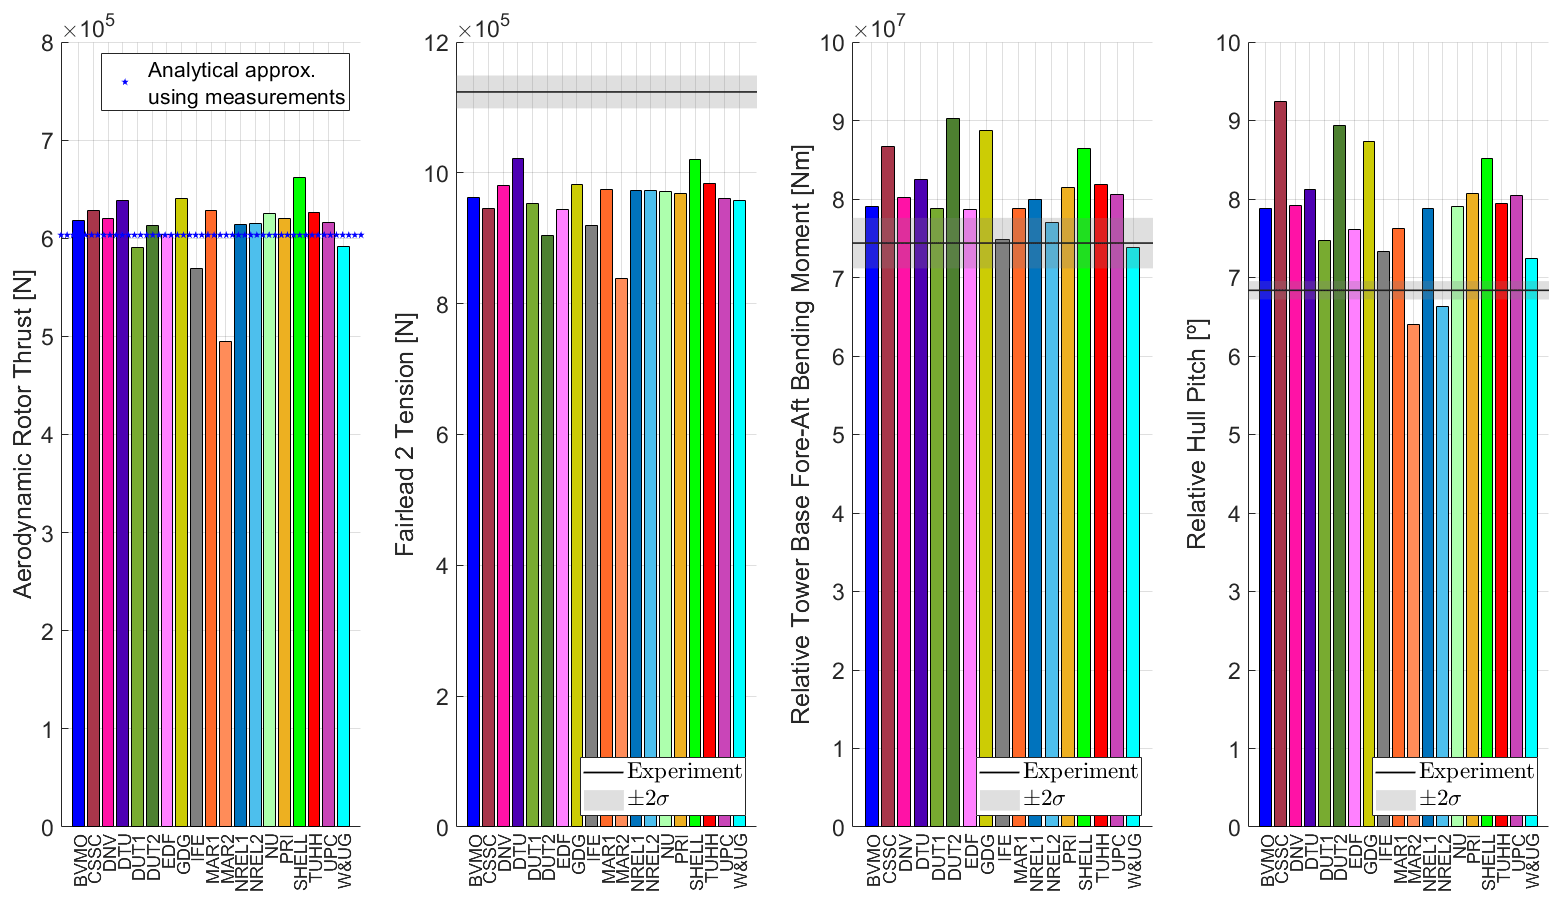
Figure 3Aerodynamic rotor thrust, Fairlead 2 tension, tower base fore–aft bending moment, and hull pitch rotation for rated wind conditions (Load Case 3.1).
The aerodynamic rotor thrust was not measured during the testing. The results from the numerical models were compared with each other as a verification. In addition, the aerodynamic rotor thrust was approximated by means of an analytical approach (moment balance around the tower base location) using the measured hull pitch rotation and the tower base fore–aft bending moment. The analytical approach accounted for the RNA and tower center-of-mass locations, disregarded the influence from the umbilical cable (relatively small due to the proximity between the tower base and the umbilical cable attachment point in the tower), and assumed rigid-body motion. First, the tower base fore–aft bending moment was computed analytically considering the bending contributions from the RNA and tower weight according to the measured hull pitch rotation in resting conditions (close to −2°). The measured tower base bending moment in resting conditions was not used because the mean value (signal DC component) during the testing campaign was not reliable (see Table 2). Then the relative measured tower base bending moment between the resting condition and the loaded condition was considered, as well as the bending contributions from the RNA and tower weight contributions according to the measured hull pitch rotation for the loaded condition (close to 4.8°). The analytical approach returned an aerodynamic rotor thrust equal to 6.03×10⁵ N for this condition. As observed in Fig. 3, most numerical models tend to slightly overpredict the thrust force. Moreover, it is expected that the real thrust force is slightly lower than 6.03×10⁵ N when the tower flexibility is considered due to the lever arm distance contributions in tower and especially RNA weights with regards to the tower base.
The Fairlead 2 tension corresponds to the load measured in the upwind mooring line. As observed in Fig. 3, the numerical models predict a lower tension than the experiment. However, the numerical models had excellent agreement when looking at the nonlinear relationship between force and imposed static surge offsets. The higher-than-expected tension for the experiment is likely due to the large surge position of the system in resting conditions before the wind was applied (+6.4 m from the system origin). Regarding the tower base fore–aft bending moment, a decision was made to analyze relative magnitudes between the resting condition and the loaded system for the aforementioned reasons. The same postprocessing was applied for the participant results (i.e., the mean value reported for the equilibrium condition in Load Case 1.1 was subtracted from the reported results). The numerical models tend to slightly overpredict the tower base fore–aft bending moment. This is aligned with the observation that the aerodynamic rotor thrust in the numerical models is slightly higher than in the experiment. Similarly, the relative hull pitch rotation is compared in Fig. 3. The hull motion is tracked at its center of mass. The experiment and most numerical models experience a hull pitch rotation of −2° for the equilibrium condition (Load Case 1.1). When the rated wind condition is applied, the relative pitch rotation is close to 7 or 8°. This means that the hull pitch moves from −2 to 5° or 6°. Similarly to the tower base fore–aft bending moments, most numerical models predict a slightly larger rotation than the experiment.
The unusual blade pitch angle (−6.2°) used during the experiment and replicated by the participants provided an aerodynamic rotor thrust similar to the target thrust for most numerical models based on the tower base bending moment shown in Fig. 3. However, when looking at the aerodynamic rotor torque (not shown), a negative value was observed for the experiment and the numerical models. This means that the wind turbine had to be powered (i.e., system acting as a motor instead of a generator) to maintain the rotational speed of 12.2 rpm.
Figure 4 compares the aerodynamic rotor thrust when considering the floating system (Load Case 3.1) and a fixed boundary condition at the tower base (Load Case 3.4). For reference, Fig. 4 also includes the median from participant results for the two boundary conditions. The scaled system and the numerical models do not have a wind turbine tilt angle. In Load Case 3.1, the rotor is tilted according to the hull pitch angle (see Fig. 3) and the tower compliance, whereas in Load Case 3.4 the rotor is solely tilted according to the tower compliance. Most numerical models predict a very similar aerodynamic rotor thrust for these two boundary conditions.
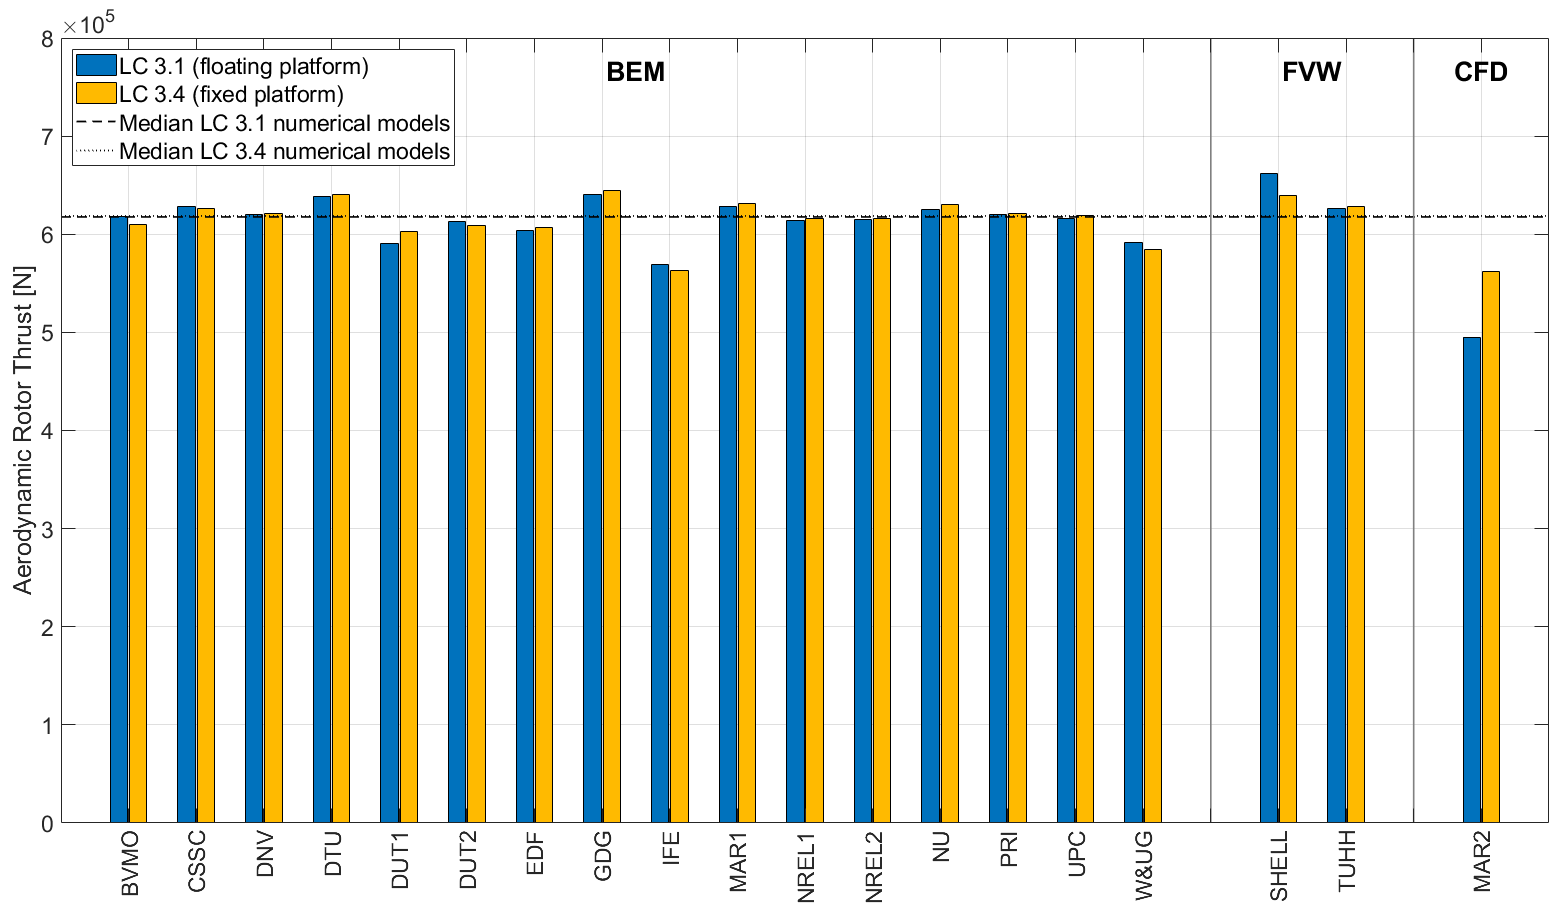
Figure 4Comparison of aerodynamic rotor thrust for floating (Load Case 3.1) and fixed (Load Case 3.4) conditions. Outputs sorted according to the aerodynamic theory: blade element momentum (BEM), free vortex wake (FVW), and computational fluid dynamics (CFD).
Some higher-fidelity models (i.e., FVW and CFD) show sensitivity to the hull rotation. For example, MAR2 (CFD) experiences a significant reduction (−11.8 %) in the aerodynamic rotor thrust for the floating system. This may be related to some physical effects caused by high angles of attack occurring in the simulation. In those conditions, flow separation at the leading edge and stall may occur, resulting in lower thrust values. It should be noted that the Reynolds numbers at model scale are low. Flow separation at large angles of attack and the transition from laminar to turbulent flow may not be captured accurately in the blade-resolved approach at model scale using the standard k–omega shear stress transport turbulence model. An opposite trend is observed in Fig. 4 for SHELL (FVW). In this case, the rotor tilt due to the hull pitch rotation results in a slightly higher (+3.4 %) rotor aerodynamic thrust compared to the fixed-platform condition.
Comparing NREL1 and SHELL (same numerical model with different aerodynamic theory) for the fixed-platform condition, it can be observed that SHELL (FVW) results in a slightly higher (+3.8 %) rotor aerodynamic thrust than NREL1 (BEM). This is aligned with the behavior observed in the OC6 Phase III project (Bergua et al., 2023). This difference is likely due to the slightly different induction factors in the rotor.
5.2 Floating support structure motion
One regular wave-only test was used to examine the wave-structure response of the system. A response amplitude operator (RAO) for a regular wave is the ratio of the system motion response amplitude to the wave excitation amplitude at the wave frequency. The regular wave studied in the basin is nonlinear (i.e., it contains wave harmonics and does not describe a perfect sinusoid); as such, the RAO is computed based on the fast-Fourier-transform amplitude obtained at the wave fundamental frequency. Figure 5 shows the normalized response amplitude at the wave frequency for the surge, heave, and pitch degrees of freedom at the hull center of mass in Load Case 4.1 (severe sea state). The figure also includes the experimental results from three repeats performed during the testing. Most numerical models tend to slightly overpredict the surge and heave motions, whereas the pitch motion is slightly underpredicted. The CFD approach from MAR2 seems to be able to accurately predict the response in the three directions.

Figure 5Normalized response amplitude at the wave frequency in Load Case 4.1 for the surge, heave, and pitch degrees of freedom. Outputs sorted according to the hydrodynamic theory: Morison equation (ME), potential flow (PF) augmented with viscous drag, and computational fluid dynamics (CFD).
Participants initially tuned the hydrodynamic coefficients (i.e., drag and inertia coefficients for Morison equation models and drag coefficients for the hybrid models) based on free-decay tests in still water. However, it is expected that the viscous damping is dependent on the sea state (Pegalajar-Jurado et al., 2019). Nevertheless, participants in this project used the same hydrodynamic coefficients for all the cases studied.
NREL performed a sensitivity analysis over the Morison equation approach and observed that the hull motion response experienced in Load Case 4.1 was mainly driven by the hydrodynamic inertia coefficient. Higher hydrodynamic drag coefficients resulted in slightly higher damping for the system, but the model was not very sensitive. The most slender members (e.g., diagonal braces) have contributions from both drag and inertia, and the largest members (e.g., central column) are dominated by inertia. These observations are also aligned with previous studies on the TetraSpar design (Thomsen et al., 2021). Members near the mean sea level (i.e., central column and diagonal braces) drive the system response, as the magnitude of the wave kinematics is higher in that region and decays exponentially with increasing depth. For reference, most numerical models based on the Morison equation approach used an inertia coefficient equal to 2. This value is also in good agreement with previous studies on the TetraSpar design (Thomsen et al., 2021).
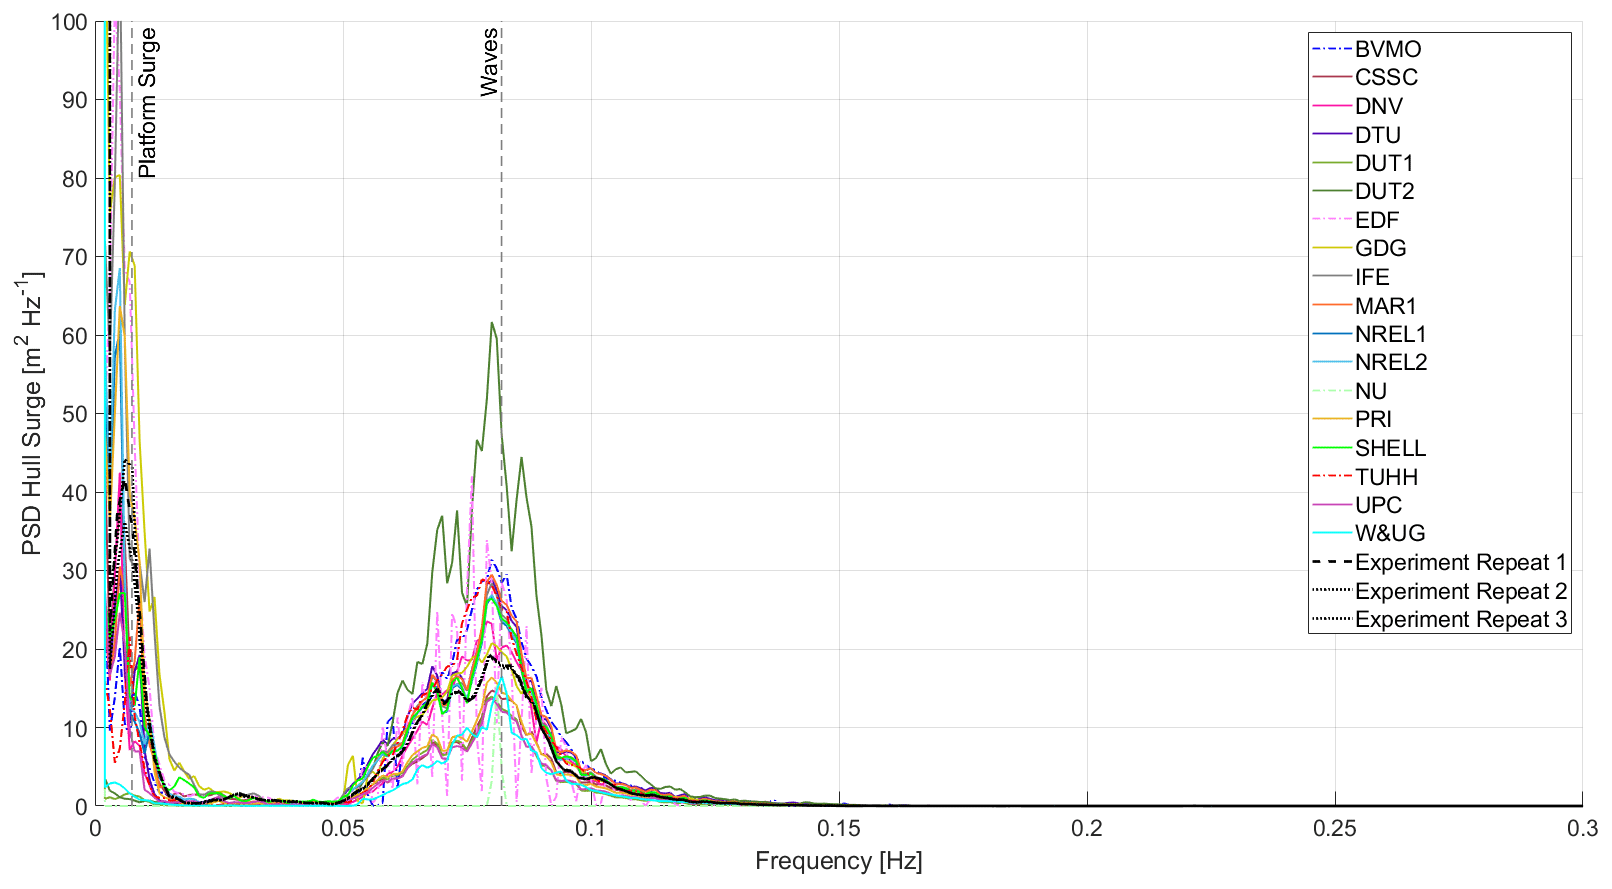
Figure 6Power spectral density (PSD) of the hull surge motion for the combined wind-and-wave condition in Load Case 5.3. Solid lines denote participants using a Morison equation approach, and dash-dotted lines denote participants using a potential-flow approach or potential flow augmented with viscous drag.
Figure 6 shows the power spectral density (PSD) of the hull surge motion for the combined unsteady wind-and-wave condition in Load Case 5.3. Participants using a Morison equation approach are denoted with a solid line, and participants using a potential-flow approach or potential flow augmented with viscous drag are denoted with a dash-dotted line. Similar patterns are used in Figs. 10 and 14. The significant wave height and peak spectral wave period considered in Load Case 5.3 are comparable in magnitude to the regular wave analyzed in Load Case 4.1. In the very low-frequency range, rigid-body (slow drift) motion activity can be observed around the platform surge eigenfrequency. The response at this frequency is driven by the wind excitation and nonlinear hydrodynamic forces able to excite the system outside the linear wave excitation region (e.g., second-order terms in the potential-flow solution or viscous drag forces, especially when including second-order wave kinematics and wave stretching). In this case, the impact of the wave stretching is significantly larger than the impact of including second-order wave kinematics. Participants using the vertical wave stretching theory obtained the largest slow-drift response. This was also observed by NREL when comparing the response between vertical and Wheeler wave stretching theories. Figure 6 shows a group of participants (DUT1, DUT2, NU, and W&UG) with a very small response around the platform surge frequency. These participants defined a steady wind condition and therefore do not include the wind excitation from the wind turbulence in the very low-frequency region. For NU, using a steady wind condition together with only linear potential-flow data for the hydrodynamics resulted in a lack of system response in the platform surge eigenfrequency. For the linear wave region (around 0.08 Hz in Fig. 6), the results are aligned with the response observed for the regular wave condition. For example, participants slightly overpredicting the response in the regular wave condition (Fig. 5) also show similar trends for the irregular wave condition (Fig. 6).
For the rated and post-rated conditions, the turbulence intensity during the testing was very small (see Table 7). The waves were the main excitation of the system. To compare the system response between participants and against the measurements, the PSD can be integrated for the linear wave excitation region. This metric is equivalent to the variance (standard deviation squared), and it is related to fatigue loading over that frequency range. Table 8 shows the lower and upper cutoff frequencies for the three irregular waves considered in Load Cases 4.X and 5.X.
Table 8Lower and upper cutoff frequencies for the linear wave excitation region to compute the PSD integral.
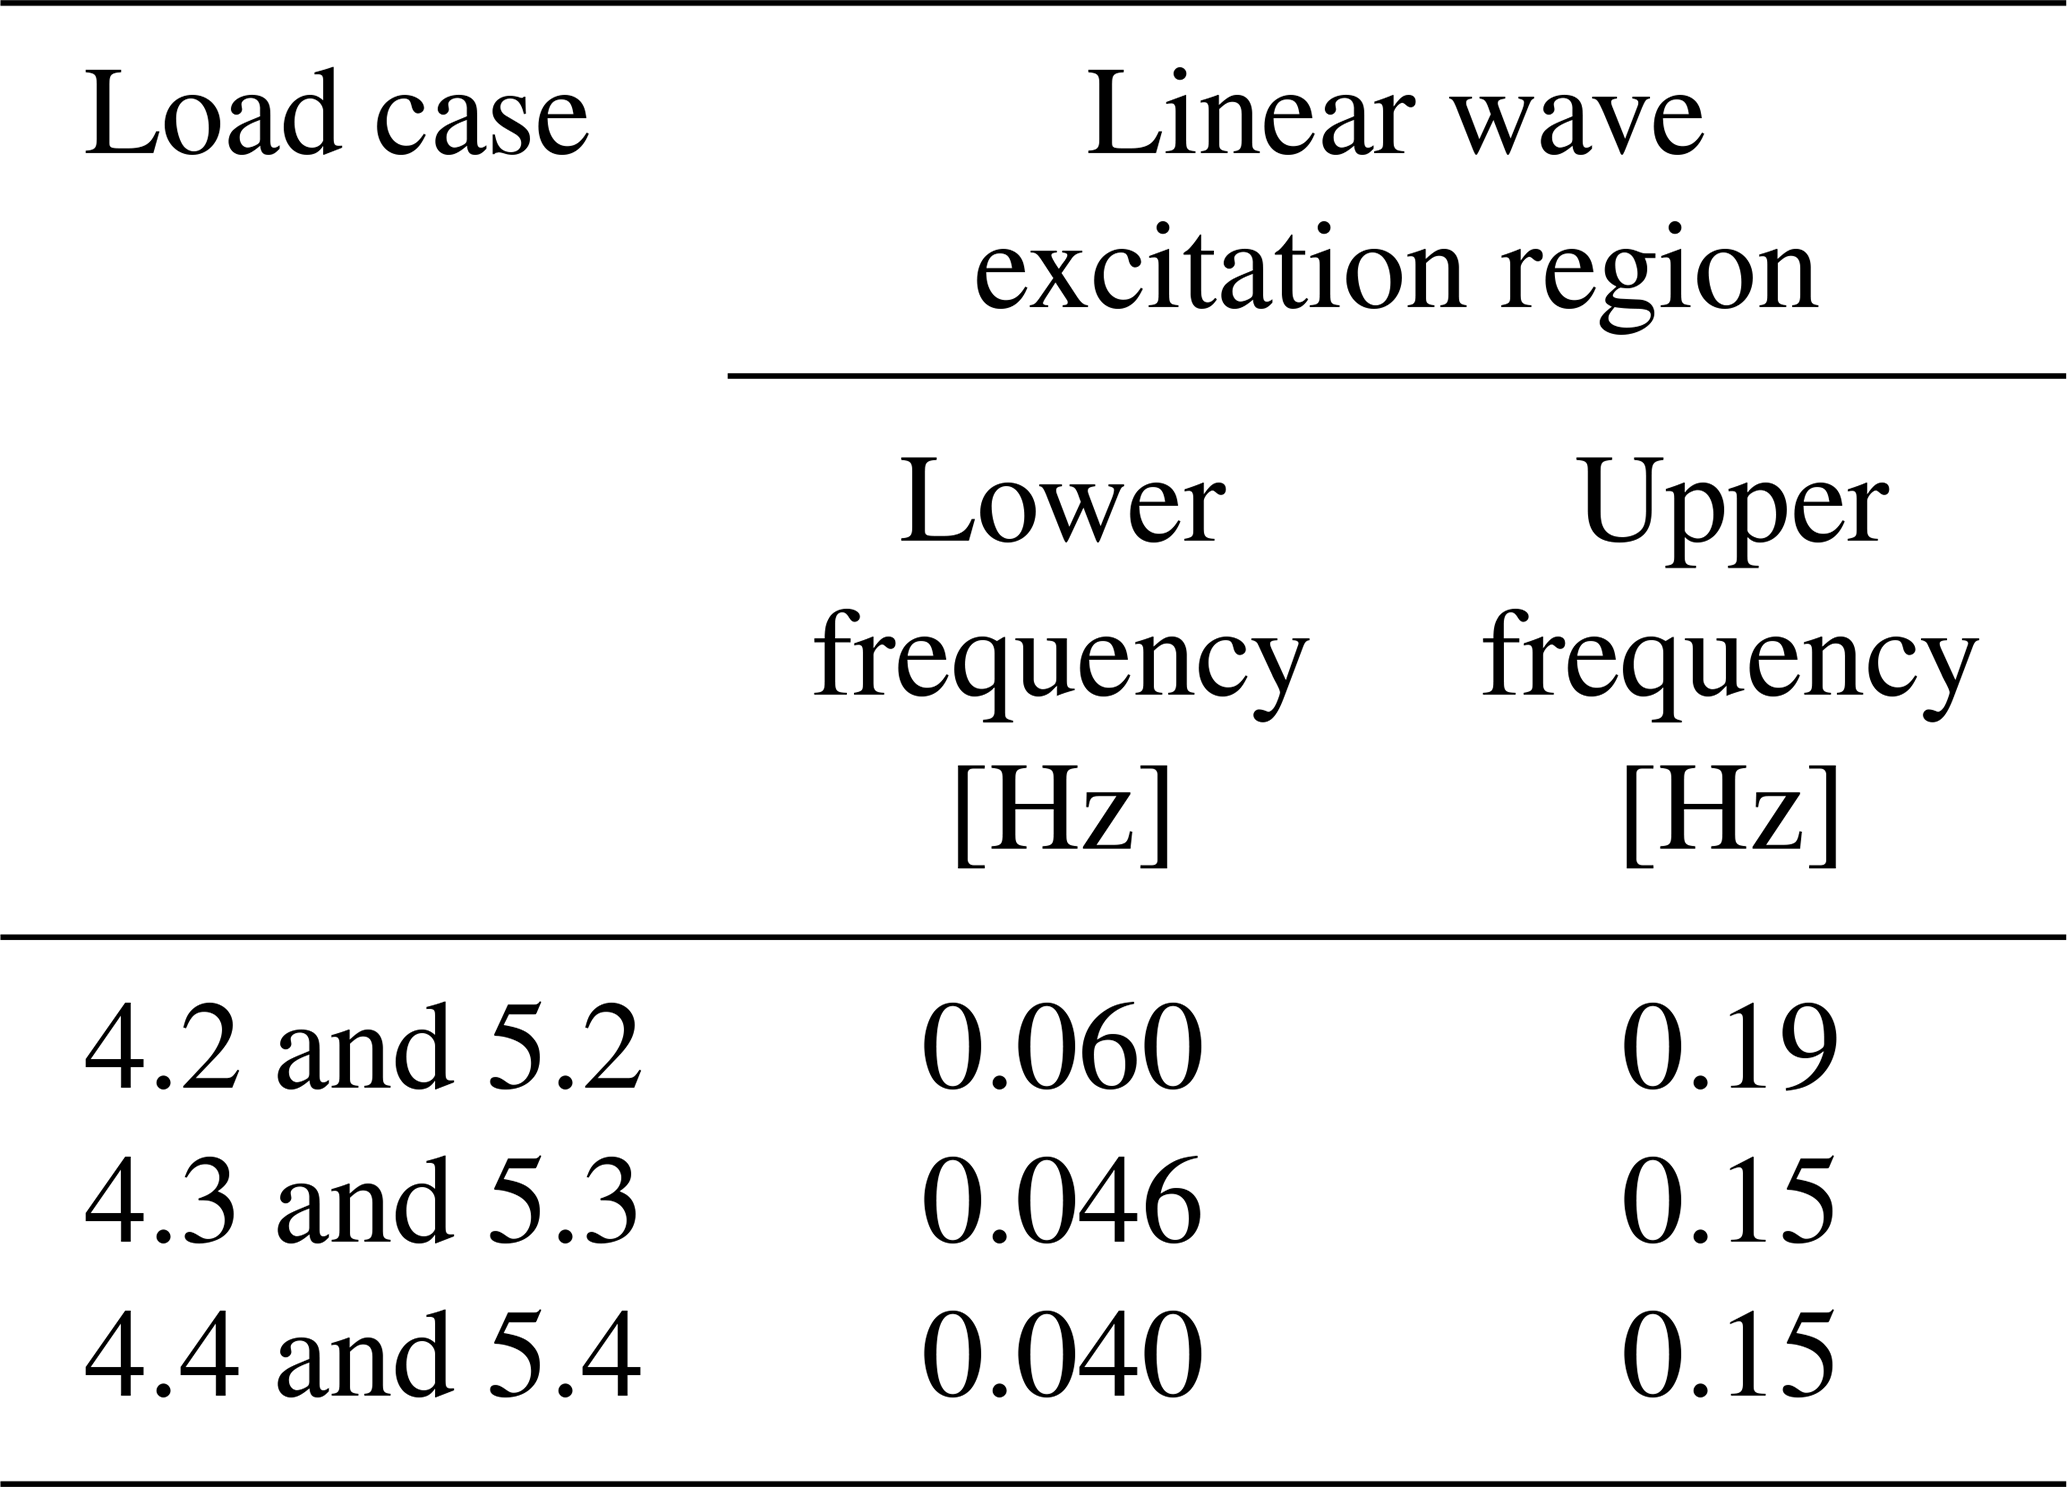
Figure 7 shows the hull surge PSD integral for the different numerical models categorized according to the hydrodynamic theory used (e.g., Morison equation, potential flow). In this case there are no outputs available from the CFD model (MAR2). Figure 7 also includes the results from three repeats performed during the testing. Similarly to Load Case 4.1, the system response in the wave linear region in Load Cases 5.2, 5.3, and 5.4 is governed by the hydrodynamic inertia component. In these load cases the hydrodynamic drag component has minor effects in the response. In Load Case 5.2, the hydrodynamic drag slightly increases the wave loading excitation, while in Load Cases 5.3 and 5.4, it provides some damping to the system. All participants using the potential flow approach, except NU, accounted for the viscous drag contribution by means of Morison-based members. However, the different behavior observed in Fig. 7 for NU is not due to the lack of viscous drag but rather something not properly set up in the numerical model.

Figure 7Power spectral density (PSD) integral of the hull surge motion for the combined wind and wave conditions in Load Cases 5.2, 5.3, and 5.4. Outputs sorted according to the hydrodynamic theory: Morison equation (ME) and potential flow (PF). Vertical axis in logarithmic scale.
Figures 8 and 9 provide the PSD integral for the hull heave and hull pitch motions, respectively. Similarly to the regular wave condition (Fig. 5), most participants tend to underpredict the hull pitch motion when considering the irregular wave conditions (Fig. 9).
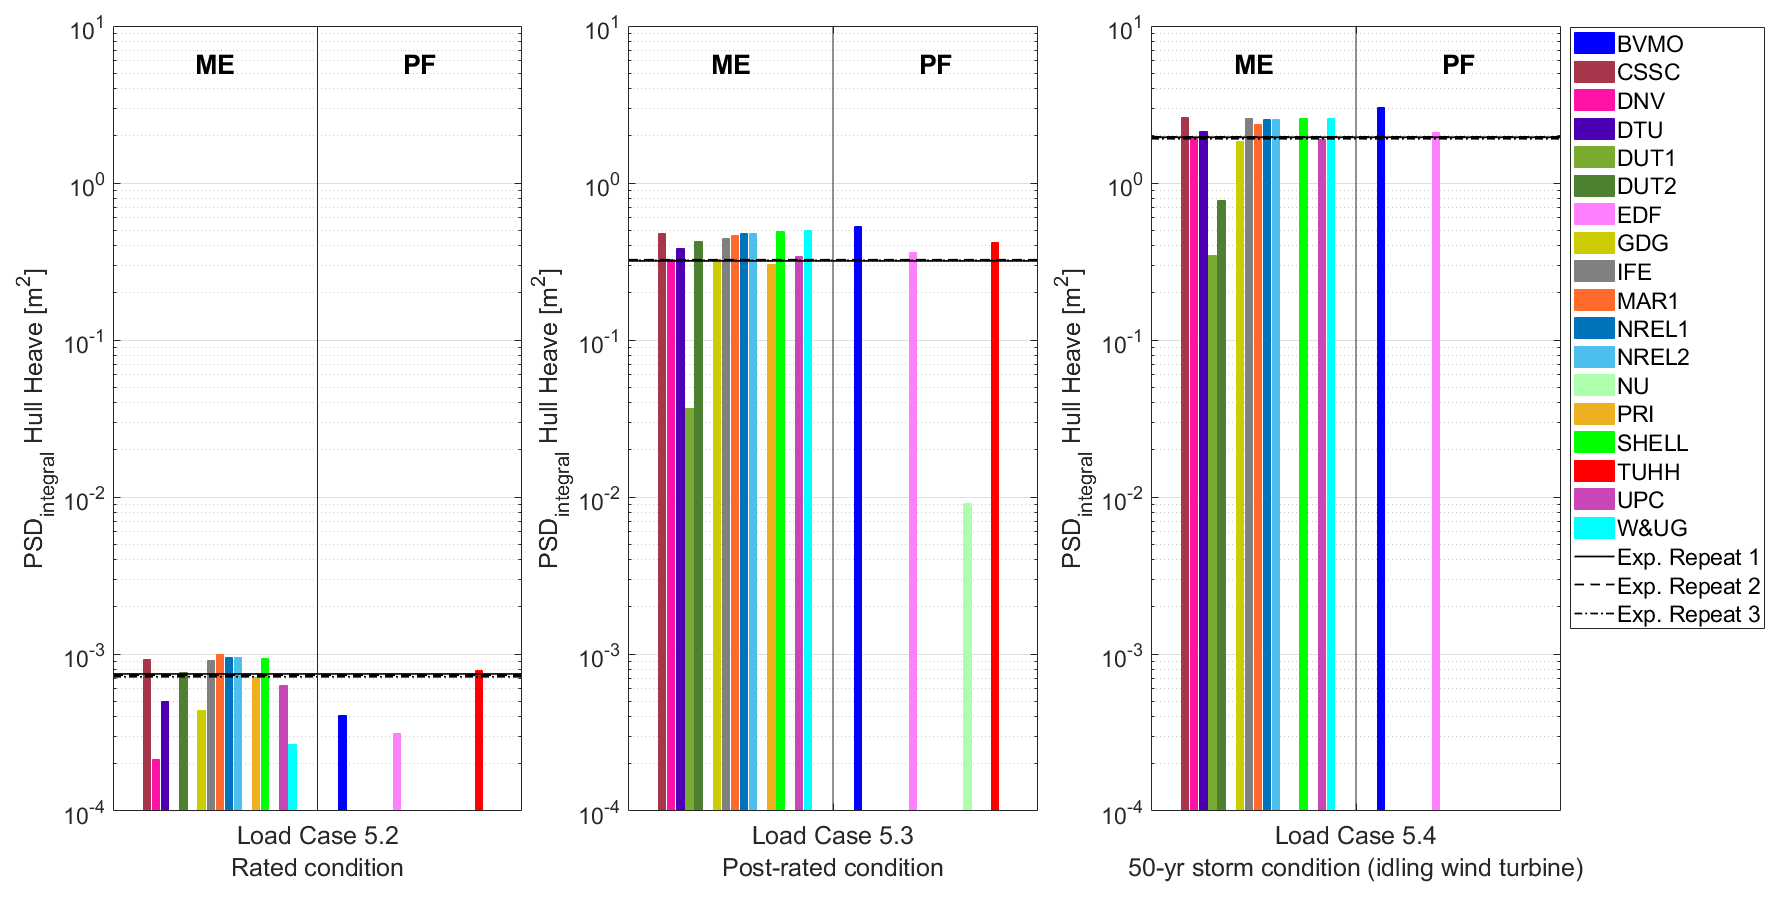
Figure 8Power spectral density (PSD) integral of the hull heave motion for the combined wind and wave conditions in Load Cases 5.2, 5.3, and 5.4. Outputs sorted according to the hydrodynamic theory: Morison equation (ME) and potential flow (PF). Vertical axis in logarithmic scale.
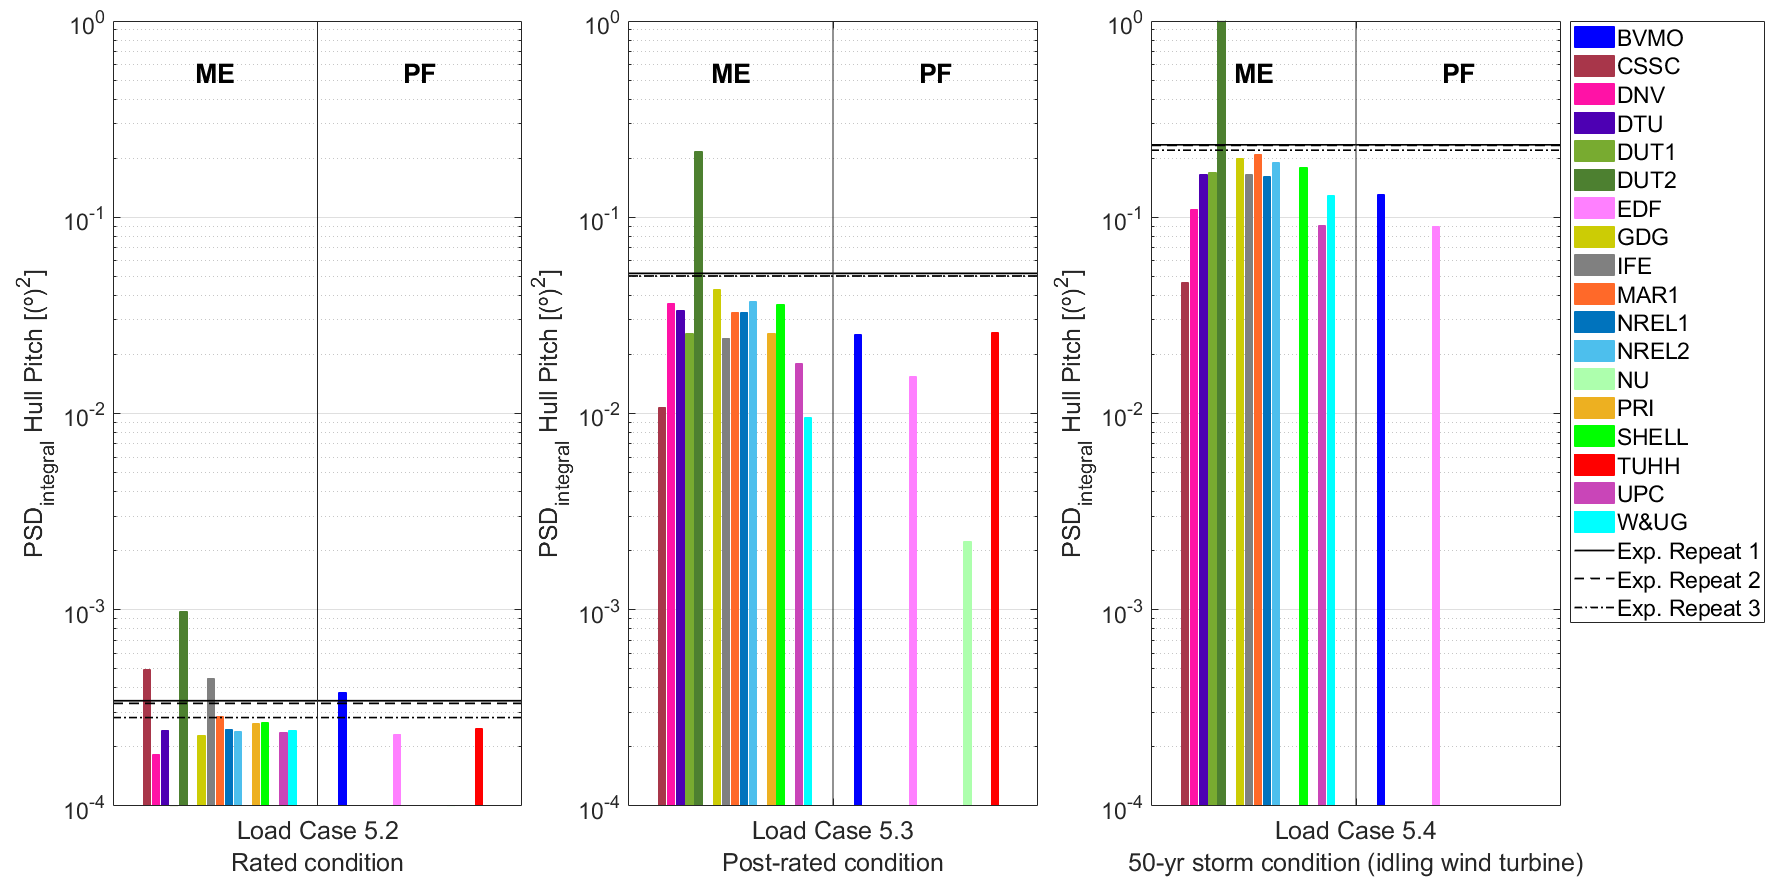
Figure 9Power spectral density (PSD) integral of the hull pitch motion for the combined wind and wave conditions in Load Cases 5.2, 5.3, and 5.4. Outputs sorted according to the hydrodynamic theory: Morison equation (ME) and potential flow (PF). Vertical axis in logarithmic scale.
As Figs. 7–9 show, Load Case 5.4 (50-year storm) results in the largest dynamic loading in the linear wave region and Load Case 5.2 (rated condition) in the smallest dynamic loading. As expected, the PSD integral is larger for the higher waves.
Although not shown, the system response in the wave linear region is very similar between the conditions without wind (Load Cases 4.X) and with wind (Load Cases 5.X) with only some relatively small differences in the pitch degree of freedom.
5.3 Tower base fore–aft bending moment
The fore–aft and side-to-side bending moments at the tower base were measured during the testing. The wind and wave load excitations occur at a frequency significantly lower than that of the first tower-bending mode. Figure 10 shows the PSD of the tower base fore–aft bending moment for an irregular wave-only condition (Load Case 4.3).
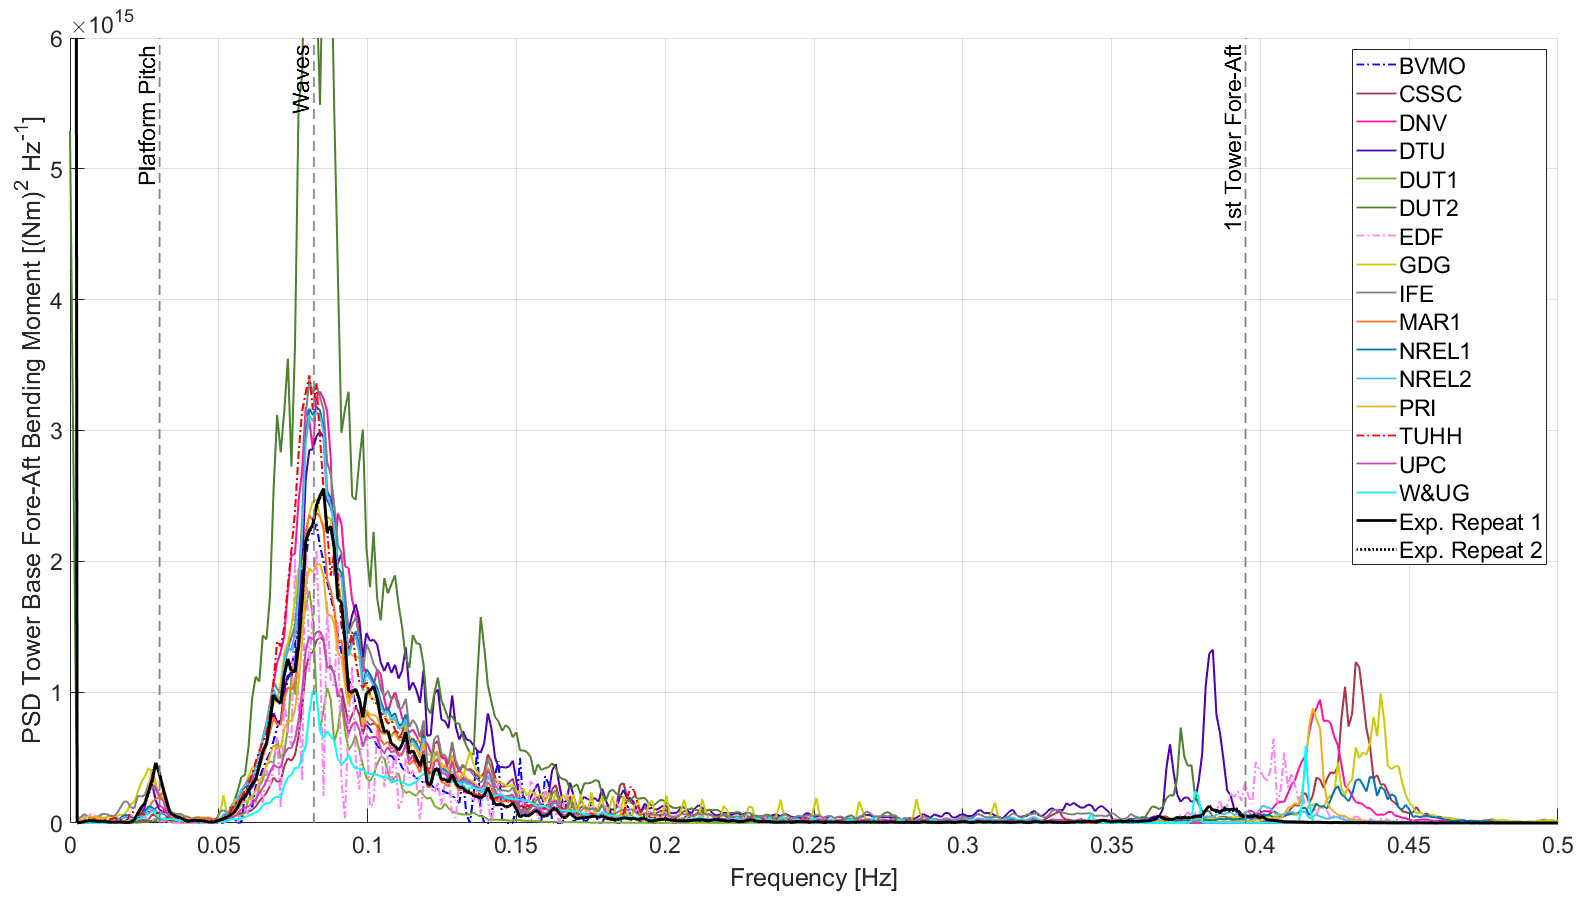
Figure 10Power spectral density (PSD) of the tower base fore–aft bending moment for the wave-only condition in Load Case 4.3.
For the experiment, the first tower fore–aft bending mode in free-floating conditions occurs at around 0.39–0.40 Hz. Most numerical models properly reproduced the expected frequency for the first tower-bending eigenfrequency for the cantilevered condition (0.34–0.35 Hz). However, when moving to the free-floating conditions, most numerical models tend to slightly overestimate the tower-bending eigenfrequency.
Figure 10 also shows some Morison-only models overestimating the response at the first tower-bending mode. The Morison equation is only valid for diameter-to-wavelength ratios smaller than 0.2 (Faltinsen, 1993). Otherwise, finite-wavelength diffraction effects become significant. To avoid this, some participants (NREL, UPC) used the MacCamy and Fuchs diffraction correction of the inertia coefficient (MacCamy and Fuchs, 1954). For the TetraSpar design studied in this project, the largest diameter (4.3 m) corresponds to the central column, hull tri-braces, and keel tri-braces. Considering deep-water conditions and the largest diameter of 4.3 m, the Morison equation without any corrections would overestimate the loading above 0.27 Hz. Some participants (DUT2, GDG, NREL) also applied a low-pass filter over the irregular wave spectrum. According to the recommended practice DNV-RP-C205 (Det Norske Veritas, 2010), when using a measured input record, it is advised to use a low-pass filter with a cutoff frequency equal to 4 times the peak spectral wave frequency. This low-pass filter cutoff frequency is 0.33 Hz in Load Case 4.3.
When using Wheeler wave stretching and the MacCamy and Fuchs correction, the response from the NREL1 model was aligned with the experiment around the first tower eigenfrequency. However, when vertical wave stretching was used (shown in Fig. 10), the response at the first tower-bending mode eigenfrequency was significant (despite using the MacCamy and Fuchs correction). This significant response was observed with and without second-order wave kinematics.
Figure 11 shows the PSD integral for the different numerical models categorized according to the hydrodynamic theory used (e.g., Morison equation, potential flow). In this case there are no outputs from the CFD model because the numerical model from MAR2 does not account for structural flexibility, and the loading at the tower base is not available. Figure 11 also includes the results from two repeats performed during the testing.

Figure 11Power spectral density (PSD) integral of the fore–aft tower base bending moment for the wave-only conditions in Load Cases 4.2, 4.3, and 4.4. Outputs sorted according to the hydrodynamic theory: Morison equation (ME) and potential flow (PF) with augmented viscous drag. Vertical axis in logarithmic scale.
5.4 Upwind fairlead tension
In slack catenary mooring lines (i.e., when part of the line rests on the seabed), the vertical component of the fairlead mean tension is equal to the suspended line net weight, and the total mean tension is determined by the angle described at the fairlead connection. When an external force is applied over the wind turbine, the floating system experiences a motion that changes the suspended weight at each line. This results in a new fairlead orientation and tension. By projecting the three fairlead tensions in the horizontal plane, the resultant force that opposes the external forces over the system in that plane could be determined.
Figure 12 shows the fairlead tension for the three mooring lines in the system equilibrium condition (Load Case 1.1). As Fig. 12 shows, the Fairlead 2 tension is significantly higher (+80 %) than the tension in the other two fairleads. The reason is that the umbilical cable pulls the system significantly downwind, loading Mooring Line 2 and unloading Mooring Lines 1 and 3. This behavior is properly reproduced by the numerical models. Figure 12 also shows a large dispersion for the Fairlead 2 measurement due to the different system resting positions experienced during the testing.
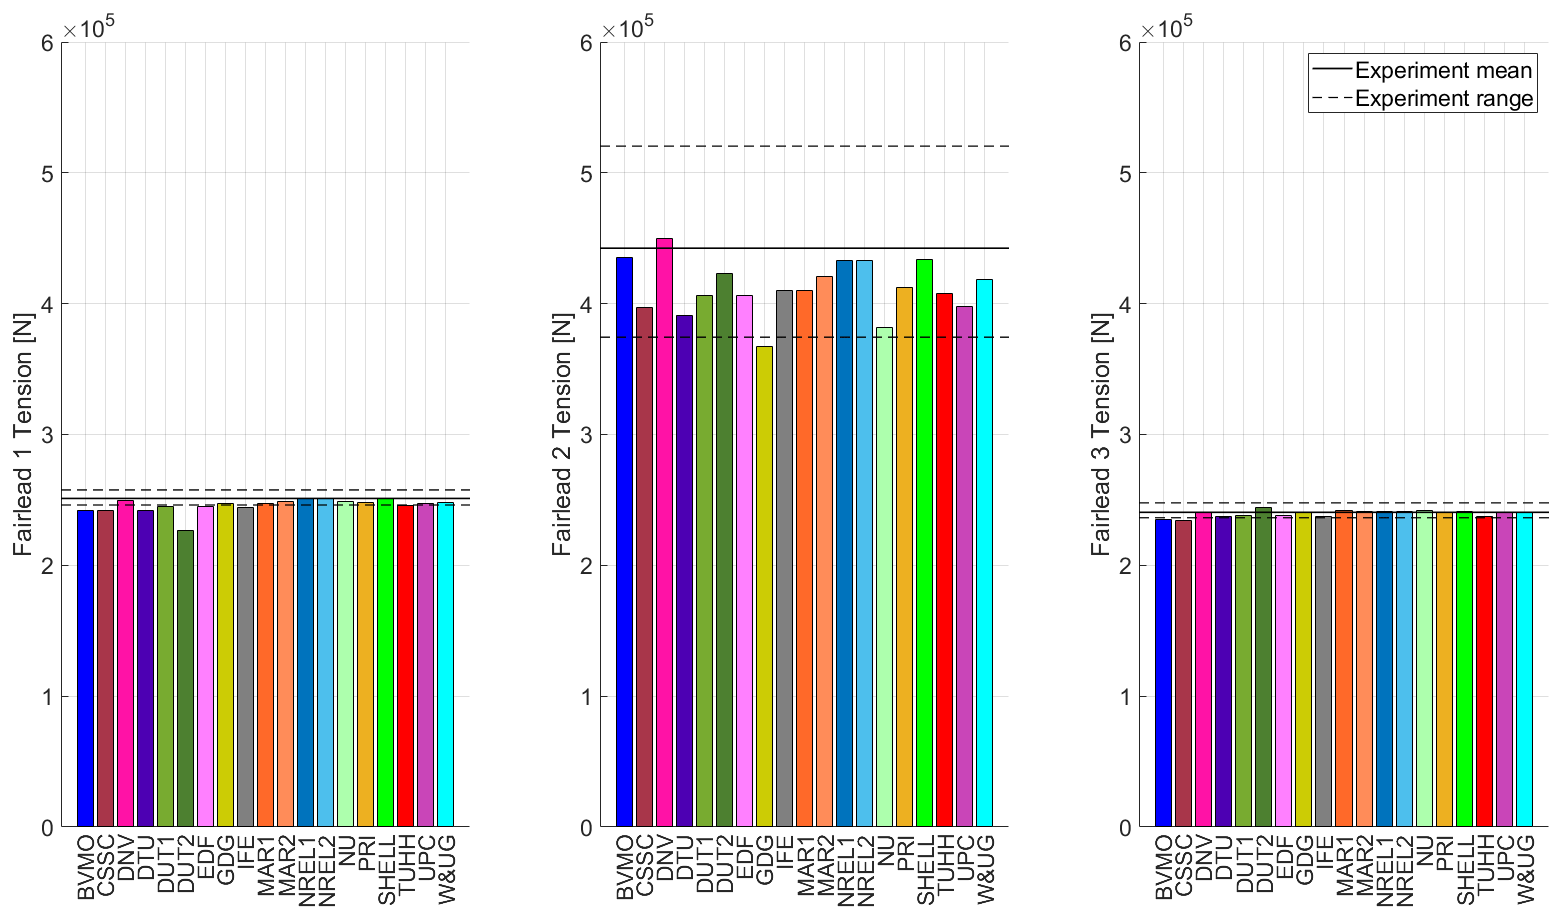
Figure 12Fairlead tension in the three mooring lines for the system equilibrium condition (Load Case 1.1).
In Load Cases 5.X, the system is loaded by wind and waves. For these conditions, the new fairlead tensions are mainly driven by the aerodynamic thrust force that translates into a platform surge offset. In Load Cases 5.X, the wind is applied along the x direction. This results in a significant increase in the Fairlead 2 tension (located upwind), whereas the fairlead tension in lines 1 and 3 (located downwind) tends to slightly decrease. Figure 13 shows the mean fairlead tension for Mooring Line 2 in Load Cases 5.2, 5.3, and 5.4. As expected, Load Case 5.2 (rated condition) results in the highest Fairlead 2 mean tension because the aerodynamic rotor thrust is at a maximum.
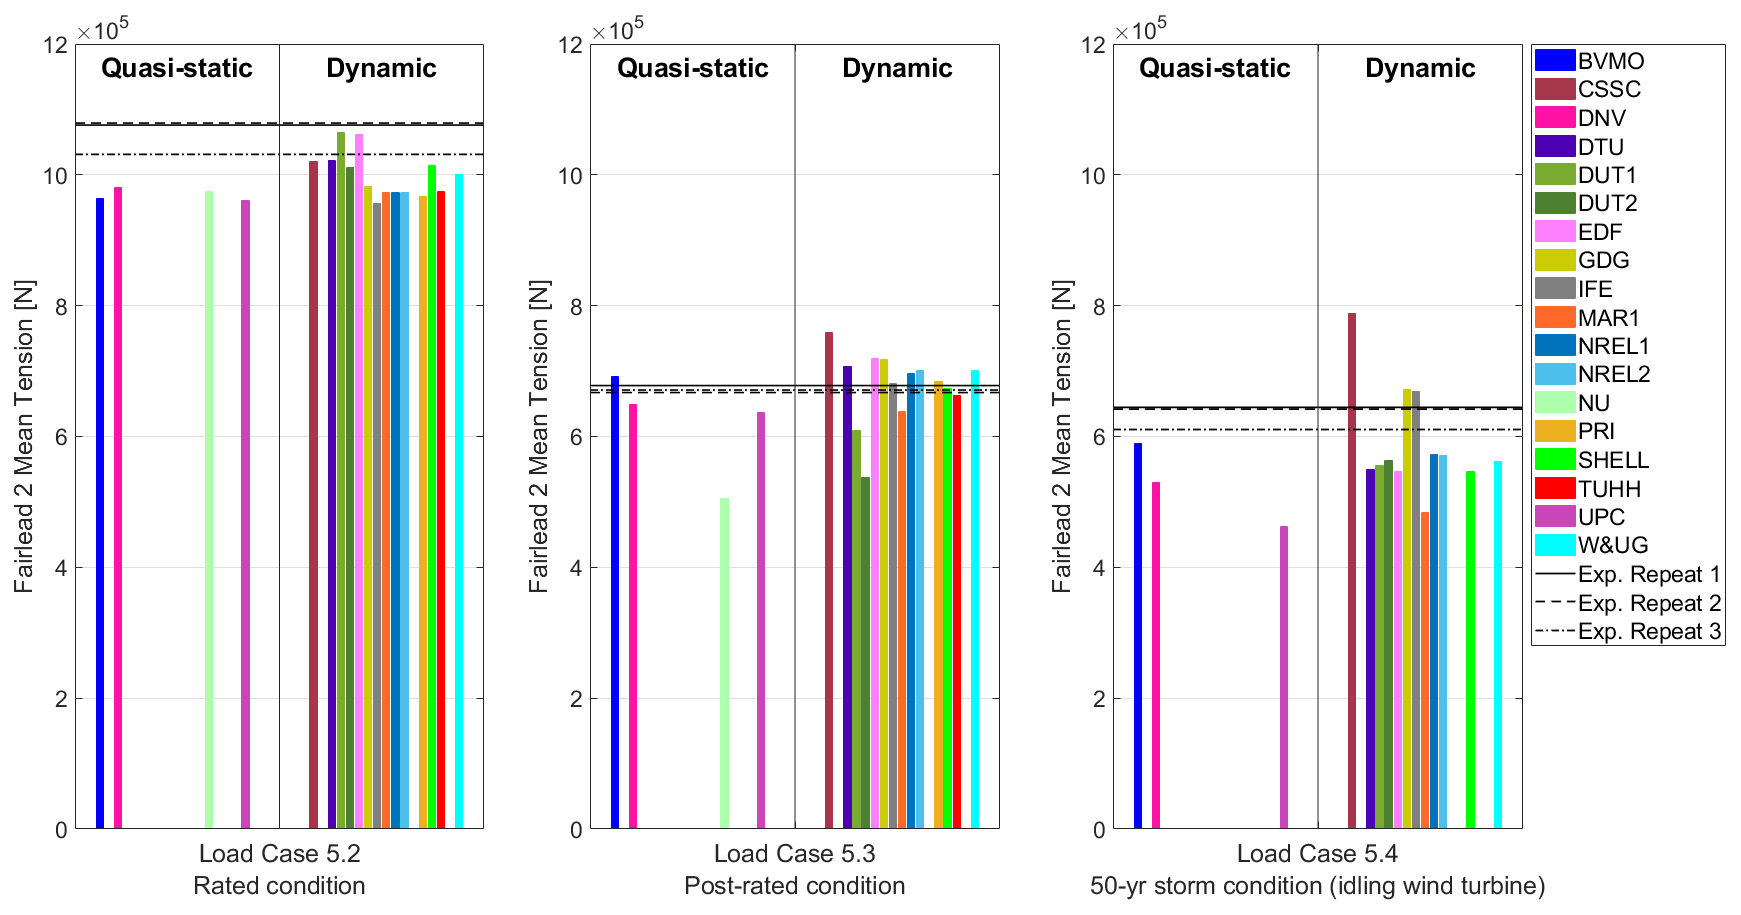
Figure 13Fairlead 2 mean tension for the combined wind and wave conditions in Load Cases 5.2, 5.3, and 5.4. Outputs sorted according to the mooring line theory: quasi-static and dynamic.
For most numerical models, the Fairlead 2 mean tension in Load Case 3.1 (steady wind-only condition) shown in Fig. 3 is similar to or slightly lower than the Fairlead 2 mean tension in Load Case 5.2 (combined unsteady wind and waves) shown in Fig. 13. This is the expected behavior and confirms that the Fairlead 2 mean tension is mainly driven by the aerodynamic loading. Interestingly, the experiment shows lower Fairlead 2 mean tensions in Load Case 5.2 (Fig. 13) compared to Load Case 3.1 (Fig. 3) and a certain discrepancy between the repeats. It is known that during Load Case 5.2, the wind in the wave basin was higher than expected (10.67 m s−1) and significantly higher than the wind measured in Load Case 3.1 (9.37 m s−1). Despite this, the experiment shows larger Fairlead 2 mean tensions in Load Case 3.1. This unexpected behavior between Load Case 3.1 and Load Case 5.2 may be related, once again, to the uncertainty in the system resting position between tests.
Figure 13 also shows that in Load Case 5.2, the Fairlead 2 mean tension observed during the testing is higher than for most of the numerical models. This indicates that during the testing, the platform experienced a higher mean surge position when the system was loaded. This could also be related, in part, to the higher mean wind speed observed during the testing (10.67 m s−1) compared to the mean wind speed used by the participants (9.86 m s−1).
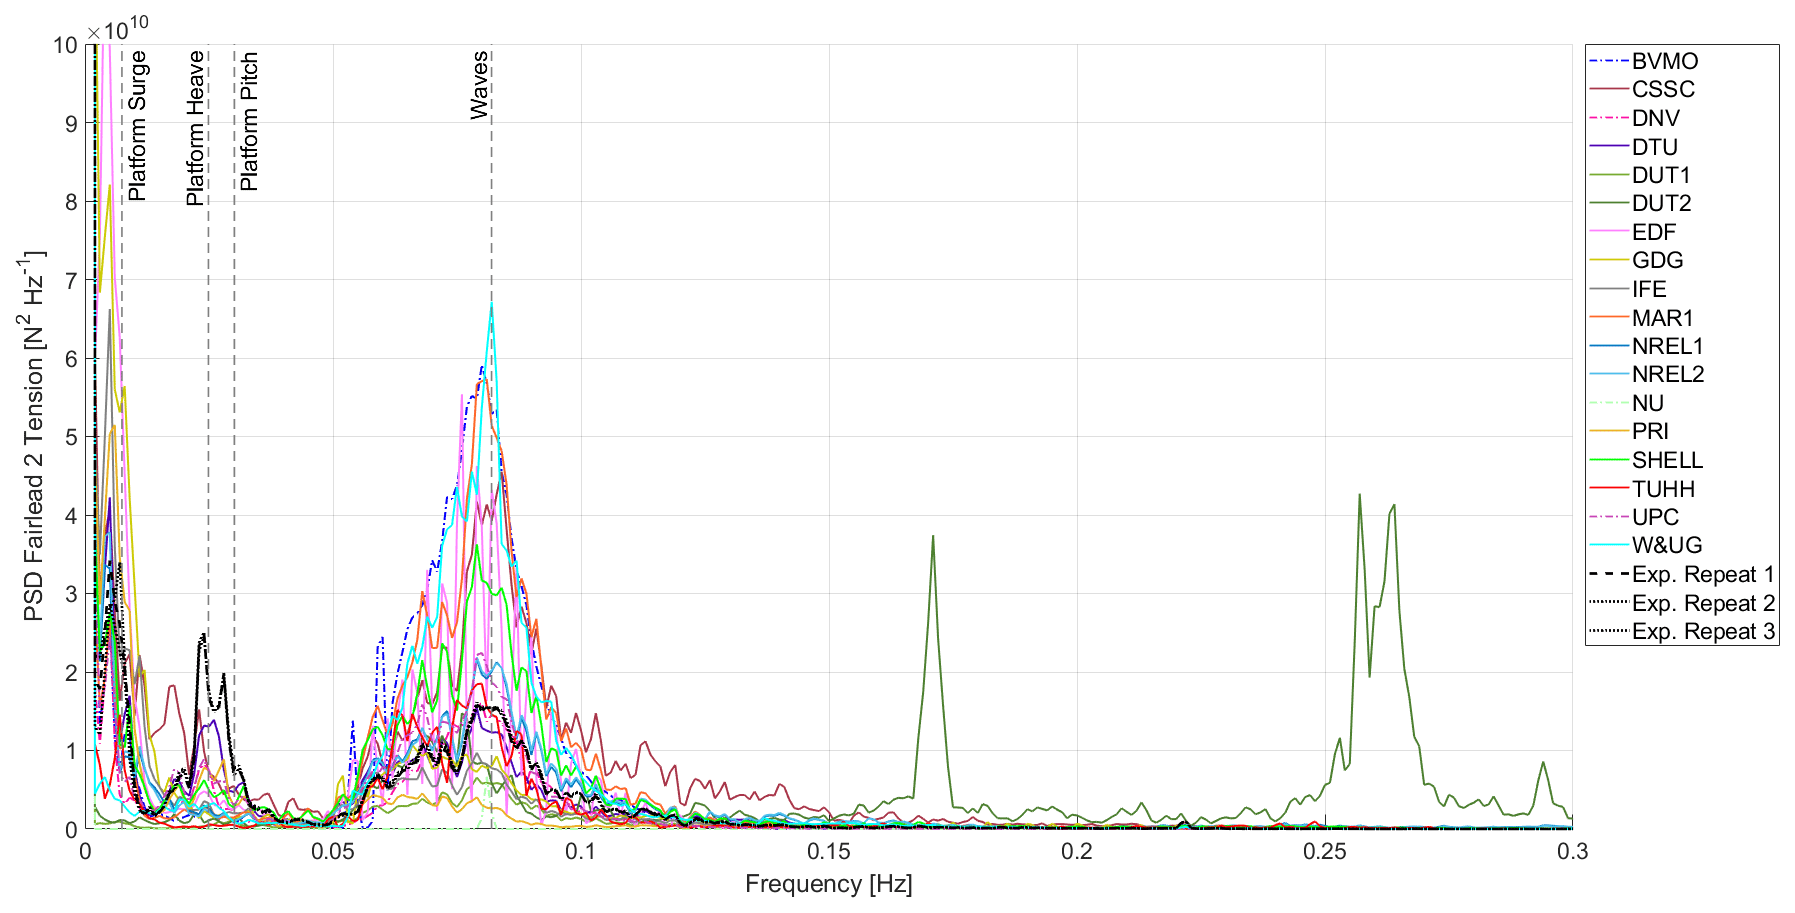
Figure 14Power spectral density (PSD) of the Fairlead 2 tension for the combined wind-and-wave condition in Load Case 5.3. Solid lines denote participants using a dynamic approach for the mooring lines, and dash-dotted lines denote participants using a quasi-static approach.
The experiment shows similar Fairlead 2 mean tension in Load Case 5.3 (post-rated condition) and Load Case 5.4 (50-year storm condition), while the numerical models tend to have slightly smaller Fairlead 2 mean tension in Load Case 5.4. For reference, during the storm with the wind turbine in idling conditions, the rotor drag is similar to the tower aerodynamic drag. It may be that the umbilical cable induces some additional aerodynamic drag force that becomes significant due to the high wind speed. Unfortunately, there was no information about the umbilical cable nominal diameter, and the aerodynamic contribution was not accounted for in the numerical models.
As expected, there are no differences between quasi-static or dynamic mooring lines to estimate the mean line tension.
During dynamic conditions, the line load variations are determined by the system motion and the corresponding suspended line weight, inertial loads, hydrostatic loads, hydrodynamic loads of the line moving through the water, and hydrodynamic loads due to the wave kinematics. Quasi-static mooring line approaches only capture changes in the suspended line weight, missing the inertial and hydrodynamic load contributions. Therefore, the quasi-static approach should tend to underpredict the dynamic line loads as observed in the OC5 Phase II project (Robertson et al., 2017).
Figure 14 shows the PSD of the Fairlead 2 tension for the combined wind-and-wave condition in Load Case 5.3. Participants using a dynamic approach for the mooring lines are denoted with a solid line, and participants using a quasi-static approach are denoted with a dash-dotted line. In the very low-frequency range, activity can be observed around the platform surge, heave, and pitch frequencies. For the linear wave region, large differences between numerical models are observed.
The response from DUT2 shows two peaks at around 2 and 3 times, respectively, the peak spectral wave frequency.
Figure 15 shows the PSD integral for the different numerical models categorized according to the mooring line theory used (e.g., quasi-static and dynamic). Figure 15 also includes the results from the three repeats performed during the testing.
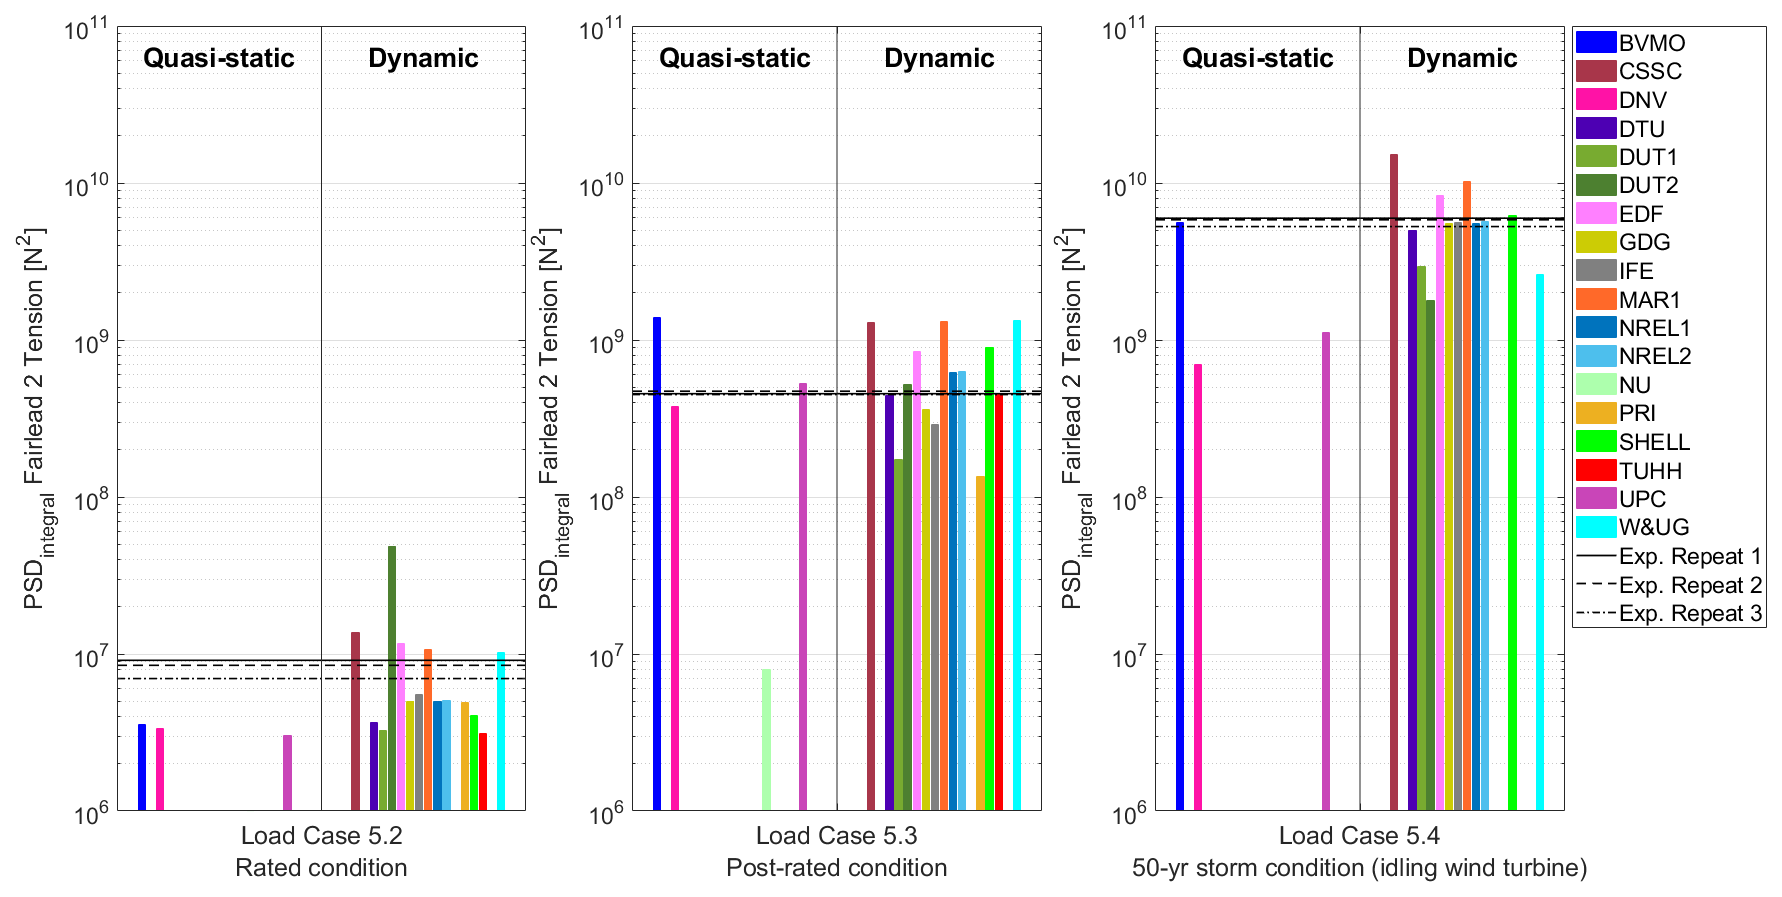
Figure 15Power spectral density (PSD) integral of the Fairlead 2 tension for the combined wind and wave conditions in Load Cases 5.2, 5.3, and 5.4. Outputs sorted according to the mooring line theory: quasi-static and dynamic. Vertical axis in logarithmic scale.
As anticipated in Fig. 14, there is a significant spread in the outputs from the participants. This indicates that the dynamic loading in the mooring lines driven by the platform motion due to the incoming waves is different between the participants. This might be due to a different platform motion (see Figs. 7–9) or a different line response for a similar platform motion. It is also important to note that different platform mean surge positions (influenced by the umbilical cable) will result in a different suspended line length and orientation, potentially impacting the dynamic loading. For example, in Load Cases 5.2 and 5.4, Experiment Repeat 3 experienced a smaller platform surge offset that resulted in lower mean Fairlead 2 tensions than for the other two repeats (see Fig. 13). When looking at the corresponding dynamic loading in the wave region (see Fig. 15), it can be observed that Experiment Repeat 3 returns lower dynamic loading in the wave region for the load cases that experienced the smaller surge offsets (Load Cases 5.2 and 5.4). Future work could include prescribing the platform's six degrees of freedom in the numerical models to determine if the mooring line responses are similar when the platform motion is imposed. It is important to highlight that, in the numerical models, the mooring line lengths of the upper section were modified to provide the expected tensions in the static surge offsets (Wiley et al., 2023). The lengths were extended by between 12 % and 18 %. It may be that these changes were not representative of the physical system.
5.5 Keel line tensions
The suspended keel acts as a counterweight providing floating stability to the system. To ensure this stability, the six keel lines must always remain under tension. In these conditions, it is assumed that the two floating support structure bodies (hull and keel) behave as a rigid body. For the load cases studied within the OC6 Phase IV project, the experimental data and the response of the numerical models confirm that the two bodies predominantly describe a rigid-body motion. The axial stiffness of the keel lines introduces some flexibility into the floating support structure assembly that results in small relative motions, but the difference in the pitch angle between hull and keel is smaller than 0.8° in all studied conditions. The maximum relative rotation between the two bodies was observed in the 50-year storm condition (Load Case 5.4) in the experiment. Most numerical models experience significantly smaller relative motions between hull and keel. This may denote that the keel line axial stiffness used as input for the numerical models is too high or that there is some uncertainty in the motion tracking system used during the testing.
The keel line system is statically determinate. The keel lines withstand the net keel weight (i.e., the difference between the weight of the keel body acting vertically downward and the hydrostatic buoyancy force acting upward). The mean tension at each keel line can be calculated analytically based on the static equilibrium equations (Pereyra, 2018). The keel lines' mean tension distribution is determined by the roll and pitch rotations of the floating support structure. These rotations are mainly driven by the RNA overhang and the aerodynamic loading. For the studied system, the static platform pitch limit where a keel line would become slack is close to 26°. Useful insights can be obtained by performing a parametric analysis of the floater with the analytical model. For example, the keel mass does not change the static platform pitch limit. This is aligned with the observations from previous studies (Pereyra, 2018). By applying scaling factors at the three vertices for the hull base and keel (see Fig. 2c), it can be observed that the static platform pitch limit is only sensitive to the line attachment points at the hull side. Wider spacing between the hull vertices increases the platform pitch limit. The other parameter determining the static platform pitch limit is the keel center-of-mass location with regard to the hull. Shorter distances between the hull and the keel would increase the platform pitch limit. However, shorter distances between hull and keel would result in smaller gravitational restoring moments. In general, longer distances between hull and keel ensuring that all keel lines remain under tension are preferred. It is also important to note that dynamic variations in the line tension may reduce the maximum platform pitch angle allowed.
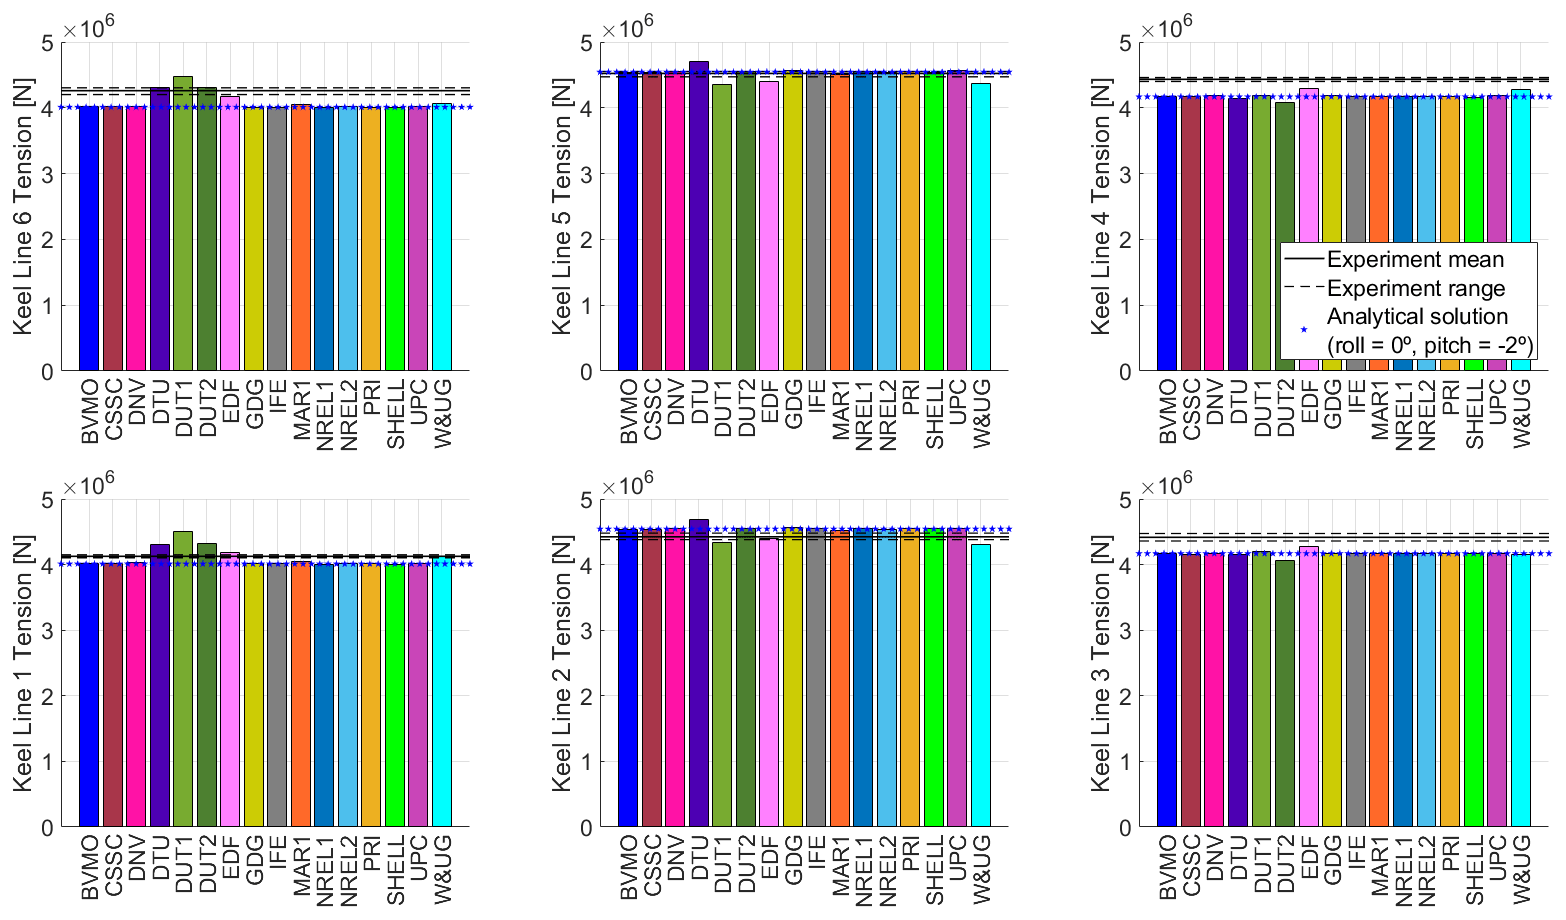
Figure 16 shows the tension for each keel line in the equilibrium condition (Load Case 1.1). The disposition of the subplots follows the physical location of the keel lines shown in Fig. 2b and c. The subplots include the measured mean tension as well as some small variations that were observed during the testing. Figure 16 also includes for reference the computed tension for each line based on the analytical approach, assuming no platform roll and a platform pitch of −2°. This rotation corresponds to the equilibrium conditions observed during the testing and is reproduced by most numerical models. There are some differences between the tensions obtained in the experiment and the ones from the analytical solution. This denotes that some physical properties in the system may be slightly different.
For the equilibrium condition, the disposition of the floating support structure together with the nacelle oriented along the negative x direction results in a symmetric system with respect to the x–z vertical plane (see Fig. 2a and c for reference). This symmetric nature of the system implies that the loading in Keel Lines 1 and 6 are the same, and the same holds true for the pairs of Keel Line 2–Keel Line 5 and Keel Line 3–Keel Line 4.
There is excellent agreement between most numerical models and the analytical solution. Some participants (EDF, W&UG) show differences in keel line tensions because the obtained system equilibrium position is slightly different (i.e., different platform pitch and/or roll values), while other participants (DTU, DUT1, DUT2) reproduce the expected system rotation but may not have the proper settings in their numerical models (e.g., slightly offset keel line attachment points, line properties, or keel net weight).
Figure 17 shows the mean tension for each keel line for the combined wind and wave conditions in Load Cases 5.2, 5.3, and 5.4. The symmetric behavior between keel lines is still present in Load Cases 5.2 and 5.3 due to the keel line disposition around the x–z vertical plane, the nacelle being aligned with the x axis, and the external loading (i.e., wind and waves) being applied along the x axis. For these two load cases, the mean keel line tensions are mainly driven by the mean pitch rotation of the floating support structure. Load Case 5.4 (50-year storm condition) does not exhibit the symmetry around the x–z vertical plane because the system rotates around −2° in roll due to the aerodynamic loading. For this loading condition, the mean keel line loading is determined by the combination of roll and pitch angles of the floating support structure. For these three load cases, the analytical formulation was also able to compute the proper mean keel line tensions based on these rotations.
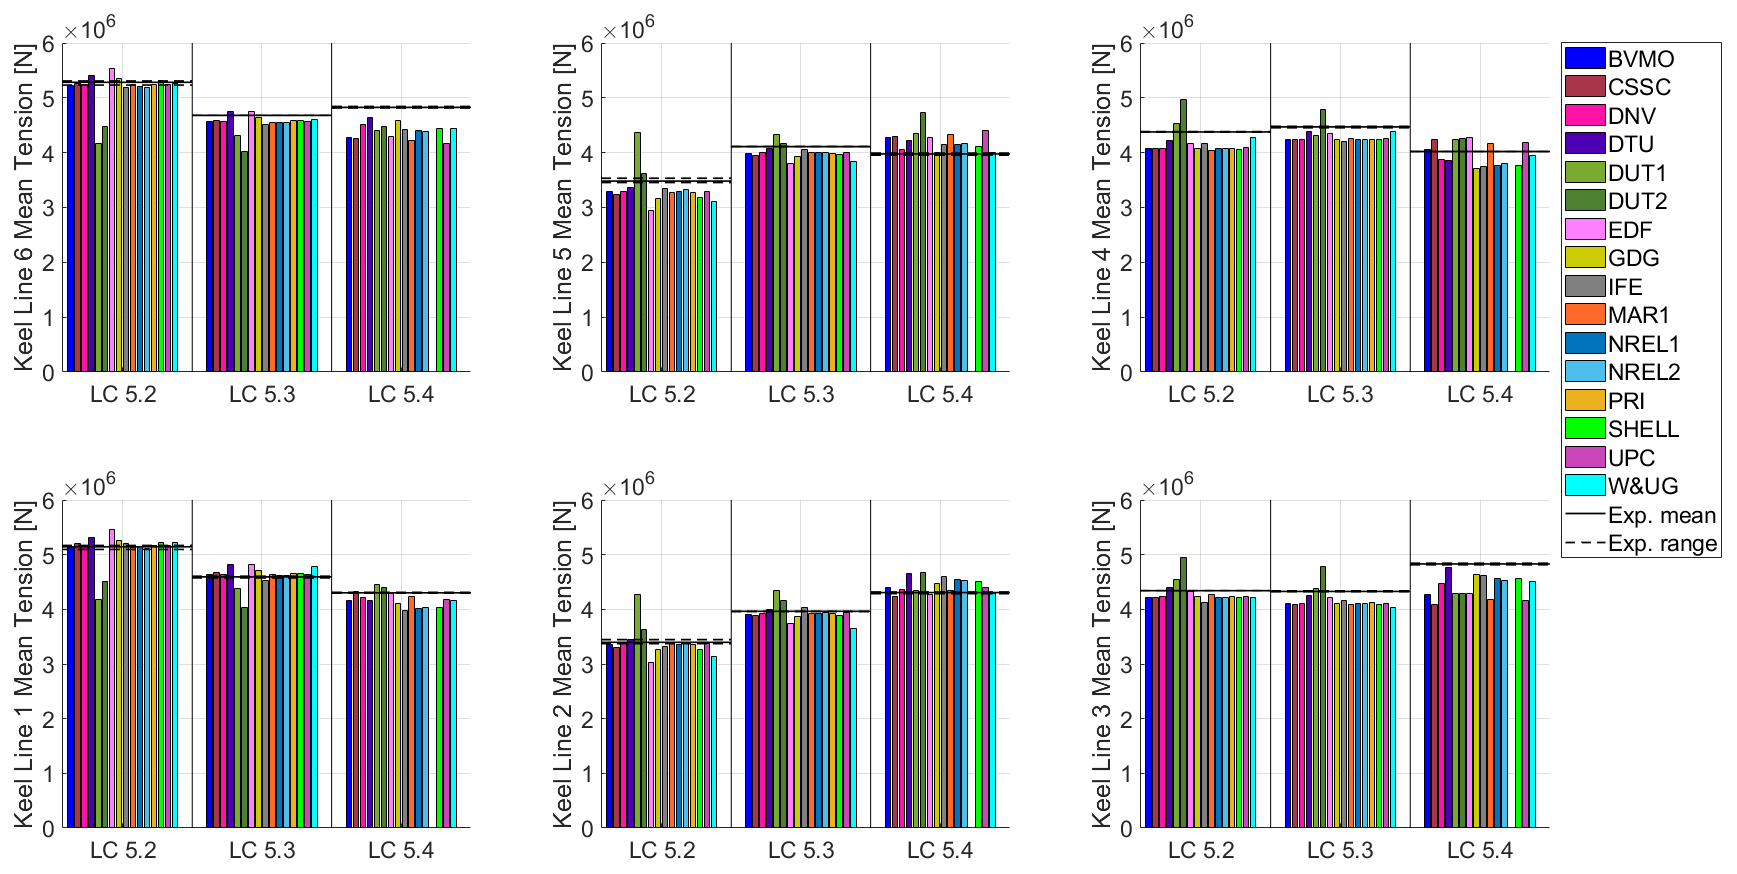
Figure 17Mean tension at the six keel lines for the combined wind and wave conditions in Load Cases (LC) 5.2, 5.3, and 5.4.
Figure 18 shows the PSD of the six keel lines for the combined wind and waves for the post-rated operating condition (Load Case 5.3) and includes the results from the participants as well as the results from three repeats that were performed during the testing. As expected, the keel lines mainly respond at the linear wave excitation region and, similarly to the keel line mean tension, exhibit the loading by keel pairs around the x–z vertical plane. The two keel lines located at the downwind side (i.e., Keel Lines 3 and 4) experience the smallest dynamic response. The small peak around 0.22 Hz corresponds to the 1P frequency due to rotor asymmetry (blade mass and blade pitch imbalance).

Figure 18Power spectral density (PSD) for the six keel lines in the combined wind and wave conditions for the post-rated operating condition (Load Case 5.3).
From a modal analysis performed over the numerical models, it was determined that the translational vibration modes of the suspended keel were located between 1 and 2 Hz and the keel rotational vibration modes between 2.5 and 3 Hz. Despite these keel natural frequencies being relatively high, the analytical formulation used to estimate the mean keel tensions was not able to capture the dynamic response. The keel line dynamic response is likely driven by the inertial loading with contributions from different degrees of freedom (e.g., surge, heave, and pitch) that the quasi-static analytical formulation does not include. This highlights the importance of using higher-fidelity models like the ones used by the participants in this project to estimate the dynamic keel line tensions.
Most numerical models are well-aligned with the response observed in the experiment. Some participants that had the proper floating support structure rotations but issues with the keel line tensions in the equilibrium condition (e.g., DUT1 and DUT2) also exhibit an unexpected dynamic response. This confirms that something is not properly set up in those numerical models.
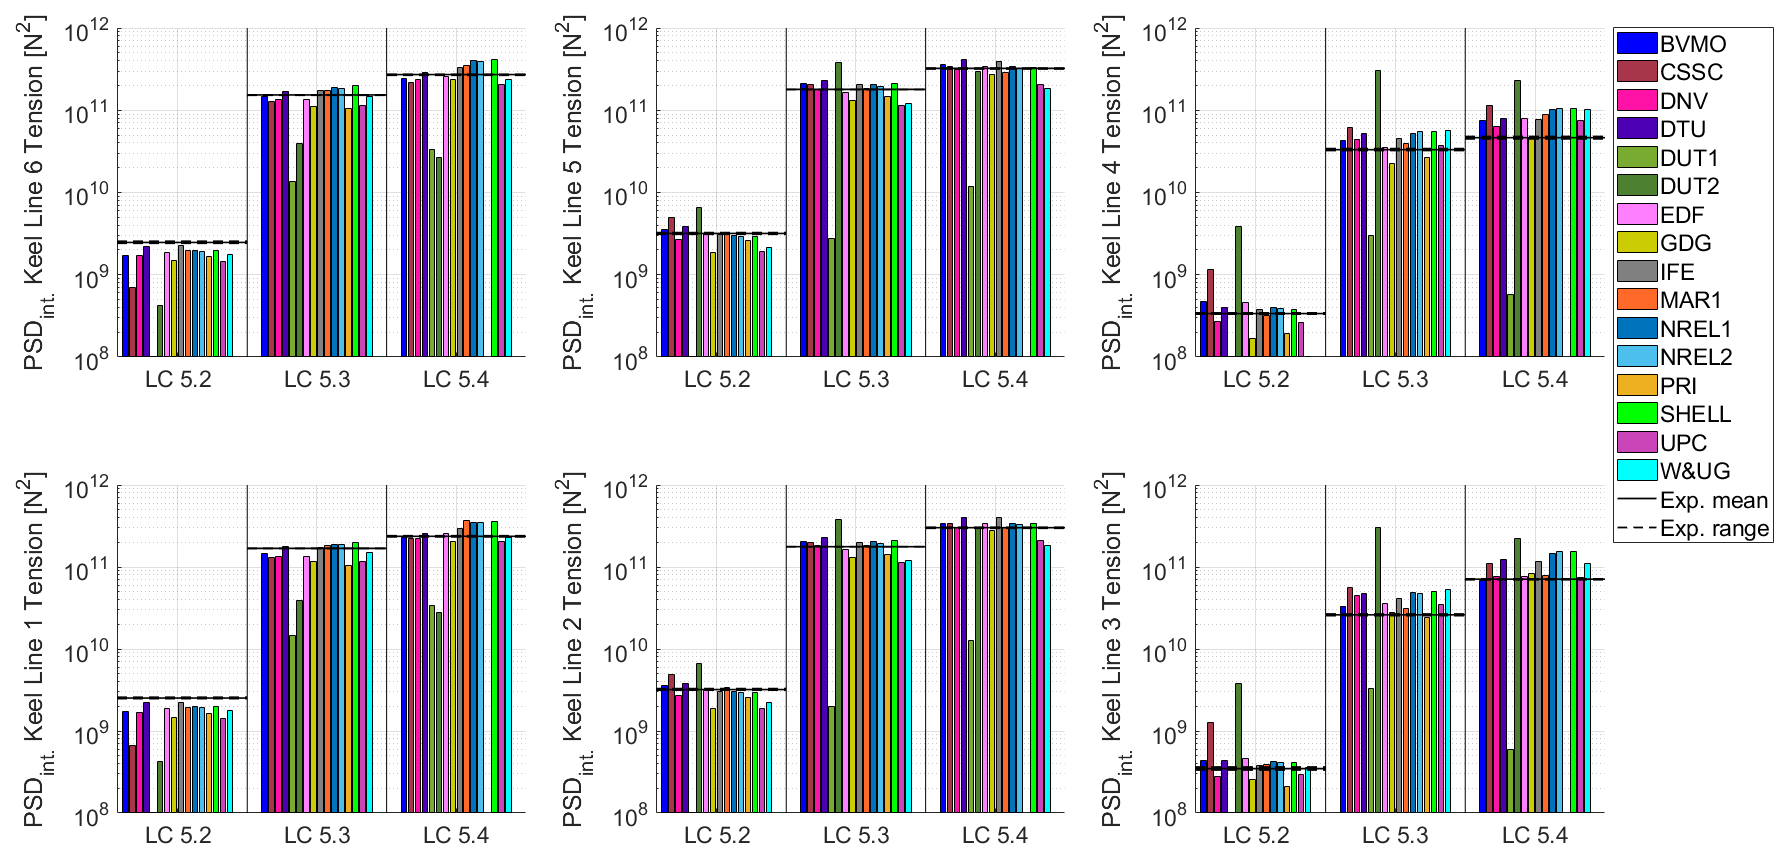
Figure 19Power spectral density (PSD) integral of the six keel lines for the combined wind and wave conditions in Load Cases (LC) 5.2, 5.3, and 5.4. Vertical axis in logarithmic scale.
Figure 19 shows the PSD integral for each keel line for the combined wind and wave conditions in Load Cases 5.2, 5.3, and 5.4. As expected, the PSD integral is larger for the higher waves. For example, the PSD integral in Load Case 5.2 (rated condition) is the smallest, while the PSD integral in Load Case 5.4 (50-year storm) is the largest. As in Fig. 18, it can be observed that the keel lines located at the downwind side always experience the smallest dynamic response.
In the frame of the OC6 Phase IV project, participants modeled a 3.6 MW wind turbine atop the TetraSpar floating support structure designed by Stiesdal Offshore. This configuration is representative of the demonstration project installed in Norway in 2021. Numerical results from participants in the project were compared against measurement data from a 1:43-scale test performed by the University of Maine. The system response was studied under wind, wave, and combined wind and wave conditions.
It is important to note that it was the first time that project participants built numerical models for this novel floating support structure design. Due to the multiphysics nature of the system, including aerodynamics, hydrodynamics, and structural dynamics, participants had to use a coupled aero-hydro-elastic approach. The participants defined modeling approaches according to the capabilities of the code(s) used. Setting up these numerical models was quite challenging and prone to user error. This is evidenced by the fact that some participants used the same code and a similar modeling approach but obtained different system responses.
During the testing of the floating system, the umbilical cable used to transfer measurement data and power had an impact on the system equilibrium position and dynamics. Significant changes in the hull surge and heave equilibrium positions were observed between tests (between −6.7 and +6.4 m in surge and 4 m range in heave from the origin of the coordinate system used). Numerical models included the umbilical cable as an additional line, but there is an uncertainty associated with it. Moreover, for the 50-year storm condition (idling rotor), the umbilical cable could be inducing a significant aerodynamic drag force in the system. This force was not included by the participants because the umbilical cable diameter was not known.
Some differences in the mean wind speed values were also observed between the winds measured during the calibration process and the winds applied during the testing. Participants in the project used the winds measured at hub height during the calibration process as input for the numerical models. However, this may not be fully representative of the actual testing conditions.
Relatively good agreement was observed between the numerical models and the experiment for the aerodynamic loading. The aerodynamic rotor thrust was not directly measured; instead, the platform pitch rotation and the tower base fore–aft bending moment were used as proxy sensors. The pitch rotation experienced by the floating support structure due to the aerodynamic thrust force did not impact the mean aerodynamic loading.
The TetraSpar design is made of slender members. When comparing the Morison equation and potential-flow (augmented with viscus drag) approaches, in general, no clear differences were observed. The largest differences were due to incorrect settings in some numerical models. For the wave loading conditions studied, the response of the numerical models based on the Morison equation approach were driven by the hydrodynamic inertia component. The Morison equation approach is only valid for diameter-to-wavelength ratios smaller than 0.2. To avoid overestimating the response at the first tower-bending mode, numerical models based on the Morison equation approach had to use the MacCamy and Fuchs diffraction correction of the inertia coefficient and/or low-pass-filter the irregular wave spectrum.
When comparing the Wheeler and vertical wave stretching theories, participants using the vertical stretching obtained the largest slow-drift platform motion. NREL also observed increased activity around the first tower-bending mode when using the vertical wave stretching. This resulted in an overestimation for the first tower-bending mode amplitude not observed with the Wheeler stretching theory.
For the combined wind and wave loading, the numerical models showed relatively good agreement for the mean upwind fairlead tension. However, when looking at the dynamic loading, large differences were observed between the numerical models and against the experiment. The response from the numerical models was different even in the linear wave region. The fairlead tensions are determined by the platform motion and the line properties. Differences in the offset platform position under load and dynamic motion around that offset position impact the estimation of the fairlead tensions. Future work may consider prescribing the recorded platform motions during the testing in the numerical models to assess their ability to estimate the mooring line loads.
The TetraSpar design features unique elements like keel lines. Characterizing the keel line tensions is important because the suspended keel ensures the floating system stability. These tensions can only be obtained by numerical models with the ability to include structural flexibility within the floating support structure. The potential-flow (augmented with viscous drag) approach is a viable option to study the keel line loads if the system is discretized into at least two potential-flow bodies (hull and keel). For the TetraSpar design, the keel lines' mean tension can be determined by means of an analytical approach based on static equilibrium equations. The keel lines' mean tension changes observed for the different loading conditions are driven by the floating support structure roll and pitch rotations. Good agreement was observed between most numerical models, the experiment, and the analytical approach. The analytical approach (quasi-static) was not able to capture the dynamic response, but the numerical models and the experiment showed very good agreement between them. This accurate estimation of the keel line tensions enables the computation of the fatigue life for these elements. To account for the loading within the hull and keel, it would be necessary to account for the member-level hydrostatics and hydrodynamics. This is the normal procedure for a Morison-equation-based approach, but it would challenge the potential-flow approach where, potentially, tens of potential-flow bodies may be necessary.
The modeling information, the simulation results, and the experimental data from this project are available to the public through the US Department of Energy Data Archive and Portal, https://doi.org/10.21947/2179225 (Robertson and Bergua, 2023).
AR: secured the funding for the OC6 project. RB, WW, AR, and JJ: proposed the methodology, formal analysis, and investigation. All authors: simulated the system and submitted results from their numerical models (detailed in Sect. 3). RB: post-processed and visualized the data from the experiment and the numerical models. RB: wrote the manuscript draft. All authors: reviewed and edited the paper.
At least one of the (co-)authors is a member of the editorial board of Wind Energy Science. The peer-review process was guided by an independent editor, and the authors also have no other competing interests to declare.
This work was authored in part by the National Renewable Energy Laboratory, operated by the Alliance for Sustainable Energy, LLC, for the US Department of Energy (DOE) under contract no. DE-AC36-08GO28308. Funding was provided by the US Department of Energy Office of Energy Efficiency and Renewable Energy Wind Energy Technologies Office. The views expressed in the article do not necessarily represent the views of the DOE or the US Government. The US Government retains and the publisher, by accepting the article for publication, acknowledges that the US Government retains a nonexclusive, paid-up, irrevocable, worldwide license to publish or reproduce the published form of this work, or allow others to do so, for US Government purposes.
Publisher's note: Copernicus Publications remains neutral with regard to jurisdictional claims made in the text, published maps, institutional affiliations, or any other geographical representation in this paper. While Copernicus Publications makes every effort to include appropriate place names, the final responsibility lies with the authors.
The authors would like to thank the TetraSpar Demonstrator ApS Consortium (Shell, RWE Renewables, TEPCO RP, Stiesdal Offshore) and the University of Maine for providing the data to characterize the numerical models and the measurements from the experimental campaign.
MARIN would like to acknowledge that their contribution to the project was partly funded by the Dutch Ministry of Economic Affairs and Climate Policy.
This research has been supported by the Office of Energy Efficiency and Renewable Energy (grant no. DE-AC36-08GO28308).
This paper was edited by Erin Bachynski-Polić and reviewed by Carlos Silva de Souza and one anonymous referee.
Allen, C. and Fowler, M.: rd Scale Basin Testing of the 3.6 MW TetraSpar Floating Offshore Wind Turbine – Spar Configuration. Advanced Structures and Composites Center, Report No. 19-25-1720, University of Maine, 2019.
Babarit, A. and Delhommeau, G.: Theoretical and numerical aspects of the open source BEM solver NEMOH, in: 11th European Wave and Tidal Energy Conference (EWTEC2015), 6–11 September 2015, Nantes, France, 2015.
Bergua, R., Robertson, A., Jonkman, J., Platt, A., Page, A., Qvist, J., Amet, E., Cai, Z., Han, H., Beardsell, A., Shi, W., Galván, J., Bachynski-Polić, E., McKinnon, G., Harnois, V., Bonnet, P., Suja-Thauvin, L., Hansen, A. M., Mendikoa-Alonso, I., Aristondo, A., Battistella, T., Guanche, R., Schünemann, P., Pham, T., Trubat, P., Alarcón, D., Haudin, F., and Quan-Nguyen, M., Goveas, A.: OC6 Phase II: Integration and verification of a new soil–structure interaction model for offshore wind design, Wind Energy, 25, 793–810, https://doi.org/10.1002/we.2698, 2022.
Bergua, R., Robertson, A., Jonkman, J., Branlard, E., Fontanella, A., Belloli, M., Schito, P., Zasso, A., Persico, G., Sanvito, A., Amet, E., Brun, C., Campaña-Alonso, G., Martín-San-Román, R., Cai, R., Cai, J., Qian, Q., Maoshi, W., Beardsell, A., Pirrung, G., Ramos-García, N., Shi, W., Fu, J., Corniglion, R., Lovera, A., Galván, J., Nygaard, T. A., dos Santos, C. R., Gilbert, P., Joulin, P.-A., Blondel, F., Frickel, E., Chen, P., Hu, Z., Boisard, R., Yilmazlar, K., Croce, A., Harnois, V., Zhang, L., Li, Y., Aristondo, A., Mendikoa Alonso, I., Mancini, S., Boorsma, K., Savenije, F., Marten, D., Soto-Valle, R., Schulz, C. W., Netzband, S., Bianchini, A., Papi, F., Cioni, S., Trubat, P., Alarcon, D., Molins, C., Cormier, M., Brüker, K., Lutz, T., Xiao, Q., Deng, Z., Haudin, F., and Goveas, A.: OC6 project Phase III: validation of the aerodynamic loading on a wind turbine rotor undergoing large motion caused by a floating support structure, Wind Energ. Sci., 8, 465–485, https://doi.org/10.5194/wes-8-465-2023, 2023.
Borg, M., Viselli, A., Allen, C. K., Fowler, M., Sigshøj, C., Grech La Rosa, A., Andersen, M. T., and Stiesdal, H.: Physical Model Testing of the TetraSpar Demo Floating Wind Turbine Prototype. In International Conference on Offshore Mechanics and Arctic Engineering, American Society of Mechanical Engineers, https://doi.org/10.1115/IOWTC2019-7561, 2019.
Cioni, S., Papi, F., Pagamonci, L., Bianchini, A., Ramos-García, N., Pirrung, G., Corniglion, R., Lovera, A., Galván, J., Boisard, R., Fontanella, A., Schito, P., Zasso, A., Belloli, M., Sanvito, A., Persico, G., Zhang, L., Li, Y., Zhou, Y., Mancini, S., Boorsma, K., Amaral, R., Viré, A., Schulz, C. W., Netzband, S., Soto-Valle, R., Marten, D., Martín-San-Román, R., Trubat, P., Molins, C., Bergua, R., Branlard, E., Jonkman, J., and Robertson, A.: On the characteristics of the wake of a wind turbine undergoing large motions caused by a floating structure: an insight based on experiments and multi-fidelity simulations from the OC6 project Phase III, Wind Energ. Sci., 8, 1659–1691, https://doi.org/10.5194/wes-8-1659-2023, 2023.
Craig, R. R. and Bampton, M. C. C.: Coupling of Substructures for Dynamic Analyses, AIAA J., 6, 1313–1319, 1968.
Det Norske Veritas: Environmental conditions and environmental loads, DNV-RP-C205, https://www.dnv.com/oilgas/download/dnv-rp-c205-environmental-conditions-and-environmental-loads/ (last access: 10 May 2023), 2010.
Faltinsen, O.: Sea loads on ships and offshore structures, in: Vol. 1, Cambridge University Press, ISBN 9780521458702, ISBN 0521458706, 1993.
IEA Wind: International Energy Agency Wind Technology Collaboration Programme Task 30, https://www.iea-wind.org/task30/ (last access: 3 July 2023), 2023.
Jonkman, J., Robertson, A., Popko, W., Vorpahl, F., Zuga, A., Kohlmeier, M., Larsen, T. J., Yde, A., Saetertro, K., Okstad, K. M., Nichols, J., Nygaard, T. A., Gao, Z., Manolas, D., Kim, K., Yu, Q., Shi, W., Park, H., Vasquez-Rojas, A., Dubois, J., Kaufer, D., Thomassen, P., de Ruiter, M. J., Peeringa, J. M., Zhiwen, H., and von Waaden, H.: Offshore Code Comparison Collaboration Continuation (OC4), Phase I – Results of Coupled Simulations of an Offshore Wind Turbine with Jacket Support Structure, NREL/CP-5000-54124, National Renewable Energy Laboratory, Golden, CO, USA, https://www.nrel.gov/docs/fy12osti/54124.pdf (last access: 20 April 2024), 2012.
Jonkman, B., Platt, A., Mudafort, R., Branlard, E., Sprague, M., Ross, H., et al.: OpenFAST v3.5.1, Zenodo [code], https://doi.org/10.5281/zenodo.10028176, 2023.
Jonkman, J. and Musial, W.: Offshore code comparison collaboration (OC3) for IEA Wind Task 23 offshore wind technology and deployment, NREL/TP-5000-48191, National Renewable Energy Laboratory, Golden, CO, USA, https://doi.org/10.2172/1004009, 2010.
Lee, C. H. and Newman, J. N.: WAMIT User Manual, WAMIT, Inc., Chestnut Hill, MA, USA, https://www.wamit.com/manual7.x/v75_manual.pdf (last access: 22 April 2024), 2006.
Liu, Y.: HAMS: A Frequency-Domain Preprocessor for Wave-Structure Interactions – Theory, Development, and Application, J. Mar. Sci. Eng., 7, 81, https://doi.org/10.3390/jmse7030081, 2019.
MacCamy, R. C. and Fuchs, R. A.: Wave forces on piles: A diffraction theory, US Army Corps of Engineers, Beach Erosion Board, https://erdc-library.erdc.dren.mil/jspui/handle/11681/3444 (last access: 2 June 2023), 1954.
Pegalajar-Jurado, A., Madsen, F. J., and Bredmose, H.: Damping identification of the TetraSpar floater in two configurations with Operational Modal Analysis, in: International Conference on Offshore Mechanics and Arctic Engineering, American Society of Mechanical Engineers, https://doi.org/10.1115/iowtc2019-7623, 2019.
Pereyra, B. T.: Design of a counter weight suspension system for the Tetraspar floating offshore wind turbine, MS thesis, NTNU, https://repository.tudelft.nl/islandora/object/uuid:08b3f210-f28d-4349-b44a-d2a2f16b6da8?collection=education (last access: 2 June 2023), 2018.
Popko, W., Huhn, M. L., Robertson, A., Jonkman, J., Wendt, F., Müller, K., Kretschmer, M., Vorpahl, F., Hagen, T. R., Galinos, C., Le Dreff, J.-B., Gilbert, P., Auriac, B., Navarro-Víllora, F., Schünemann, P., Bayati, I., Belloli, M., Oh, S., Totsuka., Y., Qvist, J., Bachynski, E., Sørum, S. H., Thomassen, P. E., Shin, H., Vittori, F., Galván, J., Molins, C., Bonnet, P., van der Zee, T., Bergua, R., Wang, K., Fu, P., and Cai, J.: Verification of a numerical model of the offshore wind turbine from the alpha ventus wind farm within oc5 phase iii, in: International Conference on Offshore Mechanics and Arctic Engineering, Vol. 51319, V010T09A056, American Society of Mechanical Engineers, https://doi.org/10.1115/OMAE2018-77589, 2018.
Popko, W., Robertson, A., Jonkman., J., Wendt, F., Thomas, P., Müller, K., Kretschmer, M., Hagen, T. R., Galinos, C., Le Dreff, J.-B., Gilbert, P., Auriac, B., Oh, S., Qvist, J., Sørum, S. H., Suja-Thauvin, L., Shin, H., Molins, C., Trubat, P., Bonnet, P., Bergua, R., Wang, K., Fu, P., Cai, J., Cai, Z., Alexandre, A., and Harries, R.: Validation of numerical models of the offshore wind turbine from the alpha ventus wind farm against full-scale measurements within OC5 Phase III, in: ASME 2019 38th International Conference on Ocean, Offshore and Arctic Engineering, American Society of Mechanical Engineers Digital Collection, https://doi.org/0.1115/OMAE2019-95429, 2019.
Robertson, A. and Bergua, R.: OC6 Project Phase IV: Validation of Numerical Models for Novel Floating Offshore Wind Support Structures, US Department of Energy [data set], https://doi.org/10.21947/2179225, 2023.
Robertson, A., Jonkman, J., Musial, W., Vorpahl, F., and Popko, W.: Offshore code comparison collaboration, continuation: Phase II results of a floating semisubmersible wind system, NREL/CP-5000-60600, National Renewable Energy Laboratory, Golden, CO, USA, https://www.nrel.gov/docs/fy14osti/60600.pdf (last access: 20 April 2024), 2013.
Robertson, A., Wendt, F., Jonkman, J., Popko, W., Vorpahl, F., Stansberg, C. T., Bachynski, E. E., Bayati, I., Beyer, F., de Vaal, J. B., Harries, R., Yamaguchi, A., Shin, H., Kim, B., van der Zee, T., Bozonnet, P., Aguilo, B., Bergua, R., Qvist, J., Qijun, W., Chen, X., Guerinel, M., Tu, Y., Yutong, H., Li, R., and Bouy, L.: OC5 project phase I: Validation of hydrodynamic loading on a fixed cylinder, NREL/CP-5000-63567, National Renewable Energy Laboratory, Golden, CO, USA, https://www.nrel.gov/docs/fy15osti/63567.pdf (last access: 20 April 2024), 2015.
Robertson, A. N., Wendt, F., Jonkman, J., Popko, W., Borg, M., Bredmose, H., Schlutter, F., Qvist, J., Bergua, R., Harries, R., Yde, A., Nygaard, T. A., de Vaal, J. B., Oggiano, L., Bozonnet, P., Bouy, L., Barrera Sanchez, C., Guanche García, R., Bachynski, E. E., Tu, Y., Bayati, I., Borisade, F., Shin, H., van der Zee, T., and Guerinel, M.: OC5 Project Phase Ib: validation of hydrodynamic loading on a fixed, flexible cylinder for offshore wind applications, NREL/JA-5000-66648, National Renewable Energy Laboratory, Golden, CO, USA, https://doi.org/10.1016/j.egypro.2016.09.201, 2016.
Robertson, A. N., Wendt, F., Jonkman, J., Popko, W., Dagher, H., Gueydon, S., Qvist, J., Vittori, F., Azcona, J., Uzunoglu, E., Guedes Soares, C., Harries, R., Yde, A., Galinos, C., Hermans, K., de Vaal, J. B., Bozonnet, P., Bouy, L., Bayati, I., Bergua, R., Galván, J., Mendikoa, I., Barrera Sanchez, C., Shin, H., Oh, S., Molins, C., and Debruyne, Y.: OC5 project phase II: validation of global loads of the DeepCwind floating semisubmersible wind turbine, Energy Proced., 137, 38–57, https://doi.org/10.1016/j.egypro.2017.10.333, 2017.
Robertson, A. N., Gueydon, S., Bachynski, E., Wang, L., Jonkman, J., Alarcón, D., Amet, E., Beardsell, A., Bonnet, P., Boudet, B., Brun, C., Chen, Z., Féron, M., Forbush, D., Galinos, C., Galván, J., Gilbert, P., Gómez, J., Harnois, V., Haudin, F., Hu, Z., le Dreef, J., Leimeister, M., Lemmer, F., Li, H., McKinnon, G., Mendikoa, I., Moghtadaei, A., Netzband, S., Oh, S., Pegalajar-Jurado, A., Nguyen, M. Q., Ruehl, K., Schünemann, P., Shi, W., Shin, H., Si, Y., Surmont, F., Trubat, P., Qvist, J., and Wohlfaahrt-Laymann, S.: OC6 Phase I: Investigating the underprediction of low-frequency hydrodynamic loads and responses of a floating wind turbine, J. Phys.: Conf. Ser., 1618, 032033, https://doi.org/10.1088/1742-6596/1618/3/032033, 2020.
Sharma, J. N. and Dean, R. G. Second-order directional seas and associated wave forces, Soc. Petrol. Eng. J., 21, 129–140, https://doi.org/10.2118/8584-PA, 1981.
Stiesdal Offshore: The TetraSpar Full-Scale Demonstration Project, https://www.stiesdal.com/offshore-technologies/the-tetraspar-full-scale-demonstration-project/ (last access: 5 April 2022), 2022.
Thomsen, J. B., Têtu, A., and Stiesdal, H.: A comparative investigation of prevalent hydrodynamic modelling approaches for floating offshore wind turbine foundations: a TetraSpar case study, J. Mar. Sci. Eng., 9, 683, https://doi.org/10.3390/jmse9070683, 2021.
Torsethaugen, K. and Haver, S.: Simplified Double Peak Spectral Model for Ocean Waves, SINTEF, Trondheim, Norway, https://www.sintef.no/globalassets/upload/fiskeri_og_havbruk/konferanser/2004-jsc-193.pdf (last access: 20 April 2024), 2004.
University of Maine: Alfond W2 Ocean Engineering Lab, https://composites.umaine.edu/facilities/w2/ (last access: 10 April 2022), 2022.
Wang, L., Robertson, A., Jonkman, J., Yu, Y-H., Koop, A., Borràs Nadal, A., Li, H., Bachynski-Polić, E., Pinguet, R., Shi, W., Zeng, X., Zhou, Y., Xiao, Q., Kumar, R., Sarlak, H., Ransley, E., Brown, S., Hann, M., Netzband, S., Wermbter, M., and Méndez López, B.: OC6 Phase Ib: Validation of the CFD predictions of difference-frequency wave excitation on a FOWT semisubmersible, Ocean Eng., 241, 110026, https://doi.org/10.1016/j.oceaneng.2021.110026, 2021.
Wiley, W., Bergua, R., Robertson, A., Jonkman, J., and Wang, L.: Definition of the SOT TetraSpar Floating Wind System for OC6 Phase IV, NREL/TP-5700-86442, National Renewable Energy Laboratory, Golden, CO, USA, https://doi.org/10.2172/2203218, 2023.