the Creative Commons Attribution 4.0 License.
the Creative Commons Attribution 4.0 License.
 | 29 Jul 2024
Dynamic performance of a passively self-adjusting floating wind farm layout to increase the annual energy production
Mohammad Youssef Mahfouz
Ericka Lozon
Matthew Hall
Po Wen Cheng
One of the main differences between floating offshore wind turbines (FOWTs) and fixed-bottom turbines is the angular and translational motions of FOWTs. When it comes to planning a floating wind farm (FWF), the translational motions introduce an additional layer of complexity to the FWF layout. The ability of a FOWT to relocate its position represents an opportunity to mitigate wake losses within an FWF. By passively relocating downwind turbines out of the wake generated by upwind turbines, we can reduce wake-induced energy losses and enhance overall energy production. The translational movements of FOWTs are governed by the mooring system attached to it. The way a FOWT relocates its position changes if the design of the mooring system attached to it changes. Additionally, the translational motion of a FOWT attached to a given mooring system is different for different wind directions. Hence, we can tailor a mooring system design for a FOWT to passively control its motions according to the wind direction. In this work, we present a new self-adjusting FWF layout design and assess its performance using both static and dynamic methods. The results show that relocating the FOWTs in an FWF can increase the energy production by 3 % using a steady-state wake model and 1.4 % using a dynamic wake model at a wind speed of 10 m s−1. Moreover, we compare the fatigue and ultimate loads of the mooring systems of the self-adjusting FWF layout design to the mooring systems in a current state-of-the-art FWF baseline design. The comparison shows that with smaller mooring system diameters, the self-adjusting FWF design has similar fatigue damage compared to the baseline design with bigger mooring system diameters at rated wind speed. Finally, the ultimate loads on the mooring systems of the self-adjusting FWF design are lower than those on the mooring systems of the baseline design.
- Article
(5934 KB) - Full-text XML
- BibTeX
- EndNote


To achieve our energy goals and harness more wind energy in sites with high wind resources, we cluster wind turbines into wind farms. However, this leads to energy losses inside the farm due to the generation of wakes. As the ambient wind field passes through a wind turbine, the turbine extracts energy out of the wind field, increasing its turbulence and decreasing its speed. When this lower speed and higher turbulence wind field reaches a downwind turbine, the turbine produces less energy and suffers from higher fatigue loads compared to the upwind one. The differences between the energy produced by the upwind and downwind turbines inside a wind farm are known as wake losses. For fixed-bottom onshore and offshore wind farms, the current state of the art is to optimize the wind farm layout to decrease the wake losses and increase the farm's annual energy production (AEP) (Baker et al., 2019). Other wind farm layout optimization techniques focus on decreasing the cable length within the wind farm (Fleming et al., 2016) or using multidisciplinary design, analysis, and optimization to decrease the wind farm's levelized cost of energy by optimizing the different components inside the wind farm's complex multidisciplinary system (Perez-Moreno et al., 2018). However, to the best of our knowledge, none of the current wind farm layout optimization techniques account for the ability of a floating offshore wind turbine (FOWT) to relocate its position in the horizontal plane.
For a FOWT, the mooring system is responsible for station-keeping, as the catenary mooring system provides stiffness in surge, sway, and yaw degrees of freedom (DoFs). The mooring system allows the FOWTs to move within a constrained region called the watch circle. As the mooring system design changes, the stiffness of the FOWT's station-keeping system changes, and the shape of the watch circle changes. The ability of a FOWT to relocate its position is a new DoF that should be considered inside a floating wind farm (FWF) for two reasons. First, the translational motions of a FOWT have an effect on the FWF's AEP. Not considering these displacements increases the uncertainty in the FWF AEP calculations and hence increases the risk of investment (Bodini et al., 2020). Fleming et al. (2015) show that if a downwind turbine moves in the crosswind direction with a displacement of 20 % of its rotor diameter (D), the energy produced will change by 4 %. The motion can either increase or decrease the FWF's AEP depending on the direction of the motion into the wake or out of the wake. The second reason is that the ability of FOWTs to relocate their positions can be used to increase the FWF energy production.
Several methods have been proposed to achieve beneficial crosswind motions in an FWF. Kheirabadi and Nagamune (2019, 2020) implemented a yaw- and induction-based turbine controller to reposition downwind turbines out of the wake. The idea was to use the FOWT controller to create a crosswind aerodynamic force component by yawing the FOWTs' nacelles to move the downwind turbines out of the wake. The results showed that relocating the FOWTs will increase the FWF's efficiency and that the increase in efficiency is dependent on the mooring system designs because they govern the FOWTs' motions. Rodrigues et al. (2015) changed the positions of FOWTs inside an FWF using a pulley to change the length of the mooring lines according to the wind direction. The results also showed that relocating the FOWTs can increase the FWF's energy production. These previous studies aimed to actively control FOWT positions and showed the dependency of the FOWT motions on the mooring system design. In our previous work (Mahfouz and Cheng, 2023), we proposed a new method to passively relocate the FOWT out of the wake through mooring system design. However, we only used static tools to assess the method, and no dynamic verification was carried out. A summary of these three methods is given in Table 1.
Kheirabadi and Nagamune (2019)Rodrigues et al. (2015)(Mahfouz and Cheng, 2023)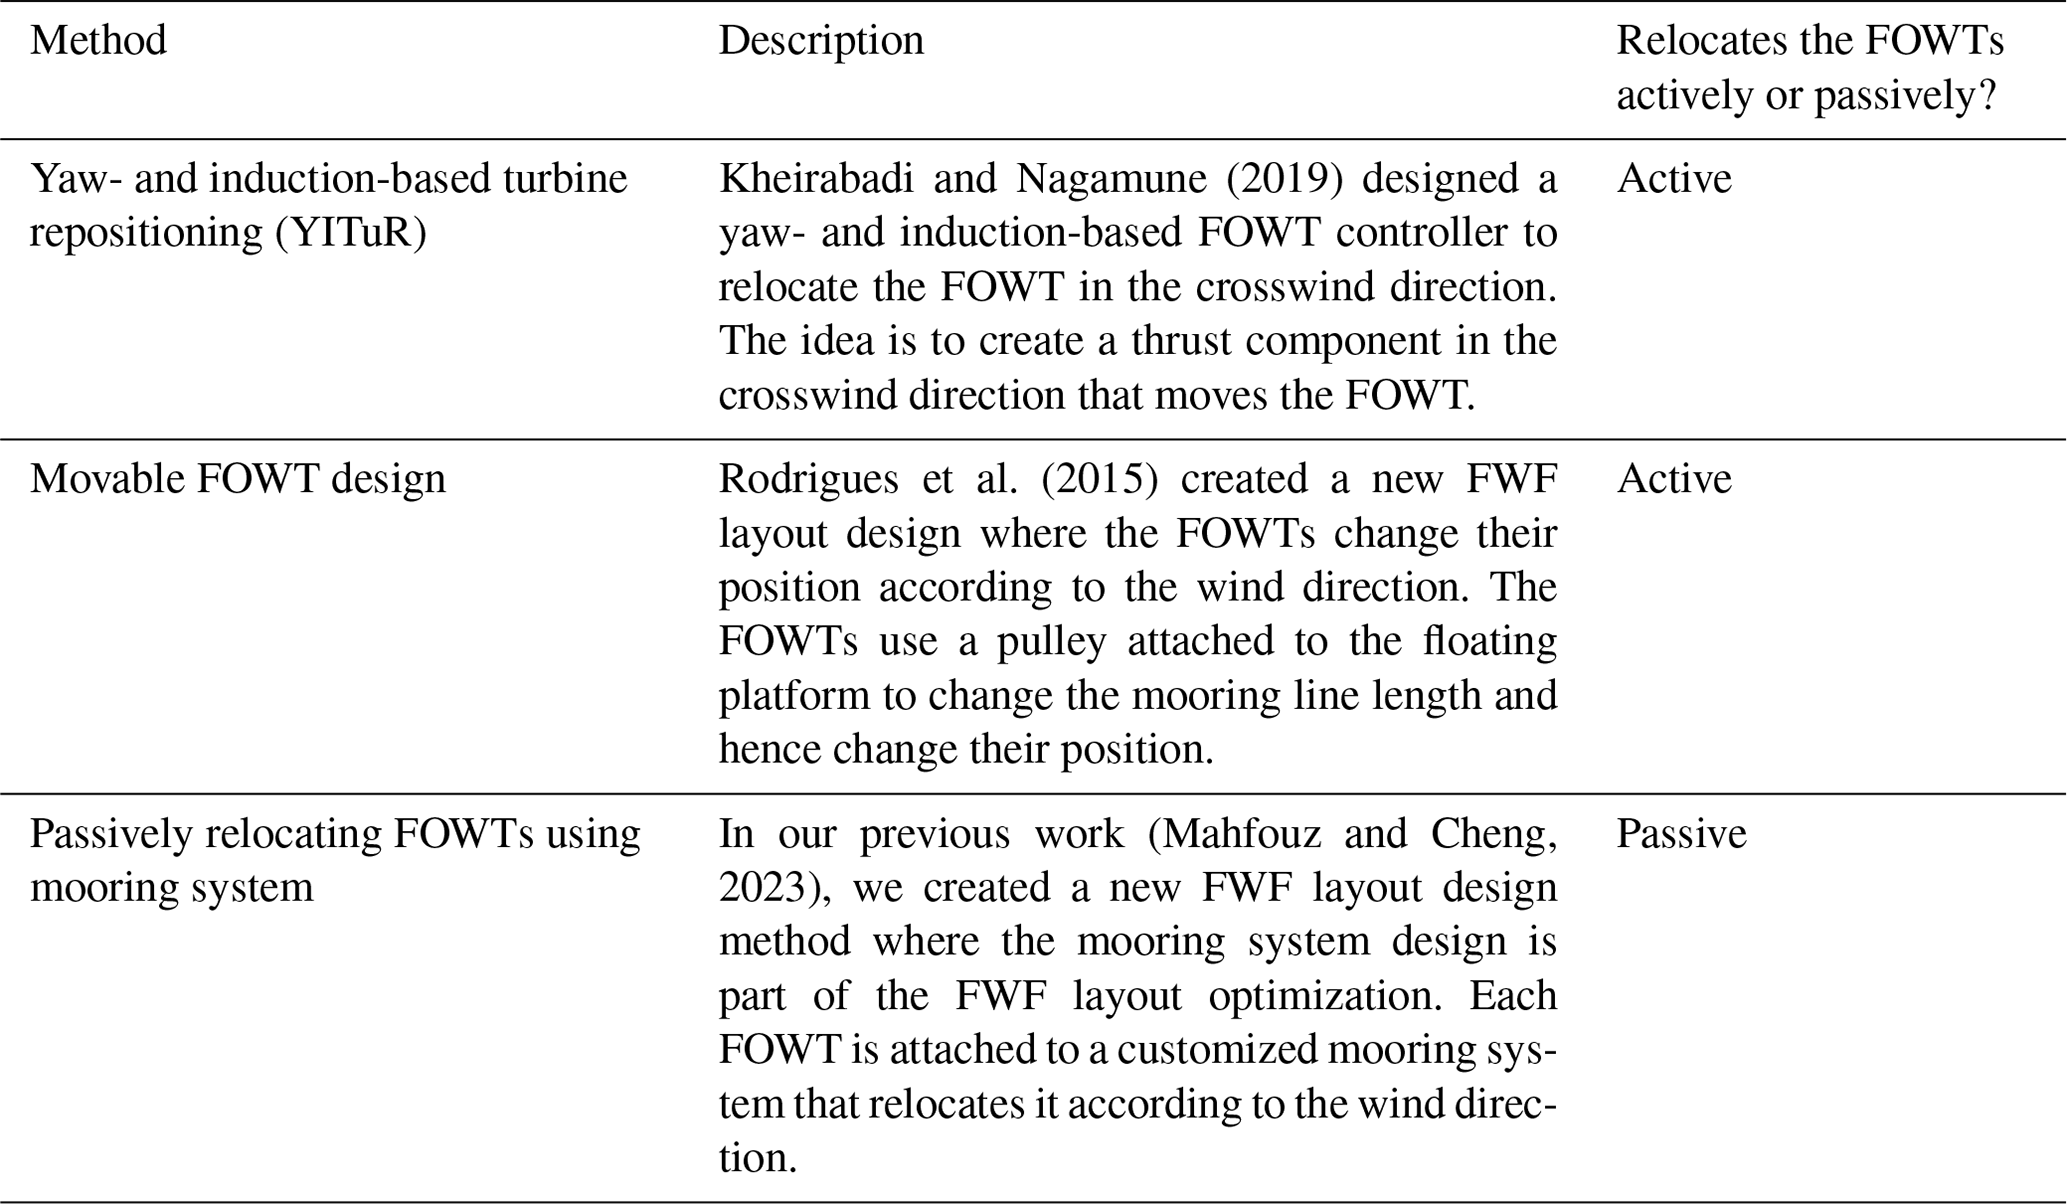
In this paper, we build on our previous work (Mahfouz and Cheng, 2023), in which we presented a methodology to passively relocate the FOWTs in an FWF to increase the farm's AEP. The methodology customizes the mooring system design of each FOWT to increase the FWF's AEP by allowing larger platform offsets and reducing farm wake losses. Mahfouz and Cheng (2023) showed that we can passively relocate the turbines and quantified the gain in AEP we can achieve by passively relocating the FOWTs. However, until this point all our work was done using static tools focusing only on increasing the AEP gain without assessing the performance of the FWF layout design under dynamic wind and wave loading. In this paper, we extend our work to verify the results using dynamic models. Our goal is to assess the performance of our FWF layout design in both operational and extreme loading conditions. We will evaluate whether the larger displacements of the FOWTs increase the fatigue and extreme loads for the novel mooring system designs compared to a traditional, state-of-the-art, baseline mooring system. Moreover, we will verify the results of the steady-state wake model, which does not consider the FOWT's motions, against the dynamic wake model, which considers the FOWT's motions. The wind farm layout and the mooring system designs presented in this work are not the global optimum designs, as this is not the goal of the method as stated and presented in our work Mahfouz and Cheng (2023).
To accomplish this, we first present the baseline layout, the passively self-adjusting FWF layout design, and the energy gain we expect to achieve using static tools. Next, we present the stiffness and natural frequency values of each mooring system design within the FWF. Then, we compare the watch circles of the mooring system designs obtained using MoorPy with those obtained using OpenFAST. We compare the energy gain between steady-state and dynamic wake models at a constant wind speed of 10 m s−1. We also calculate the fatigue damage on the mooring system designs and compare it to the fatigue damage of a baseline mooring system design. Finally, we assess the loads on the new mooring system designs under extreme wind and wave conditions to determine their ability to withstand ultimate loads.
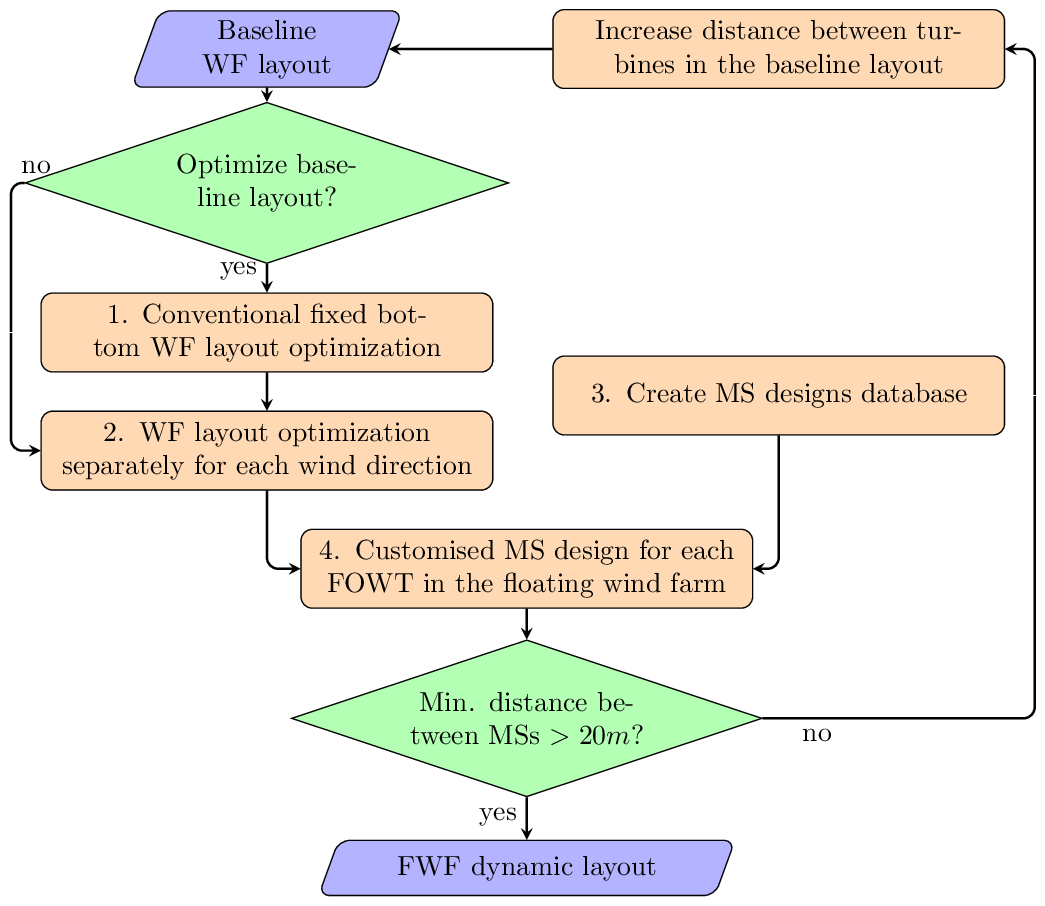
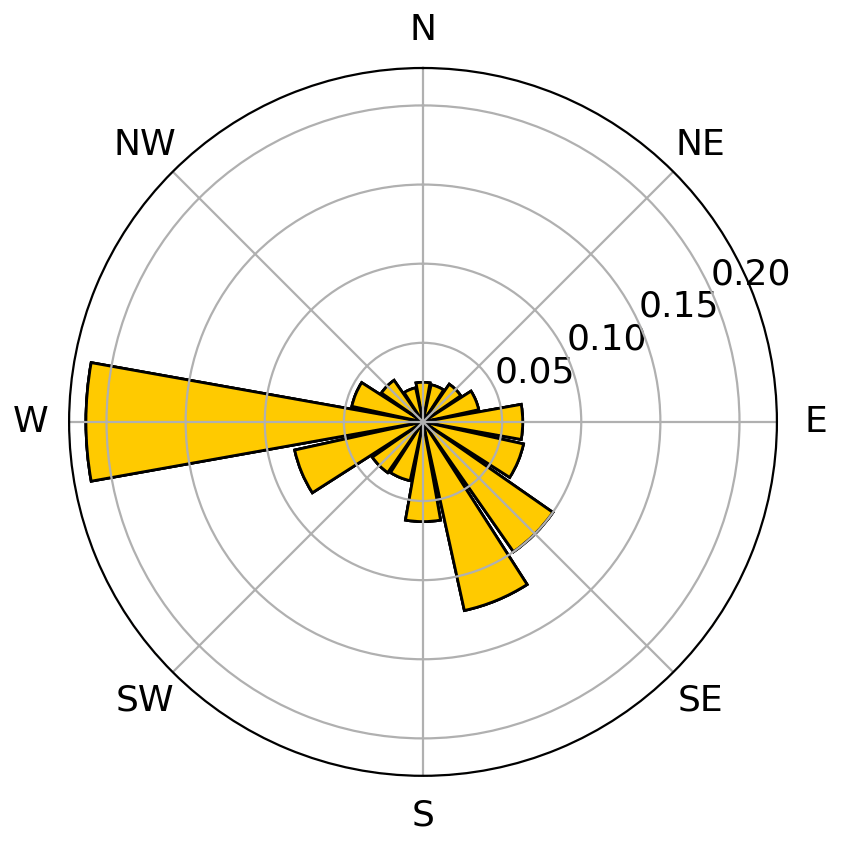
In this section we present the methodology to design the passively self-adjusting layout starting from a baseline wind farm layout. Additionally, we show the results of the static models for each step of the design process. The design process consists of four main steps as shown in Fig. 1. We discuss each step in the following sections. Throughout this work, we use the International Energy Agency Wind Technology Collaboration Programme (IEA Wind) 15 MW reference wind turbine (Gaertner et al., 2020) coupled to the Activefloat semisubmersible floater as presented by Mahfouz et al. (2021). The wind rose introduced within IEA Wind Task 37 (Baker et al., 2019) presented in Fig. 2 was used in this study. Throughout this work, the wind speed was assumed to be constant in all wind directions and equal to 10 m s−1. We chose the value of 10 m s−1 to be just below the rated wind speed of 11 m s−1 of the FOWT reference model, as wakes have no effect on the wind farm's energy production above the rated wind speed. The wind speed used has no effect on the method as it is independent of the wind speed: any below-rated wind speed can be used. A wind speed just below the rated wind speed of the turbine is recommended as this is where the energy gain is the highest.
The controller tuned for the Activefloat coupled to the 15 MW reference turbine in the work of Mahfouz et al. (2021, 2020) is used in the current work. The controller is a simple generator torque controller for the below-rated wind speed and collective pitch controller for the above rated wind speeds with no tower top feedback and no yaw control. The controller was not retuned in this work with the change of the mooring system designs and was used as is for all simulations in this work.
2.1 Conventional layout optimization
The first step in the novel FWF design methodology is to optimize the wind farm layout using the conventional state-of-the-art methods assuming a fixed-bottom layout. This step can be skipped if the user provides a baseline layout that is already optimized. We start with this step because our goal is to show the gain in a wind farm's AEP due to relocating the FOWTs. Starting from a baseline layout far from the optimum will overestimate the effects of relocating the FOWTs showing higher AEP gain. Instead, we compare the novel passive relocation technique to more traditional layout optimization methods with limited floater motions. The baseline wind farm layout we started with in this paper is shown in Fig. 3. The layout has a square shape and consists of nine wind turbines. We optimized the layout using the gradient-based optimizer SNOPT (Gill et al., 2005, 2008): the objective function was to maximize the wind energy production. The optimization process had two constraints. The first was to keep all turbines within the wind farm boundaries (i.e., within a square of side length 12D). The mooring system designs are not included in this step; hence, when the mooring systems of all FOWTs in the FWF are designed, the anchors will not be within the FWF boundary. The second constraint was that the minimum distance between any two turbines in the wind farm cannot be less than 4D.
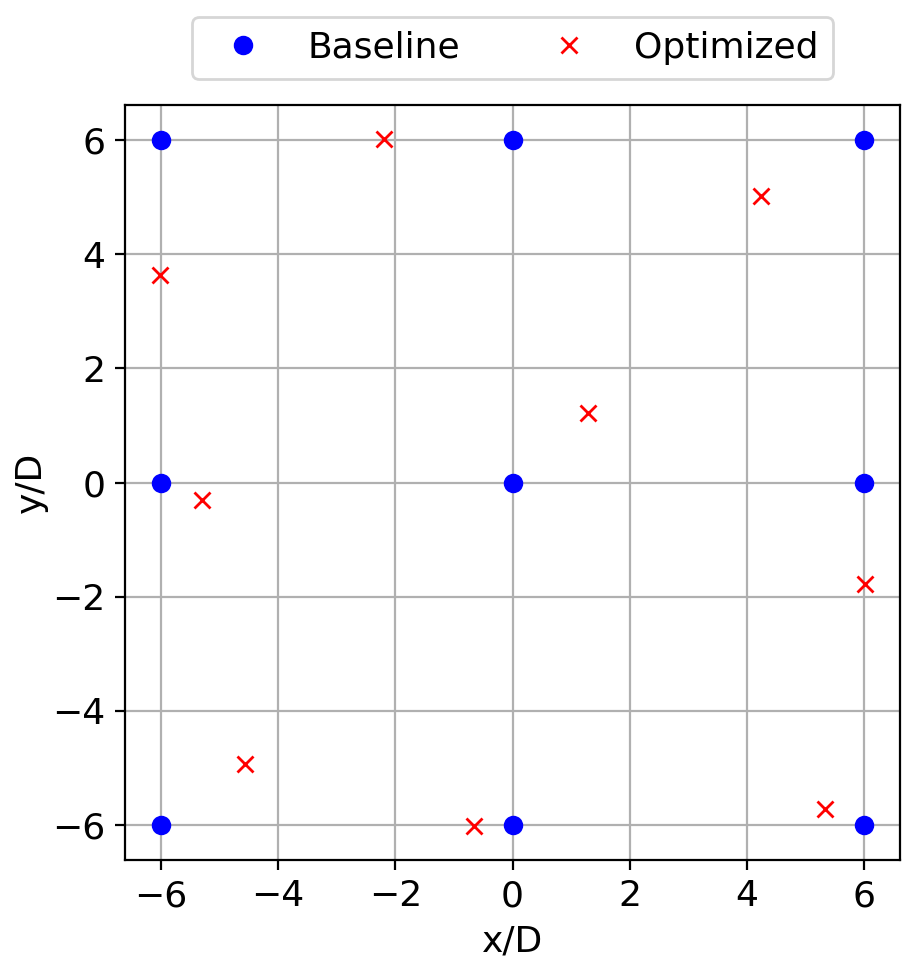
The wakes were estimated during the optimization using FLORIS v3.1 (NREL, 2023). The wake model used was the Gaussian velocity model implemented within the tool based on the works of Bastankhah and Porté-Agel (2016) and Niayifar and Porté-Agel (2016) and Gauss deflection model based on the works of Bastankhah and Porté-Agel (2016) and King et al. (2021). The turbulence model used was the Crespo–Hernández model (Crespo and Hernández, 1996). The wake deflection in FLORIS only accounts for the horizontal wake deflection due to yawing the wind turbines. In this work, the yaw angle is always defined to be zero for all wind turbines within the wind farm; hence, no horizontal wake deflection occurs for all calculations done using FLORIS. The optimized wind farm layout is shown in Fig. 3. We will refer to this layout as the optimized wind farm layout (OWFL) throughout the rest of the text. This layout will be used as a baseline to compare the energy gain after relocating the FOWTs in the FWF. The goal is that the customized mooring system will be coupled to the optimized wind farm layout and passively relocate the FOWTs to decrease wake losses.
The wake losses of the OWFL compared to the non-optimized gridded layout are calculated using Eq. (1), where Eopt is the optimum energy production of the farm at 10 m s−1 assuming no wake losses. The wake losses of the non-optimized gridded layout were −21.31 %, while the OWFL had only −7.66 % wake losses.
2.2 Wind farm layout optimization per wind direction
The next step in the self-adjusting FWF layout design method is to find the FWF-targeted layout. The targeted layout is the optimum wind farm layout we can achieve if we allow each turbine inside the wind farm to displace in the crosswind direction for every wind direction. To achieve the targeted layout, we used the optimization algorithm SNOPT and the same wake model we used to get the optimized wind farm layout. We optimized the wind farm layout separately for each wind direction in the wind rose. The optimization objective was to increase the energy production in every wind direction. The optimization process had two constraints. First, the FOWTs were only allowed to displace in the crosswind direction. Second, the crosswind displacement could not be bigger than 0.5D, which is a distance of 120 m for the 15 MW reference wind turbine.
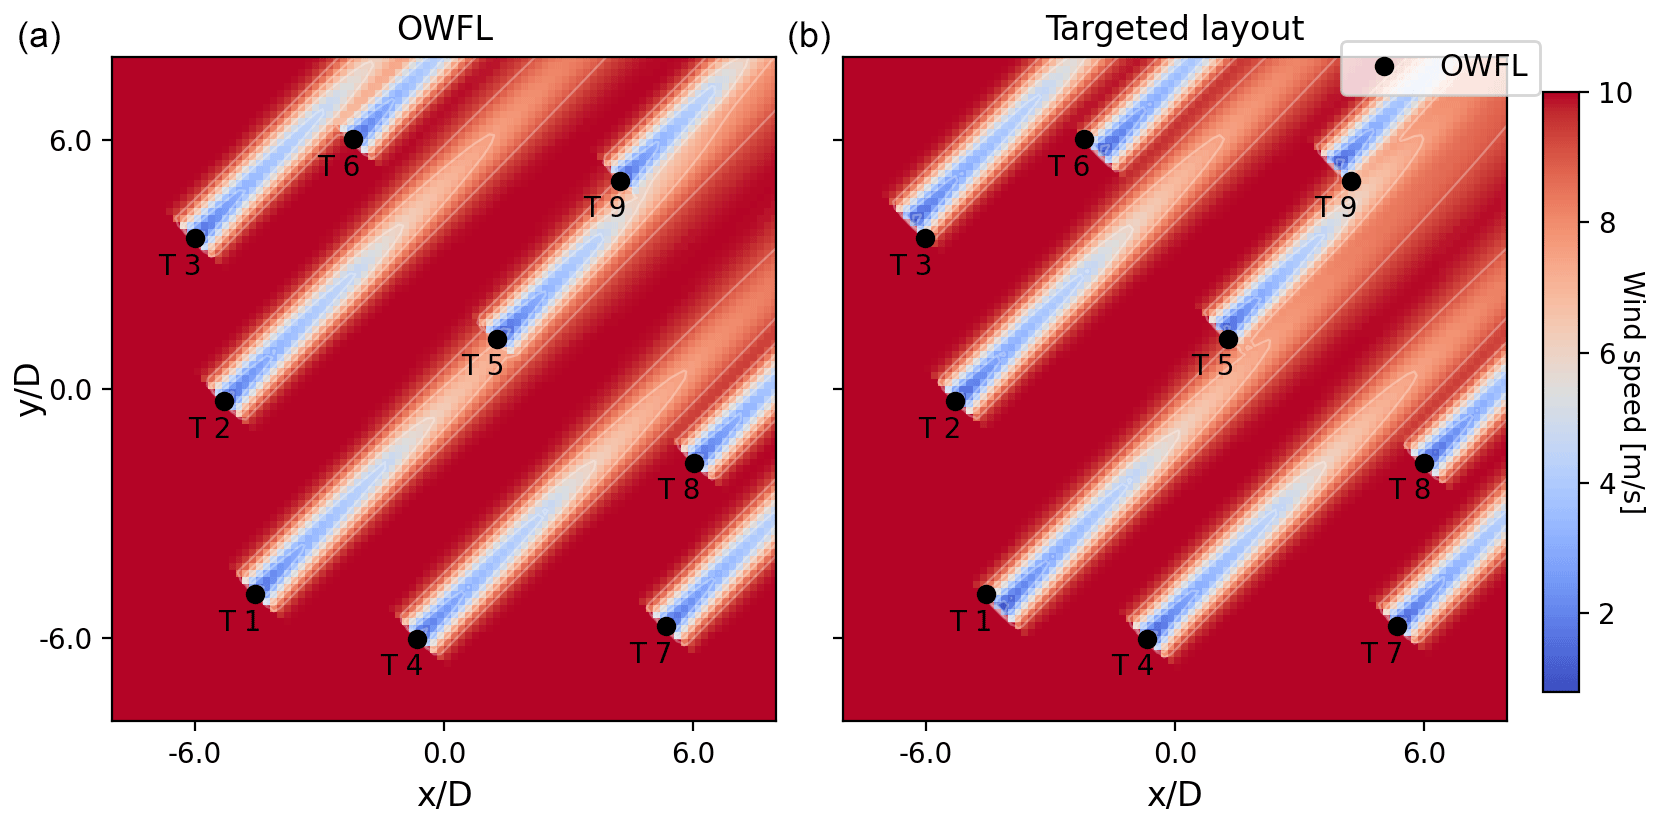
Figure 4Wind farm layouts with wakes modeled by FLORIS: (a) the optimized wind farm layout and (b) the targeted layout. The black dots represent the positions of the turbines from the optimized layout.
Figure 4 shows results of the targeted layout for only one wind direction; this process was repeated for each wind direction. We can see that the turbine positions are shifted in the crosswind direction to decrease wake interactions. The energy gain of the targeted layout compared to the optimized layout for each wind direction was equal to 6.1 % energy gain at a constant wind speed of 10 m s−1. The energy gain was calculated using Eq. (2):
where Ei is the energy of the new layout (targeted layout) at a single wind direction i, E0,i is the energy of the optimized layout at a single wind direction i, and E0,total is the total energy of the optimized layout for all wind directions N, which is equal to the number of wind directions in the wind rose in Fig. 2. The energy gain achieved in this paper only considers a constant wind speed of 10 m s−1 and not the full wind spectrum. As shown in our work in Mahfouz and Cheng (2023), when all wind speeds are considered, the energy gain was reduced by 40 % to 30 % of the gain calculated at 10 m s−1. The 40 % to 30 % values represent the results of two wind roses with identical wind direction distribution but different Weibull distribution. The calculation of the full wind rose energy gain is out of scope of this paper because we instead focus on the comparison of the steady-state and dynamic models.
The targeted layout is not realistic and is impossible to achieve, as we cannot freely move the FOWTs to the displacements in all wind directions. Realistically, our goal is to get the FOWTs to displace close to the targeted layout for as many wind directions as possible. However, the FOWT displacements are governed by the mooring system design, which cannot achieve the targeted displacement for all wind directions. Using Eq. (1), the wake loss of the targeted layout is −1.99 %, compared to −7.66 % for the OWFL.
2.3 Mooring system database
The third step in the self-adjusting FWF layout design method as shown in Fig. 1 is to create a mooring system design database. The goal of the database is to contain several mooring system designs with different design parameters and save the watch circle and the displacements of each mooring system design for all wind directions. The database will be used in the next step to find a customized mooring system design for each FOWT in the FWF. To create the mooring system design database, we created a full factorial design matrix iterating over several design parameters while keeping other parameters fixed. The fixed parameters were the bathymetry (depth), which was set at a value of 200 m; the number of mooring lines in each mooring system design, which was set to three lines; and the line type – all lines were assumed to be studless chains made of R4S steel. Novel lighter materials with lower environmental impact for the mooring lines are not checked in this work.
The permutable design parameters used to create the full factorial mooring system design matrix were the following:
-
Mooring line diameters. The three nominal diameter values of 0.09, 0.12, and 0.15 m were used.
-
Mooring line headings. A total of 72 combinations of mooring system line headings were used covering all possible heading combinations, with an increment of 10°, which a three-line mooring system design can have. The minimum angle between any two mooring lines was 10°.
-
Anchoring radius. Two anchoring radius values of 2.5D and 3.5D were used. The anchoring radius is the horizontal distance from the tower's center to the anchor.
-
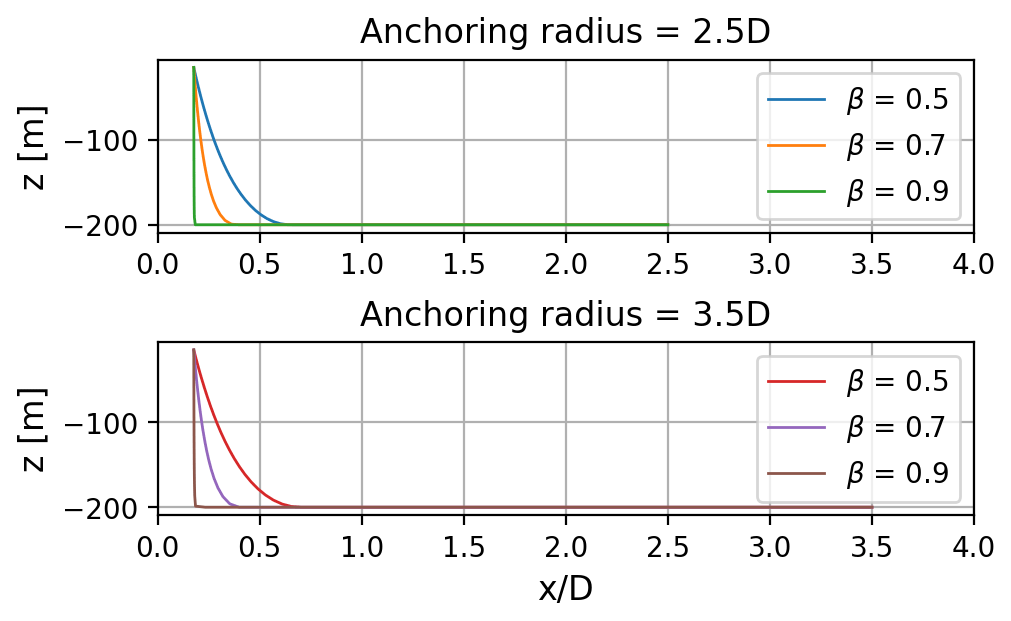
Mooring line length. Three values of the mooring line length as a function of the anchoring radius were used, as shown in Eq. (3). In Eq. (3), R is the horizontal distance between the fairlead position and the anchor position, Lmax is the maximum length a mooring line can have, and Lmin is the minimum length a chain mooring line can have. The three values of β used for the mooring system design matrix were 0.5, 0.7, and 0.9. The line profiles of the three values of β at the two anchoring radii are shown in Fig. 5.
After defining these permutable design parameters, we ended up with a full factorial design matrix containing 419 904 possible mooring system designs. We used MoorPy (Hall et al., 2021) to calculate the watch circle of each mooring system design. MoorPy is a quasi-static Python-based tool for mooring system analysis and design. In MoorPy a FOWT is modeled as a point mass with 6 DoFs and its hydrostatic properties. Additionally, an external force vector was applied to the FOWT at water level. This external force represented the aerodynamic thrust force vector at a wind speed of 10 m s−1. We used coordinate transformation to transform the aerodynamic force from the FOWT's hub to the water level. In MoorPy, we iterated through all wind directions with an increment of 5° and found the steady-state position of each mooring system design for each wind direction. While creating the mooring system database, the wave loads were neglected, as their effect on the steady-state displacement of the FOWTs is negligible compared to the aerodynamic loading.
After calculating the mooring system watch circles and displacements for each design in the design matrix, we checked that the designs passed the following constraints:
-
The mooring system yaw angles are between −5° and 5°. We chose this constraint because a higher value will lead to high energy losses in the FWF due to yaw misalignment. We are not implementing any yaw control routines on a turbine level or a farm level within this paper; hence, we decided to keep the mean yaw value within these limits to avoid yaw misalignment.
-
The mooring system cannot displace more than 1D in the wind direction. Although the current state of the art generally limits the FOWT excursions to be less than 30 % of the water depth, we are going to neglect this in our current work and allow larger excursion limits.
-
There are no vertical loads on the mooring system anchors. This means that all lines have catenary shapes with a section lying on the seabed for all wind directions.
After applying these constraints, we ended up with 440 mooring system designs that we used to choose the customized mooring system for each FOWT in the FWF. We presented the effect each mooring system design parameter has on the shape of the watch circle and the mooring system stiffness in our work in Mahfouz et al. (2022).
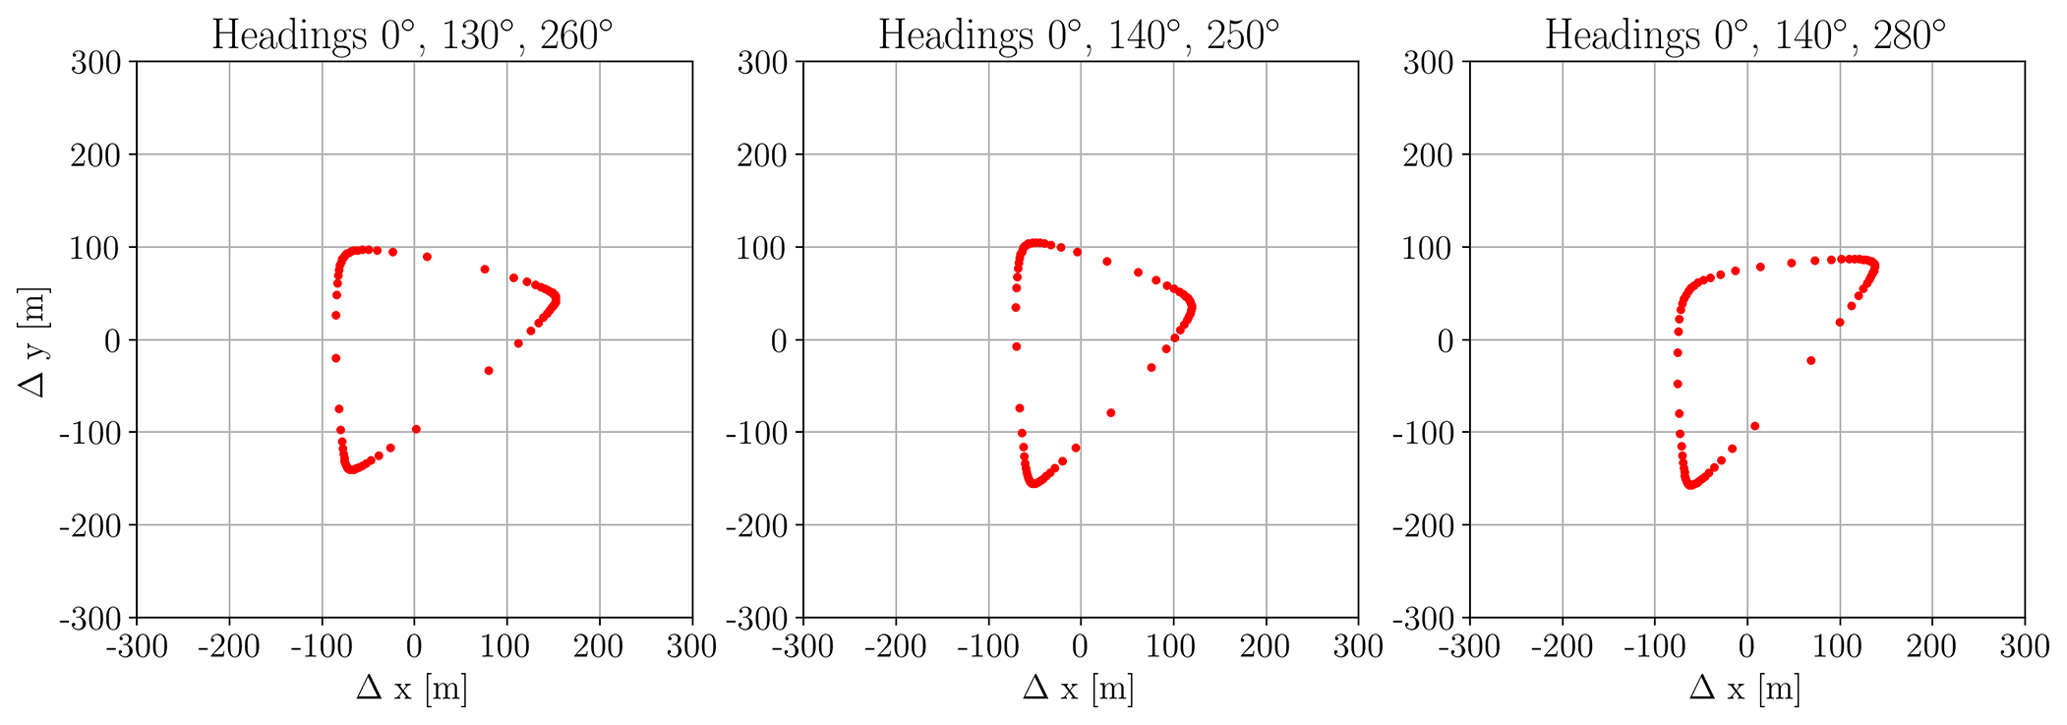
The watch circles of three randomly chosen mooring system design with three different headings are shown in Fig. 6. In the absence of wind and waves the FOWT is at the origin at (0,0), and when the aerodynamic force at 10 m s−1 wind speed is applied, the FOWT moves to the dots shown in Fig. 6. Each dot in the Fig. 6 represents the position of the FOWT at one wind direction. As we have shown in our work in Mahfouz et al. (2022), the shape of the watch circles are defined by the line headings, while the other design parameters can be used to tune the FOWT motion by increasing it or decreasing without changing the shape of the watch circle.
2.4 Customized mooring system designs
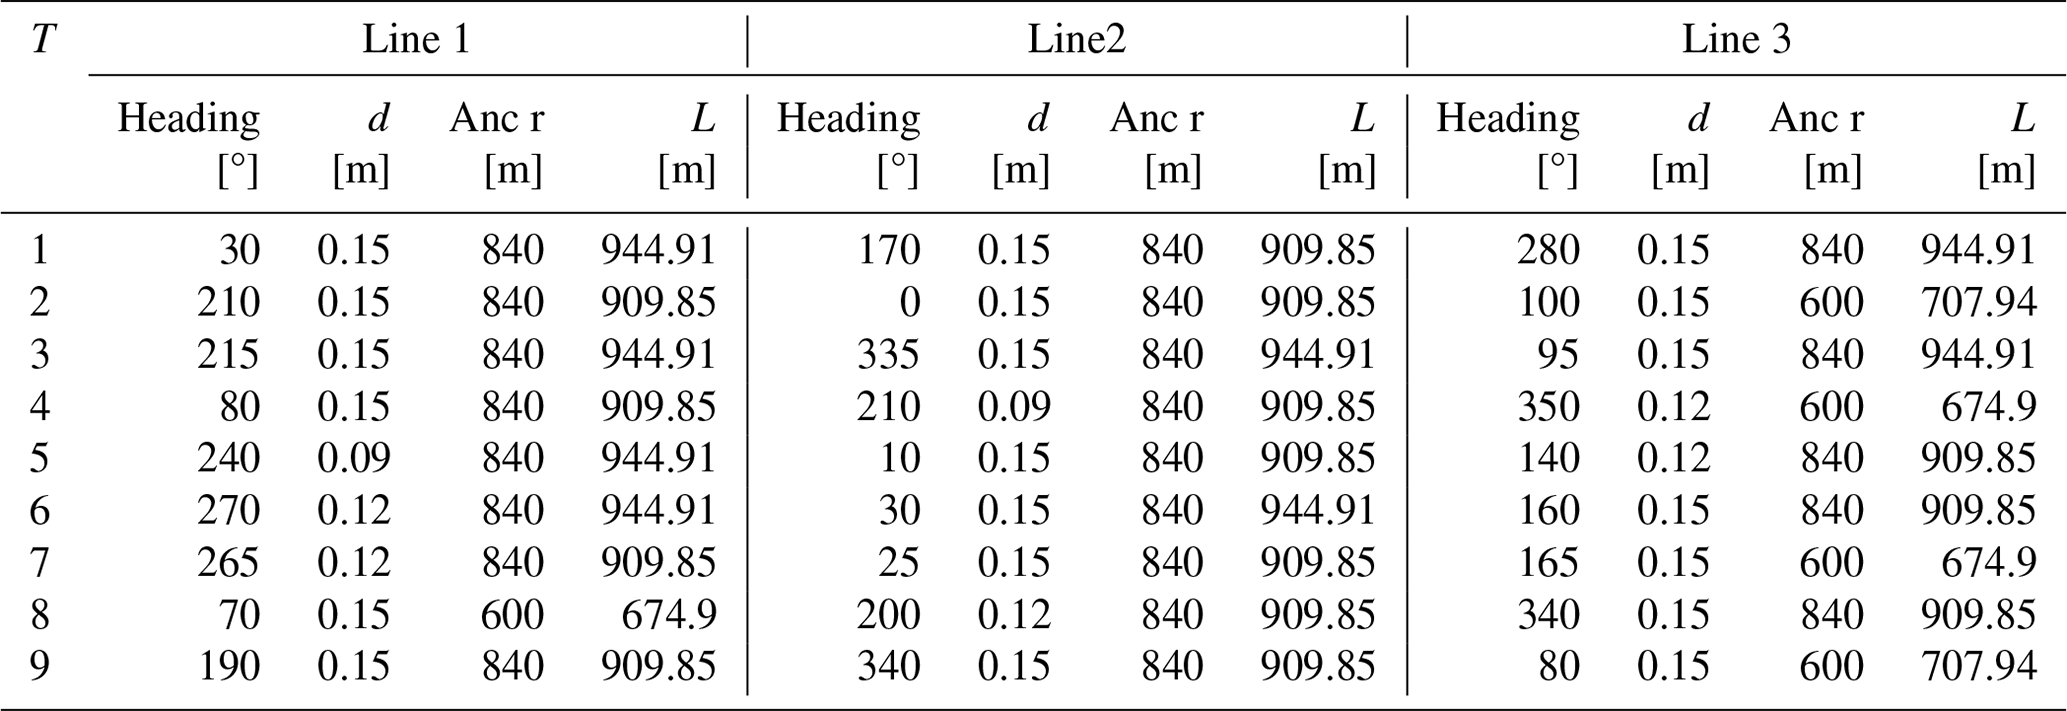
After creating the mooring system database, we used the targeted layout design to choose mooring systems with watch circles closest to the target displacements. This process was explained in detail in our work in Mahfouz and Cheng (2023). We used brute force optimization to find the mooring system design for each FOWT to increase the overall energy production of the FWF. Afterward, we checked that the minimum distance between any two mooring lines within the FWF was larger than 20 m as required in the API (2005) standard. If the distance between two mooring lines was less than 20 m, we increased the minimum acceptable distance between any two turbines while designing the optimized wind farm layout in Sect. 2.1. In this work, we started with the constraint of minimum distance equal to 2D, and we iterated till the required minimum distance between any two lines was larger than 20 m. Therefore, we ended up with a constraint of minimum distance equal to 4D for the optimized layout design as introduced in Sect. 2.1. The design parameters of the nine customized mooring systems attached to each FOWT in the FWF can be found in Table A1 in the Appendix.
The positions of the final self-adjusting FWF layout relative to the optimized wind farm layout for one direction are shown in Fig. 7, which shows how the crosswind movement of the FOWTs in the layout decreases wake interactions inside the FWF as Turbines 9 and 6 move out of the wake of Turbines 5 and 3, respectively. The energy gain of final FWF layout design compared to the optimized layout at each wind direction is shown in Fig. 12. As expected, the total energy gain of the final FWF is only 3.1 % compared to 6.1 % of the targeted layout, as the mooring system designs cannot achieve all crosswind displacements like the targeted wind farm layout design. We can see in Fig. 7 that turbines are displaced in the crosswind direction, and in-wind displacements they are also visible, because the FOWTs are coupled to the mooring system designs. An overall view of the floating optimized wind farm layout with the mooring system attached to each FOWT is shown in Fig. 8. Using Eq. (1), the wake loss of the final layout is −4.79 %. The wake losses of the gridded non-optimized layout, the OWFL, the targeted layout, and the final layout are summarized in Table 2.
Table 2Wake losses of the gridded wind farm layout, OWFL, and targeted layout.
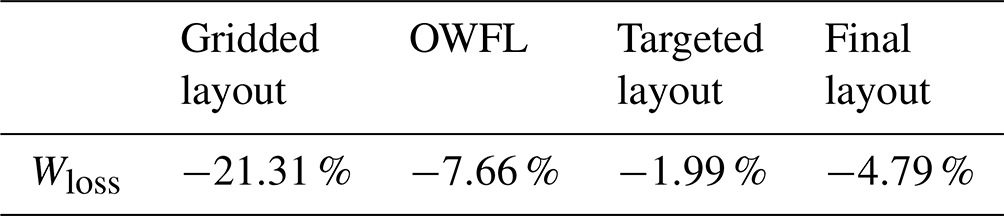
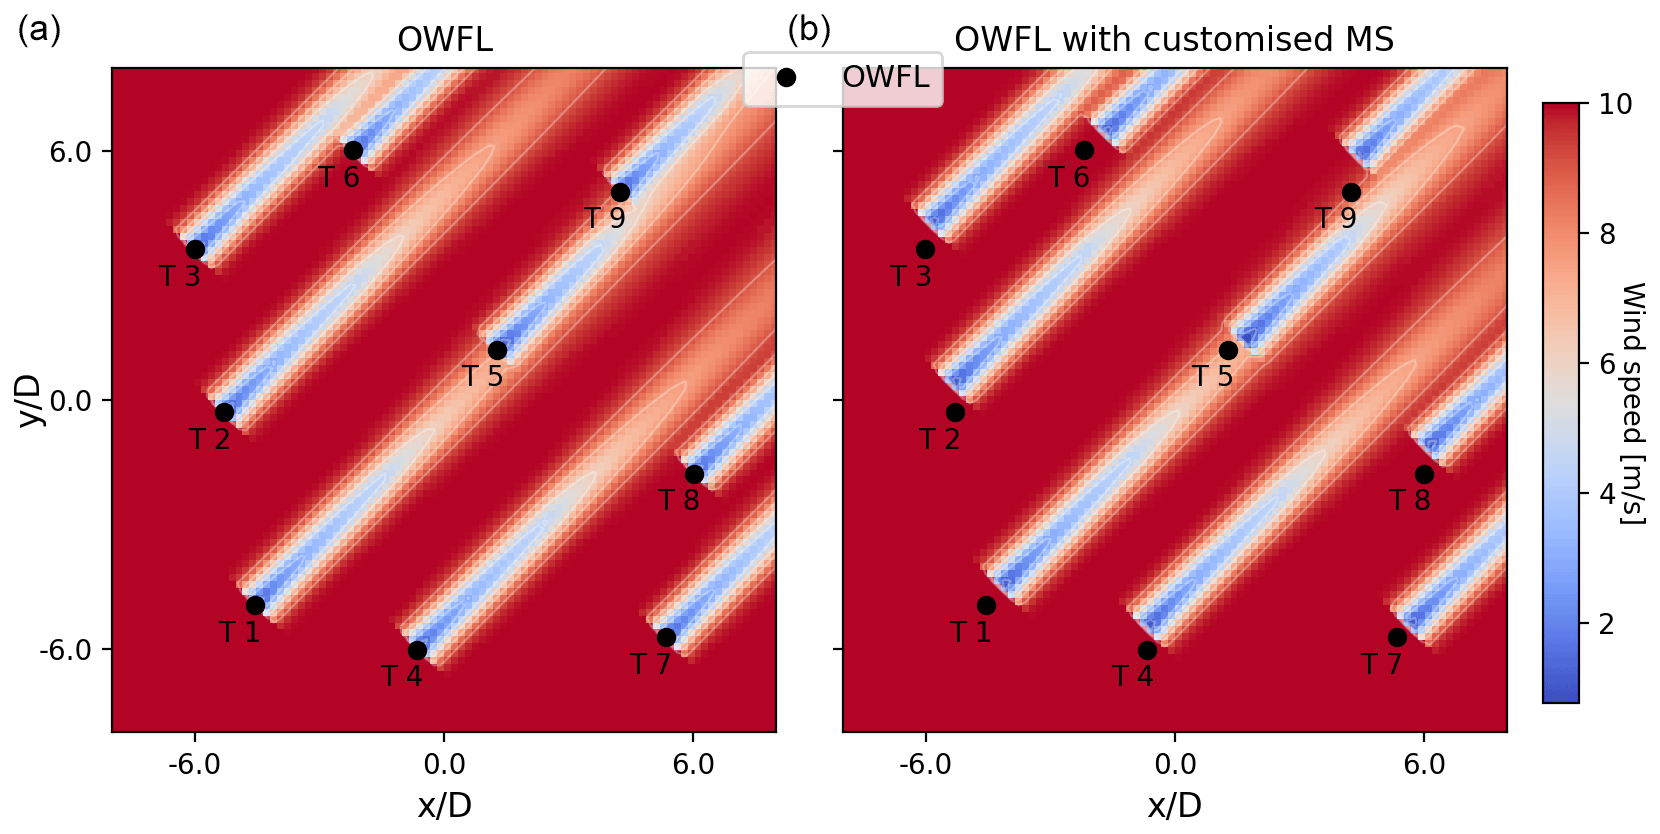
Figure 7Wind farm layout and wakes: (a) the optimized layout and (b) the final layout. The black dots represent the positions of the turbines in the optimized layout.
In this section we verify the initial results that we obtained using static wind loading and a steady-state wake model against dynamic wind and wave loading and a dynamic wake model. We use the mid-fidelity, state-of-the-art aero-servo-elasto-hydro-tool OpenFAST v3.4.1 to model the FOWT and assess its behavior in operational and extreme conditions. Additionally, we use FAST.Farm v3.4.1 (Jonkman and Shaler, 2020) to model the FWF and assess how much energy gain relocating the FOWTs will achieve using the dynamic wake meandering (DWM) model.
3.1 Introducing baseline floating wind farm design
Before starting to assess and verify the novel FWF layout design performance, we introduce a baseline mooring system design that we use as a benchmark to compare the customized mooring system designs against. A baseline is needed to reflect the difference between the current state-of-the-art mooring system designs with small translational displacements (a few meters) and the customized mooring system designs that relocate the FOWTs more than 100 m.
The baseline mooring system design process assumed a fixed anchor spacing of 600 m, a water depth of 200 m, and three mooring lines at evenly distributed heading angles. The maximum platform offset was constrained to be 12 % of water depth, about 25 m. The length and diameter of the chain were varied to meet constraints on extreme tensions and fatigue damage, with safety factors of 2 and 3, respectively. The fatigue damage was checked with a simplified fatigue analysis that consisted of three load cases, with wind speeds near the rated wind speed and corresponding waves. The load cases assumed aligned wind and waves and uniform distribution of wind–wave headings. The API (API, 2005) fatigue analysis process was followed, using the T–N curve for chain. Fatigue was the driving constraint in the design of the baseline mooring system, resulting in a chain diameter of 0.19 m. The properties of the baseline mooring design are shown in Table 3. The baseline mooring system design follows the current state-of-the-art mooring system design recommendations, and hence it is valid to use it as a benchmark in this study.
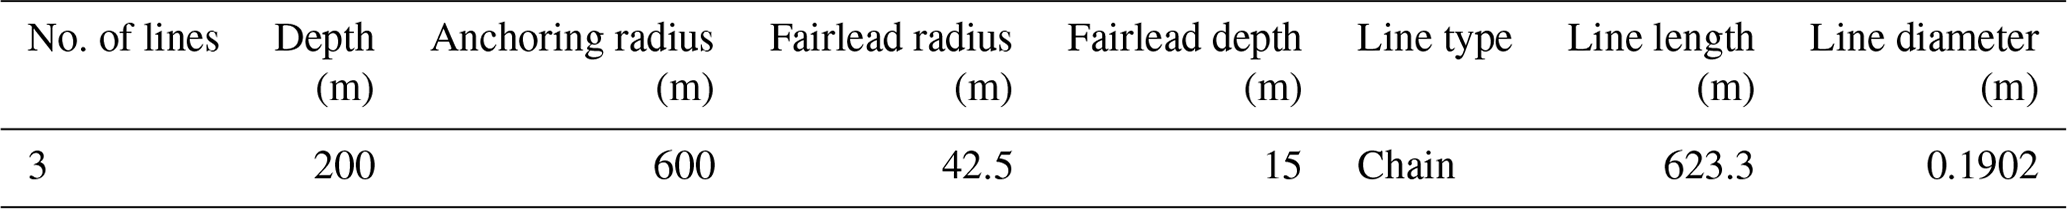
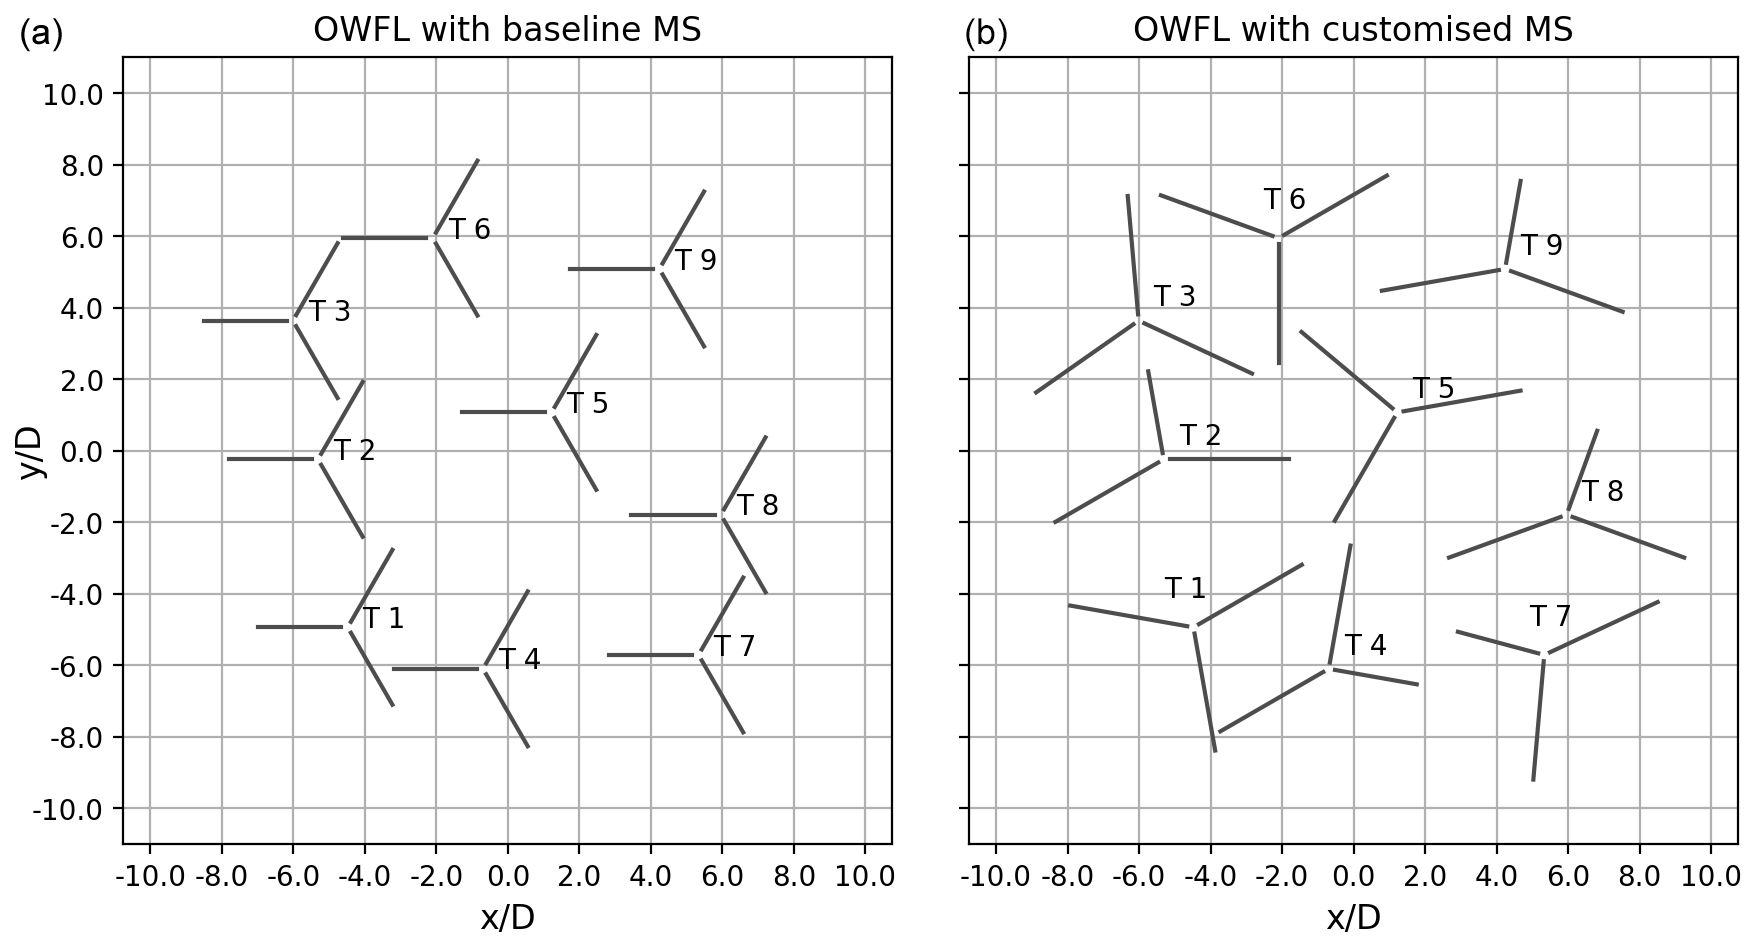
Figure 8The optimized wind farm layout coupled to (a) the baseline mooring system and (b) the customized mooring system.
The optimized wind farm layout coupled to the baseline mooring system and the customized mooring system is shown in Fig. 8. Both layouts are shown in the absence of wind and wave loading. Mahfouz (2023b) presents an animation video illustrating the passive displacements of the FOWTs according to the wind direction. The video shows a top view of the wind farm layout and the mooring systems and how the FOWTs move passively as the wind direction changes. The baseline design can be coupled with a conventional power cable design, while the passive repositioning mooring system designs require a power cable that can tolerate much larger offsets. The effect of the larger FOWT's relocation on the cable design is not discussed in this paper.
3.2 Customized mooring system stiffness
We compared the natural frequency of FOWTs when coupled to the customized mooring system designs versus the baseline design. We used MoorPy to calculate the stiffness of the mooring system at each wind speed and wind direction to cover the FOWT operation range between cut-in and cut-out wind speeds. Then, we used the results to calculate the natural frequencies of the system over the watch circles of the mooring systems. The results for the baseline mooring system and the customized mooring system design of the first turbine (T1) in the FWF are shown in Figs. 9 and 10, respectively. The figures show the value of the natural frequencies in the x-axis and y-axis directions (surge and sway DoFs respectively). Each dotted line in the plots represents the watch circle at one wind speed; the most inner line is the watch circle at a wind speed of 3 m s−1, and the outermost line is the watch circle at rated wind speed of 11 m s−1. The color of the plots represents the value of the natural frequency over the different positions of the watch circle.
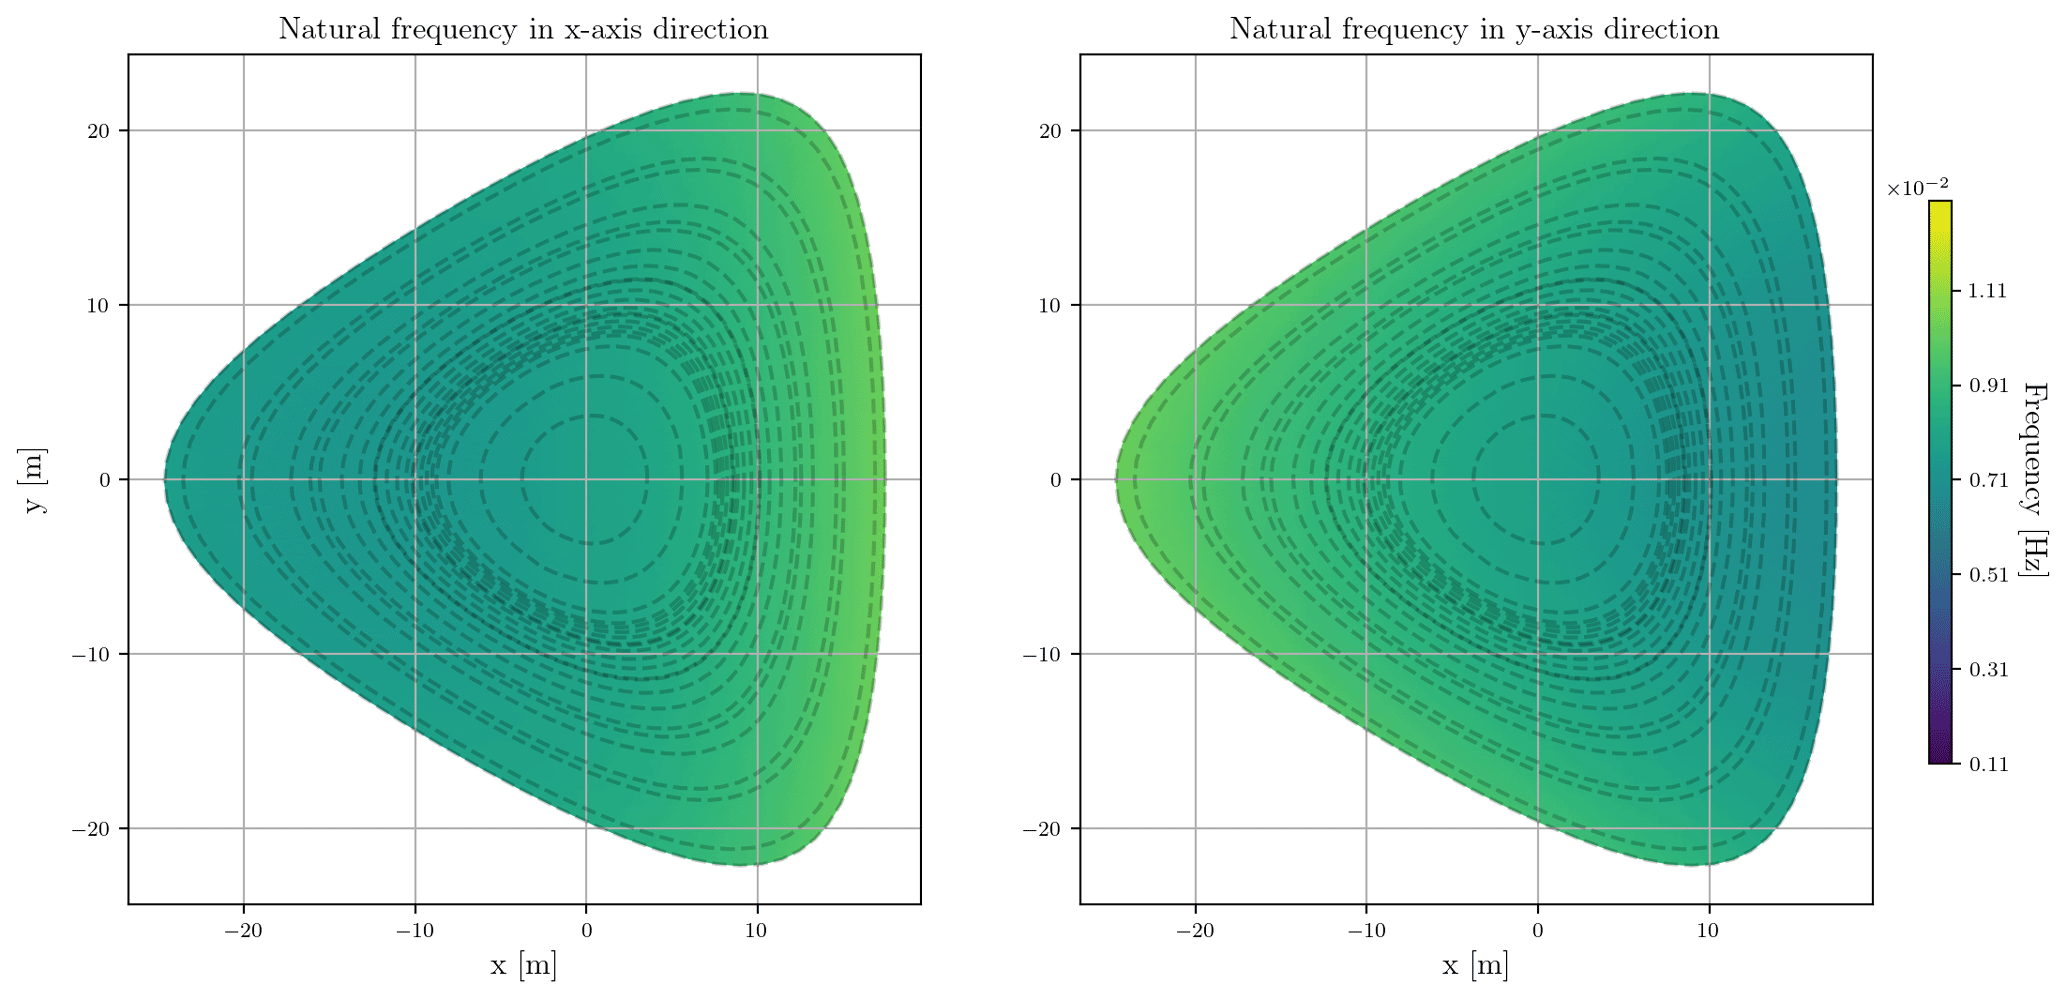
Figure 9The natural frequency in x and y directions (surge and sway DoFs) for the FOWT when coupled to the baseline mooring system. The dotted lines represent the watch circles at wind speeds ranging from 3 to 11 m s−1. The range of the color bar extends from 0.001 Hz (time period of 900 s) to 0.01 Hz (time period of 90 s).
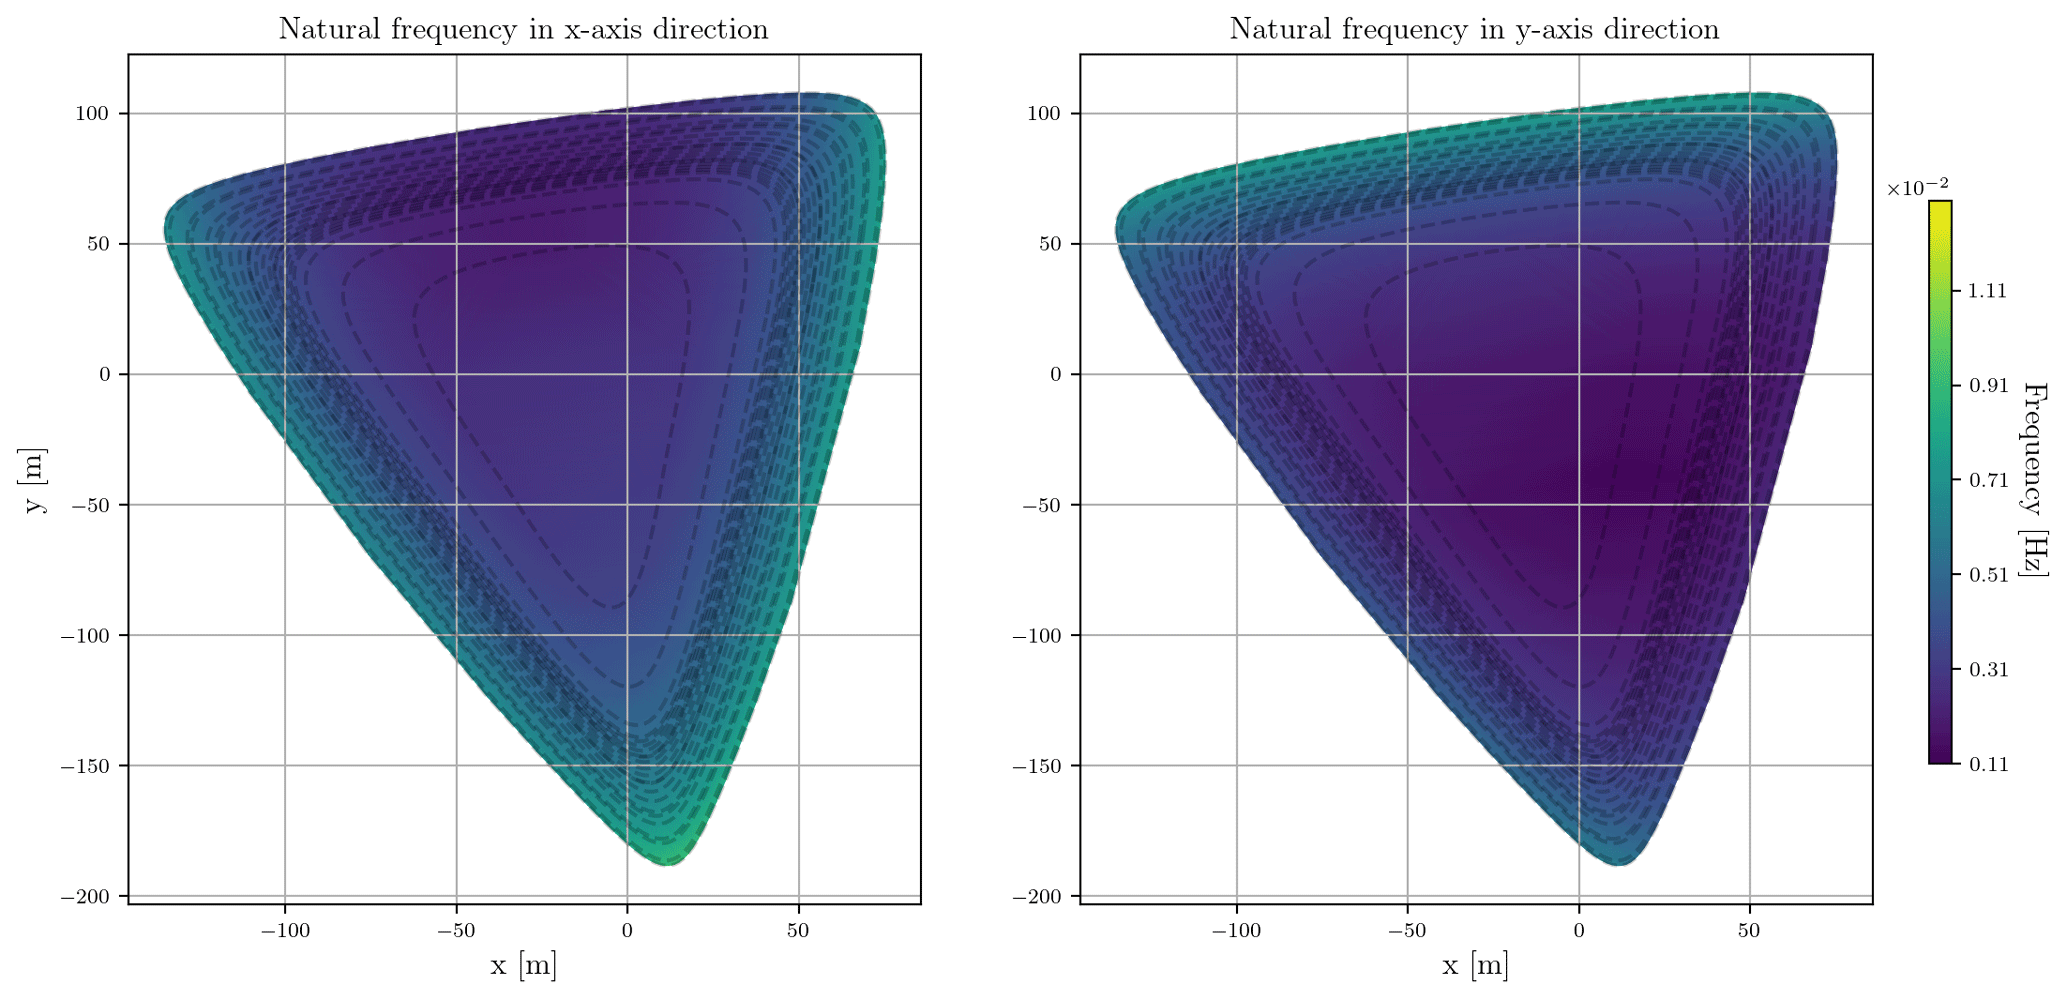
Figure 10The natural frequency in x and y directions (surge and sway DoFs) for the FOWT when coupled to the customized mooring system of Turbine 1. The dotted lines represent the watch circles at wind speeds ranging from 3 to 11 m s−1. The range of the color bar extends from 0.001 Hz (time period of 900 s) to 0.01 Hz (time period of 90 s).
In Fig. 9, the natural frequency of the baseline design shows only small changes as the wind speed and wind direction change. This means that for all wind excitations and for all positions inside the watch circle, the natural frequency is changing within a small range as shown in Fig. 9. This is because the stiffness of the baseline design is linear and almost constant for all wind speeds and wind directions. On the other hand, Fig. 10 shows that the natural frequencies of the customized mooring systems are rather spread; the frequencies are low at low wind speeds and increase to be within the same frequency range of the baseline mooring system design as the wind speed increases. This is because the stiffness of the customized mooring system design is nonlinear and changes with the wind speeds and the wind directions. In general, the frequencies of the customized mooring system are lower than the baseline design because their stiffness values are lower to allow larger mean FOWT translational displacements. As an example of the spread of the natural frequency of the customized mooring systems at a wind speed of 10 m s−1, the baseline mooring system design natural periods range from 97 to 130 s in the x-axis direction and range from 97 to 147 s in the y-axis direction. On the other hand at 10 m s−1 the natural periods of the customized mooring system design coupled to Turbine 1 range from 108 to 404 s in the x-axis direction and from 128 to 448 s in the y-axis direction. The dark areas in Figs. 9 and 10 represent the higher natural period region (lower natural frequency). The x-axis and y-axis directions do not change with the change of wind direction and are fixed global axis.
3.3 Steady-state behavior
Before applying any dynamic loads on the FOWTs, we verified that the mean steady-state displacements calculated with MoorPy were equal to the steady-state displacements in OpenFAST. This comparison was important before running FAST.Farm simulations to quantify the energy gain of displacing the FOWTs in the FWF and comparing it to the results of the static model. If the mean displacements of the two models are different, it will lead to a different layout for every wind direction, and we cannot directly compare the energy gain of the two models. Hence, we applied a steady wind of 10 m s−1 at the rotor hub using OpenFAST; then, we compared the steady-state positions between the two models in Fig. 11. The figure shows the comparison of the watch circle of Turbine 1 in the FWF in both tools on the left side and the maximum difference between the watch circles produced by MoorPy and OpenFAST. The biggest difference in displacement between the two models is around 3.3 m for Turbine 6. This difference is negligible compared to the 240 m rotor diameter of the 15 MW reference wind turbine. The reason for this difference is that OpenFAST models the full structure of the FOWT, captures the tower top deflections, and includes them while transforming the aerodynamic forces from the tower top coordinate system to the water level coordinate system. On the other hand, the MoorPy model is a simplified model and does not account for structural deflections; therefore, the forces applied at the water level are different between the two models. Moreover, we assumed in MoorPy that the aerodynamic force vector at the hub height changes linearly with the FOWT's roll, pitch, and yaw angle, which is different than OpenFAST, which recalculates the aerodynamic forces using blade element momentum theory.
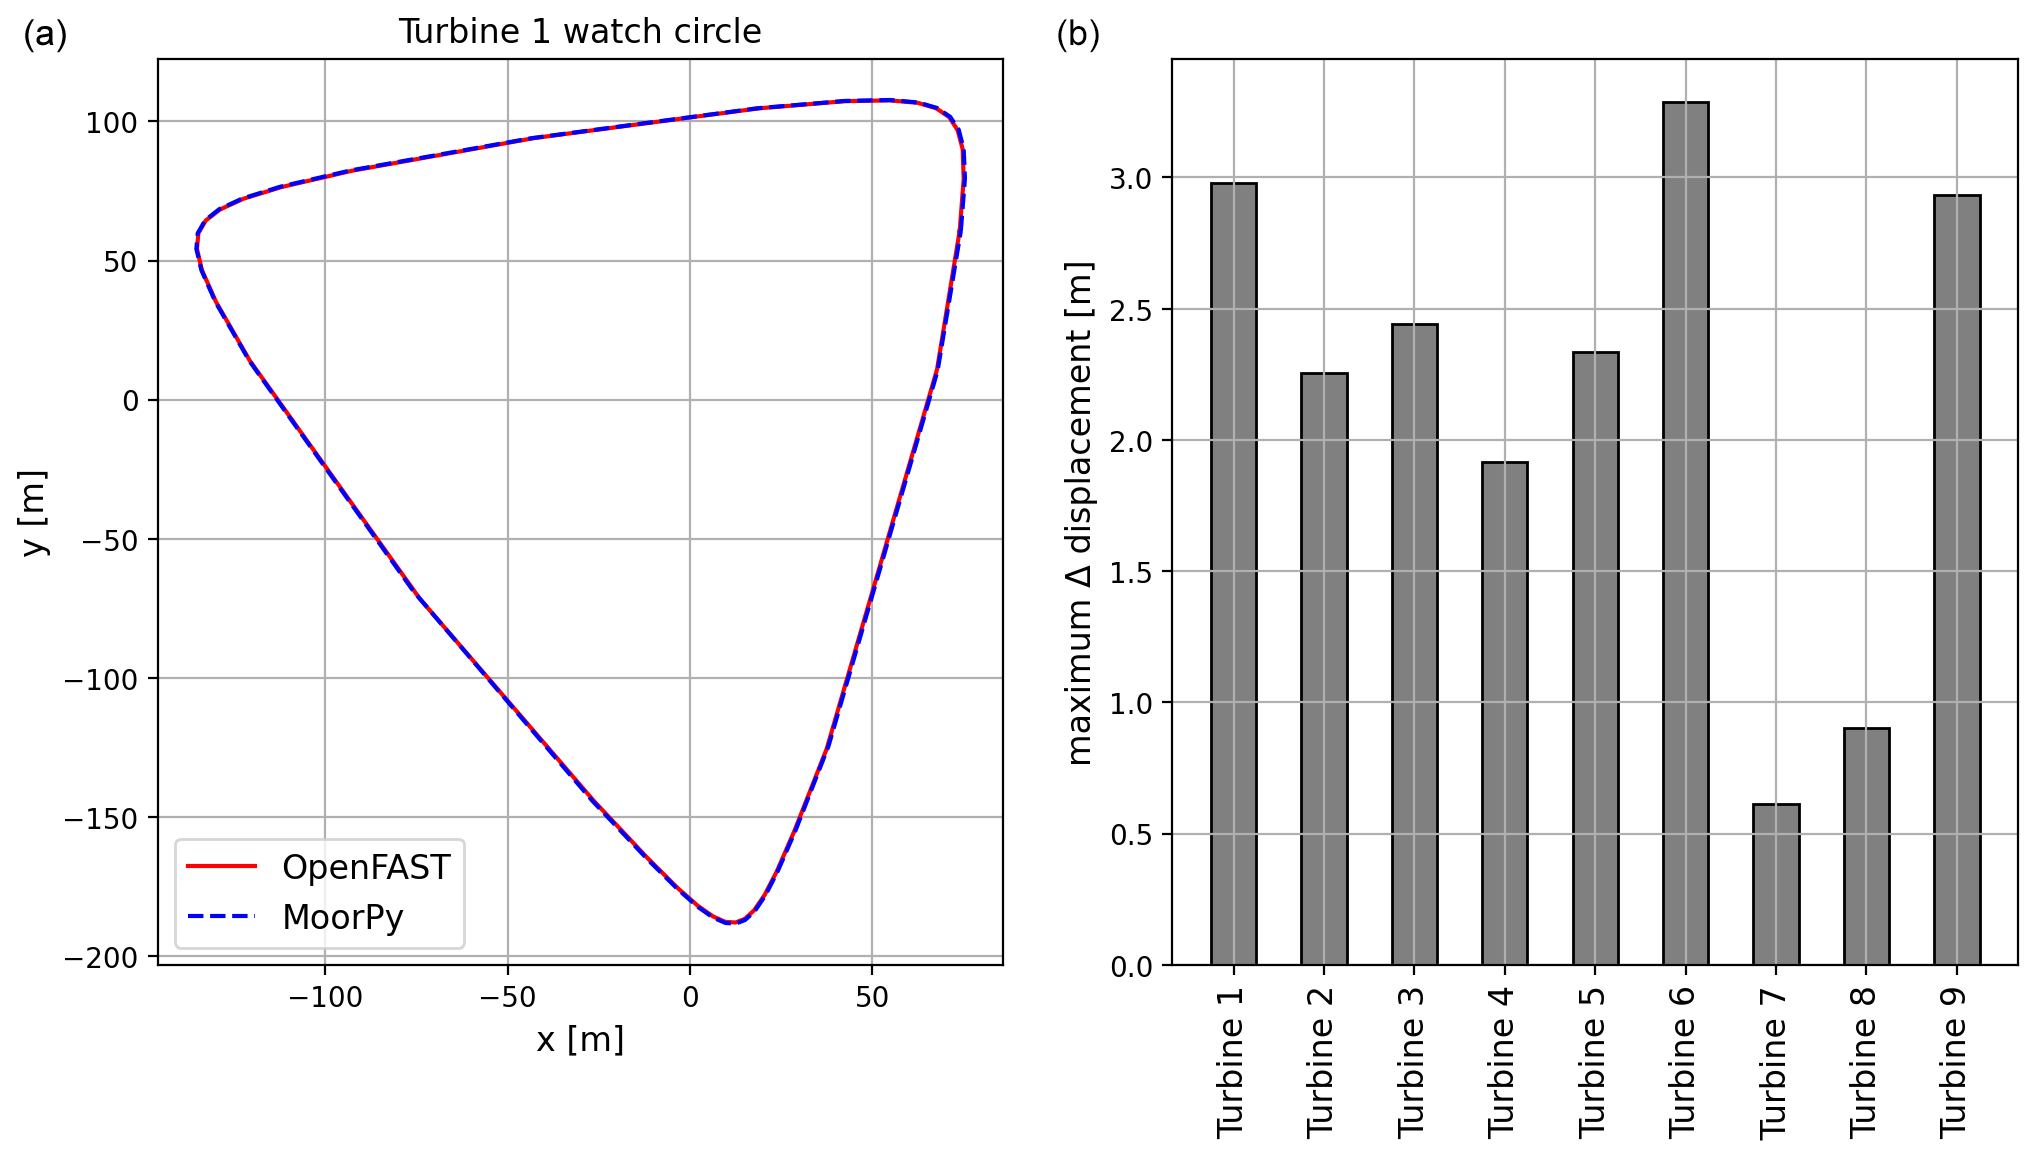
Figure 11(a) The watch circle of Turbine 1 in both MoorPy and OpenFAST. (b) The maximum difference between the watch circle of each turbine in the FWF in MoorPy and OpenFAST.
3.4 Energy production
In this section, our goal is to compare the FWF energy gain that we calculated using the steady-state Gaussian wake model in FLORIS with the results of the mid-fidelity DWM from FAST.Farm. FAST.Farm uses OpenFAST to account for the aero-elasto-servo-hydrodynamics of each FOWT in the FWF and the DWM model to account for wake deficits, advection, deflection, meandering, and merging. We simulated the optimized wind farm layout twice at every wind direction of the wind rose in Fig. 2 – first with all the FOWTs in the FWF coupled to the baseline mooring system design and second with each FOWT coupled to its customized mooring system design. Our wind rose has 16 wind directions, resulting in 32 FAST.Farm simulations. All simulation settings and the wind fields for both cases, with the baseline mooring system and with the customized mooring systems, were identical for all wind directions.
The wind fields were generated using the Mann turbulence box (Mann, 1998). The Mann model parameters were defined following the IEC (2019) standard to achieve a turbulence intensity of 6 %. The mean wind speed at the hub was equal to 10 m s−1. For all simulations, the resolution of the high-resolution grid in FAST.Farm in the x, y, and z directions was equal to 5 m, and the low-resolution grid's resolution was set to 35 m. The low-resolution time step was set to 3.78 s, while the high-resolution time step was 0.42 s, and the OpenFAST time step was set to 0.0378 s. The significant wave height for all simulations was equal to 2 m, and the wave period was equal to 6 s. We used these values for the sea states as they are the operational values used during the Activefloat design as indicated in Mahfouz et al. (2020). The second-order wave forces were not considered in any of these simulations. The simulation time was 4200 s, and the first 600 s was excluded to avoid transient effects. Additionally, the simulations started with the FOWT positions set according to the values obtained from MoorPy to avoid big transient movements. The polar formulation of the DWM in FAST.Farm was used with the default settings of the wake model. The default settings were calibrated and verified by Doubrawa et al. (2018) and Jonkman et al. (2018) against large-eddy simulations for a fixed-bottom 5 MW wind turbine. FAST.Farm wake parameters are not yet calibrated for FOWTs.
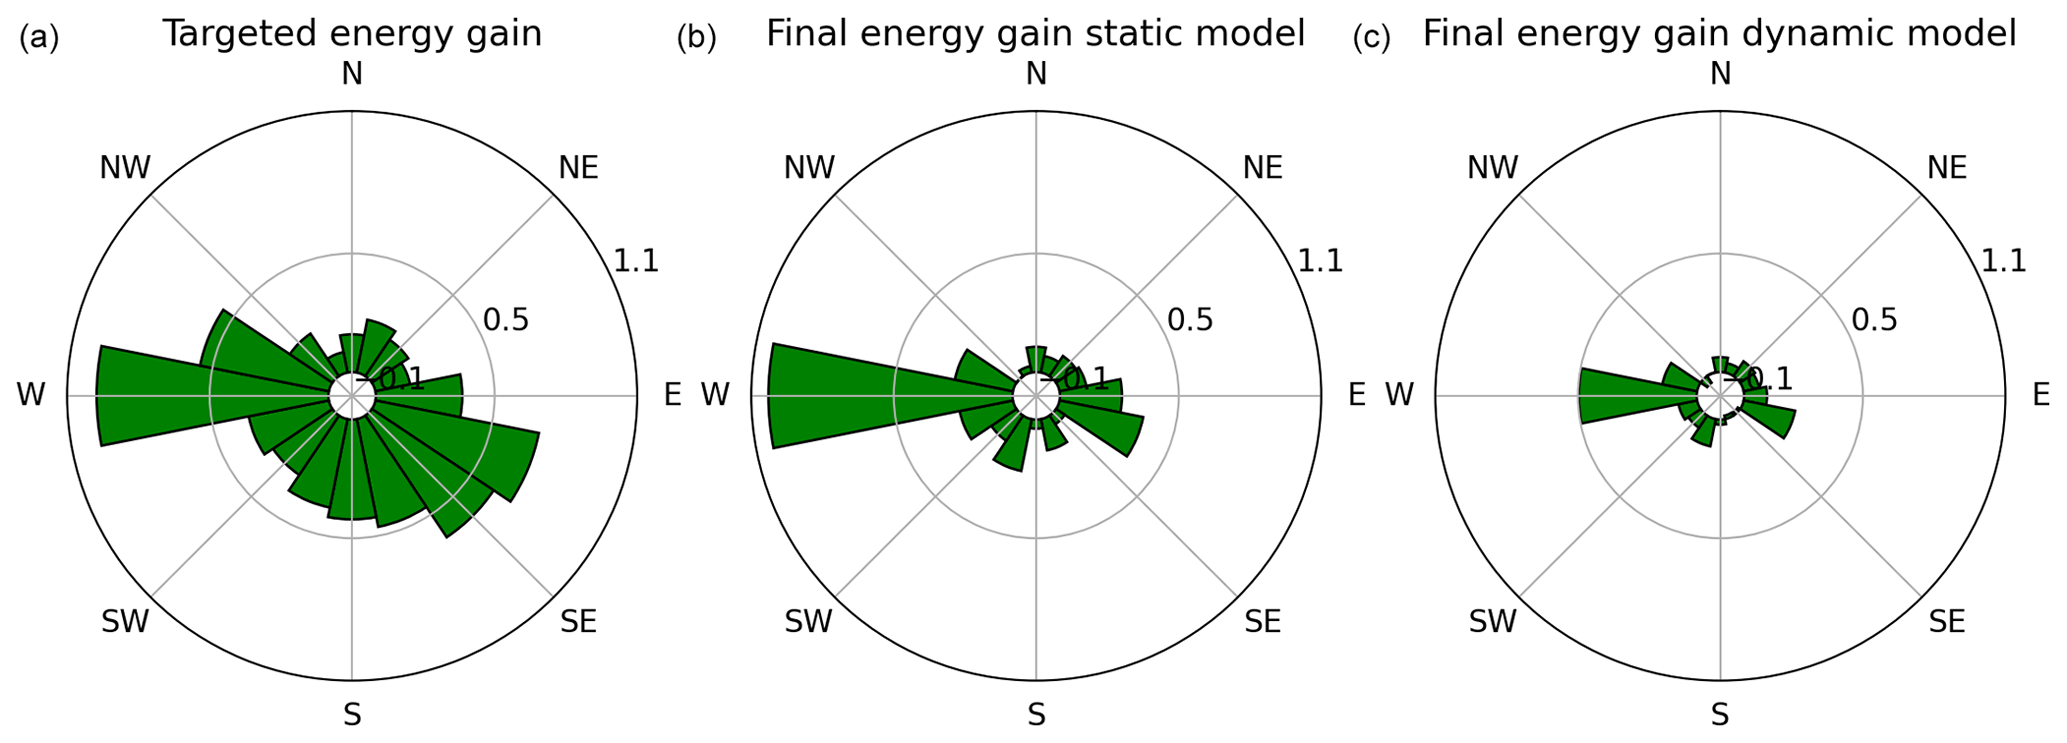
Figure 12(a) The percentage of energy gain at each wind direction for the targeted wind farm layout, (b) the percentage of the final wind farm layout using static wake models, and (c) the percentage of the final wind farm layout using dynamic wake models.
After omitting the first 600 s, the final 3600 s of each simulation was processed. The average power produced by each turbine in both FWF layouts (with baseline mooring system and with the customized mooring system designs) was calculated. The energy gain of the optimized layout coupled to the customized mooring system was calculated relative to the optimized layout when coupled to the baseline mooring system as in Eq. (2). The gain from FAST.Farm was equal to 1.4 %, and the gain for every wind direction in the wind rose is shown on the right side in Fig. 12. The energy gain distribution per wind direction in the FAST.Farm model follows the same trend as the gain distribution for the MoorPy-FLORIS results. This shows that the energy gain achieved by the OWFL when coupled to the customized mooring systems is not numerical as it is not random but follows our expectations from the steady-state model. The wake losses of the OWFL when coupled to the baseline mooring system and the customized mooring system are shown in Table 4.
Table 4Wake losses of the wind farm before and after optimization.
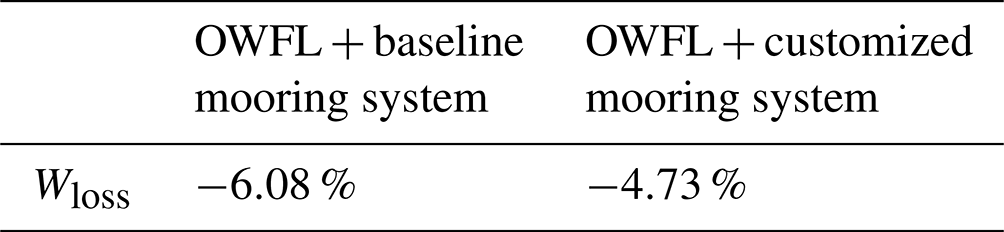
The gain values predicted by FAST.Farm are smaller than what the steady-state models predicted. Moreover, the wake losses predicted by FAST.Farm for the OWFL (−6.08 %) are lower than those predicted by the steady-state model (−7.66 %). The difference between the MoorPy–FLORIS static model and FAST.Farm model can be for two reasons. First, the FOWTs are not being displaced by the customized mooring system designs as we predict in the design phase. However, this possibility is omitted because, as we presented in Sect. 3.3, the FOWTs relocate their positions in OpenFAST and MoorPy similarly, and the difference is negligible. The second source of difference between the MoorPy–FLORIS model and the FAST.Farm model comes from the difference between the wake models implemented in FLORIS and FAST.Farm, as well as the difference in fidelity between MoorPy–FLORIS and FAST.Farm. First, FLORIS is a steady-state model that does not account for the FOWT's mean pitch angle, which means that the rotor average wind speeds in FLORIS and OpenFAST are different. Moreover, Ramos-García et al. (2022b, a), Johlas (2021), and Nanos et al. (2022) showed that the positive pitch angle of FOWTs deflects the wake upward. This deflection is captured in FAST.Farm but not in FLORIS. Therefore, we analyzed the difference between the wind speed deficit in FLORIS and FAST.Farm to understand the difference between the models. Since the main energy gain happens when the wind blows from west to east (wind direction = 0°), we used this wind direction during this analysis.
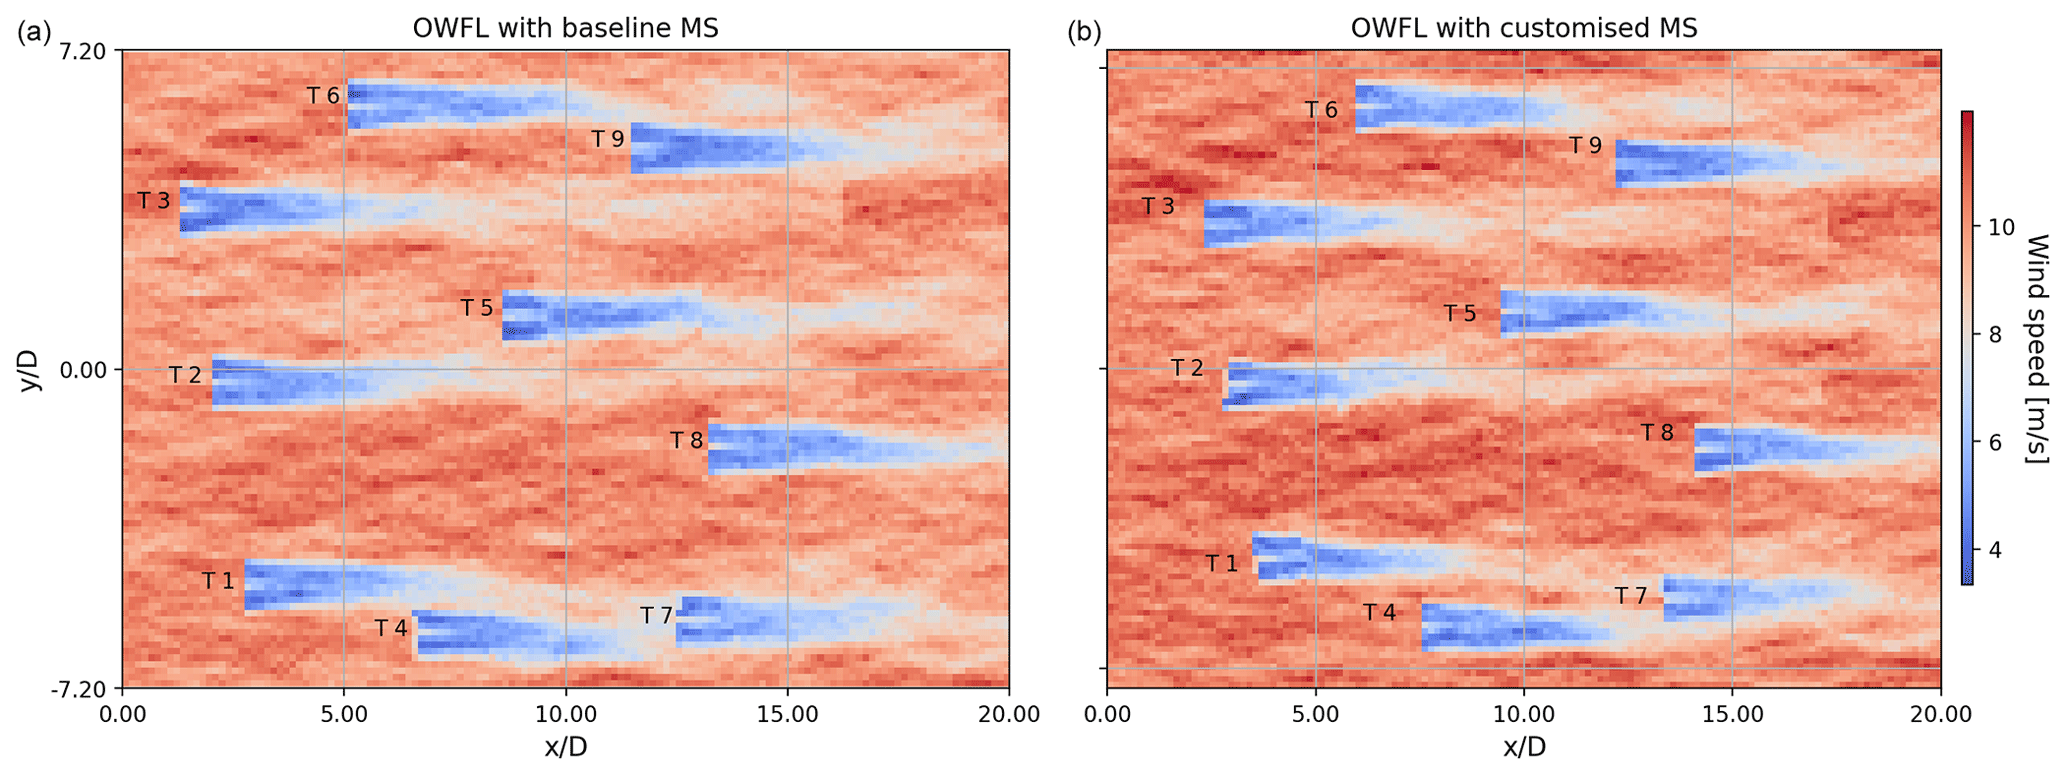
Figure 13The wind flow field at the rotor hub at 4200 s. (a) The non-relocating optimized wind farm layout coupled to the baseline mooring system design compared to (b) the self-relocating optimized layout at wind direction = 0°.
The wind flow field at the rotor hub from FAST.Farm is presented in Fig. 13 – the flow field of the optimized wind farm layout with the baseline mooring system on the left and the self-relocating layout on the right. Figure 14 shows the rotor average wind speed in FLORIS and in FAST.Farm for a wind direction of 0°. On the left, all FOWTs are coupled to the baseline mooring system with limited movement in the crosswind direction, in the middle, each FOWT is attached to its customized mooring system design, allowing crosswind movements, and on the right is the difference in rotor average wind speed of each turbine. Turbines 7 and 9 are relocated out of the wake, and their rotor average wind speeds are higher, as shown in Fig. 14. We updated the source code of the FAST.Farm used in this work, so the rotor average wind speeds do not include the FOWTs dynamic motions. From Fig. 14 we can conclude the following:
-
The rotor average wind speed of a FOWT is always slightly lower in FAST.Farm when compared to FLORIS, because FAST.Farm considers the pitch, roll, and yaw motions, while FLORIS cannot capture them. For an inflow wind field with mean wind speed of 10 m s−1, the average rotor wind speed of FOWTs in FAST.Farm is 9.5 m s−1, instead of 10.0 m s−1 in FLORIS. This is because the rotor average wind speed is measured in rotor coordinates for both tools, but the rotor coordinates are fixed in FLORIS, while they move with the rotor in FAST.Farm.
-
In FLORIS, Turbine 4 is partially in the wake of Turbine 1 in the baseline floating optimized layout, while in FAST.Farm this is not the case. This can be caused by wake meandering, which is considered in the FAST.Farm model and not in FLORIS, so the wake is meandered and Turbine 4 is no longer in the wake of Turbine 1. This can also be caused by horizontal wake deflection, as the platform yaw angle of Turbine 1 will deflect the wake away from Turbine 4. However, this reason is omitted, as the FOWT yaw angle of Turbine 1 is almost zero.
-
Looking at the change in rotor average wind speeds between the optimized layout when attached to the customized mooring system designs and the baseline mooring system design, we can see that there are small differences in the rotor average wind speeds for the turbines in the free flow wind fields (such as Turbines 1, 2, 3, and 6). These differences come from the difference in the mean pitch angle of the FOWTs affected by the mooring system design overhang for each wind direction. The difference in the mooring system designs has a slight effect on the floating platform's pitch stiffness and affects the steady-state pitch angles of FOWTs. The change in the mean pitch angle is small and less than 1°.
-
The wake losses in FAST.Farm are less than in FLORIS. This is clear from the rotor average wind speed of Turbine 7 in both FAST.Farm and FLORIS. In Fig. 14, for the optimized layout with the baseline mooring system, the average rotor wind speed of Turbine 7 in the FLORIS model is lower than the FAST.Farm model, which indicates that the wind speed deficit is higher in FLORIS and hence there are higher losses. After the optimized layout is modeled with the customized mooring system designs and the turbines are relocated, the wind speed increases in both models, proving that relocating the layout decreases the wake losses for Turbine 7. The value of the rotor average wind speed of Turbine 7 after the FOWTs are relocated is slightly higher in the FAST.Farm model. However, the total increase in FLORIS is higher, and hence the energy gain of relocating Turbine 7 is also higher. This was seen for all the turbines in the wake for all wind directions.
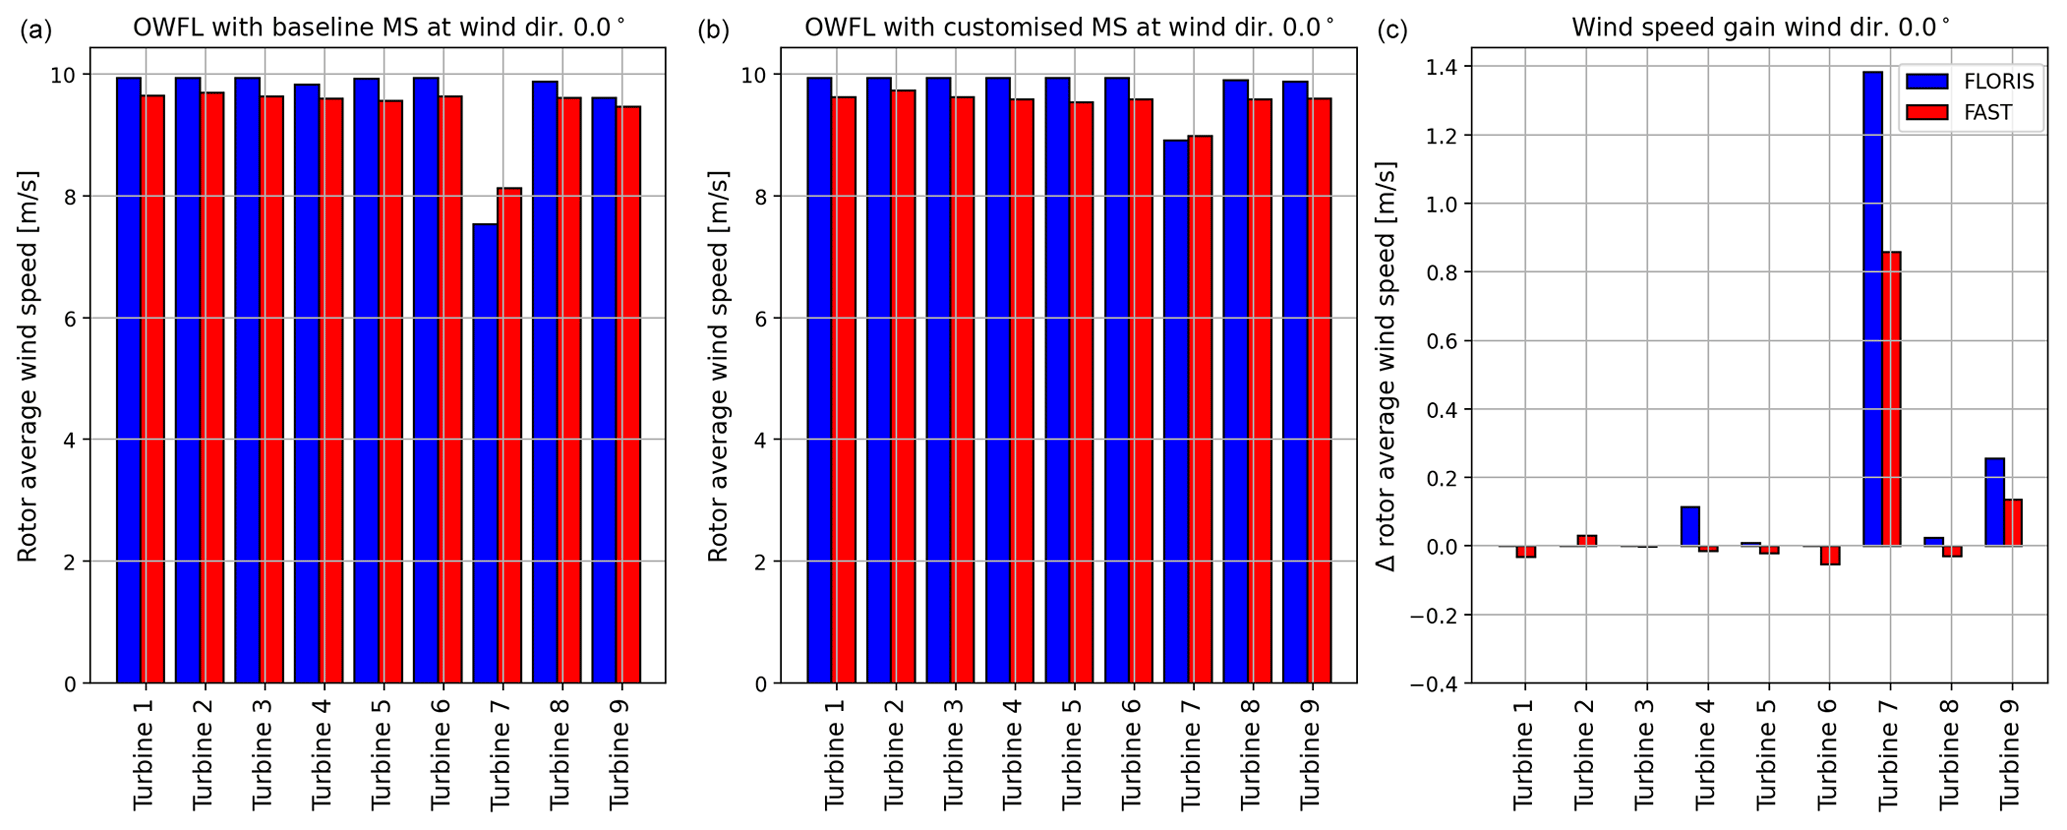
Figure 14The rotor average wind speed in FLORIS and FAST.Farm at wind direction = 0°. (a) The rotor average wind speed of the optimized wind farm layout coupled to the baseline mooring system. (b) The rotor average wind speed of the optimized layout coupled to the customized mooring system design. (c) The difference between the average rotor wind speed of the two configurations.
These four differences between the FAST.Farm and the FLORIS models lead to the difference in the energy gain of relocating the wind turbines. The first three differences are expected, as they result from the lack of turbine structural modeling in FLORIS or the simplicity of the steady wake model compared to the DWM. However, the big difference in velocity deficit of the two models requires further analysis. To understand why FLORIS estimates higher wake losses than FAST.Farm and whether this difference is because of the effect of FOWTs on wake recovery and wake deflection, we decided to simulate the optimized wind farm layout as a fixed-bottom wind farm and compare it to the optimized layout when coupled to the baseline mooring system design. The results of the average rotor wind speed of the fixed-bottom optimized layout in FAST.Farm are shown in Fig. 15.
Figure 15 shows that the FAST.Farm rotor average wind speeds of the turbines in ambient wind (Turbines 1, 2, and 3) for the fixed-bottom optimized layout are higher than the floating optimized layout but still lower compared to FLORIS. This difference comes from the rotor uptilt angle of the turbines. This uptilt angle is only accounted for in FLORIS in the power coefficients look-up table, and it does not show in the rotor average wind speeds. This means that for a the fixed-bottom turbine, the mean power produced in the ambient wind field in FLORIS and FAST.Farm is equal. Additionally, Fig. 15 shows that for the fixed-bottom optimized layout, the velocity deficit for Turbine 7 in FAST.Farm is equal to FLORIS and is higher than the deficit of the floating optimized layout with the baseline mooring system design. This proves that the difference in velocity deficit is due to the motions of FOWTs and their effect on the wake rather than to the different fidelity of the steady wake model in FLORIS and the DWM in FAST.Farm.
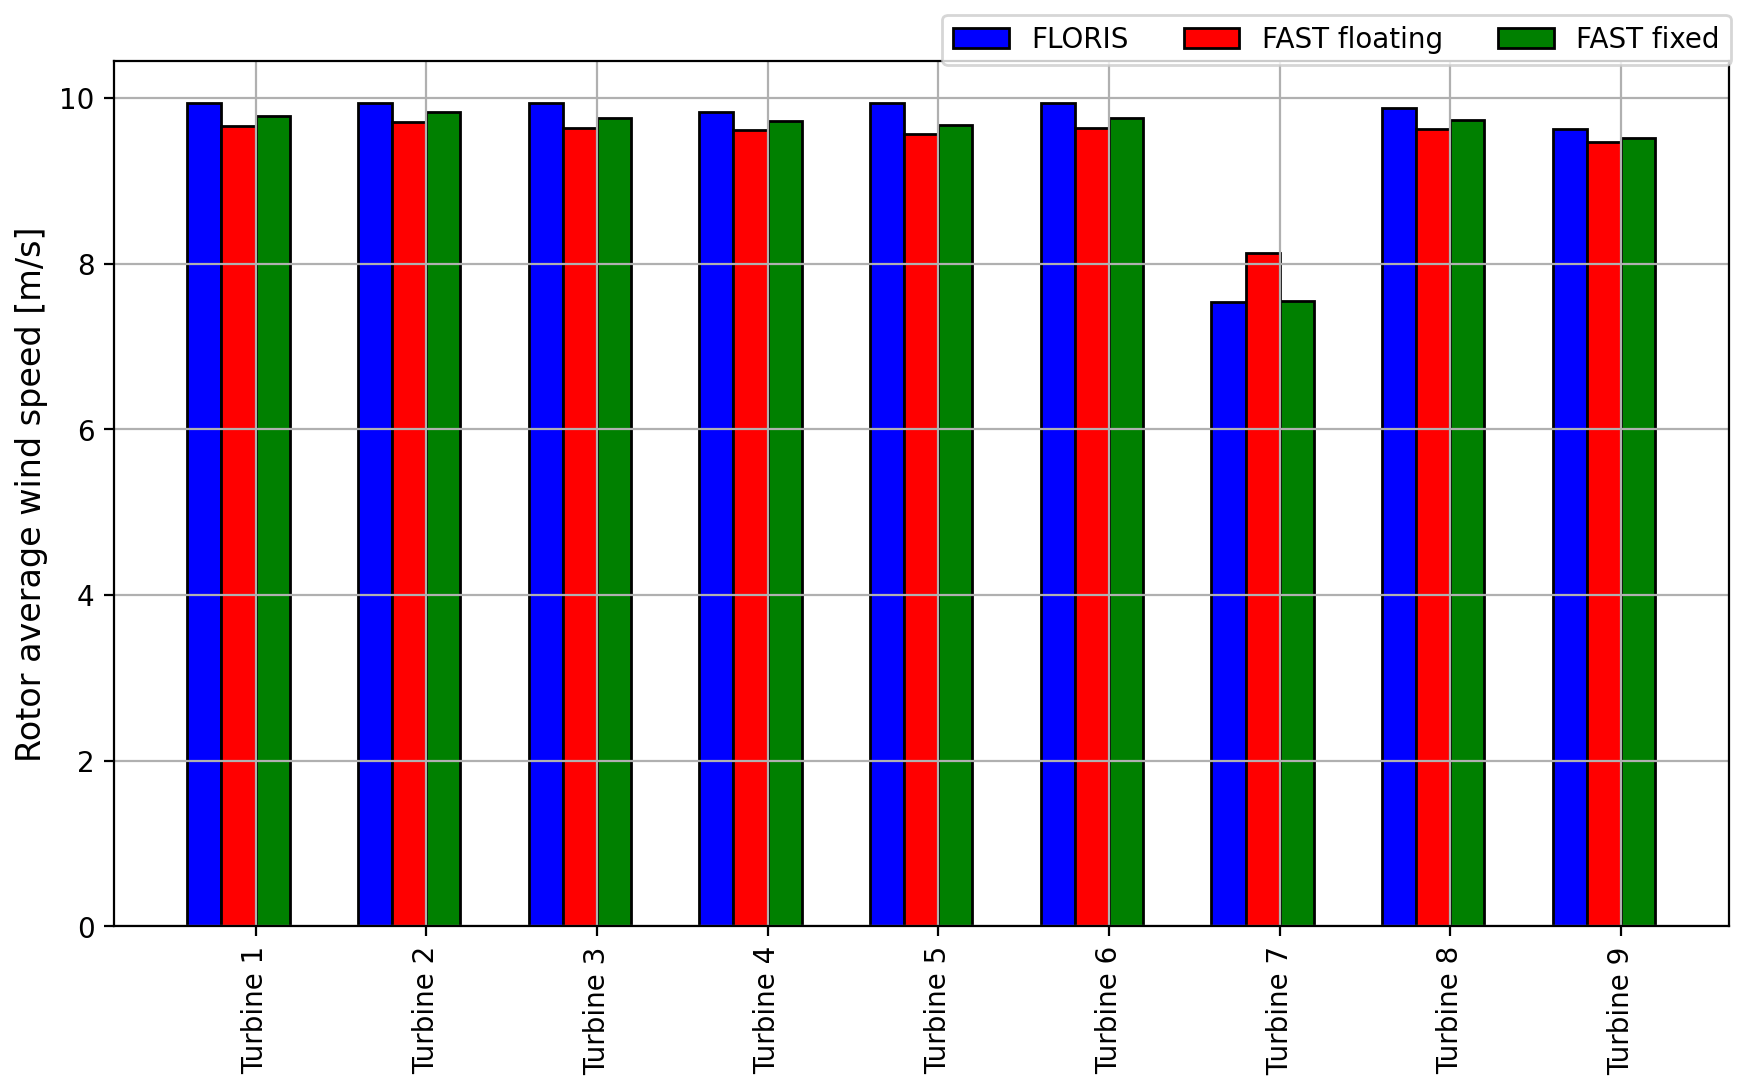
Figure 15The rotor average wind speed of the optimized wind farm layout as a fixed bottom and coupled to the baseline mooring system in FAST.Farm and FLORIS
Figure 16 shows that the wake center of Turbine 4 is deflected upward when it is floating compared to when it is fixed. After a distance of 6D, the wake center of Turbine 4 is at a height of 193 m for a fixed-bottom turbine and a height of 234 m for a FOWT. This means that the FOWT's wake is deflected 41 m more compared to that of a fixed-bottom turbine, which is equivalent to 0.17D. This agrees with the results found in Ramos-García et al. (2023), which indicated that FAST.Farm results showed larger vertical wake deflection when compared to the higher-fidelity wake model presented by Ramos-García et al. (2022b). Moreover, Fig. 16 shows the horizontal wind field of the wind farm at the hub height, which shows that the wake recovery is faster inside an FWF compared to a fixed-bottom wind farm. This is clear when looking at the wakes behind Turbines 2 and 3. The main reason for the faster wake recovery at the hub height is the vertical deflection of the wakes. Another reason is the motions of the FOWTs, which increase the turbulence of the flow field and hence increase the wake mixing and accelerate the wake recovery. In general, further work is needed to verify and calibrate the mid-fidelity DWM model in FAST.Farm with higher-fidelity models to capture the effects of FOWTs on the wake with more certainty.
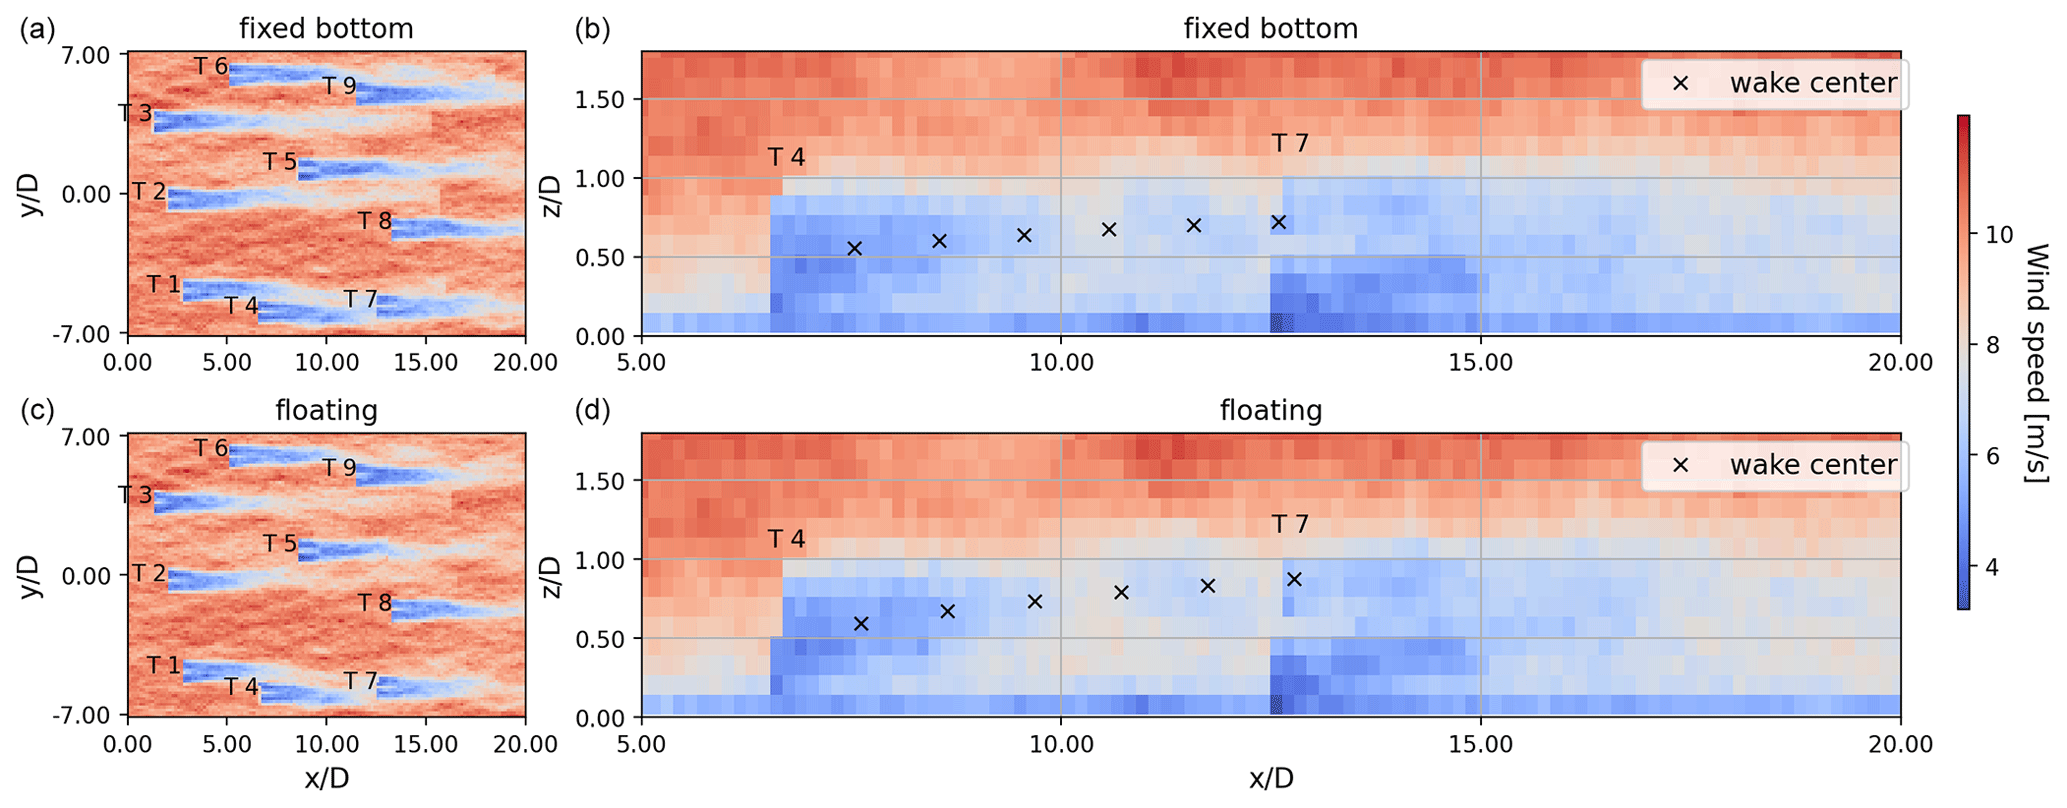
Figure 16FAST.Farm results of (a, b) the optimized wind farm layout as a fixed bottom and (c, d) the optimized wind farm layout coupled with the baseline mooring system. Panels (a) and (c) represent the horizontal plane at hub height; (b) and (d) are the vertical plane passing through the hub of Turbine 7.
3.5 Performance in normal operation
To check whether relocating the FOWTs increases the fatigue loads of the customized mooring system designs compared to the baseline mooring system, we calculated the damage equivalent loads (DELs) and the 25-year fatigue damage at rated wind speed of 11 m s−1. OpenFAST simulations of 4200 s were done for each of the nine turbines within the FWF. The wind field was generated using the Mann turbulence generator, and its parameters were defined following the IEC (2019) standard to achieve a turbulence intensity of 6 %. The fatigue loads of the mooring lines were assessed at all wind directions with a step of 10° leading to 36 wind directions. The significant wave height for all simulations was set to 2 m, and the wave period was set to 6 s. The wind and wave headings were aligned for all wind directions. The second-order wave loads were considered for all directions, and one wave seed and wind seed were used for each wind direction. We chose to do the fatigue analysis at the rated wind speed, as from our experience, this is where the fatigue loads are the highest. In this work, we focused on estimating the mooring line fatigue and did not check the effect of relocating the turbines on the blades and tower fatigue loads. Moreover, we did not check the wake effect on the mooring system fatigue loads, as it is out of the scope of this work. Therefore, we cannot make concrete conclusions on the lifetime damage of the FOWT or the mooring system. The results in this section give an indication of the fatigue loads of the mooring system.
The 1 Hz DELs were calculated using Eq. (4), with a Wöhler exponent m=3 and the Tsim equal to 3600 because the first 600 s from each simulation was omitted to decrease transient effects. The rain-flow counting method was used to count the load cycles for the mooring line fairlead tensions. The DELs of the three mooring lines of the baseline mooring system for each wind direction are shown in Fig. 17. The maximum DEL of each of the three lines is when the wind direction is aligned with the line, as this line will be carrying the highest tension. For example, when the wind direction is from east to west, Line 2 of the baseline mooring system in Fig. 17 will have the highest DEL value. Moreover, since the three lines in the baseline mooring system are identical and mooring system is symmetrical, the DELs of the lines are also symmetrical. In Fig. 18 the DELs of the lines of the customized mooring system attached to Turbine 1 can be seen. Similar to the baseline mooring system, the DELs are highest when the wind is aligned with a mooring line. However, since each mooring system is asymmetric, and the mooring lines are not identical, the values of the DELs of each line differ. In a wind farm design, we can benefit from the fact that the highest DELs happen when one of the lines is aligned with the wind direction to decrease fatigue loads. This can be achieved by avoiding having any of the mooring lines aligned with the most probable wind directions.
We calculated the 25-year damage using the T–N curve for studless chain mooring lines as defined within the API (2005) standard in Eq. (5), with a slope m=3 and an intercept k=316. T is the fairlead tension of the mooring lines, and N represents the cycles to failures. The minimum breaking load (MBL) is a function of the mooring line diameter d as in Eq. (6). For the damage calculations, we assumed that for the 25-year time, the wind speed is always at 11 m s−1, and no other wind speeds were considered. This is enough for the purpose of the paper comparing the customized mooring system fatigue to the baseline mooring system fatigue, but it does not show whether or not the mooring system designs survive a 25-year lifetime. As each mooring system has different headings and hence a different DEL at each wind direction, we decided to remove the effect of wind direction and line headings on the damage. We assumed equal wind distribution over all 36 wind directions considered. The 25-year damage results are presented in Fig. 19.
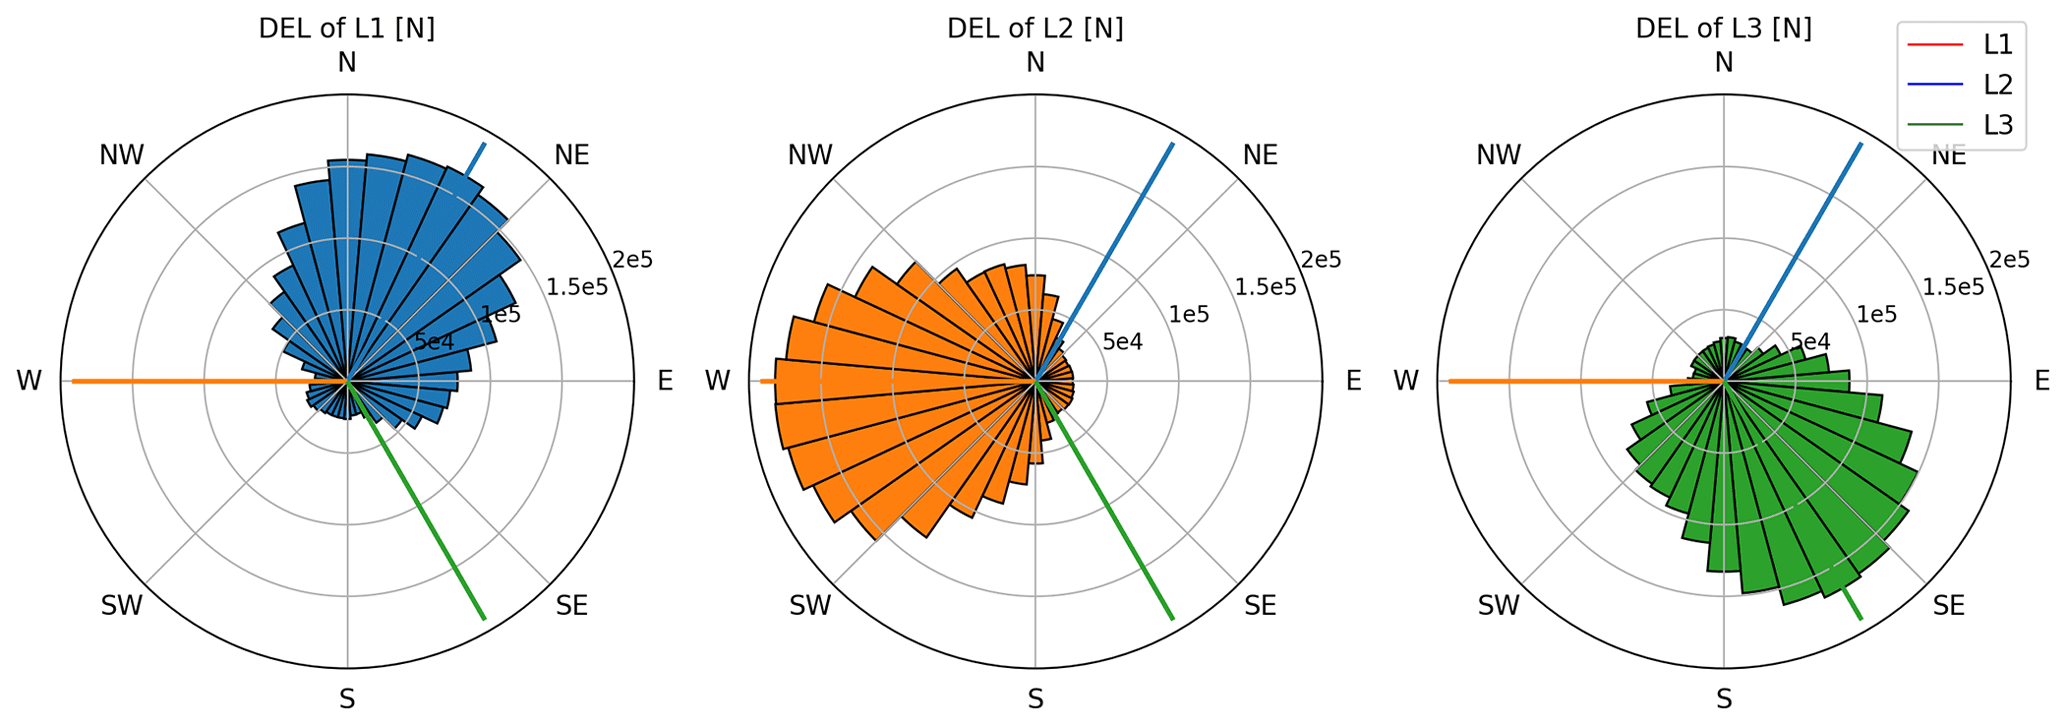
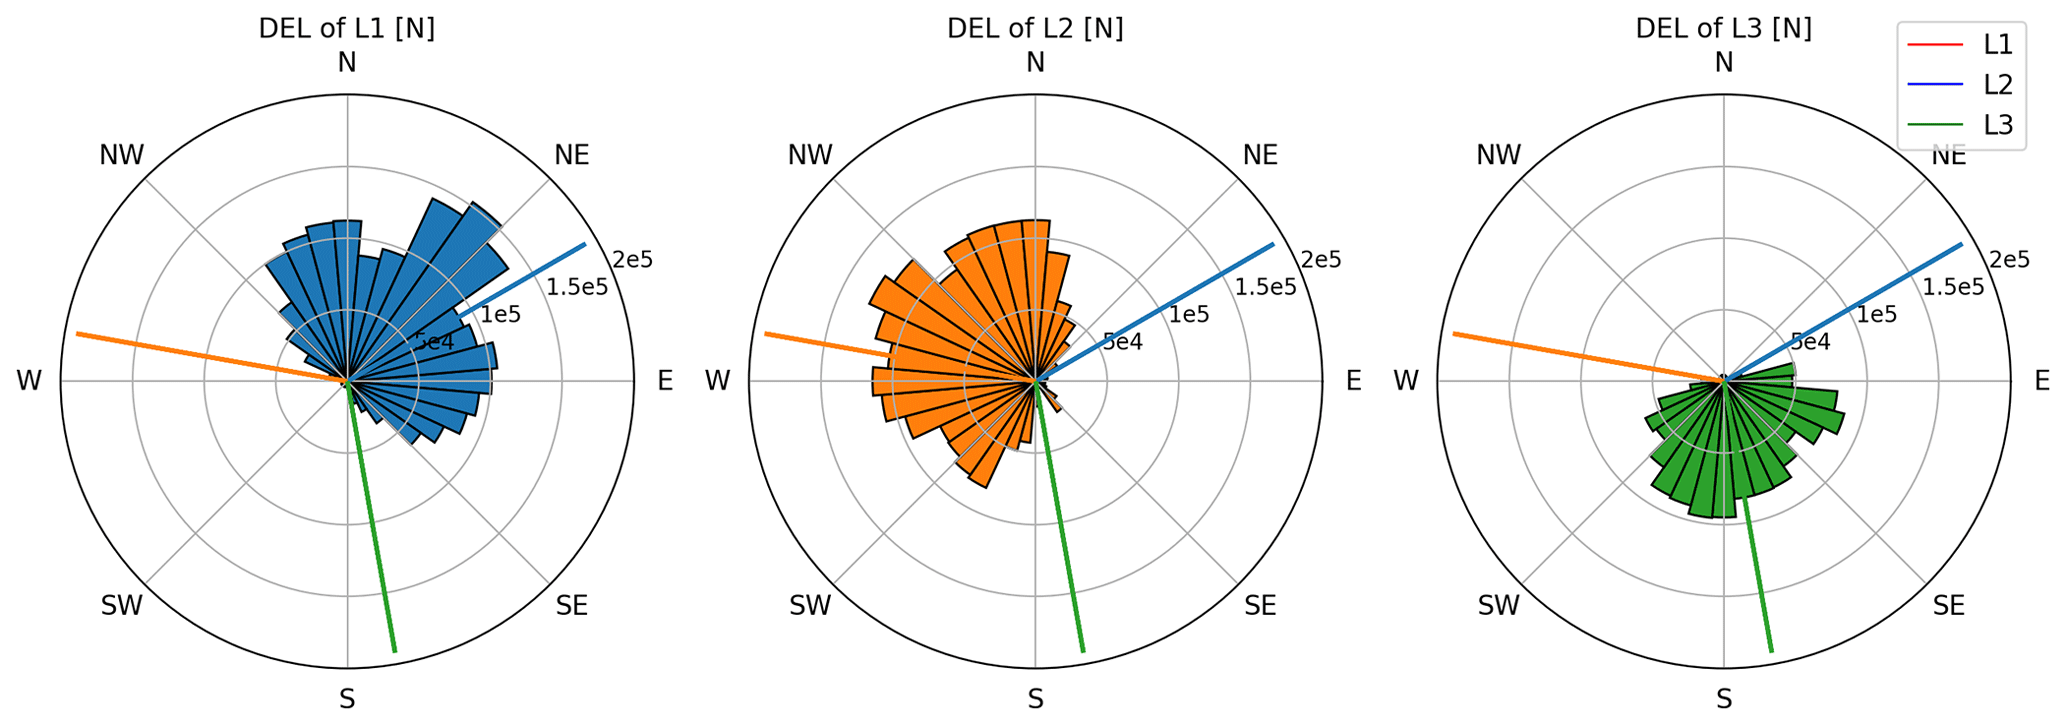
Figure 18The 1 Hz DEL of the customized mooring system design of Turbine 1 in the FWF at each wind direction.
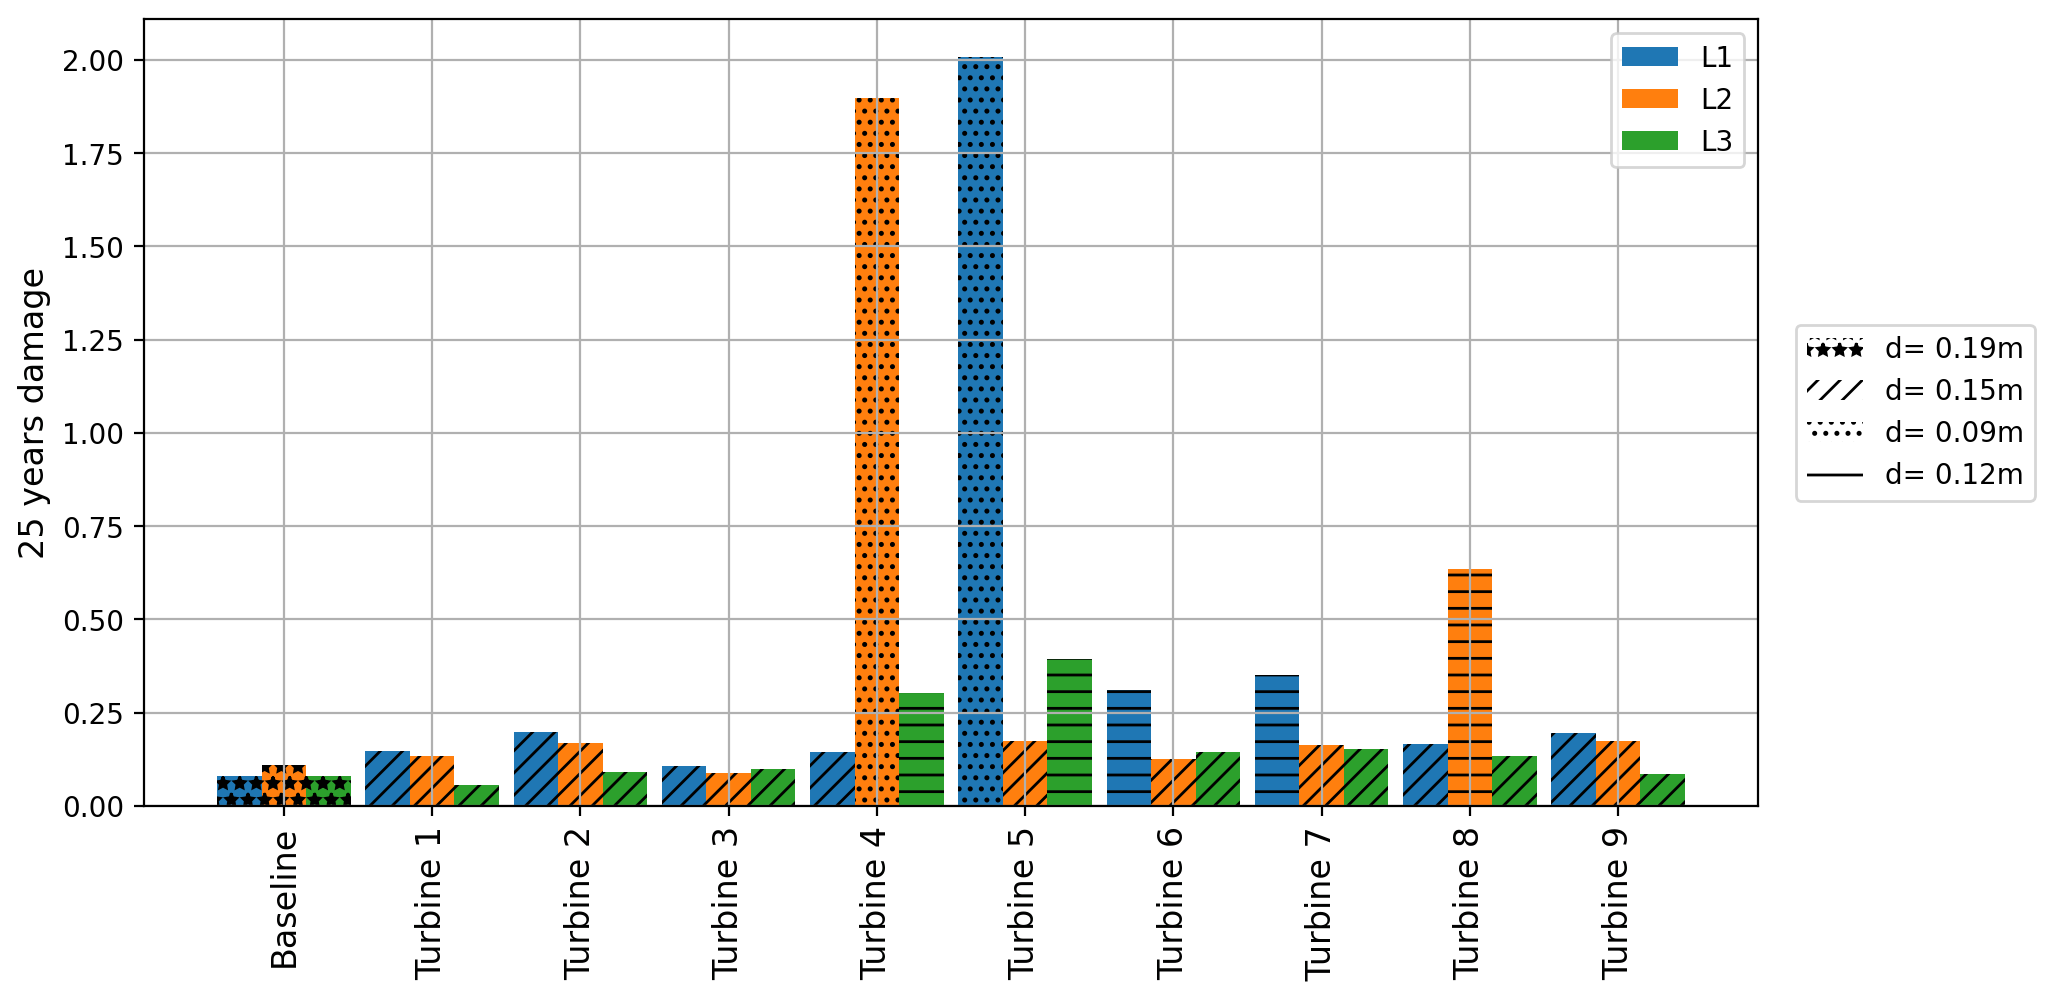
The baseline mooring system fatigue damage is generally the lowest with the largest line diameter of 0.19 m. The customized mooring system 25-year fatigue damage is overall comparable, except for a few lines. The mooring lines with fatigue damage greater than 1.75 have a line diameter of only 0.09 m. The remainder of lines with fatigue damage greater than 0.25 have a line diameter of 0.12 m. All of the customized mooring lines with a diameter of 0.150 m show fatigue damage of less than 0.25, which is comparable to the baseline design. This is notable because the customized mooring system designs achieve similar fatigue damage with a significantly smaller line diameter.
The fatigue performance of the mooring system relates to the mooring system stiffness. The stiffness at a given position is equal to the slope of the force–displacement response of the mooring system at that offset. The FOWTs are offset to a mean displacement under the thrust force of the wind turbine. Then, waves act on the mooring system causing oscillations in position and tension about the mean. The stiffness, or the slope of the tension–displacement response, is representative of the amplitude of wave–frequency tension fluctuations about the mean. The customized mooring system designs have much lower stiffness overall compared to the baseline, resulting in lower tension amplitudes and resulting fatigue damage. Additionally, the reduced stiffness will in principle reduce the platform motion responses to first-order wave forces as the system is even farther from resonance.
Finally, we checked the mooring line tensions for snap loads as the mooring systems presented are less stiff than the state-of-the-art mooring designs. However, we have not seen any snap loads in the operation conditions in any of the cases we checked.
3.6 Performance in extreme conditions
The ability of the customized mooring system designs to withstand extreme loads was also checked. We applied extreme 50-year wind and wave conditions with a wind speed of 28.35 m s−1, a significant wave height of 5.11 m, and a wave period of 9 s. These extreme values were chosen because they were the values used to design the Activefloat platform used within this work as introduced by Mahfouz et al. (2021). The extreme wind field was produced using the Mann turbulence generator with turbulence intensity of 11 % as recommended by the IEC (2019) standard for extreme wind conditions. OpenFAST was used to simulate each of the customized mooring system designs, and the baseline mooring system designs for 36 wind directions and second-order wave loads were considered. The simulation time was set to 4200 s, and the first 600 s was omitted to avoid transient effects.
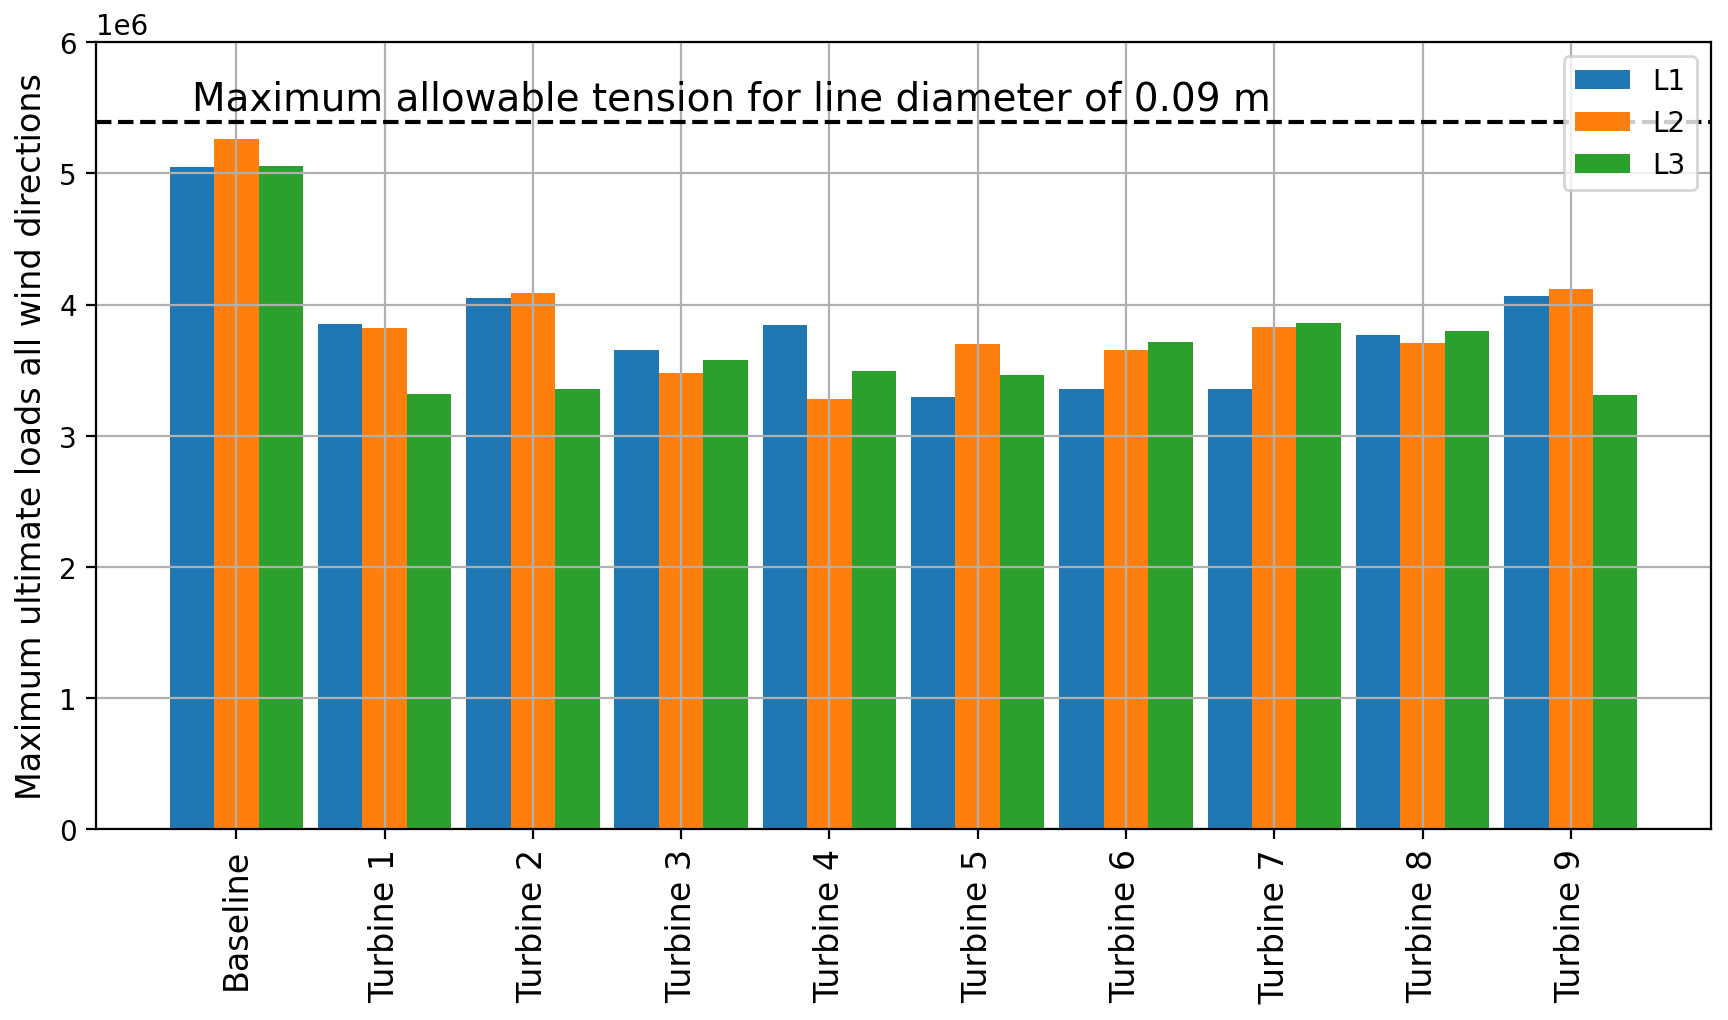
Figure 20Maximum tension of each mooring system design for all wind directions under extreme wind and wave loads.
The maximum tension of each line for all the 36 wind directions is shown in Fig. 20. The maximum tensions of the customized mooring system design are always lower than the tension of the baseline mooring system. Moreover, the maximum tensions were always lower than the maximum allowable tension for all mooring lines. The maximum allowable tension was calculated by dividing the MBL, as defined in Eq. (6), by a safety factor of 2. This safety factor is consistent with the safety factor defined by the API (2005) standard. The maximum allowable tension shown in Fig. 20 stands for the value for a mooring line of 0.09 m diameter, as this is the smallest diameter in the customized mooring system designs. Therefore, we can conclude from Fig. 20 that all mooring system designs can withstand the extreme loads. Finally, we have not seen any snap loads in the extreme loading conditions in any of the cases we checked.
This paper verifies an innovative method for FWF layout design and optimization using mid-fidelity dynamic models. The novel method aims to passively relocate downwind FOWTs out of the wakes of upwind ones in an FWF to decrease wake losses. The relocation of the FOWTs depends on the mooring system design to govern the FOWTs' movements according to the wind direction. The verification process has two key objectives: first, verify the energy gain predicted by the Gaussian steady-state wake model implemented within FLORIS against the DWM model within FAST.Farm and, second, verify that the novel mooring system designs can withstand the fatigue and extreme loads in operational and extreme conditions when compared to a state-of-the-art mooring system design.
The findings of the paper can be summarized as follows:
-
Passively relocating the FOWTs in an FWF increases the farm's energy production.
-
Allowing larger FOWT excursions decreases the fatigue loads on the mooring lines at rated wind speed.
-
Allowing larger FOWT excursions decreases the extreme loads on the mooring lines.
-
Fatigue loads on a mooring line are highest when the mooring line is upwind and aligned with the wind direction.
The paper first introduced the four steps of the FWF layout design methodology and showed the results of each step using static models. The results of the static models showed that at a constant wind speed of 10 m s−1, FOWT movements can increase the energy production of the FWF by 3.1 %. Afterward, we verified these results using the polar implementation of the DWM model within FAST.Farm. First, we simulated the baseline FWF with all FOWTs coupled to the baseline mooring system, which restricted the FOWTs' movements. Then we simulated the FWF with each FOWT coupled to the customized mooring system design allowing crosswind movements to mitigate the wake losses. This was repeated for all wind directions of the wind rose presented in Fig. 2. Finally, we compared the results of the energy production of the baseline FWF to the new FWF layout design. The energy gain calculated by FAST.Farm was 1.4 % at a constant wind speed of 10 m s−1; this is 45 % of the energy gain predicted by the steady-state wake models. However, the results showed that FAST.Farm overpredicts the vertical wake deflection for FOWTs and hence underestimates the wake losses within the baseline FWF layout. This causes the big difference between the steady-state wake model and the DWM model, as explained in Sect. 3.4. Calibration of the DWM model within FAST.Farm using higher-fidelity large-eddy simulations is needed to decrease the uncertainty in the wake losses inside an FWF, as shown in the work of Rivera-Arreba et al. (2024).
The study also assessed the performance of the novel mooring system designs and their fatigue loads in operational conditions at rated wind speeds. Wind and wave simulations were conducted at a rated wind speed of 11 m s−1 for all wind directions with an increment of 10° (i.e., 36 wind directions). Then we calculated the 1 Hz DEL and the 25-year damage. The results showed that the customized mooring system designs have lower 25-year damage than a state-of-the-art mooring system design with the same mooring line diameter. This is due to the lower stiffness of the customized mooring system designs, which leads to smaller dynamic fluctuations in the fairlead tensions. However, the results only analyze the fatigue damage at a rated wind speed. Moreover, the results showed a direct relationship between the line headings, wind direction, and DEL values. The fatigue loads were highest when the wind was aligned with the upwind mooring line. Therefore, in any FWF we should avoid aligning the mooring lines with the most probable wind direction in order to avoid having high fatigue loads concentrated at one of the mooring lines.
Furthermore, we checked that the customized mooring system designs can endure 50-year extreme wind and wave events for all 36 wind directions with an increment of 10°. The results showed that the maximum loads on the new customized mooring system designs were always lower than a baseline state-of-the-art mooring system design. All customized mooring system designs comfortably withstood extreme 50-year events for all wind directions when applying a safety factor of 2.
In conclusion, this study successfully verified the potential of relocating FOWTs to increase energy production within FWFs using a mid-fidelity dynamic analysis, which is the primary goal of this research. Despite the uncertainties associated with the DWM model for wake losses, the dynamic results predicted an energy gain of 1.4 % at a constant wind speed of 10 m s−1. Additionally, the FOWTs moved as predicted in the design process, and the energy gain distribution in Fig. 12 was as predicted by the steady-state model in the design process. Additionally, the paper showed that designing mooring systems with larger excursion limits and lower stiffness lead to lower mooring system fatigue damage and extreme loads. This means that allowing larger excursions leads to mooring lines with smaller diameters.
In future work, we are planning to make our designs more realistic and consider real-life scenarios. We are planning to use one customized mooring system design for all FOWTs in the FWF instead of having different mooring system for each FOWT. Additionally, we will decrease the FOWT excursion limits to bring them closer to the current limits used within the current state-of-the-art mooring system designs. Moreover, we are planning to include the levelized cost of energy as a design objective along with increasing the energy gain. Moreover, we are planning to consider the supply chain and ease of installation by designing a single mooring system for all FOWTs in the FWF instead of having a different mooring system design for each FOWT in the FWF. Additionally, studying the effect of the FOWT's larger displacement on the cable costs and cable design is still missing in the current work. Finally, the optimization process should include from the beginning the ability of the FOWTs to relocate their positions passively, and this should be integrated in a full optimization routine instead of the step-by-step approach followed in this paper.
The code used for FWF layout optimization and the MoorDyn file for each mooring system design can be found at https://doi.org/10.5281/zenodo.8370977 (Mahfouz, 2023a).
An animation video of the passive displacements of the FOWTs can be found at http://doi.org/10.5446/63167 (Mahfouz, 2023b).
MYM developed the novel method to passively relocate the FOWTs in the FWF, carried out all the static and dynamic simulations, and wrote most of the paper. EL designed the baseline mooring system, contributed to the fatigue analysis post-processing, and helped in writing and reviewing the paper. MH contributed to the conceptualization of the methods and reviewed the paper. PWC supervised the work and reviewed the paper.
The contact author has declared that none of the authors has any competing interests.
The views expressed in the article do not necessarily represent the views of the DOE or the U.S. Government.
Publisher’s note: Copernicus Publications remains neutral with regard to jurisdictional claims made in the text, published maps, institutional affiliations, or any other geographical representation in this paper. While Copernicus Publications makes every effort to include appropriate place names, the final responsibility lies with the authors.
The support of Jason Jonkman, Andrew Platt, and Lucas Carmo in setting up the FWF model in FAST.Farm is gratefully acknowledged. The research leading to these results has received partial funding from the European Union’s Horizon2020 Research and Innovation Programme under grant agreement no. 815083 (COREWIND). This work was authored in part by the National Renewable Energy Laboratory, operated by the Alliance for Sustainable Energy, LLC, for the U.S. Department of Energy (DOE) under contract no. DE-AC36-08GO28308. The U.S. Government retains and the publisher, by accepting the article for publication, acknowledges that the U.S. Government retains a nonexclusive, paid-up, irrevocable, worldwide license to publish or reproduce the published form of this work, or allow others to do so, for U.S. Government purposes.
This research has been supported by the EU Horizon 2020 research project COREWIND (grant no. 815083).
This open-access publication was funded by the University of Stuttgart.
This paper was edited by Maurizio Collu and reviewed by three anonymous referees.
API: API RP 2SK: Design and Analysis of Stationkeeping Systems for Floating Structures, Tech. Rep., American Petroleum Institute, https://www.intertekinform.com/en-au/standards/api-rp-2sk-2005-97009_saig_api_api_2630188/ (last access 11 July 2024), 2005. a, b, c, d
Baker, N. F., Stanley, A. P., Thomas, J. J., Ning, A., and Dykes, K.: Best practices for wake model and optimization algorithm selection in wind farm layout optimization, in: AIAA Scitech 2019 Forum, San Diego, California, 2019, https://doi.org/10.2514/6.2019-0540, 2019. a, b
Bastankhah, M. and Porté-Agel, F.: Experimental and theoretical study of wind turbine wakes in yawed conditions, J. Fluid Mech., 806, 506–541, https://doi.org/10.1017/jfm.2016.595, 2016. a, b
Bodini, N. and Optis, M.: Operational-based annual energy production uncertainty: are its components actually uncorrelated?, Wind Energ. Sci., 5, 1435–1448, https://doi.org/10.5194/wes-5-1435-2020, 2020. a
Crespo, A. and Hernández, J.: Turbulence characteristics in wind-turbine wakes, J. Wind Eng. Ind. Aerod., 61, 71–85, https://doi.org/10.1016/0167-6105(95)00033-X, 1996. a
Doubrawa, P., Annoni, J., Jonkman, J., and Ghate, A.: Optimization-based calibration of FAST.Farm parameters against SOWFA, in: Wind Energy Symposium, Kissimmee, Florida, 2018, 1–16, https://doi.org/10.2514/6.2018-0512, 2018. a
Fleming, P., Gebraad, P. M., Lee, S., van Wingerden, J.-W., Johnson, K., Churchfield, M., Michalakes, J., Spalart, P., and Moriarty, P.: Simulation comparison of wake mitigation control strategies for a two-turbine case, Wind Energy, 18, 2135–2143, https://doi.org/10.1002/we.1810, 2015. a
Fleming, P. A., Ning, A., Gebraad, P. M. O., and Dykes, K.: Wind plant system engineering through optimization of layout and yaw control, Wind Energy, 19, 329–344, https://doi.org/10.1002/we.1836, 2016. a
Gaertner, E., Rinker, J., Sethuraman, L., Zahle, F., Anderson, B., Barter, G. E., Abbas, N. J., Meng, F., Bortolotti, P., Skrzypinski, W., Scott, G. N., Feil, R., Bredmose, H., Dykes, K., Shields, M., Allen, C., and Viselli, A.: IEA Wind TCP Task 37: Definition of the IEA 15-Megawatt Offshore Reference Wind Turbine, Tech. rep., International Energy Agency, https://www.nrel.gov/docs/fy20osti/75698.pdf (last access: last access: 11 July 2024), 2020. a
Gill, P. E., Murray, W., and Saunders, M. A.: SNOPT: An SQP algorithm for large-scale constrained optimization, SIAM Review, 47, 99–131, https://doi.org/10.1137/S0036144504446096, 2005. a
Gill, P. E., Murray, W., and Saunders, M. a.: User's Guide for SNOPT Version 7, Tech. Rep., https://web.stanford.edu/group/SOL/guides/sndoc7.pdf (last access: 11 July 2024), 2008. a
Hall, M., Housner, S., Sirnivas, S., and Wilson, S.: MoorPy (Quasi-Static Mooring Analysis in Python), DOE Code [software], https://doi.org/10.11578/dc.20210726.1, 2021. a
IEC: International Standard IEC61400-3-1:Wind energy generation systems – Part 3-1: Design requirements for fixed offshore wind turbines, First; 2019, Standard, IEC, https://webstore.iec.ch/en/publication/29360 (last access: 11 July 2024), 2019. a, b, c
Johlas, H.: Simulating the Effects of Floating Platforms, Tilted Rotors, and Breaking Waves for Offshore Wind Turbines, https://doi.org/10.7275/24291287, 2021. a
Jonkman, J. and Shaler, K.: FAST.Farm User's Guide and Theory Manual, Tech Report, https://www.nrel.gov/docs/fy21osti/78485.pdf (last access: 11 July 2024), 2020. a
Jonkman, J., Doubrawa, P., Hamilton, N., Annoni, J., and Fleming, P.: Validation of FAST.Farm Against Large-Eddy Simulations, J. Phys. Conf. Ser., 1037, 062005, https://doi.org/10.1088/1742-6596/1037/6/062005, 2018. a
Kheirabadi, A. C. and Nagamune, R.: Modeling and power optimization of floating offshore wind farms with yaw and induction-based turbine repositioning, Proceedings of the American Control Conference, Philadelphia, PA, USA, 10–12 July 2019, 5458–5463, https://doi.org/10.23919/acc.2019.8814600, 2019. a, b
Kheirabadi, A. C. and Nagamune, R.: Real-time relocation of floating offshore wind turbine platforms for wind farm efficiency maximization: An assessment of feasibility and steady-state potential, Ocean Eng., 208, 107445, https://doi.org/10.1016/j.oceaneng.2020.107445, 2020. a
King, J., Fleming, P., King, R., Martínez-Tossas, L. A., Bay, C. J., Mudafort, R., and Simley, E.: Control-oriented model for secondary effects of wake steering, Wind Energ. Sci., 6, 701–714, https://doi.org/10.5194/wes-6-701-2021, 2021. a
Mahfouz, M. Y.: SWE-UniStuttgart/FloatingWAYS: Beta Version (v0.2.0-beta), Zenodo [code and data set], https://doi.org/10.5281/zenodo.8370977, 2023a. a
Mahfouz, M. Y.: A passively self-adjusting floating wind farm layout design [video], https://doi.org/10.5446/63167, 2023b. a, b
Mahfouz, M. Y. and Cheng, P. W.: A passively self-adjusting floating wind farm layout to increase the annual energy production, Wind Energy, 26, 251–265, https://doi.org/10.1002/we.2797, 2023. a, b, c, d, e, f, g
Mahfouz, M. Y., Salari, M., Vigara, F., Hernandez, S., Molins, C., Trubat, P., Bredmose, H., and Pegalajar-Jurado, A.: D1.3. Public design and FAST models of the two 15MW floater-turbine concepts, Zenodo, https://doi.org/10.5281/zenodo.4385727, 2020. a, b
Mahfouz, M. Y., Molins, C., Trubat, P., Hernández, S., Vigara, F., Pegalajar-Jurado, A., Bredmose, H., and Salari, M.: Response of the International Energy Agency (IEA) Wind 15 MW WindCrete and Activefloat floating wind turbines to wind and second-order waves, Wind Energy Science, 6, 867–873, https://doi.org/10.5194/wes-6-867-2021, 2021. a, b, c
Mahfouz, M. Y., Hall, M., and Cheng, P. W.: A parametric study of the mooring system design parameters to reduce wake losses in a floating wind farm, J. Phys. Conf. Ser., 2265, 42004, https://doi.org/10.1088/1742-6596/2265/4/042004, 2022. a, b
Mann, J.: Wind field simulation, Probabilist. Eng. Mech., 13, 269–282, https://doi.org/10.1016/s0266-8920(97)00036-2, 1998. a
Nanos, E. M., Bottasso, C. L., Tamaro, S., Manolas, D. I., and Riziotis, V. A.: Vertical wake deflection for floating wind turbines by differential ballast control, Wind Energ. Sci., 7, 1641–1660, https://doi.org/10.5194/wes-7-1641-2022, 2022. a
Niayifar, A. and Porté-Agel, F.: Analytical modeling of wind farms: A new approach for power prediction, Energies, 9, 741, https://doi.org/10.3390/en9090741, 2016. a
NREL: FLORIS. Version 3.1, GitHub [code], https://github.com/NREL/floris, 2023. a
Perez-Moreno, S. S., Dykes, K., Merz, K. O., and Zaaijer, M. B.: Multidisciplinary design analysis and optimisation of a reference offshore wind plant, J. Phys. Conf. Ser., 1037, https://doi.org/10.1088/1742-6596/1037/4/042004, 2018. a
Ramos-García, N., González Horcas, S., Pegalajar-Jurado, A., Kontos, S., and Bredmose, H.: Investigation of the floating IEA wind 15-MW RWT using vortex methods Part II: Wake impact on downstream turbines under turbulent inflow, Wind Energy, 25, 1434–1463, https://doi.org/10.1002/we.2738, 2022a. a
Ramos-García, N., Kontos, S., Pegalajar-Jurado, A., González Horcas, S., and Bredmose, H.: Investigation of the floating IEA Wind 15 MW RWT using vortex methods Part I: Flow regimes and wake recovery, Wind Energy, 25, 468–504, https://doi.org/10.1002/we.2682, 2022b. a, b
Ramos-García, N., González-horcas, S., Pegalajar-jurado, A., Gözcü, O., Bredmose, H., Özinan, U., Mahfouz, M. Y., Fontanella, A., Facchinetti, A., and Belloli, M.: D1.5: Methods for nonlinear wave forcing and wakes, Tech. Rep. March 2022, https://corewind.eu/wp-content/uploads/files/delivery-docs/D1.5.pdf (last access: 11 July 2024), 2023. a
Rivera-Arreba, I., Li, Z., Yang, X., and Bachynski-Polić, E. E.: Comparison of the dynamic wake meandering model against large eddy simulation for horizontal and vertical steering of wind turbine wakes, Renew. Energ., 221, 119807, https://doi.org/10.1016/j.renene.2023.119807, 2024. a
Rodrigues, S. F., Teixeira Pinto, R., Soleimanzadeh, M., Bosman, P. A., and Bauer, P.: Wake losses optimization of offshore wind farms with moveable floating wind turbines, Energ. Convers. Manage., 89, 933–941, https://doi.org/10.1016/j.enconman.2014.11.005, 2015. a, b
- Abstract
- Introduction
- Self-adjusting floating wind farm design
- Design performance and verification
- Conclusions
- Appendix A: FWF mooring system designs
- Code and data availability
- Video supplement
- Author contributions
- Competing interests
- Disclaimer
- Acknowledgements
- Financial support
- Review statement
- References