the Creative Commons Attribution 4.0 License.
the Creative Commons Attribution 4.0 License.
 | 02 Aug 2024
Experimental analysis of a horizontal-axis wind turbine with swept blades using PIV data
Koen Boorsma
Carlos Ferreira
This study presents findings from a wind tunnel experiment investigating a model wind turbine equipped with aft-swept blades. Utilising particle image velocimetry, velocity fields were measured at multiple radial stations. These allow the derivation of blade-level aerodynamic parameters, including bound circulation, induction values, inflow angle, angle of attack, and forces normal and tangential to the rotor plane. The measured local lift coefficient aligns well with the lift polar of the design airfoil, validating the experimental approach.
The resulting public dataset provides a comprehensive aerodynamic characterisation of rotating swept blades in controlled conditions. It can serve as a baseline for future experimental research on swept wind turbine blades. Furthermore, it is valuable in validating numerical models of varying fidelity simulating swept wind turbine blades. The provided blade-level aerodynamics are particularly relevant to lower-fidelity models such as blade element momentum theory and lifting-line algorithms. At the same time, the measured flow fields can be compared against higher-fidelity simulation results from computational fluid dynamics.
- Article
(2933 KB) - Full-text XML
- BibTeX
- EndNote


In the pursuit of reducing the levelised cost of energy, wind turbine rotors are becoming increasingly large. Current state-of-the-art horizontal-axis wind turbines (HAWTs) feature blade lengths beyond the 100 m mark. Consequently, these blades become more slender and flexible, increasing the interaction between aerodynamic forces and structural deformations. A challenge arising from this is the development of techniques which can be used to tailor the aeroelastic behaviour of blades.
Blade sweep, first discussed in the context of wind turbine blades by Liebst (1986), offers such an aeroelastic tailoring potential. It is defined as the displacement of the blade axis in the rotor plane. This creates an offset between a blade cross-section's aerodynamic and shear centre, thus coupling bending and torsional deformations. Blade sweep is, therefore, also referred to as geometric bend–twist coupling. For example, an aft-swept blade under flapwise loading will locally twist to lower angles of attack, thereby reducing the flapwise loading (Larwood and Zuteck, 2006). The potential for bending load reduction has been demonstrated numerically by Verelst and Larsen (2010) and Larwood et al. (2014).
Conversely, this reduction in loading suggests that the diameter of a rotor with swept blades can be increased, effectively increasing the turbine's power rating while staying within the load envelope of a straight-bladed reference rotor. This was demonstrated experimentally in the STAR (sweep twist adaptive rotor) project on a sub-megawatt wind turbine where the swept blade configuration produced 10 %–12 % more energy than the straight baseline configuration (see Ashwill et al. (2010)).
It should be noted that blade sweep generally entails an increase in torsional moment. Numerical simulations by Verelst and Larsen (2010) and Suzuki et al. (2011) indicate this increase to be in the range of 280 %–400 %. Another obstacle in developing swept blades on the state-of-the-art scale is that wind turbine blade design optimisation still largely relies on simulation tools based on blade element momentum theory (BEM). Its rapid calculation speed makes it the only viable tool to simulate the many load cases that wind turbines experience during their lifetime in a reasonable time. BEM algorithms, in their basic form, however, cannot accurately represent the aerodynamics of swept blades as they inherently assume a straight blade geometry.
Recently, research efforts have been made to develop computationally efficient simulation tools that can account for blade sweep. Li et al. (2018, 2020, 2021) extended the near-wake model by Pirrung et al. (2016) to swept-blade applications. Fritz et al. (2022) present a correction model which enables BEM algorithms to account for blade sweep.
In parallel to the numerical developments, further experimental studies have been conducted. Barlas et al. (2021, 2022) tested a non-rotating swept wind turbine blade tip in a wind tunnel and later on a rotor test rig in the field, which allowed the testing of the tip on a “one-armed” turbine. An experimental study of swept blades on a three-bladed rotor in controlled conditions is yet missing in the literature.
The present work provides precisely a wind tunnel campaign on a HAWT equipped with swept blades. Particle image velocimetry (PIV) is used to measure detailed flow fields in the vicinity of the blades. Blade-level aerodynamics are derived from these flow fields, characterising the blades in terms of circulation, axial and tangential induction, inflow angle, angle of attack, and forces normal and tangential to the rotor plane. Previous studies have demonstrated that the spanwise distributions of blade-level aerodynamic quantities change with respect to a straight reference when applying blade sweep (Li et al., 2021; Fritz et al., 2022). These changes can be explained by the misalignment between the local inflow and the airfoil orientation in the swept part of the blade, the displacement of the trailed vorticity in azimuthal direction, and the induction of the curved bound vorticity on itself. The experimental dataset presented in this study enables the validation of low- to high-fidelity numerical tools used for simulating the aerodynamics of swept blades in terms of the aforementioned quantities. By basing the scaled blade geometry on the aerodynamic characteristics of the IEA 15 MW reference wind turbine (Gaertner et al., 2020), the relevance for current research interests of the wind energy community is ensured. For example, this reference turbine is being studied extensively in the ongoing IEA task 47 (Schepers, 2021).
This article is structured as follows: Sect. 2 introduces the experimental set-up, including the scaled wind turbine model and the measurement system. Furthermore, a brief description of the methods used to derive aerodynamic quantities from the PIV-processed velocity fields is given. The results are presented in Sect. 3. Initially, the procedure of accounting for pitch and twist deviations from the original design is explained. This is followed by analysing the flow fields, blade-level aerodynamics and the lift polar. In Sect. 4, conclusions are drawn, and suggestions for future research are made.
2.1 Scaled wind turbine model
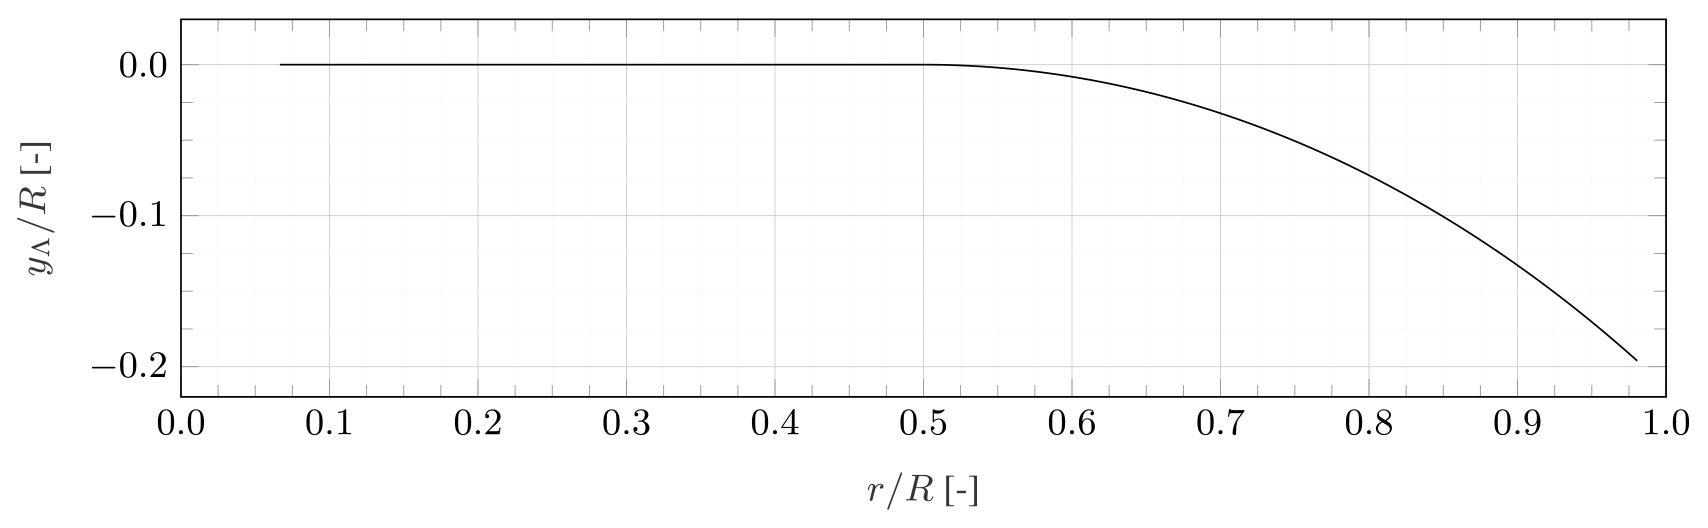
The wind tunnel model used for this study is a horizontal-axis wind turbine with a rotor diameter of D=1.8 m. It is, with the exception of blade sweep, identical to that presented in Fritz et al. (2024). The swept blades are derived from the straight reference blade by gradually displacing the blade axis in the rotor plane as a function of the radial position r:
where R is the blade tip radius. The sweep starting position is chosen as rstart=0.5 R, the tip displacement as ytip=0.2 R and the sweep exponent as γ=2. Such tip displacement values would likely be unrealistic on a full-scale, operational wind turbine. For example, the blades tested in the STAR project had a tip radius of 28 m and a tip displacement of 2.2 m, corresponding to ytip=0.08 R (Ashwill et al., 2010). Nevertheless, this tip sweep is chosen to exaggerate the effect of sweep on the blade's aerodynamic characteristics. This exaggeration is intended to ensure that the effect of sweep exceeds the uncertainties and noise otherwise present in experimental data and, thus, facilitate the validation of numerical models. The local sweep angle can be determined as . The swept blade geometry is generated by locally orienting the airfoils perpendicular to the swept blade axis. To maintain the same tip radius as the unswept reference blade, the swept-blade axis coordinates are scaled by . If this were not done, the swept-blade tip radius would be , and the rotor area of the straight and swept blades would be unequal. The swept blade axis is depicted in Fig. 1. Note that the blade root radius is .
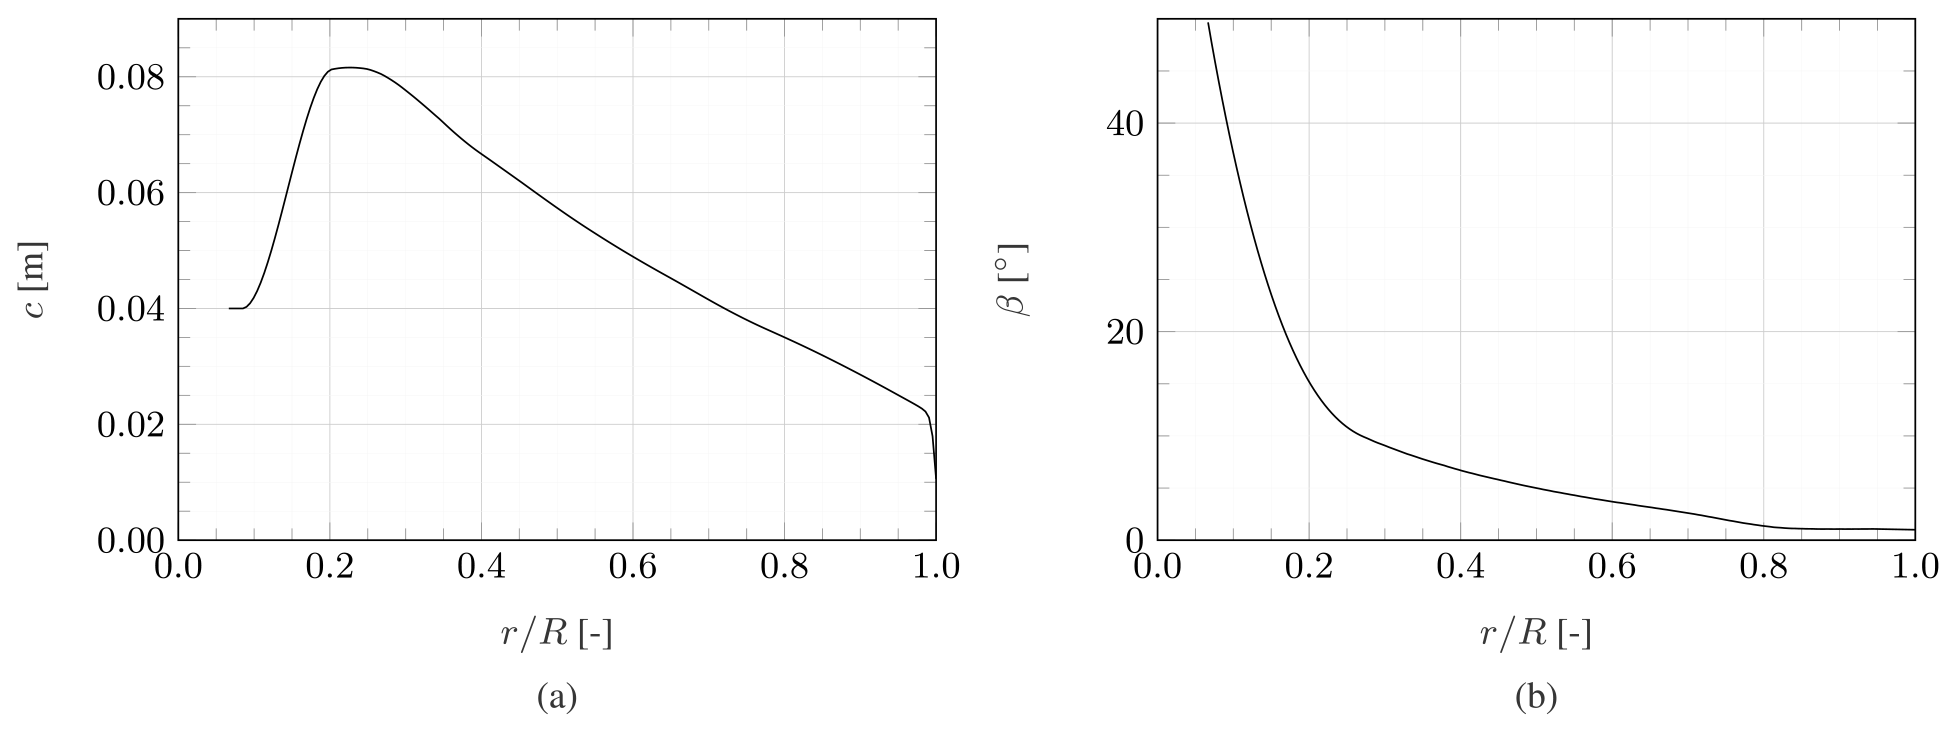
Chord and twist distributions of the straight reference blade, as shown in Fig. 2, are kept identical for the swept blade. These distributions were derived to obtain a scaled version of the IEA 15 MW reference wind turbine (RWT) as defined by Gaertner et al. (2020). The main objective of the scaling procedure was to maintain the IEA 15 MW RWT blade's non-dimensionalised thrust distribution. The blade geometry is defined by the SD7032 airfoil, which blends into a cylinder close to the blade root. This airfoil has been used in multiple wind tunnel experiments on rotating wind turbines, e.g. by Fontanella et al. (2022) or Kimball et al. (2022), because of its good performance in low-Reynolds-number conditions. Details of the scaling approach can be found in Fritz et al. (2024).
The blades used in this experiment were manually manufactured out of vacuum-infused carbon-fibre-reinforced material. They were manufactured to be stiff to enable a purely aerodynamic analysis of blade sweep. Despite these intentions, deformations occurred, which will be discussed in more detail in Sect. 3.1.
2.2 Experimental set-up and measurement system
The experimental campaign was conducted in TU Delft's Open Jet Facility (OJF), which has an octagonal jet exit of 2.85 m × 2.85 m. The model turbine was operated at a constant tip speed ratio of λ=9 and an inflow velocity of U∞=3.95 m s−1. To exclude external phenomena from impacting the measurements, the wind tunnel's operating conditions were logged in terms of velocity, pressure, temperature and density for each measurement point and showed no significant variation (generally, less than 1 % maximum deviation from the mean value of the entire campaign).
The primary data gathered in this campaign are flow fields measured around various blade cross-sections along the span using stereoscopic particle image velocimetry (SPIV). Employing laser optics, a thin, uniform light sheet was created within a vertical measurement plane aligned with the inflow. Smoke particles were introduced into the wind tunnel downstream of the measurement section. The smoke is then distributed homogeneously during the recirculation, enabling the airflow's visualisation. Two cameras captured the flow field from two angles, allowing the measurement of velocity components in three spatial directions. The entire flow field surrounding a blade cross-section was captured in two steps because the blade itself casts a shadow and covered part of the measurement plane from the cameras' perspective. Thus, the flow around the blade's pressure side was evaluated with the measurement set-up placed upwind of the rotor and the laser sheet angled downstream. The suction side's flow was then captured by placing the apparatus downstream of the turbine and tilting the laser sheet upstream. By stitching the two measurements together in post-processing, the entire flow field was made available. This process was facilitated by the constant wind turbine operational conditions and environmental conditions of the wind tunnel.
Laser and cameras were triggered by a notch on the turbine's main shaft, activating an optical sensor once per revolution. Per measurement plane, 120 phase-locked images were recorded and post-processed into an average velocity field and its standard deviation using LaVision DaVis software. While Table 1 lists more specific information regarding the hardware used in this measurement campaign, Table 2 details the SPIV measurement specifications. Figure 3a shows the swept blades, and Fig. 3b shows the wind tunnel set-up and measurement system.
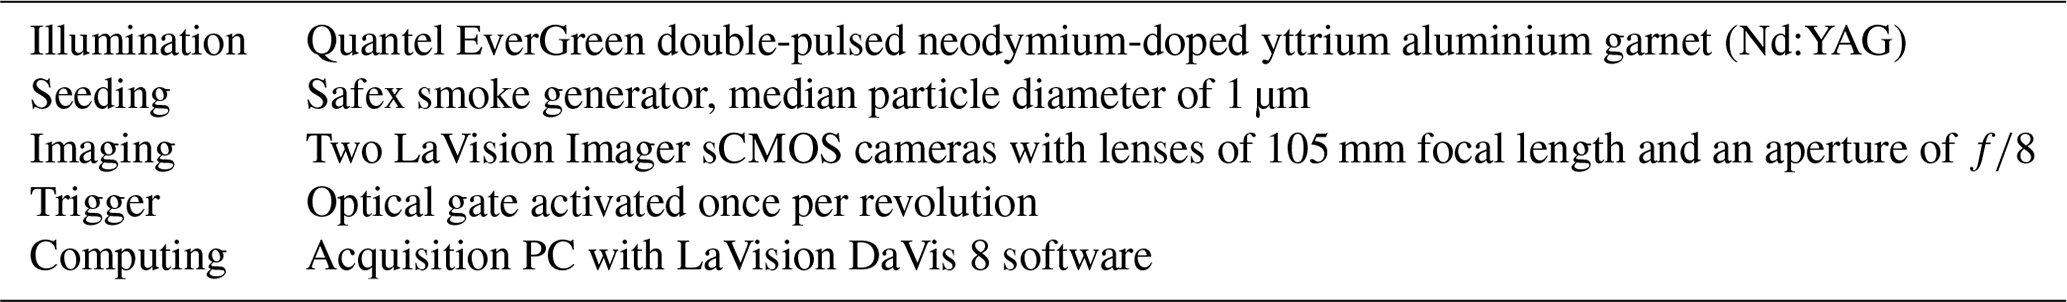
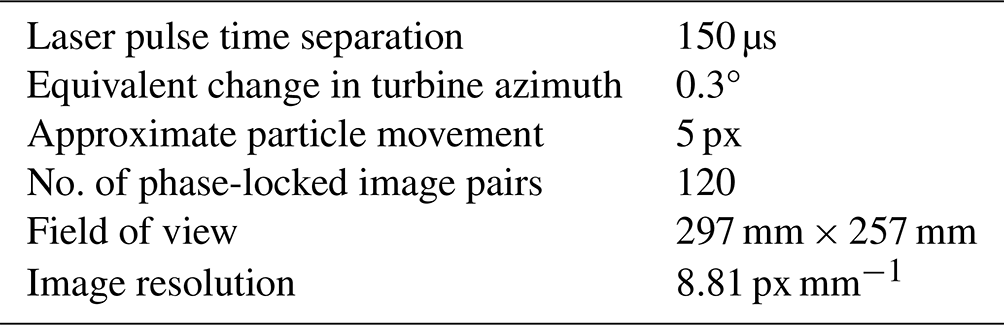
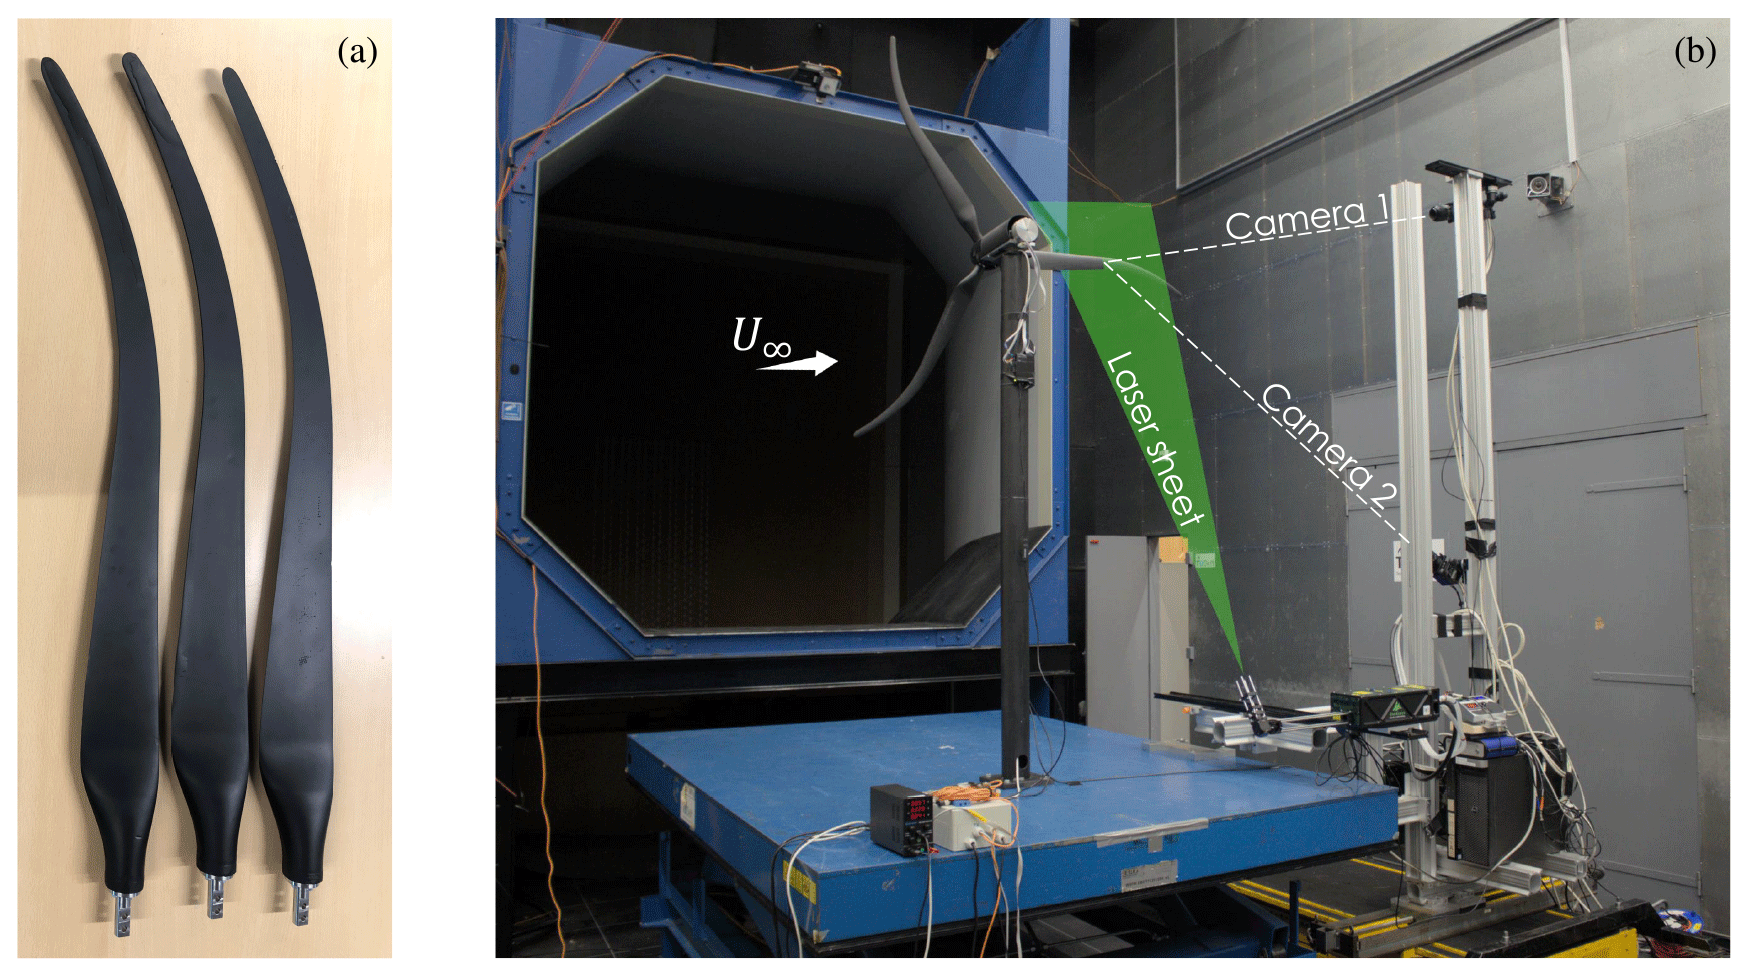
Figure 3Swept model wind turbine blades (a) and experimental set-up and measurement system (b). The laser sheet is oriented in the plane spanned by the vertical and the inflow direction.
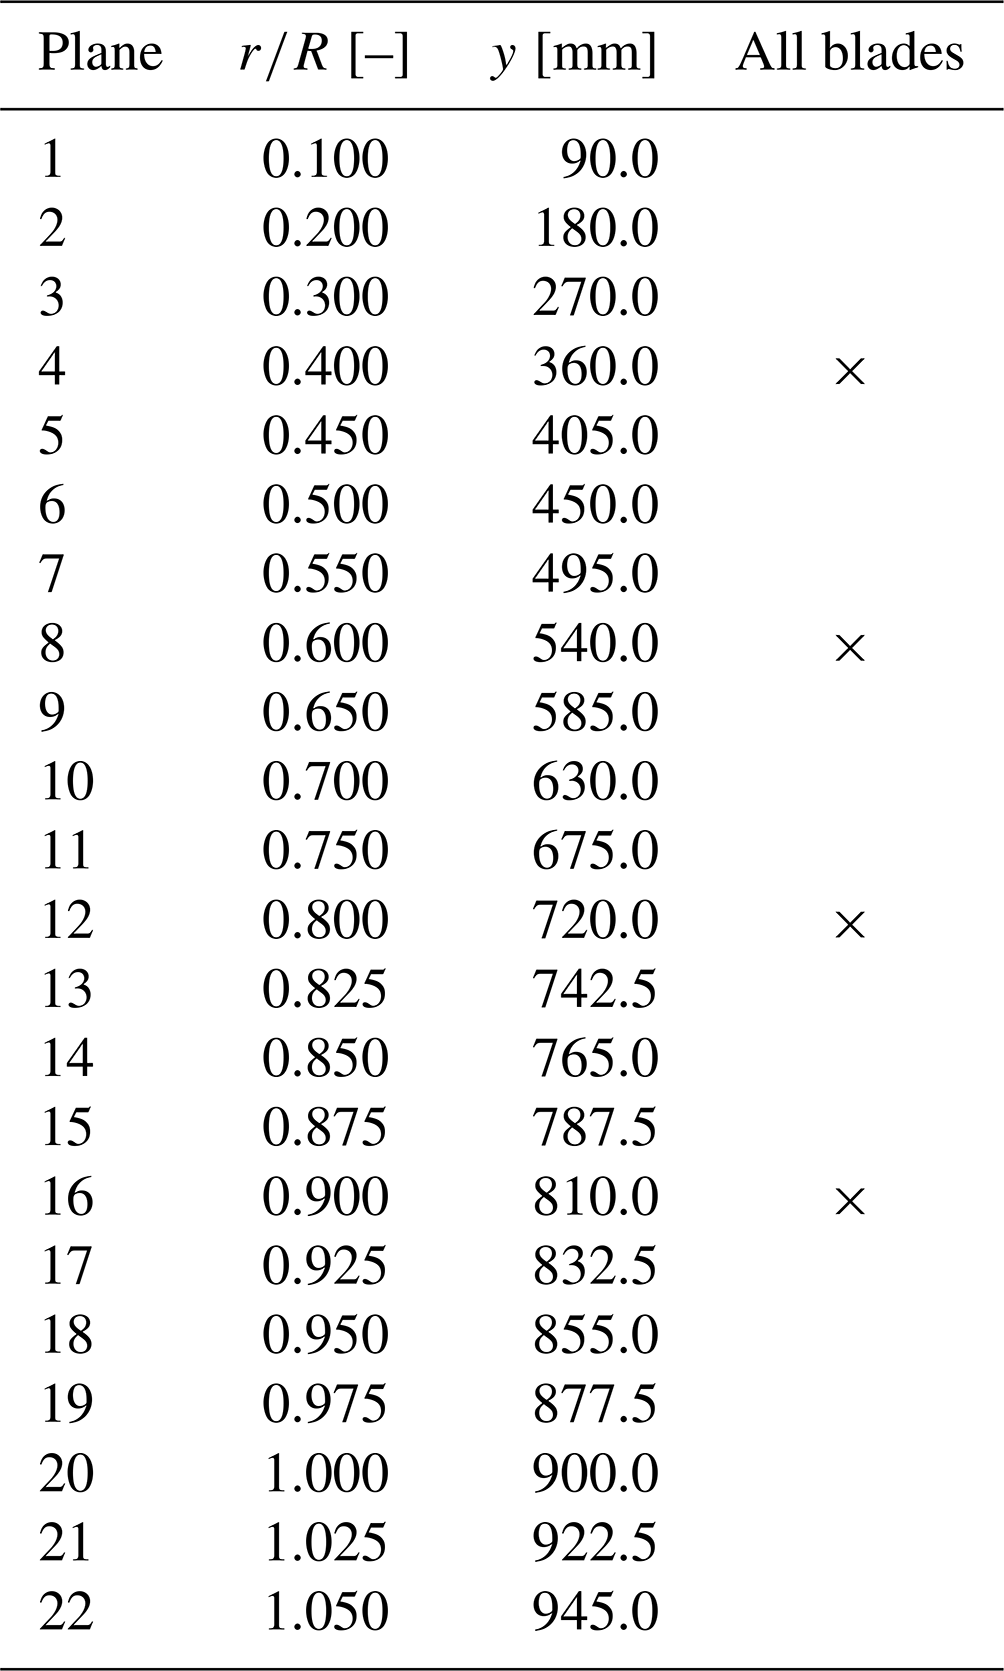
The entire SPIV set-up was mounted rigidly on a traverse system moving in radial direction, allowing for time-efficient measurements without the need to recalibrate the software at each new location. In total, measurements were taken at 22 planes along the blade span with the following spacing:
-
for
-
for
-
for .
These planes were chosen to guarantee higher resolution in the tip region where higher gradients in aerodynamic quantities and the main impact of blade sweep are expected. To evaluate how representative the main measurement blade is for the remaining two blades, measurements were taken for all three blades at . An overview of the individual measurement planes and their coordinates is given in Appendix B.
A time delay was set between the trigger signal and camera and laser activation for measurement planes in the swept part of the blade. This is to ensure that (1) the blade cross-section remains in the centre of the field of view and that (2) the radial position of the measurements is equivalent to the measurements on the straight reference blades as presented by Fritz et al. (2024). This increases the comparability of the two wind tunnel campaigns. Figure 4 shows a supporting schematic of this approach. Figure 4a is representative of measurements in the unswept part of the blade. Here, the measurement plane is perpendicular to the blade axis. Figure 4b is representative of measurements in the swept part of the blade, where the local blade axis is not perpendicular to the measurement plane. Two coordinate systems are introduced: one global coordinate system and one aligned with the local blade axis and airfoil orientation. In the unswept part of the blade, these two coordinate systems coincide.
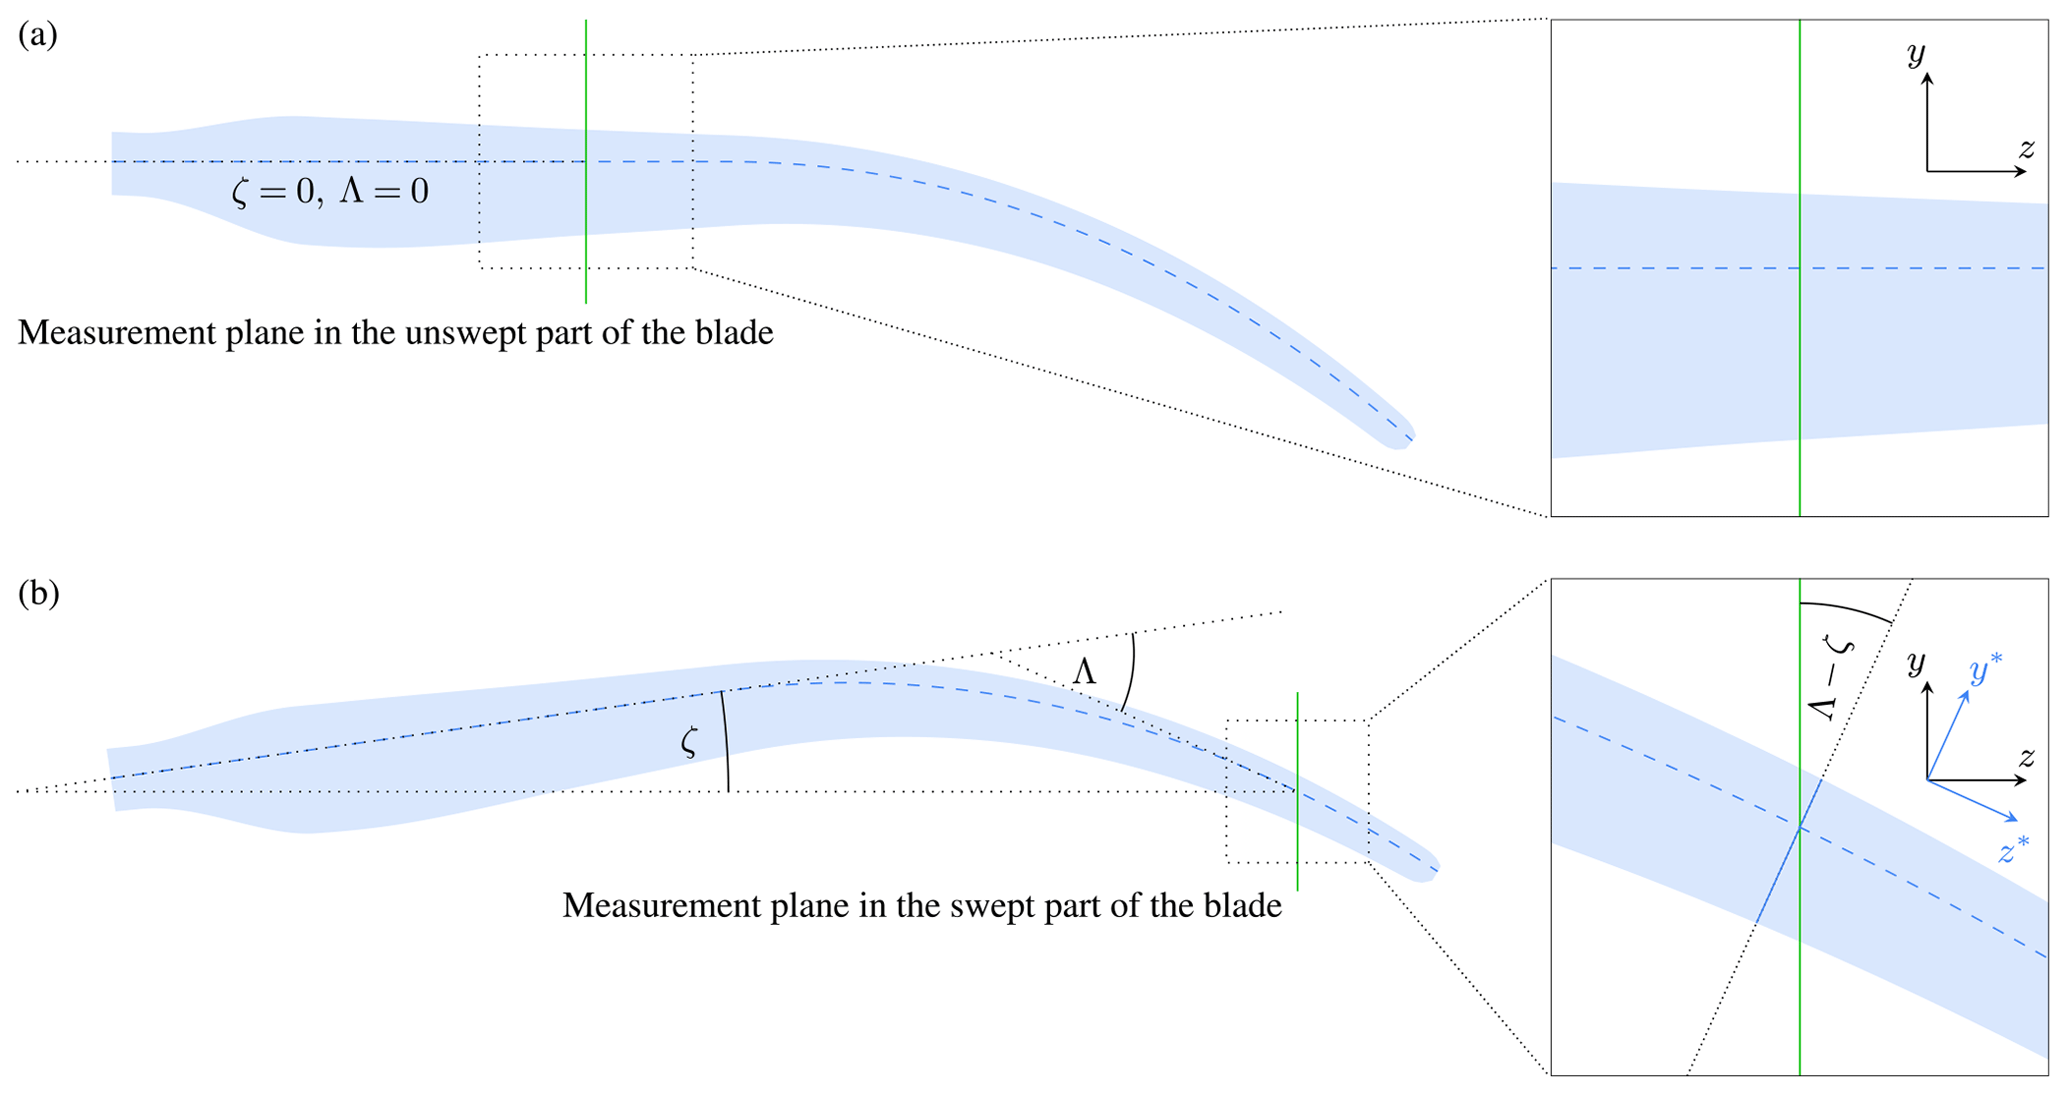
The global sweep angle of a given blade section ζ and the required additional time delay ΔtΛ are calculated as
where ω is the angular velocity.
2.3 Deriving blade-level aerodynamics from PIV measurements
In this study, multiple aerodynamic quantities are derived from the measured flow fields. Only a brief summary of the methods employed is given here. For a detailed description and the mathematical formulation of these methods, the reader is referred to Fritz et al. (2024).
All methods rely on evaluating the velocity field on a closed curve encompassing the investigated blade cross-section. The bound circulation Γ is computed as the line integral of the measured velocity field along this control curve (e.g. Anderson, 2017, p. 176). The inflow conditions are determined using the Ferreira–Micallef approach (Rahimi et al., 2018). It aims to remove the regarded blade cross-section's induction from the measured flow field using elemental potential flow solutions. What is left after this removal is the sum of the freestream velocity and the velocities induced by the remainder of the blades and the wake, yielding the relative inflow vector. The inflow vector then allows the computation of induction values, inflow angle and angle of attack. The blade forces are calculated using two approaches, namely Noca's method (Noca et al., 1999), which calculates the forces using a momentum balance based on the velocity field along a control volume's bounding curve, and the Kutta–Joukowski theorem, which directly relates the forces to the bound circulation (e.g. Anderson, 2017, p. 282).
It was found that Noca's method is only reliable when determining the normal force. In contrast, the tangential force did not converge for varying control volume sizes. The developed wind tunnel model turbine has low torque and tangential force values. Consequently, accurately capturing the momentum change associated with the tangential force proves challenging when utilising the Noca method. The same challenge was observed by Fritz et al. (2024), and the reader is referred to this work for a more detailed discussion. Given this challenge, only the tangential force based on the Kutta–Joukowski theorem is presented in this article. It should be noted that the Kutta–Joukowski theorem is based on potential flow theory; thus it neglects the viscous drag contribution to the tangential force. While this might lead to some inaccuracies in the tangential force, the neglect of viscosity has limited impact on the normal force.
As discussed in Sect. 2.2, the airfoil orientation and measurement plane do not align in the swept part of the blade. Therefore, additional considerations are necessary. Firstly, the inflow angle in the measurement plane and the inflow angle in the plane perpendicular to the local blade axis differ. The rotational velocity needs to be decomposed, and only its component aligned with the airfoil orientation should be considered in calculating the inflow angle:
where a and a′ are the axial and tangential induction factors, respectively. The angle of attack, which is a two-dimensional quantity defined in the direction of the airfoil orientation, is then given by
Secondly, when discussing blade loading, it is relevant to distinguish between forces per unit blade length and per unit radius. In contrast to a straight blade, there are non-negligible differences between the two for swept blades (Madsen et al., 2020). The infinitesimal blade length dl, oriented along the local blade axis, is related to the infinitesimal radial coordinate dr by
This section presents the results of the conducted wind tunnel campaign. Section 3.1 details the encountered challenge of varying pitch offsets and twist deformations between the three blades. The primary collected data, namely the flow fields, are presented in Sect. 3.2, while derived blade-level aerodynamics and the lift coefficients are presented in Sect. 3.3 and 3.4, respectively.
3.1 Determination of the combined pitch and twist offset
As mentioned in Sect. 2.1, the blades were manufactured out of vacuum-infused carbon-fibre-reinforced material. The manual manufacturing can lead to minor differences in the exact positioning of the carbon fibre layers for the individual blades. On top of that, the resin infusion can introduce changes to the layup, which are much more difficult to mitigate as the blade moulds are closed during this process. As a consequence, varying twist deformations occurred for the three blades during operation. Additionally, a manual pitch mechanism implemented between the blade root and hub led to minor pitch offsets.
To quantify the pitch and twist offsets, the blade cross-sections visible in the raw images were inspected and compared against the original blade design. This approach is visualised in Fig. 5a, showing a blade cross-section illuminated in white and the original design, i.e. the expected airfoil orientation, overlaid in red. In green, the corrected airfoil orientation is shown, generated by rotating the original design around the trailing edge until it approximately aligns with the pressure side of the illuminated cross-section.
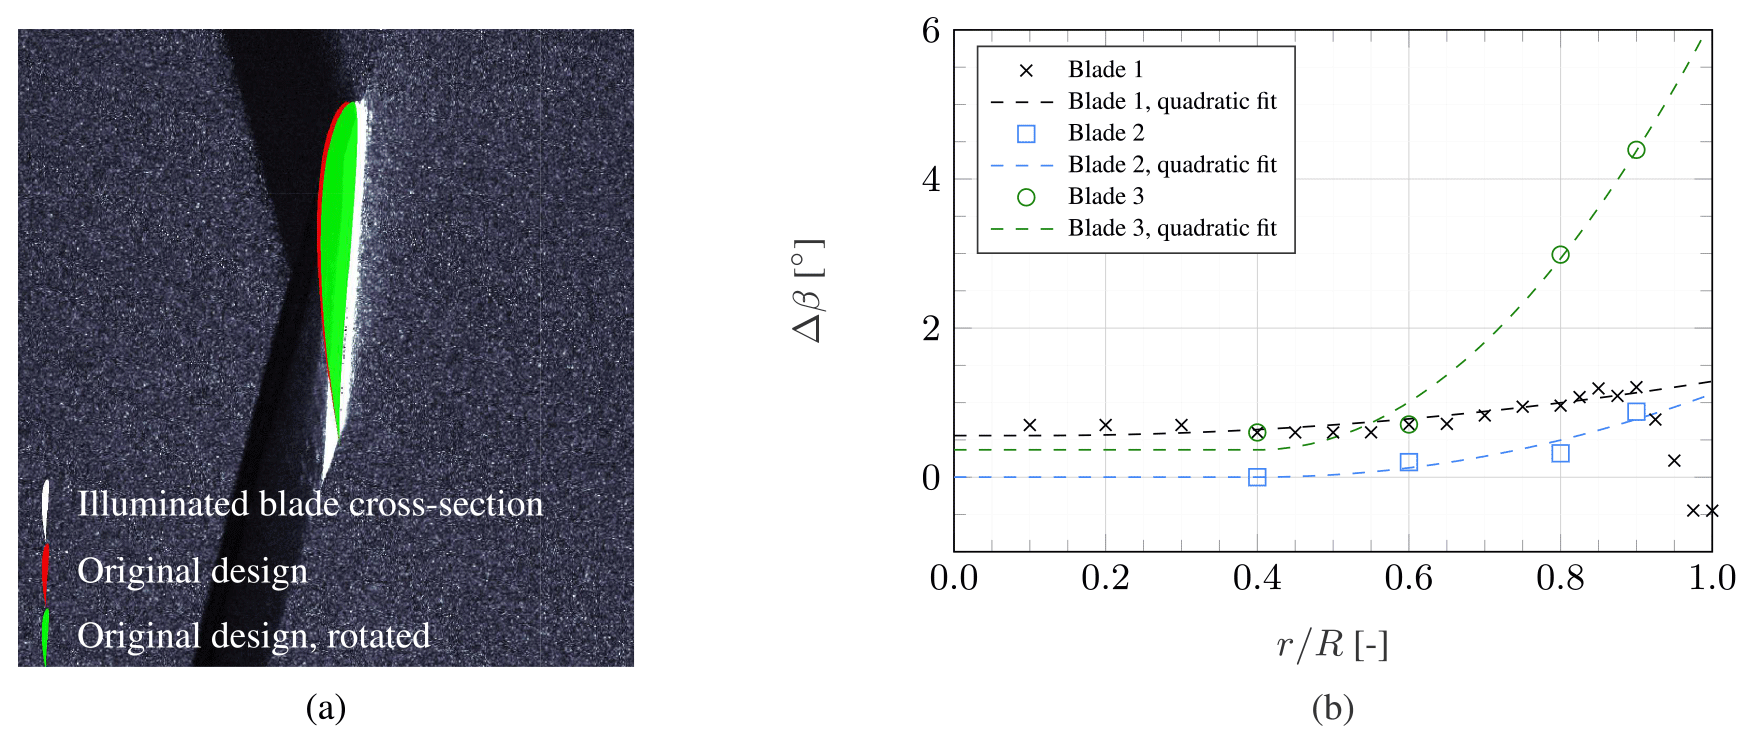
Figure 5Approach of determining actual local airfoil orientation (a) and pitch and twist offset determined by comparing experimentally captured blade cross-sections to the original design (b).
It should be noted that for a measurement point in the unswept region of the blade, this orientation correction corresponds directly to a deviation from the original twist distribution and pitch angle. For measurement planes in the swept part of the blade, this correction is less trivial, as the visible cross-section corresponds approximately to the local airfoil elongated vertically by a factor of (see Fig. 4). Therefore, the deviation from the twist distribution, determined in the measurement plane, has to be multiplied by the same factor to correct the twist in the airfoil coordinate system. Figure 5b shows the resulting offset in pitch and twist from the original design.
For all blades, a quadratic curve is fitted to the distribution of pitch and twist offset to balance out fluctuations, likely due to human error in interpreting the raw images. This is particularly evident in the tip measurements of blade 1, where the very small chord makes the interpretation of the cross-section's orientation difficult. Thus, measurements with were excluded in generating the curve fit. The mathematical descriptions of the quadratic curve fits are given in Eqs. (7a)–(7c). All three blades exhibit twisting behaviour as expected for aft-swept blades, namely twisting to lower angles of attack under aerodynamic loading. However, the three blades vary significantly in their twist extent. The tip twist deformation angle varies from ° for blade 1 to ° for blade 2 and ° for blade 3. While the blade deformations and pitch offsets were unintentional, the method described here allows the determination of the actual blade geometries with reasonable accuracy. This bears significance for potential future numerical validation studies based on the experimental results presented in the following sections.
3.2 Flow field
The PIV-processed velocity fields are the primary data collected during this experiment. Velocity magnitudes from the measurement planes where data from all three blades are available are shown in Fig. 6, non-dimensionalised by the local relative inflow velocity, which is defined as
The induction terms used in this equation are presented in the next section.
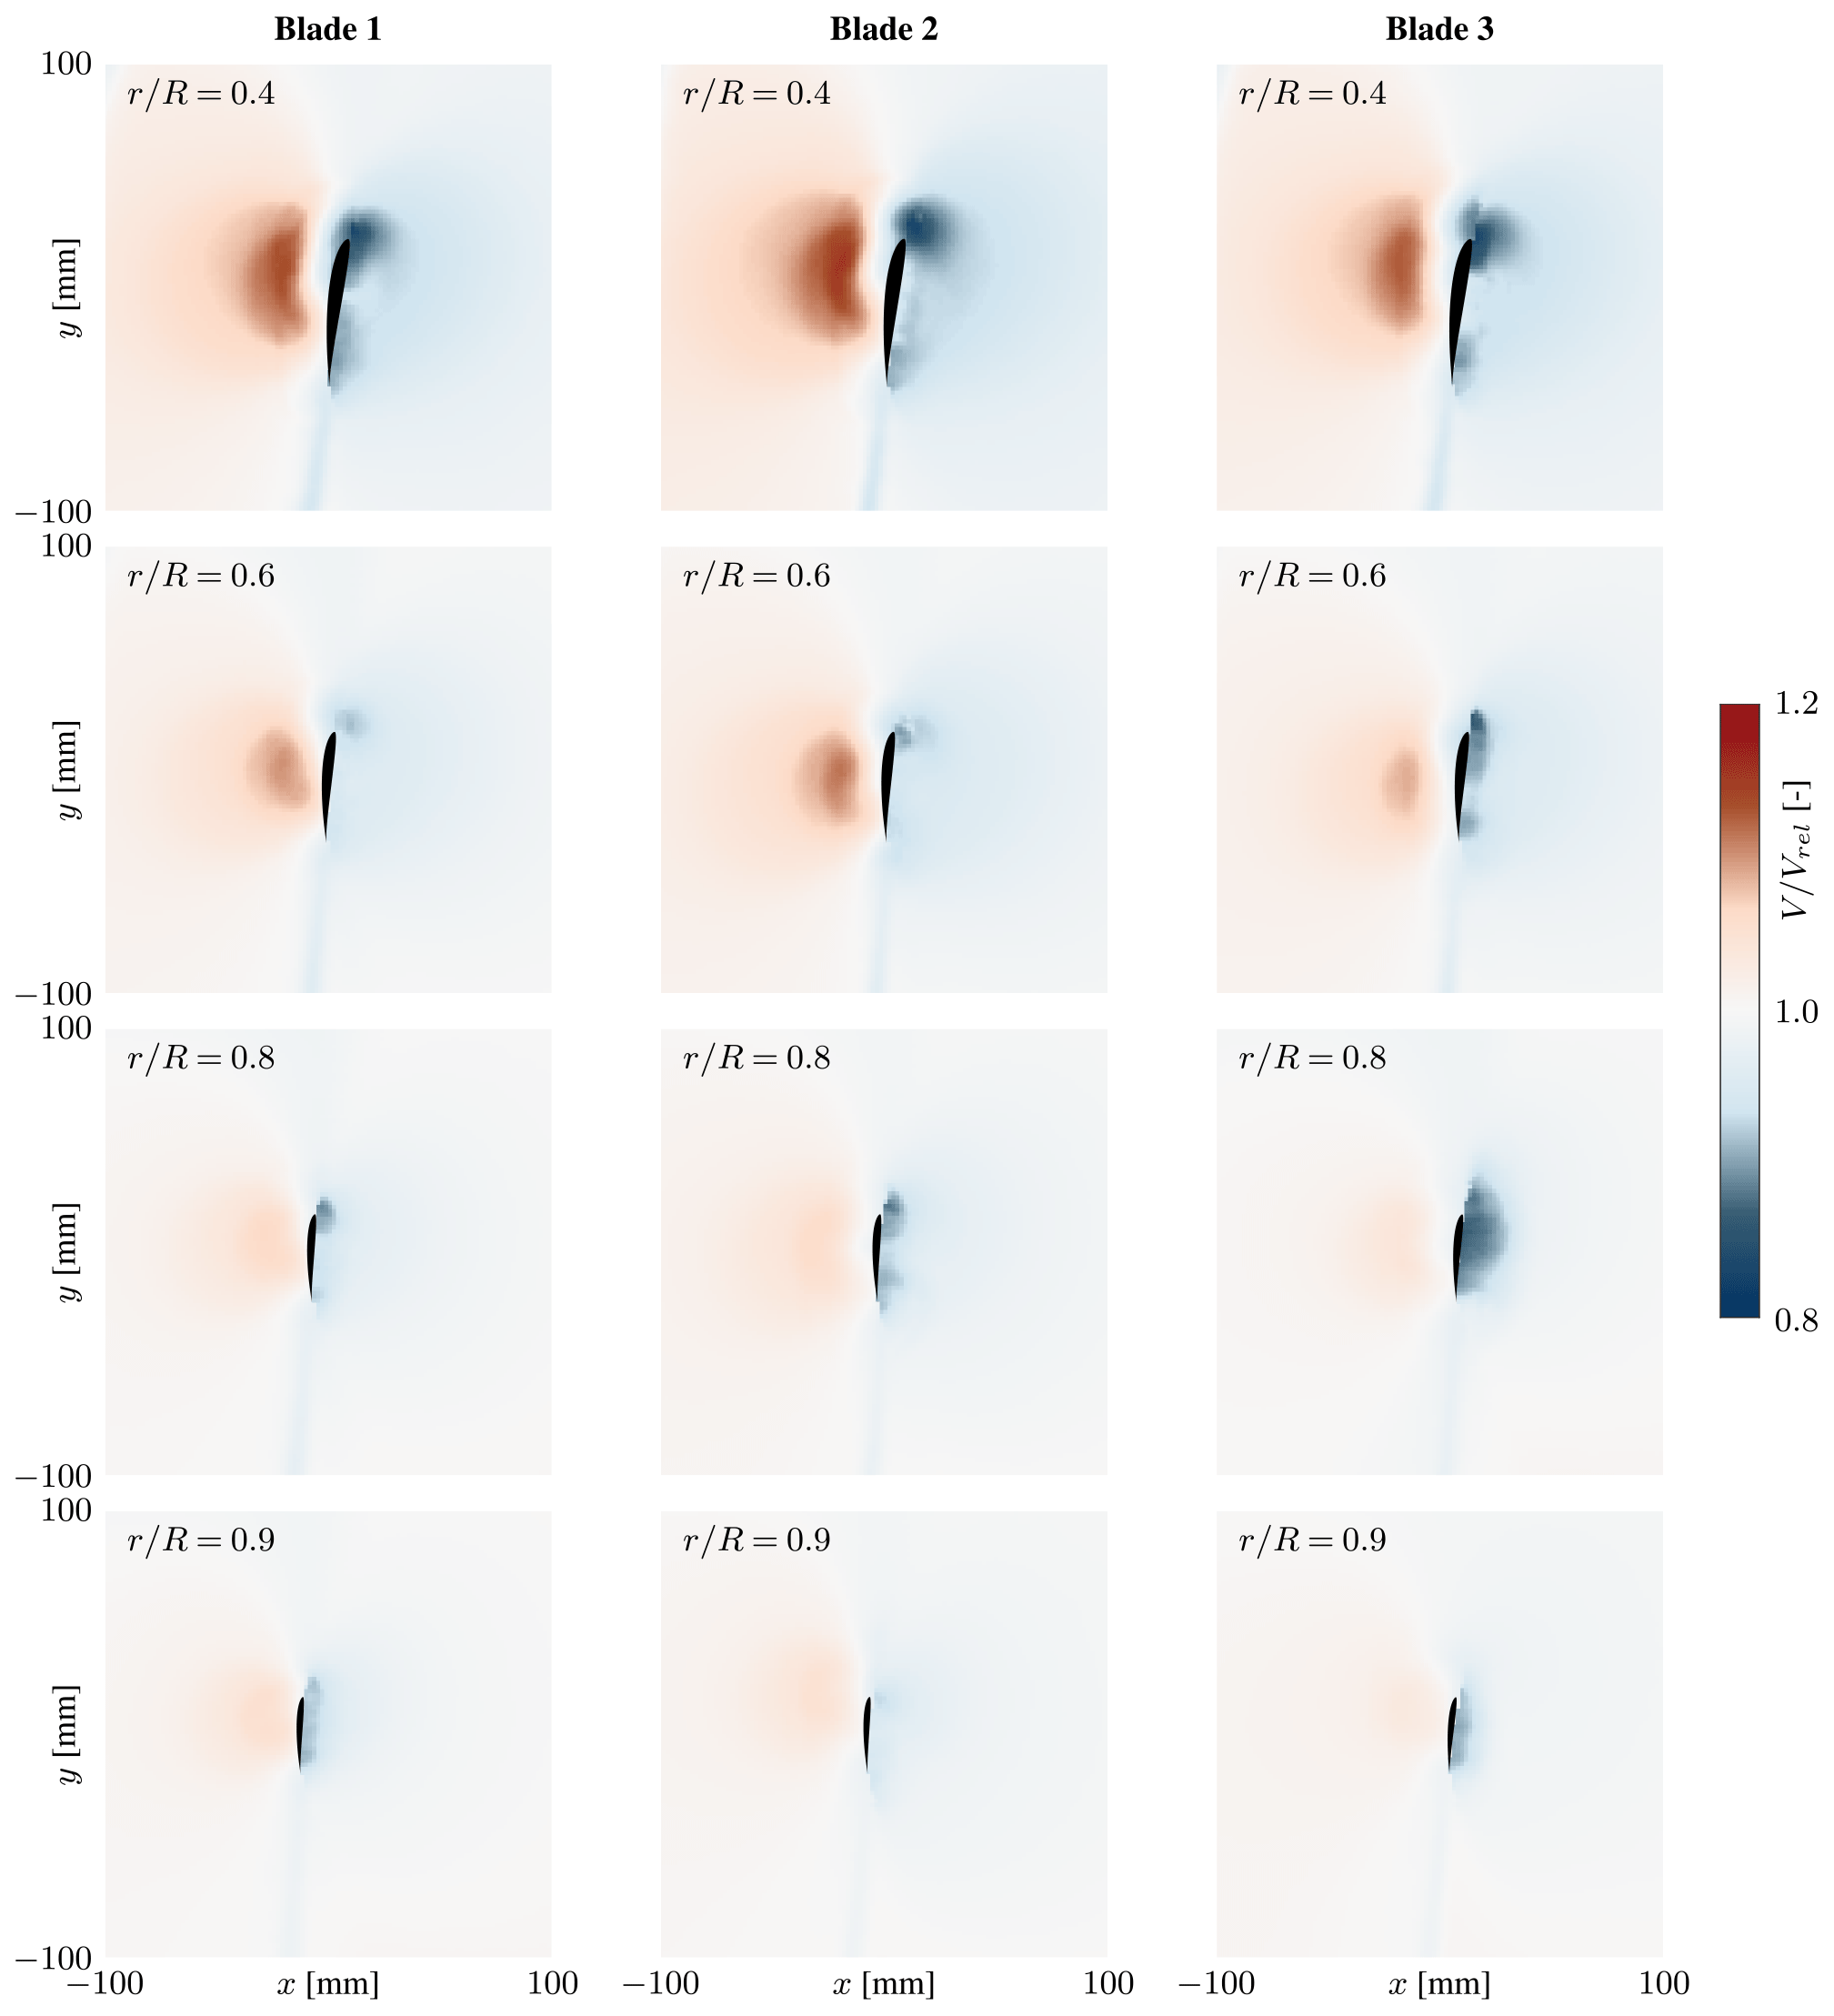
Figure 6Non-dimensionalised velocity magnitudes at the radial stations measured for all three blades.
The general flow patterns are congruent between the three blades. Yet, differences caused by the varying pitch and twist offsets from the original blade design are evident from the flow fields; see e.g. the second row of subplots corresponding to . Blade 2, experiencing the highest angle of attack of all three blades, exhibits higher induced velocities and, thus, higher velocity magnitudes on the suction side. By contrast, blade 3 twists to lower angles of attack, entailing lower velocity magnitudes in the blade's vicinity.
Close to the suction side, low-velocity regions are observable for many measurement points. These are caused by laser reflection from the convex blade surface, complicating the PIV processing. They are much less prominent on the concave pressure side.
3.3 Blade aerodynamics
This section discusses the spanwise distributions of the derived aerodynamic quantities. In addition to the mean value, error bars indicate the 95 % confidence interval based on the standard deviation in the measured velocity fields as calculated during the PIV processing. This uncertainty covers both the accuracy of phase-locking and the variability in the flow field during the image acquisition. Noteworthy uncertainties are only present at the blade root. These can be attributed to reflections from the nacelle and hub, which lead to increased uncertainty in the PIV processing. In the outer regions, uncertainties are negligible, indicating very high accuracy in phase-locking and steady flow conditions. As a consequence, the error bars for these data points are smaller than the marker size of the mean value.
Figure 7 shows the circulation distribution of the three blades. Straight wind turbine blades are usually designed to have a constant circulation value over large parts of the blade in design conditions. This is also the case for the IEA 15 MW RWT, which served as a reference to develop the planform of the straight blades presented in Fritz et al. (2024). The presence of blade sweep leads to a slanted distribution with the circulation decreasing towards the tip. It is not clear how much of this can be attributed to the misalignment of airfoil orientation and inflow velocity and how much to the bend–twist coupling presented in Sect. 3.1. The differences in circulation distribution between the three blades align with the observed pitch and twist offset.
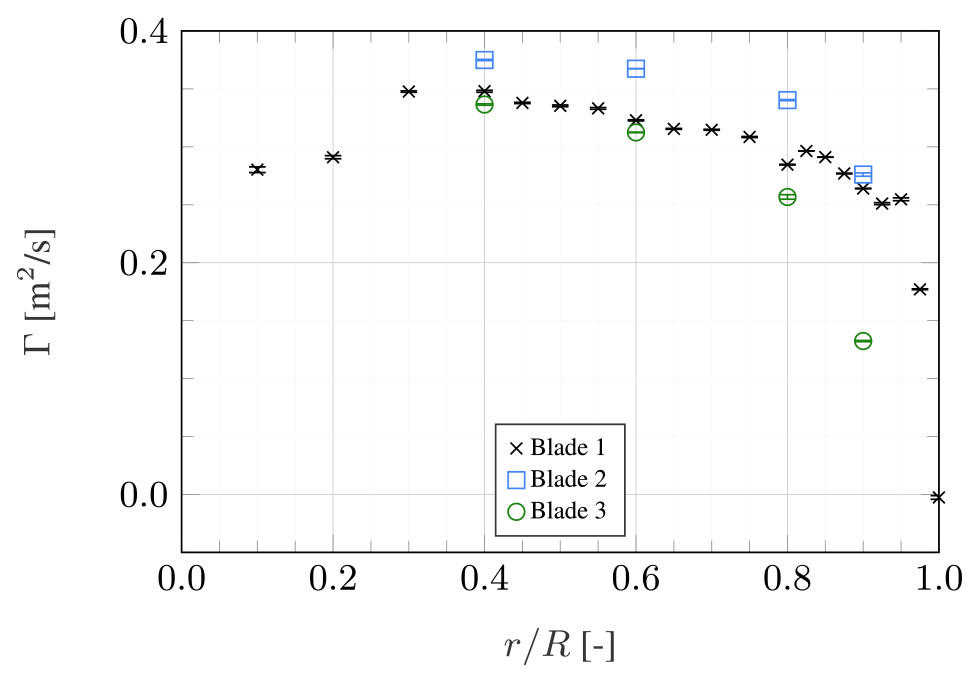
Figure 7Spanwise distribution of bound circulation, error bars representing the 95 % confidence interval.
The axial and tangential induction factors are plotted in Fig. 8. Both distributions exhibit relatively small differences between the three blades, with the only relevant deviations at where the twist deformations vary strongly. A similar pattern was observed for the experimental campaign with straight blades (Fritz et al., 2024). It indicates that, at the rather high tip speed ratio present in this experiment, induction is largely a rotor-averaged phenomenon, independent of whether the blades are swept or not. At the tip, the axial induction reaches negative values. It can be speculated that this is due to the tip vortex's induction and that the three-dimensional nature of the flow in this region is also responsible for the slightly higher uncertainties present at this measurement location.
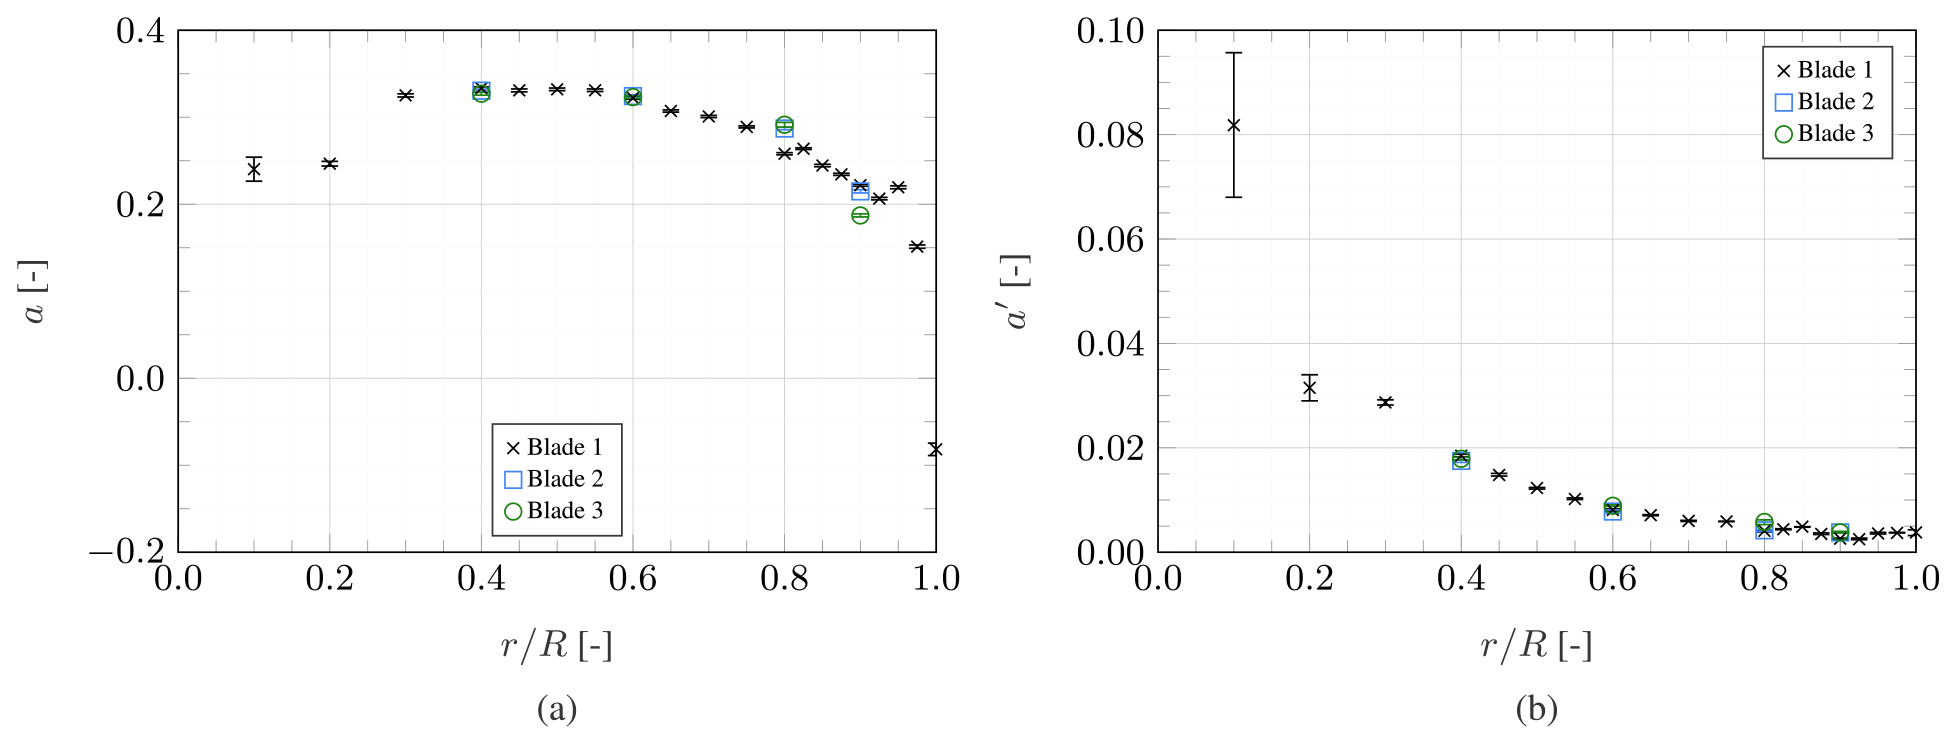
Figure 8Spanwise distribution of axial (a) and tangential (b) induction factors, error bars representing the 95 % confidence interval.
Figure 9 shows the inflow angle and angle of attack distribution, both quantities defined perpendicular to the local blade axis. At , the blade geometry is defined by a cylindrical cross-section, rendering the angle of attack value presented at this location meaningless. In line with the derived induction values, the inflow angle varies very little between the three blades. The angle of attack, however, is evidently influenced by each blade's pitch and twist offset. Particularly, blade 3, which has the highest twist deformations, experiences near-zero angles of attack at the tip. Given that the SD7032 airfoil used in the blade design stalls at approximately α=11° (Fontanella et al., 2021b), all angle of attack values derived from the PIV data suggest operation in the linear region of the airfoil.
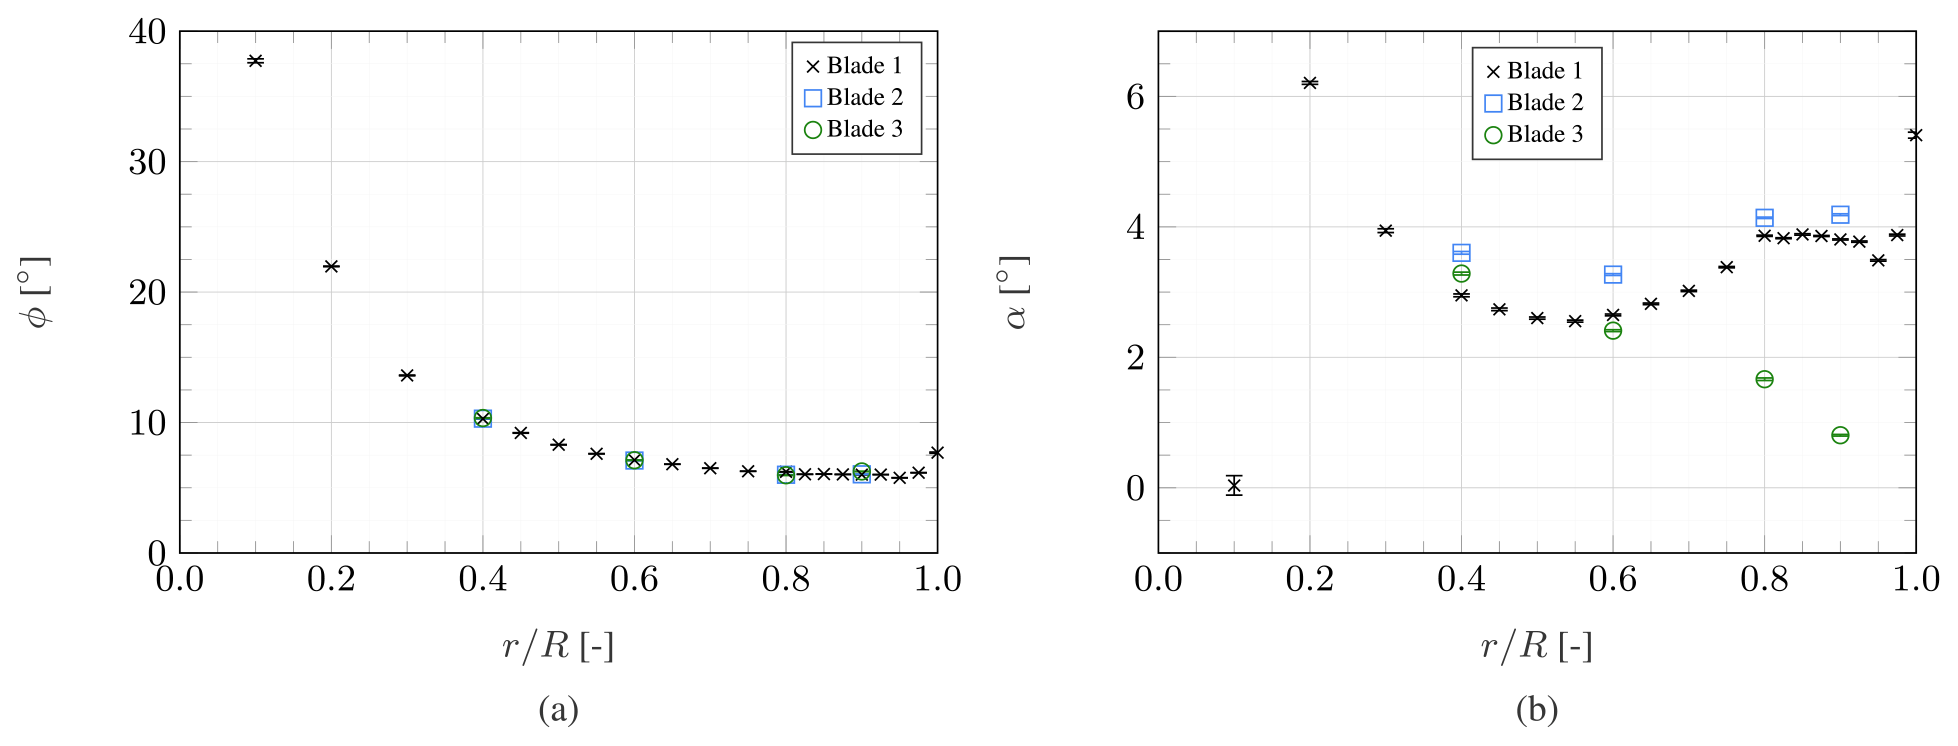
Figure 9Spanwise distribution of inflow angle (a) and angle of attack (b), error bars representing the 95 % confidence interval.
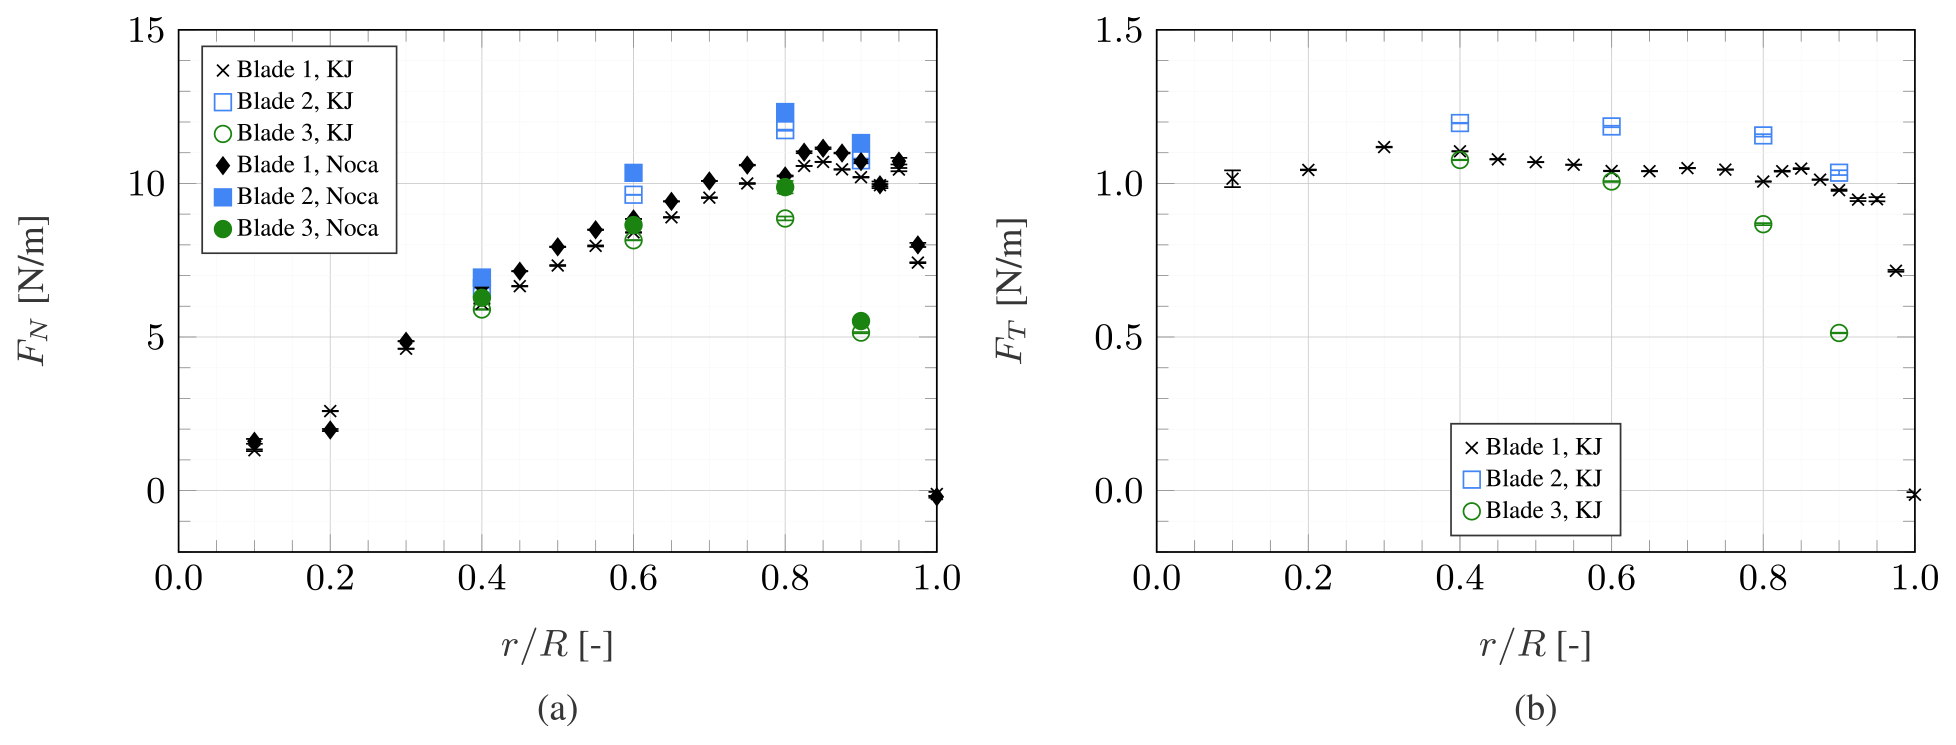
Figure 10Spanwise distribution of normal (a) and tangential (b) force, error bars representing the 95 % confidence interval.
The normal and tangential force distribution is depicted in Fig. 10. It should be noted that the forces are given per unit radius and not per unit blade length. This corresponds to the forces in the coordinate system spanning the measurement planes and, thus, not in the plane of the airfoil definition (see Fig. 4). The normal force is calculated using both Noca's method and the Kutta–Joukowski (KJ) theorem. The rotor thrust can be calculated by integrating the normal force along the blade radius. For this purpose, piecewise cubic curves are fit to the experimental data with zero loading prescribed at root and tip if no data are available there. The non-dimensionalisation of the rotor thrust yields the thrust coefficient . Depending on the approach, the experimental thrust coefficients are and , respectively.
Fritz et al. (2024) demonstrated for a comparable dataset that Noca's method does not converge with varying control volume size for the tangential force; the same holds for the data presented in this study, which is why only the tangential force calculated using the Kutta–Joukowski theorem is presented here. With the exception of the measurements at , Noca's method consistently results in slightly higher normal force values than the Kutta–Joukowski theorem. Variations in the calculated forces are, again, aligned with the pitch and twist offset discussed above.
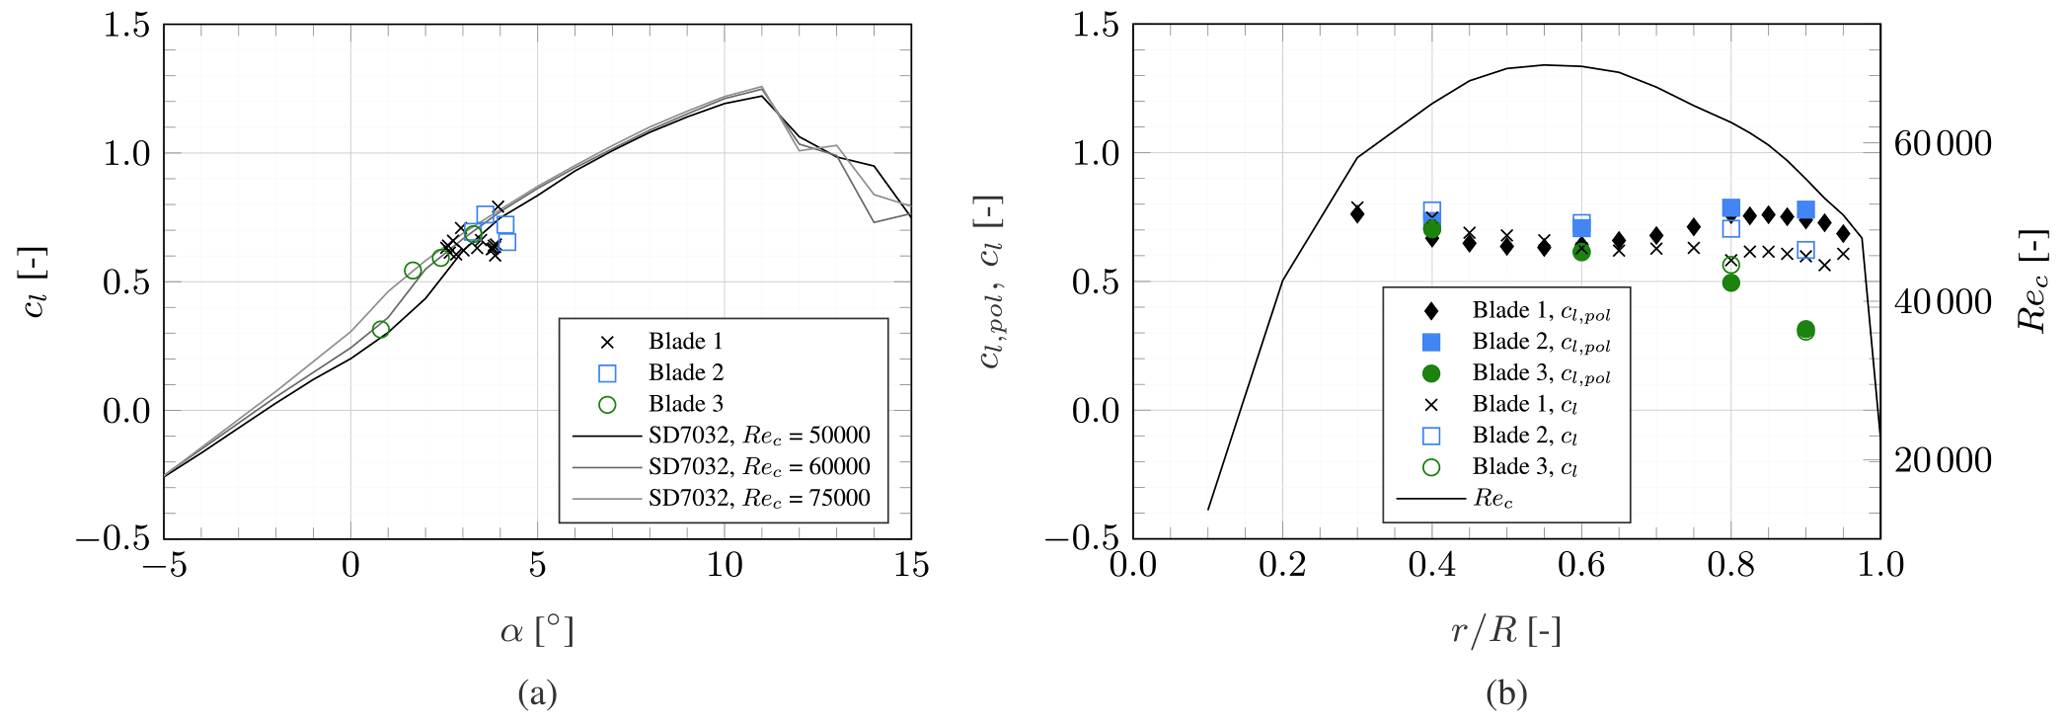
Figure 11Experimental lift polar compared to the SD7032 airfoil lift polar (a) and comparison between the lift coefficient derived from measured forces to that expected based on the design lift polars, alongside the chord Reynolds number distribution (b).
3.4 Lift polar
Given the aerodynamic characteristics presented in the previous section, the experimental lift coefficient cl can be calculated for each measurement point. Being an airfoil-level quantity, the lift coefficient has to be calculated using quantities aligned with the airfoil orientation. Using Eq. (6), the forces measured per unit radius can be converted to forces per unit blade length so that
where ρ is the density of air. The resulting values are plotted in Fig. 11a alongside the SD7032 lift polar (Fontanella et al., 2021b) at Reynolds numbers resembling the experimental conditions varying between approximately 40 000 and 70 000 along the blade span. The two measurement points closest to the root and the two closest to the tip are omitted. At the root, the blade is defined not by the design airfoil but rather by a cylinder and a blend between cylinder and airfoil. At the tip, the tip vortex increases the flow's three-dimensionality, and thus, measurements cannot be compared to two-dimensional wind tunnel data. For all other measurement points, the agreement between the design airfoil's lift polar and the experimental values is good.
While Fig. 11a provides insight into the experimentally obtained lift polar, it lacks representation of the varying Reynolds numbers across the blade. Alternatively, the experimentally derived lift coefficient cl is plotted as a function of the radial position alongside the chord Reynolds number distribution in Fig. 11b. Additionally, the design airfoil polars can be evaluated for the experimentally derived angle of attack and Reynolds number to obtain the expected polar-based lift coefficient cl,pol. Comparing cl and cl,pol reveals that blades 1 and 2 utilised in this experiment generate less lift than anticipated in the outboard regions. The experimentally derived lift coefficient of blade 3 agrees well with the expected polar-based one. It can be hypothesised that this discrepancy can be attributed to differences in surface finish between the model blades and the airfoil studied by Fontanella et al. (2021a) and minor inaccuracies in the manually manufactured geometry. The latter have a more significant impact towards the tip where the chord values are very low.
This study presents results from a wind tunnel experiment where a three-bladed model turbine equipped with swept blades was tested. The velocity fields around multiple radial stations were measured using a particle image velocimetry set-up. From the measured velocity fields, blade-level aerodynamic quantities are derived, namely bound circulation, induction values, inflow angle, angle of attack, and forces normal and tangential to the rotor plane. The normal force distributions, determined with both Noca's method and the Kutta–Joukowski theorem, agree reasonably well. Furthermore, the deviations in the aerodynamic response between the three blades are consistent with the determined offsets in blade pitch and twist deformations from the original design. Knowing the aerodynamic blade characteristics, the local lift coefficient can be calculated, which shows good agreement with the lift polar of the design airfoil.
The created dataset characterises the three swept blades aerodynamically in rotating and controlled conditions. Such data, rarely available even for more conventional straight blades, were absent in the current literature. It provides a baseline for future experimental research on the same model turbine as well as a valuable validation dataset for numerical tools of varying fidelity aiming at simulating swept wind turbine blades. While the flow fields can serve for the validation of higher-fidelity models, such as panel codes and computational fluid dynamics, the blade-level aerodynamics are also relevant to lower-fidelity models, such as BEM and lifting-line algorithms.
In future research, we intend to use the experimental results presented here to validate the BEM correction model for swept blades developed by Fritz et al. (2022). This validation exercise gains in importance due to the pitch and twist offsets experienced in this experiment and the one presented in Fritz et al. (2024). The two campaigns were designed to deliver datasets enabling a direct comparison of straight- and swept-blade aerodynamics. Since pitch offsets and blade deflections varied considerably between the three blades and even more so between the two campaigns, such a direct comparison now requires an approach to accurately correct both datasets for these offsets. It is expected that once the BEM correction model is validated, it can be used to correct the experimental datasets and facilitate the intended comparison.
| Latin letters | |
| a, a′ | Axial and tangential induction factor |
| CT | Thrust coefficient |
| c | Chord |
| cl | Lift coefficient |
| D | Rotor diameter |
| FN, FT | Normal and tangential force |
| l | Coordinate along blade axis |
| R | Blade tip radius |
| Rec | Chord Reynolds number |
| r | Radial coordinate |
| rstart | Sweep starting position |
| t | Time |
| U∞ | Free-stream velocity |
| Vrel | Relative inflow velocity |
| yΛ | Blade sweep |
| ytip | Tip sweep extent |
| Greek letters | |
| α | Angle of attack |
| β | Combined blade pitch and twist angle |
| γ | Sweep exponent |
| Greek letters | |
| Γ | Circulation |
| ζ | Global sweep angle |
| Λ | Local sweep angle |
| λ | Tip speed ratio |
| ρ | Density of air |
| ϕ | Inflow angle |
| ω | Angular velocity |
| Subscripts | |
| KJ | Kutta–Joukowski |
| pol | Based on design polars |
Table B1 gives an overview of the measurement planes. Here, y is the coordinate lateral to the inflow direction measured from the rotor centre. At planes that are marked as “all blades”, measurements were taken for blades 1, 2 and 3, while only blade 1 was measured at all other planes.
The data presented in this study, as well as information regarding the blade planform and logged wind tunnel operating conditions, are openly available on the 4TU.ResearchData repository at https://doi.org/10.4121/C9631F69-8855-4E2D-8777-38338534B4EA (Fritz et al., 2024).
EF designed the wind turbine model, built the model blades, planned and executed the experiment, and post-processed and analysed the measurement data. KB acquired funding and contributed to the experiment planning and the data analysis. CF acquired funding and contributed to the experiment planning and execution, the development of post-processing methods, and the data analysis.
The contact author has declared that none of the authors has any competing interests.
Publisher's note: Copernicus Publications remains neutral with regard to jurisdictional claims made in the text, published maps, institutional affiliations, or any other geographical representation in this paper. While Copernicus Publications makes every effort to include appropriate place names, the final responsibility lies with the authors.
This contribution has been financed with Topsector Energiesubsidie from the Dutch Ministry of Economic Affairs under grant no. TEHE119018. The wind tunnel experiment was financed by internal TU Delft funding.
This paper was edited by Mingming Zhang and reviewed by Alessandro Fontanella and one anonymous referee.
Anderson, J. D.: Fundamentals of aerodynamics, in: McGraw-Hill series in aeronautical and aerospace engineering, 6th Edn., McGraw-Hill Education, New York, NY, ISBN 978-1-259-12991-9, 2017. a, b
Ashwill, T., Kanaby, G., Jackson, K., and Zuteck, M.: Development of the sweep-twist adaptive rotor (STAR) blade, in: 48th AIAA aerospace sciences meeting including the new horizons forum and aerospace exposition, 4–7 January 2010, Orlando, Florida, American Institute of Aeronautics and Astronautics, https://doi.org/10.2514/6.2010-1582, 2010. a, b
Barlas, T., Pirrung, G. R., Ramos-García, N., Horcas, S. G., Mikkelsen, R. F., Olsen, A. S., and Gaunaa, M.: Wind tunnel testing of a swept tip shape and comparison with multi-fidelity aerodynamic simulations, Wind Energ. Sci., 6, 1311–1324, https://doi.org/10.5194/wes-6-1311-2021, 2021. a
Barlas, T., Pirrung, G. R., Ramos-García, N., González Horcas, S., Li, A., and Madsen, H. A.: Atmospheric rotating rig testing of a swept blade tip and comparison with multi-fidelity aeroelastic simulations, Wind Energ. Sci., 7, 1957–1973, https://doi.org/10.5194/wes-7-1957-2022, 2022. a
Fontanella, A., Bayati, I., Mikkelsen, R., Belloli, M., and Zasso, A.: UNAFLOW: a holistic wind tunnel experiment about the aerodynamic response of floating wind turbines under imposed surge motion, Wind Energ. Sci., 6, 1169–1190, https://doi.org/10.5194/wes-6-1169-2021, 2021a. a
Fontanella, A., Bayati, I., Mikkelsen, R., Belloli, M., and Zasso, A.: UNAFLOW: UNsteady Aerodynamics of FLOating Wind turbines, Zenodo [data set], https://doi.org/10.5281/zenodo.4740006, 2021b. a, b
Fontanella, A., Facchinetti, A., Di Carlo, S., and Belloli, M.: Wind tunnel investigation of the aerodynamic response of two 15 MW floating wind turbines, Wind Energ. Sci., 7, 1711–1729, https://doi.org/10.5194/wes-7-1711-2022, 2022. a
Fritz, E., Ribeiro, A., Boorsma, K., and Ferreira, C.: Aerodynamic characterisation of a thrust-scaled IEA 15 MW wind turbine model: experimental insights using PIV data, Wind Energ. Sci., 9, 1173–1187, https://doi.org/10.5194/wes-9-1173-2024, 2024. a, b, c, d, e, f, g, h, i
Fritz, E. K., Ferreira, C., and Boorsma, K.: An efficient blade sweep correction model for blade element momentum theory, Wind Energy, 25, 1977–1994, https://doi.org/10.1002/we.2778, 2022. a, b, c
Fritz, E., Boorsma, K., and Ferreira, C.: Supporting data belonging to the publication Experimental analysis of a horizontal axis wind turbine with swept blades using PIV data, 4TU.ResearchData [data set], https://doi.org/10.4121/C9631F69-8855-4E2D-8777-38338534B4EA, 2024. a
Gaertner, E., Rinker, J., Sethuraman, L., Zahle, F., Anderson, B., Barter, G., Abbas, N., Meng, F., Bortolotti, P., Skrzypinski, W., Scott, G., Feil, R., Bredmose, H., Dykes, K., Shields, M., Allen, C., and Viselli, A.: Definition of the IEA wind 15-megawatt offshore reference wind turbine, Tech. Rep. NREL/TP-5000-75698, National Renewable Energy Laboratory, 2020. a, b
Kimball, R., Robertson, A., Fowler, M., Mendoza, N., Wright, A., Goupee, A., Lenfest, E., and Parker, A.: Results from the FOCAL experiment campaign 1: turbine control co-design, J. Phys.: Conf. Ser., 2265, 022082, https://doi.org/10.1088/1742-6596/2265/2/022082, 2022. a
Larwood, S. and Zuteck, M.: Swept wind turbine blade aeroelastic modeling for loads and dynamic behavior, AWEA Windpower, https://scholarlycommons.pacific.edu/soecs-facpres/4 (last access: 1 August 2024), 2006. a
Larwood, S., van Dam, C., and Schow, D.: Design studies of swept wind turbine blades, Renew. Energy, 71, 563–571, https://doi.org/10.1016/j.renene.2014.05.050, 2014. a
Li, A., Pirrung, G., Madsen, H. A., Gaunaa, M., and Zahle, F.: Fast trailed and bound vorticity modeling of swept wind turbine blades, J. Phys.: Conf. Ser., 1037, 062012, https://doi.org/10.1088/1742-6596/1037/6/062012, 2018. a
Li, A., Gaunaa, M., Pirrung, G. R., Ramos-García, N., and Horcas, S. G.: The influence of the bound vortex on the aerodynamics of curved wind turbine blades, J. Phys.: Conf. Ser., 1618, 052038, https://doi.org/10.1088/1742-6596/1618/5/052038, 2020. a
Li, A., Pirrung, G. R., Gaunaa, M., Madsen, H. A., and Horcas, S. G.: A computationally efficient engineering aerodynamic model for swept wind turbine blades, Wind Energ. Sci., 7, 129–160, https://doi.org/10.5194/wes-7-129-2022, 2022. a, b
Liebst, B. S.: Wind turbine gust load alleviation utilizing curved blades, J. Propuls. Power, 2, 371–377, https://doi.org/10.2514/3.22897, 1986. a
Madsen, H. A., Larsen, T. J., Pirrung, G. R., Li, A., and Zahle, F.: Implementation of the blade element momentum model on a polar grid and its aeroelastic load impact, Wind Energ. Sci., 5, 1–27, https://doi.org/10.5194/wes-5-1-2020, 2020. a
Noca, F., Shiels, D., and Jeon, D.: A comparison of methods for evaluating time-dependant fluid dynamic forces on bodies, using only velocity fields and their derivatives, J. Fluids Struct., 13, 551–578, https://doi.org/10.1006/jfls.1999.0219, 1999. a
Pirrung, G. R., Madsen, H. A., Kim, T., and Heinz, J.: A coupled near and far wake model for wind turbine aerodynamics, Wind Energy, 19, 2053–2069, https://doi.org/10.1002/we.1969, 2016. a
Rahimi, H., Schepers, J., Shen, W., García, N. R., Schneider, M., Micallef, D., Ferreira, C. S., Jost, E., Klein, L., and Herráez, I.: Evaluation of different methods for determining the angle of attack on wind turbine blades with CFD results under axial inflow conditions, Renew. Energy, 125, 866–876, https://doi.org/10.1016/j.renene.2018.03.018, 2018. a
Schepers, G.: IEA Task 47 Innovative aerodynamic experiment technologies and simulations on wind turbines in turbulent inflow, Zenodo, https://doi.org/10.5281/zenodo.4580358, 2021. a
Suzuki, K., Schmitz, S., and Chattot, J.-J.: Analysis of a swept wind turbine blade using a hybrid Navier–Stokes/Vortex-Panel model, in: Computational fluid dynamics 2010, Springer, Berlin, Heidelberg, 213–218, https://doi.org/10.1007/978-3-642-17884-9_25, 2011. a
Verelst, D. R. and Larsen, T. J.: Load consequences when sweeping blades – A case study of a 5 MW pitch controlled wind turbine, Tech. Rep. RISO-R-1724(EN), Technical University of Denmark, Risø National Laboratory for Sustainable Energy, Wind Energy Division, Roskilde, Denmark, https://orbit.dtu.dk/en/publications/load-consequences-when-sweeping-blades-a-case-study-of-a-5 (last access: 1 August 2024), 2010. a, b