the Creative Commons Attribution 4.0 License.
the Creative Commons Attribution 4.0 License.
 | 02 Aug 2024
The potential of wave feedforward control for floating wind turbines: a wave tank experiment
Peter Naaijen
Vincent Leroy
Félicien Bonnefoy
Mohammad Rasool Mojallizadeh
Yves Pérignon
Jan-Willem van Wingerden
Floating wind energy has attracted substantial interest since it enables the deployment of renewable wind energy in deeper waters. Compared to the bottom-fixed turbines, floating wind turbines are subjected to more disturbances, predominantly from waves acting on the platform. Wave disturbances cause undesired oscillations in rotor speed and increase structural loading. This paper focuses on investigating the potential of using wave preview measurement in the control system labeled as wave feedforward to mitigate the effects of the wave disturbances. Two wave feedforward controllers were designed: one to reduce generator power oscillations and the other one to minimize the platform pitch motion. In this study, a software-in-the-loop wave tank experiment is presented for the purpose of investigating the potential of these wave feedforward controllers. In the experiment, a 1:40 scaled model of the DTU 10 MW reference wind turbine is used on top of a spar platform, with the baseline feedback control functionalities. Different environmental conditions, including wind speed, significant wave height, turbulence intensity, and wave spreading, were applied during the experiments to test the feedforward control performance and their effect on the turbine dynamics in general. It was found that the feedforward controller for the generator power reduces the power fluctuations properly with a fair control effort, while the one for platform pitch motion requires almost double the actuation duty for the same percentage reduction. Furthermore, the feedforward controller was able to counteract the wave disturbance at different wave heights and directions. However, it could not do much with increasing turbulence intensity as wind turbulence was found to have more dominance on the global dynamic response than waves.
- Article
(9443 KB) - Full-text XML
- BibTeX
- EndNote


Wind energy is pivotal for meeting the decarbonization objectives of the European Union (EU) energy system, as it ensures delivering clean, affordable, and secure electricity to various sectors, including households, industry, and transport. Consequently, wind energy is expected to heavily contribute to the EU renewable-energy targets. This is not surprising, especially when we know that in 2022, wind energy covered 16 % of the EU electricity demand and accounted for over 37 % of the total electricity generated from renewable sources in the EU in 2021. No wonder the EU is regarded as a pioneer in wind energy. Accordingly, this has seen the EU revising the renewable-energy directive, which lays down a minimum binding target of a 42.5 % share of renewables by 2030 with an aspiration to reach 45 %. This is 10.5 % higher than the initial 32 % target. Subsequently, the EU could fulfill its ambition of becoming climate-neutral by 2050 (European Commission, 2023).
Offshore wind is quite superior to onshore wind when it comes to the higher wind speeds and consistency in direction. Floating offshore wind, in particular, offers unique opportunities for Europe, as floating offshore wind turbines (FOWTs) can produce electricity further offshore and in deeper waters than bottom-fixed turbines, which opens the door for offshore wind development in countries with deeper sea basins such as the Mediterranean and Atlantic. Nevertheless, floating offshore wind turbines operate in rough environmental conditions. As opposed to onshore turbines, waves come into play and act as another source of disturbances affecting the wind turbine and exerting extra structural loading on top of the loads due to wind turbulence. Consequently, fatigue loads experienced by FOWTs are increased due to the contribution added by the waves (Saenz-Aguirre et al., 2022). FOWTs come with additional challenges compared to their onshore counterpart from a control point of view, as extra dynamics introduced by the floating platform make the control problem more complex. A well-known example is the negative damping instability that forces a reduction in the bandwidth of the feedback (FB) pitch controller below the platform pitch eigenfrequency (Larsen and Hanson, 2007; Jonkman, 2008; van der Veen et al., 2012; Fischer, 2013; Lemmer et al., 2020; Hegazy et al., 2023a). Consequently, the blade pitch FB controller has limited control over errors caused by disturbances like wind and waves, leading to a delayed response in control actions to these disturbances. As mentioned before, wind and waves are the main sources of disturbance affecting FOWTs. If a preview of those disturbances exists, it can be exploited within a feedforward (FF) control framework to combat their effects. This would reduce the control effort exerted by the FB controller, as it would not need to react to disturbances anymore since the FF would be taking care of them. As for wind disturbance, nacelle‐mounted light detection and ranging (lidar) technology can provide measurements of the upstream wind inflow, from which an estimate of the rotor-effective wind speed is obtained, which can be used for FF wind turbine control. Lidar FF control has proven its ability to reduce fatigue loads and power excursions effectively (Schlipf et al., 2013; Navalkar et al., 2015; Schlipf et al., 2020), which helped boost its momentum towards commercialization.
Generally speaking, wave FF control strategy resembles lidar FF control, as in the case of wave FF, a preview of the wave height/loads is acquired based on measurements of the surrounding upstream waves, as shown in Fig. 1, which is then exploited within the turbine controller. In this regard, several technologies are available to measure the surface wave elevation: wave buoys, radars, or satellites. The radar technology, in particular, has the capability of scanning large areas at further distances, which makes it attractive (Fontanella et al., 2021). Predictions of the surface wave elevation can then be established from the radar images of the wave field (Naaijen and Wijaya, 2014). Kim et al. (2023) developed a phase-resolved ocean wave predictions algorithm to incorporate directional sea states and validated them against dedicated scaled wave tank experiments, considering sea states with different directional spreading as well as different wave steepness. Later on, they continued the development of the prediction algorithms with the aim of enhancing the accuracy of continuous wave prediction as discussed in Kim et al. (2024a). Furthermore, Kim et al. (2024b) proposed wave excitation force prediction methods, where they validated the prediction algorithms against the experimental data.
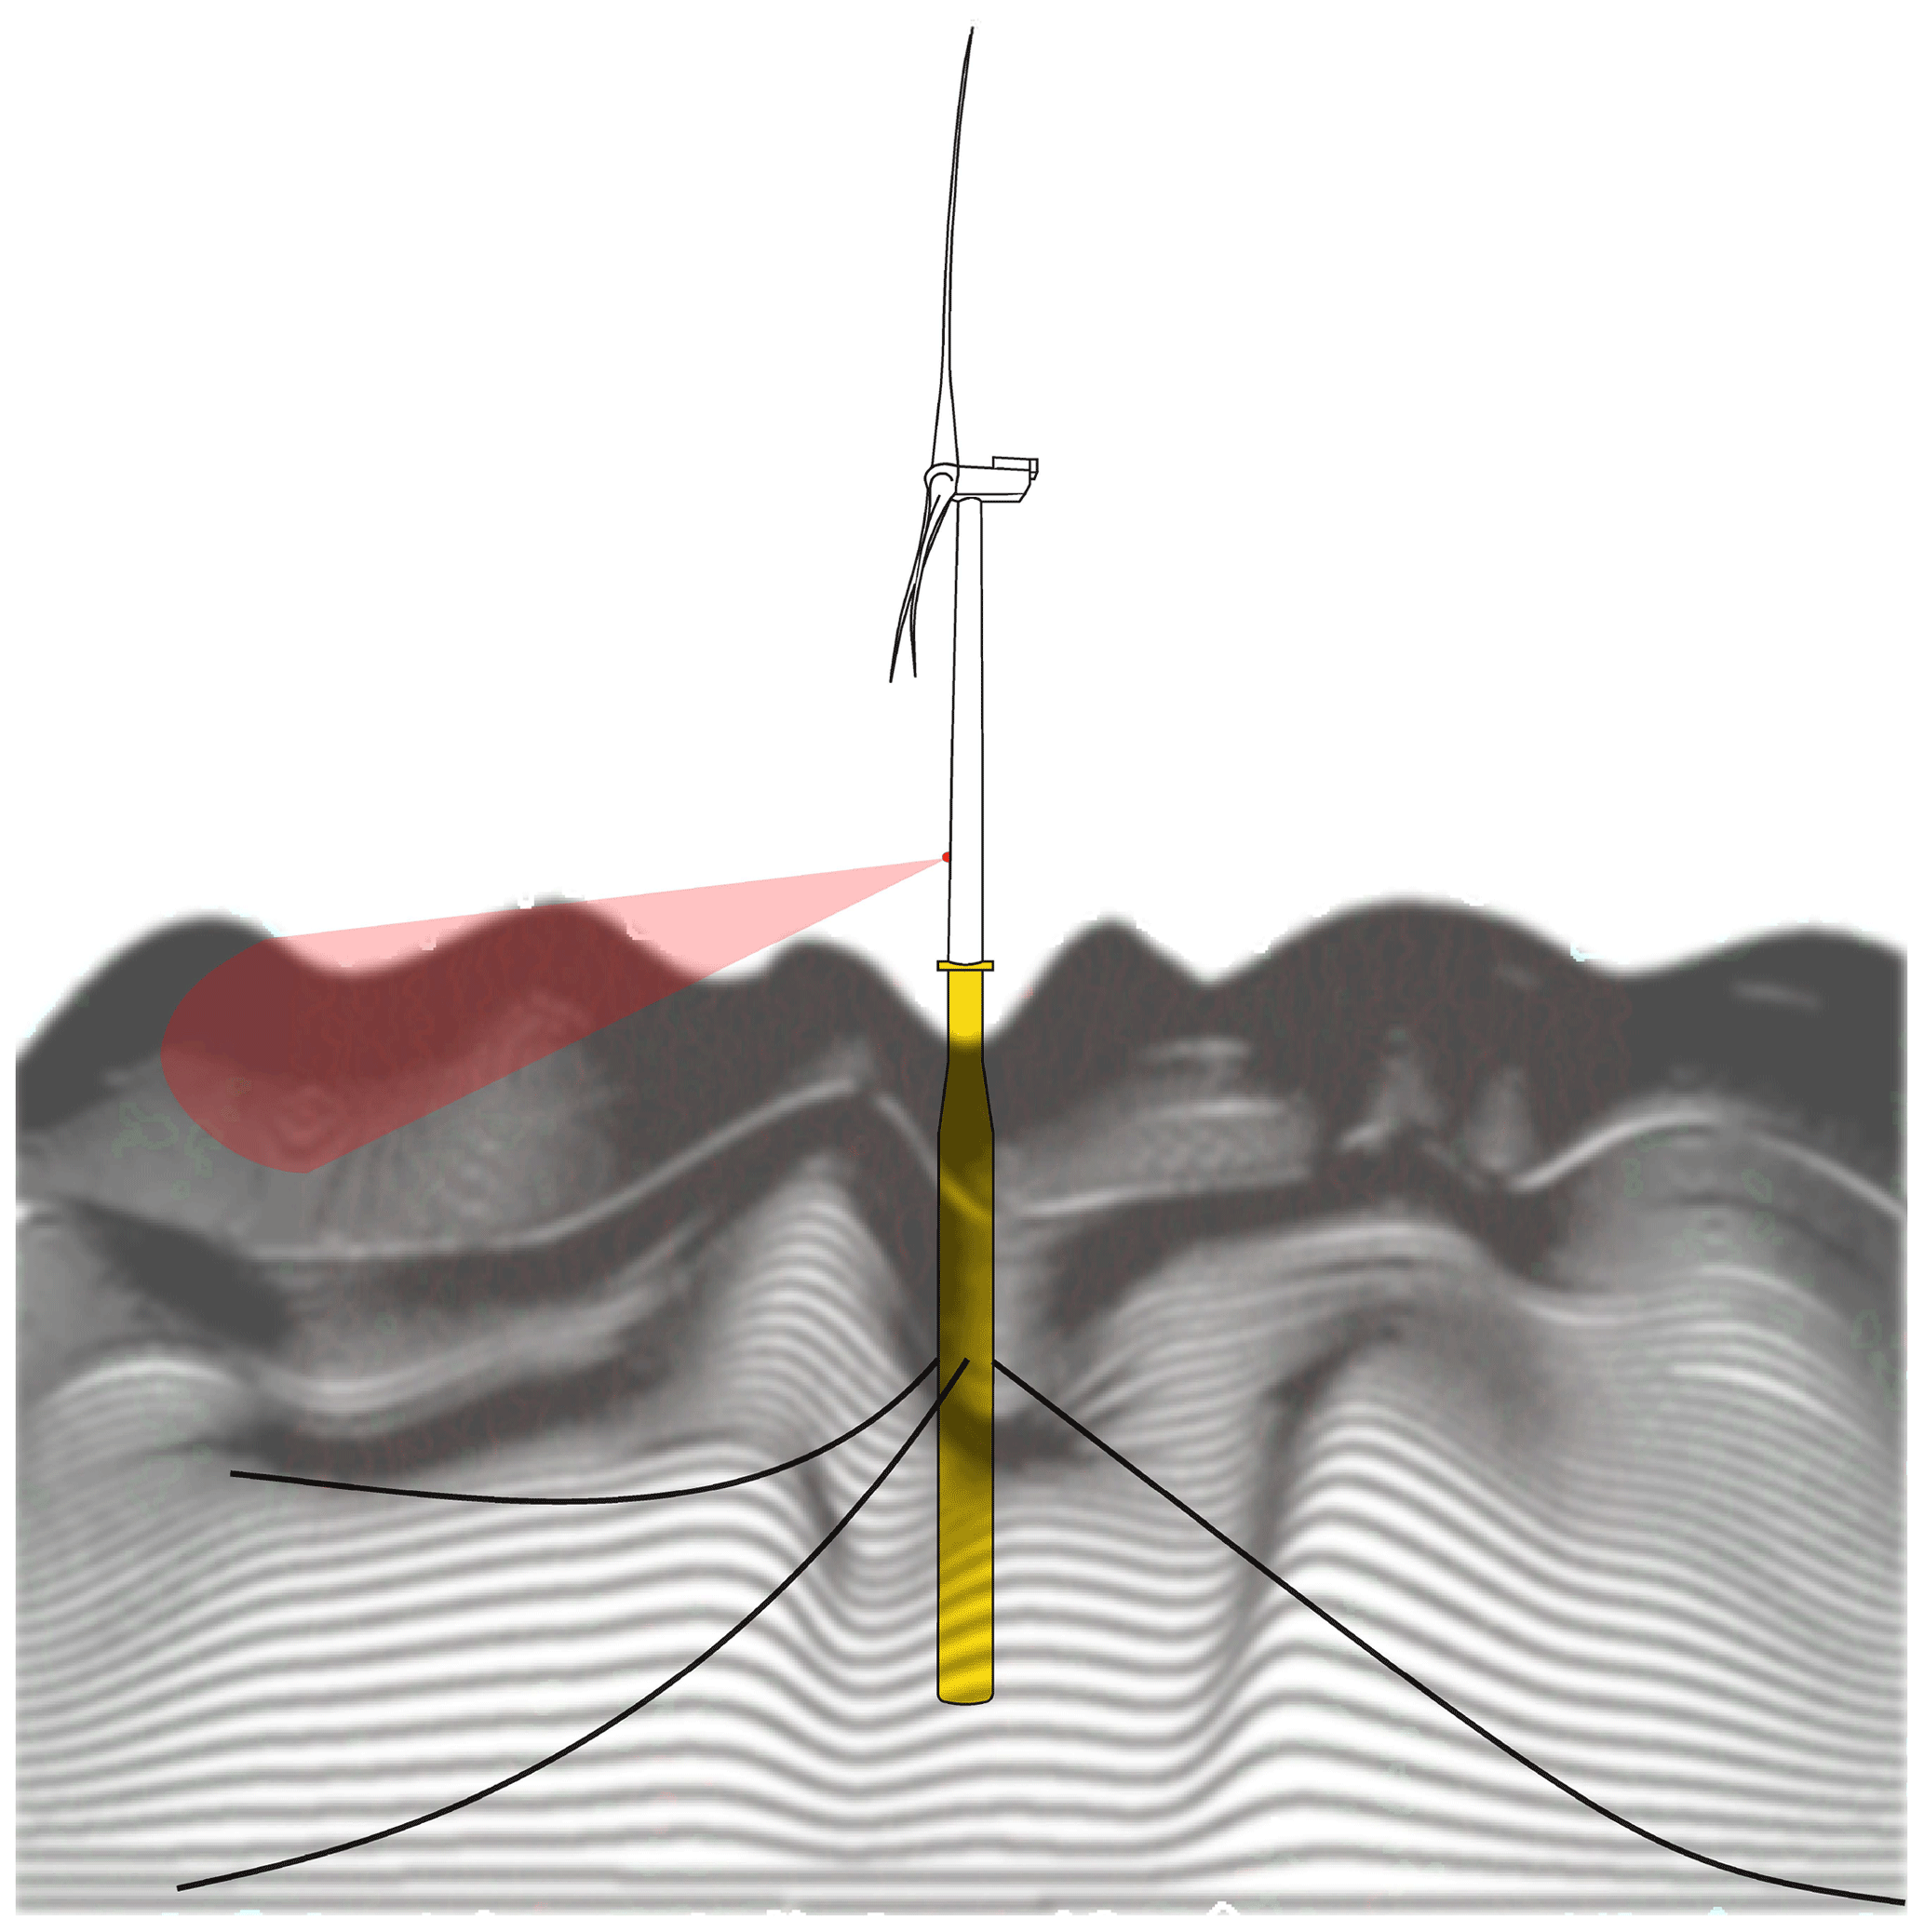
Figure 1Schematic of the wave FF control strategy. The FF control action is based on the wave elevation measured by a radar upstream of the wind turbine. This measurement is used to obtain a preview of the wave excitation forces at the floating platform ahead of time, which is the input to the wave FF controller.
Wave FF, however, is not yet as mature as lidar FF, since it is not thoroughly discussed in the literature. Only a few studies investigated the subject as in Raach et al. (2014) where a non-linear model predictive control (NMPC) strategy was developed, considering perfect wind/wave preview, demonstrating promising improvement over the baseline feedback controller with regard to blade loads, but the contribution of each of the lidar and wave FF separately was not clarified. In Ma et al. (2018), an effective deterministic finite-horizon linear quadratic regulator (LQR) controller was designed, exploiting a real-time forecast of the wave loads, to reduce tower-base fore–aft (FA) bending moment, and achieved assorted results. A model-inversion wave FF controller utilizing a preview of the incoming wave elevation, with the objective of reducing rotor speed oscillations, was developed in Fontanella et al. (2021) and Al et al. (2020) considering a few degrees of freedom corresponding to the global dynamics of the FOWT, where the FF controller was added to the standard FB controller to improve power quality by reducing the rotor speed fluctuations caused by waves. They showed that the controller could alleviate the effects of the wave disturbance on the rotor speed, hence the generator power, with a positive side effect of lowering the fatigue loads for the low-speed shaft (LSS) and blades.
Unlike the model-based control used in Fontanella et al. (2021) and Al et al. (2020) for the control synthesis, Hegazy et al. (2023b) employed a data-driven control approach that can capture the missing dynamics that are not considered in the model-based one. As the predictor-based subspace identification (PBSIDopt) algorithm, van der Veen et al. (2013) developed the wave FF controllers, which were synthesized for the same two control objectives discussed in this study: power regulation and platform pitch motion reduction. Those controllers were then tested in the aero-servo-hydro-elastic simulation suite, QBlade (Marten, 2023). Hegazy et al. (2023b) went on to show that FF control for power regulation helps reduce the rotor speed fluctuations and, thus, leads to higher-power quality output. Meanwhile, the FF control for platform pitch mitigation requires large control effort.
A step forward towards pushing the technology readiness level of such a control strategy would be conducting physical experiments. Such experiments can be performed in the field using a full-scale prototype, or a scaled model of the system can be tested either in a wind tunnel or a wave tank. Scaled-model testing helps to better understand the system dynamics and at a lower cost than full-scale prototypes. The domain where higher accuracy is required plays an important role in choosing the scaled-model testing environment, whether in a wind tunnel to focus on the aerodynamic aspect of the system or a wave basin to focus on the hydrodynamic aspect. If the tests are performed in a wind tunnel, the part of the FOWT with the uncertain theoretical model is reproduced with a physical-scale model, while a numerical model is used to emulate the rest of the FOWT. Both the physical and the numerical models are then coupled via continuous measurement of some quantities of the physical model and actuation of other quantities computed in the numerical model (Fontanella et al., 2023). Meanwhile for wave tank testing, a numerical model is used to define the turbine aerodynamics and control actions, while the hydrodynamic and structural response of the platform is reproduced with a physical-scale model (Chen et al., 2022).
Within the context of FF control of wind turbines, field tests of full-scale prototypes were conducted to investigate the effectiveness of lidar FF wind turbine control, which confirmed the positive impact lidar FF control has with regard to power regulation and structural loading as was reported in Scholbrock et al. (2013) and Schlipf et al. (2014). Unfortunately, the experiments were not successful due to unknown reasons that have nothing to do with the FF controller itself (Al, 2020). So to the best of the authors' knowledge, no successful experiments have been conducted for the purpose of investigating wave FF control potential so far. This takes us to the main contributions of this article:
-
Explore the potential of wave FF control strategy by conducting scaled-model testing in a wave basin.
-
Investigate the effect of different environmental conditions on the performance of the different wave FF controllers.
The remainder of this article is structured as follows: Sect. 2 presents the experimental setup of the model-scale test. Afterwards, the control design procedure is discussed in Sect. 3. Results from the conducted wave tank scale-model tests are then discussed in Sect. 4. Finally, Sect. 5 will draw the conclusion.
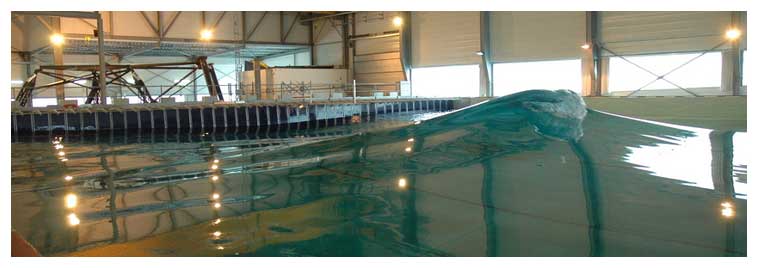
The experimental campaign was performed in the Hydrodynamics and Ocean Engineering Wave Tank of École Centrale de Nantes (ECN) in France as shown in Fig. 2. It is 50 m long, 30 m wide, and 5 m deep, equipped with a segmented wave maker composed of 48 independent flaps distributed over the width of the basin, which enables generating high-quality waves. It can produce both regular and irregular waves, taking into account wave direction. Both uni- and multi-directional waves can be generated. The generated wave periods can vary from 0.5 to 5 s, while the significant wave height at model scale can go up to 1 m for regular waves and 0.6 m for irregular ones.
2.1 Floating wind turbine model
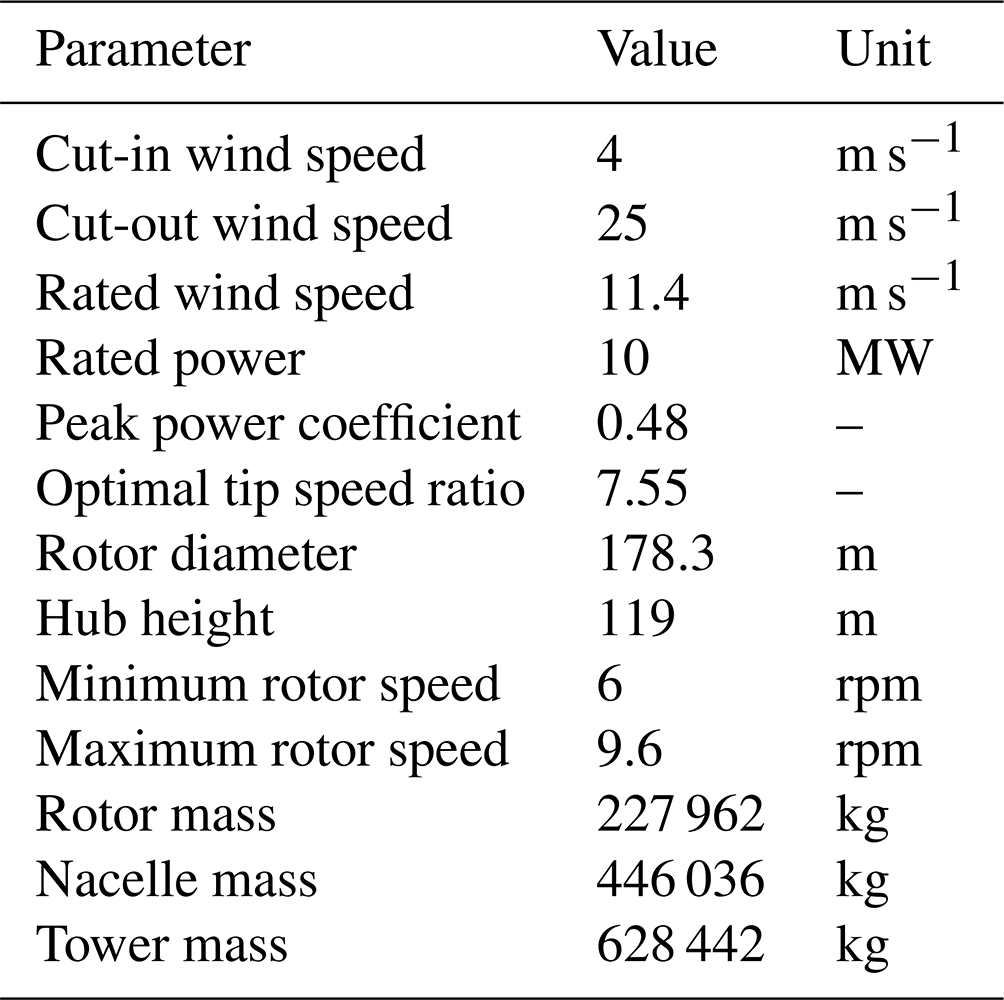
For this study, the DTU 10 MW reference wind turbine (RWT) (Bak et al., 2013) is mounted on top of a spar-type floater, at a scale of 1:40, as shown in Fig. 3. The floating platform was designed at ECN within the context of the SOFTWIND project (Arnal, 2020). The SOFTWIND floating platform is a spar-type floater. It has a 90 m draft and an 18 m diameter, tapered to 11.2 m diameter at the water level. The mooring system considered is composed of three catenary lines contained within a 16 m radius with a 120° spacing. Each line is fixed on two fairlead points by means of delta connection lines to ensure high yaw stiffness. The parameters of both the DTU 10 MW RWT and the SOFTWIND floating platform are shown in Tables 1 and 2, respectively.
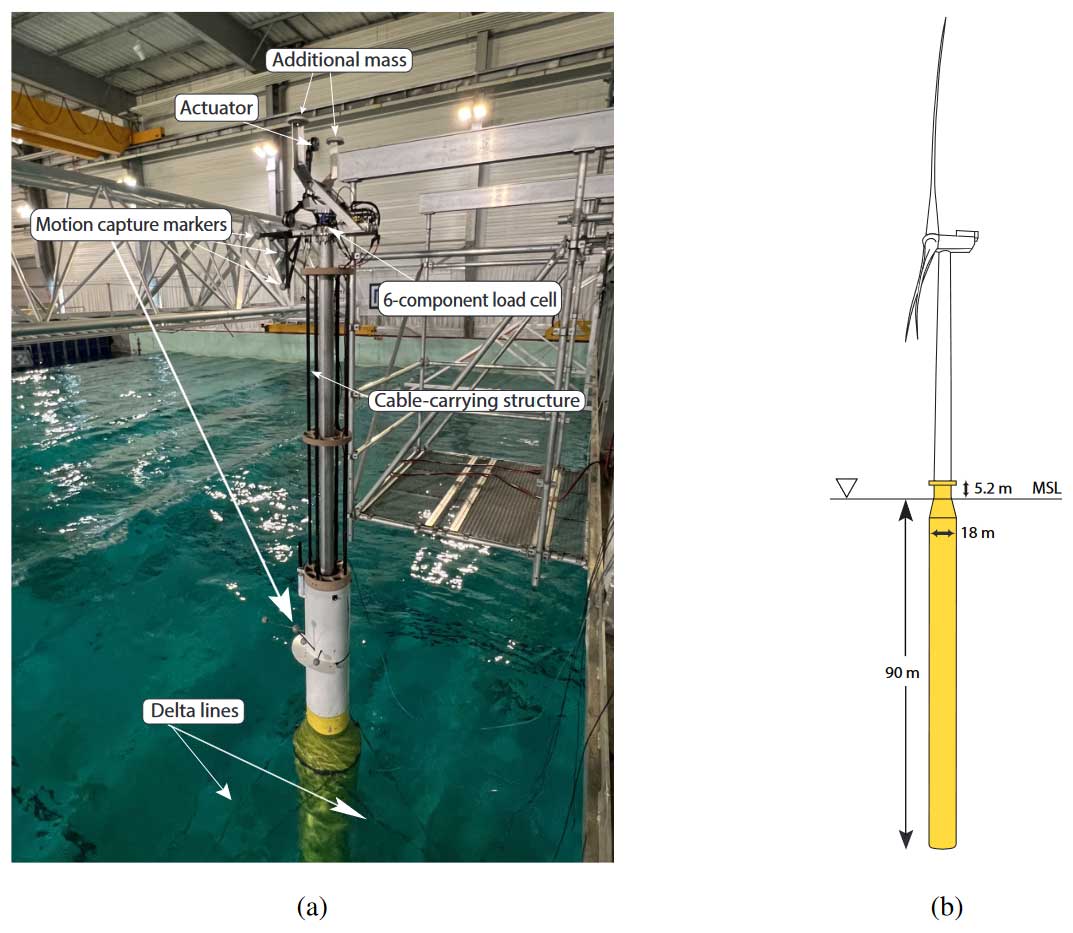
Figure 3A snapshot of the floating wind turbine 1:40 scaled model of the DTU 10 MW RWT on top of the SOFTWIND spar in (a), together with a schematic of the full-scale model in (b).
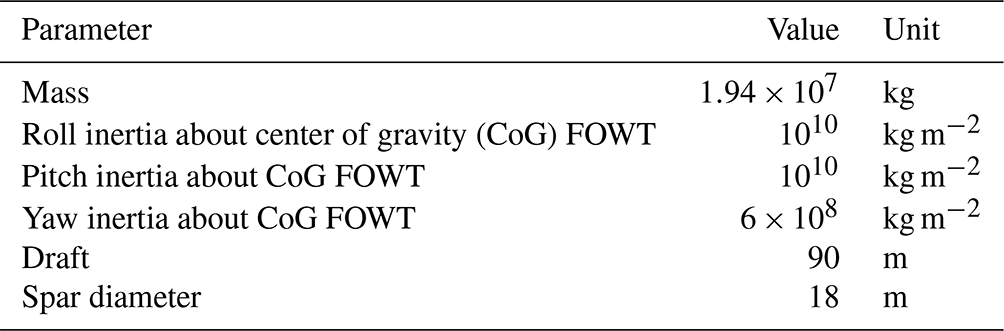
Table 2Key parameters of the DTU 10 MW RWT (Bak et al., 2013).
The floating wind turbine is regulated with an industry-standard generator speed controller, as at below-rated wind speeds, the controller seeks to maximize the extracted power by keeping the collective blade pitch angle, θc, constant while varying the generator torque, τg, as a function of the square of the generator speed, ωg, as follows:
where is the generator–torque constant, ρ is the air density, r is the rotor radius, and ηg is the gearbox ratio. Cp,max is the maximum power coefficient, which is achieved at the optimal tip-speed ratio, λopt, and zero blade pitch angle.
At above-rated wind speeds, the controller regulates the generator speed to its rated value while keeping the generator torque constant at its rated value. As a result, generator power fluctuations are directly proportional to the oscillations occurring in the generator speed. The collective blade pitch controller regulates the generator speed around its rated value, ωg,rat, according to the following feedback control law:
where kp and ki are the proportional and integral gains respectively, which were properly tuned using the loop-shaping technique. It is important to mention that the gain crossover frequency was kept below the platform pitch eigenfrequency to avoid the negative damping instability. Moreover, constant torque strategy was adopted, which on the one hand limits the rotor speed variations resulting from reducing the natural frequency of the blade pitch controller and, on the other hand, reduces the drive-train loads and the pitch activity (Larsen and Hanson, 2007). The feedback controller is considered the baseline against which the wave FF controller is evaluated.
2.2 Measurements
The measurement system consists of several sensors. As for the forces and moments, two six-component load cells (model HBM-MCS10) are placed along the tower. The first is installed between the tower top and the nacelle to measure the rotor integral forces and torques, while the second is installed at the transition piece to measure the tower-base loads, including the bending moments. The axial load in each mooring line is measured through an in-line submersible one-component load cell located at the connection between the main line and the delta line where the tension is supposed to be maximum. Four strain gauges are installed at the tower base to measure the tower bending strain.
An accelerometer of model ASC 5525MF-002 is installed on the nacelle, above the load cell at the tower top. This accelerometer is used to compute the inertial force and the weight terms to obtain the actual thrust forces.
Regarding motions, an optical Qualisys motion capture system is used to measure the 3D position of eight spherical reflective markers (see Fig. 3). Four markers are fixed to the nacelle to measure the tower-top motion, while another four markers are fixed to the platform top to measure the platform motion. The platform and nacelle velocities can then be derived from the positions measured by the motion capture system via an implicit super-twisting differentiator (Mojallizadeh et al., 2024b).
Moreover, seven wave gauges, required for the wave reconstruction and prediction algorithm, are installed at different locations in the wave basin. The waves were calibrated with one wave probe exactly at the model's equilibrium position.
All the onboard sensors' signals are acquired via the CompactRIO data acquisition system, which is installed inside the spar platform to record all the measurements of the sensors fixed on the FOWT model. An HBM Quantum signal-conditioning unit records the data from the mooring load cells, the wave gauges, and the water temperature sensor through the Catman software. The Qualisys software records the FOWT motions on a PC. An Ethernet cable connects the PC with the CompactRIO in order to ensure the fastest possible data exchange. These three systems are then synchronized via a trigger signal generated at the start of the wave maker.
2.3 Software-in-the-loop system
The main purpose of the software-in-the-loop (SIL) system is to take care of reproducing the aerodynamic loads on the FOWT model. It is composed of a real-time loop including acquisition, blade element momentum simulation, and force reproduction by means of thrusters to mimic the rotor loads, since the wind turbine rotor is not physically scaled. A motion tracking system measures the position of the platform (reference point: tower base) and the tower top deflection (fore–aft and side–side), whenever the model reacts physically to external loads (gravity, waves, moorings, and actuator).
A set of differentiators are then used to calculate the velocities of the platform and nacelle. Once the displacements and the velocities are measured, they are provided to the numerical simulation (OpenFAST), which runs in parallel to the experiments, to compute the relative velocities on the elements of the blades and, thus, the thrust force acting on the rotor. By applying Froude scaling on the thrust force obtained from OpenFAST, the reference force to apply with the actuator is then derived at model scale and applied by a set of thrusters as depicted in Fig. 4.
The inner loop of the SIL system controls the actuators with implicit sliding mode control (Mojallizadeh et al., 2024b), which aims at reproducing as fast and accurately as possible the axial thrust force set point (Mojallizadeh et al., 2024a). A feedback control loop enables the system to reach a satisfactory accuracy, particularly at low and wave frequencies, which are the main focus of the presented analysis. The delays of the system and the minimum rotor speed are limitations of the current setup. The total delay, defined as the delay between measurement of the state of the physical model and the reproduction of the aerodynamic force corresponding to this instant (sum of delays induced by the acquisition, simulation, and force reproduction), is estimated as 100 ms in the worst case. In terms of force magnitude, the error on the reproduction of the axial force is lower than 5 % at low and wave frequencies (Bonnefoy et al., 2024).
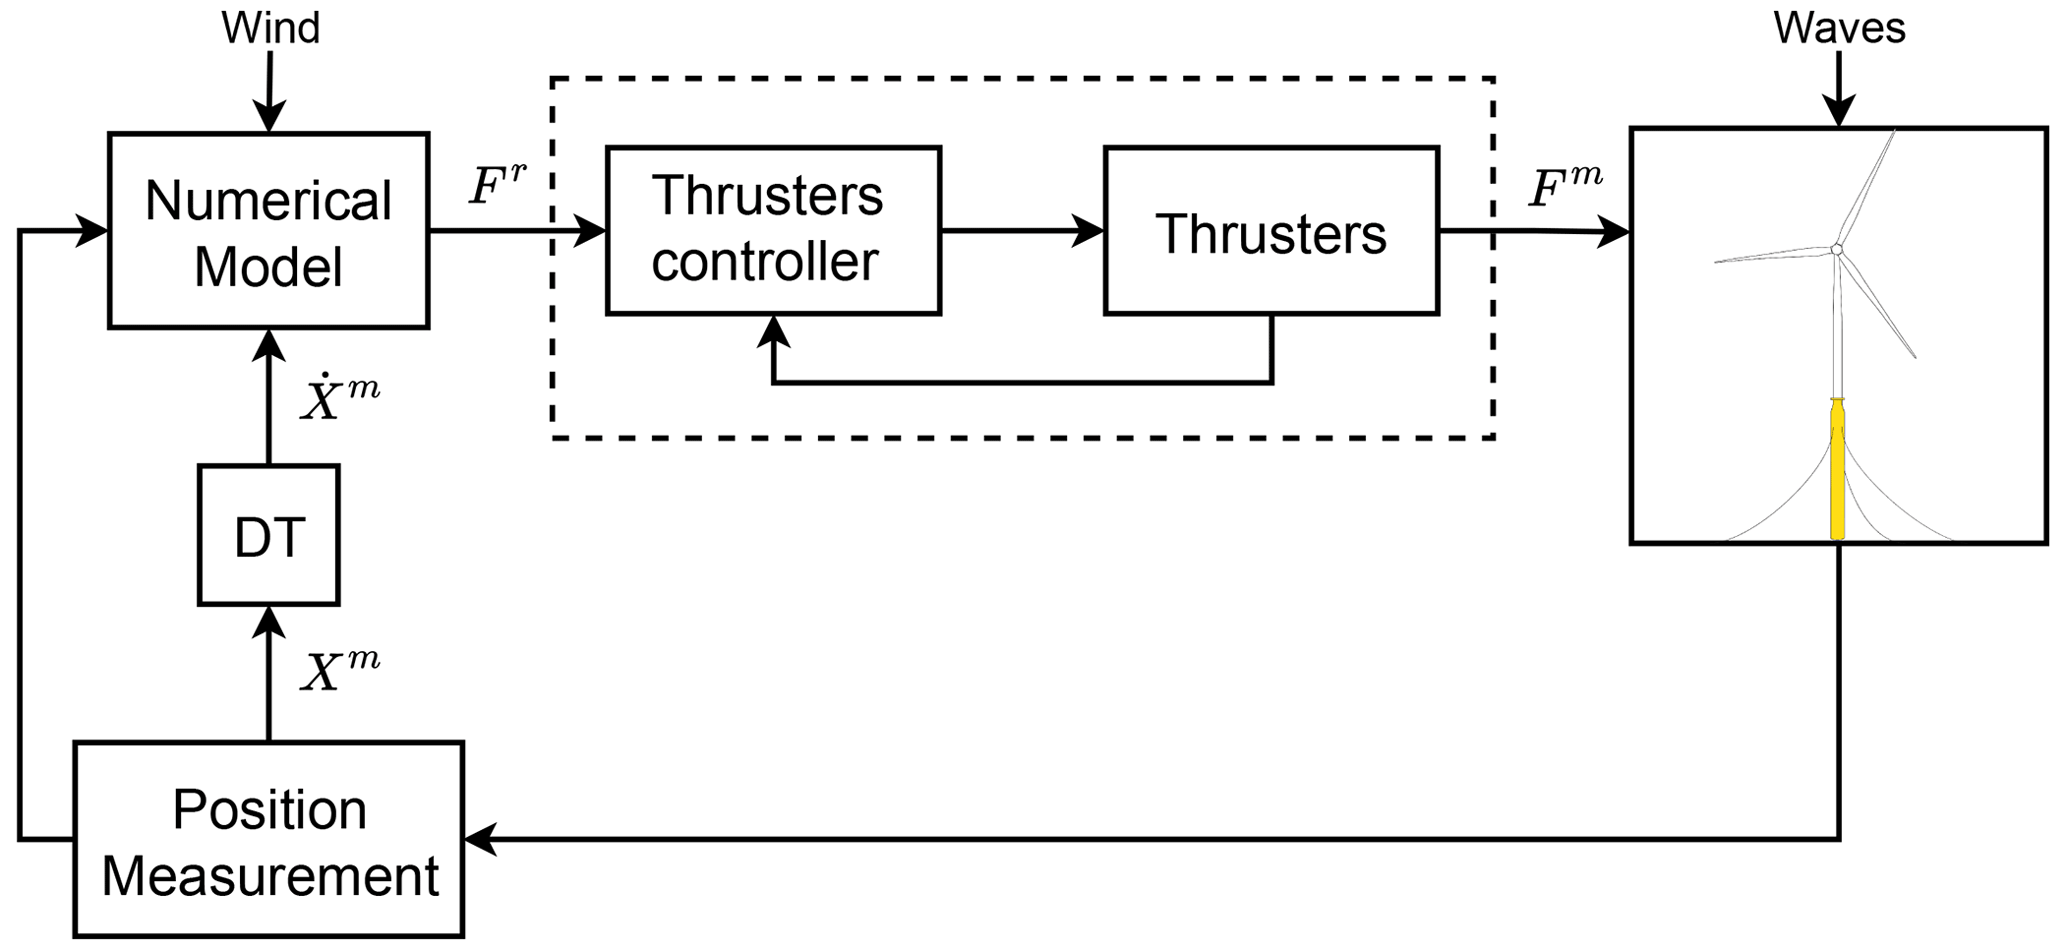
Figure 4Scheme of the real-time loop for the SOFTWIND SIL approach, with the numerical model emulating the wind turbine controller and aerodynamic response.
2.4 Wave load prediction
Regarding the preview of the wave excitation forces, a real-time phase-resolved ocean wave forecasting algorithm, developed by Kim et al. (2023, 2024a), was used. It is composed of two steps: (1) reconstruction of the initial wave conditions by assimilating data from observations and (2) wave propagation to achieve wave preview by simulating wave surfaces over a specific zone in the spatiotemporal domain. Once the wave preview is available, the wave excitation force estimation methods in Kim et al. (2024b) are applied to predict the wave excitation forces acting on the FOWT.
Figure 5 illustrates the comparison between the real surface wave elevation and wave excitation pitch moment at the FOWT and the predicted wave elevation and moment expected at the FOWT. We can already see that the prediction algorithm can provide a fairly accurate wave preview.
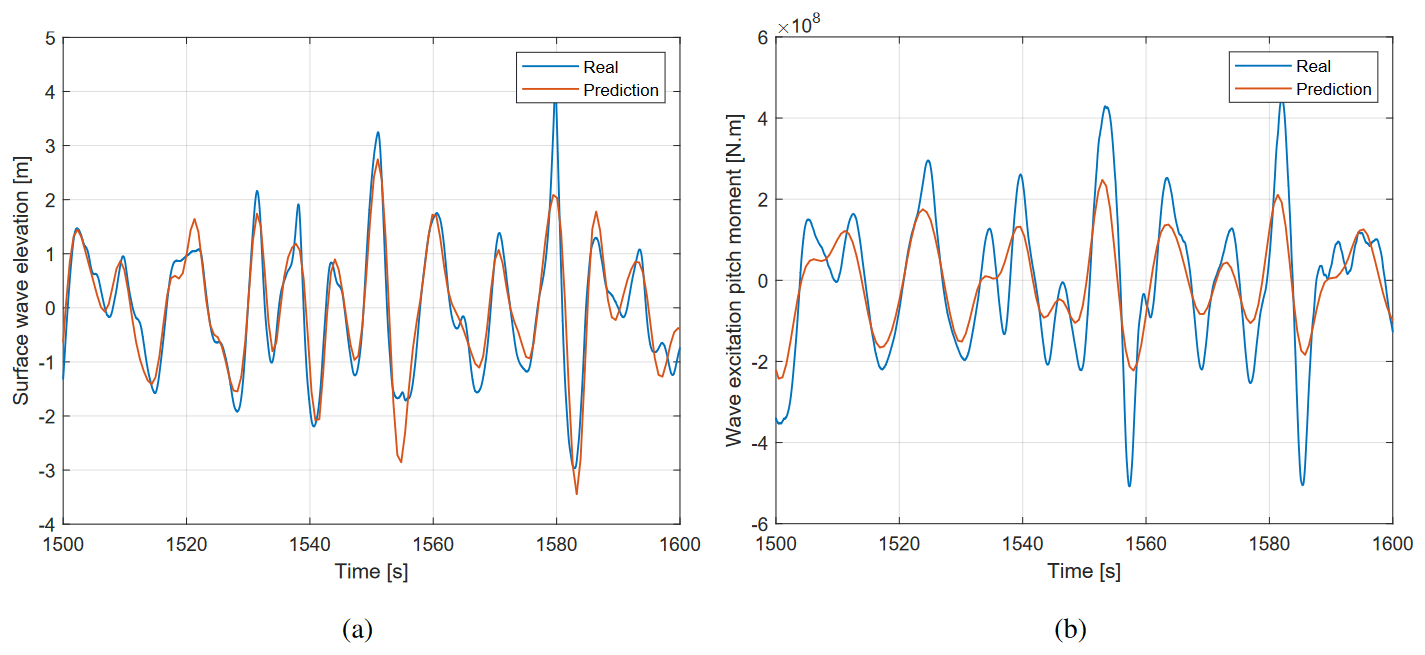
Figure 5Comparison between the wave preview of the (a) surface wave elevation and (b) wave excitation pitch moment, obtained via the prediction algorithm (Kim et al., 2023), and the real wave height and moment measured at the FOWT location.
In this section the controller design is presented. First, the control model is explained before moving to the control synthesis of the FF controller.
3.1 Data-driven approach
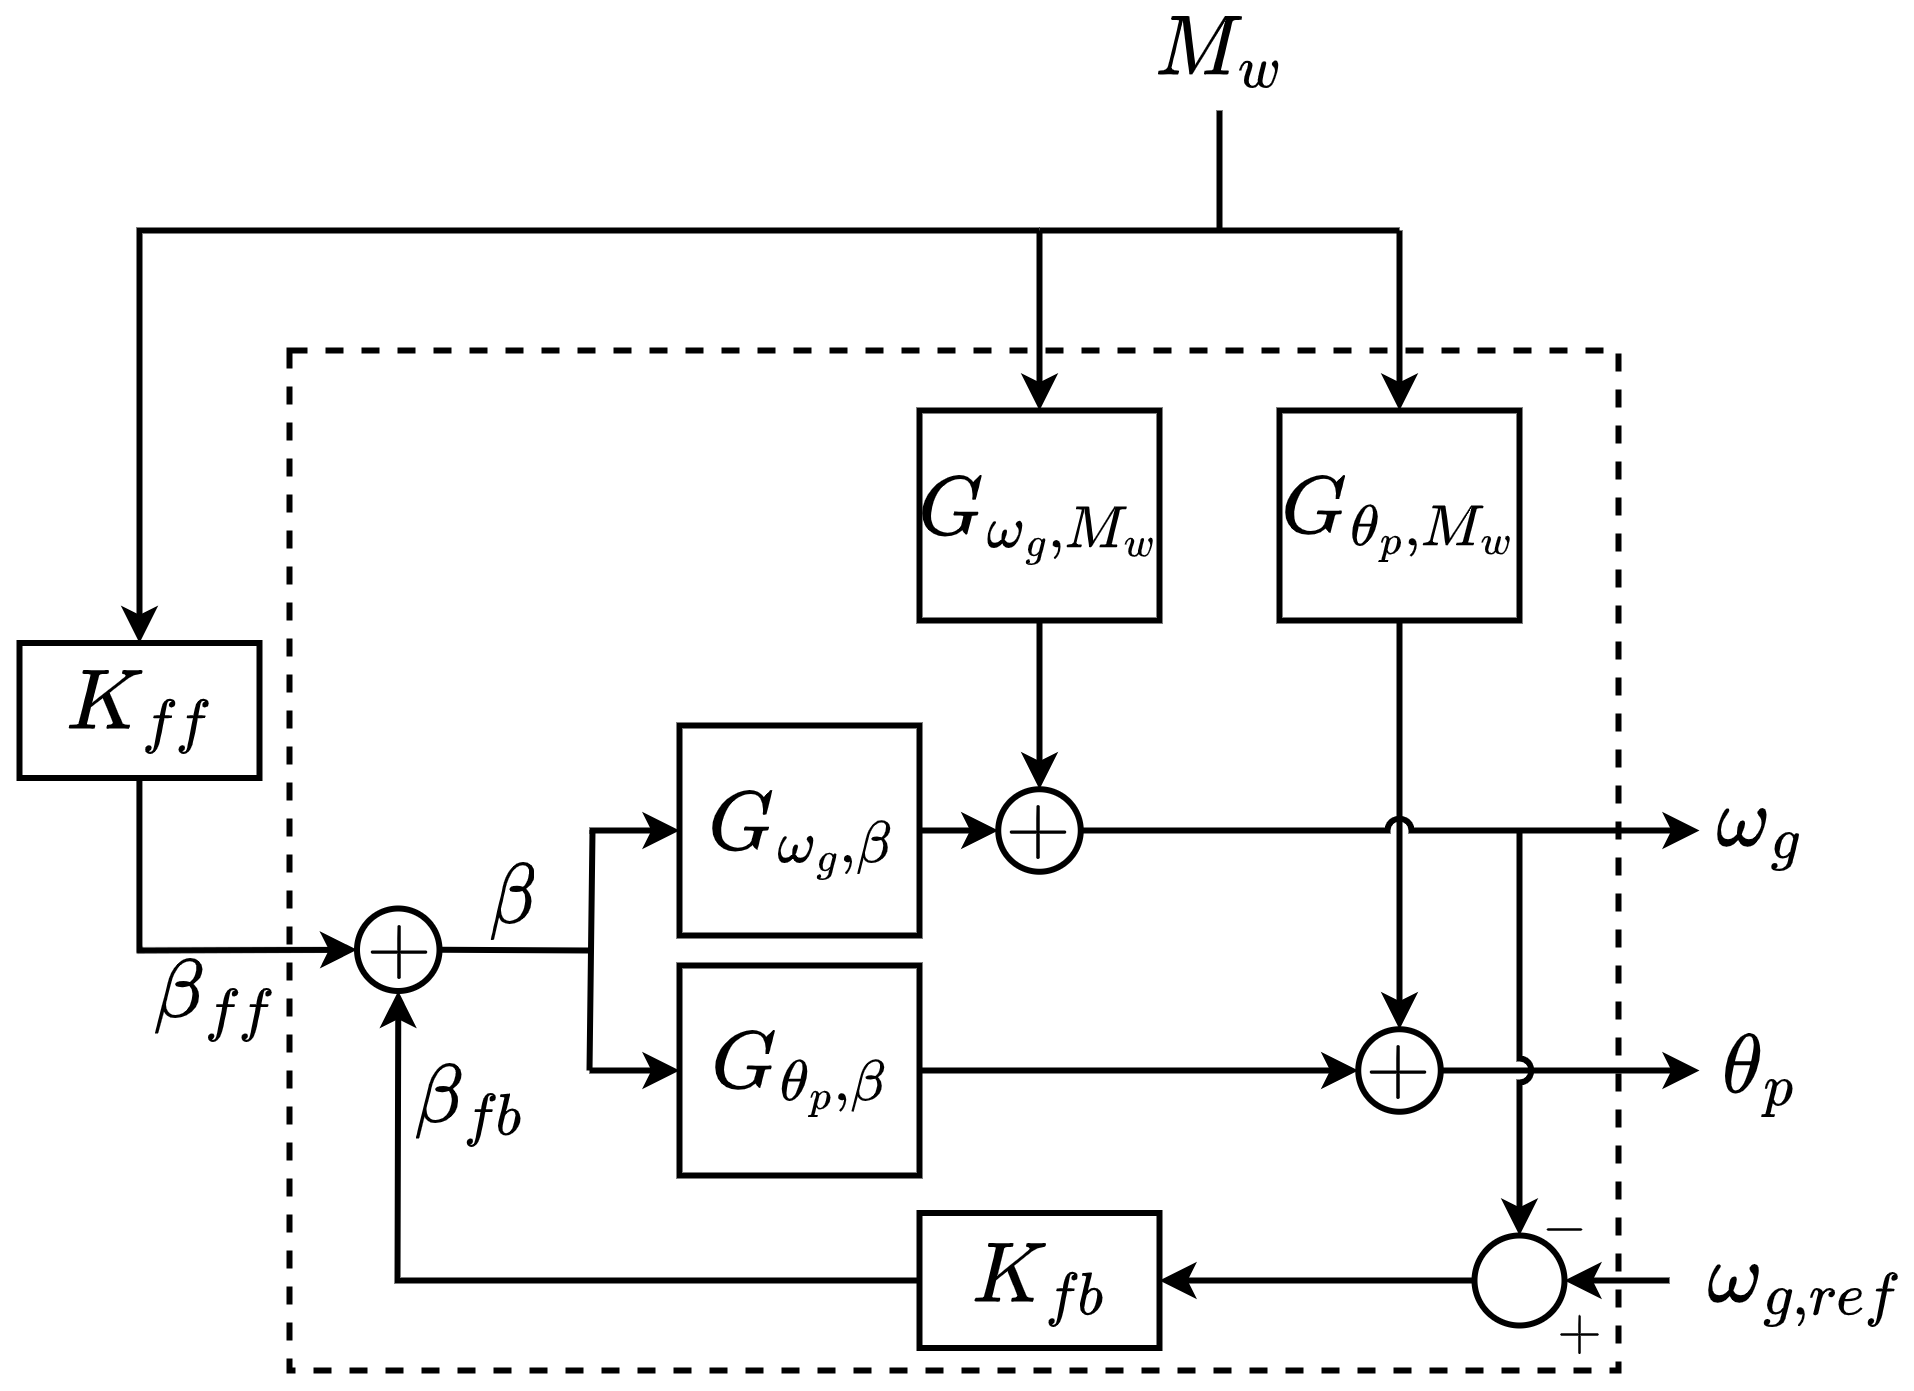
Figure 6 shows a block diagram of the FOWT model and control signals. Each block represents a linear transfer function (TF). represents the mapping from the wave-induced pitch moments, Mw, to the platform pitch motion, θp, while maps the wave-induced pitch moments to the generator speed, ωg. Similar to the wave moment, the effect of blade pitch, β, on the generator speed and the platform pitch motion is described by the TFs and , respectively.
To obtain these TFs, which are required for the control design, identification was conducted on the results obtained from QBlade (Marten, 2023), where the FOWT is modeled at full scale, and was able to reproduce the experimental results (Becker et al., 2022). QBlade is a fully coupled, non-linear, aero-hydro-servo-elastic wind turbine simulation suite that is capable of simulating wind turbines. System identification is also required when using QBlade for control design purposes, as it is not equipped with a linearization functionality, thus making it complicated to do model-based control.
The TFs were identified at an average wind speed of 16 [m s−1] as an operating point. A similar procedure was used for both the spectral estimation and the system identification, where an experiment of duration of 25 000 [s] was performed in QBlade.
In order to obtain the TFs ( and ), a chirp signal, logarithmically distributed over the experiment's duration, was used to excite β within a frequency band (0.02 to 0.3 Hz). As for and , a JONSWAP spectrum was used for waves.
A non-parametric form of the abovementioned TFs is obtained from the input–output data by spectral estimation. A frequency response function (FRF), assuming no correlation between the input and noise signals, is achieved according to
where ω in Eq. (3) denotes the frequency, , Syu(jω) is the cross-power spectral density of the output and input, Suu(jω) is the auto-power spectral density, and Gy,u(jω) represents the estimated FRF. Based on the estimated frequency response functions and the FF structure given in Fig. 6, the optimal non-parametric FF controller, for both the generator speed control and the platform pitch motion control, can be estimated and are respectively given by
The optimal non-parametric controllers are given by the blue lines in Fig. 7a and b, respectively.
So far, the controllers given in Eq. (5) are non-parametric since FRFs were used. However, they cannot be directly employed for control implementation.
The parametric controllers are obtained by fitting stable FF parametric TFs to the spectral estimate as shown in Fig. 7a and b. The fitting must be ensured to be of the highest accuracy within the wave band enclosed by the dashed vertical lines in the figures such that the performance is ensured within the wave frequency range (0.05–0.2 Hz) without the need for complex higher-order control structures. Outside the wave bandwidth, the controller is not supposed to react.
The parametric wave FF targeting the power regulation, , takes a structure that is a combination of a double integrator, first-order zero, and a second-order system according to Eq. (6):
where is a static gain for controller tuning, τ a time constant, ζ the damping ratio, and ωc the corner frequency of the controller.
For the parametric FF controller targeting the platform pitch, , the controller structure is composed of a double differentiator together with a second-order system, with being a static gain for controller tuning, as illustrated in Eq. (7):
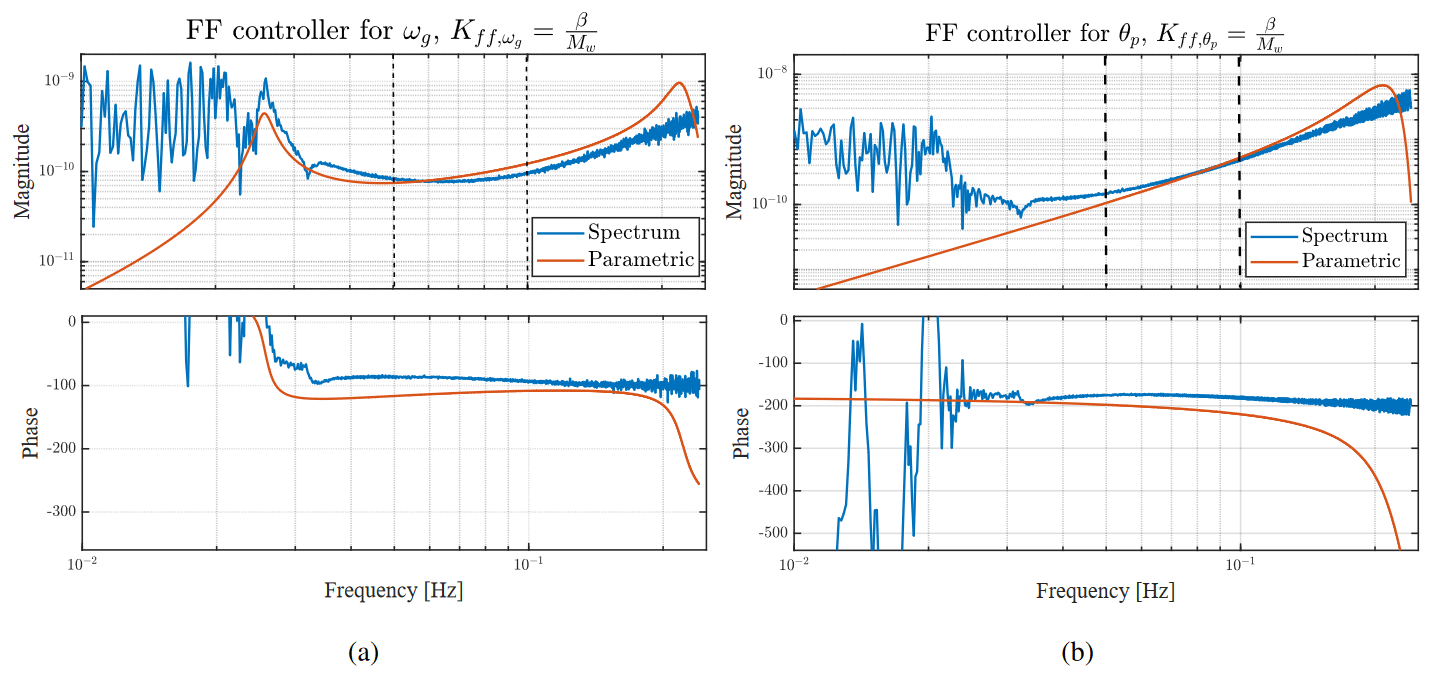
Figure 7Bode plot of the optimal feedforward controller for (a) power regulation and (b) platform pitch motion reduction. Blue: spectral estimate. Red: parametric controller.
Investigating Fig. 7a and b, they show a good agreement between the spectral-based and the parametric FF controller within the frequency band of interest enclosed by the dashed vertical lines, which gives confidence in the fitted parametric controllers.
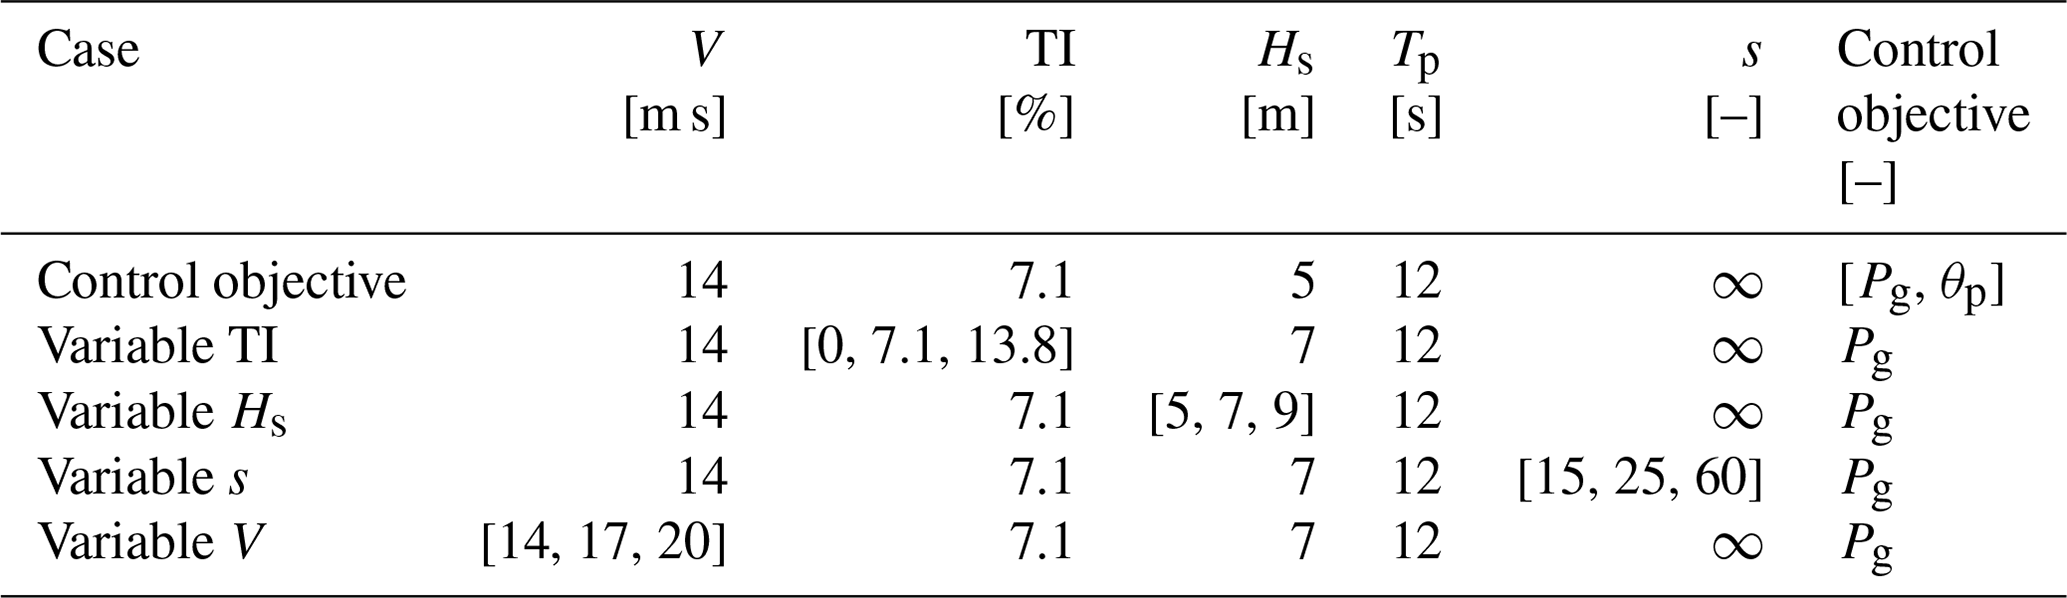
In this section, the results from the experimental campaign are illustrated and discussed. The wave tank tests were performed under different conditions to properly assess the controller performance for power regulation (Pg) and platform pitch motion reduction (θp). First, both controllers are tested at the same condition to investigate their effectiveness. Afterwards, we carried out the rest of the experiments with the more effective one, which was then tested at different wind speeds, turbulence intensities, significant wave heights, and wave directions. Accordingly, each case would be treated separately. So, we will first look at the effect of varying the turbulence intensity, TI, at a certain wind speed. This is followed by varying the significant wave height, Hs, then the wave directional spreading parameter, s, before concluding with varying the wind speed, V. In each case, one of the parameters is varied, while the rest are kept constant. The different experiments that were performed are listed in Table 3.
Table 3Environmental conditions for the different experiments performed in the wave tank (Pg refers to the power regulation controller, while θp refers to platform pitch motion reduction).
4.1 Control objective
We begin with illustrating the performance of the two different FF controllers for power regulation and platform pitch motion reduction, each one at a time against the baseline FB controller. In the end, we should be able to determine the effectiveness of the wave FF control for each control objective.
The two control strategies were compared by performing the SIL experiment at fixed wind and wave conditions. Turbulent wind at V=14 m s−1 and TI=7.1 % was considered. Waves according to a JONSWAP spectrum, with Hs=5 m and Tp=12 s, were considered.
Figure 8 shows the generator power, the collective blade pitch, and the platform pitch time-domain responses together with their power spectral densities (PSDs) with the different controllers. As first, the experiment was performed only with the FB controller as a baseline case. Afterwards, the FF controllers for both power regulation and platform motion reduction were added to the FB controller. We can see in the time response of the blade pitch signal the higher-frequency ripples, corresponding to waves, oscillating around a lower-frequency sinusoidal signal corresponding to the wind turbulence. This indicates that adding the FF controller to the control loop on top of the FB controller does not have any effect on the low-frequency content that corresponds to the wind turbulence, as it remains unchanged, but only reacts to the higher-frequency wave signals, which results in additional blade pitching. This is also evident in the PSDs, where we see that in the wave frequency range (0.05–0.2 Hz), the generator power signal has less spectral content than the baseline case for the power regulation control objective, while there is no change at lower frequencies for both objectives. On the contrary, when the FF controller for the platform motion reduction objective is operational, the spectral content in the generator power signal slightly increases above the baseline.
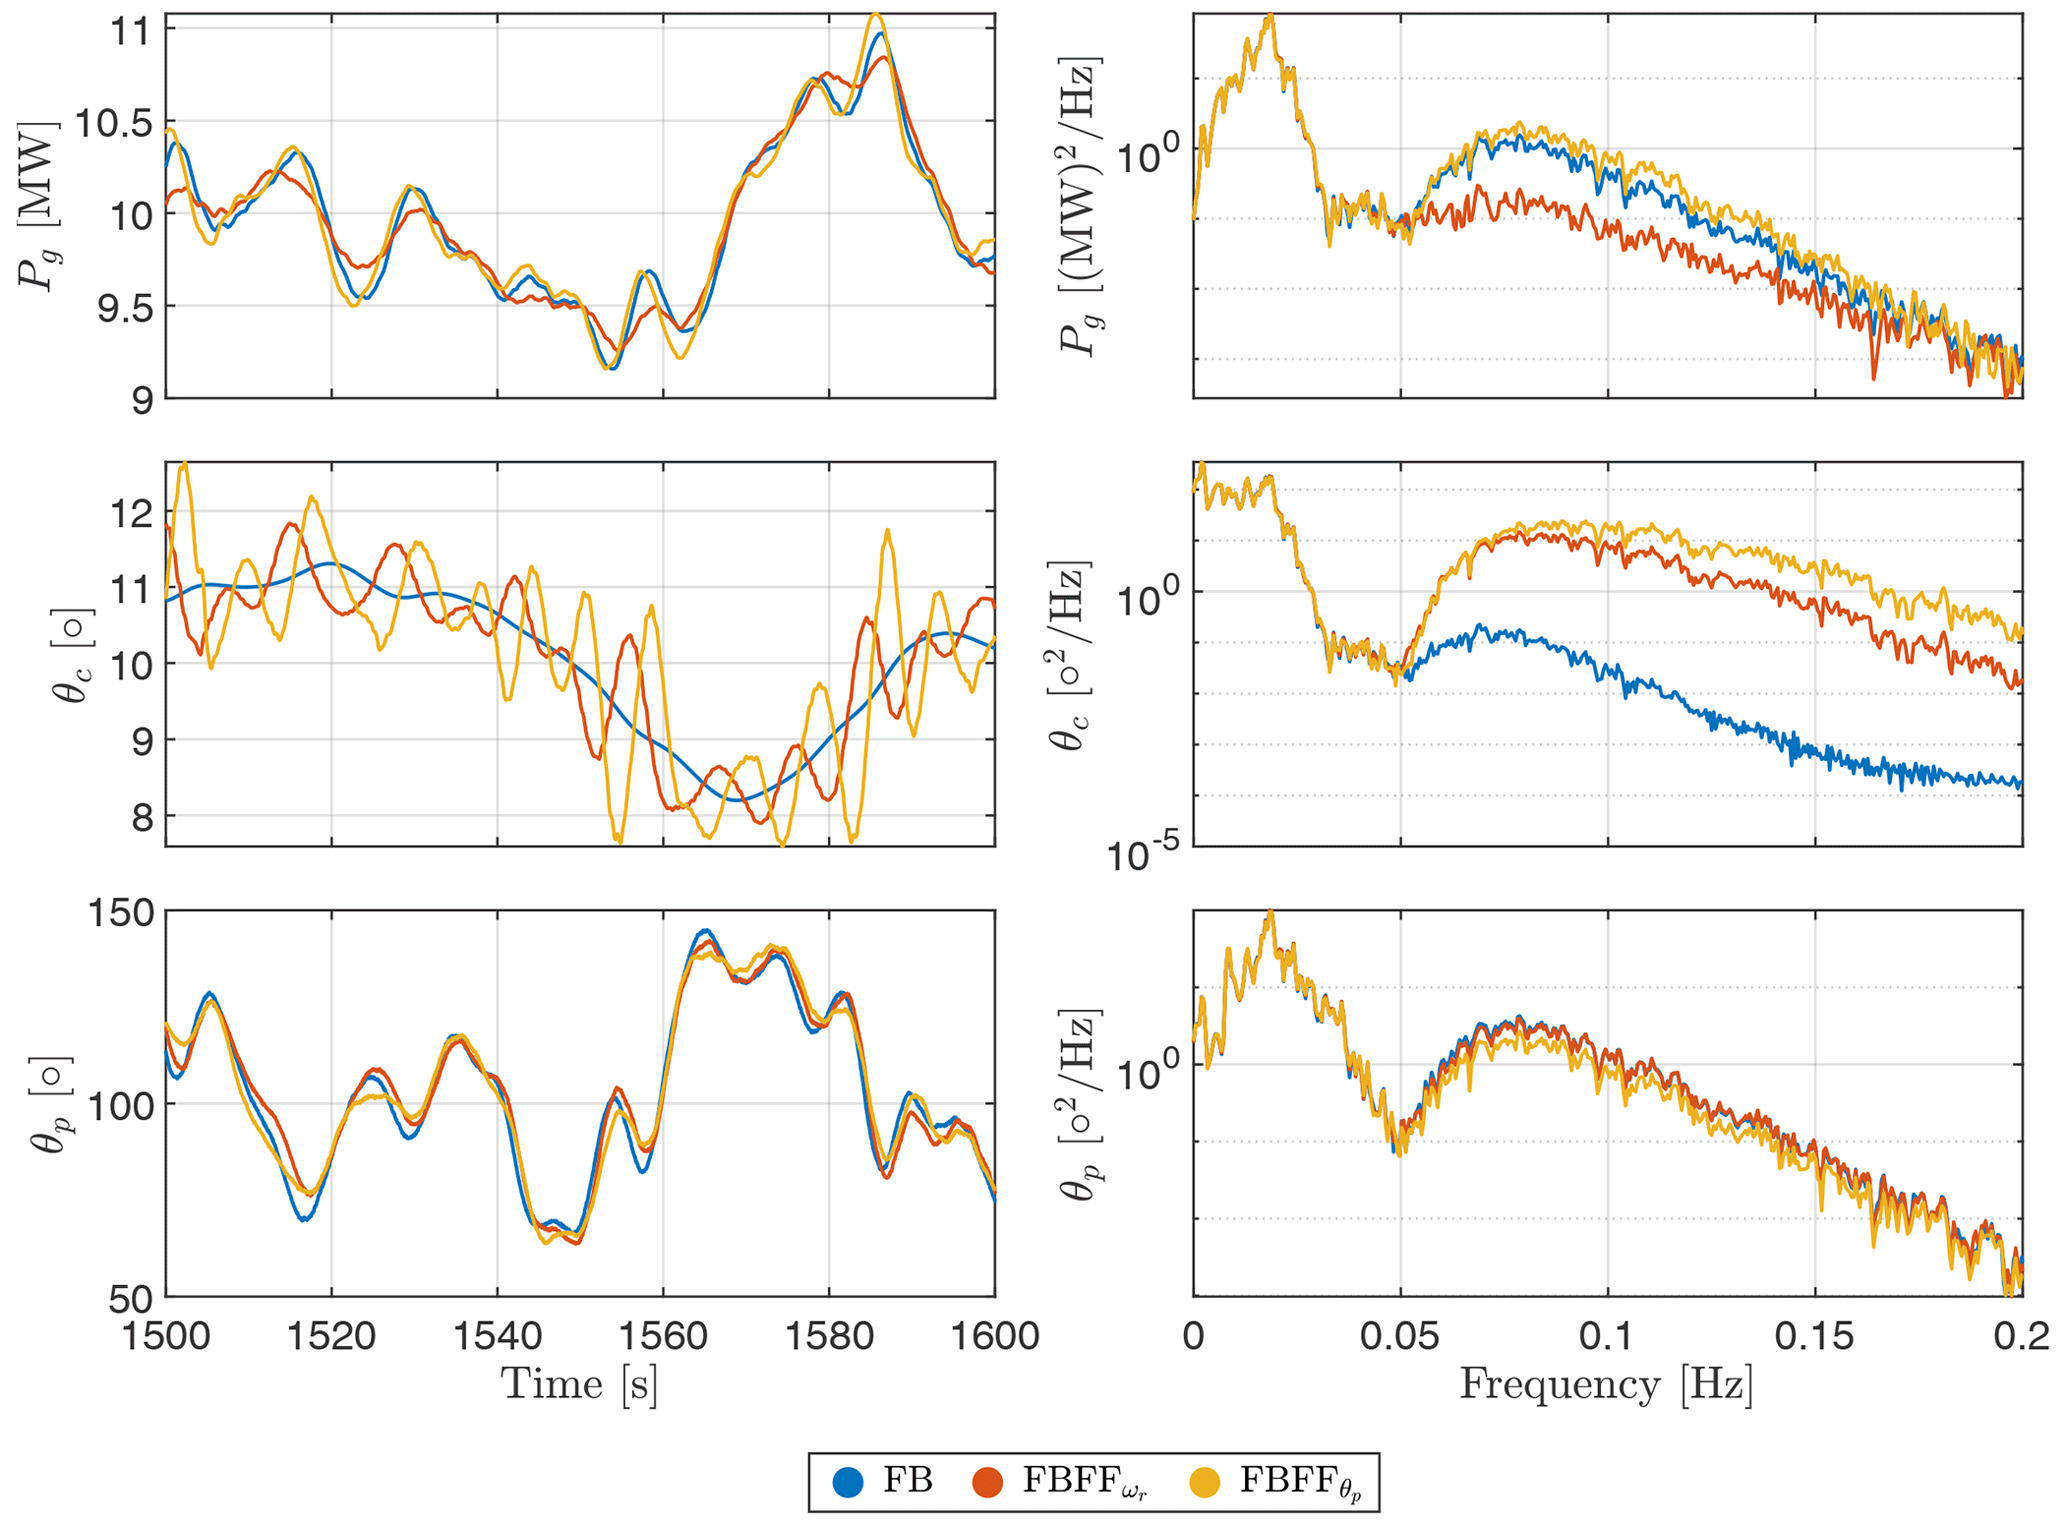
Figure 8Generator power (Pg), blade pitch (θc), and platform pitch (θp) responses with and without wave feedforward control, at a wind speed of V=14 m s−1, TI=7.1 %, and wave conditions of Hs=5 m and Tp=12 s. The two feedforward controllers, for the objectives of power regulation and platform pitch motion reduction, are compared to the baseline feedback controller.
The PSDs in Fig. 8 also show that the reduction in the generator power fluctuations with the FF controller for power regulation is achieved with less blade pitch actuation than the reduction resulting from the FF controller for the platform pitch motion. Therefore, we conclude that the reduction of the platform pitch motion requires a significantly large actuation for a smaller gain relative to the one for power regulation, which is evident in Fig. 8, where the effect of the feedforward controller, FBFF, on the platform motion is minor, unlike the effect of FBFF on the generator power.
In Fig. 9, the standard deviation, as a statistical metric illustrating the variation of a signal about its mean, is used to demonstrate the effect of the FF controllers, since they are expected to counteract the effect of the wave disturbance and, thus, reduce the variance of the generator power and the platform pitch. In fact, Fig. 9 shows the percentage difference between the standard deviation of the signals with and without the FF control, which is normalized with respect to the standard deviation of the baseline feedback controller. As mentioned earlier in Fig. 8, FBFF mitigates the wave effects on the quality of Pg by reducing the variations in ωr, as illustrated in Fig. 9. The variation in θc increases for both FF controllers relative to the baseline case. This indicates that indeed the FF controller is active for both objectives. However, in order for FBFF to achieve its control objective, it requires almost half the blade pitch actuation needed by FBFF to achieve its control objective. As for FBFF, the blade pitch variation about the mean value increases by almost 20 % above the baseline case to achieve its control objective.
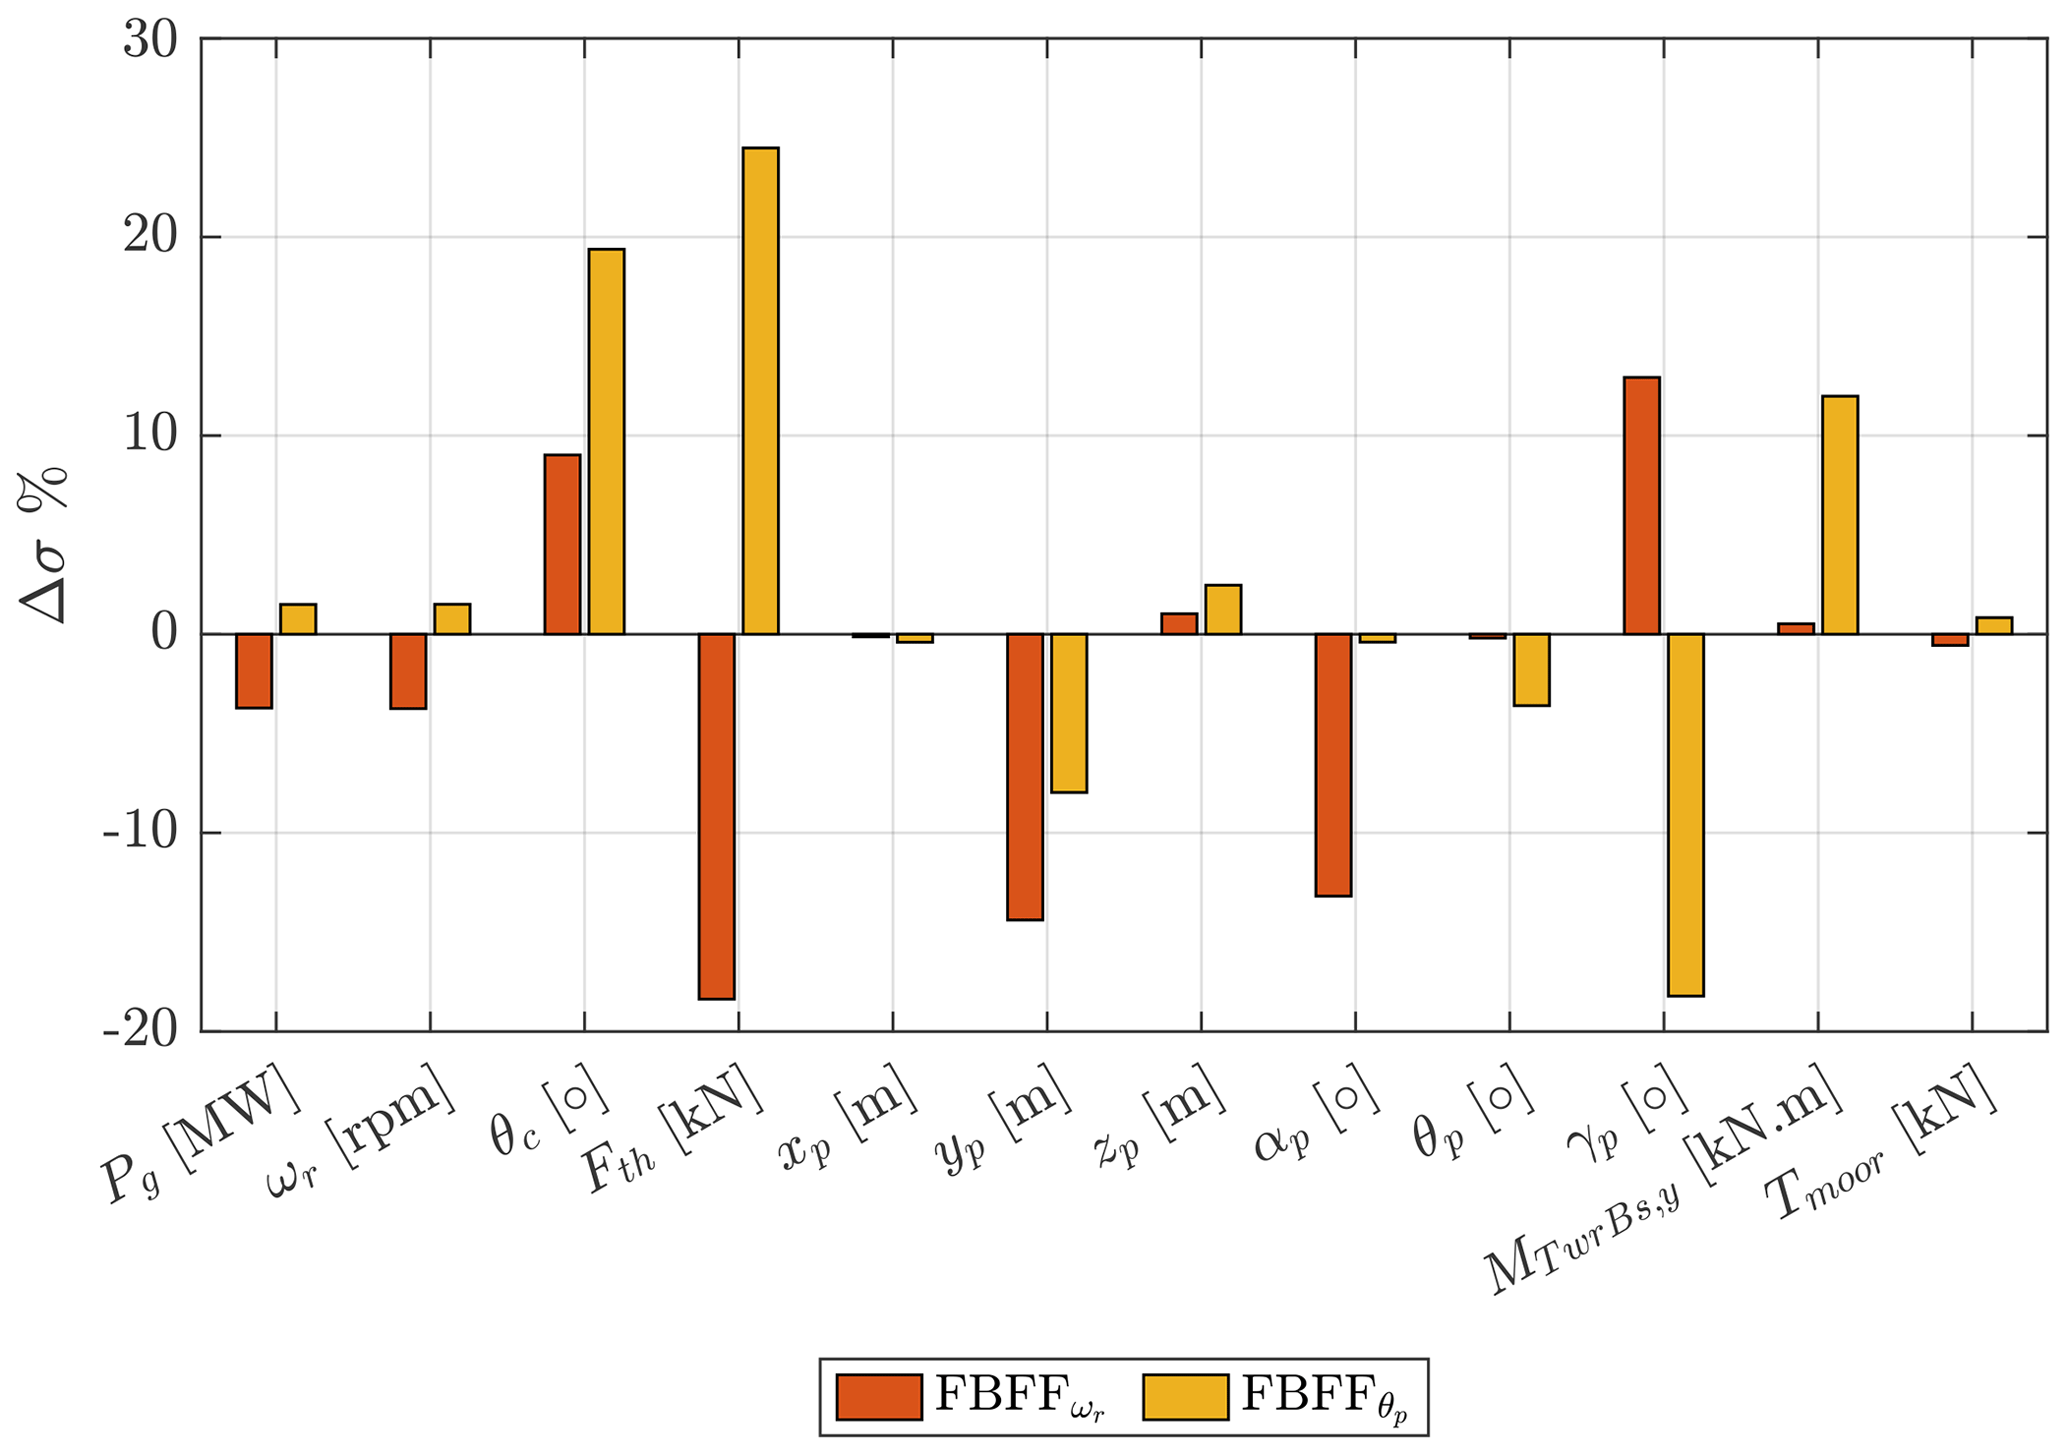
Figure 9Normalized standard deviation percentage change of the two different control modes for different variables with respect to the baseline FB case. All cases were held at a wind speed of V=14 m s−1, with TI=7.1 %, and wave conditions of Hs=5 m, with Tp=12 s.
Even though the blade pitch action is higher with the FF controller than in the FB baseline case, the FF control contribution reduces that of the FB controller, as it does not need to react to the wave disturbance anymore since the FF is taking care of that. The variation of the total thrust force varies for both objectives, as for the FBFF, the thrust variance decreases below the baseline, which is not the case for FBFF. The thrust variation is reduced as a result of more blade pitching by FBFF in order to regulate the rotor speed, while for FBFF, thrust is varied continuously to keep the platform pitch motion as minimal as possible.
Regarding the platform motion, we can say that the FF control in general has a positive effect on the platform motions as we see a reduction for both control objectives in most of the degrees of freedom (DOFs). Now that might vary from one DOF to another as we can see, for instance, there is a minor reduction in the surge, xp, and pitch, θp, DOFs, while there is a significant reduction in sway, yp, and roll, αp, DOFs. For heave, zp, and yaw, γp, DOFs, FBFF and FBFF lead to more oscillations, while their effect differs when it comes to yaw DOFs. As FBFF increases oscillations in platform yaw, FBFF reduces those fluctuations significantly. This is an extra effect of FBFF since it was designed to mitigate the platform pitch, θp, oscillations only. FBFF hardly affects the tower-base bending moment, MTwrBs,y, as an insignificant increase is observed, which is not the case for FBFF, which leads to more tower-base loading. Regarding the mooring tension, Tmoor, both FBFF and FBFF affect the mooring tension slightly, as FBFF leads to a small reduction in the tension oscillation, while FBFF causes a slight increase in the mooring tension.
According to Fig. 9, not only does the platform motion alleviation objective require large actuation effort, but also it increases the tower-base bending moment, unlike the power regulation objective. As a result, we proceeded with the FF control for power regulation, FBFF, for the rest of the study.
4.2 Effect of turbulence intensity variation
After showing the potential of FF control for both objectives and observing that the platform pitch motion reduction FF control requires large actuation, the remaining experimental results are based on the power regulator FF. We start with investigating the effectiveness of the FF controller while varying the turbulent intensity. The experimental results at a wind speed of 14 m s−1 were chosen for this discussion. Figures 10–12 clearly illustrate the performance of the FF control. In Fig. 10 the effect of waves on the generator power is reduced compared to the FB-only cases, as there is a reduction at all the turbulent intensities, within the wave frequency range (0.05–0.2 Hz). This is depicted in the PSD of Fig. 10, where the addition of FF control reduces the energy within the wave energy band. However, it has no effect within the low-frequency band corresponding to wind turbulence, which is to be expected since the controller's bandwidth is targeting the wave frequency range only.
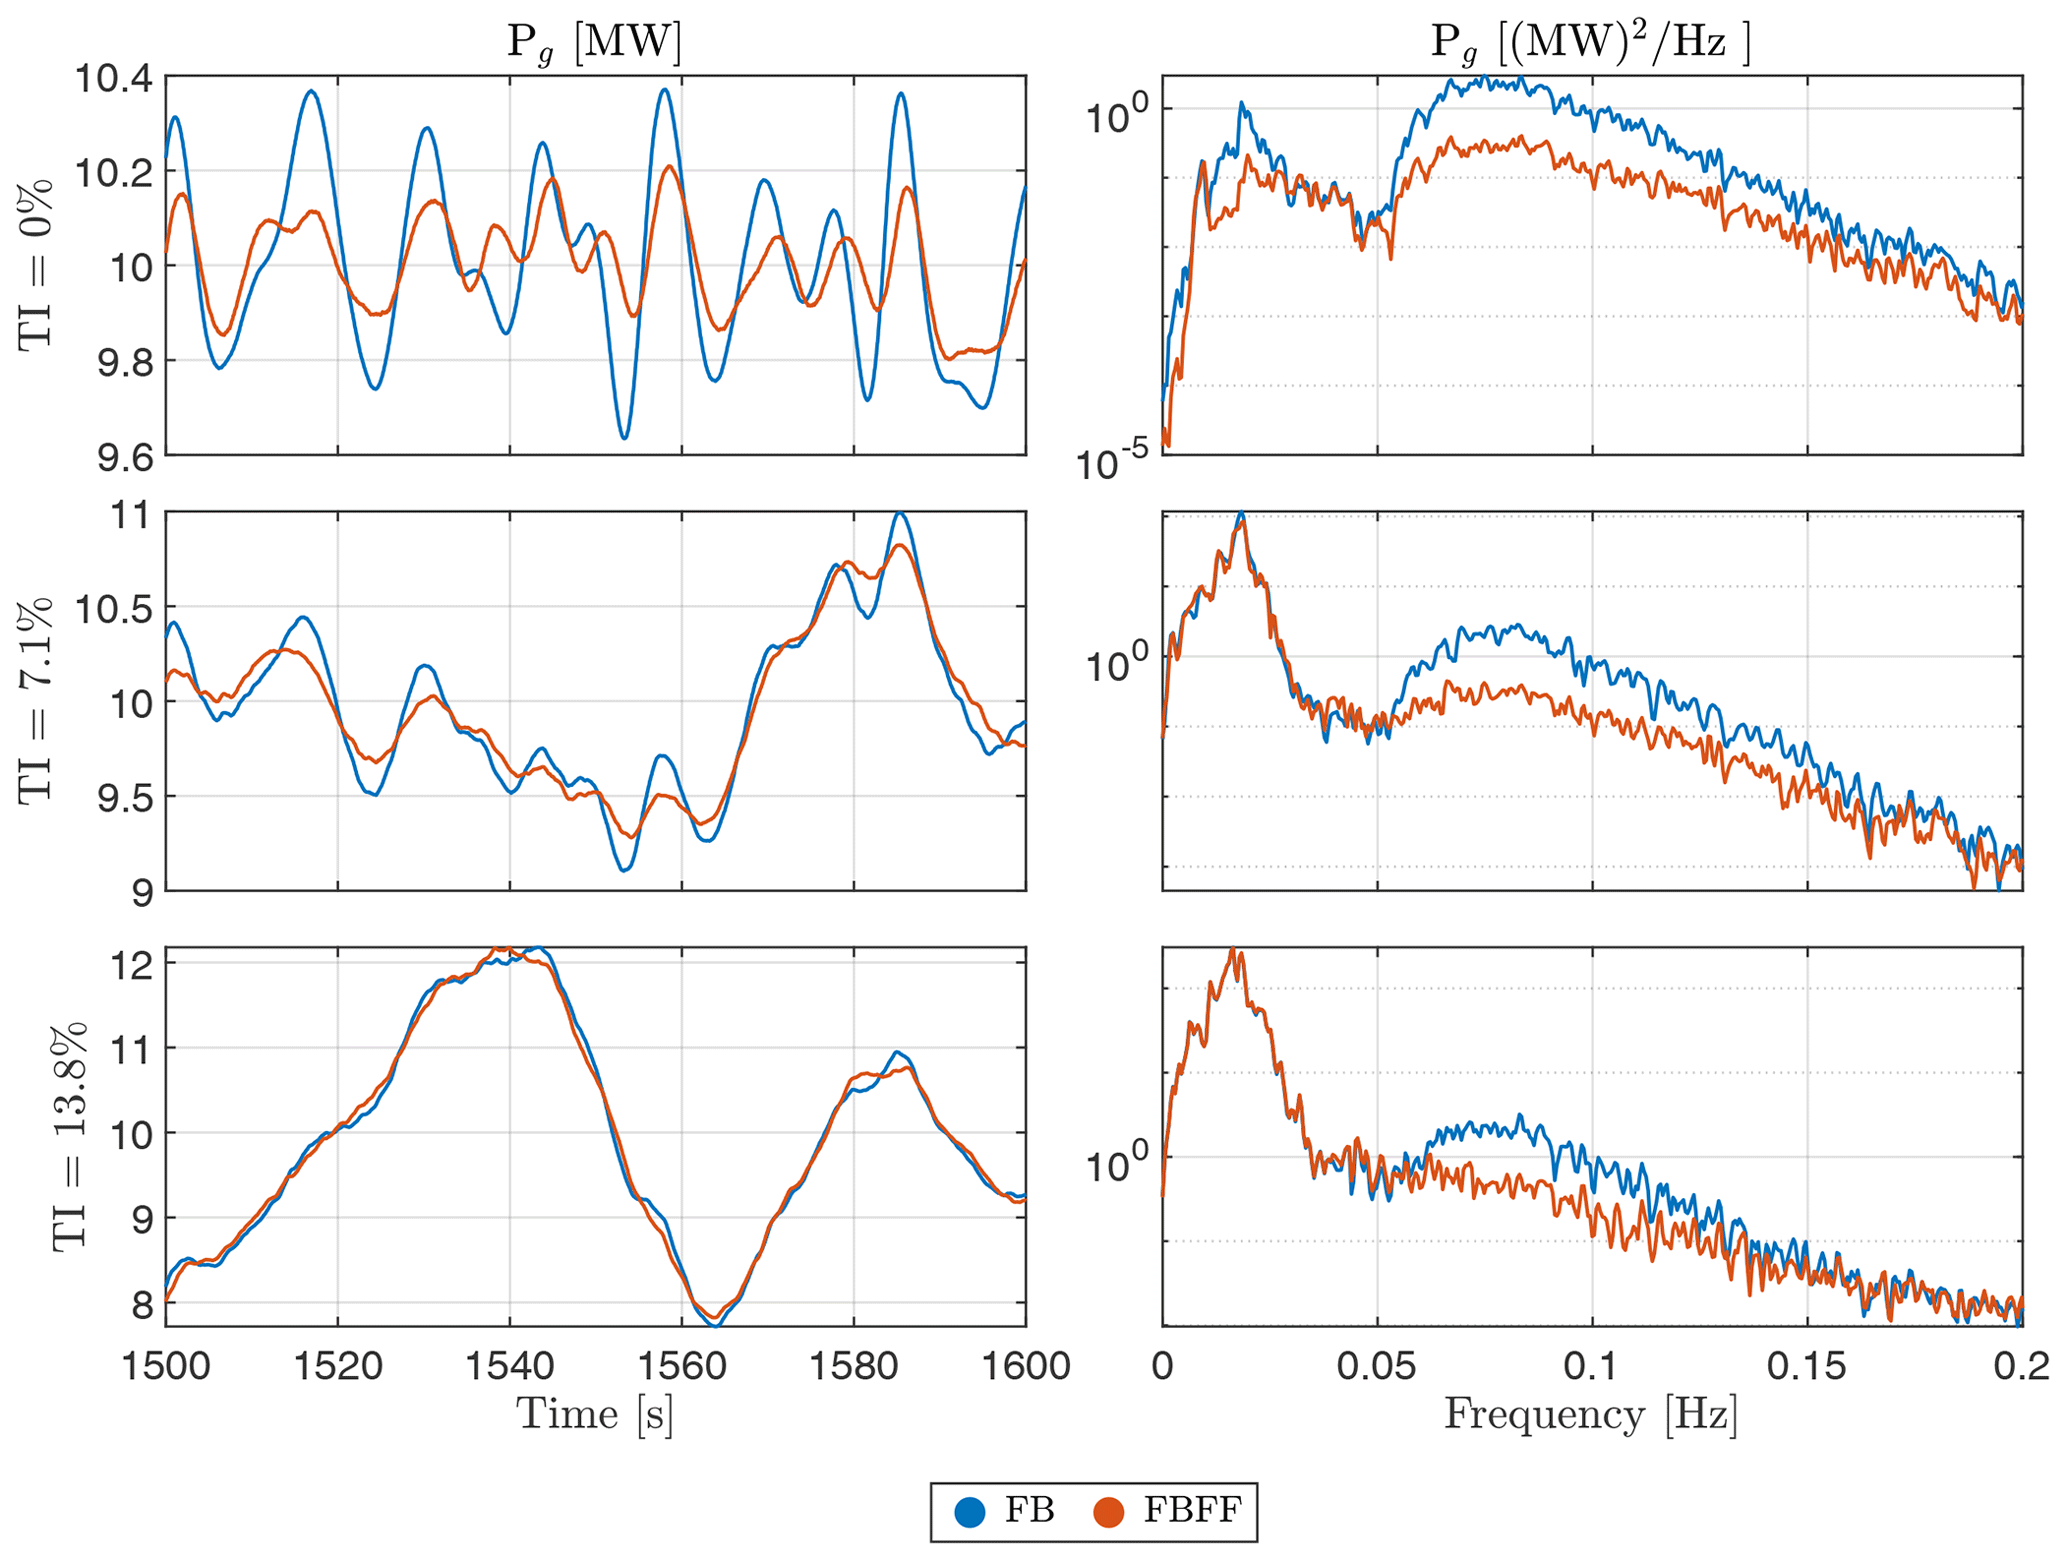
Figure 10Generator power response with and without wave feedforward control, at V=14 m s−1, varying from steady wind at 0 % TI to turbulent wind at TI=7.1 % and 13.8 %.
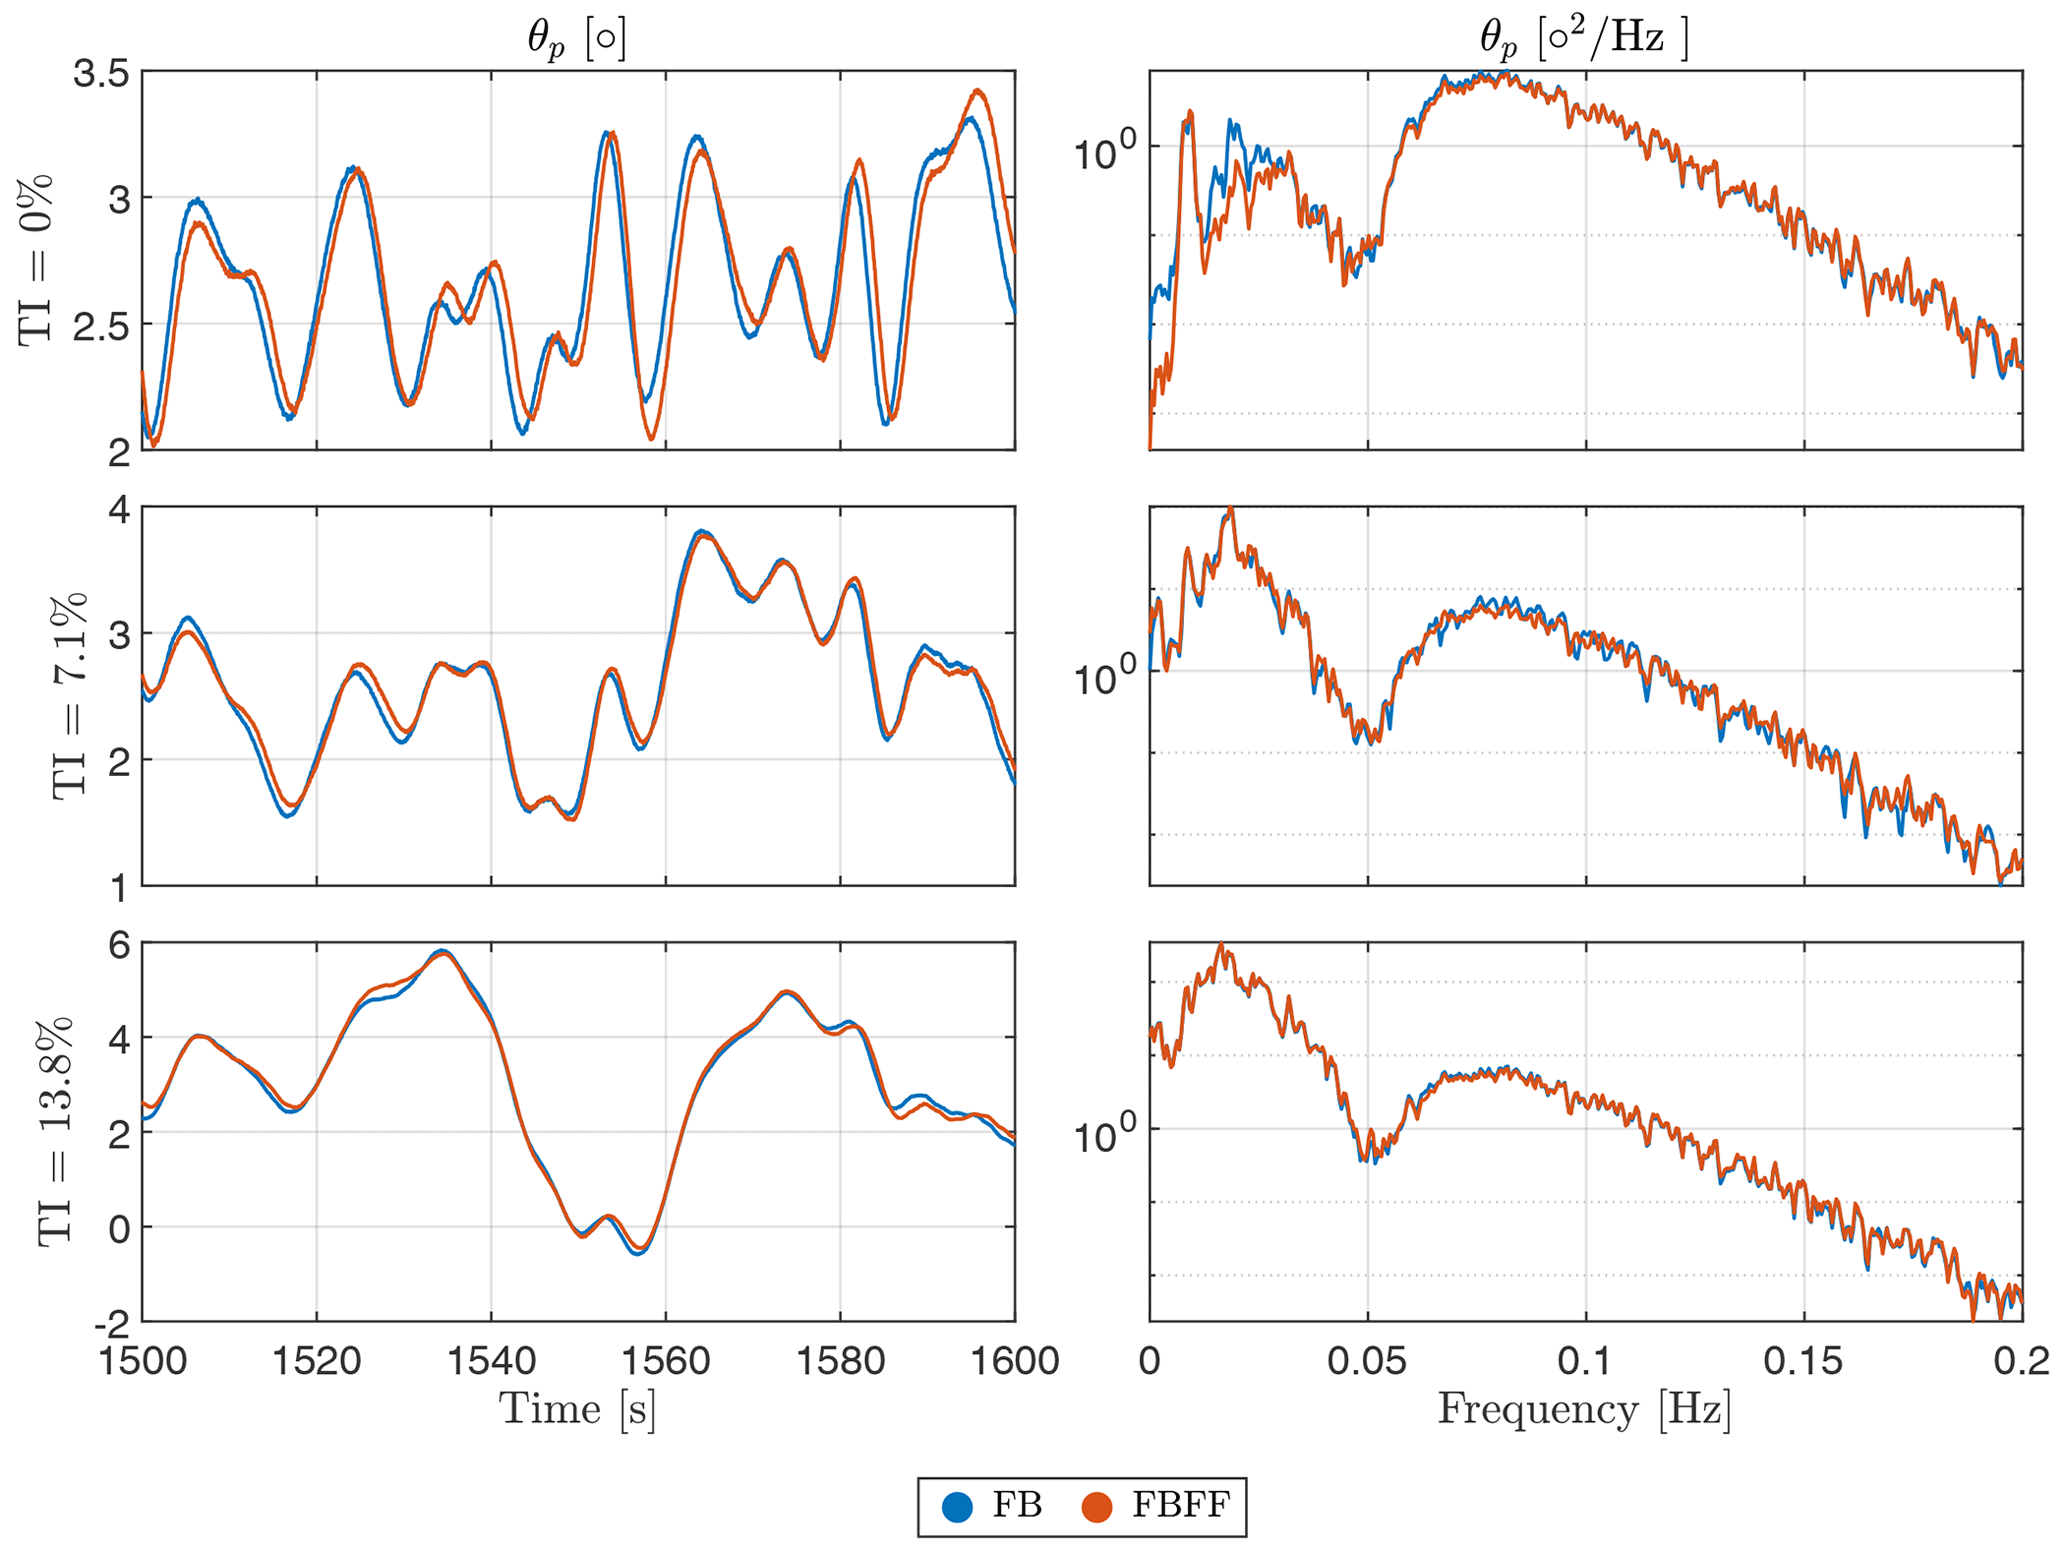
Figure 11Platform pitch response with and without wave FF control, at a wind speed of V=14 m s−1, varying from steady wind at 0 % TI to turbulent wind at a TI of 7.1 % and 13.8 %.
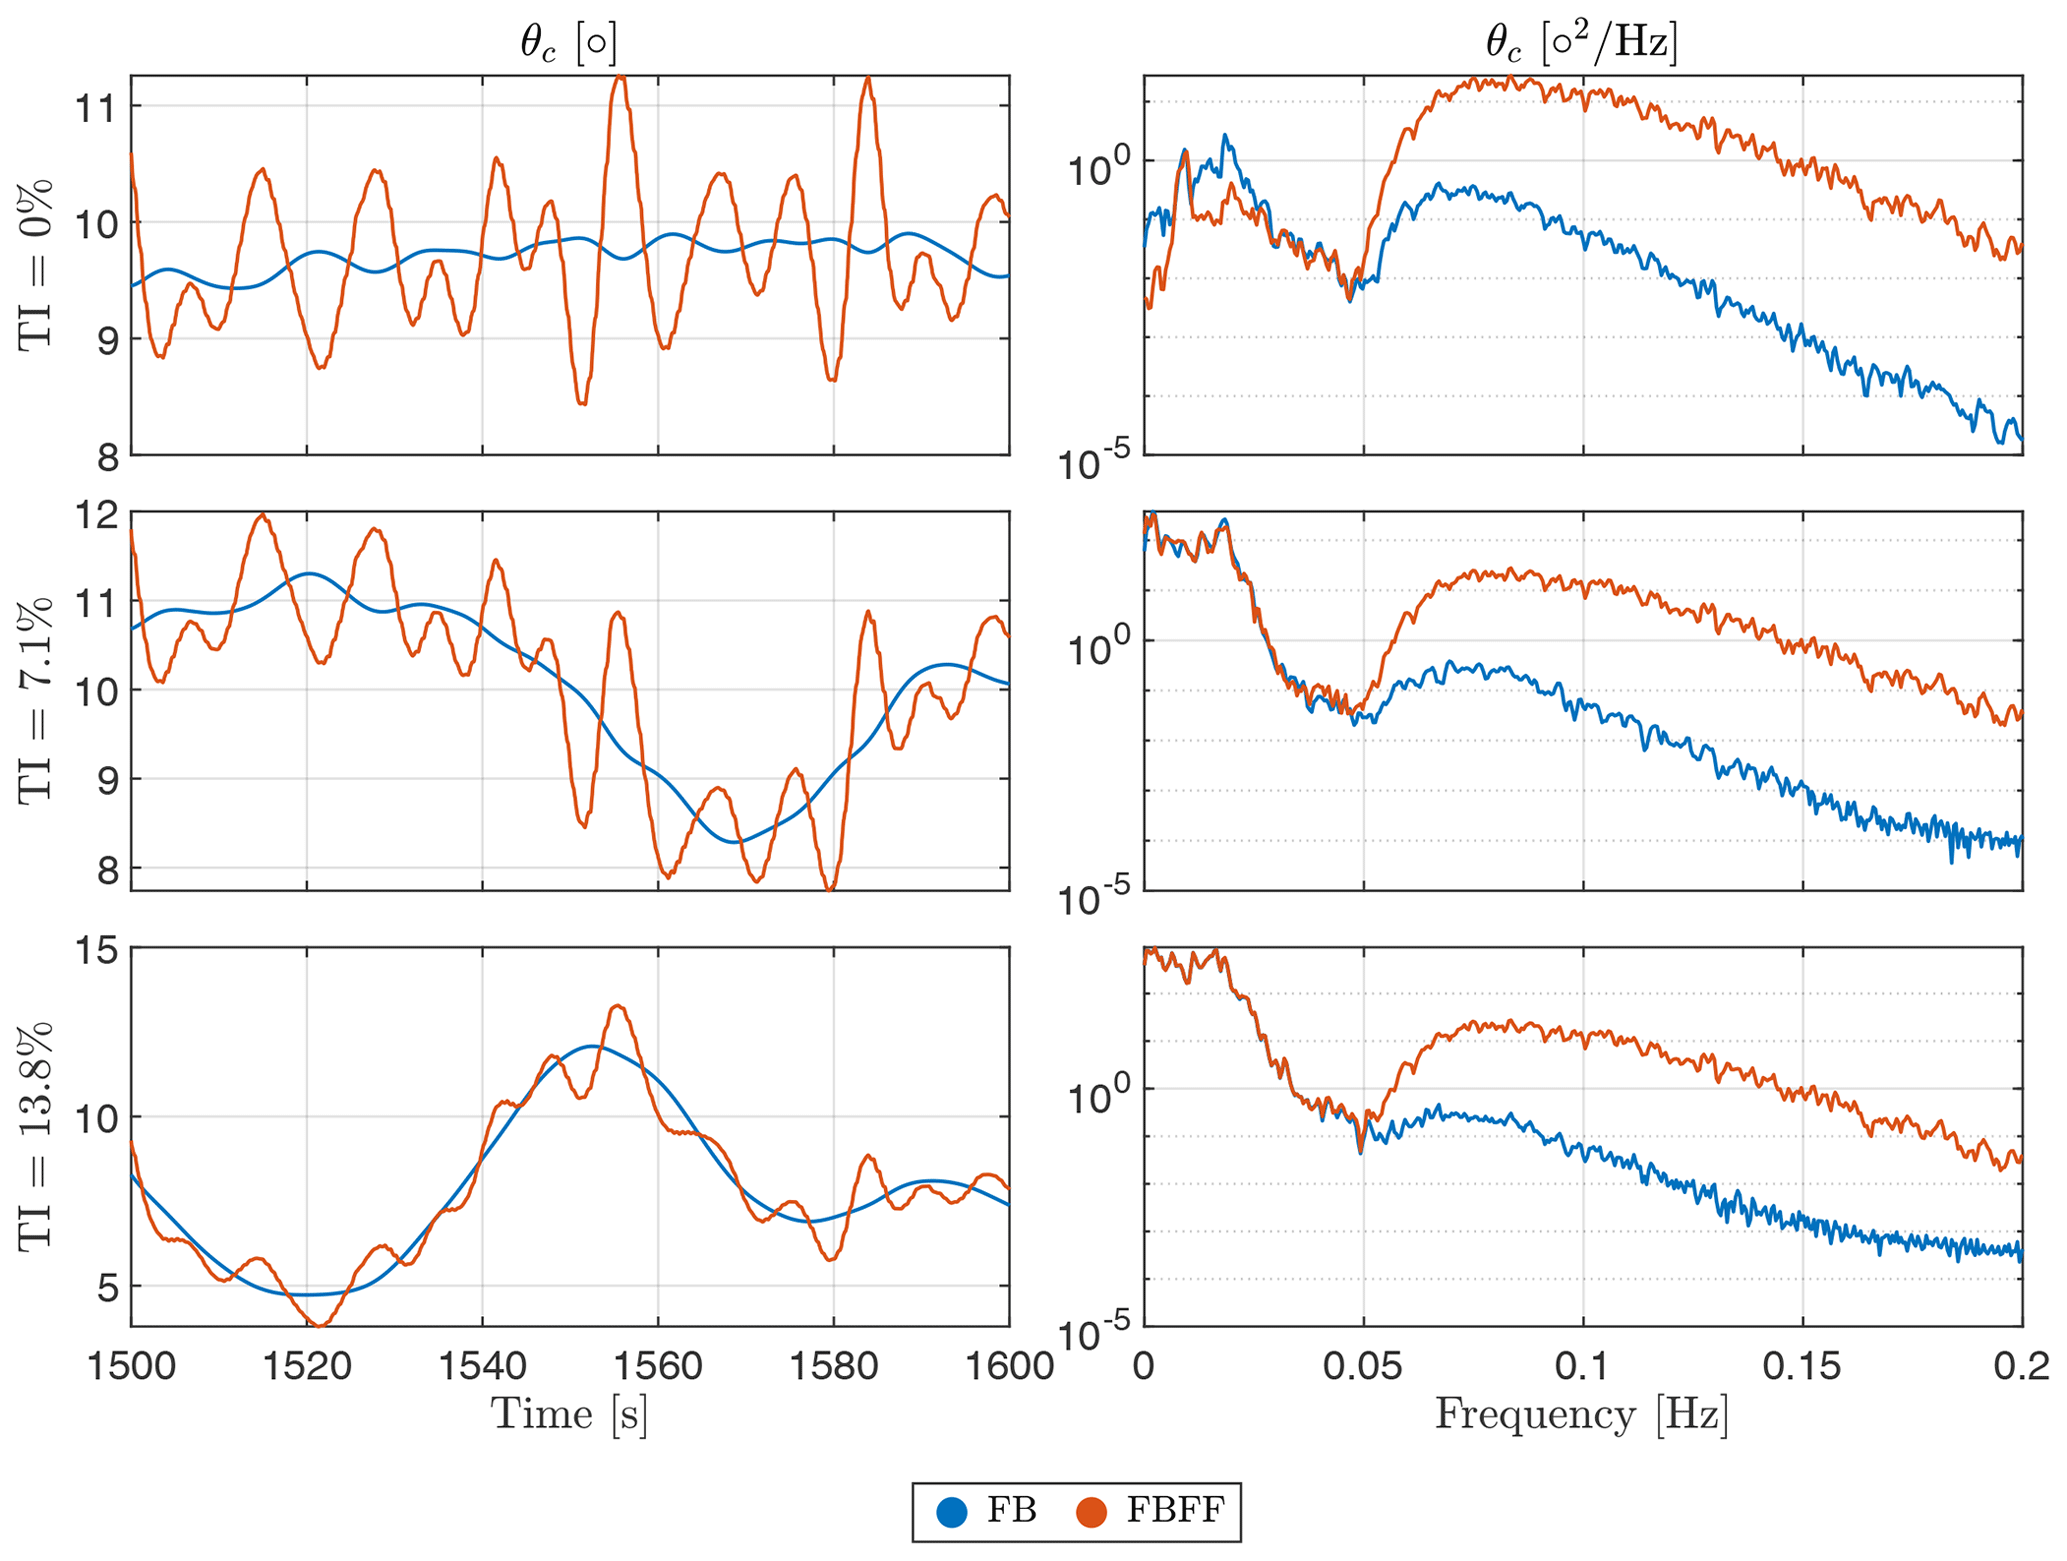
Figure 12Collective blade pitch angle with and without wave FF control, at a wind speed of V=14 m s−1, varying from steady wind at 0 % TI to turbulent wind at a TI of 7.1 % and 13.8 %.
Increasing the turbulence intensity has a direct effect on increasing the variance of the depicted signals. In steady wind, we can clearly observe how the time traces are dominated by the high-frequency sinusoids, relevant to the wave frequency band, while the low-frequency sinusoids, relevant to wind turbulence, dominate as the TI increases. This leads to increasing the peak-to-peak value about the mean of the signal, indicating an increase in the variance of the signal. This can also be confirmed by the PSD, where there is more spectral content in the low-frequency bandwidth than the bandwidth related to the waves. In steady wind, we can observe a reduction in the generator power variation as a result of using wave FF control. However, once the wind inflow becomes more realistic and wind turbulence increases, the reduction in the generator power oscillations is not as significant. This indicates that the wind turbulence, lying in the low-frequency band, dominates the global dynamic response even though the wave FF controller is taking care of oscillations caused by the waves in the high-frequency band.
Figure 11 illustrates the platform pitch response at different turbulence intensities. In Fig. 11, we see that the FF controller has no authority on the platform motions in the wave band, which is reasonable since this controller is mainly aimed at reducing power fluctuations. Also, for the TI effect, we see a clear domination of the wind turbulence.
As for the collective blade pitch angle in Fig. 12, the pitch actuator is clearly active in the wave frequency range with the FF control compared to the FB controller. We see that the FB controller is only reacting to the low-frequency wind turbulence while not considering the wave disturbance because of the negative damping implications that would happen if the bandwidth of the FB controller were increased (Nielsen et al., 2006; Larsen and Hanson, 2007; Jonkman, 2008; van der Veen et al., 2012; Fischer, 2013; Fleming et al., 2014; Hegazy et al., 2023a). Moreover, it is observed that the peak-to-peak value of the FBFF control signal decreases as the turbulence intensity increases. This indicates that in steady wind, the blade pitch actuator varies at a higher rate than in turbulent wind, and the higher the turbulence, the less the blade pitch variation. This is depicted and discussed in Fig. 13.
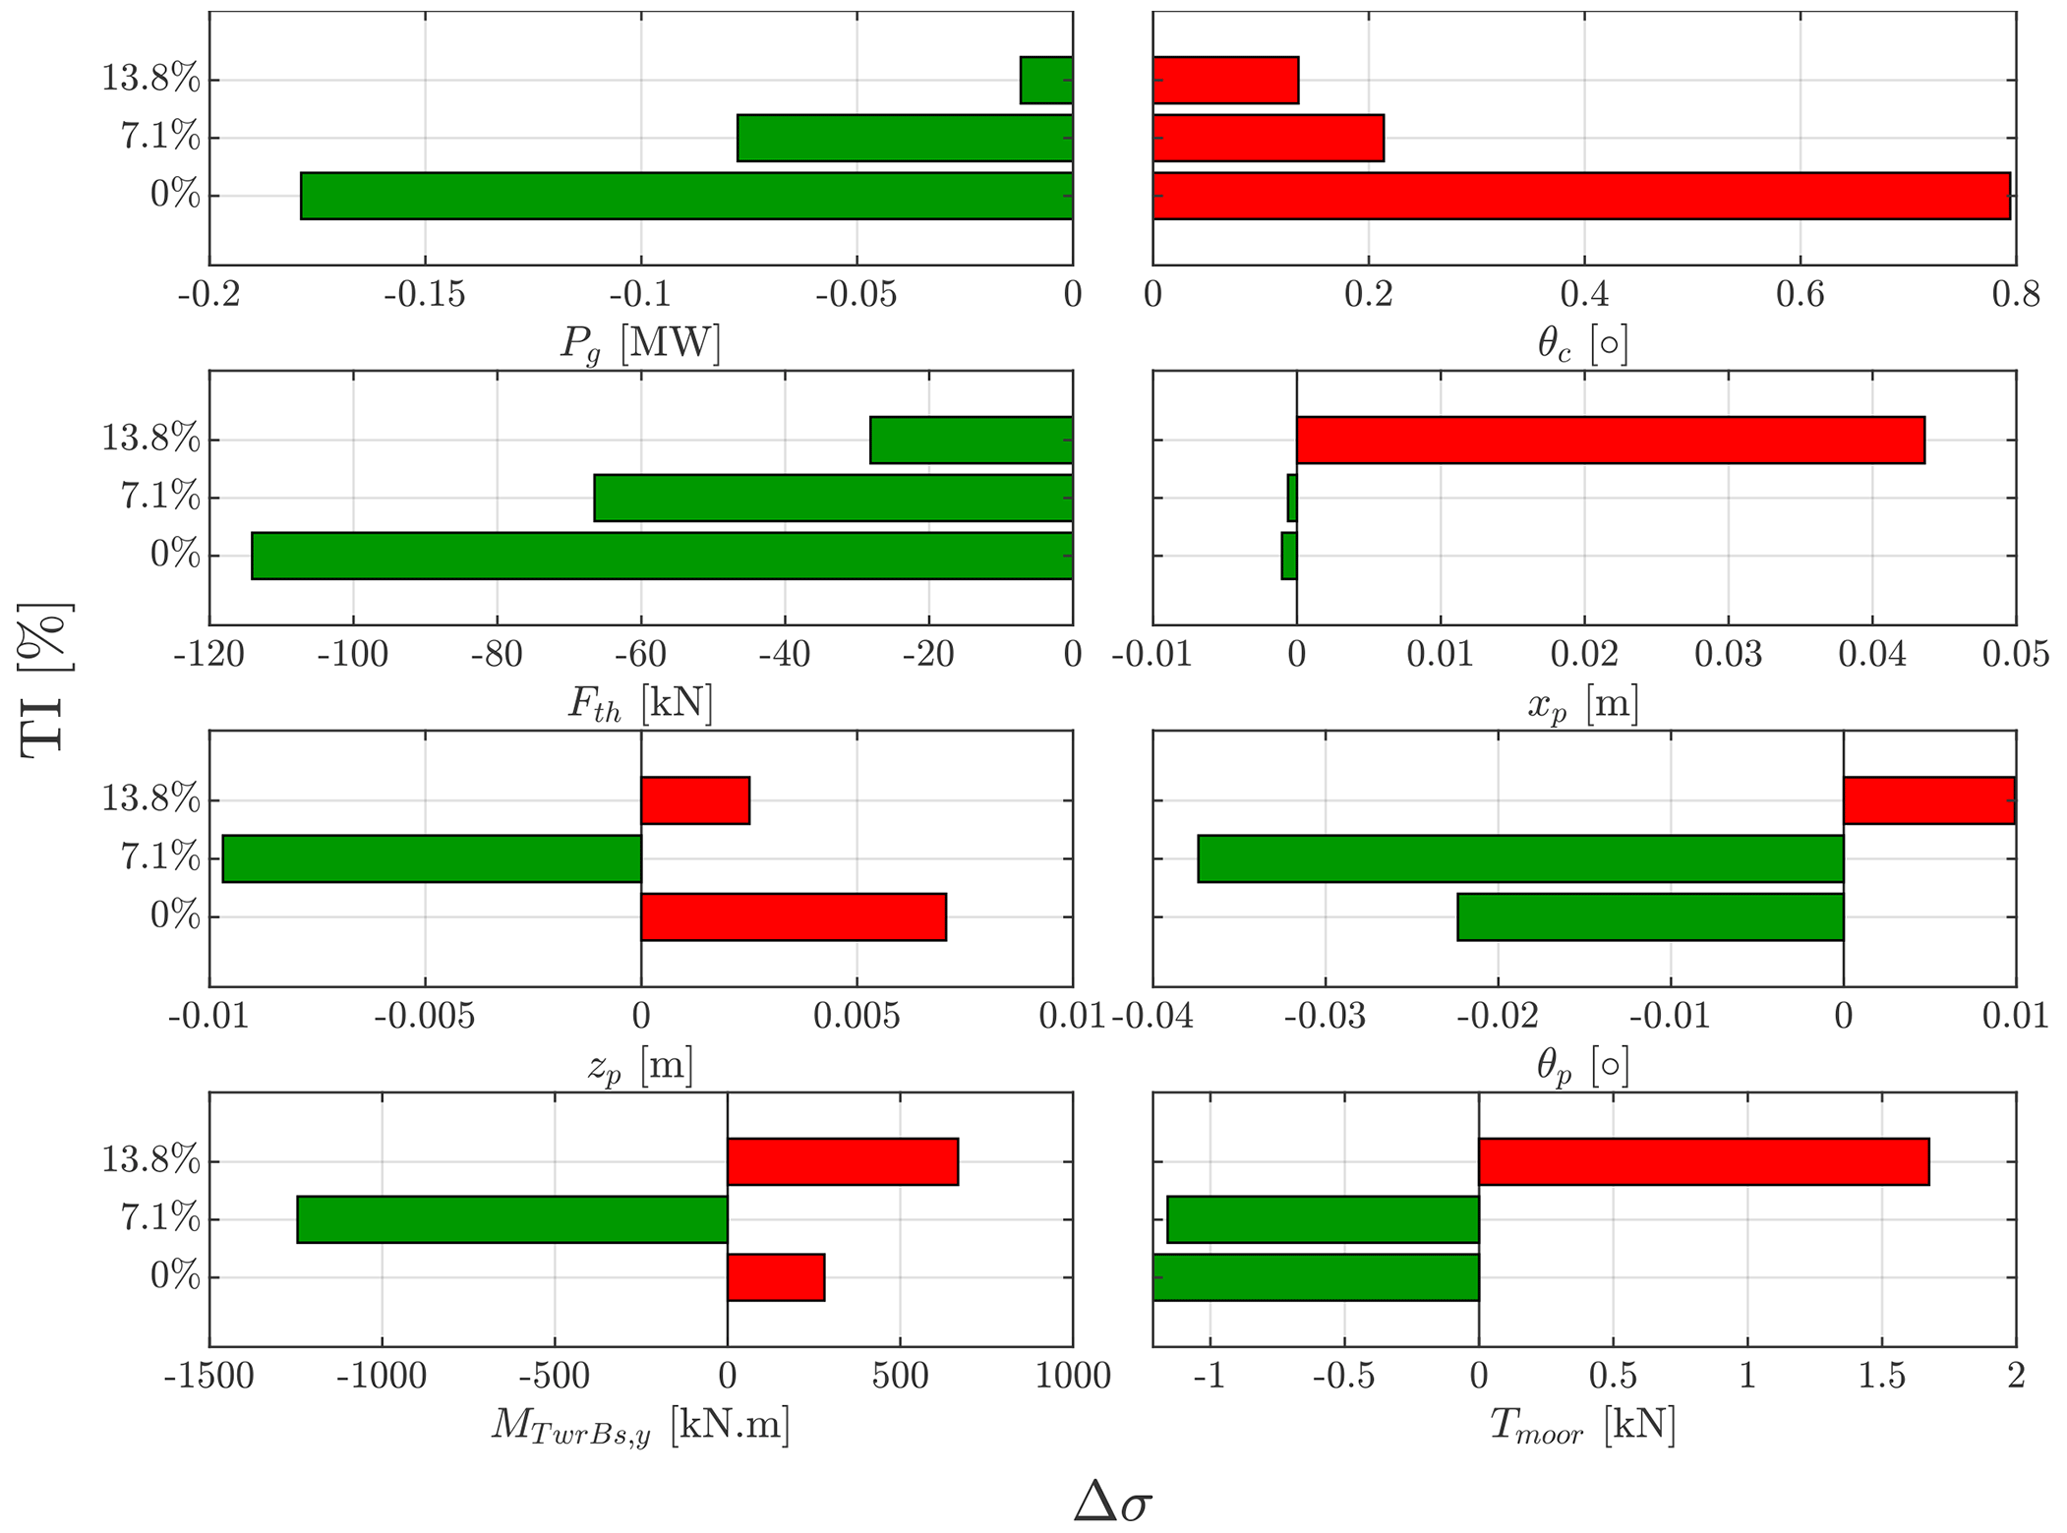
Figure 13Standard deviation change with wave FF control relative to the baseline feedback control, at a wind speed of V=14 m s−1, varying from steady wind at 0 % TI to turbulent wind at a TI of 7.9 % and 13 %.
The standard deviation (SD) of the signals is used to quantify the effect of the FF control on the different variables of interest as shown in Fig. 13. It is fair to mention that the figure illustrates the difference between the FF control and the baseline FB controller in a steady wind case. The effect of including FF control can already be seen as the main objective of the FF controller is to regulate the generator power, Pg. However, the focus in this subsection is on the effectiveness of the FF strategy under different wind inflow turbulent intensity conditions. It is striking to see how the wind dominates the waves as the turbulence intensity increases, as the reduction in the generator power fluctuations decreases with the increase in the turbulence intensity. Thus, we can conclude that the FF strategy is indeed effective in improving the power quality, but as the turbulence intensity increases, the effectiveness of the FF diminishes. Furthermore, the effect of the turbulence intensity on the platform motion varies from one DOF to another, and there is no clear trend for the different DOFs.
4.3 Effect of significant wave height variation
Varying the significant wave height has, without a doubt, effects on the FF control performance. As the disturbance, TF accounts for the mapping from the wave excitation forces, as a disturbance input, to the rotor speed. By wave excitation forces, we are referring to the first-order wave forces based on linear wave theory (Newman, 2018), where there is a direct transfer from the wave height to the first-order wave excitation forces through the transfer functions known as the response amplitude operators (RAOs). To have a deeper look at this subject, different wave conditions were applied, where different significant wave heights were considered while keeping both the peak period and the wind speed constant. This is in addition to having long-crested unidirectional waves (i.e., s=∞). The peak period was kept constant because the natural periods are very large compared to the waves (>30 s). The motion RAOs are hence quite low, in particular on a spar, which is known to have small wave-induced motions. Therefore, there would be only a very limited effect of varying the peak period across the typical peak periods of ocean waves.
Looking at Fig. 14, apart from the FF control operating as expected, we can see how the amplitude of the generator power oscillations at the wave frequencies increases as waves get bigger, which corresponds to an increase in energy in the PSDs for the corresponding signals. This rise in amplitude can also be observed in the blade pitch signal to maintain the rotor speed as close to its rated value as possible as demonstrated in Fig. 15.
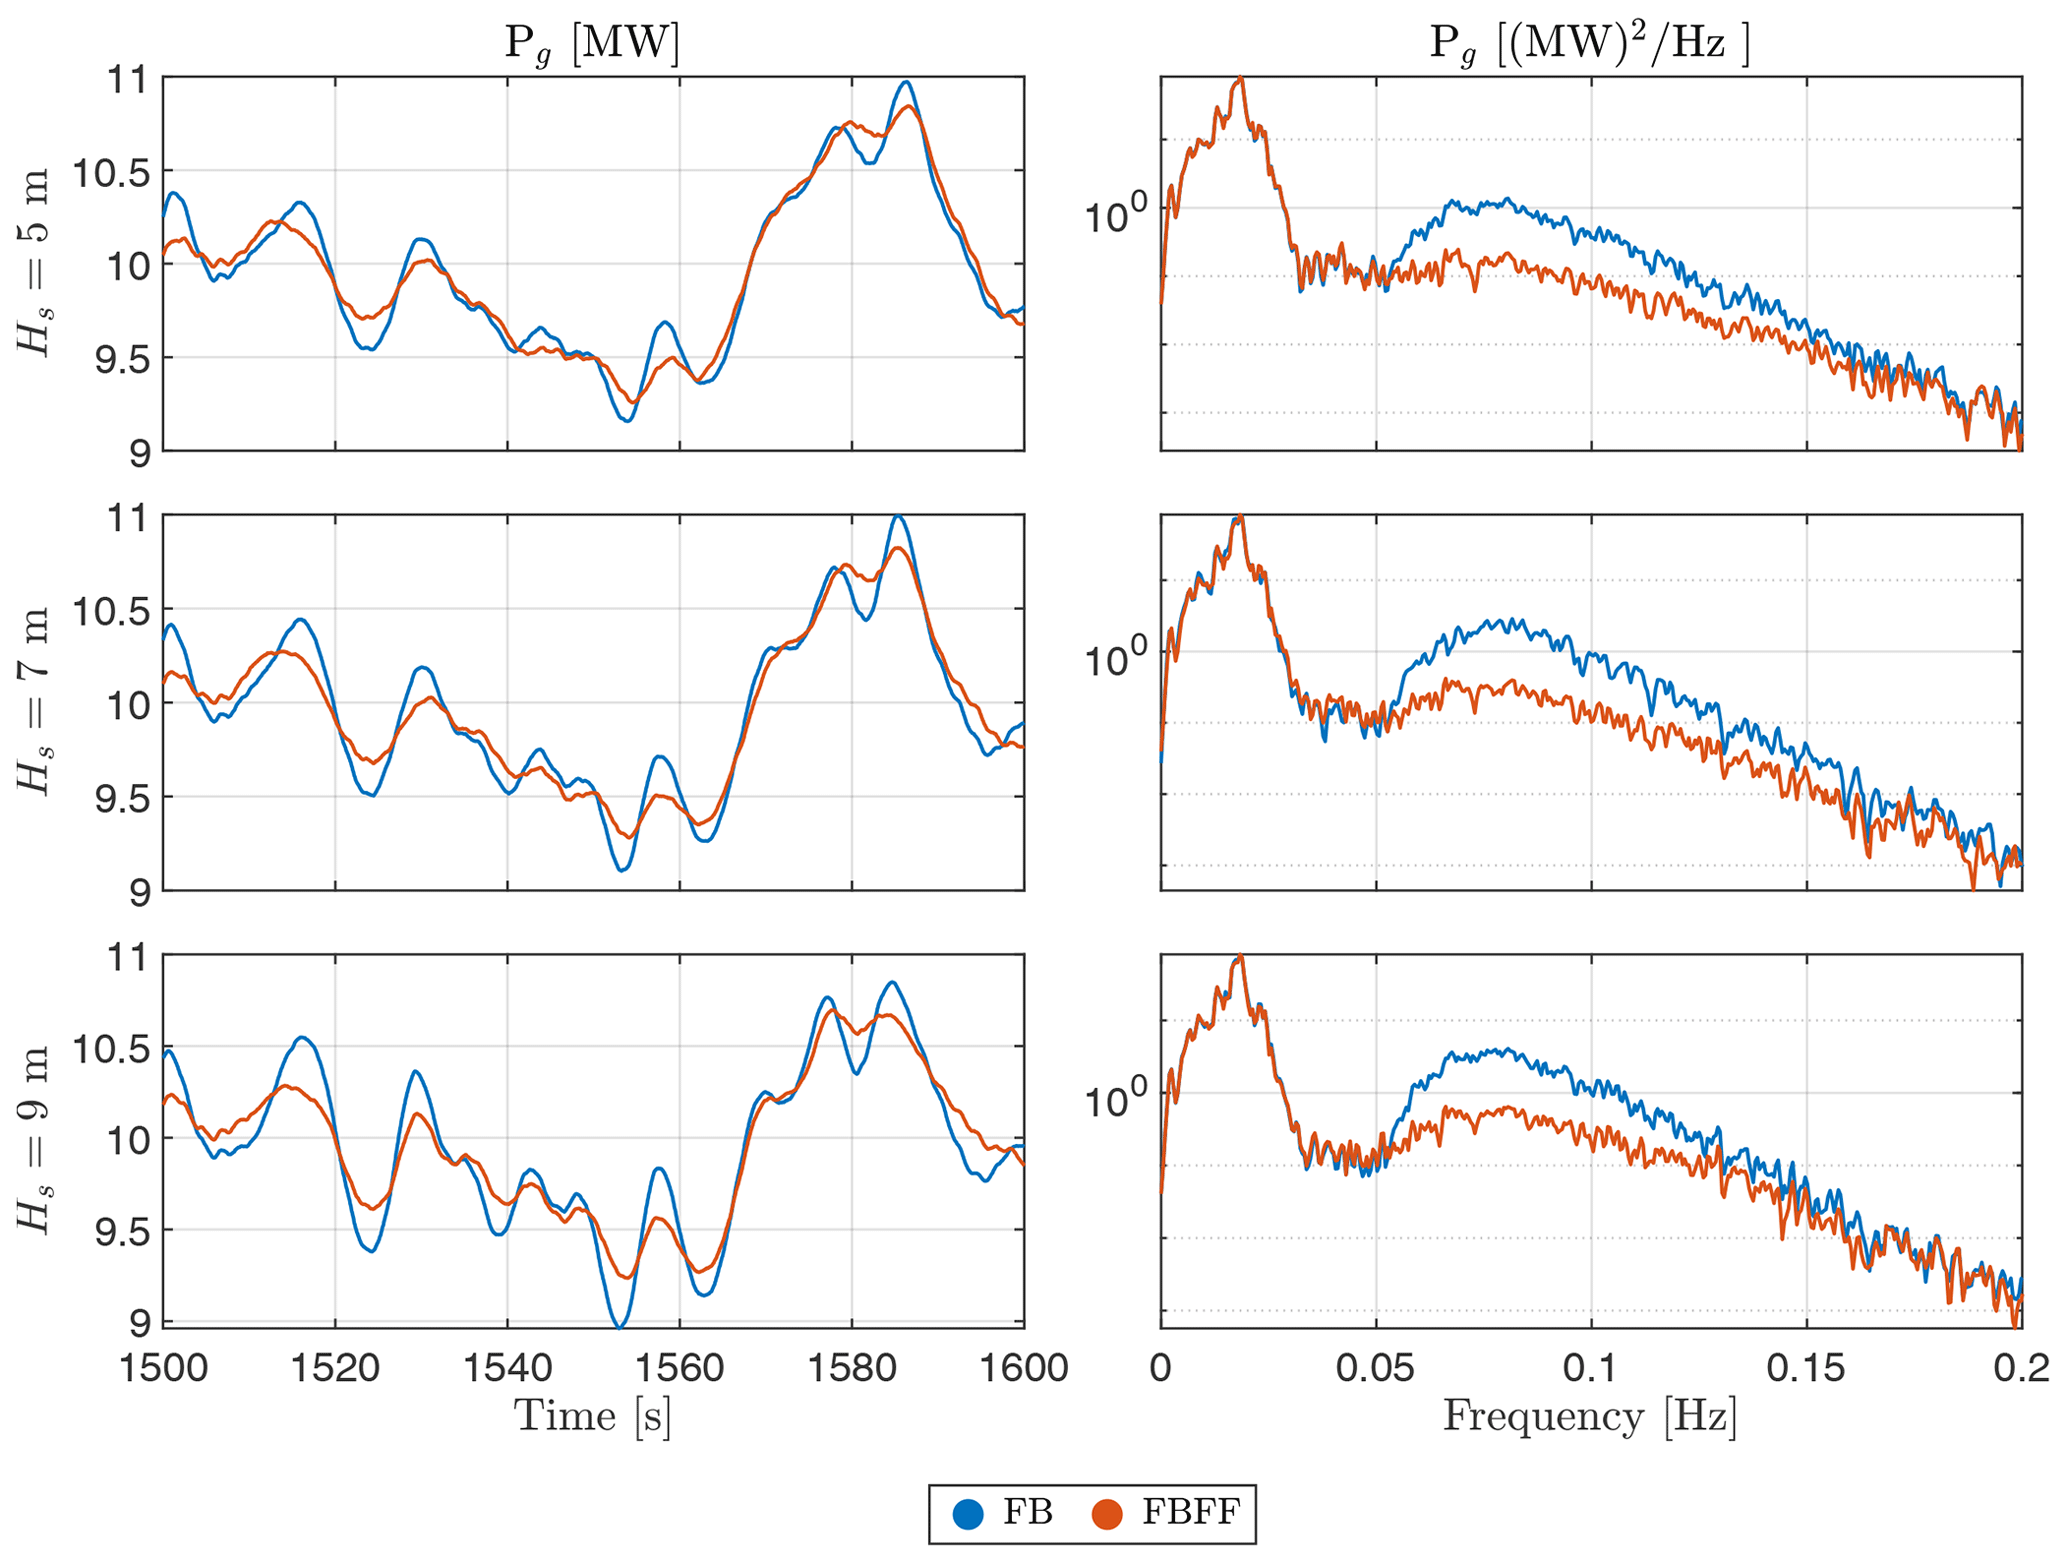
Figure 14Generator power responses with and without wave FF control, at a turbulent wind speed of V=14 m s−1 with TI=7.1 %, and unidirectional waves at s=∞ and Tp=12 s but at different significant wave heights, Hs.
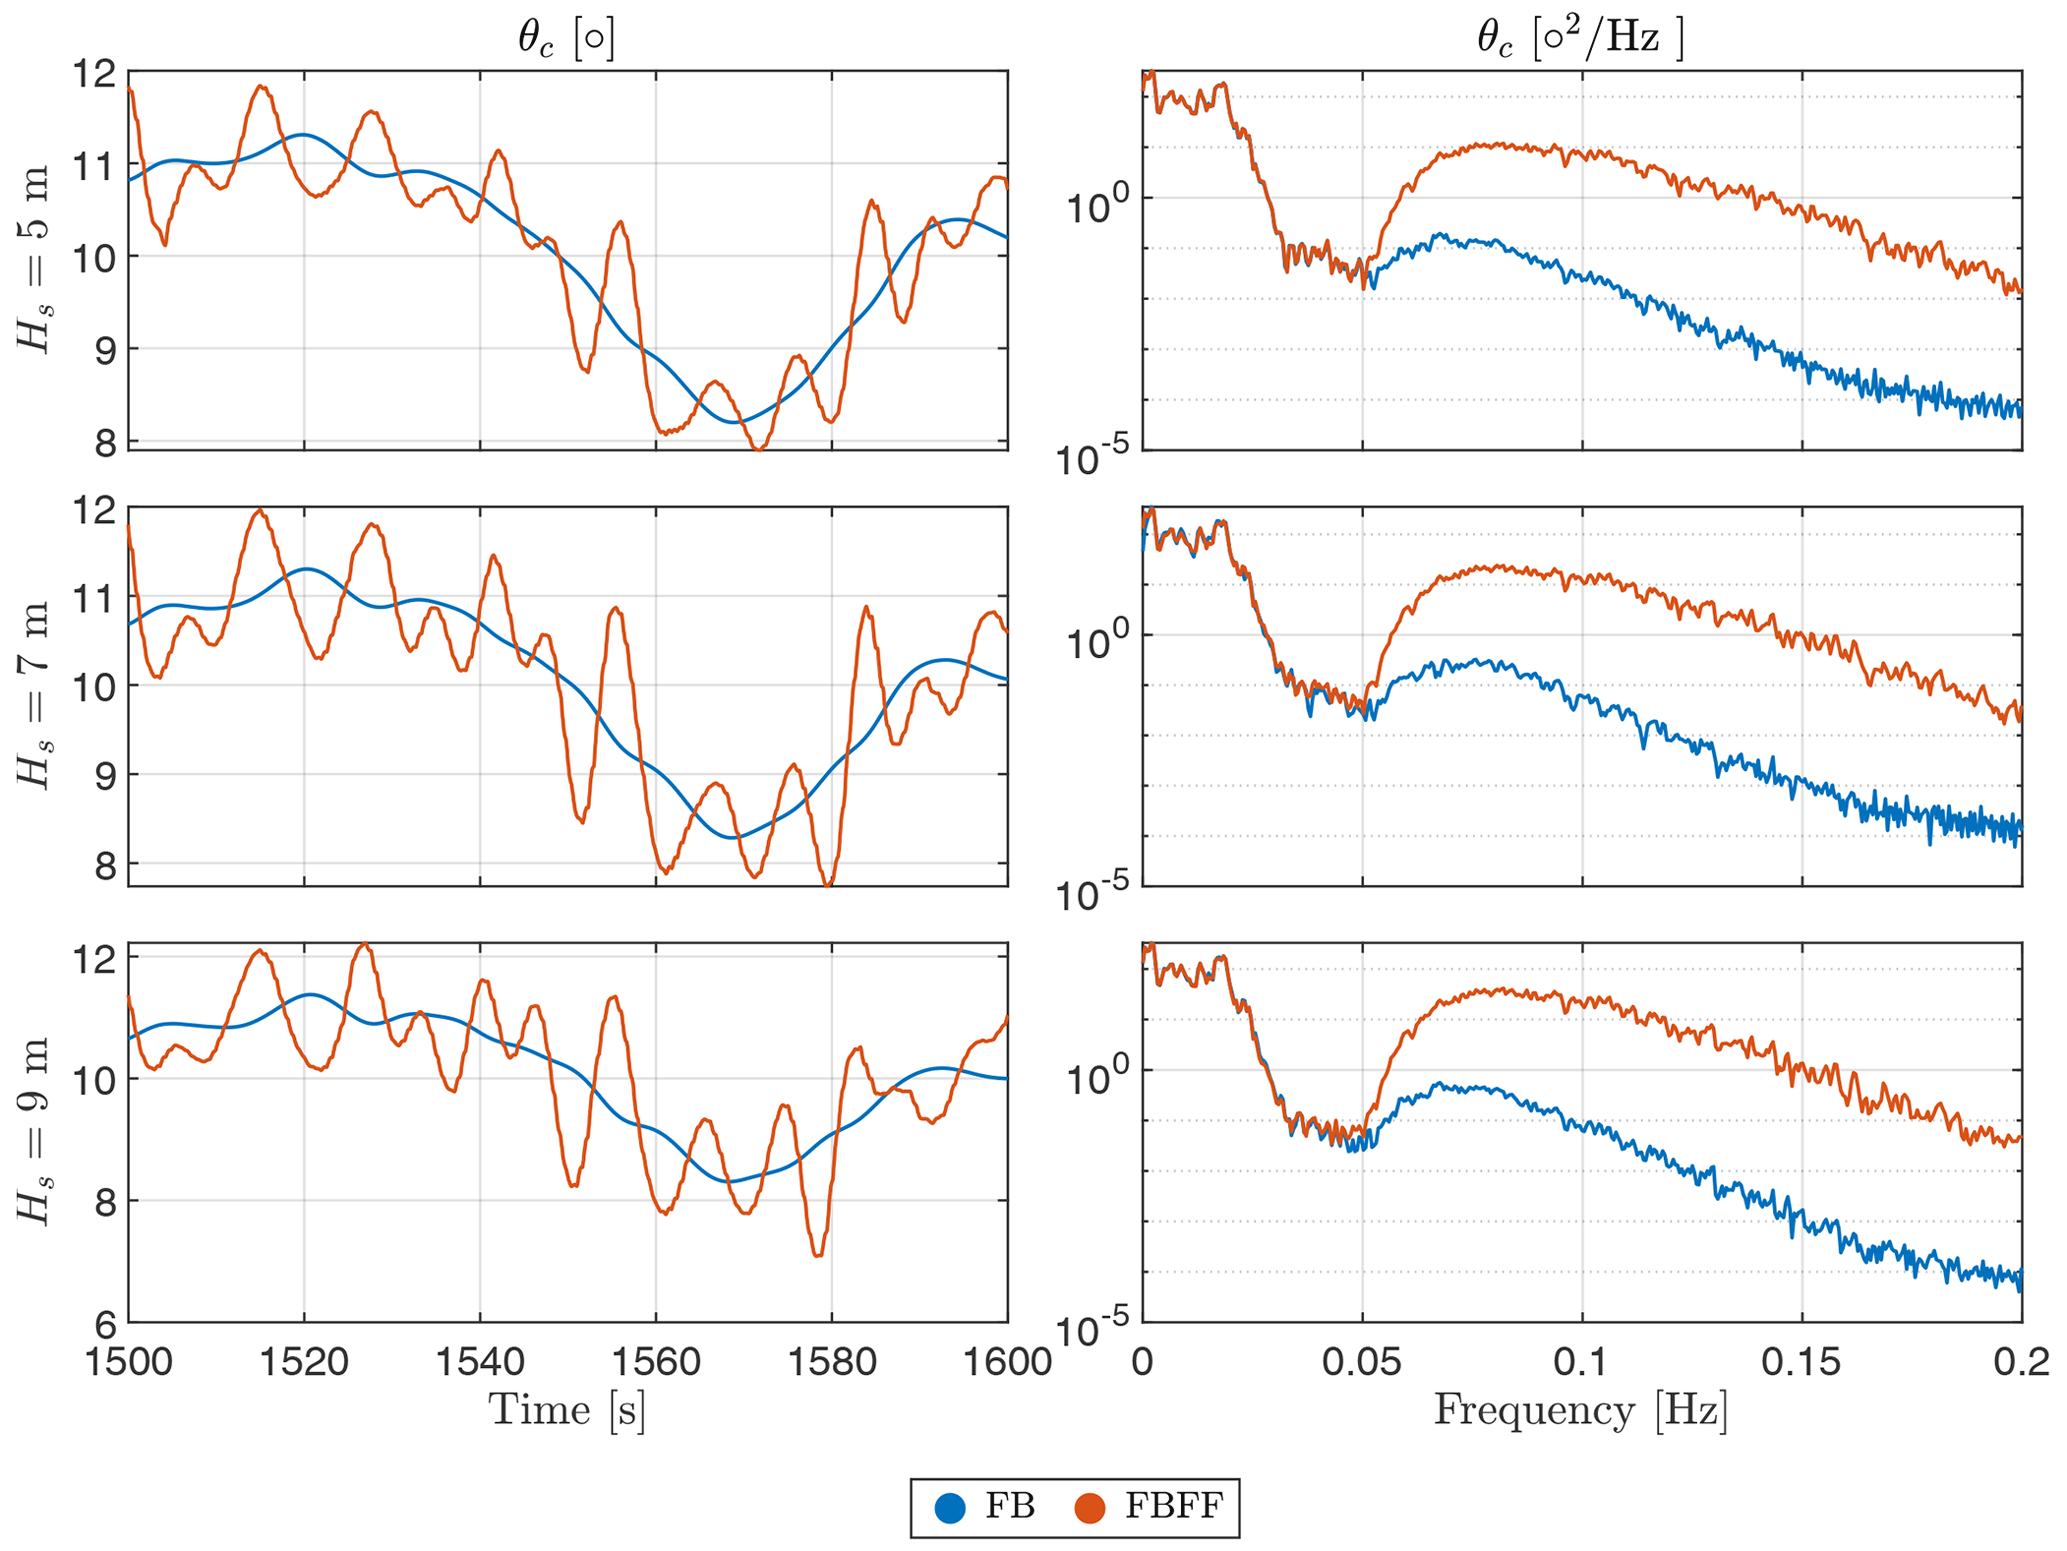
Figure 15Collective blade pitch responses with and without wave FF control, at a turbulent wind speed of V=14 m s−1 with TI=7.1 %, and unidirectional waves at s=∞ and Tp=12 s but at different significant wave heights, Hs.
Figure 16 summarizes the effect of varying the significant wave height on the different variables of interest. It is pretty clear how the FF controller reacts to waves: the bigger they get, the stronger the FF control action is. This is illustrated in the generator power and the blade pitch signals. On the contrary, we see a rise in the fluctuations in the thrust force as the significant wave height becomes higher.
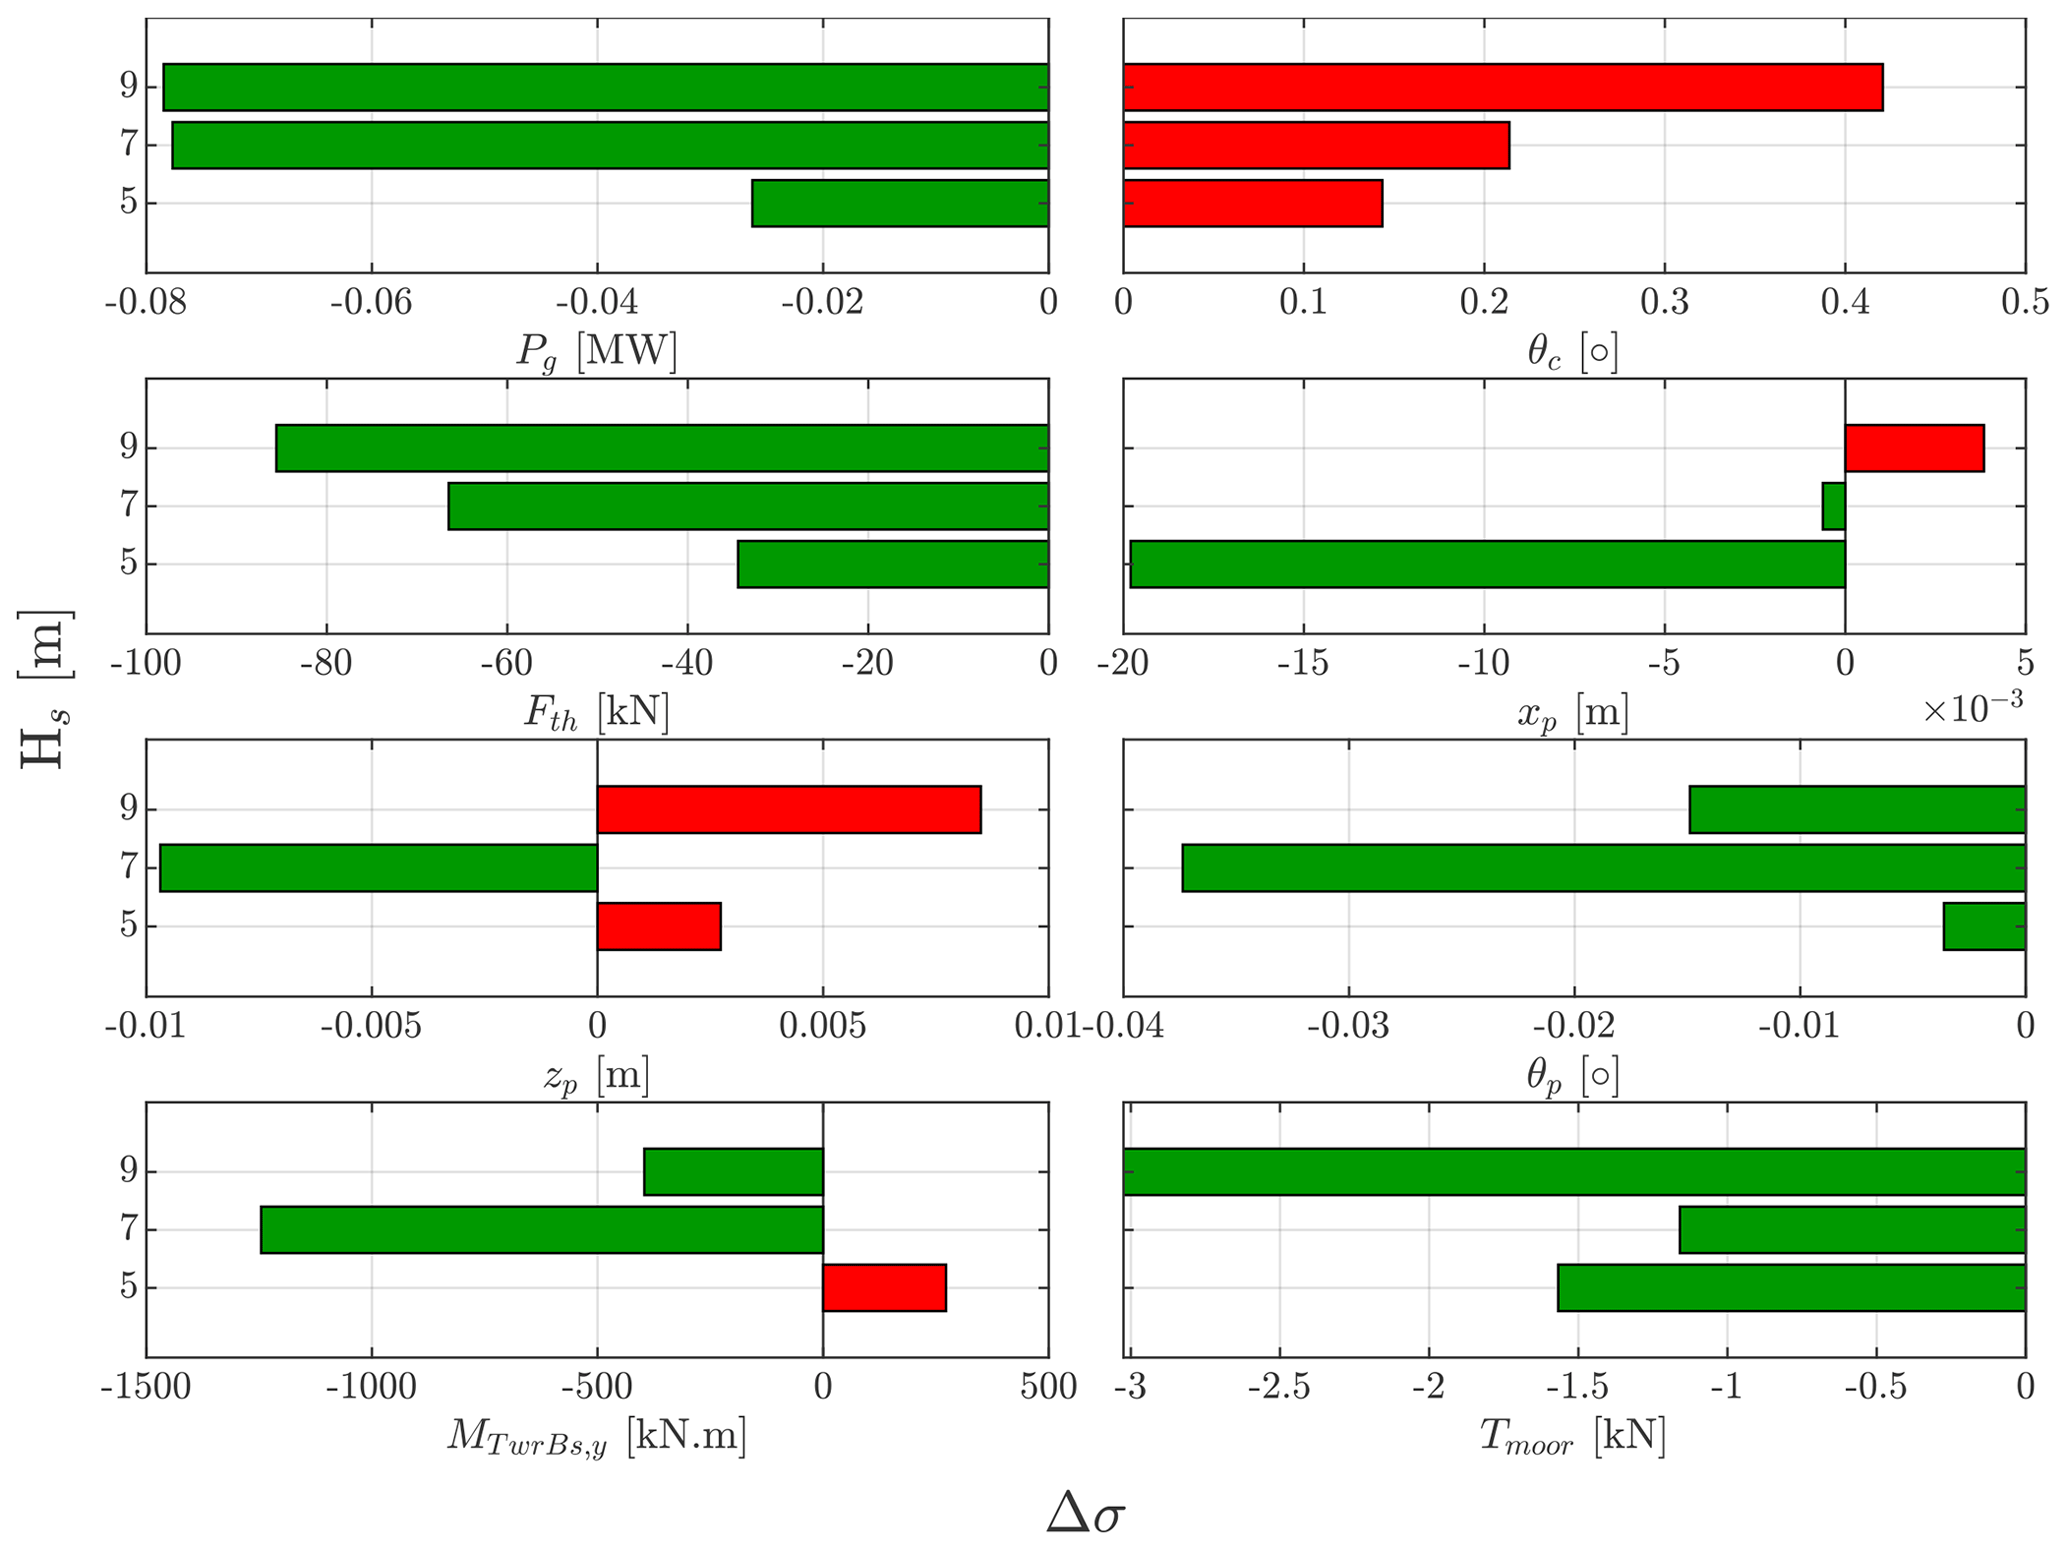
Figure 16Standard deviation change of different variables of interest with wave FF control, at a turbulent wind speed of V=14 m s−1 with TI=7.1 %, and waves of Tp=12 s but at different significant wave heights, Hs. The bars illustrate the difference in standard deviation with the FF control compared to the baseline case at each significant wave height.
Regarding the platform motion, each DOF has a different sensitivity to the wave height variation. We see, for instance, that the fluctuations in the surge DOF significantly decrease with the FF control compared to the baseline FB controller at Hs=5 m, while as Hs increases, the percentage difference in the standard deviation goes from negative to positive at Hs=9 m, indicating that the power regulation FF control leads to higher surge displacements at bigger waves. Concerning heave and pitch DOFs, we observe that at Hs=7 m in particular, there is a considerable alleviation in the oscillations of both signals with respect to the baseline FB control. However, an increase in the platform heave oscillations can be seen for the other two wave heights, while a mitigation in the platform pitch fluctuations is observed at all the wave heights.
4.4 Effect of wave directional spreading
After investigating the effect of varying the turbulence intensity, and the significant wave height, we move on to the effect of the wave directional spreading on the different variables of interest with the FF control present. For this part of the experimental campaign, waves were generated at Hs=7 m and Tp=12 s but at a different directional spreading parameter, where it was varied from a low value corresponding to short-crested waves of a multi-directional nature to higher values that correspond to long-crested waves that act in a more unidirectional manner.
Starting with Fig. 17, where the generator power is depicted, it can be observed that even though the disturbance TF, used in the FF control synthesis, was identified based on unidirectional waves, the FF controller is also still working well in multidirectional waves, which is evident in the time history and the PSD. As for the different directional spreading parameter cases, whether with FB only or FBFF, we cannot really detect a big influence of the wave directional spreading on the generator power signal, as the amplitudes at each time instant, or frequency, almost do not change. This is an expected result, which is attributed to the fact that the system identification was performed with the wave excitation moment as a disturbance input instead of the surface wave elevation. This was done for the purpose of eliminating the effect of wave directionality from the control problem. Therefore, there is no reason to expect the FF controller to be less effective in wave conditions with different directional spreading, since the directional spreading does not have a very significant effect on the distribution of the wave excitation forces over the frequencies.
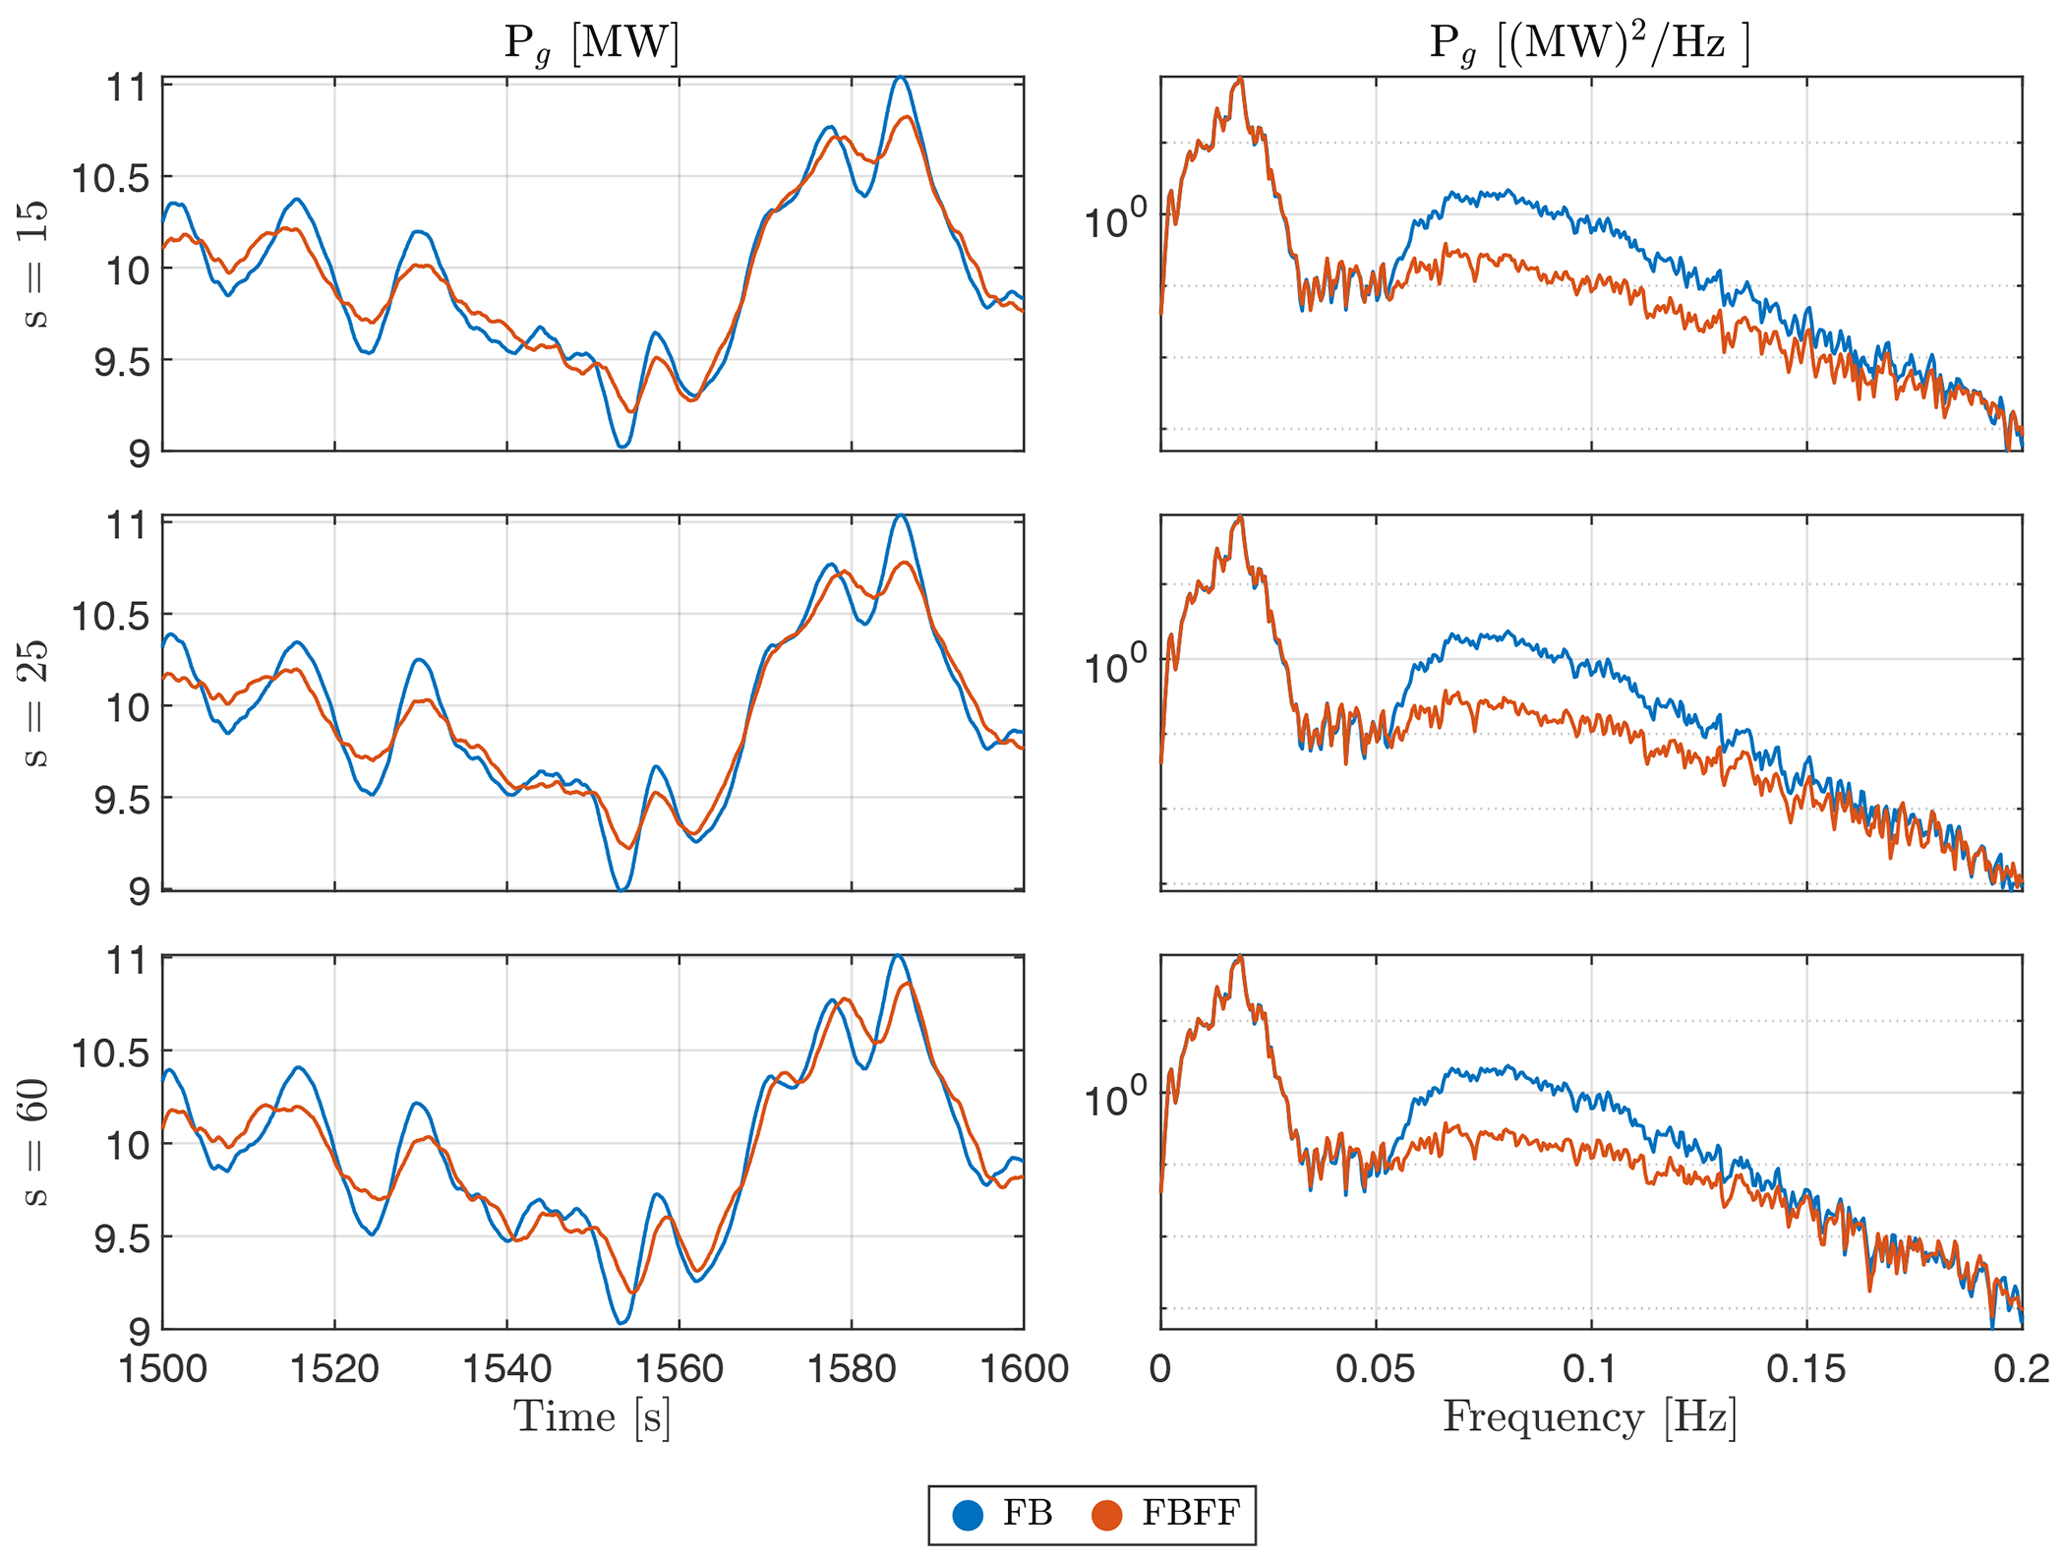
Figure 17Generator power response with and without wave FF control, at a turbulent wind speed of V=14 m s−1 with TI=7.1 %, and waves with Hs=7 m and Tp=12 s but with a different directional spreading parameter, varying from short- to long-crested waves.
Coming back to Fig. 18, again, the activity of the FF controller within different wave directional conditions is clear, and again, the amplitudes of the blade pitch signal do not differ too much from one another.
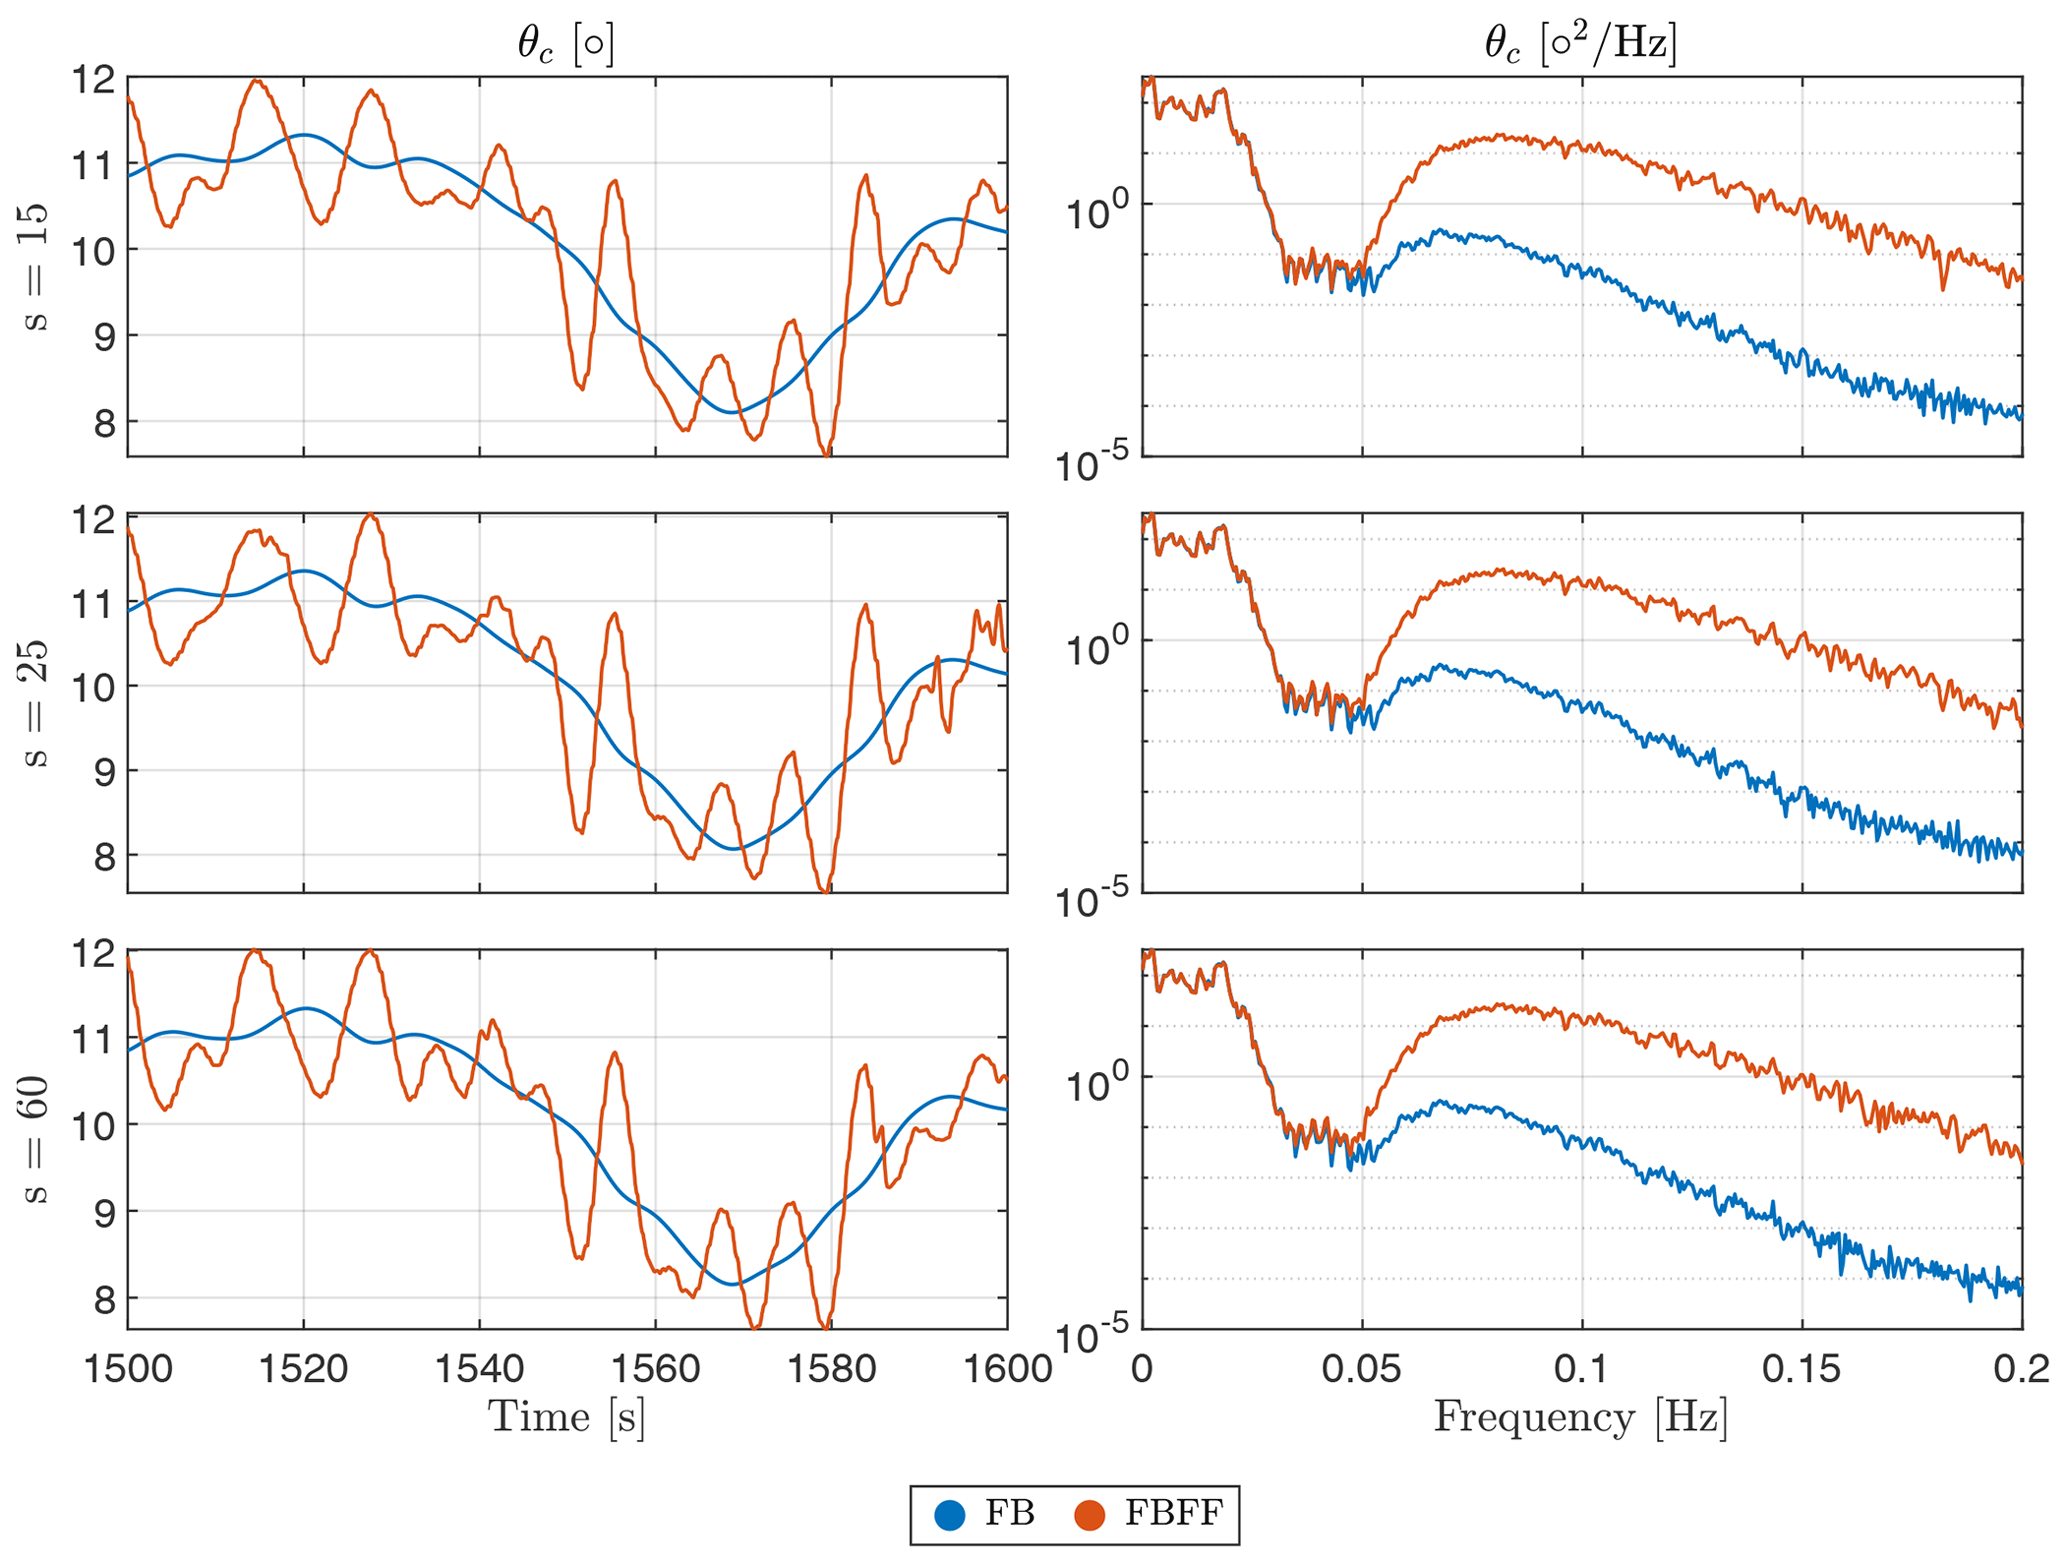
Figure 18Collective blade pitch response with and without wave FF control, at a turbulent wind speed of V=14 m s−1 with TI=7.1 %, and waves with Hs=7 m and Tp=12 s but with a different directional spreading parameter, varying from short- to long-crested waves.
The wave directionality results are summarized in Fig. 19. We see that in short-crested waves, which are the ones with a low spreading parameter, the effectiveness of the FF control is slightly reduced compared to the long-crested wave case. Directional spreading results in a reduction of the pitch and surge excitation forces. Therefore, in terms of the wave excitation force, an increased directional spreading has an effect similar to a decreased wave height. In that sense, the results in Fig. 19 are consistent with those in Fig. 9.
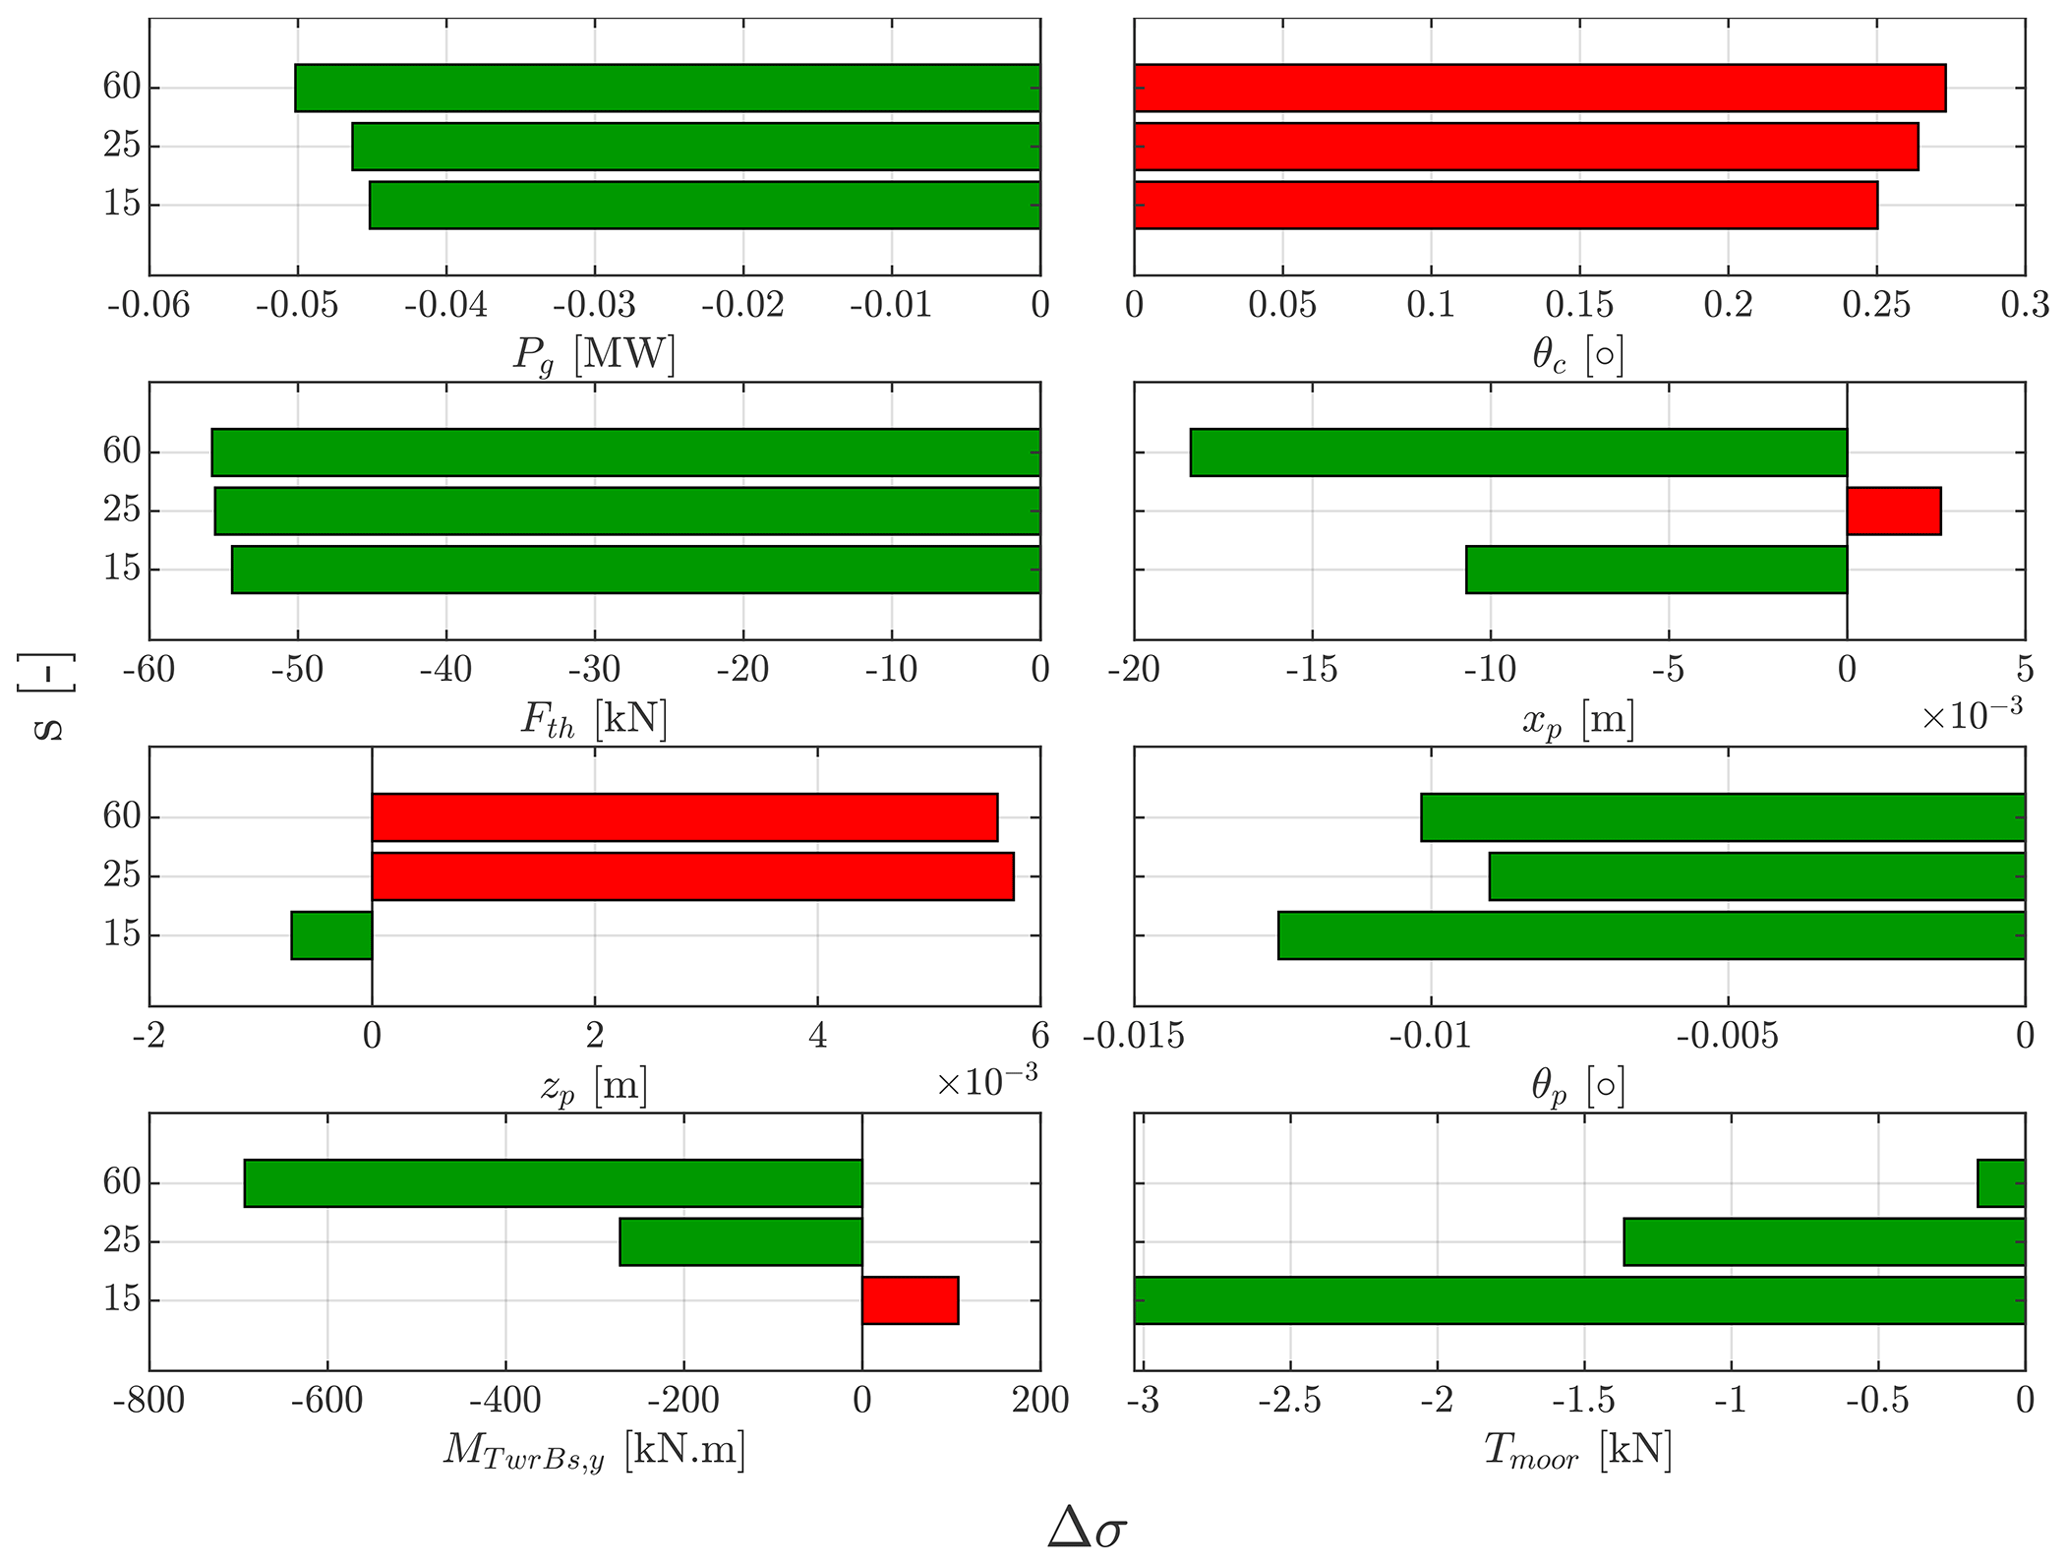
Figure 19Normalized standard deviation percentage change of different variables of interest with wave FF control, at a turbulent wind speed of V=14 m s−1 with TI=7.1 %, and waves with Hs=7 m and Tp=12 s but with a different directional spreading parameter, S, varying from short-crested at s=15 to longer-crested waves at s=60. The bars illustrate the difference in standard deviation with the FF control compared to the baseline case at each directional spreading parameter.
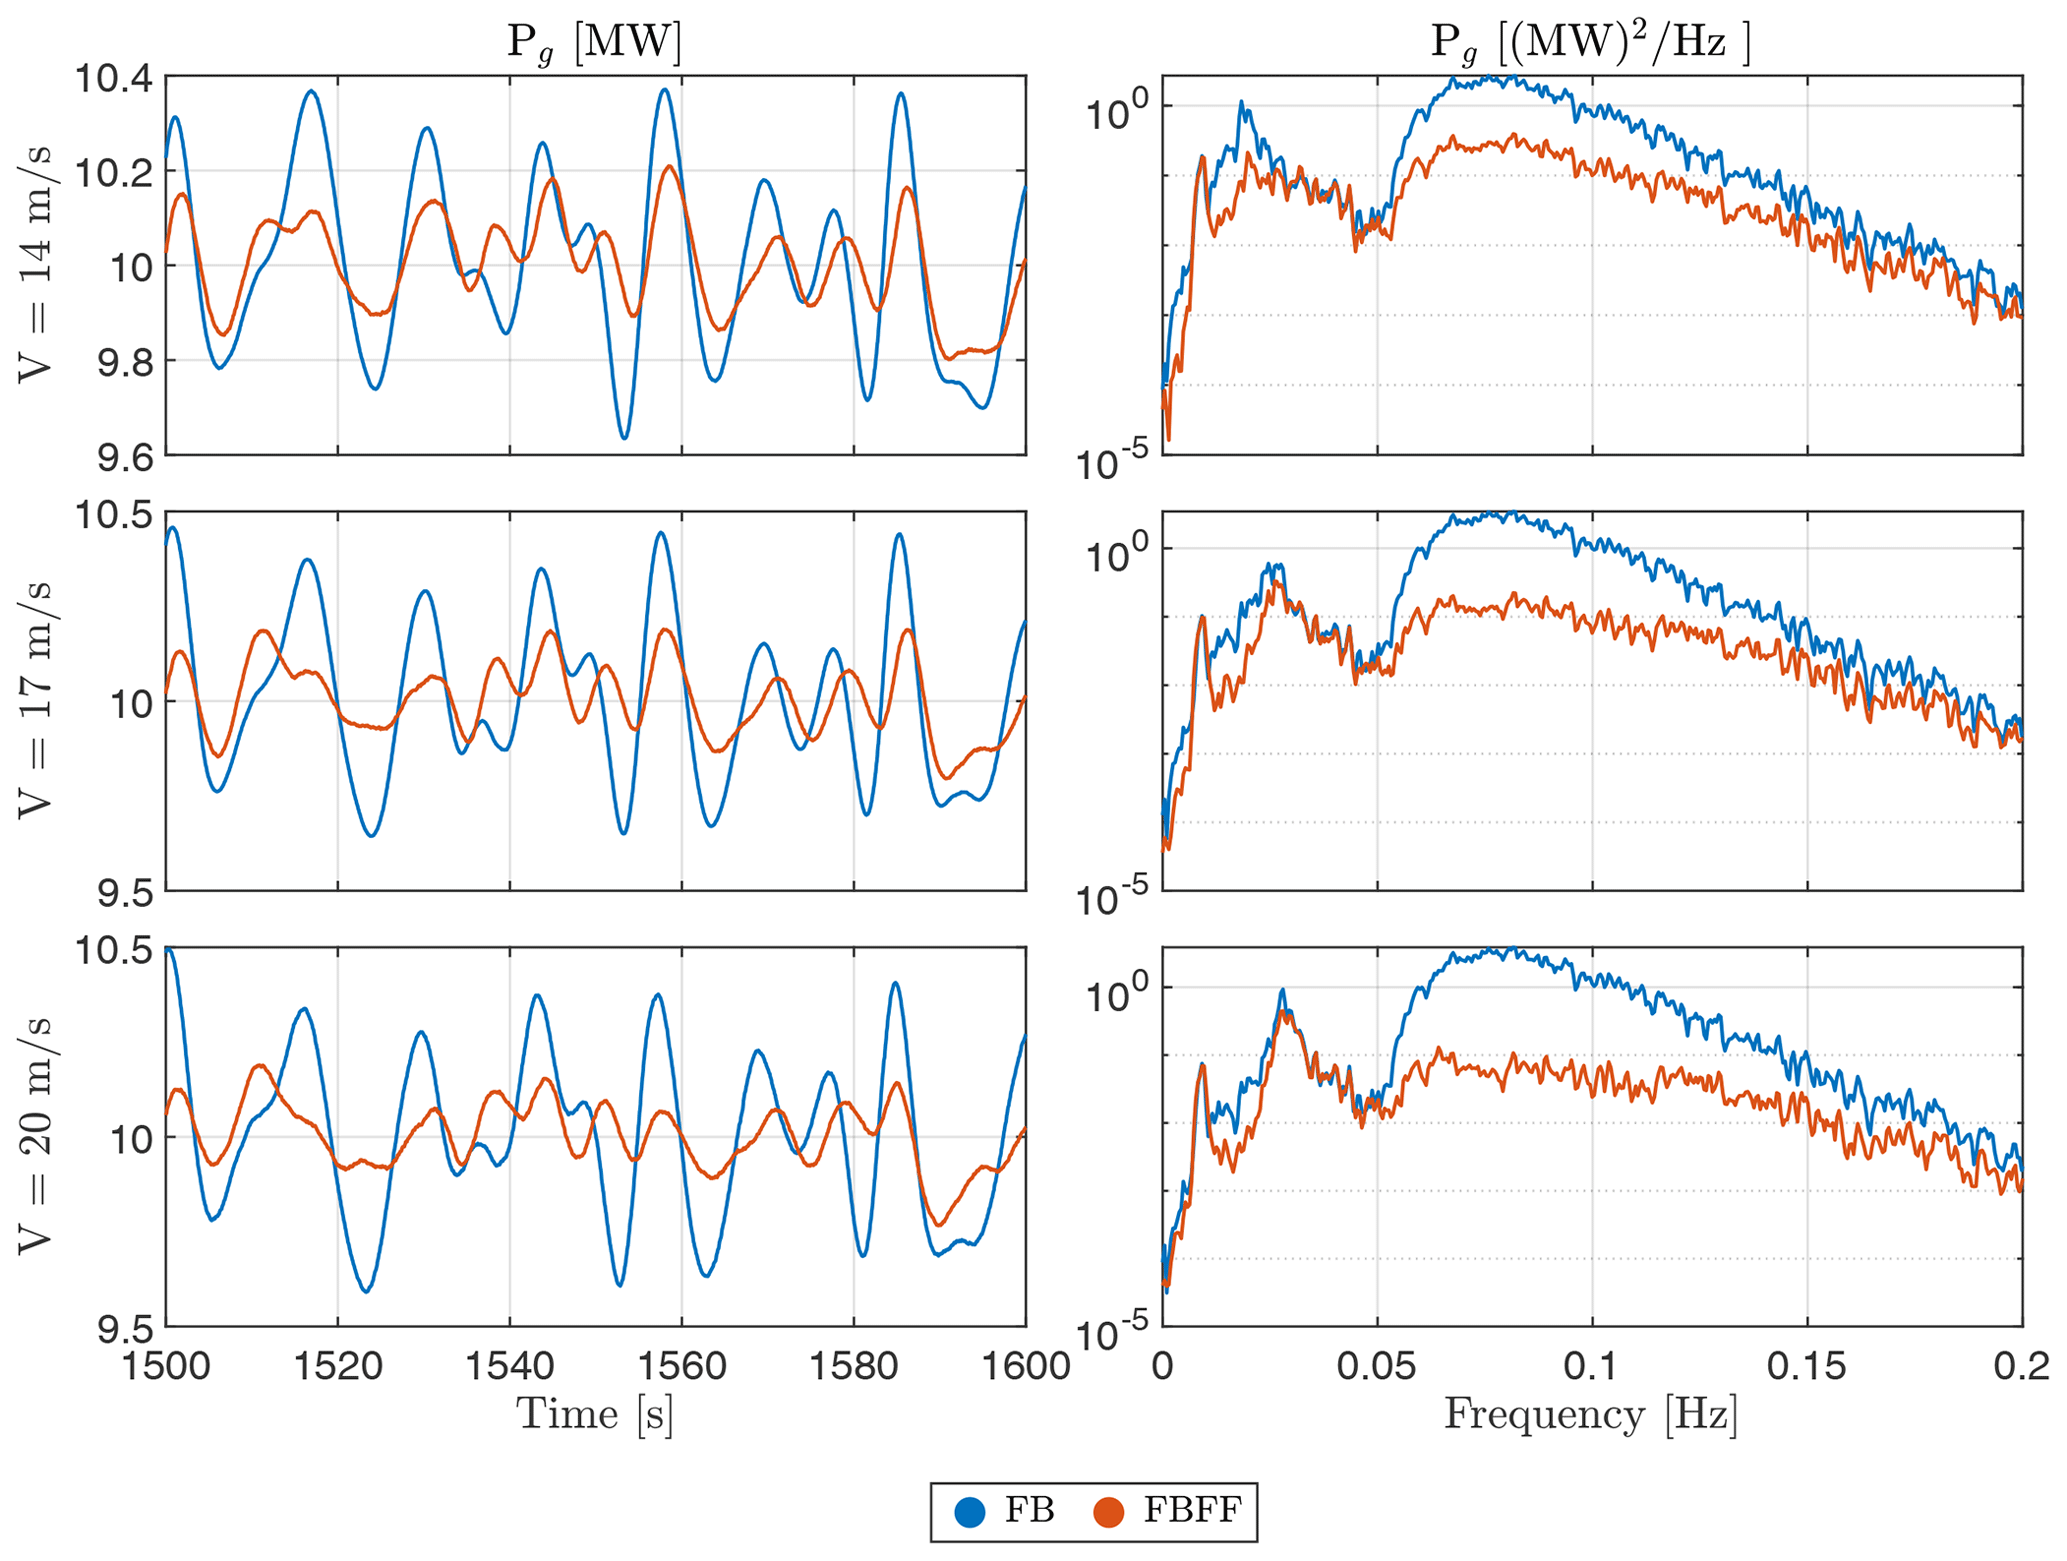
Figure 20Generator power response with and without wave FF control, at different steady wind speeds at 14, 17, and 20 m s−1, and long-crested waves with Hs=7 m, Tp=12 s, and s=∞.
Again, there is no specific trend for the platform motions, as we see a different effect at each spreading parameter for every DOF. Also, the different DOFs do not agree on a certain behavior at every spreading parameter. We see the surge decreasing at short-crested waves, then increasing before decreasing again. The heave decreases slightly before increasing all the way. The platform pitch is always less oscillatory than the baseline FB case, but this reduction in oscillations seems to vary in a random manner, as the reduction is at a maximum at short-crested waves. It then decreases as the wave spreading decreases (s increases), before it increases again slightly as the waves become more long-crested.
4.5 Controller performance at different wind speeds
In this subsection, we show the control performance when the wind speed varies. Initially, the controller was synthesized at a single operating point at a wind speed of 16 m s−1. Consequently, the controller might be expected not to perform optimally at other wind speeds. However, Fig. 20 suggests otherwise, as it shows the controller efficiently operating at different wind speeds. This is clear in both the time response, where we observe a decent reduction in the peak-to-peak amplitudes, and the spectral content in the PSDs.
This gives confidence in the controller that it is robust enough to handle the non-linear dynamics of the FOWTs without the need for gain scheduling even though it was synthesized for a single operating point. Of course having a gain-scheduled controller would ensure that the controller is performing optimally at each operating point across the spectrum of the operating wind speeds of the wind turbine. However, sometimes having a suboptimal controller is preferred to have a compromise between performance and control effort.
Successful wave tank experiments were conducted to evaluate the benefits of the wave feedforward control strategy, using wave excitation force preview, in terms of the structural loads and the power quality of the floating wind turbine components. It was found that the effectiveness of the wave feedforward controller in reducing the power fluctuations is higher than the one for decreasing the platform pitch motion, as the feedforward controller for generator power requires less actuation than the feedforward controller for the platform pitch motion, and the reduction in the generator power oscillations is greater than the alleviation in the platform pitch motion. The experiments went on to investigate the performance of the feedforward control for power regulation within several environmental conditions and how these conditions affect the turbine dynamics in general. Subsequently, some experiments were performed at different wind turbulence intensities, others at varying significant wave heights, and others at contrasting wave spreading conditions.
The wave feedforward strategy was indeed proven to be operational and effective under different environmental conditions. However, we concluded that as the turbulence intensity increases, the wind dominates and the effectiveness of the feedforward control diminishes. As for varying significant wave heights, as the waves get bigger, the responses of the different DOFs of the platform motion vary randomly. On the other hand, for different wave spreading parameters, it was shown that the power fluctuations are higher in the case of short-crested waves than in long-crested ones. However, the difference is rather insignificant, which indicates that the main source of fluctuations is the fore–aft direction.
In short, the wave feedforward control strategy is effective when it comes to alleviating the effects of the wave forces on the produced power of the FOWT, whereas wave feedforward control requires significant amount of actuation to minimize the platform pitch motion, which makes such a technology unfavorable for that objective.
The data presented in this work can be made available upon request.
AH was responsible for the conceptualization, methodology, investigation, and writing of the original draft under the supervision of PN and JWVW. VL, FB, MRM, and YP designed the wave tank experiment. The insights and conclusion presented in this paper are the results of extensive discussions among the coauthors. All coauthors thoroughly reviewed the article.
At least one of the (co-)authors is a member of the editorial board of Wind Energy Science. The peer-review process was guided by an independent editor, and the authors also have no other competing interests to declare.
Publisher's note: Copernicus Publications remains neutral with regard to jurisdictional claims made in the text, published maps, institutional affiliations, or any other geographical representation in this paper. While Copernicus Publications makes every effort to include appropriate place names, the final responsibility lies with the authors.
This project is part of the FLOATECH project. The research presented in this paper has received funding from the European Union's Horizon 2020 research and innovation program under grant agreement no. 101007142.
This research has been supported by the European Union's Horizon 2020 (grant no. 101007142).
This paper was edited by Jennifer King and reviewed by two anonymous referees.
Al, M.: Feedforward control for wave disturbance rejection on floating offshore wind turbines, MS thesis, Delft University of Technology, Delft, the Netherlands, https://repository.tudelft.nl/record/uuid:8b4851ef-02f7-4c1e-a949-6c7d18371873 (last access: 2 December 2023), 2020. a
Al, M., Fontanella, A., van der Hoek, D., Liu, Y., Belloli, M., and van Wingerden, J. W.: Feedforward control for wave disturbance rejection on floating offshore wind turbines, J. Phys.: Conf. Ser., 1618, 022048, https://doi.org/10.1088/1742-6596/1618/2/022048, 2020. a, b
Arnal, V.: Modélisation expérimentale d'une éolienne flottante par une approche sofware-in-the-loop, PhD thesis, http://www.theses.fr/2020ECDN0037 (last access: 2 December 2023), 2020. a, b
Bak, C., Zahle, F., Bitsche, R., Kim, T., Yde, A., Henriksen, L. C., Hansen, M. H., Blasques, J. P. A. A., Gaunaa, M., and Natarajan, A.: The DTU 10-MW reference wind turbine, in: Danish wind power research 2013, https://backend.orbit.dtu.dk/ws/portalfiles/portal/55645274/The_DTU_10MW_Reference_Turbine_Christian_Bak.pdf (last access: 2 December 2023), 2013. a, b
Becker, S., Saverin, J., Behrens de Luna, R., Papi, F., Combreau, C., Ducasse, M.-L., Marten, D., and Bianchini, A.: FLOATECH D2.2. Validation Report of QBlade-Ocean, Tech. rep., https://www.researchgate.net/publication/364360061_FLOATECH_D22_Validation_Report_of_QBlade-Ocean/stats (last access: 2 December 2023), 2022. a
Bonnefoy, F., Leroy, V., Mojallizadeh, M. R., Delacroix, S., Arnal, V., and Gilloteaux, J.-C.: Multidimensional hybrid software-in-the-loop modeling approach for experimental analysis of a floating offshore wind turbine in wave tank experiments, Ocean Eng., 309, 118390, https://doi.org/10.1016/j.oceaneng.2024.118390, 2024. a
Chen, C., Ma, Y., and Fan, T.: Review of model experimental methods focusing on aerodynamic simulation of floating offshore wind turbines, Renew. Sustain. Energ. Rev., 157, 112036, https://doi.org/10.1016/j.rser.2021.112036, 2022. a
European Commission: European Wind Power Action Plan, https://energy.ec.europa.eu/system/files/2023-10/COM_2023_669_1_EN_ACT_part1_v8.pdf (last access: 16 November 2023), 2023. a
Fischer, B.: Reducing rotor speed variations of floating wind turbines by compensation of non‐minimum phase zeros, IET Renew. Power Generat., 7, 413–419, https://doi.org/10.1049/iet-rpg.2012.0263, 2013. a, b
Fleming, P. A., Pineda, I., Rossetti, M., Wright, A. D., and Arora, D.: Evaluating methods for control of an offshore floating turbine, in: International Conference on Offshore Mechanics and Arctic Engineering, vol. 45547, 8–13 June 2014, San Francisco, California, USA, American Society of Mechanical Engineers, V09BT09A019, https://doi.org/10.1115/OMAE2014-24107, 2014. a
Fontanella, A., Al, M., van Wingerden, J., and Belloli, M.: Model-based design of a wave-feedforward control strategy in floating wind turbines, Wind Energ. Sci., 6, 885–901, https://doi.org/10.5194/wes-6-885-2021, 2021. a, b, c
Fontanella, A., Facchinetti, A., Daka, E., and Belloli, M.: Modeling the coupled aero-hydro-servo-dynamic response of 15 MW floating wind turbines with wind tunnel hardware in the loop, Renew. Energy, 219, 119442, https://doi.org/10.1016/j.renene.2023.119442, 2023. a
Hegazy, A., Naaijen, P., and van Wingerden, J. W.: A novel control architecture for floating offshore wind turbines, in: 22nd IFAC World Congress, 9–14 July 2023, Yokohama, Japan, https://doi.org/10.1016/j.ifacol.2023.10.1163, 2023a. a, b
Hegazy, A., Naaijen, P., and van Wingerden, J.-W.: Wave Feedforward Control for Large Floating Wind Turbines, in: 2023 IEEE Conference on Control Technology and Applications (CCTA), 16–18 August 2023, Bridgetown, Barbados, 593–598, https://doi.org/10.1109/CCTA54093.2023.10252529, 2023b. a, b
Jonkman, J.: Influence of Control on the Pitch Damping of a Floating Wind Turbine, in: 46th AIAA Aerospace Sciences Meeting and Exhibit, American Institute of Aeronautics and Astronautics, ISBN 978-1-62410-128-1, https://doi.org/10.2514/6.2008-1306, 2008. a, b
Kim, I.-C., Ducrozet, G., Bonnefoy, F., Leroy, V., and Perignon, Y.: Real-time phase-resolved ocean wave prediction in directional wave fields: Enhanced algorithm and experimental validation, Ocean Eng., 276, 114212, https://doi.org/10.1016/j.oceaneng.2023.114212, 2023. a, b, c
Kim, I.-C., Ducrozet, G., Leroy, V., Bonnefoy, F., Perignon, Y., and Bourguignon, S.: A real-time wave prediction in directional wave fields: Strategies for accurate continuous prediction in time, Ocean Eng., 291, 116445, https://doi.org/10.1016/j.oceaneng.2023.116445, 2024a. a, b
Kim, I.-C., Ducrozet, G., Leroy, V., Bonnefoy, F., Perignon, Y., and Delacroix, S.: Numerical and experimental investigation on deterministic prediction of ocean surface wave and wave excitation force, Appl. Ocean Res., 142, 103834, https://doi.org/10.1016/j.apor.2023.103834, 2024b. a, b
Larsen, T. J. and Hanson, T. D.: A method to avoid negative damped low frequent tower vibrations for a floating, pitch controlled wind turbine, J. Phys: Conf. Ser., 75, 012073, https://doi.org/10.1088/1742-6596/75/1/012073, 2007. a, b, c
Lemmer, F., Yu, W., Schlipf, D., and Cheng, P. W.: Robust gain scheduling baseline controller for floating offshore wind turbines, Wind Energy, 23, 17–30, https://doi.org/10.1002/we.2408, 2020. a
Ma, Y., Sclavounos, P. D., Cross-Whiter, J., and Arora, D.: Wave forecast and its application to the optimal control of offshore floating wind turbine for load mitigation, Renew. Energy, 128, 163–176, 2018. a
Marten, D.: Qblade Website, http://www.q-blade.org, (last access: 2 February 2023), 2023. a, b
Mojallizadeh, M. R., Bonnefoy, F., Leroy, V., Plestan, F., Delacroix, S., Ohana, J., and Bouscasse, B.: Control design for thrust generators with application to wind turbine wave-tank testing: a sliding-mode control approach with Euler backward time-discretization, Control Eng. Pract., 146, 105894, https://doi.org/10.1016/j.conengprac.2024.105894, 2024a. a
Mojallizadeh, M. R., Bonnefoy, F., Plestan, F., Hamida, M. A., and Ohana, J.: Euler implicit time-discretization of multivariable sliding-mode controllers, ISA Trans., 147, 140–152, https://doi.org/10.1016/j.isatra.2024.01.031, 2024b. a, b
Naaijen, P. and Wijaya, A. P.: Phase Resolved Wave Prediction From Synthetic Radar Images, in: Vol. 8A: Ocean Engineering of International Conference on Offshore Mechanics and Arctic Engineering, 8–13 June 2014, San Francisco, California, USA, https://doi.org/10.1115/OMAE2014-23470, 2014. a
Navalkar, S. T., van Wingerden, J. W., Fleming, P. A., and Van Kuik, G.: Integrating robust lidar-based feedforward with feedback control to enhance speed regulation of floating wind turbines, in: IEEE 2015 American Control Conference (ACC), 1–3 July 2015, Chicago, IL, USA, 3070–3075, https://doi.org/10.1109/ACC.2015.7171804, 2015. a
Newman, J. N.: Marine hydrodynamics, The MIT Press, ISBN 9780262534826, 2018. a
Nielsen, F. G., Hanson, T. D., and Skaare, B.: Integrated Dynamic Analysis of Floating Offshore Wind Turbines, ASMEDC, 671–679, ISBN 978-0-7918-4746-6, ISBN 978-0-7918-3777-1, https://doi.org/10.1115/OMAE2006-92291, 2006. a
Raach, S., Schlipf, D., Sandner, F., Matha, D., and Cheng, P. W.: Nonlinear model predictive control of floating wind turbines with individual pitch control, in: 2014 American Control Conference, 4–6 June 2014, Portland, OR, USA, 4434–4439, https://doi.org/10.1109/ACC.2014.6858718, 2014. a
Saenz-Aguirre, A., Ulazia, A., Ibarra-Berastegi, G., and Saenz, J.: Floating wind turbine energy and fatigue loads estimation according to climate period scaled wind and waves, Energ. Convers. Manage., 271, 116303, https://doi.org/10.1016/j.enconman.2022.116303, 2022. a
Schlipf, D., Schlipf, D. J., and Kühn, M.: Nonlinear model predictive control of wind turbines using LIDAR, Wind Energy, 16, 1107–1129, https://doi.org/10.1002/we.1533, 2013. a
Schlipf, D., Fleming, P., Haizmann, F., Scholbrock, A., Hofsäß, M., Wright, A., and Cheng, P. W.: Field testing of feedforward collective pitch control on the CART2 using a nacelle-based lidar scanner, J. Phys.: Conf. Ser., 555, 012090, https://doi.org/10.1088/1742-6596/555/1/012090, 2014. a
Schlipf, D., Lemmer, F., and Raach, S.: Multi-variable feedforward control for floating wind turbines using lidar, in: ISOPE International Ocean and Polar Engineering Conference, 11–16 October 2020, virtual, https://onepetro.org/ISOPEIOPEC/proceedings-pdf/ISOPE20/All-ISOPE20/ISOPE-I-20-1174/2249085/isope-i-20-1174.pdf (last access: 2 December 2023), 2020. a
Scholbrock, A., Fleming, P., Fingersh, L., Wright, A., Schlipf, D., Haizmann, F., and Belen, F.: Field testing LIDAR-based feed-forward controls on the NREL controls advanced research turbine, in: 51st AIAA Aerospace Sciences Meeting, including the New Horizons Forum and Aerospace Exposition, 7–10 January 2013, Grapevine, Texas p. 818, https://doi.org/10.2514/6.2013-818, 2013. a
van der Veen, G., van Wingerden, J. W., Bergamasco, M., Lovera, M., and Verhaegen, M.: Closed-loop subspace identification methods: an overview, IET Control Theor. Appl., 7, 1339–1358, 2013. a
van der Veen, G. J., Couchman, I. J., and Bowyer, R.: Control of floating wind turbines, in: 2012 American Control Conference (ACC), 27–29 June 2012, Montreal, QC, Canada, 3148–3153, https://doi.org/10.1109/ACC.2012.6315120, 2012. a, b