the Creative Commons Attribution 4.0 License.
the Creative Commons Attribution 4.0 License.
Power curve modelling and scaling of fixed-wing ground-generation airborne wind energy systems
Michiel Kruijff
The economic viability of future large-scale airborne wind energy systems critically hinges on the achievable power output in a given wind environment and the system costs. This work presents a fast model for estimating the net power output of fixed-wing ground-generation airborne wind energy systems in the conceptual design phase. In this quasi-steady approach, the kite is represented as a point mass and operated in circular flight manoeuvres while reeling out the tether. This phase is subdivided into several segments. Each segment is assigned a single flight state resulting from an equilibrium of the forces acting on the kite. The model accounts for the effects of flight pattern elevation, gravity, vertical wind shear, hardware limitations, and drivetrain losses. The simulated system is defined by the kite, tether, and drivetrain properties, such as the kite wing area, aspect ratio, aerodynamic properties, tether dimensions and material properties, generator rating, maximum allowable drum speed, etc. For defined system and environmental conditions, the cycle power is maximised by optimising the operational parameters for each phase segment. The operational parameters include cycle properties such as the stroke length (reeling distance over the cycle), the flight pattern average elevation angle, and the pattern cone angle, as well as segment properties such as the turning radius of the circular manoeuvre, the wing lift coefficient, and the reeling speed. To analyse the scaling behaviour, we present a kite mass estimation model based on the wing area, aspect ratio, and maximum tether force. The computed results are compared with 6-degree-of-freedom simulation results of a system with a rated power of 150 kW. The results show the interdependencies between key environmental, system design, and operational parameters. Gravity penalises performance more at low wind speeds than at high wind speeds, and excluding gravity does not yield optimistic performance since it assists in the reel-in phase by reducing the required power. Thin tethers perform better at lower wind speeds but limit power extraction at higher wind speeds and vice versa for thick tethers. Upscaling results in a diminishing gain in performance with an increase in kite wing area. The proposed model is suitable for integration with cost models and is aimed at sensitivity and scaling studies to support design and innovation trade-offs in the conceptual design of systems.
- Article
(10255 KB) - Full-text XML
- BibTeX
- EndNote
Airborne wind energy (AWE) is an emerging technology that uses tethered airborne devices to harness higher-altitude wind resources that are inaccessible to conventional towered wind turbines with potentially lower material usage. Figure 1 shows several implemented prototypes in the power range of rated powers up to 600 kW. Makani and Kitekraft use onboard ram-air turbines to convert the relative flow at the aircraft into electricity, using a conductive tether to transmit the electricity to the ground. SkySails Power and Kitepower operate large soft-wing kites in pumping cycles, using suspended cable robots for control and converting the pulling force of the kite into electricity by means of a ground-based drum-generator module. TwingTec and Kitemill use fixed-wing kites that adopt the same conversion principle in combination with the vertical takeoff and landing (VTOL) subsystem. EnerKíte operates a lightweight fixed-wing kite in pumping cycles, using three tethers controlled from the ground station. A rotational mast on the ground station is employed to launch the kite. Mozaero, previously known as Ampyx Power, uses a catapult subsystem combined with onboard propellers to launch the kite.
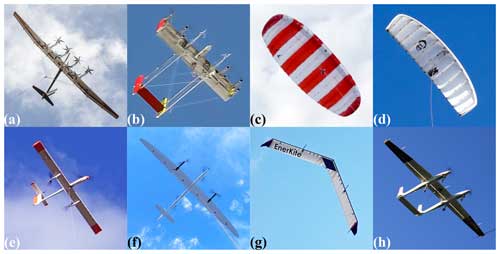
Figure 1Implemented AWE systems (AWESs): (a) Makani (2020), discontinued in 2020; (b) Kitekraft (2024); (c) SkySails (2024); (d) Kitepower (2024); (e) TwingTec (2024); (f) Kitemill (2024); (g) Enerkíte (2024); and (h) Mozaero (2024), formerly Ampyx Power. Photos courtesy of the respective companies.
This work focuses on the fixed-wing ground-generation (ground-gen) concept developed by Ampyx Power, which has been continued by Mozaero since 2023. As illustrated in Fig. 2, a fixed-wing kite analogous to a glider aircraft is connected by a tether to a drum-generator module on the ground. The kite flies in repetitive crosswind patterns, pulling the tether with high force from the drum and driving the generator, as shown in Fig. 2a. During this reel-out phase, electricity is generated. Once the tether has reached a certain length, the kite is retracted toward the generator with minimum aerodynamic drag and substantially lower force as shown in Fig. 2b. A small fraction of the generated electricity is consumed during this reel-in phase. An intermediate buffer storage is typically used for this purpose. The reel-out and reel-in phases are repeated cyclically to generate a net power output.
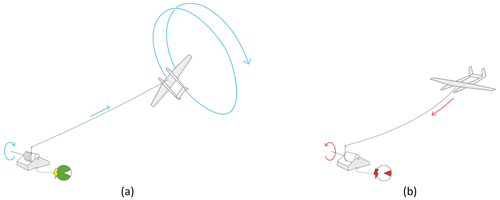
Figure 2Operation schematic of the fixed-wing ground-generation airborne wind energy concept: (a) reel-out phase and (b) reel-in phase (image courtesy of Ampyx Power B.V.).
Compared to flexible-membrane kites, fixed-wing kites are characterised by better aerodynamic performance, a higher lift-to-drag ratio, and a substantially larger mass-to-wing surface ratio. While the first ratio stays roughly the same when increasing the size of the kite, the latter ratio progressively increases. This increase affects fixed-wing kites much more than it does soft-wing kites, rendering mass a crucial parameter for designing large-scale fixed-wing AWESs. The present work focuses on the gravitational effect of mass and its interplay with the resultant aerodynamic force and the tether force during quasi-steady flight operation. To understand this effect, it is important to note that the gravitational force is a constant contribution to the force equilibrium at the kite. In contrast, the aerodynamic force depends on the instantaneous flight speed and can thus vary greatly in the different operational phases of the system. The tether force, on the other hand, is a reaction force to the vectorial sum of the two external forces.
Because of the fast crosswind manoeuvres in the reel-out phase, the apparent wind speed is high, and the quasi-steady force equilibrium is dominated by the aerodynamic loading and the tether force – except for low wind speeds at cut-in where the gravitational force contributes substantially. In the reel-in phase, the gravitational effect is exploited to retract the kite with a minimum tether force and thus reel-in power. The force equilibrium is dominated by the aerodynamic and gravitational forces, while the tether force plays only a minor role. Several different strategies exist for launching and landing. For AWE systems pursuing a vertical takeoff and landing (VTOL) strategy, the aerodynamic force generated by the VTOL subsystem is used entirely to overcome gravity because the wing is either perpendicular to the wind and thus ineffective for lift (e.g. Makani or Kitekraft) or aligned with the wind but providing an insufficient lift force (e.g. Kitemill or TwingTec). For AWE systems pursuing a horizontal takeoff and landing (HTOL) strategy, the kite needs to be accelerated by an external mechanism to a certain minimum flight speed at which the aerodynamic force can overcome gravity. This can be done with a catapult and optional onboard propellers (e.g. Ampyx Power) or a swivelling mast (EnerKíte). Irrespective of how the fixed-wing kite is launched or landed, it has to maintain a certain minimum flight speed during crosswind operation to create an aerodynamic load level sufficient to compensate for gravity's effect and stay airborne. This interplay between aerodynamic, gravitational, and tether forces during the different operational phases requires careful trade-off analysis when designing a fixed-wing AWE system.
Several physical models with a broad spectrum of fidelity and scope have been developed to understand and mathematically describe the operation of AWE systems. Higher-fidelity approaches based on dynamic models and system control, such as in Licitra et al. (2019), Malz et al. (2019), and Eijkelhof and Schmehl (2022), are computationally expensive and require the initialisation and tuning of many parameters. Sommerfeld et al. (2022) investigated the scaling effects of fixed-wing ground-generation AWE systems using AWEbox (Schutter et al., 2023), which is an optimal control framework. Their simulation results do not reveal consistent trends, which could indicate non-converged results. The results of such models are highly dependent on the implemented controller's performance. Hence, they are not the best option for understanding the fundamental principles of systems; the achievable energy output; and the interdependencies between environmental, system design, and operational parameters. Lower-fidelity approaches based on steady or quasi-steady models can be used for this purpose and techno-economic analysis, such as in Heilmann and Houle (2013), Faggiani and Schmehl (2018), and Joshi et al. (2023).
There have been several attempts to model the power generation characteristics of AWE systems with lower fidelity, but none of the theories account for all the relevant physical effects. The first mathematical foundation for estimating power extraction using tethered kites in a crosswind motion was laid by Loyd (1980). This analytical theory assumes idealised flight states to estimate the mechanical power output of a pumping AWE system, but it does not account for losses due to elevation, retraction phase, gravity, vertical wind shear, and hardware limitations.
Argatov et al. (2009) extended this crosswind theory to spherical coordinates to compute the mean mechanical reel-out power of ground-generation systems. The theory accounts for the averaged effects of elevation and gravity on the kite but does not account for the losses due to the retraction phase. Luchsinger (2013) extended Loyd's ideal power extraction theory for fixed-wing ground-generation systems to account for the retraction phase, average pattern elevation, and hardware limitations such as the maximum tether force and generator power rating. But, their study does not account for the effect of gravity. Fechner and Schmehl (2013) presented a model for soft-wing ground-generation systems that accounts for losses due to elevation, the transition phase, and the retraction phase but does not account for the effect of gravity. They also accounted for various efficiencies of the ground station in computing net electrical power output. The model results were compared against measurements of a 4 kW prototype demonstrator.
Ranneberg et al. (2018) presented a model to compute the net power output that accounts for the traction and retraction phases, including gravity and component efficiencies. However, the paper does not provide explicit problem formulation using gravity or highlight the relevance of different force terms. The model results were compared against measurements of a 5 kW prototype, which showed deviations within their expected range. It was also compared to a full 6-degree-of-freedom (6-DOF) simulation of a 30 kW system, which showed good agreement between their models. Trevisi et al. (2020) presented an analytical modelling framework to compute net power output, accounting for the losses due to elevation, gravity, and the retraction phase. Following this work, Trevisi et al. (2023) proposed refining the power estimation by including the effect of the far wake on the induced drag. These losses were modelled as loss factors to calculate the net power output. The model results were not compared against higher-fidelity simulations or measurements.
A quasi-steady model (QSM) for soft-wing ground-generation systems was developed by Schmehl et al. (2013) and Van der Vlugt et al. (2019) and validated by Schelbergen and Schmehl (2020) using measurements from a 20 kW prototype. This model accounts for the losses due to elevation, retraction phase, transition phase, and gravity. We have extended this formulation to fixed-wing systems by incorporating changes in the retraction phase, angle of attack controllability impacting the operational lift coefficient, induced drag, effects of vertical wind shear, hardware limitations, and drivetrain losses. The model is then used to formulate an optimisation problem to find the operational set points for maximising the system's electrical cycle power. The study offers several insights into the impact of gravity and system scaling across low and high wind speeds. The findings highlight how kite and tether mass scaling influences performance, revealing trade-offs between larger and smaller kite–tether configurations.
The paper is structured as follows. Section 2 describes the theoretical framework, which begins with simplifying assumptions and then builds up by relaxing them step by step; Sect. 3 presents the model capabilities through a numerical example and effects of gravity and scaling on performance; and Sect. 4 presents the conclusions.
Consider a fixed-wing kite, analogous to a glider aeroplane, flying on a circular flight trajectory, with a wing planform area S; an aspect ratio AR; lift and drag coefficients CL and CD, respectively; a tether of maximum allowable force Ft,max; a turning radius Rp; a cone opening angle γp; and a turning axis elevation angle βp, which is also referred to as the pattern elevation angle in the following sections. The pattern elevation angle is kept constant for one reel-out phase and one reel-in phase. This is the first step of a system-level performance analysis, so unsteady effects such as turbulence or wind gusts are not considered. The kite kinematics and the forces acting on the kite are formulated in a spherical reference frame (), defined with respect to the Cartesian wind reference frame (). The horizontal axis is aligned with the wind velocity vw and its Z axis pointing vertically upward, as shown in Fig. 3. The unit vectors er,eθ, and eϕ define a right-handed local vector base. The kite's position is represented by point K, and the ground station is located at the origin O. The radial coordinate r specifies the geometrical distance between the kite and the ground station; θ is the polar angle, which is complementary to the tether elevation angle β measured from the ground (i.e. ); and ϕ is the azimuth angle.
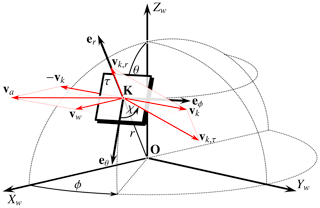
Figure 3Decomposition of kite kinematics in a spherical reference frame (Schmehl et al., 2013).
The kite velocity vk can be decomposed into radial and tangential components vk,r and vk,τ, respectively. The direction of vk,τ is given by the course angle χ measured in the local tangential plane τ from the unit vector eθ. The apparent wind velocity can be expressed in spherical coordinates ( as
The final model simulating the reel-out and reel-in phases of a system is formulated as an optimisation problem where the net electrical cycle power is maximised for given wind conditions. The fixed model inputs are the system design parameters, such as the kite wing area, aspect ratio, wing aerodynamic properties, tether properties, speed limits of the drum-generator module, etc. The optimisation variables are the operational parameters, such as the stroke length (reeling distance over a cycle), pattern elevation angle, cone opening angle, turning radius at the start of the cycle, kite reeling speed, and operating lift coefficient. The optimisation problem is constrained by physical limits, such as the maximum tether force, tether length limit, minimum ground clearance, maximum operation height, etc.
Section 2.1 describes power extraction using the assumption of a massless kite on a straight tether at an elevation. Section 2.2 introduces a kite mass estimation function based on prototype data and scaling laws. Section 2.3 incorporates the effect of gravity on the power output. Section 2.4 describes the impact of the retraction phase on the net power output of the system. Section 2.5 introduces vertical wind shear, and, finally, Sect. 2.6 describes the electrical cycle power of a system considering all the effects together.
2.1 Massless kite at an elevation
Figure 4a illustrates the physical problem of a massless kite with a straight inelastic tether flying in a circular pattern symmetrically around the Xw axis. In the depicted instance along the flight path, the kite just passes through the XwZw plane, and the wind vector vw is orthogonal to the kite's tangential motion component. At this analysis stage, we assume a uniform and constant wind field; i.e. the wind speed and the direction do not change in time and space. The rotation of the wind reference frame is assumed to be so slow that the accelerations induced by this rotation are negligible. For any arbitrary point on the circular flight manoeuvre, Fig. 4b shows the decomposition of velocity and force vectors in the erva plane.
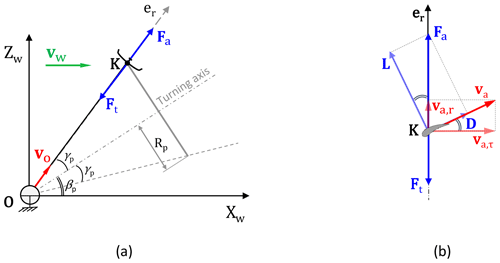
Figure 4Velocities and forces for the massless kite at an elevation. (a) Side view illustrating the circular flight manoeuvre with the average pattern elevation angle βp, opening cone angle γp, reel-out speed vo, and force equilibrium at the kite. (b) Decomposition of velocity and force vectors in the erva plane of the spherical reference frame for any arbitrary point on the trajectory.
The assumption of a massless kite allows us to ignore the effects of gravity and inertia on the kite's motion. Since the tether cannot support a bending moment, the radial force balance is
Because of the assumed straight tether, the kite's radial speed vk,r is identical to the reel-out speed vo. For any point on the flight trajectory, the apparent wind speed can be expressed by its radial and tangential components as
The radial component is defined by Eq. (1) as
The ratio of the tangential and radial components of the apparent wind velocity is also known as the kinematic ratio as described in Schmehl et al. (2013). Because of the geometric similarity of the velocity and force triangles illustrated in Fig. 4b, the kinematic ratio can be related to the lift-to-drag ratio,
From Eqs. (2), (3), (4), (5), and (6), the extractable mechanical power at the ground station can be computed as
From this equation, one can conclude that increasing values of the elevation angle and azimuth angles decrease the magnitude of the apparent wind velocity vector. We simplify our formulation and represent one circular flight manoeuvre by a single flight state. During one full circular flight manoeuvre, the elevation angle β will vary from βp−γp to βp+γp, where γp is the cone opening angle. The geometric average βp over one full manoeuvre can be considered a representative elevation angle over the pattern. The effect of the azimuth angle differs from that of the elevation angle. Using the geometric average of the variation in the azimuth angle as a representative angle will result in ϕp=0 due to the negative and positive signs of the azimuth angle on either side of the symmetry plane XwZw. But in reality, the kite flying in a circular manoeuvre is, on average, at a non-zero azimuth angle (Van der Vlugt et al., 2019). Therefore, we regard the geometric centre of the semicircle as a representative azimuth angle. The centroid yc of a semicircle with a radius R in the Cartesian reference frame is given by
This translates to a specific azimuth angle in the spherical reference frame. For a given cone angle γp, the azimuth angle representing the centroid of a semicircle is
Therefore, it can be approximated that a representative point for the entire pattern, incorporating the average effect of elevation and azimuth, is with and . The mean pattern reel-out power can now be estimated using Eq. (7). The reel-out speed is an independent variable in our model, which is controlled by the ground station, and the tangential velocity is a result of the local force balance at the kite. The other dependent properties of the system are the tether dimensions, the kite's operational envelope, and the effective drag coefficient. They are computed as follows.
Tether dimensions
For a given turning radius Rp and opening cone angle γp during operation, the required tether length is computed as
For a given tether tensile strength σt and maximum allowable tether force Ft,max, the required tether diameter can be calculated as
For ground-gen systems, the tether lifetime is driven primarily by fatigue due to bending and creep (Bosman et al., 2013). Hence, the tether will not be sized based on the material's ultimate breaking strength but on the optimal operating stress levels for an extended fatigue life.
Kite's operational envelope
From Eq. (7), one can see that the closer the tether is aligned with the wind velocity, the higher is the power generated in crosswind operation. However, in a practical operation scenario, the kite must maintain a certain ground clearance hmin and, in most cases, respect a maximum operating height hmax for safety reasons and regulations. These limits must be considered when estimating the tether length and the operational height during the cycle. Figure 5 shows this geometrical relationship where zk,min and zk,max are the bottom-most and topmost operating points during the cycle, and lt,min and Rp,min are the tether length and the turning radius at the start of the cycle, respectively. The operational height range of the kite is the non-hashed vertical region between hmin and hmax. The region between the dotted red lines represents the actual operational envelope of the kite. This envelope changes since the optimal operating parameters change with respect to different wind conditions.
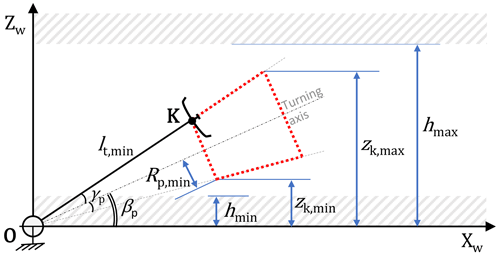
Figure 5Side view illustrating the kite's operational envelope (region shown by the dotted red lines) and the operational height range (non-hashed region between hmin and hmax).
Determining the minimum tether length lt,min using Eq. (11), the minimum ground clearance hmin can be enforced by computing the kite's height at the bottom-most point of its circular flight manoeuvre,
such that . The maximum operational height limit hmax can be enforced similarly by computing
Wing lift coefficient
We assume complete control over the kite by modulating the angle of attack to maintain the necessary wing lift coefficient CL for optimal flight. Therefore, CL is a variable in our model whose value is based on the lift polar. The maximum lift coefficient will set the upper limit considering some stall margins. This can be obtained from experimental measurements or computational analysis such as in Vimalakanthan et al. (2018).
Effective drag coefficient
In addition to the wing drag, the tether is responsible for drag losses during operation. The tether drag contribution is assumed to be lumped to the kite, resulting in an effective drag of the combined kite and tether system (Houska and Diehl, 2006). To estimate this effective drag, it is assumed that the generated moment at the ground station equals the sum of the moments generated by the kite and the tether drag individually. The generated drag force is approximately perpendicular to the tether for high lift-to-drag ratios. We assume that the apparent velocity of the topmost segment of the tether is the same as that of the kite, and it uniformly drops to zero at the ground station. For a given tether length lt, this moment equality can be mathematically expressed as
where CD,k is the kite drag coefficient, va,l is the apparent velocity of the tether element dl at a distance l from the ground station, dt is the cross-sectional diameter, and Cd,t is the cross-sectional drag coefficient of the tether.
This equation can be solved as follows to estimate the effective drag coefficient:
where
It is the effective drag coefficient of the tether lumped at the kite. The total drag of a wing is the sum of parasitic drag and lift-induced drag. Parasitic drag is comprised of a pressure drag contribution due to flow separation and a skin friction drag contribution. The induced drag is coupled to the generated lift (Anderson, 2016). For a given wing with an aspect ratio AR and a wing planform efficiency (Oswald) factor e, the total kite drag coefficient can be expressed as
where Cd,min is the parasitic drag, CL is the wing lift coefficient, and is the lift coefficient at Cd,min. As stated earlier, the drag polar can be obtained from experimental measurements or computational analysis such as in Vimalakanthan et al. (2018).
2.2 Effective mass estimate
Equation (2) does not consider the effect of gravity in the force equilibrium. This effect can generally be neglected during the reel-out phase for smaller systems, especially for low-mass soft-wing systems. This is because the gravitational force is much lower than the traction force. The main impact of weight for soft-wing systems is during the reel-in phase since they typically fly to higher heights because the lift-to-drag ratio is limited to a lower value. Gravity helps to reduce this height and shorten the reel-in phase (Van der Vlugt et al., 2019). This effect differs for larger and fixed-wing systems with higher mass (Eijkelhof and Schmehl, 2022). Gravity reduces the attainable tether force and should be accounted for in the power extraction.
Kruijff and Ruiterkamp (2018) and Bonnin (2019) developed a model for mass scaling at the part level based on the 150 kW prototype AP3 and the megawatt level concept study AP4 developed by Ampyx Power B.V. The model uses the prototype as a reference system and applies known scaling laws for each structural part within the kite. The reference prototype was designed to meet aviation standards with relatively conservative safety factors. The prototype's architecture is scalable using a conventional design with ribs, spar caps, webs, etc. It is, therefore, assumed to be a good representation even for much larger fixed-wing kites. In the resulting mass model, the kite mass mk is a non-linear function of the kite planform wing area S, aspect ratio AR, and maximum tether force Ft,max, given as
where ARref=12, Ft,max is in kilonewtons (kN), S is in square metres (m2), and mk is in kilogram (kg) The physical meaning of the term corresponds to the wing loading for an aircraft. It states the maximum force it can handle per unit wing area and varies around 1–10 kNm−2 based on the purpose and size of the aircraft. Figure 6 is a plot of kite mass against wing area using the above equation and fixing AR=12 and . These fixed values represent the AP3 150 kW prototype values. The result is compared against various data points compiled in Joshi et al. (2023). As seen from the aircraft scaling curve (Roskam, 1989), a conventional aircraft wing does not increase in mass as drastically as an AWE system kite. Based on available information, the MegAWES kite has AR=12 and (Eijkelhof and Schmehl, 2022), AP2 has AR=10, AP4 has AR=12 and (Kruijff and Ruiterkamp, 2018; Ruiterkamp and Sieberling, 2013), AP5 has AR=9.6 and (Hagen et al., 2023), M600 has AR=20 and , MX2 has AR=12.5 and (Echeverri et al., 2020), and Haas et al. (2019) has AR=26 and .
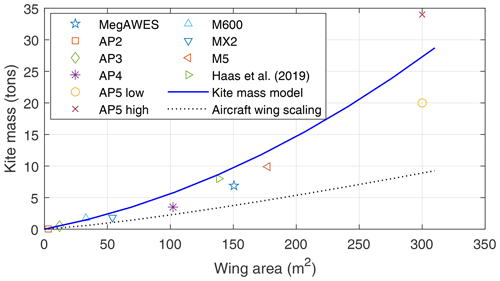
Figure 6Kite mass as a function of wing area. Discrete data points are from Joshi et al. (2023). MegAWES – Eijkelhof and Schmehl (2022); Ampyx Power AP2, AP3, and AP4 – Kruijff and Ruiterkamp (2018) and Ruiterkamp and Sieberling (2013); Ampyx Power AP5 low and AP5 high – Hagen et al. (2023); Makani Power M600, MX2, and M5 – Hardham (2012) and Echeverri et al. (2020); Haas et al. (2019); aircraft wing scaling – Roskam (1989).
Figure 7 shows a 3D plot by varying all three parameters in Eq. 20. As expected, the kite mass increases with increasing values of wing area, maximum allowable tether force, and aspect ratio.
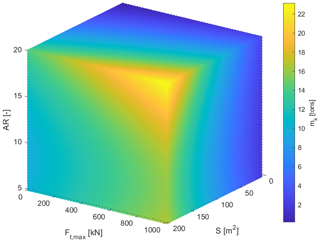
Figure 7A 3D plot illustrating the relationship between wing area S, maximum tether force Ft,max, and aspect ratio AR, with the kite mass mk.
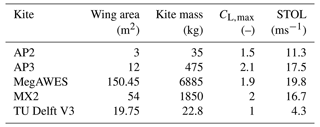
The minimum wind speed required by a static kite to compensate for the gravitational force and stay airborne, also known as the static takeoff limit (STOL), will help us further understand the effect of mass. The STOL can be calculated as
where CL,max is the maximum operable wing lift coefficient. Table 1 shows the STOL for some of the prototypes. When the wind speeds are below the STOL for the particular kite, for example during takeoff, they need to be accelerated to achieve a higher apparent wind speed that allows compensation for the gravitational force. This implies that less heavy soft-wing kites, such as the TU Delft V3, could be launched at lower wind speeds without additional accelerating mechanisms for takeoff. On the other hand, the heavier fixed-wing kites will always need to be accelerated to increase their apparent speeds.
Table 1Static takeoff limits for different prototypes. AP2 – Kruijff and Ruiterkamp (2018) and Williams et al. (2019), AP3 – Vimalakanthan et al. (2018) and Kruijff and Ruiterkamp (2018), MegAWES – Eijkelhof and Schmehl (2022), MX2 – Hardham (2012), TU Delft V3 – Oehler and Schmehl (2019).
In addition to the kite mass, tether mass also affects power extraction and is assumed to be lumped together with the kite mass. To determine the equivalent lumped mass, we require that the moment generated at the drum equals the sum of the moments generated by the kite and the continuous tether individually (Houska and Diehl, 2006). For a specific tether length lt and elevation angle β,
where g is the gravitational acceleration, dt is the tether diameter, ρt is the tether material density, and dl is the length of the tether element at a distance l from the drum. This equation can be solved as
where the tether mass varies with the deployed length of the tether during the cycle as
2.3 Effect of gravity
If we consider the top point of the pattern during operation, shown in Fig. 8, the aerodynamic force vector Fa has to tilt upward to compensate for the kite's weight Fg. This tilt is achieved by rolling the kite by an angle Ψ from the radial direction. In this model, the roll and the pitch are defined as orientation properties of the aerodynamic force vector relative to the radial direction. Along the manoeuvre, the aerodynamic force vector will continuously roll and pitch to counteract gravity. This effectively reduces the contribution of Fa to Ft. Since Fg always points downward, it does not have a component in the eϕ direction. For the top point of the pattern, the quasi-steady force balance of Ft, Fg, and Fa in spherical coordinates is
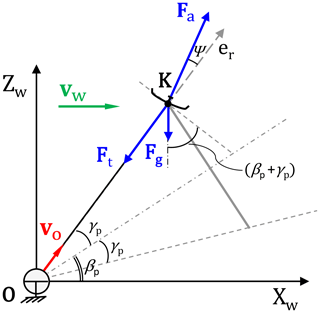
Figure 8Side view illustrating the forces and velocities, including weight, during the reel-out phase of the kite at the top point of its circular manoeuvre.
Due to the tilting of Fa relative to the radial direction, the geometric similarity between the velocity and force triangles, as used to formulate Eq. (6), is lost. Hence, the kinematic ratio κ cannot be substituted with the glide ratio. The mechanical reel-out power, in this case, becomes
As explained in Schmehl et al. (2013) and Van der Vlugt et al. (2019), while maintaining the force balance given in Eq. (26), there should be a solution for the kinematic ratio κ for which the decomposition of Fa in L and D components corresponds to the glide ratio. By the definition of drag force, , and using , we get the equation
This equation is a consistency constraint that must be respected for the solution of the kite speed within the force balance. The value for κ is solved numerically.
During the cyclic motion of the kite through the pattern, the apparent wind speed varies due to the aerodynamic work and the potential and kinetic energy exchange. The apparent wind velocity will be the highest on the bottom and the lowest on the topmost part of the pattern (Eijkelhof and Schmehl, 2022). This variation in velocity leads to oscillations in the mechanical power. Although it should ideally not affect the pattern average power during the cycle, it will demand oversizing of the drivetrain to be able to handle the oscillation peaks. This will lead to increased costs and reduced overall efficiency since the drivetrain will not operate near its rated conditions most of the time. This undesired effect is more extreme for larger kite masses. The oscillating mechanical power must be capped if it exceeds the generator limit. This can be done in multiple ways, for example, by modulating the reeling speed or changing the angle of attack, which can both be done relatively quickly, or by increasing the pattern elevation angle, which takes more time. The work of gravity during the upward and downward parts of the pattern is conserved, but at the same time, there are non-conservative forces, such as the drag force, which lead to energy dissipation. We choose the same representative point to evaluate the mean pattern reel-out power as discussed in Sect. 2.1. The power is estimated using Eq. (27) with and .
2.4 Retraction phase
At the end of the reel-out phase, when the kite is at the topmost point along its trajectory, it is assumed to be pulled back in a straight line starting from the top of the pattern, covering the reeled-out distance. This is as shown in Fig. 8 but with the difference that the kite does not have a tangential velocity; i.e. the kite's tangential velocity component , with ) and ϕp=0. It only has a velocity in the negative radial direction. This is the reel-in velocity vi, an independent variable in the model controlled by the ground station.
A force balance similar to the one described in Sect. 2.3 is solved to estimate the required mechanical reel-in power:
In contrast to the reel-out phase, gravity assists the kite in the retraction phase by reducing the required tether force for reeling in. When the reel-in speed is increased, the time required for reel in can be decreased, but this increases the apparent speed, consequently increasing the tether force. To achieve this descent, the kite needs to modulate CL to a lower value by pitching the kite. By doing so, the kite could be reeled in faster without necessarily increasing the tether force, hence minimising the required reel-in power. This trade-off should be captured when optimising the system's performance.
2.5 Effect of vertical wind shear
Since the kite gradually climbs from lower to higher heights during the reel-out phase, it is exposed to vertical wind shear. The wind resource varies with the height from location to location based on the ground surface roughness and other local meteorological parameters (Bechtle et al., 2019). These vertical wind distributions can be modelled using meteorological data and exhibit significant diurnal and annual variations. Schelbergen et al. (2020) proposed a method to identify characteristic shapes of the wind profile using reanalysis data. Such characteristic wind profile shapes can be used with this model to evaluate the energy production of systems. Since an in-depth wind resource characterisation is not the focus of this work, the commonly used characterisation of a vertical wind profile in neutral atmospheric conditions using the power law given by
is used to describe the relationship between wind speed vw and height z based on the ground surface roughness parameter α (Peterson and Hennessey, 1978).
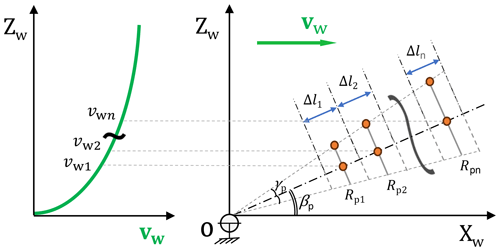
To account for the changing inflow during the system's operation, the reel-out phase is discretised into several segments as shown in Fig. 9. The tractive power is evaluated for each segment using the corresponding wind speed and resulting force balance. The orange points represent the numerical evaluation points during the reel-out and reel-in phases.
2.6 Electrical cycle power optimisation
The power represented by Eq. (27) is the average mechanical reel-out power over one pattern for a given wind speed. This does not yet account for the losses due to the power consumed in the reel-in phase and the losses in the drivetrain. The drivetrain is the chain of components between the drum of an AWE system and the point of connection to the electricity grid. Since the power output of a ground-gen AWE system is cyclic, a storage component needs to be used to charge and discharge during the cycle to maintain smooth power fed into the grid (Joshi et al., 2022). The electrical cycle average power is computed as
Here, to is the time duration of the reel-out phase, Pe,i is the power required during reel in, ti is the time duration of the reel-in phase, and ηDT is the drivetrain efficiency.
2.6.1 Drivetrain efficiency
In a typical electrical drivetrain, the generator is connected to the drum using a gearbox. The generator is then connected to an electrical storage module via a power converter and to the grid via a power converter in parallel configuration (Joshi et al., 2022; Fechner and Schmehl, 2013). Therefore, ηDT is a combination of the individual component efficiencies given as
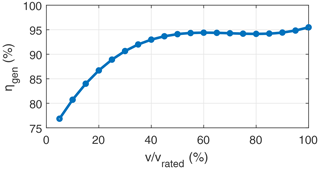
where ηgb is the gearbox, ηgen is the generator, ηpc is the power converter efficiencies, and ηsto is the electrical storage. We assume a value of 95 % for all three components except the generator. The generator efficiency at its rated speed could be as high as 95 % and drops steeply below about 40 % of its rated speed. This non-linear relationship is based on the supplier data received from Ampyx Power B.V. and is modelled as
where v is the operating speed of the generator. Figure 10 shows this generator efficiency plot.
2.6.2 Reel-out and reel-in times
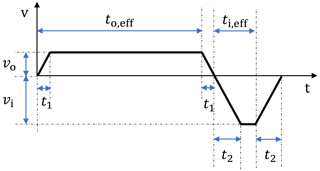
The reel-out and reel-in times heavily influence the average electrical cycle power of the system. They are dependent on the reel-out speed vo, reel-in speed vi, stroke length Δl, and given maximum drum acceleration ad,max. Figure 11 shows a velocity–time graph for a representative cycle. The reel-out phase starts with a reeling speed of zero. The kite achieves its set reel-out speed by accelerating with ad,max, and the speed remains constant until the kite covers the stroke length. The kite then decelerates back to zero to begin the reel-in phase. Similar to the start of the reel-out phase, the reeling speed reaches its set value by accelerating with ad,max and then remains constant until the end of the reel-in phase, after which it again decelerates to zero to begin a new cycle.
If t1 is the time taken by the kite to reach the maximum reel-out speed, to,eff is the effective time during which the kite is in traction and producing power, t2 is the time taken by the kite to reach its maximum reel-in speed, and ti,eff is the effective time during which the system is out of traction, then the cycle time is expressed as
2.6.3 Optimisation problem setup
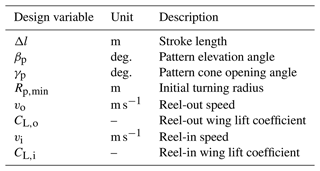
The optimisation objective is maximising the electrical cycle average power Pe,avg, given by Eq. (31), for given wind conditions. Table 2 shows a list of the operational design parameters, which are the variables of the optimisation problem. In general, the upper and lower bounds on the variables should be set such that the optimum is not restricted by the bounds. This will change if component limitations are considered. For example, the limits on the kite speed v will depend on the drivetrain's maximum allowable speed, and the operational wing lift coefficient CL will depend on the wing aerodynamic properties. Since this is a steady-state model without a controller, the lower limit on the pattern radius Rp could be set based on studies considering a controller, such as Rossi (2023) and Eijkelhof et al. (2024). To account for the feasibility of trajectories in this model, we propose a lower limit on the turning radius of 5b, where b is the wing span.
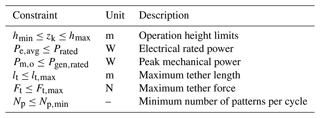
Table 3 presents a list of the constraints of the optimisation problem. Constraints are enforced on the minimum ground clearance, required electrical rated power, peak mechanical power (limiting the size of the generator), maximum tether length, maximum allowable tether force, and minimum number of patterns per cycle. At least one full pattern during a cycle is imposed to account for the fact that inertial effects are excluded, and it can be unrealistic to have fast transitions between reel out and reel in without completing at least one circular trajectory. Another important constraint that must be respected during reel out and reel in is given by Eq. (28). Since the design space is continuous and has non-linear constraints, sequential quadratic programming (SQP), a gradient-based optimisation algorithm, is implemented in MATLAB to solve the problem. The results give the optimal operation set points for the defined system with respect to the given wind conditions.
The optimiser attempts to find a solution for the quasi-steady force balance for every wind speed in the given range. The cut-in wind speed vw,cut-in is the minimum speed at which the system produces net positive electrical cycle power. That is, for wind speeds below vw,cut-in, power will be consumed to keep the kite in the air (). The rated wind speed vw,rated is the speed at which the system produces its nameplate rated electrical power. Therefore, the cut-in and rated wind speeds are part of the solution. On the other hand, the cut-out wind speed vw,cut-out is a design choice and will most probably be a consequence of the structural lifetime and design limits of the system components. Following conventional wind turbines, the cut-out wind speed is assumed to be 25 ms−1 at the operational height.
The attainable power curve for a fixed-wing ground-gen AWE system can be estimated using the presented model. Results from simulating a system with a rated power of 150 kW are presented in Sect. 3.1, and some effects of scaling are discussed in Sect. 3.3, showcasing the capabilities of the model and its application for the conceptual design phase.
3.1 Simulation results of a 150 kW system
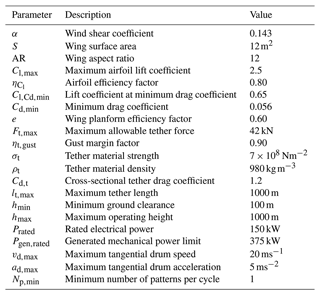
The system's parameters are based on the prototype AP3 (Fig. 12), originally developed by Ampyx Power (Kruijff and Ruiterkamp, 2018; Vimalakanthan et al., 2018) and continued by Mozaero since 2023 (Paelink and Rand, 2024). Table 4 lists the parameters and the limits used to define the specific system. It is important to note that the system parameters are not optimised, and hence the power curve does not characterise a commercial 150 kW system. A safety factor ηt,gust is applied on Ft,max, reducing the maximum allowable tether force value below the actual limit of the tether. To account for 3D wing aerodynamic effects, an aerodynamic efficiency factor is applied on the maximum airfoil lift coefficient, setting an upper limit for the wing lift coefficient CL. This is given as
where is the efficiency factor, and Cl,max is the maximum airfoil lift coefficient. For the induced drag calculation using Eq. (19), a wing planform efficiency factor e (Oswald efficiency factor) is used.
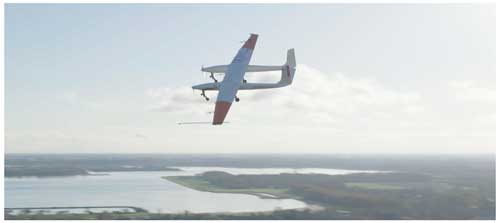
Figure 12The first untethered flight of the AP3 demonstrator aircraft in the Netherlands in November 2023 (Paelink and Rand, 2024). Photo courtesy of Mozaero.
Figure 13 shows the chosen vertical wind shear profile representing an onshore scenario and neutral atmospheric conditions using a surface roughness coefficient α of 0.143. The figure also shows wind profiles from Cabauw, an onshore location, and IJmuiden, an offshore location in the Netherlands. These two profiles were generated using the wind profile clustering approach described in Schelbergen et al. (2020) and were utilised in Eijkelhof and Schmehl (2022). For any given location, several profiles exist based on the probability of occurrence. The profiles with the highest probabilities in the two locations are shown in the figure. The modelled profile with α=0.143 is comparable to the empirical onshore profile and is hence chosen to represent a generic onshore location.
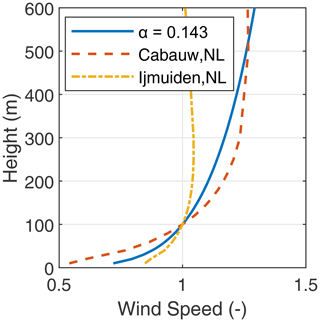
Figure 13The chosen vertical wind shear profile with a surface roughness coefficient of 0.143 compared against profiles from Cabauw, an onshore location, and IJmuiden, an offshore location in the Netherlands (Eijkelhof and Schmehl, 2022).
3.1.1 Power curve comparison with 6-DOF simulation
The 6-degree-of-freedom (6-DOF) simulation results were generated using the simulation framework developed at Ampyx Power B.V., as described in Ruiterkamp and Sieberling (2013), Williams et al. (2019), and Licitra et al. (2019). This model accounts for 3 degrees of freedom related to the kite's attitude and 3 related to its position. Unlike steady-state modelling, it solves the equations of motion, including the acceleration terms. The wing's aerodynamic derivatives are obtained through computational analysis, as described in Vimalakanthan et al. (2018). The tether is modelled as a flexible component with discretised segments. Flight and winch feedback controllers are implemented to simulate the tethered kite system during takeoff, reel-out, reel-in, transition, and landing phases.
Figure 14 shows the computed power curve compared to the ideal crosswind power extraction theory by Loyd (1980) and the results of the 6-DOF simulation. The horizontal axis describes the wind speed at 100 m height. Loyd's ideal crosswind power is computed using
where CL,max is the upper limit as defined by Eq. (38), CD is computed as described in Eq. (19), and vw is the wind speed at 100 m height. This ideal crosswind theory overpredicts the power because it neglects the losses due to gravity, elevation and azimuth angles, tether drag, cyclic operation, hardware limits, and drivetrain efficiency.
The kite mass mk using Eq. (20) equals 437 kg, which is close to the indication received from the company about the AP3 prototype, as seen from Fig. 6. The shape of the estimated power curve using the developed model resembles the curve generated by the 6-DOF simulations, but it is more optimistic. This is mainly because the developed model ignores the losses due to control and inertial effects. It also does not account for realistic takeoff or flight sustenance conditions at low wind speeds, which is most likely the reason for the earlier cut-in. The rated power is reached at a wind speed of 15 ms−1. As a design choice, the cut-out wind speed is chosen to be 25 ms−1 at the operational height. Due to the vertical wind shear, this translates to a wind speed of 21 ms−1 at 100 m.
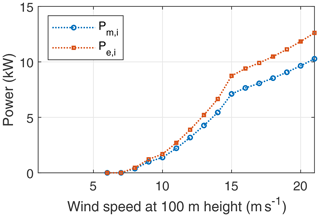
The mean mechanical and electrical powers, reel-out and reel-in powers, and electrical cycle average power are shown in Figs. 15 and 16. The reel-out power has three regimes, as described in Luchsinger (2013) and Kruijff and Ruiterkamp (2018). The cubic regime I is above the cut-in speed (here, 6 ms−1), in which the reel-out power increases cubically until 10 ms−1 when the maximum allowable tether force (here, 34 kN, considering the gust margin factor) is reached. The linear regime II starts when the maximum allowable tether force is reached, in which the reel-out power increases linearly until the chosen rated electrical power (here, 150 kW) is reached. The flat regime III starts when the rated power is reached and continues until the cut-out speed. In this regime, the mechanical reel-out power is capped to maintain the rated electrical power. The power is capped by varying the operational parameters. These changes in operational parameters also affect the reel-in power seen in Fig. 16.
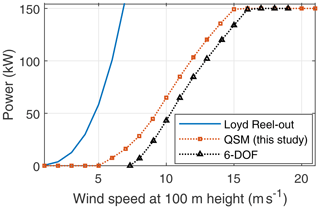
Figure 14Power curve comparison of the quasi-steady model (QSM) with Loyd and 6-DOF simulation results.
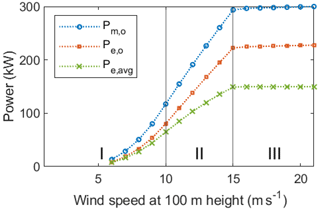
Figure 15Mean mechanical power Pm,o, electrical reel-out power Pe,o, and electrical cycle average power Pe,avg as functions of the wind speed.
3.1.2 Forces and operational parameters for the entire wind speed range
Figures 17 and 18 show the resultant aerodynamic force, the tether force, and the gravitational force during the reel-out and reel-in phases, respectively. As specified in Table 4, a gust margin factor of 0.9 is applied to the maximum allowable tether force. Once this upper limit is reached, the aerodynamic force has to be capped to avoid tether overload. In our specific example, this limit is reached at 10 ms−1. The aerodynamic force can be capped by reducing the wing's lift coefficient, modulating the reeling speed, or increasing the elevation angle. The choice of a specific capping strategy depends on multiple trade-offs. The optimisation objective is the average electrical cycle power, including the reel-out and reel-in phases. During reel in, the kite is flown such that the maximum contribution of the generated aerodynamic force is used to counter the kite's weight, reducing the required pulling force and, consequently, the reel-in power. This is seen in Fig. 18. Intuitively, if the aerodynamic force completely balanced the weight, it would lead to an and hence no requirement of reel-in energy. This would be the case for a freely gliding kite. However, this could also increase the reel-in time, which could lead to lower net cycle power. Hence, the optimiser finds a solution to the reel-in speed such that it creates a non-zero tether force but still ultimately reduces the net cycle loss.
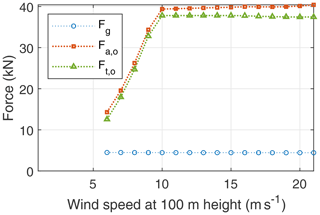
Figure 17Mean resultant aerodynamic force Fa,o, tether force Ft,o, and weight of the kite and the tether lumped together Fg during the reel-out phase as functions of the wind speed.
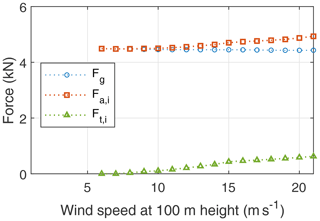
Figure 18Mean resultant aerodynamic force Fa,i, tether force Ft,i, and weight of the kite and the tether lumped together Fg during the reel-in phase as functions of the wind speed.
Figures 19 and 20 show the lift and drag coefficients during the reel-out and reel-in phases. As stated earlier, CL is a variable in our model, and CD is calculated using Eq. (17). The aerodynamic force during reel in only has to counter the kite's weight, which is achieved by decreasing the lift coefficient during reel in. Because of the lift-induced drag contribution, the kite drag coefficient is a function of the lift coefficient and follows its trend. The total drag coefficient is the summation of the kite drag coefficient and the tether drag coefficient as described in Eq. (17). Figure 20 shows that the tether drag coefficient contributes significantly to the system's total drag coefficient. It is almost equal to the kite drag coefficient during the reel-out phase and is higher during the reel-in phase.
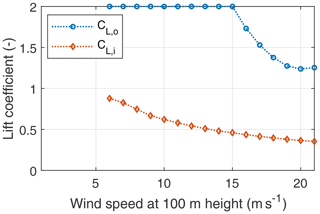
Figure 19Mean kite lift coefficients CL,o and CL,i during the reel out and reel in, respectively, as functions of the wind speed.
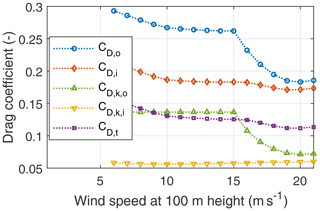
Figure 20Mean effective system drag coefficients CD,o and CD,i; mean kite drag coefficients and during the reel out and reel in, respectively; and mean tether drag coefficient CD,t as functions of the wind speed.
The kite's radial and tangential velocity components are commonly non-dimensionalised with the wind speed, leading to the reeling factor and the tangential velocity factor (Schmehl et al., 2013). Figure 21 shows the tether reeling factors during reel out and reel in and the tangential velocity factor during reel out. The reel-out speed peaks when the rated power is reached, i.e. at 15 ms−1 of wind speed, and then gradually reduces, assisting in power capping. The reel-in speed is kept at the drum's tangential speed limit of 20 ms−1. This is seen from the gradual decrease in the reel-in speed factor. After the maximum tether force is reached at 10 ms−1, the kite's tangential velocity is gradually reduced, decreasing the aerodynamic force to maintain the tether force at its maximum value.
Figure 22 shows the reel-out time, reel-in time, average time the kite takes to perform one circular pattern during reel out, and the number of patterns per cycle. The number of patterns is calculated using the reel-out time, pattern radius, and tangential kite speed as
In a more realistic operation, the number of patterns should be a whole number such that the reel-in phase always starts from the top point of the pattern. However, since we are not resolving the full trajectory in this model, the number of patterns is allowed to be a fractional result. Moreover, since inertial effects are ignored in this model, the full cycle time durations are optimistic. Realistic cycle times will increase due to the transition phase between reel out and reel in, which is unaccounted for in this model.
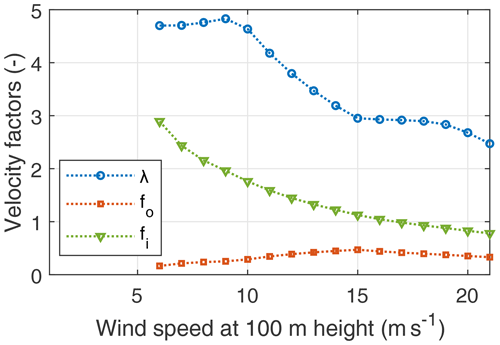
Figure 21Mean kite tangential speed factor λ, reel-out factor fo, and reel-in factor fi as functions of the wind speed.
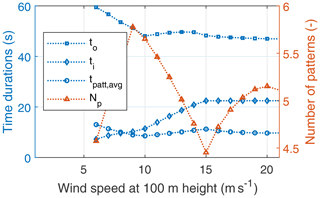
Figure 22Reel-out time to, reel-in time ti, average pattern time tpatt,avg, and number of patterns per cycle Np as functions of the wind speed.
Figure 23 shows the average pattern height, pattern radius, stroke length, maximum tether length, and minimum tether length. The average pattern height is the height of the centre point of the pattern at half of the stroke length. The minimum tether length and, consequently, the pattern radius and height are primarily driven by the ground clearance constraint, pattern elevation angle, and cone opening angle. In reality, they will also be influenced by the effect of the centrifugal force, which is ignored in the quasi-steady approach. As the elevation angle increases, the required minimum tether length is reduced. The maximum tether length is driven by the optimised stroke length.
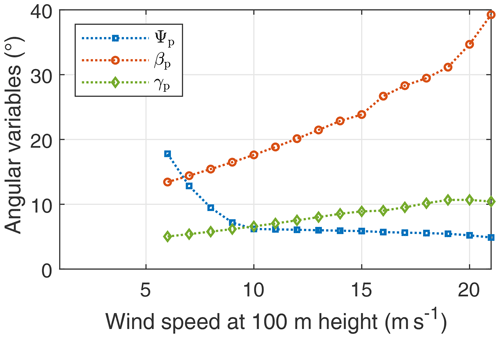
Figure 24 shows the roll, pattern elevation, and opening cone angles. The roll angle is the deviation of the resultant aerodynamic force vector with respect to the radial direction. The pattern elevation angle increases with the wind speed. This quasi-steady flight state results from the trade-off between an increase in incoming wind speed, an increase in cosine losses due to gravity, and a decrease in reel-in power with a higher elevation angle. The optimiser trades all these factors to maximise the average cycle power at each wind speed.
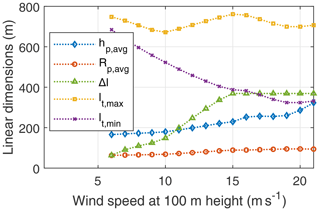
Figure 23Average pattern height hp,avg, average pattern radius Rp,avg, stroke length Δl, maximum tether length lt,max, and minimum tether length lt,min as functions of the wind speed.
3.1.3 Forces and operational parameters over one cycle
The maximum convertible power is limited by the generator rated power, which in our specific example is 375 kW, as given in Table 4. To enforce this hardware limit in the third wind speed regime, the operational parameters have to be modulated. Figure 25 shows the mechanical, electrical, and electrical cycle power over a single pumping cycle at the rated wind speed of 15 ms−1. The delivered rated power of 150 kW is the electrical cycle average power. The difference in the instantaneous mechanical and electrical power is due to the drivetrain efficiency.
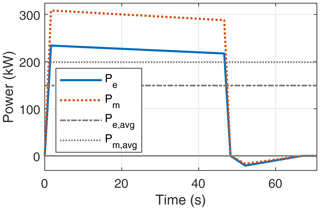
Figure 25Instantaneous powers Pe and Pm together with net powers Pe,avg and Pm,avg over one pumping cycle at a rated wind speed of 15 ms−1.
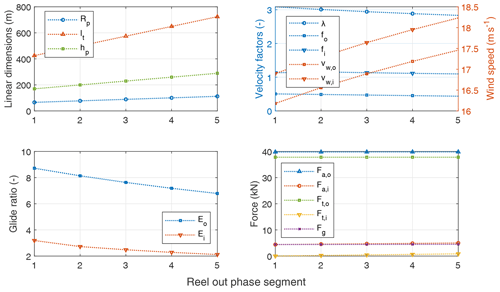
The power profile during the cycle has a slight downward trend during the reel out and an upward trend during the reel in. This is explained using Fig. 26. For the quasi-steady-state evaluation, the reel-out phase is discretised into five segments arranged in sequence on the horizontal axes of the diagrams. The cycle begins with a tether length of around 400 m, and the reel-out phase ends with a tether length of around 700 m. The average pattern height and the pattern radius increase during the reel-out phase. Due to the gain in height, the kite experiences a higher wind speed vw as it climbs up. Due to the increasing tether length, the overall drag of the system increases, and hence the glide ratio decreases. Hence, to respect the relation given by Eq. (28), the kite speed has to drop, reflected in the reeling and tangential velocity factors. Since the tether force is already maximised, the overall power decreases due to a lower reel-out speed.
3.2 Effect of gravity
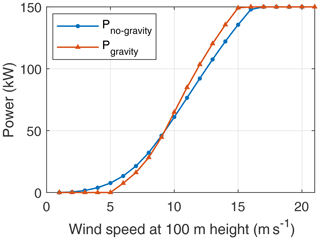
Figure 27 shows the power curve comparison between two simulations, one with gravity and one without, including the effect of gravity (i.e. weight). Gravity has a negative impact on operation at low wind speeds because this affects the attainable reel-out power substantially. Hence, the simulation without gravity yields better performance at lower wind speeds than the one including gravity. But for higher wind speeds, this effect is superseded by its impact on the reel-in phase. As explained in Sect. 2.4, the weight assists in the retraction phase, positively impacting the net cycle power output. The kite is pitched in such a way that the resultant aerodynamic force vector balances the gravitational force vector, hence reducing the tether force magnitude in the quasi-steady force balance. The kite can be retracted faster without consuming a lot of energy.
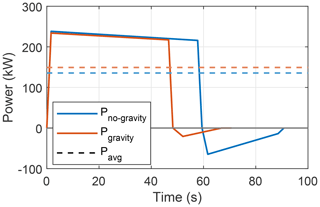
Figures 28 and 29 detail the effect of gravity on a pumping cycle for a lower wind speed of 6 ms−1 and the rated wind speed 15 ms−1. The reel-out power without the effect of gravity is substantially higher at 6 ms−1 than at 15 ms−1. The net difference between the energy generated during reel out and consumed during reel in leads to higher net average power for the case without gravity at 6 ms−1 than at 15 ms−1. This shows that excluding gravity in the analysis does not necessarily lead to optimistic results. In any case, including gravity should always be the more realistic simulation for the pumping cycle.
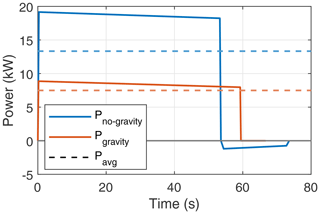
Figure 28Cycle power comparison with and without the effect of gravity for a low wind speed of 6 ms−1.
3.3 Effect of scaling
One of the primary purposes of this model is to capture the effects of scaling on the performance of fixed-wing AWE systems. Due to the interdisciplinary nature of AWE systems, multiple trade-offs must be considered. The kite and the tether are the primary aspects affecting the system's performance. The performance metric used is the power harvesting factor ζ defined as
where P is the extracted mechanical power, and PwS is the available power in the wind. This metric is based only on the reel-out power and does not consider the reel-in power. The force a tether can withstand for a given material strength is proportional to its diameter as shown in Eq. (12). The kite should also be able to withstand this tether force; hence, with increasing tether force, the structural mass of the kite increases to support the increasing wing loading. Though increasing the tether force will enable the extraction of more power, the consequent increase in kite mass will decrease the performance. Moreover, the contribution of tether drag will increase with increasing diameter, consequently penalising the extractable power.
Figure 30 shows the effect of tether diameter on the performance of an AWE system. For a kite with the same wing area, the mass increases with increasing tether force as given in Eq. (20). This increase in kite mass negatively impacts the attainable reel-out power. For this simulation, the performance is maximum when using a tether with a diameter of around 3.8 cm. Similarly, Fig. 31 shows the effect of scaling the wing area on the performance of an AWE system. For the chosen tether, the kite wing area which maximises power is 50 m2.
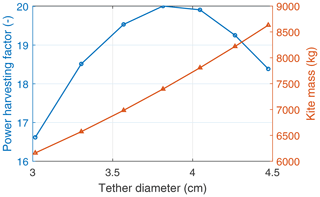
Figure 30Effect of tether diameter on the performance of an AWE system with a fixed kite wing area of 100 m2 at a constant wind speed of 12 ms−1.
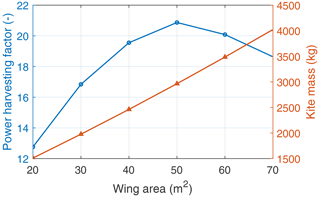
Figure 31Effect of wing area on the performance of a system with a fixed tether diameter of 2.7 cm at a wind speed of 12 ms−1.
Figure 32 shows the effect of the tether diameter on the performance of a system with a fixed kite wing area of 100 m2 for the complete operational wind speed range. As seen from Fig. 30, the kite mass of a system with smaller tether tension is lower. Lighter kites will experience lower gravitational loss and will hence perform better at lower wind speeds. At higher wind speeds, the maximum tether force limits the extractable power. Therefore, for a given wing area, systems with thinner tethers, i.e. lower Ft,max, perform better at lower wind speeds, and systems with larger tethers, i.e. higher Ft,max, perform better at higher wind speeds.
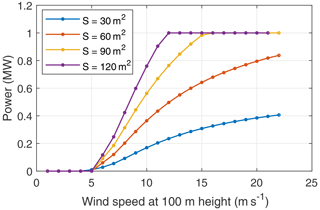
Figure 33 shows the wing area's effect on a system's performance with a fixed wing loading for the complete operational wind speed range. Fixed wing loading is used instead of a fixed tether force since simulation results of a high tether force coupled to a small kite and vice versa do not converge for the entire operational wind speed range. A larger tether force demands a stronger kite, resulting in a heavier one. This configuration cannot produce positive net cycle power at low wind speeds. Therefore, the choice of tether force for a given wing area must fall in a certain range to have converged results for the entire operational wind speed range. The system performs better with increasing wing area, but these gains diminish since the penalising effect of the gravitational force scales faster than the performance gain.
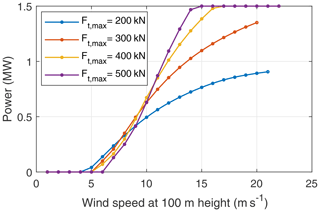
Figure 32Effect of scaling the tether (diameter) on the performance of a system with a fixed kite wing area of 100 m2 for the complete operational wind speed range.
3.4 Discussion
The results show that the proposed model captures all relevant dependencies between the system components, allowing for the evaluation of different trade-offs at play. Since the model is based on a quasi-steady flight motion, the results are expected to be optimistic predictions of a real system's performance. Since the model relies on a limited set of input parameters defining an AWE system, it is suitable for coupling with similar-fidelity cost models, as proposed in Joshi and Trevisi (2024). The present modelling approach does not account for the various effects of inertia responsible for losses in the different operational phases.
For example, centrifugal acceleration is important during sharp turning manoeuvres, and its effect needs to be balanced by an aerodynamic side force component. A fixed-wing kite generates this side force component by rolling toward the turning axis, reducing the aerodynamic force available for conversion into electricity, thus representing a loss. On the other hand, the path-aligned acceleration introduces a history term in the kite's equations of motion, affecting the temporal progress along the flight path. For relatively lightweight soft-wing kites, these two inertial effects have only a minor effect on the power output and are thus generally neglected. However, with an increasing mass-to-wing surface ratio the contribution of inertia becomes more important. An accompanying study by Van Deursen (2024) showed that for heavier kites, the different acceleration terms can lead to quite complex superposition effects. Because it is not possible to account for all acceleration terms in a quasi-steady modelling framework, we decided to neglect all inertial effects and instead use existing 6-DOF dynamic simulation results for validation.
Moreover, the transition times between the reel-out and reel-in phases are not considered in the present modelling framework. Because of the alternating loading and unloading of the airborne subsystem, the tether alternates between straightening and sagging. Straightening and sagging take time during which no work is performed. The kite moves radially away from or toward the ground, while the winch does not reel. This hysteresis effect represents a loss for the pumping cycle operation. Eijkelhof and Schmehl (2022) found that the kite needs to be slowed down at the start and end of the transition phase to avoid tether rupture due to the change in the magnitude of forces. This effect is also known as the “whiplash effect”. The present model cannot estimate the reel-out power oscillations due to the acceleration and deceleration of the kite when it follows the prescribed flight path.
The model and simulation results in this paper are not validated against measurement data. SkySails Power GmbH, a German company, released a certified power curve of their PN-14 system based upon the IEC 61400-12-1 standard used for conventional wind turbines (Bartsch et al., 2024). They reported good agreement between their measurements and their simulation results. Figure 34 shows an overlay of their measurements against the 150 kW simulation results from Sect. 3.1. This is not a performance comparison since the technologies and their system characteristics differ significantly, but the systems do have similar power ratings. The IEC standard requires multiple changes considering the differences between conventional wind turbines and AWE systems, such as the definition of the reference height, the wind range, the method of averaging over time, the incorporation of the number of cycles in averaging, etc. The reference height proposed by SkySails Power is 200 m, which is closer to the average operational height of their system. Alignment with the reference height for wind speed measurements while communicating the power curve is essential for fair comparisons. As the AWE sector advances rapidly, there is an increasing need for dedicated IEC standards to validate the power curve of AWE systems.
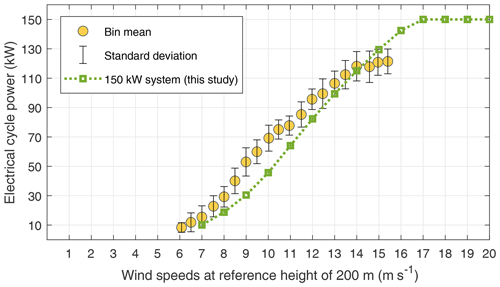
Figure 34Overlay of the power curve of the 150 kW system over SkySails Powers' validated power curve of SKS PN-14 (Bartsch et al., 2024).
The quasi-steady model presented in this paper enables fast power curve computations based on a limited set of input parameters. It is useful for understanding the fundamental physical behaviour of fixed-wing ground-generation AWE systems and is suitable for sensitivity analysis and estimating AWE systems' theoretical potential. The model can easily be coupled to systems engineering tools, cost models, and larger-scale energy system models. It may thus help to create technology development roadmaps, investigate scaling potential, and define research targets to validate assumptions.
Kite mass is a key parameter influencing the performance of systems, primarily at lower wind speeds. A higher mass leads to a larger component of the generated aerodynamic force needed to compensate for the gravitational force, reducing the usable mechanical power. On the other hand, gravity positively impacts performance at higher wind speeds by reducing the required energy during reel in. The tether diameter and the kite's structural mass are coupled to design an optimised system. The maximum force-bearing capacity of the tether is directly proportional to the diameter of the tether, and a higher tether force requires a structurally stronger kite. Hence, choosing a tether with a larger force-bearing capacity also increases the kite mass, negatively impacting the performance at low wind speeds but enabling higher power extraction at higher wind speeds. This trade-off becomes critical for choosing the optimal tether–kite combination based on site-specific requirements. Upscaling results in a diminishing gain in performance with an increase in kite wing area. Integrating the prescribed model in a system design optimisation framework provides a computational design tool that accounts for the multiple trade-offs for site-specific design. The system design parameters, such as the kite wing area, generator rating, tether diameter, etc., can be optimised to maximise the annual energy production for a specific wind resource. Moreover, annual energy prediction alone will not give the right indication for system design since this metric lacks the influence of costs. To include this important aspect, the presented model can be coupled to a cost model to find the system design that minimises the levelised cost of energy.
Since the presented model is based on the assumption of quasi-steady flight motion, it does not account for inertial effects. These will be significant for larger AWE systems; hence, the model is likely too optimistic in estimating their performance. This approach occupies a middle ground between ideal power extraction and fully resolved dynamic simulations. The outcomes of this analysis define the upper limits that practical systems might approach. Consequently, these models are valuable for determining whether and under what conditions AWE could benefit the entire energy system.
| Greek letters | |
| γ | Cone opening angle |
| β | Elevation angle |
| θ | Polar angle |
| ϕ | Azimuth angle |
| τ | Tangential |
| χ | Course angle |
| σ | Material strength |
| ρ | Material density |
| Ψ | Roll angle |
| α | Wind shear coefficient |
| η | Efficiency |
| λ | Tangential velocity factor |
| ζ | Power harvesting factor |
| Latin letters | |
| S | Wing area |
| AR | Aspect ratio |
| CL | Lift coefficient |
| CD | Drag coefficient |
| F | Force |
| R | Radius |
| v | Velocity |
| L | Lift |
| D | Drag |
| d | Diameter |
| Latin letters | |
| l | Length |
| z | Z-axis co-ordinate |
| h | Height |
| m | Mass |
| t | Time |
| P | Power |
| a | Acceleration |
| N | Number |
| f | Reel-out factor |
| e | Wing planform efficiency factor |
| Subscripts | |
| p | Pattern |
| t | Tether |
| max | Maximum |
| min | Minimum |
| w | Wind |
| k | Kite |
| r | Radial |
| a | Apparent |
| g | Gravity |
| o | Reel out |
| i | Reel in |
| eff | Effective |
| ref | Reference |
| e | Electrical |
| m | Mechanical |
| avg | Average |
| DT | Drivetrain |
| gen | Generator |
| sto | Storage |
| pc | Power converters |
| gb | Gearbox |
The model is implemented in MATLAB and is available on GitHub under the name AWE-Power at https://github.com/awegroup/AWE-Power (Joshi, 2024a). It contains a pre-defined input file, which can be used to run the model and reproduce the results presented in the paper. An instance of the repository is deposited and published on Zenodo and is available open source at https://doi.org/10.5281/zenodo.13842298 (Joshi, 2024b).
The company-specific data sets are not publicly available since they are regarded as confidential information.
Conceptualisation: RJ, MK, and RS; methodology: RJ, MK, and RS; software: RJ; validation: RJ and MK; writing (original draft preparation): RJ and MK; writing (review and editing): RS; supervision: MK and RS; funding acquisition: MK and RS.
At least one of the (co-)authors is a member of the editorial board of Wind Energy Science. The peer-review process was guided by an independent editor, and the authors also have no other competing interests to declare.
Publisher’s note: Copernicus Publications remains neutral with regard to jurisdictional claims made in the text, published maps, institutional affiliations, or any other geographical representation in this paper. While Copernicus Publications makes every effort to include appropriate place names, the final responsibility lies with the authors.
The authors thank Ampyx Power B.V. for providing reference data and inputs. The development of the associated code repository was supported by the Digital Competence Centre, Delft University of Technology.
This research has been supported by the Nederlandse Organisatie voor Wetenschappelijk Onderzoek (grant no. 17628) and Interreg North-West Europe (MegaAWE project).
This paper was edited by Jonathan Whale and reviewed by two anonymous referees.
Anderson, J. D.: Fundamentals of Aerodynamics, 6th Edn., McGraw-Hill, ISBN 1259129918, 2016. a
Argatov, I., Rautakorpi, P., and Silvennoinen, R.: Estimation of the mechanical energy output of the kite wind generator, Renew. Energ., 34, 1525–1532, https://doi.org/10.1016/j.renene.2008.11.001, 2009. a
Bartsch, T., Knipper, P., Grazianski, S., Noga, R., and Paulig, X.: SkySails PN-14 Power Curve Measurement, in: The 10th International Airborne Wind Energy Conference (AWEC 2024): Book of Abstracts, edited by: Sánchez-Arriaga, G., Thoms, S., and Schmehl, R., Delft University of Technology, Madrid, Spain, http://resolver.tudelft.nl/uuid:24968992-e316-4fa5-be53-4b601f92bf09 (last access: 8 November 2024), 2024. a, b
Bechtle, P., Schelbergen, M., Schmehl, R., Zillmann, U., and Watson, S.: Airborne wind energy resource analysis, Renew. Energ., 141, 1103–1116, https://doi.org/10.1016/j.renene.2019.03.118, 2019. a
Bonnin, V.: An Analytical Performance Model for AP-4 Conceptual Design Phase, in: The 8th International Airborne Wind Energy Conference (AWEC 2019): Book of Abstracts, edited by: Schmehl, R. and Tulloch, O., University of Strathclyde | Delft University of Technology, Glasgow, United Kingdom, https://repository.tudelft.nl/record/uuid:e0a4471b-c11b-4c47-b409-45d62974ce94 (last access: 8 November 2024), 2019. a
Bosman, R., Reid, V., Vlasblom, M., and Smeets, P.: Airborne Wind Energy Tethers with High-Modulus Polyethylene Fibers, in: Airborne Wind Energy, edited by: Ahrens, U., Diehl, M., and Schmehl, R., Green Energy and Technology, chap. 33, 563–585, Springer, Berlin Heidelberg, https://doi.org/10.1007/978-3-642-39965-7_33, 2013. a
Echeverri, P., Fricke, T., Homsy, G., and Tucker, N.: The Energy Kite: Selected Results From the Design, Development and Testing of Makani’s Airborne Wind Turbines, Technical report, Makani, https://storage.googleapis.com/x-prod.appspot.com/files/Makani_TheEnergyKiteReport_Part1.pdf, (last access: 19 January 2024), 2020. a, b
Eijkelhof, D. and Schmehl, R.: Six-degrees-of-freedom simulation model for future multi-megawatt airborne wind energy systems, Renew. Energ., 196, 137–150, https://doi.org/10.1016/j.renene.2022.06.094, 2022. a, b, c, d, e, f, g, h, i
Eijkelhof, D., Rossi, N., and Schmehl, R.: Optimal Flight Pattern Debate: Circular vs. Figure-Of-Eight, in: The 10th International Airborne Wind Energy Conference (AWEC 2024): Book of Abstracts, edited by: Sánchez-Arriaga, G., Thoms, S., and Schmehl, R., Delft University of Technology, Madrid, Spain, https://pure.tudelft.nl/ws/portalfiles/portal/203215332/Optimal_Flight_Pattern_Debate.pdf (last access: 8 November 2024), 2024. a
Enerkíte: Homepage, https://enerkite.de/en/ (last access: 7 August 2024), 2024. a
Faggiani, P. and Schmehl, R.: Design and Economics of a Pumping Kite Wind Park, in: Airborne Wind Energy – Advances in Technology Development and Research, edited by: Schmehl, R., Green Energy and Technology, chap. 16, 391–411, Springer, Singapore, https://doi.org/10.1007/978-981-10-1947-0_16, 2018. a
Fechner, U. and Schmehl, R.: Model-Based Efficiency Analysis of Wind Power Conversion by a Pumping Kite Power System, in: Airborne Wind Energy, edited by: Ahrens, U., Diehl, M., and Schmehl, R., Green Energy and Technology, chap. 14, 249–269, Springer, Berlin Heidelberg, https://doi.org/10.1007/978-3-642-39965-7_14, 2013. a, b
Haas, T., Schutter, J. D., Diehl, M., and Meyers, J.: Wake characteristics of pumping mode airborne wind energy systems, J. Phys. Conf. Ser., 1256, 012016, https://doi.org/10.1088/1742-6596/1256/1/012016, 2019. a, b
Hagen, L. V., Petrick, K., Wilhelm, S., and Schmehl, R.: Life-Cycle Assessment of a Multi-Megawatt Airborne Wind Energy System, Energies, 16, 1750, https://doi.org/10.3390/en16041750, 2023. a, b
Hardham, C.: Response to the Federal Aviation Authority, Tech. rep., Makani Power, https://www.regulations.gov/comment/FAA-2011-1279-0014 (last access: 8 November 2024), 2012. a, b
Heilmann, J. and Houle, C.: Economics of Pumping Kite Generators, in: Airborne Wind Energy, edited by Ahrens, U., Diehl, M., and Schmehl, R., Green Energy and Technology, chap. 15, 271–284, Springer, Berlin Heidelberg, https://doi.org/10.1007/978-3-642-39965-7_15, 2013. a
Houska, B. and Diehl, M.: Optimal Control of Towing Kites, in: Proceedings of the 45th IEEE Conference on Decision and Control, 2693–2697, IEEE, https://doi.org/10.1109/CDC.2006.377210, 2006. a, b
Joshi, R.: awegroup/AWE-Power, GitHub [code], https://github.com/awegroup/AWE-Power (last access: 8 November 2024), 2024a. a
Joshi, R.: AWE-Power (v0.1.0), Zenodo [code], https://doi.org/10.5281/zenodo.13842298, 2024b. a
Joshi, R. and Trevisi, F.: Reference economic model for airborne wind energy systems, Technical report, IEA Wind TCP Task 48, https://doi.org/10.5281/zenodo.10959930, 2024. a
Joshi, R., von Terzi, D., Kruijff, M., and Schmehl, R.: Techno-economic analysis of power smoothing solutions for pumping airborne wind energy systems, J. Phys. Conf. Ser., 2265, 042069, https://doi.org/10.1088/1742-6596/2265/4/042069, 2022. a, b
Joshi, R., Kruijff, M., and Schmehl, R.: Value-Driven System Design of Utility-Scale Airborne Wind Energy, Energies, 16, 2075, https://doi.org/10.3390/en16042075, 2023. a, b, c
Kitekraft: Homepage, https://www.kitekraft.de/ (last access: 7 August 2024), 2024. a
Kitemill: Homepage, https://www.kitemill.com/, (last access: 7 August 2024), 2024. a
Kitepower: Homepage, https://thekitepower.com/, (last access: 7 August 2024), 2024. a
Kruijff, M. and Ruiterkamp, R.: A Roadmap Towards Airborne Wind Energy in the Utility Sector, in: Airborne Wind Energy – Advances in Technology Development and Research, edited by: Schmehl, R., Green Energy and Technology, chap. 26, 643–662, Springer, Singapore, https://doi.org/10.1007/978-981-10-1947-0_26, 2018. a, b, c, d, e, f, g
Licitra, G., Koenemann, J., Bürger, A., Williams, P., Ruiterkamp, R., and Diehl, M.: Performance assessment of a rigid wing Airborne Wind Energy pumping system, Energy, 173, 569–585, https://doi.org/10.1016/j.energy.2019.02.064, 2019. a, b
Loyd, M. L.: Crosswind kite power, J. Energy, 4, 106–111, https://doi.org/10.2514/3.48021, 1980. a, b
Luchsinger, R. H.: Pumping Cycle Kite Power, in: Airborne Wind Energy, edited by: Ahrens, U., Diehl, M., and Schmehl, R., Green Energy and Technology, chap. 3, 47–64, Springer, Berlin Heidelberg, https://doi.org/10.1007/978-3-642-39965-7_3, 2013. a, b
Makani: Homepage, https://x.company/projects/makani/ (last access: 7 August 2024), 2020. a
Malz, E., Koenemann, J., Sieberling, S., and Gros, S.: A reference model for airborne wind energy systems for optimization and control, Renew. Energ., 140, 1004–1011, 2019. a
Mozaero: Homepage, https://www.mozaero.com/ (last access: 7 August 2024), 2024. a
Oehler, J. and Schmehl, R.: Aerodynamic characterization of a soft kite by in situ flow measurement, Wind Energ. Sci., 4, 1–21, https://doi.org/10.5194/wes-4-1-2019, 2019. a
Paelink, R. and Rand, K.: Progress Along the Long and Windy Road, in: The 10th International Airborne Wind Energy Conference (AWEC 2024): Book of Abstracts, edited by: Sánchez-Arriaga, G., Thoms, S., and Schmehl, R., Delft University of Technology, Madrid, Spain, http://resolver.tudelft.nl/uuid:5b930d4b-7f26-42c2-a94f-8857f9641d96 (last access: 8 November 2024), 2024. a, b
Peterson, E. W. and Hennessey, J. P. J.: On the use of power laws for estimates of wind power potential, J. Appl. Meteorol. Clim., 17, 390–394, 1978. a
Ranneberg, M., Wölfle, D., Bormann, A., Rohde, P., Breipohl, F., and Bastigkeit, I.: Fast Power Curve and Yield Estimation of Pumping Airborne Wind Energy Systems, in: Airborne Wind Energy – Advances in Technology Development and Research, edited by: Schmehl, R., Green Energy and Technology, chap. 25, 623–641, Springer, Singapore, https://doi.org/10.1007/978-981-10-1947-0_25, 2018. a
Roskam, J.: Airplane Design: Part V, Component Weight Estimation, Roskam Aviation and Engineering Corporation, ISBN 978-1-884885-50-1, 1989. a, b
Rossi, N.: Performance comparison and flight controller of circular and figure-of-eight paths for fixed-wing airborne wind energy systems, Master's thesis, University of Trento, https://doi.org/10.5281/zenodo.10160420, 2023. a
Ruiterkamp, R. and Sieberling, S.: Description and Preliminary Test Results of a Six Degrees of Freedom Rigid Wing Pumping System, in: Airborne Wind Energy, edited by: Ahrens, U., Diehl, M., and Schmehl, R., Green Energy and Technology, chap. 26, 443–458, Springer, Berlin Heidelberg, https://doi.org/10.1007/978-3-642-39965-7_26, 2013. a, b, c
Schelbergen, M. and Schmehl, R.: Validation of the quasi-steady performance model for pumping airborne wind energy systems, J. Phys. Conf. Ser., 1618, 032003, https://doi.org/10.1088/1742-6596/1618/3/032003, 2020. a
Schelbergen, M., Kalverla, P. C., Schmehl, R., and Watson, S. J.: Clustering wind profile shapes to estimate airborne wind energy production, Wind Energ. Sci., 5, 1097–1120, https://doi.org/10.5194/wes-5-1097-2020, 2020. a, b
Schmehl, R., Noom, M., and Van der Vlugt, R.: Traction Power Generation with Tethered Wings, in: Airborne Wind Energy, edited by: Ahrens, U., Diehl, M., and Schmehl, R., Green Energy and Technology, chap. 2, 23–45, Springer, Berlin Heidelberg, https://doi.org/10.1007/978-3-642-39965-7_2, 2013. a, b, c, d, e
Schutter, J. D., Leuthold, R., Bronnenmeyer, T., Malz, E., Gros, S., and Diehl, M.: AWEbox: An Optimal Control Framework for Single- and Multi-Aircraft Airborne Wind Energy Systems, Energies, 16, 1900, https://doi.org/10.3390/en16041900, 2023. a
SkySails: Homepage, https://skysails-power.com/ (last access: 7 August 2024), 2024. a
Sommerfeld, M., Dörenkämper, M., De Schutter, J., and Crawford, C.: Scaling effects of fixed-wing ground-generation airborne wind energy systems, Wind Energ. Sci., 7, 1847–1868, https://doi.org/10.5194/wes-7-1847-2022, 2022. a
Trevisi, F., Gaunaa, M., and McWilliam, M.: Unified engineering models for the performance and cost of ground-gen and fly-gen crosswind airborne wind energy systems, Renew. Energ., 162, 893–907, https://doi.org/10.1016/j.renene.2020.07.129, 2020. a
Trevisi, F., Riboldi, C. E. D., and Croce, A.: Refining the airborne wind energy system power equations with a vortex wake model, Wind Energ. Sci., 8, 1639–1650, https://doi.org/10.5194/wes-8-1639-2023, 2023. a
TwingTec: Homepage, https://twingtec.ch/ (last access: 7 August 2024), 2024. a
Van der Vlugt, R., Bley, A., Noom, M., and Schmehl, R.: Quasi-steady model of a pumping kite power system, Renew. Energ., 131, 83–99, https://doi.org/10.1016/j.renene.2018.07.023, 2019. a, b, c, d
Van Deursen, V.: Dynamic simulation techniques for airborne wind energy systems – Evaluating the role of kite inertia in a soft-wing system operated in pumping cycles, Master's thesis, Delft University of Technology, https://resolver.tudelft.nl/uuid:bb32fc5b-300a-4789-9b48-90927f035378 (last access: 8 November 2024), 2024. a
Vimalakanthan, K., Caboni, M., Schepers, J., Pechenik, E., and Williams, P.: Aerodynamic analysis of ampyx's airborne wind energy system, J. Phys. Conf. Ser., 1037, 062008, https://doi.org/10.1088/1742-6596/1037/6/062008, 2018. a, b, c, d, e
Williams, P., Sieberling, S., and Ruiterkamp, R.: Flight Test Verification of a Rigid Wing Airborne Wind Energy System, in: 2019 American Control Conference (ACC), 2183–2190, https://doi.org/10.23919/ACC.2019.8814338, 2019. a, b


