the Creative Commons Attribution 4.0 License.
the Creative Commons Attribution 4.0 License.
 | 02 Feb 2024
Optimal position and distribution mode for on-site hydrogen electrolyzers in onshore wind farms for a minimal levelized cost of hydrogen (LCoH)
Thorsten Reichartz
Georg Jacobs
Tom Rathmes
Lucas Blickwedel
Ralf Schelenz
Storing energy is a major challenge in achieving a 100 % renewable energy system. One promising approach is the production of green hydrogen from wind power. This work proposes a method for optimizing the design of wind–hydrogen systems for existing onshore wind farms in order to achieve the lowest possible levelized cost of hydrogen (LCoH). This is done by the application of a novel Python-based optimization model that iteratively determines the optimal electrolyzer position and distribution mode of hydrogen for given wind farm layouts. The model includes the costs of all required infrastructure components. It considers peripheral factors such as existing and new roads, necessary power cables and pipelines, wage and fuel costs for truck transportation, and the distance to the point of demand (POD). Based on the results, a decision can be made whether to distribute the hydrogen to the POD by truck or pipeline.
For a 23.4 MW onshore wind farm in Germany, a minimal LCoH of EUR 4.58 at an annual hydrogen production of 241.4 is computed. These results are significantly affected by the position of the electrolyzer, the distribution mode, varying wind farm and electrolyzer sizes, and the distance to the POD. The influence of the ratio of electrolyzer power to wind farm power is also investigated. The ideal ratio between the rated power of the electrolyzer and the wind farm lies at around 10 %, with a resulting capacity factor of 78 % for the given case.
The new model can be used by system planners and researchers to improve and accelerate the planning process for wind–hydrogen systems. Additionally, the economic efficiency, hence competitiveness, of wind–hydrogen systems is increased, which contributes to an urgently needed accelerated expansion of electrolyzers. The results of the influencing parameters on the LCoH will help to set development goals and indicate a path towards a cost-competitive green wind–hydrogen system.
- Article
(3133 KB) - Full-text XML
- BibTeX
- EndNote


The International Energy Agency (IEA) projects that global demand for hydrogen will nearly double by 2030 from 2021 levels. Today, less than 1 % of the world's hydrogen production is low-emission hydrogen, while 99 % is produced either from fossil fuels or as a by-product (IEA, 2021). To meet the future demand for green hydrogen, the European Union has set a target of 40 GW of installed electrolyzer capacity in 2030 (European Commission, 2020). Part of the electrolysis capacity will be built in combination with wind farms, as encouraged by the European Commission (European Commission, 2023). In this way, electrolyzers can reduce grid-induced curtailment of wind turbines, increase the utilization of wind farms, and enable the storage of large amounts of renewable energy in the form of hydrogen. However, the rate of electrolyzer deployment is currently low at less than 0.5 GW a−1 in the EU (Ueckerdt et al., 2021). There are a number of reasons for this, but one of the most important is the high levelized cost of hydrogen (LCoH). The main drivers for the high LCoH of green hydrogen are the high investment costs for electrolyzers and the electricity costs (Ajanovic et al., 2022).
One possible way to reduce the LCoH is to further reduce the levelized cost of electricity (LCoE) of wind turbines and farms. However, the LCoE of wind energy is already low and is unlikely to fall by orders of magnitude in the near future (Bošnjaković et al., 2022). As a result, energy costs, which account for about 40 % of the LCoH, will remain high (Ajanovic et al., 2022). The capital cost of electrolyzers will decrease in the future, due to scale-up effects and further technology improvements (IRENA, 2020). But wind farm planning has little to no influence on these developments. Therefore, in order to reduce the LCoH, wind farm developers will need to take advantage of the freedom in the design of the wind–hydrogen system. Numerous studies have addressed the subject, including Hofrichter et al. (2023b), who investigated the optimal power ratio of electrolyzers and renewable energy sources. Their analysis covered wind farm sites characterized by varying full-load hours (FLH) but did not consider hydrogen transportation costs nor on-site electrolyzer positioning. Similarly, Schnuelle et al. (2020) and Benalcazar and Komorowska (2022) take the macroscopic approach of evaluating sites based on FLH, neglecting hydrogen transport and microscopic assessments that include ancillary infrastructure requirements such as existing roads and water pipelines. In their study on hydrogen production from floating offshore wind, Ibrahim et al. (2022) address the transportation of energy to shore in the form of hydrogen or electricity, considering the central role of energy distribution within energy systems. The study focuses on offshore wind to hydrogen, which limits its transferability to onshore farms. Sens et al. (2022) investigate the ideal locations on a continental and regional scale for hydrogen production from wind and solar to provide hydrogen to Germany, including hydrogen transportation costs, but they only consider pipeline transportation as they focus on large quantities of produced hydrogen. The authors also made it explicit that they excluded transmission costs for electricity and water on-site. While other studies have also analyzed the costs of the necessary infrastructure for hydrogen production and transportation at the macroscopic level (Yang and Ogden, 2007; Reuß, 2019; Correa et al., 2022), transferable models for a specific cost analysis at the wind farm level, including detailed site-specific infrastructure, electrolyzer positioning, and transport mode optimization, are not available. This publication aims to address and fill that gap by answering the following research question and sub-questions:
-
To what extent can wind farm operators and developers reduce the LCoH of green hydrogen produced at wind farm sites?
-
What are relevant influencing factors on the LCoH of on-site wind–hydrogen systems?
-
How can those be modeled?
-
What level of the LCoH can be achieved, and what is the ideal electrolyzer–wind farm power ratio to achieve this minimum, taking into account hydrogen transport and all required infrastructure at a specific wind farm site?
-
Despite the environmental benefits of green hydrogen, its production costs must be reduced in order to compete with grey hydrogen (Ajanovic et al., 2022). Decentralized hydrogen production brings its own challenges, such as the need to position electrolyzers on wind farm sites, establish deionized water and electricity supply, and transport the hydrogen off-site.
To address this issue, this paper introduces a new methodology that can generate wind-farm-specific preliminary designs of the entire wind–hydrogen system and compute the corresponding LCoH. In order to minimize the LCoH, the electrolyzer position and rated power are optimized considering site-specific conditions such as wind farm power and wind conditions. In addition, the hydrogen distribution mode to the point of demand (POD) is optimized. The developed method is based entirely on open-source software.
In Sect. 2, the underlying physical and economic assumptions for dimensioning and selecting the system components are described. In addition, the objective function and the developed optimization algorithm are introduced. In Sect. 3, the results for a case-study wind farm in Germany are presented. Section 4 discusses the results and model limitations and provides an outlook for further research and application.
The method described in the following allows for the preliminary design of a cost-optimal on-site wind–hydrogen system for onshore wind farms. Optimal for this study means that the minimal LCoH is achieved, while all boundary conditions are met. The developed method can be applied to all onshore wind farm sites, although financial parameters need to be adapted regionally.
The combination of electrolyzers with wind farms comes with a large number of degrees of freedom in design. Making simplifying assumptions is imperative in order to manage complexity, ensure transferability, and keep the required computing power within feasible limits.
In Sects. 2.1 and 2.2 all underlying assumptions of the conversion of electricity to hydrogen, storage on-site, and the hydrogen distribution mode are given. In Sect. 2.3 the applied optimization method and the required input data are explained.
The overall goal of a wind–hydrogen system is to generate hydrogen at a wind farm site and transport it to a POD while minimizing cost. The respective objective function is given in Eq. (1). The LCoH is dependent on the total expenditures (TOTEX) and the annual mass of hydrogen produced .
The calculation of TOTEX is performed using the annuity method, with crf as the capital recovery factor, as shown in Eqs. (2) and (3). The weighted average cost of capital (WACC) is assumed to be 7 %, as is often used in other studies focusing on renewable energies (Satymov et al., 2022; Fasihi and Breyer, 2020). The costs of hydrogen transportation to the POD are included in the modeling of the LCoH. Capital expenditures (CAPEX) and operational expenditures (OPEX) of the system components i depend on the selected hydrogen distribution mode d. A total of seven different possible hydrogen distribution modes are considered. These are derived from the possible combinations of trailers and diesel or hydrogen trucks and the distribution of hydrogen by pipeline.
Some TOTEX components are also dependent on the electrolyzer position p at the wind farm site, e.g., power cables, water pipelines, and roads. The lifetime of each component is considered via the parameter n, given in years a.
Figure 1 shows the boundaries of the wind–hydrogen system. CAPEX and OPEX for all components of the hydrogen system are included in the calculation of the LCoH. However, wind farm costs are not considered. This is based on the assumption that the wind farm already has a power grid connection and that its layout is unchanged during the hydrogen layout optimization process. The method currently focuses on the optimization of wind–hydrogen systems for already existing wind farms. The LCoE and the generation profile of the wind farm serve as input variables. Costs for infrastructure at the POD are not included. This does not apply for components necessary for unloading the hydrogen trailers and converting hydrogen back into a gaseous state. This ensures LCoH comparability between different distribution modes.
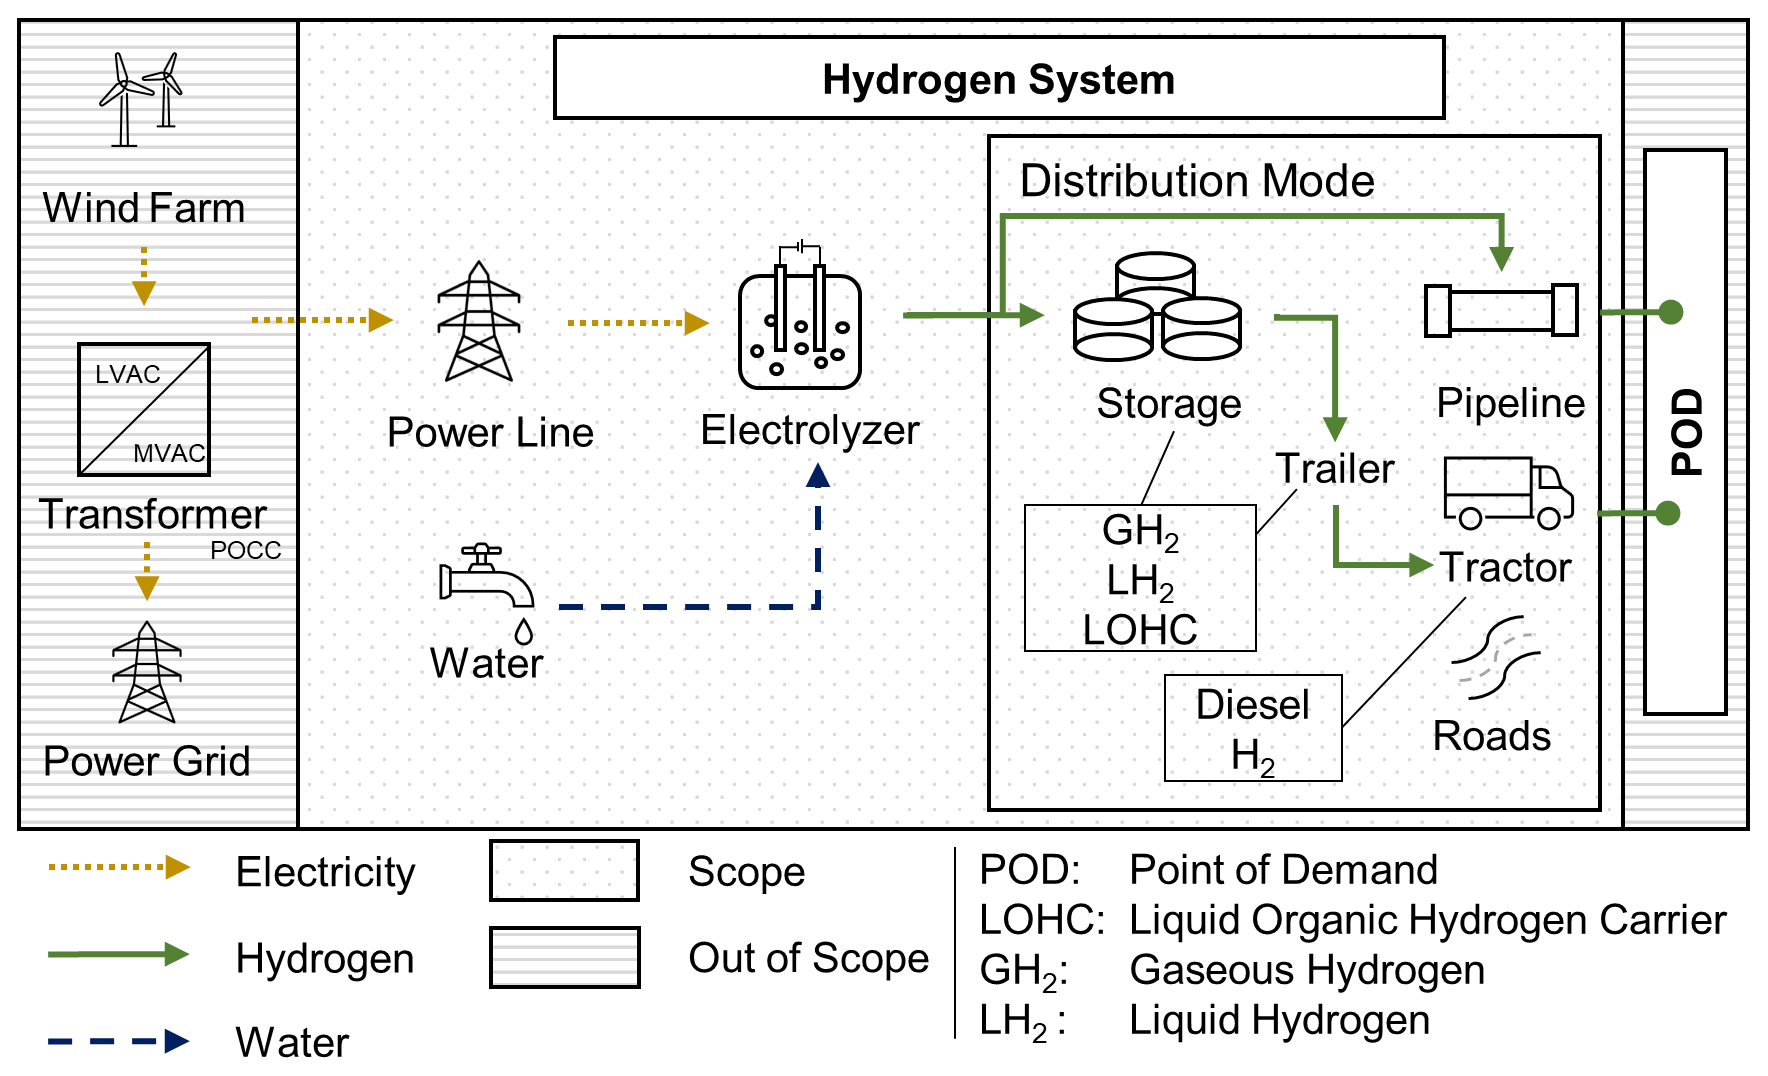
Figure 1Overview of the wind–hydrogen system and system boundaries. Excluding illustration of supporting components. LVAC: low-voltage alternating current, MVAC: medium-voltage alternating current.
2.1 Hydrogen production
Electrolyzers utilize electricity to split water into hydrogen and oxygen. In this model, the required electricity for the electrolysis process is acquired solely from the wind farm. No additional electricity is purchased from the grid to feed the electrolyzer. In this section the electrolyzer and all its auxiliary system components are described. In addition, it is explained how the utilization of the electrolyzer capacity is approximated depending on the given wind farm and the local wind conditions.
2.1.1 Electrolyzer
Various water electrolysis processes exist, differentiated by the applied electrolyte. The most relevant technologies are alkaline electrolysis, proton exchange membrane electrolysis, and solid oxide electrolysis (SOEL). SOEL is still in the development stage and is therefore not included in this study (Buttler and Spliethoff, 2018). There is a trend towards the usage of proton exchange membrane electrolysis (PEMEL) for on-site hydrogen production over the use of alkaline electrolysis (AEL). Since PEMEL has better load flexibility, shorter cold and warm start times, and allows for higher load gradients than AEL, only PEMEL is considered in this study (Buttler and Spliethoff, 2018; Davoudi et al., 2022; Schiebahn et al., 2015; Hermesmann et al., 2021). Estimating the future cost development of electrolyzers is subject to a number of uncertainties, such as the R&D funding and production scale-up effects (Schmidt et al., 2017). Currently, the costs for PEMEL amount in the range of EUR 700 to 1400 (electric; IRENA, 2020). The specific PEMEL costs for this study are therefore estimated to be EUR 1000 .
In current manufacturer specifications for PEMEL, the efficiencies vary widely, ranging from 52 % up to 69 % (Buttler and Spliethoff, 2018). Given that PEMEL is a relatively new technology with anticipated efficiency improvements in the near future, ηEl is assumed to be 70 % (Reuß, 2019). The efficiency of the electrolysis process also depends on the load at which PEMEL is operated (Yodwong et al., 2020). However, this correlation is neglected here.
The electrolyzer utilization, here referred to as capacity factor CFEl, must be calculated specifically for the site in order to be able to calculate the annual hydrogen production of a wind–hydrogen system. This is not trivial since wind energy is a volatile energy source. CFEl is defined as the percentage of hours per year during which the electrolyzer is operated at equivalent rated power PEl, as given in Eq. (4). The energy available for the electrolyzer over a full year WEl is visualized in Fig. 2, and its calculation is explained below.
WEl depends on the amount of electricity generated by the connected wind farm. This energy is defined as the annual energy production (AEP). It is assumed that the difference between the AEP and WEl is fed to the electricity grid. In practice, the accuracy of the AEP estimation can be enhanced by data availability at the wind farm site, e.g., historical SCADA (supervisory control and data acquisition) data.
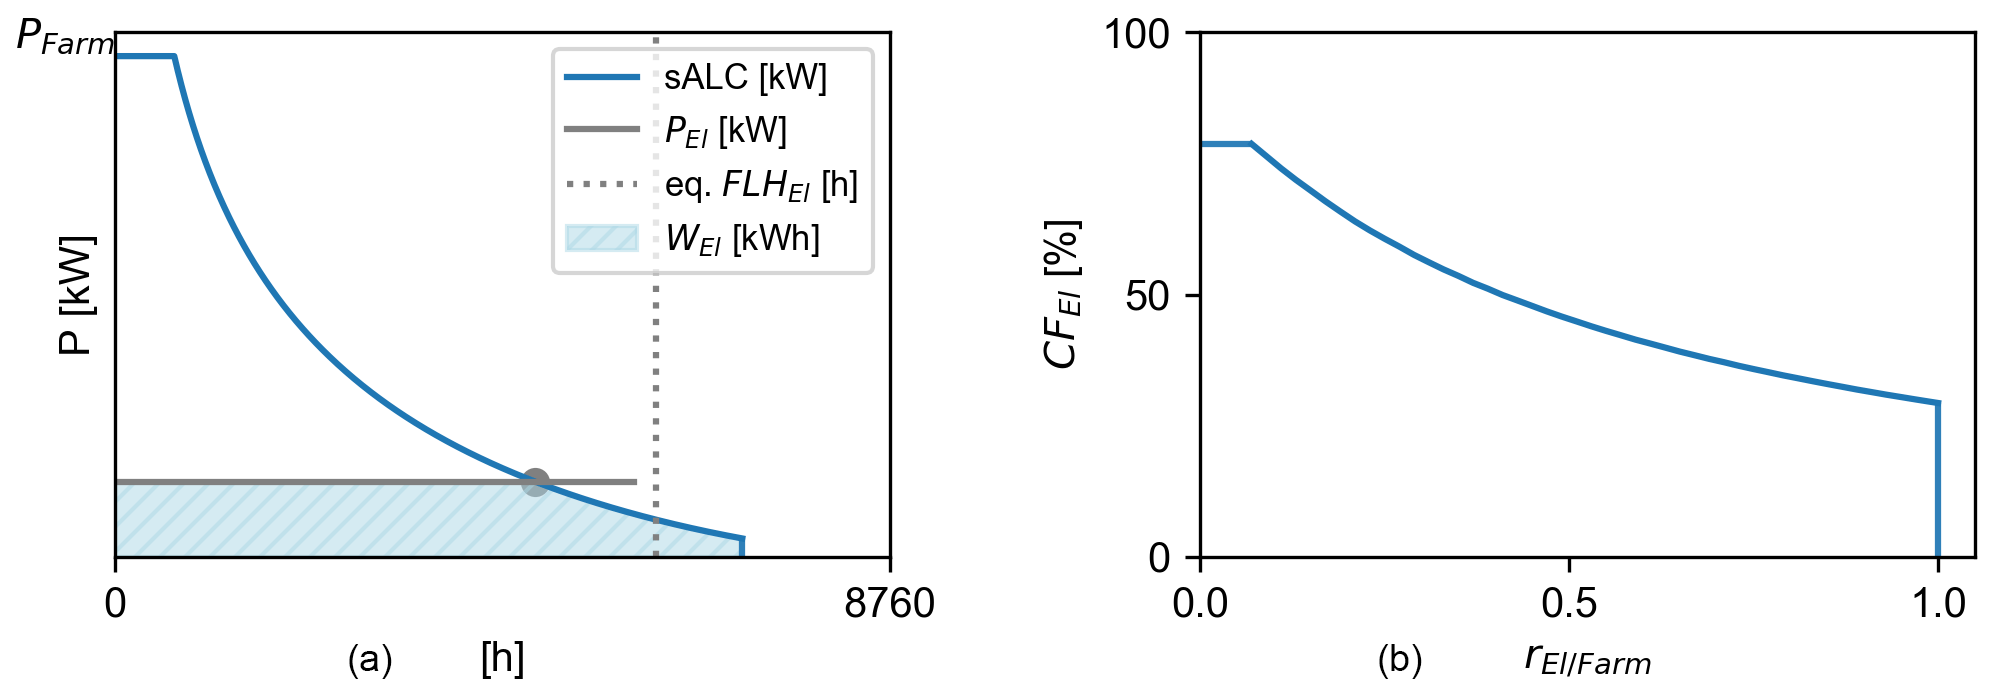
Figure 2(a) Sorted annual load curve for a wind farm site and (b) CFEl depending on the ratio rEl/Farm.
Estimating the AEP based on the sorted annual load curve (sALC) is possible with minimal available data. The sALC is calculated based on the power curve of the turbines used and the Weibull distribution of wind speeds at rotor hub height at the site (Hau, 2016). It is usually calculated for a single turbine. To obtain the sALC of a wind farm, the curve is multiplied by the number of turbines in the farm. This simplification is assumed to be sufficient for the subject of this work. However, a more accurate sALC, considering wind turbine (WT) positions and wake effects, can be generated, for example, using the methodology described by Shapiro et al. (2019) or one of the wake models discussed by Brusca et al. (2018). As shown in Fig. 2, based on the sALC and the rated power of the electrolyzer PEl, the equivalent FLHEl, WEl, and thus CFEl are computed.
In the graph shown on the right in Fig. 2, the correlation of CFEl with the ratio of PEl and PFarm (rEl/Farm) is visualized. It shows that CFEl does not exceed a maximum value of approx. 0.8, as the wind farm does not produce electricity throughout the entire year.
The annual hydrogen production is calculated based on the rated electrolyzer power PEl, the efficiency ηEl, and CFEl, as shown in Eq. (5). The lower heating value of hydrogen is 33.33 (Adolf et al., 2017).
By setting the input parameter PEl, it is now possible to calculate for a specific wind farm and electrolyzer setup.
2.1.2 Electrolyzer power connection
PEMEL operates at 1.4 to 2.5 V DC (IRENA, 2020), whereas a state-of-the-art WT usually produces 690 V AC, which is transformed to medium voltage (10–35 kV) in the turbine (Žarković et al., 2021). The electricity is then accumulated at the point of common coupling (POCC). In this study, it is assumed that the wind farm remains interconnected with the power grid. Consequently, costs for the transformer required at the POCC to adjust the voltage to grid level are not included in the LCoH calculation.
The power cable of the electrolyzer is connected to the POCC. The cable from the POCC to the electrolyzer is modeled as a 33 kV AC underground cable, as commonly used for electrical wind farm networks (Žarković et al., 2021). Its length lcable is the geodesic length between the position of the POCC pPOCC and the position of the electrolyzer pEl. lcable includes an additional safety factor scable which is set as 1.7 to consider terrain and obstacles (Zarkovic et al., 2019).
The electrolyzer power PEl affects the required cable thickness and thus the cable costs. Typically, copper or aluminum cables are used, which can be purchased in a wide variety of diameters. Copper cables are used for this study. Based on the cable costs used by Žarković et al. (2021), the specific cable costs are approximated to be EUR 4.56 plus installation costs. Installation costs are set to EUR 30 000 km−1 (Hau, 2016). Thus, a linear correlation between the cable costs and PEl is assumed. Furthermore, transmission losses are not considered in this work, since cables will mostly cover short distances. An additional converter transformer is required at the electrolyzer to rectify the current for PEMEL and reduce the voltage level. Following Fasihi and Breyer (2020), the converter has specific capital costs of EUR 150 .
2.1.3 Electrolyzer water supply
In addition to electricity, the electrolyzer needs a water supply. Stoichiometrically 9 is necessary for the electrolysis process (Reaction R1). Including losses and an additional 25 % water consumption for equipment cleaning, the real water consumption is approximately 14 (Simoes et al., 2021).
Water demand can be provided from various sources, e.g., industrial wastewater or groundwater. However, additional water treatment is required, and not all water sources are available at every location. Therefore, water consumption is modeled using water from the water grid. For wind farm sites in Germany, the water price is set to EUR 2 (Statistisches Bundesamt, 2020). In the future, globally increasing water scarcity will make an individual consideration of the water supply situation on-site imperative.
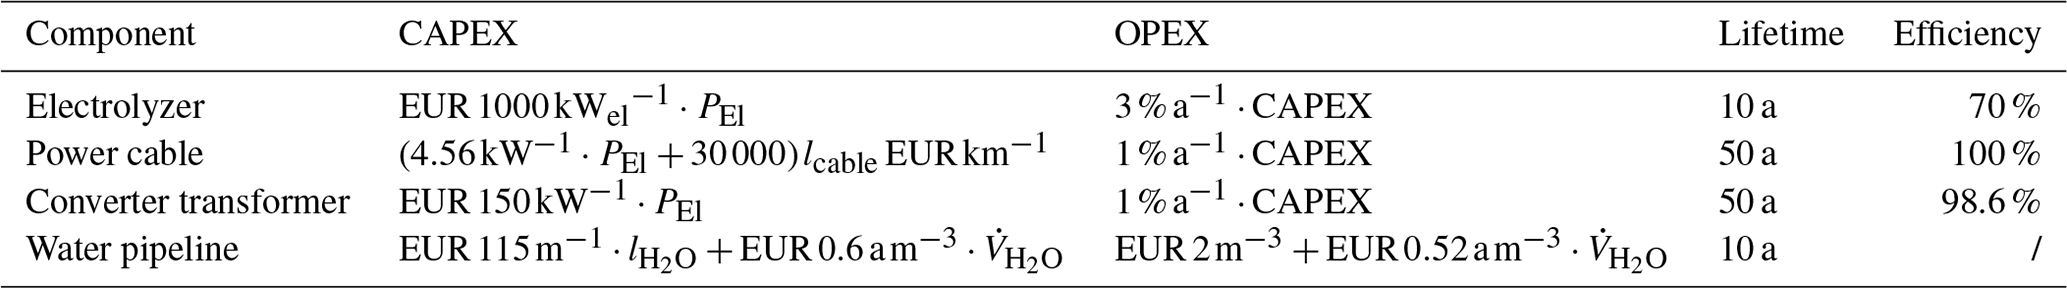
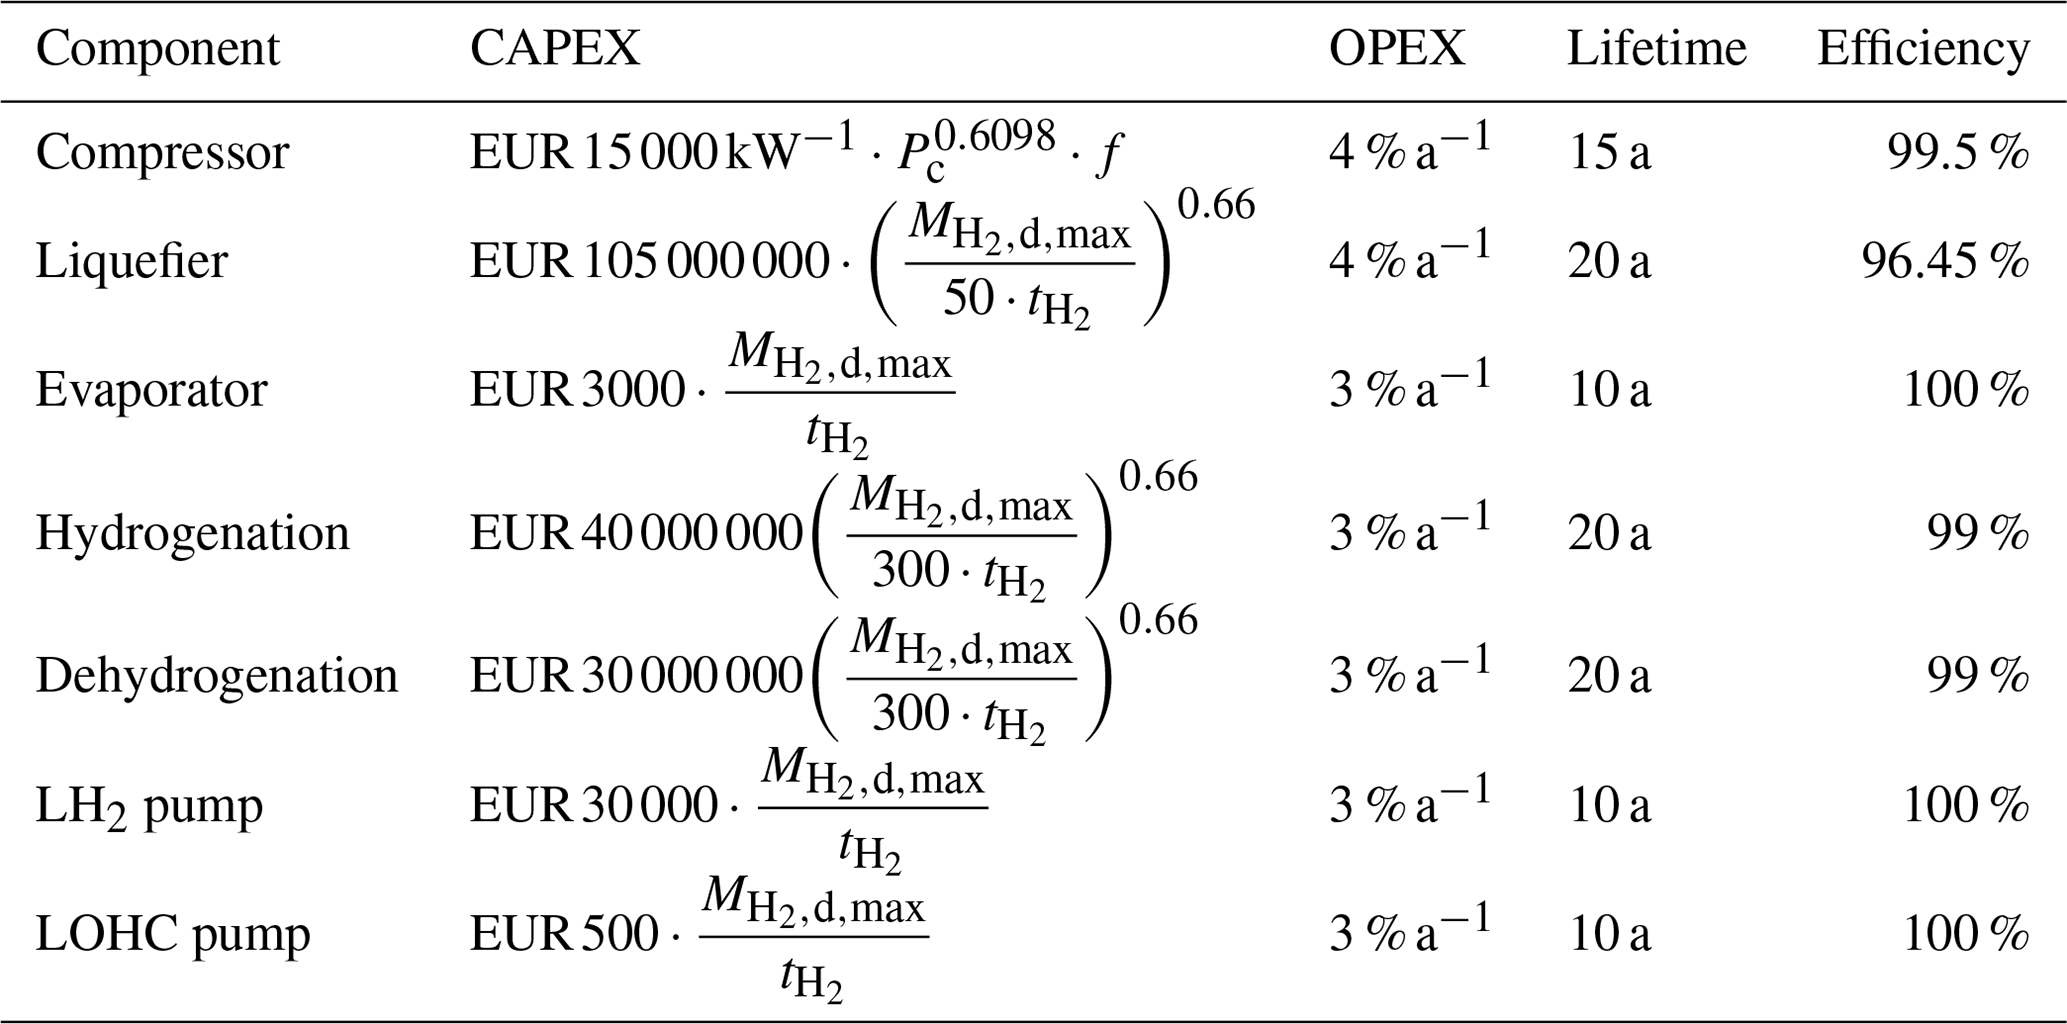
Despite the good water quality, impurities must be removed from the water by the process of reverse osmosis, which requires water tanks and pumps at the wind farm site. To avoid detrimental effects on components, PEMEL uses deionized water (Guo et al., 2019), whereas the de-ionization process is typically part of the electrolyzer unit, so no additional costs are included here (Simoes et al., 2021). The remaining costs are divided into CAPEX and OPEX and depend on the annual water usage , which in turn is dependent on the annual produced amount of hydrogen (see Eq. 5). The specific CAPEX are assumed to be EUR 0.6 and the specific OPEX are assumed to be EUR 0.52 , following Simoes et al. (2021), who conducted a detailed study on water usage of electrolyzers for Portugal. Additionally, the specific water pipeline costs are assumed to be EUR 115 m−1. The required pipeline length is the geodesic length between the water connection point and the electrolyzer position pEl. includes a safety factor of 1.7 (see Sect. 2.1.2). All additional parameters are given in Table 1.
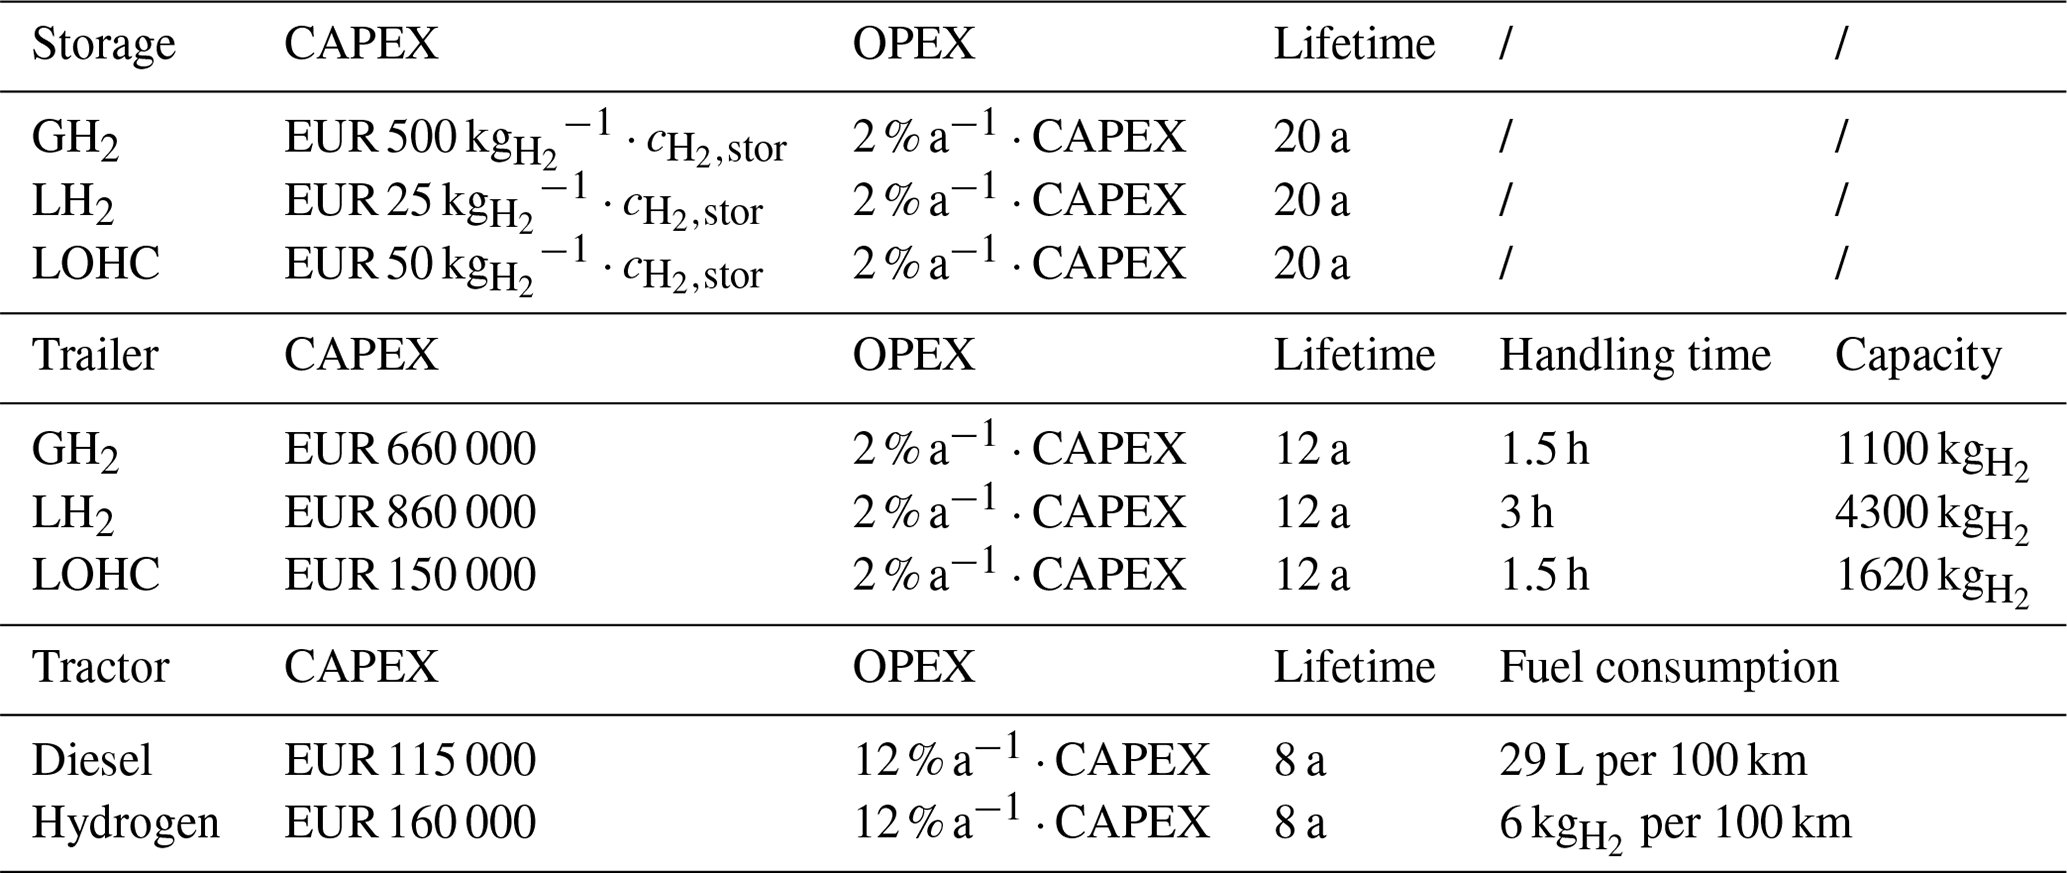
Table 1Financial parameters of hydrogen production and supply infrastructure (Reuß, 2019; Fasihi and Breyer, 2020; Zarkovic et al., 2019; Žarković et al., 2021; Simoes et al., 2021; Statistisches Bundesamt, 2020; Hau, 2016).
2.2 Hydrogen distribution
Unlike for the transport of electricity, there is no comparable distribution network for hydrogen. Hence, transportation of decentrally generated hydrogen is unevenly more complex than distributing electricity. For some hydrogen production sites, pipelines may be viable, while other sites are better served by trucks. An additional degree of freedom is granted through the possible options of transporting hydrogen in trailers in a liquid (LH2) or gaseous (GH2) state or bound using a liquid oxygen hydrogen carrier (LOHC). In this section, the necessary assumptions to individually select the most cost-effective distribution mode for a wind farm site are explained. Figure 3 shows an overview of the different hydrogen distribution modes and their impact on the required infrastructure. Although the components for dehydration, as well as vaporizers, are not located at the wind farm, but at the customer's site, their costs are included. This ensures the comparability of the LCoH of all distribution modes, as transport in other forms may require the hydrogen to be reconverted at the costumer's site.
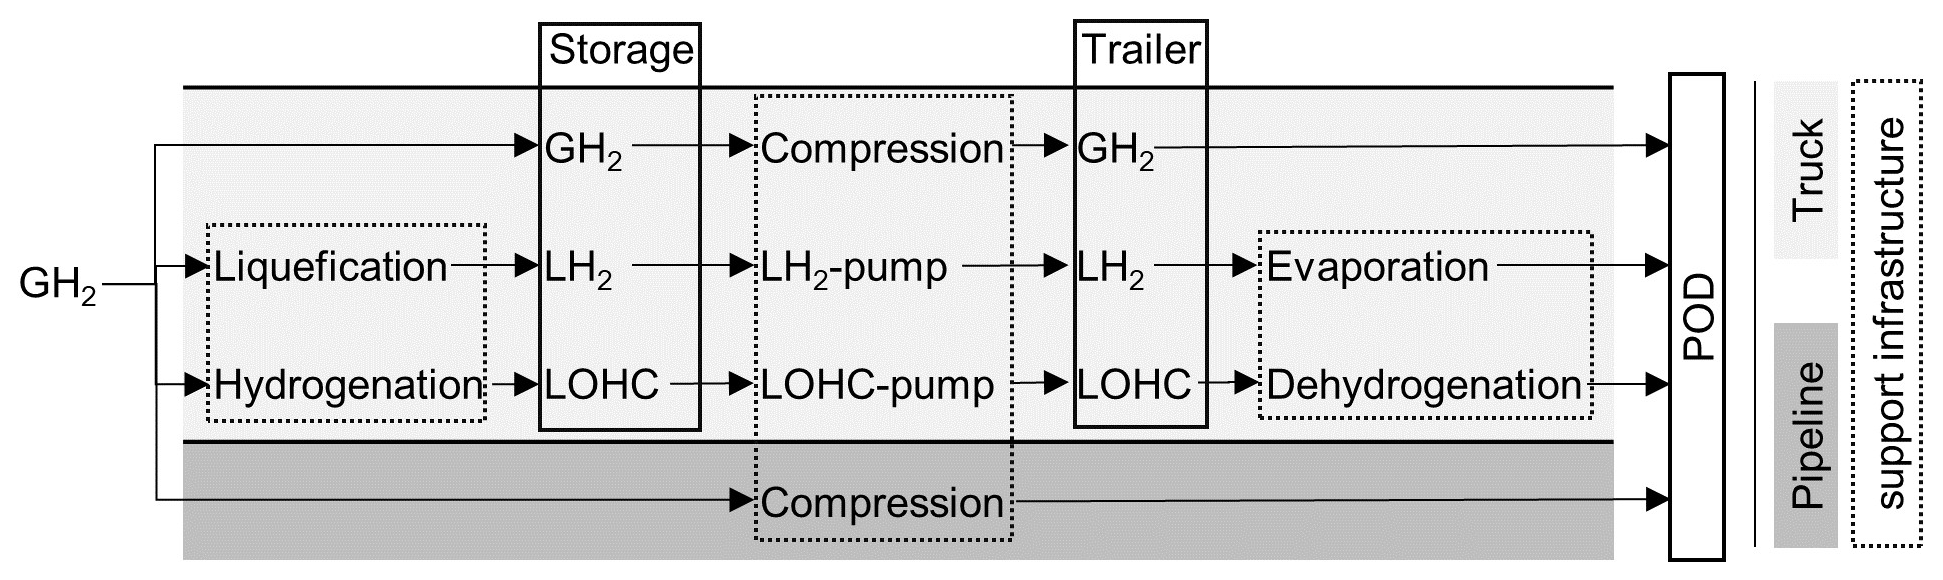
Figure 3Overview of considered hydrogen distribution modes and their impact on required infrastructure components.
2.2.1 Hydrogen storage
Hydrogen produced at the wind farm site must be temporarily stored before it is transported by truck, resulting in the need for hydrogen storage units. In the case of distribution by pipeline, additional storage is not required, since hydrogen is continuously carried off.
There are various approaches to storing hydrogen. The use of salt caverns as a natural storage type is promising for storing large volumes of hydrogen (Caglayan et al., 2020). However, since salt caverns are not available in all locations and the quantities of hydrogen produced are comparatively low, they are not considered further. Therefore, as shown in Fig. 3, GH2, LH2, or LOHC storage units are used, as proposed by Reuß (2019). Storage costs are mainly driven by the storage type and its required size. For all storage types, losses are neglected, as they are regularly discharged and storage losses during a day are less than 1 % for all storage types (Reuß, 2019). According to the approach of Yang and Ogden (2007), the storage units used have a capacity of 50 % of the maximum daily hydrogen production , as given in Eq. (6).
All parameters necessary to calculate the TOTEX of each storage type are given in Table 2. The impact of the selected storage type on the required support infrastructure at the wind farm is shown in Fig. 3. All other parameters used to calculate the cost of the support infrastructure are given in Table A1.
Table 2Financial parameters of hydrogen storage, trailers, and tractors (Reuß, 2019; Reuß et al., 2017; Petitpas, 2018; Adolf et al., 2016).
In the case in which an LH2 tank is used, a hydrogen liquefier is required. The hydrogen is cooled down below its boiling point and compressed, which requires up to 15 (Reuß, 2019). However, dedicated studies on the liquefaction process assume an energy consumption of 6.76 , which is used here (Stolzenburg and Mubbala, 2013). The investment costs for liquefiers are high and depend on the maximum daily hydrogen production (see Table A1), which has to be considered when selecting the distribution mode. The advantages of LH2 are lower storage costs and higher density compared to GH2.
In the case of using an LOHC tank, hydrogenation of a typically aromatic compound is used, which requires an energy input of 9.08 (thermal energy), which depends on the compound used. The necessary thermal energy is provided by the conversion of electricity supplied by the wind farm. Recovery and further usage of thermal waste energy is not considered, although 8.8 is emitted during the process (Müller et al., 2015). The costs for the hydrogenation unit are estimated based on Reuß (2019) and depend on the maximum daily hydrogen production (see Table A1). The advantage of an LOHC is that it can be transported under ambient conditions (Reuß et al., 2017).
At this point, it must be mentioned that both hydrogenation and liquefaction of hydrogen are processes under development. In particular, assumptions about component costs and their scalability to the necessary size for application at wind farms are uncertain.
2.2.2 Tractor and trailers
Different trailers are necessary to transport the hydrogen by truck, depending on the state in which it is stored at the wind farm, as shown in Fig. 3. The combination of storage units and trailers that are not of the same type, such as a GH2 tank and an LOHC trailer, is not considered. This is because it would require the necessary infrastructure and auxiliary systems for both technologies and is therefore estimated to be too costly.
For the transport of GH2, tube trailers are used. Due to their high weight, they only have a capacity of approx. 300 . However, current research aims for an improvement in tube trailer capacities up to 1100 using alternative materials which can withstand higher pressures (Adolf et al., 2017). A compressor is needed to increase the pressure of the stored GH2 to the pressure level of the trailers.
LH2 trailers have a much higher capacity of 4300 , which is due to the higher density compared to GH2 (Reuß et al., 2017). An LH2 pump is required to pump hydrogen from the LH2 storage to the trailer. During transport and unloading approximately 5 % of the hydrogen is lost (Petitpas, 2018).
Conventional petrol trailers are used to transport LOHC-bound hydrogen, resulting in a theoretical capacity of 1800 (Reuß et al., 2017). However, during hydrogenation and dehydrogenation, not all hydrogen is processed, again resulting in a loss of approximately 10 % of the trailer's capacity. An additional LOHC pump is required to fill the trailer (Petitpas, 2018).
The same lifetime is assumed for all trailers. However, the handling time thandling is different for each type of trailer, as shown in Table 2.
A further degree of freedom is the decision on the type of tractor to be used. Today, almost all heavy-duty trucks are diesel-powered (ACEA, 2023). However, both diesel- and hydrogen-powered tractors are considered, which differ in purchase cost and fuel consumption, as shown in Table 2. The simplified assumption is that the required hydrogen for transport is provided free of charge by the wind farm's hydrogen production. The cost of diesel is estimated at EUR 1.50 L−1. In addition, the labor cost of the truck driver is considered to be EUR 35 h−1 (Reuß, 2019). Driver labor costs are calculated based on travel time to the POD and thandling.
A truck access road to the electrolyzer is also required. Road construction costs vary widely depending on local conditions. Based on an expert interview, the cost of an asphalt road, including earthworks, is estimated at EUR 220 m−2 (Ilker Kaluk, personal communication, 2022). The road width is 3 m. Based on the available roads and the position of the electrolyzer pEl, the road length lroad is calculated.
2.2.3 Pipeline
An alternative for the hydrogen transport is the use of a hydrogen pipeline. Again, a compressor is required, as shown in Fig. 3, in this case, to adjust the pressure level of the electrolyzer to the pressure level of the pipeline. Gas pipelines are divided into transmission and distribution lines, which operate at different pressure levels. Transmission lines are designed for high volumes and long distances and operate at high pressure levels, typically above 8.5 MPa, while distribution lines operate at pressures of 3–4 MPa (Melaina et al., 2013). Comparatively, only small amounts of hydrogen will be produced by decentralized electrolyzers at wind farms, so the parameters of distribution pipelines are used. The outlet pressure of PEMEL instruments varies widely in specifications (Buttler and Spliethoff, 2018). Here, it is assumed that the outlet pressure of PEMEL is 3 MPa and the pressure in the hydrogen pipeline is 4 MPa.
The cost of the hydrogen pipeline is mainly determined by its radius and length (see Table 3) (Mischner et al., 2015). According to Baufumé et al. (2013), a pipeline will not be built with a radius smaller than 50 mm. Therefore, the pipeline size is fixed to 50 mm for electrolyzers below a rated power of 50 MW. It is only variable if PEl exceeds 50 MW. is again calculated as the geodesic length between the electrolyzer position pEl and the POD position pPOD and multiplied by a safety factor , which here is 1.4 (Reuß, 2019).
Table 3Financial parameters of a hydrogen pipeline (Reuß, 2019).
2.3 Optimization algorithm
In this section, the implemented optimization algorithm shown in Fig. 4 is explained. It is assumed that the entire power consumption of all system components is provided by the wind farm. Therefore, the electricity cost is set equal to the LCoE of the farm. Excess electricity that cannot be used by the electrolyzer because it is running at its rated power PEl is fed into the grid (overload operation of PEMEL is not considered). Therefore, regardless of the electrolyzers capacity utilization CFEl, the LCoE is assumed to be constant.
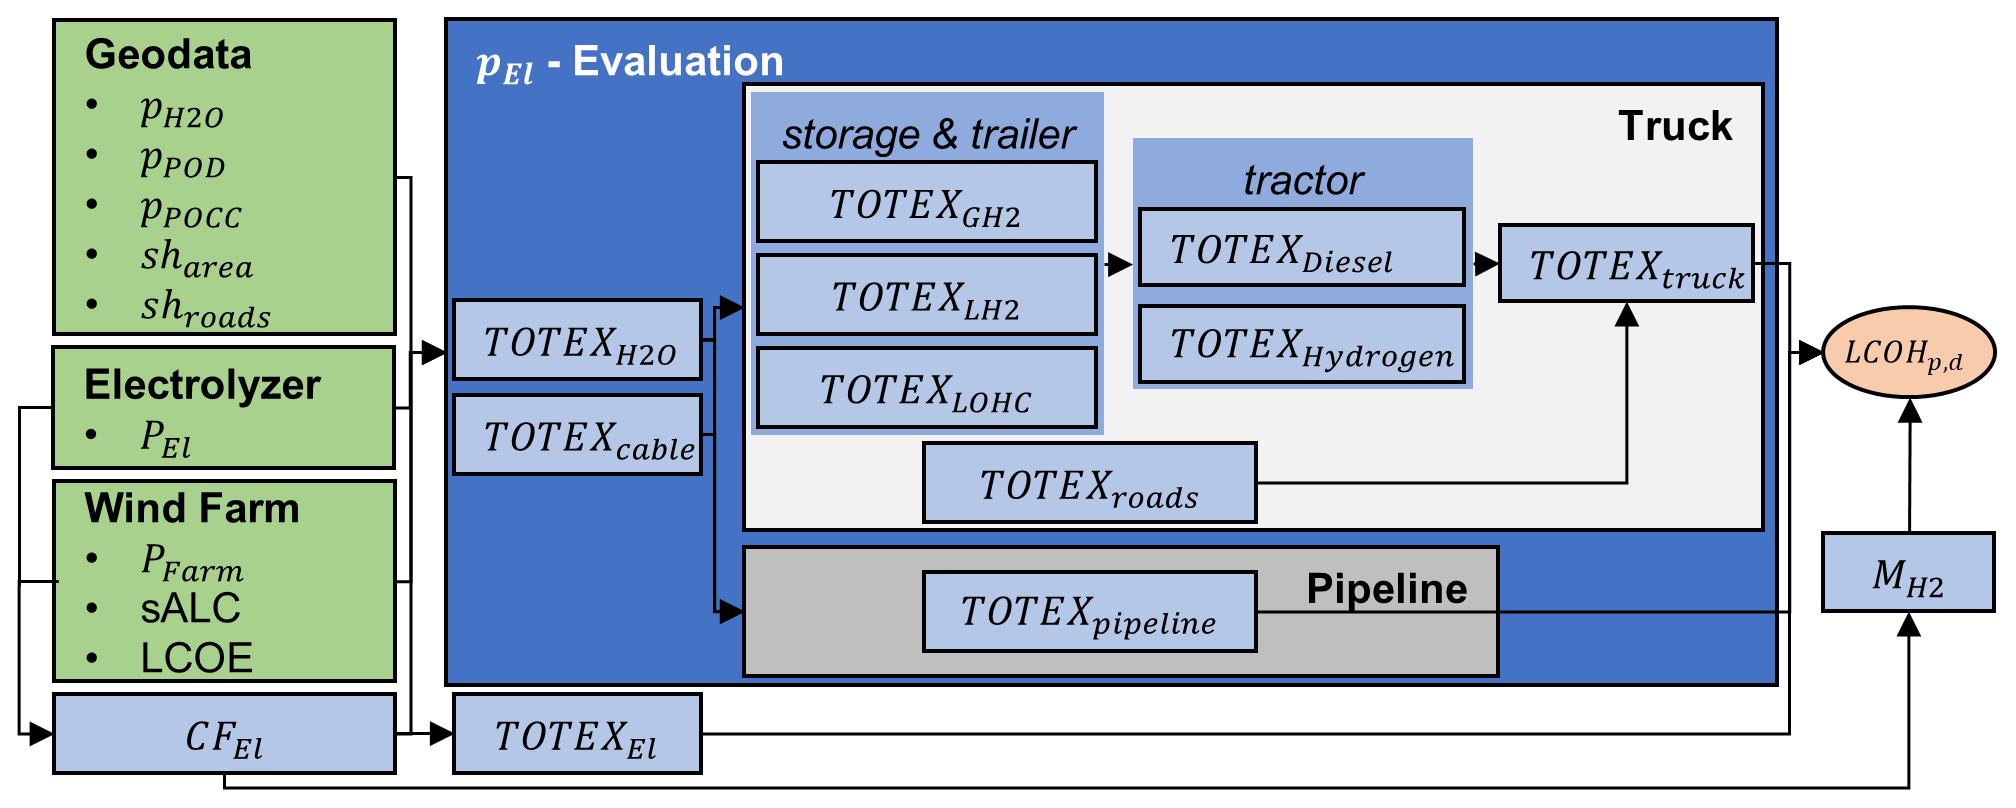
Figure 4Illustration of the used optimization algorithm to calculate the electrolyzer position and hydrogen distribution mode to achieve the minimum LCoH. Green boxes are input data (fix values); the orange box is output data (target value); and all blue boxes are automatic calculations, with varying a pEl (influencing all values in the dark-blue box).
The area to be considered for electrolyzer positioning must be specified as a shapefile sharea in addition to the point data pPOD, pPOCC, and (see Sects. 2.1 and 2.2). sharea is automatically discretized into a point grid resulting in all considered positions pEl. Existing roads must also be provided as a shapefile shroads. All necessary geodata are processed using the open-source software QGIS. Further processing and calculation of all parameters is done in Python. For each possible set of electrolyzer position pEl and distribution mode, the resulting TOTEX and finally the LCoH are calculated. The result is the information for which set of pEl and hydrogen distribution mode the LCoH is the lowest.
In the following, the results of the optimization algorithm introduced in Sect. 2.3 are described. The selected use case is an onshore wind farm in Germany. The positions pPOD and and the area considered for the position of the electrolyzer sharea are chosen arbitrary. This also applies to the power curve of the wind farm. It was not provided by the farm operator but estimated based on wind data.
3.1 Use cases
The results of the optimization are shown in Fig. 5a and b. The necessary geodata are created in QGIS and processed in Python. Figure 5a shows the results for a 23.4 MW wind farm consisting of 13 WTs at 1.8 MW with a vcutin of 2.5 m s−1, vnominal of 12.5 m s−1, and vcutout of 34 m s−1, combined with a 2 MW electrolyzer, resulting in a CFEl of 77 %. Figure 5b shows the results for a wind farm with a rated power PFarm of 58.5 MW. The increase in PFarm could in practice result from a repowering of the wind farm. To investigate the influence of the electrolyzer and wind farm power on the optimal position and distribution mode, the geodata, including the considered area for the electrolyzer sharea and pPOCC, are kept constant for the use cases. The larger wind farm consist of 13 WTs at a rated power of 4.5 MW with a vcutin of 3 m s−1, vnominal of 12 m s−1, and vcutout of 24.5 m s−1, combined with a 10 MW electrolyzer, resulting in a CFEl of 68 %. The farm-specific sALC and thus CFEl for both use cases a and b are calculated as described in Sect. 2.1.1. The Weibull parameters are specific to the site, with a scale parameter of 7.79 and a shape parameter of 2.13. Wind farm optimization software, introduced by Roscher (2020), was utilized to compute the Weibull parameters.
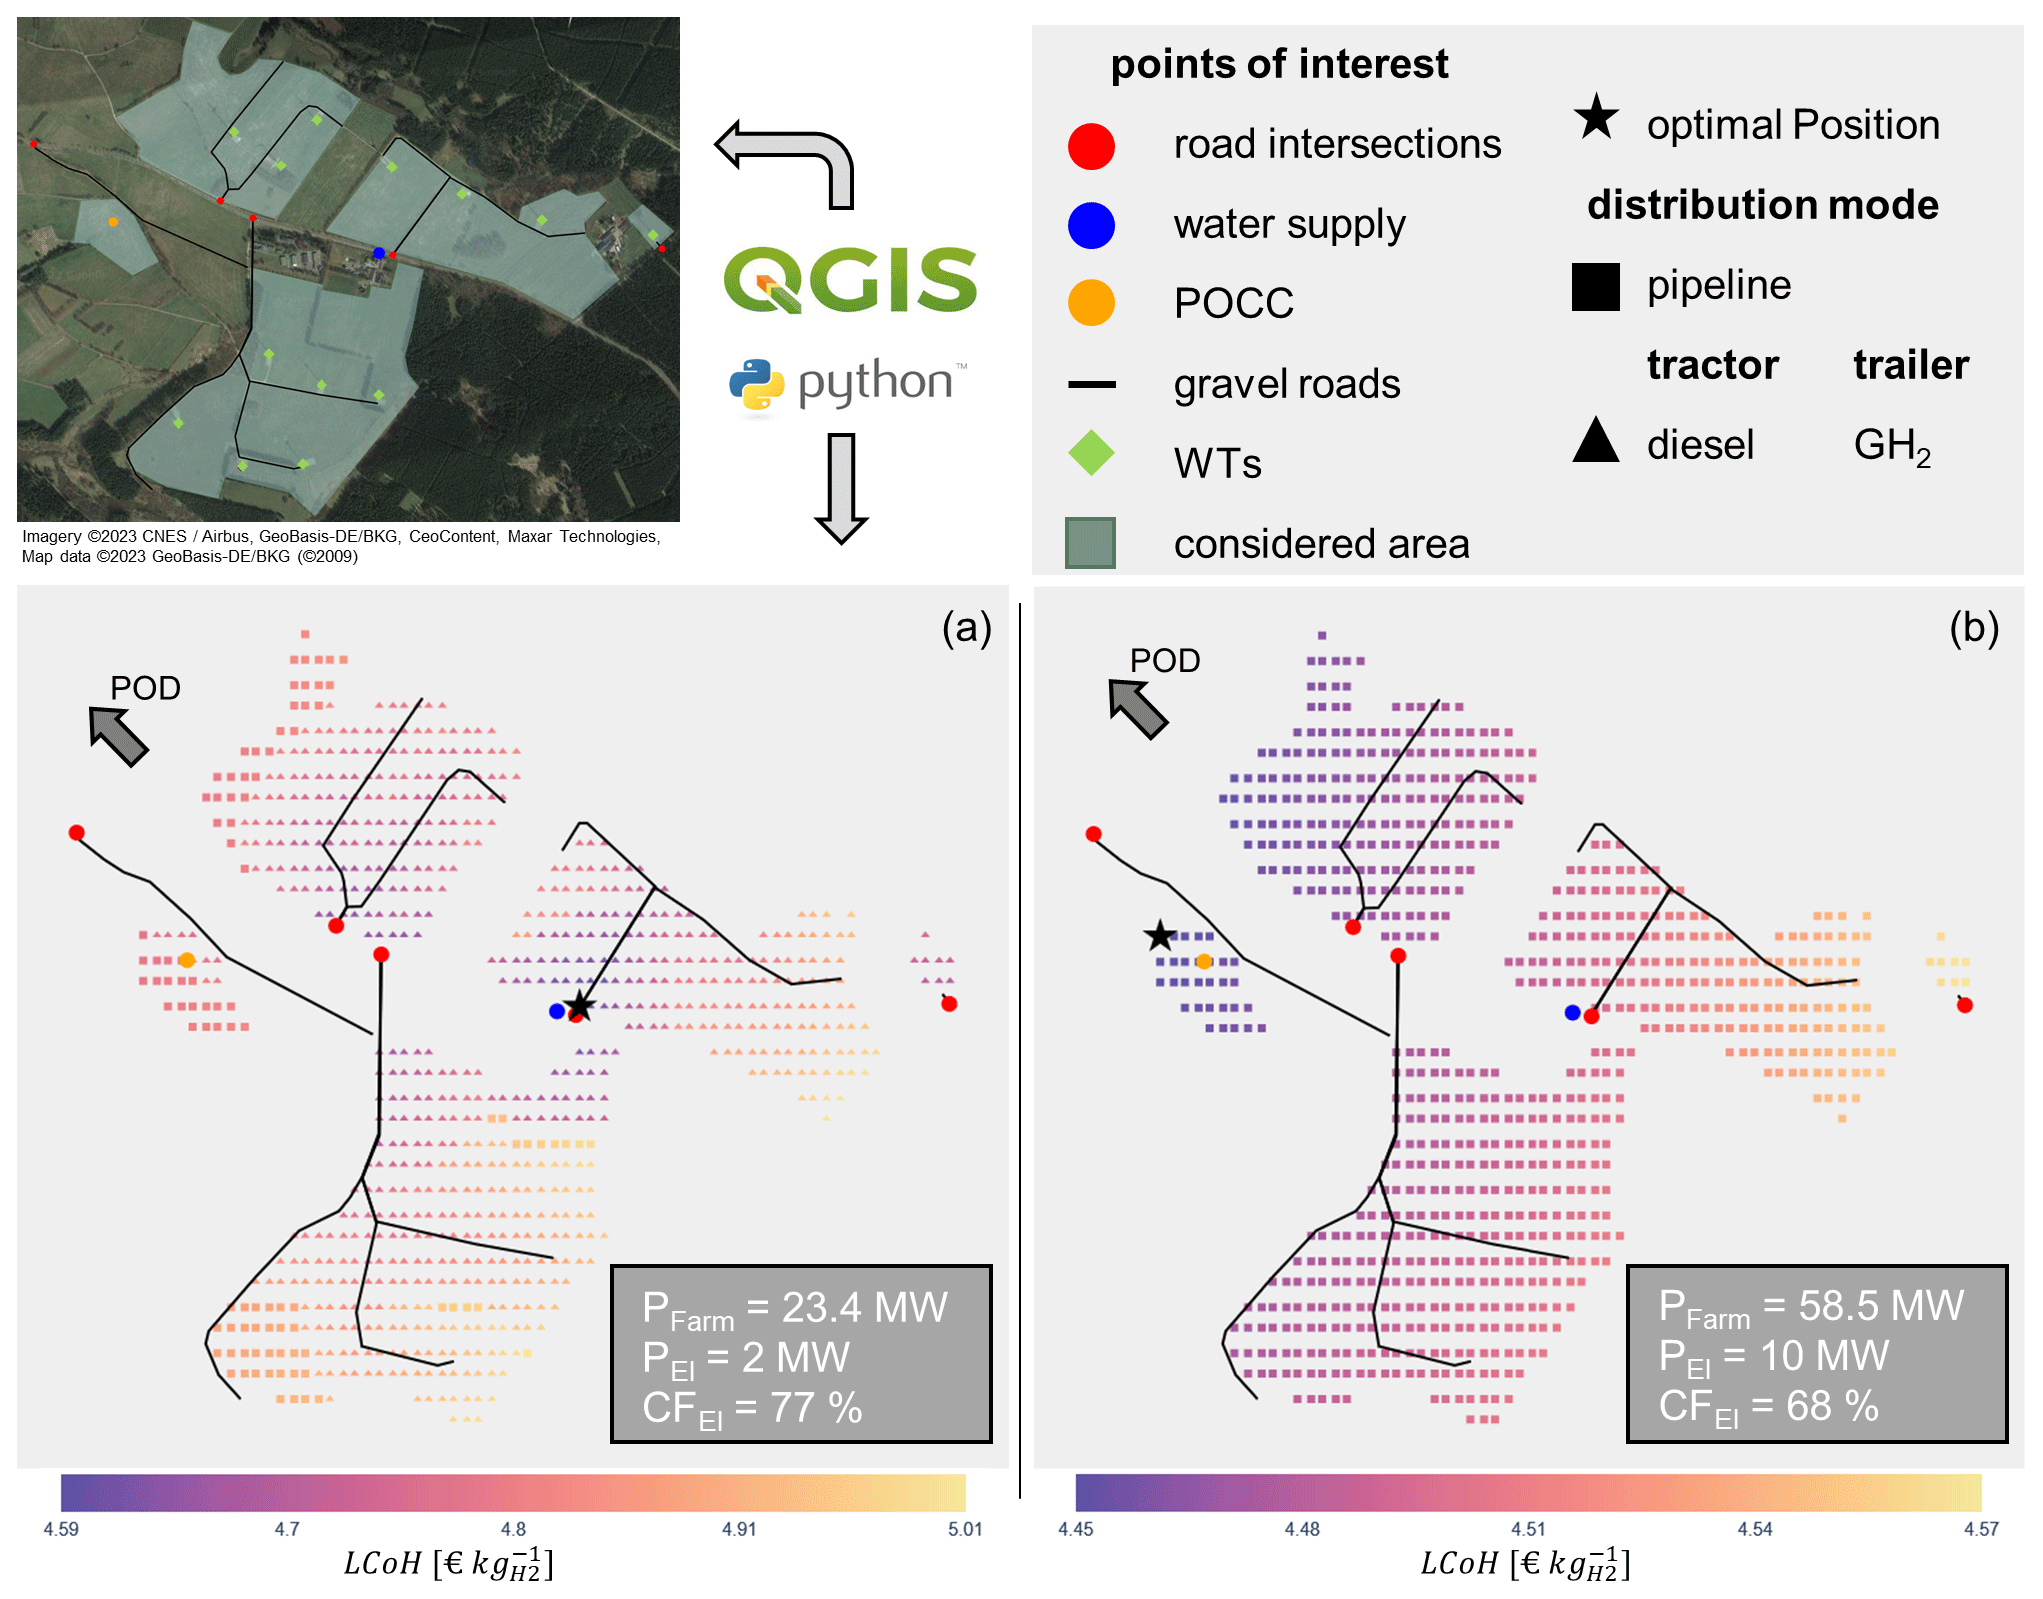
Figure 5Optimization results for a German onshore wind farm with an LCoE of EURct 5.5 kW−1 (EUR 0.055 kW−1). In both cases (a) and (b), the distance to the POD is approx. 4–6 km, depending on the location pEl of the electrolyzer on the wind farm site.
The result of the optimization tool is a heat map containing all relevant information of the wind–hydrogen system. The achievable minimal LCoH (mLCoH) is plotted for each electrolyzer position pEl. This information is indicated by the color of the data point, as shown in the color bar in Fig. 5. The value of the distribution mode that results in the lowest cost is plotted, even though there are as many LCoH values for each position pEl as distribution modes considered. The marker shape indicates which distribution mode d results in the mLCoH at a position pEl. A black star indicates the combination of position and distribution mode that results in the for the entire area sharea.
Based on the calculation results, the achievable mLCoH for the 23.4 MW wind farm combined with a 2 MW electrolyzer is EUR 4.59 . According to Eq. (1), the wind–hydrogen system produces about 283.6 . Here, the mLCoH is achieved when a diesel-engine tractor in combination with a GH2 trailer is used. For this use case, the selection of the optimal electrolyzer position pEl on-site over the worst position results in a reduction in the LCoH of 8.38 %. This applies when comparing the optimal distribution mode for each position.
Figure 5a also shows that the LCoH is lower in the vicinity of roads and road intersections with the main road (red dots and black lines) than further away from them, as the road construction costs depend on the required road length lroad. It is also apparent that the mLCoH is achieved for this use case when the electrolyzer is placed in proximity to the position of the water supply (blue dot). Therefore, a relatively long power cable is required for this wind farm. The reason for this is that the water pipeline costs are higher than the costs for the power cable at low electrolyzer powers PEl. Depending on the position of pEl, the POD is only 4 to 6 km away. The impact on the TOTEX and therefore on the LCoH is small as the time required to cover this distance by truck is small. In addition, there are changes in the optimal distribution mode on the considered area for the positioning of the electrolyzer. At the locations closest to the POD (see northwest of the area under consideration in Fig. 5), transport by pipeline rather than by truck results in a lower LCoH. This is due to the fact that the pipeline length is minimal here, while road construction costs for truck transport are high.
For a specific location pEl within the available area sharea Fig. 6 showcases and quantifies the above results.
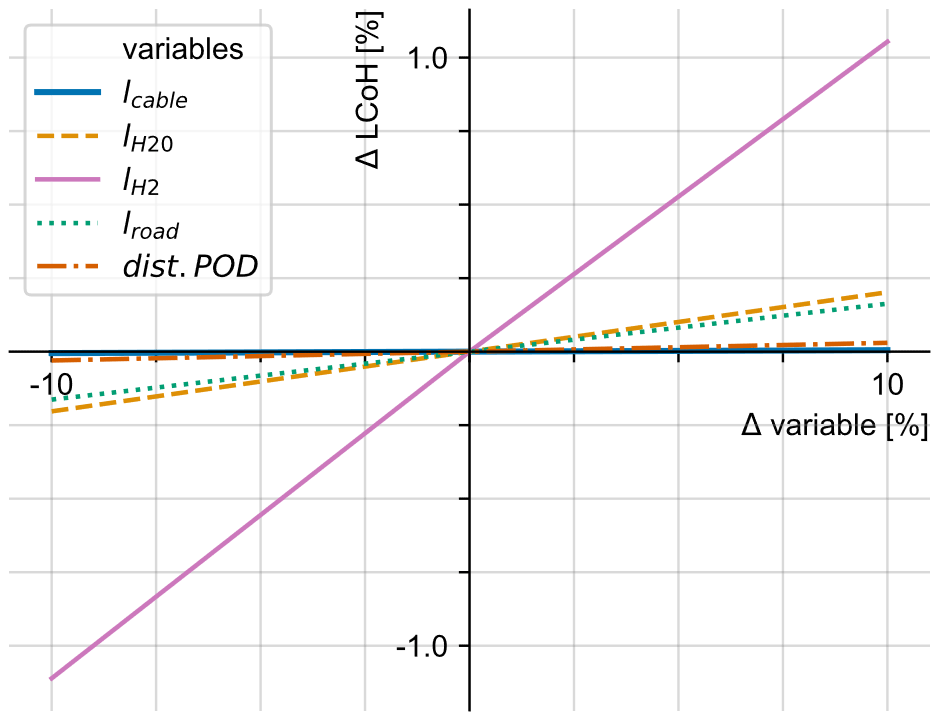
Figure 6Sensitivity analysis of the impact of varying individual parameters on the LCoH for scenario a. Changes in the LCoH due to changes in are relevant only for distribution by pipeline. Changes in the distance to the POD are relevant here for truck transportation.
For the wind–hydrogen system with PFarm at 58.5 MW combined with a 10 MW electrolyzer, the mLCoH is lower at EUR 4.45 . This is due to the 4.4-fold increase in the amount of hydrogen produced per year (1252.18 ) as compared to the small wind–hydrogen system. The 10 MW electrolyzer has a comparatively lower CFEl. However, the higher amount of produced hydrogen results in a better overall utilization of the required infrastructure, resulting in an LCoH reduction. As a result of the large amount of hydrogen that needs to be transported daily from the wind farm to the POD, pipeline transportation is now the distribution mode resulting in the mLCoH. Figure 5b shows that the optimal electrolyzer position pEl is at the northwestern edge of the considered area, which leads to the shortest distance pipeline distance . The cost of the water pipeline no longer dominates the optimal position pEl, as the specific hydrogen pipeline cost per meter is approximately 3 times higher.
3.2 Global LCoH optimum for a wind farm
The results shown in Sect. 3.1 are calculated for a fixed electrolyzer power PEl. In this case, as shown in Fig. 4, PEl is an input parameter that is not varied. For the calculation of the global LCoH optimum for a wind farm, PEl is now subject to optimization and is therefore also variable.
The optimization algorithm shown in Fig. 4 is run for all PEl and PFarm ratios rEl/Farm. PEl,max is equal to the rated power of the wind farm PFarm because it is assumed that the electrolyzer is only powered by the wind farm, so rEl/Farm is always below 1. This results in the minimum LCoH that can be achieved for a combination of the wind farm and POD, referred to as .
As shown in Fig. 7, is obtained at an rEl/Farm of about 0.1. A low rEl/Farm value results in a high electrolyzer capacity utilization CFEl (see also Fig. 2). Thus, for the use case shown in Fig. 5a and discussed in Sect. 3.1, the electrolyzer is therefore almost optimally sized with an rEl/Farm value of 0.085, while the rate of 0.17 is above the optimum for use case b, resulting in the LCoH being higher than the mLCoH. For larger values of rEl/Farm or smaller CFEl values, the LCoH increases almost linearly. This is mainly due to the infrastructure supplying the electrolyzer being designed for its rated power PEl. Consequently, the infrastructure costs scale linearly with PEl. The cost of the electrolyzer also increases with its size. For almost all components, the OPEX are also based on their CAPEX. The design and thus the cost of the infrastructure for on-site hydrogen storage and distribution is also based on PEl (see Sect. 2.2). The TOTEX of a hydrogen system with a larger electrolyzer but lower CFEl values increase more than the mass of hydrogen it can produce annually . According to Eq. (1), this results in an increase in the LCoH.
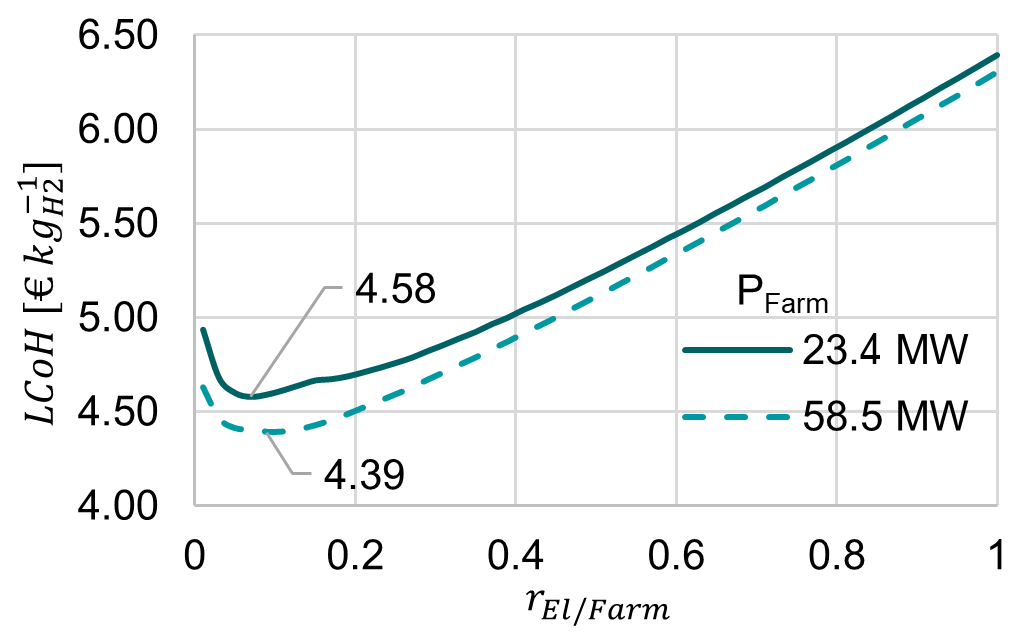
For a smaller rEl/Farm, the LCoH also increases, in this case almost exponentially. In the case that rEl/Farm falls below a certain value, the utilization of the electrolyzer CFEl does not increase any further, since wind farms typically do not produce electricity for a certain time period of the year (cf. Sect. 2.1.1). As PEl decreases, fixed CAPEX such as road construction costs do not decrease. TOTEX therefore decrease at a lower rate than , resulting in a higher LCoH. In any case, if the value rEl/Farm is too high or too low, some infrastructure components will not be used optimally.
3.3 Distribution mode analysis
For further analysis, the dependence of the distribution modes on the distance to the POD and the daily hydrogen production are investigated. This allows for a sensitivity analysis of input parameters for selecting different distribution modes. All parameters except the distance to the POD and PEl are constant, including the electrolyzer position pEl on the wind farm site.
In particular, CFEl is kept constant at 70 %, which implies that PFarm and/or the wind farm FLH must increase with PEl. Figure 8 shows the results of the distribution mode analysis. The plot shows only the LCoH for the distribution mode, which results in the combination of the mLCoH for a daily hydrogen production and distance to the POD. The black line indicates where the LCoH for pipeline transport is higher than the LCoH for truck transport, or vice versa. For high hydrogen mass flows but short distances, the pipeline is the most economical distribution mode. Up to an electrolyzer power of 50 MW, the pipeline cost is only dependent on its length (see Sect. 2.2.3). Due to the low capacity of hydrogen trailers (see Table 2) multiple trailers are required for high daily hydrogen production , increasing the LCoH.
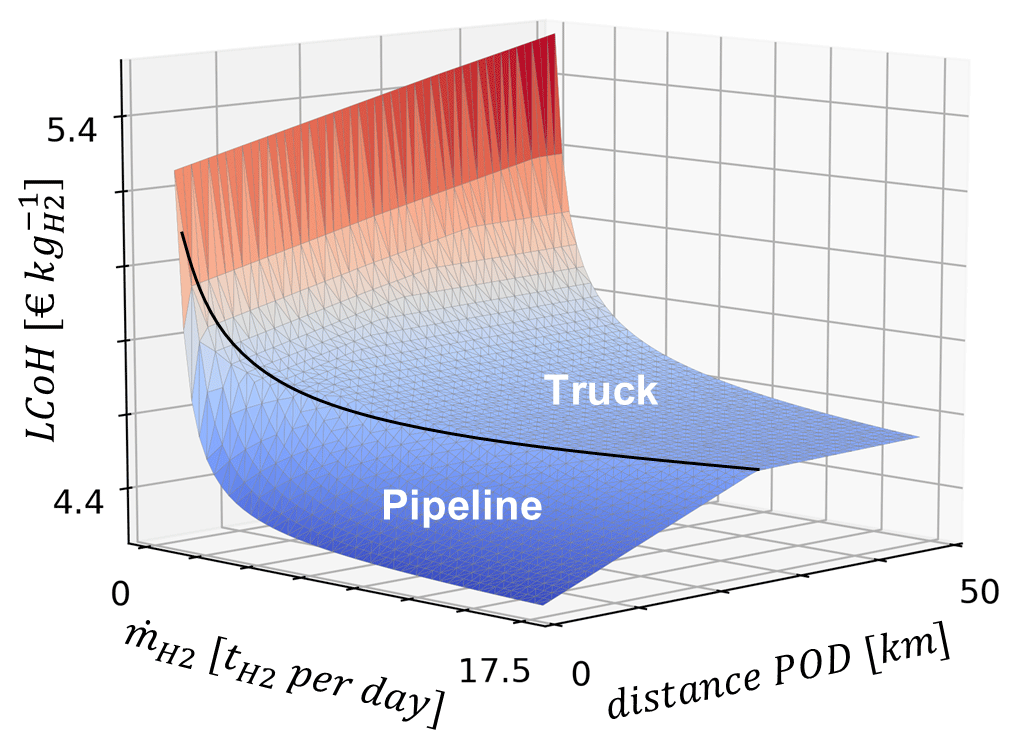
Figure 8Distribution mode analysis results for a minimum PEl of 1 MW and a maximum PEl of 50 MW. The CFEl is constant at 70 % for each data point.
However, for low daily hydrogen productions and short distances, as well as a high daily production and long distances to the POD, transportation by truck is cheaper than by pipeline, as shown in Fig. 8. For long distances, the high cost of pipelines exceeds the cost of truck transportation.
Figure 9 provides a more detailed analysis of the most favorable distribution mode depending on distance to the POD and daily hydrogen production. Therefore, results are shown for two different exemplary diesel fuel prices and excluding a pipeline as a distribution mode. Instead of the LCoH, the color indicates the different distribution modes, including the different tractor and trailer combinations. For wind farm sites where construction of a hydrogen pipeline is not possible or not permitted, consideration of the operating windows without the pipeline is relevant.
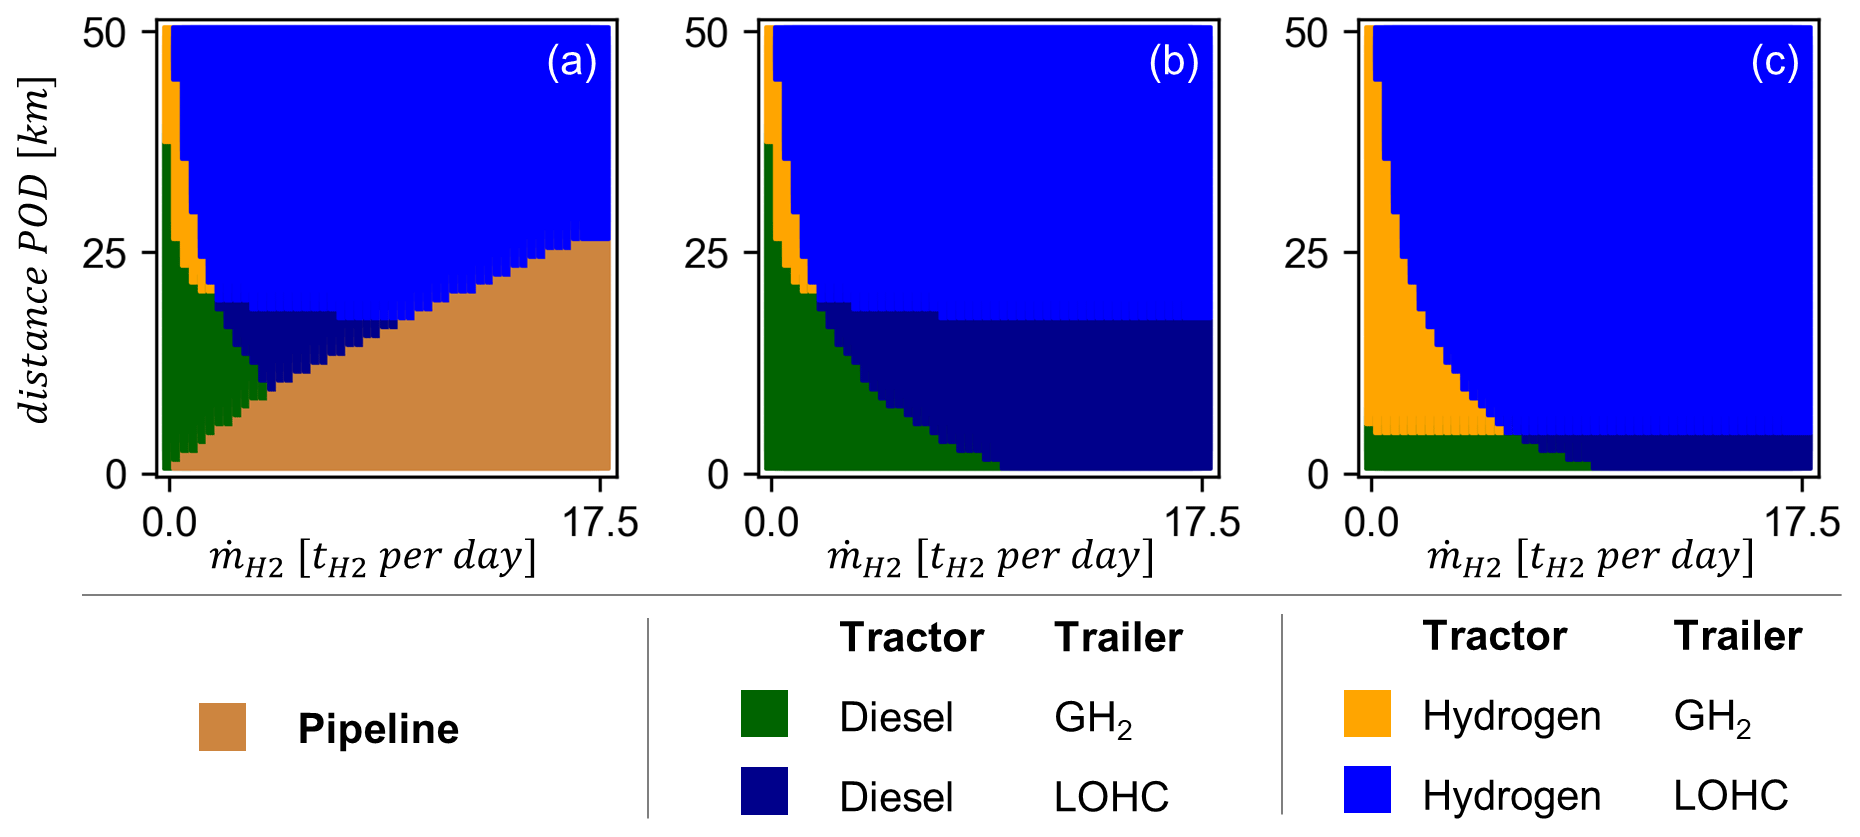
Figure 9Detailed distribution mode analysis for (a) a diesel price of EUR 1.50 L−1, considering a pipeline; (b) a diesel price of EUR 1.50 L−1, not considering a pipeline; and (c) a diesel price of EUR 2.50 L−1, not considering a pipeline.
As shown in Fig. 9a and discussed before, large hydrogen mass flows and short distances to the POD result in the pipeline being the most economical distribution mode. Transportation by a GH2 trailer is best suited for long distances and small amounts of hydrogen.
Transportation in an LOHC trailer is only feasible for wind–hydrogen systems with a larger daily hydrogen production. Although the LOHC trailer is the least expensive of the trailers considered (see Table 2), it requires expensive additional infrastructure (see Fig. 3). However, the higher capacity and lower price of the trailers makes the investment in the additional infrastructure economically viable at a certain amount of hydrogen produced per day.
For long distances to the POD, the additional investment in more expensive hydrogen tractors is reasonable. This is because there is no additional cost included in the model for hydrogen consumed by trucks. It is assumed that the hydrogen consumption of the trucks is covered by the production of the wind farm so that the hydrogen price is equal to the LCoH. This is a simplification, as additional infrastructure is required for hydrogen refueling at the wind farm and the hydrogen used cannot be sold, which must be taken into account in any economic analysis. Still, the increase in diesel price from Fig. 9b to c shows that the operating window for diesel tractors can be reduced by increasing fuel prices.
No combination of the considered distance to the POD and hydrogen mass flow results in the mLCoH for the use of LH2 trailers. While LH2 trailers have the largest hydrogen capacity, they are also the most expensive trailers (see Table 2). In addition, infrastructure components are required on-site to load and unload LH2 trailers.
In this paper, the influence of the optimal electrolyzer position pEl at a wind farm site in combination with the optimal hydrogen distribution mode on the LCoH has been discussed. Therefore, a novel optimization method based on analytical equations has been developed. The implemented methodology leads to transparent and reproducible results for the LCoH, which are in line with the LCoH for green hydrogen as reported in the literature (Ajanovic et al., 2022). Hofrichter et al. (2023b), who conducted a study on the optimal ratio of an electrolyzer to wind farm size, calculated the mLCoH of EUR 2.53 . The lower LCoH is partly due to a lower WACC and LCoE considered and partly due to the fact that hydrogen transportation costs are not considered. Hofrichter et al. (2023b) conclude that a higher optimal rEl/Farm results in a lower LCoH and that higher installed capacities of renewables lead to a lower LCoH, which is in line with the results of this work. Since infrastructure components are sized based on electrolyzer capacity, the LCoH increases for increasing rEl/Farm in this study. In their review of 18 papers, Bhandari and Shah (2021) concluded that the LCoH for decentralized hydrogen production with PEMEL is EUR 1.90–7.56 . The LCoH calculated in this paper falls within this range. As shown here, the electrolyzer position pEl and the distribution mode have a significant impact on the LCoH of a wind–hydrogen system combined with a POD. Depending on the distribution mode, the main parameters affecting pEl are the pipeline length and the expenses for roads and water pipes. It is now possible to calculate the optimal rEl/Farm to achieve the mLCoH for an individual wind farm site, considering local wind conditions and WT types. For the investigated use case of a 23.4 MW wind farm the optimal ratio lies at around 10 %. The method requires minimal data input. Therefore, it is easily transferable to other onshore wind farm sites.
The impact of technological advances such as increased electrolysis efficiency, component lifetime extension, or cost reduction in the LCoH of a wind–hydrogen system can be analyzed by varying the input parameters. This has been done for the example of a rising diesel price. This allows for future-proof decisions to be made as early as possible in the planning phase of a project. The developed method thus generates added value for both research and industry. Wind farm operators and planners can use the method to obtain a sound estimate of the achievable LCoH for a wind–hydrogen system. The results can be used for detailed planning. In science, the method can be further applied to hybrid power plants, consisting of photovoltaics, batteries, and wind farms, to further reduce green hydrogen cost. In addition, the impact of technological advances on the LCoH can be assessed.
Wind–hydrogen systems are complex and consist of many components. Several components are still in the early stages of development. Estimates of costs, efficiencies, and other system parameters are therefore subject to uncertainty. In addition, the design of the overall wind–hydrogen system requires the use of physically simplifying assumptions. Various model limitations have already been described in Sect. 2. In particular, the efficiency of the electrolyzer is assumed to be constant regardless of load. Hofrichter et al. (2023a) show that the efficiency of PEMEL is higher at partial load compared to full load. This could potentially increase the optimal rEl/Farm. However, due to infrastructure components being sized based on the electrolyzer capacity, the effect will be limited. The AEP of the wind farms is calculated using site-specific Weibull parameters and the turbines' power curves. The AEP is slightly overestimated due to the neglect of wake effects, resulting in small uncertainties in an optimal rEl/Farm. A detailed investigation of each component is beyond the scope of this work and would increase the required computational effort. Currently, on an AMD Ryzen 7 Pro 6850U running at 2.7 GHz with 32 GB of RAM, the optimization is performed in less than 900 s for typical wind farm sites. Although the results of the method will change as the input parameters are modified, the dependencies shown for the LCoH of wind–hydrogen systems on electrolyzer position and distribution modes remain. However, the detailed design of a wind–hydrogen system must be site-specific.
The implemented methodology offers several opportunities for future research, some of which are highlighted below.
According to Eqs. (1) and (5), the LCoH is inversely proportional to CFEl (see Eq. 7). Currently, the electricity for the electrolysis process is only provided by the wind farm. There is potential to increase CFEl by using power from both wind and photovoltaic systems, as there is little competition for time-resolved power feed-in from both technologies (Gerlach et al., 2011).
To maximize the utilization of the electrolyzer CFEl, additional electricity can be purchased from the grid. However, the price of electricity then depends on the market price of electricity at the time of consumption. Therefore, the additional purchase of electricity during periods of low electricity prices may further reduce the achievable LCoH. In addition, FLH and thus the CFEl can be increased by integrating photovoltaic (PV) systems and battery storage into the system. The impact on the LCoH needs to be investigated, considering detailed infrastructure costs, as in this study.
Both the power grid and road layout for a wind farm are usually planned in an early design phase, when the optimal WT positions are evaluated (Roscher, 2020). Since additional power cables and roads need to be built for the electrolyzer, it may have an impact on the overall wind farm grid and road layout. Instead of optimizing the hydrogen system sequentially, the optimization process needs to be integrated into a wind farm optimizer.
As described in Sect. 2, the optimization method introduced in this paper aims to achieve the mLCoH for a wind–hydrogen system. Blickwedel et al. (2021) introduce the metric of levelized revenue of electricity (LRoE). Unlike the LCoE or LCoH, it does not measure the costs of a plant but its revenue. For a wind–hydrogen plant, designing the system to maximize the LRoE is the next step. A controller must be developed, considering the electricity and hydrogen market prices. This controller must decide when to produce hydrogen or feed electricity into the grid.
Table A1Financial parameters of the support infrastructure; f is 2.5 for a pipeline compressor and 3 for a compressor used for a trailer (Reuß, 2019). Depending on the pressure level of the pipeline or GH2 trailer, Pc is calculated.
No data other than that given in the paper are required to produce the presented results. The source code is not published.
The concept and method of the present study were developed by ToR and ThR. ToR performed the initial implementation of the software, which was extended and improved by ThR and LB. ThR performed the initial text creation. LB, RS, and GJ were responsible for supervision, revision, and final approval. All authors have read and agreed to the published version of the paper.
The contact author has declared that none of the authors has any competing interests.
Publisher's note: Copernicus Publications remains neutral with regard to jurisdictional claims made in the text, published maps, institutional affiliations, or any other geographical representation in this paper. While Copernicus Publications makes every effort to include appropriate place names, the final responsibility lies with the authors.
This open-access publication was funded by the RWTH Aachen University.
This paper was edited by Nicolaos A. Cutululis and reviewed by two anonymous referees.
ACEA: Fuel types of new trucks: electric 0.6 %, diesel 96.6 % market share full-year 2022, https://www.acea.auto/fuel-cv/fuel-types-of-new-trucks-electric-0-6-diesel-96-6-market-share-full-year-2022/, last access: 20 June 2023.
Adolf, J., Balzer, C., Haase, F., Lenz, B., Lischke, A., and Knitschky, G.: Shell Nutzfahrzeug-Studie: Diesel oder alternative Antriebe – womit fahren LKW und Bus morgen?, Shell Deutschland, DLR, 2016.
Adolf, J., Balzer, C., Louis, J., Schabla, U., Fischedick, M., Arnold, K., Pastowski, A., and Schüwer, D.: Shell Wasserstoff-Studie Energie der Zukunft?: Nachhaltige Moblität durch Brennstoffzelle und H2, Shell Deutschland, Wuppertal Institut, 2017.
Ajanovic, A., Sayer, M., and Haas, R.: The economics and the environmental benignity of different colors of hydrogen, Int. J. Hydrogen Energ., 47, 24136–24154, https://doi.org/10.1016/j.ijhydene.2022.02.094, 2022.
Baufumé, S., Grüger, F., Grube, T., Krieg, D., Linssen, J., Weber, M., Hake, J.-F., and Stolten, D.: GIS-based scenario calculations for a nationwide German hydrogen pipeline infrastructure, Int. J. Hydrogen Energ., 38, 3813–3829, https://doi.org/10.1016/j.ijhydene.2012.12.147, 2013.
Benalcazar, P. and Komorowska, A.: Prospects of green hydrogen in Poland: A techno-economic analysis using a Monte Carlo approach, Int. J. Hydrogen Energ., 47, 5779–5796, https://doi.org/10.1016/j.ijhydene.2021.12.001, 2022.
Bhandari, R. and Shah, R. R.: Hydrogen as energy carrier: Techno-economic assessment of decentralized hydrogen production in Germany, Renew. Energ., 177, 915–931, https://doi.org/10.1016/j.renene.2021.05.149, 2021.
Blickwedel, L., Harzendorf, F., Schelenz, R., and Jacobs, G.: Future economic perspective and potential revenue of non-subsidized wind turbines in Germany, Wind Energ. Sci., 6, 177–190, https://doi.org/10.5194/wes-6-177-2021, 2021.
Bošnjaković, M., Katinić, M., Santa, R., and Marić, D.: Wind Turbine Technology Trends, Appl. Sci.-Basel, 12, 8653, https://doi.org/10.3390/app12178653, 2022.
Brusca, S., Lanzafame, R., Famoso, F., Galvagno, A., Messina, M., Mauro, S., and Prestipino, M.: On the Wind Turbine Wake Mathematical Modelling, Enrgy. Proced., 148, 202–209, https://doi.org/10.1016/j.egypro.2018.08.069, 2018.
Buttler, A. and Spliethoff, H.: Current status of water electrolysis for energy storage, grid balancing and sector coupling via power-to-gas and power-to-liquids: A review, Renew. Sust. Energ. Rev., 82, 2440–2454, https://doi.org/10.1016/j.rser.2017.09.003, 2018.
Caglayan, D. G., Weber, N., Heinrichs, H. U., Linßen, J., Robinius, M., Kukla, P. A., and Stolten, D.: Technical potential of salt caverns for hydrogen storage in Europe, Int. J. Hydrogen Energ., 45, 6793–6805, https://doi.org/10.1016/j.ijhydene.2019.12.161, 2020.
Correa, G., Volpe, F., Marocco, P., Muñoz, P., Falagüerra, T., and Santarelli, M.: Evaluation of levelized cost of hydrogen produced by wind electrolysis: Argentine and Italian production scenarios, Journal of Energy Storage, 52, 105014, https://doi.org/10.1016/j.est.2022.105014, 2022.
Davoudi, S., Khalili-Garakani, A., and Kashefi, K.: Power-to-X for Renewable-Based Hybrid Energy Systems, in: Whole Energy Systems Bridging the Gap via Vector-Coupling Technologies, edited by: Vahidinasab, V. and Mohammadi-Ivatloo, B., Springer International Publishing, Cham, 23–40, https://doi.org/10.1007/978-3-030-87653-1_2, 2022.
European Commission: A hydrogen strategy for a climate-neutral Europe, Brussels, 2020.
European Commission: Commission Delegated Regulation (EU) of 10.2.2023 supplementing Directive (EU) 2018/2001 of the European Parliament and of the Council by establishing a Union methodology setting out detailed rules for the production of renewable liquid and gaseous transport fuels of non-biological origin, 2023.
Fasihi, M. and Breyer, C.: Baseload electricity and hydrogen supply based on hybrid PV-wind power plants, J. Clean. Prod., 243, 118466, https://doi.org/10.1016/j.jclepro.2019.118466, 2020.
Gerlach, A.-K., Stetter, D., Schmid, J., and Breyer, C.: PV and Wind Power – Complementary Technologies, 30th ISES Biennial Solar World Congress 2011, SWC 2011, 4607–4613, https://doi.org/10.4229/26thEUPVSEC2011-6CV.1.32, 2011.
Guo, Y., Li, G., Zhou, J., and Liu, Y.: Comparison between hydrogen production by alkaline water electrolysis and hydrogen production by PEM electrolysis, IOP Conf. Ser.: Earth Environ. Sci., 371, 42022, https://doi.org/10.1088/1755-1315/371/4/042022, 2019.
Hau, E.: Windkraftanlagen: Grundlagen, Technik, Einsatz, Wirtschaftlichkeit, 6th edn., Springer Vieweg, Berlin, 996 pp., 2016.
Hermesmann, M., Grübel, K., Scherotzki, L., and Müller, T. E.: Promising pathways: The geographic and energetic potential of power-to-x technologies based on regeneratively obtained hydrogen, Renew. Sust. Energ. Rev., 138, 110644, https://doi.org/10.1016/j.rser.2020.110644, 2021.
Hofrichter, A., Rank, D., Heberl, M., and Sterner, M.: Corrigendum to “Determination of the optimal power ratio between electrolysis and renewable energy to investigate the effects on the hydrogen production costs” [Int J Hydrogen Energy 48 (5) (2023) 1651–1663], Int. J. Hydrogen Energ., 48, 24150, https://doi.org/10.1016/j.ijhydene.2023.03.128, 2023a.
Hofrichter, A., Rank, D., Heberl, M., and Sterner, M.: Determination of the optimal power ratio between electrolysis and renewable energy to investigate the effects on the hydrogen production costs, Int. J. Hydrogen Energ., 48, 1651–1663, https://doi.org/10.1016/j.ijhydene.2022.09.263, 2023b.
Ibrahim, O. S., Singlitico, A., Proskovics, R., McDonagh, S., Desmond, C., and Murphy, J. D.: Dedicated large-scale floating offshore wind to hydrogen: Assessing design variables in proposed typologies, Renew. Sust. Energ. Rev., 160, 112310, https://doi.org/10.1016/j.rser.2022.112310, 2022.
IEA: Hydrogen, https://www.iea.org/reports/hydrogen (last access: 19 August 2022), 2021.
IRENA: Green hydrogen cost reduction: Scaling up electrolysers to meet the 1.5C climate goal, International Renewable Energy Agency, Abu Dhabi, 2020.
Melaina, M., Antonia, O., and Penev, M.: Blending Hydrogen into Natural Gas Pipeline Networks: A Review of Key Issues, 132 pp., 2013.
Mischner, J., Fasold, H.-G., and Heymer, J.: gas2energy.net, 2nd edn. (online edn.), Edition gwf Gas/Erdgas – Gas 2016, DIV Deutscher Industrieverlag, München, 1708 pp., 2015.
Müller, K., Stark, K., Emel'yanenko, V. N., Varfolomeev, M. A., Zaitsau, D. H., Shoifet, E., Schick, C., Verevkin, S. P., and Arlt, W.: Liquid Organic Hydrogen Carriers: Thermophysical and Thermochemical Studies of Benzyl- and Dibenzyl-toluene Derivatives, Ind. Eng. Chem. Res., 54, 7967–7976, https://doi.org/10.1021/acs.iecr.5b01840, 2015.
Petitpas, G.: Boil-off losses along LH2 pathway, along LH2 pathway, USA, https://doi.org/10.2172/1466121, 2018.
Reuß, M., Grube, T., Robinius, M., Preuster, P., Wasserscheid, P., and Stolten, D.: Seasonal storage and alternative carriers: A flexible hydrogen supply chain model, Appl. Energ., 200, 290–302, https://doi.org/10.1016/j.apenergy.2017.05.050, 2017.
Reuß, M. E.: Techno-Economic Analysis of Hydrogen Infrastructure Alternatives, RWTH Aachen University, 2019.
Roscher, B.: Multi-dimensionale Windparkoptimierung in der Planungsphase: = Multi-dimensional wind farm optimization in the concept phase, Dissertation, Verlagsgruppe Mainz GmbH, Aachen, III, 119, XV pp., XII–XIV, 2020.
Satymov, R., Bogdanov, D., and Breyer, C.: Global-local analysis of cost-optimal onshore wind turbine configurations considering wind classes and hub heights, Energy, 256, 124629, https://doi.org/10.1016/j.energy.2022.124629, 2022.
Schiebahn, S., Grube, T., Robinius, M., Tietze, V., Kumar, B., and Stolten, D.: Power to gas: Technological overview, systems analysis and economic assessment for a case study in Germany, Int. J. Hydrogen Energ., 40, 4285–4294, https://doi.org/10.1016/j.ijhydene.2015.01.123, 2015.
Schmidt, O., Gambhir, A., Staffell, I., Hawkes, A., Nelson, J., and Few, S.: Future cost and performance of water electrolysis: An expert elicitation study, Int. J. Hydrogen Energ., 42, 30470–30492, https://doi.org/10.1016/j.ijhydene.2017.10.045, 2017.
Schnuelle, C., Wassermann, T., Fuhrlaender, D., and Zondervan, E.: Dynamic hydrogen production from PV & wind direct electricity supply – Modeling and techno-economic assessment, Int. J. Hydrogen Energ., 45, 29938–29952, https://doi.org/10.1016/j.ijhydene.2020.08.044, 2020.
Sens, L., Piguel, Y., Neuling, U., Timmerberg, S., Wilbrand, K., and Kaltschmitt, M.: Cost minimized hydrogen from solar and wind – Production and supply in the European catchment area, Energ. Convers. Manage., 265, 115742, https://doi.org/10.1016/j.enconman.2022.115742, 2022.
Shapiro, C. R., Starke, G. M., Meneveau, C., and Gayme, D. F.: A Wake Modeling Paradigm for Wind Farm Design and Control, Energies, 12, 2956, https://doi.org/10.3390/en12152956, 2019.
Simoes, S. G., Catarino, J., Picado, A., Lopes, T. F., Di Berardino, S., Amorim, F., Gírio, F., Rangel, C. M., and Ponce de Leão, T.: Water availability and water usage solutions for electrolysis in hydrogen production, J. Clean. Prod., 315, 128124, https://doi.org/10.1016/j.jclepro.2021.128124, 2021.
Statistisches Bundesamt: Entgelt für die Trinkwasserversorgung in Tarifgebieten nach Tariftypen, https://www.destatis.de/ DE/Themen/Gesellschaft-Umwelt/Umwelt/Wasserwirtschaft/ Tabellen/tw-07-entgelt-trinkwasserversorgung-tarifgeb-nach-tariftypen-2017-2019-land-bund.html (last access: 23 August 2022), 2020.
Stolzenburg, K. and Mubballa, R.: Hydrogen liquefaction report. Integrated design for demonstration of efficient liquefaction of hydrogen (IDEALHY), FCH JU, https://www.idealhy.eu/uploads/documents/IDEALHY_D3-16_Liquefaction_Report_web.pdf (last access: 23 June 2023), 2013.
Ueckerdt, F., Pfluger, B., Odenweller, A., Günther, C., Knodt, M., Kemmerzell, J., Rehfeldt, M., Bauer, C., Verpoort, P., Gils, C., and Luderer, G.: Dossier: Cornerstones of an Adaptable Hydrogen Strategy, Kopernikus-Projekt Ariadne Potsdam-Institut für Klimafolgenforschung (PIK), https://ariadneprojekt.de/publikation/eckpunkte-einer-anpassungsfaehigen-wasserstoffstrategie/ (last access: 12 June 2023), 2021.
Yang, C. and Ogden, J.: Determining the lowest-cost hydrogen delivery mode, Int. J. Hydrogen Energ., 32, 268–286, https://doi.org/10.1016/j.ijhydene.2006.05.009, 2007.
Yodwong, B., Guilbert, D., Phattanasak, M., Kaewmanee, W., Hinaje, M., and Vitale, G.: Faraday's Efficiency Modeling of a Proton Exchange Membrane Electrolyzer Based on Experimental Data, Energies, 13, 4792, https://doi.org/10.3390/en13184792, 2020.
Zarkovic, S. D., Stankovic, S., Shayesteh, E., and Hilber, P.: Reliability improvement of distribution system through distribution system planning: MILP vs. GA, in: 2019 IEEE Milan PowerTech, 23–27 June 2019, Milan, Italy, 1–6, https://doi.org/10.1109/PTC.2019.8810515, 2019.
Žarković, S. D., Shayesteh, E., and Hilber, P.: Onshore wind farm – Reliability centered cable routing, Electr. Pow. Syst. Res., 196, 107201, https://doi.org/10.1016/j.epsr.2021.107201, 2021.