the Creative Commons Attribution 4.0 License.
the Creative Commons Attribution 4.0 License.
 | 13 Feb 2024
An experimental study on the aerodynamic loads of a floating offshore wind turbine under imposed motions
Felipe Novais
Axelle Viré
The rotor of a floating wind turbine is subject to complex aerodynamics due to changes in relative wind speeds at the blades and potential local interactions between blade sections and the rotor near wake. These complex interactions are not yet fully understood. Lab-scale experiments are highly relevant for capturing these phenomena and provide means for the validation of numerical design tools. This paper presents a new wind tunnel experimental setup able to study the aerodynamic response of a wind turbine rotor when subjected to prescribed motions. The present study uses a 1:148 scale model of the DTU 10 MW reference wind turbine mounted on top of a 6 degrees of freedom parallel kinematic robotic platform. Firstly, the thrust variation of the turbine is investigated when single degree of freedom harmonic motions are imposed by the platform, with surge, pitch and yaw being considered in this study. For reduced frequencies greater than 1.2, it is found that the thrust variation is amplified by up to 150 % compared to the quasi-steady value when the turbine is subject to pitch and surge motions, regardless of the amplitude of motion. A similar behaviour is also noticed under yaw motions. Secondly, realistic 6 degrees of freedom motions are imposed by the platform. The motions are derived from FAST simulations performed on the full-scale turbine coupled with the TripleSpar floater, and the tests aim at exploring the thrust force dynamics for different sea states and wind conditions, obtaining reasonable agreement with the simulations. Finally, the work shows the capabilities of an off-the-shelf hexapod to conduct hybrid testing of floating offshore wind turbines in wind tunnels, as well as its limitations in performing such tests.
- Article
(4186 KB) - Full-text XML
- BibTeX
- EndNote


Nowadays, most offshore wind turbines are installed on support structures that are rigidly mounted on the seabed. However, these fixed foundations are only economically feasible for water depths up to about 60 m (van Kuik et al., 2016). By contrast, floating offshore wind turbines (FOWTs) that are moored to the seabed unlock the exploitation of wind resources in deeper water. As opposed to bottom-fixed wind turbines, FOWTs are subject to motions in 6 degrees of freedom that result from the interactions between the turbine, wakes, and met-ocean conditions. Due to the complex dynamics involved in such systems, there is a necessity for a comprehensive understanding of the loads on such systems and the suitability of existing numerical models used during the design process.
Scaled model testing is an attractive way to validate numerical models and better understand the physics involved in these systems, at a lower cost than full-scale prototyping. An example of the use of experimental data by the research community is presented in Robertson et al. (2013), where wave basin data are utilized as a benchmark for code-to-code comparison of fully coupled aero-hydro-elastic engineering tools. Similarly, Bergua et al. (2023) performed comparisons between wind tunnel experiments and numerical models of different fidelities to validate the aerodynamic loading on a turbine when experiencing large motions caused by a floating support structure.
In general, wave basin tests have demonstrated great utility in investigating the coupled dynamics of floating offshore wind turbines. In Goupee et al. (2012), the authors analysed the response of three different floaters supporting a 1:50 scale model of the NREL 5 MW turbine. As the blades of the model were only geometrically scaled, the rotor was subjected to a thrust force that was significantly lower than expected due to the Froude-scaled low-Reynolds-number wind generated at the basin. Hence, a subsequent test campaign was conducted in Goupee et al. (2014), where the rotor blades were redesigned, utilizing an airfoil profile specifically for Froude-scaled wind which could match the desired aerodynamic thrust forces. Other endeavours such as Goupee et al. (2017), Bredmose et al. (2017), Kim et al. (2023) and Meng et al. (2023) also included servo-control capabilities to the model and mainly focused on investigating the global response of the system.
Even though testing floating offshore wind turbines in a wave basin allows us to have both the wind and the waves physically present, there are challenges involved mainly when it comes to controlling the wind field and the recirculation of the flow in the area, as shown by Gueydon et al. (2020). Furthermore, the low Reynolds number encountered when applying Froude scaling could be detrimental to the aerodynamic response of the turbine, as discussed by Bayati et al. (2018b). Therefore, when it comes to assessing purely the aerodynamic phenomena, it is preferred to perform wind tunnel testing.
Within the scope of the LIFES50+ project (LIFES50+, 2015), a 1:75 model of the DTU 10 MW turbine was designed for wind tunnel testing (Bayati et al., 2016b, a). The model was initially mounted on top of a 2 degrees of freedom (DOF) test rig able to impose pitch and surge motions at the base of the turbine. The results of this experiment were utilized to compare the thrust and torque measurements to the results of a blade element momentum (BEM) model with dynamic wake. Discrepancies were observed between the numerical model and the gathered data, whose causes were not at first clearly identified, and hence motivated further investigation (Bayati et al., 2016c). Later, it was concluded that the outcomes of the experiment were affected by the flexibility of the tower. As a result, a new set of experiments, using a stiffer tower, was conducted. The UNsteady Aerodynamics of FLOating Wind turbines (UNAFLOW) project aimed to understand the aerodynamic response and wake of a floating offshore wind turbine undergoing large surge motions; the methodology applied to this test campaign is mainly documented in Bayati et al. (2018a), Fontanella et al. (2021) and Mancini et al. (2020). Amidst the test findings, it was observed that the thrust response of the turbine presented a quasi-steady behaviour up to reduced frequencies of 0.5 Hz.
In Fontanella et al. (2022), torque and thrust measurements for a 15 MW wind turbine model were performed for 4 DOFs. The imposed motion frequencies were defined based on the natural frequencies of each DOF according to two different floating platforms and the wave spectrum peak for a specific site. Among the findings, it was noticed that the agreement with a quasi-steady model was good for the low-frequency cases, with differences only observed for the pitch. However, at wave frequency, the rotor loads for both surge and pitch were not linearly proportional to the rotor apparent speed, indicating the presence of aerodynamic unsteadiness. In the OC6 project reported by Bergua et al. (2023), both pitch and surge were tested. However, for the range of frequencies considered, the aerodynamic loads presented mostly a quasi-steady response.
In addition to investigating wind turbine loads, a number of wind tunnel tests focus on floating wind turbine wakes and their development under different atmospheric conditions (e.g. Schliffke et al., 2020). These experimental campaigns typically rely on actuator disc models, with a focus on mid- and far-wake regions rather than turbine loads. Up to date, not many wind tunnel test campaigns with scale models of three-blade floating turbines are documented in the literature, and the number of conditions assessed is still scarce. Nevertheless, experimental data are very useful for providing low-uncertainty datasets for the validation of numerical codes. This paper builds on the previous experiments described above whilst extending the motion conditions tested. The turbine investigated here follows the same rotor scaling principles as defined in Bayati et al. (2016b) and is placed on top of a 6 DOF hexapod. Differently from the UNAFLOW project, where only surge was tested, this paper also includes pitch and yaw motions. The aim is to investigate whether the rotor is still subjected to quasi-static loads under these different prescribed motions for a range of motion amplitudes and frequencies. Additionally, prescribed motion time series extracted from 6 DOF fully coupled simulations are also applied to the hexapod, and the measured loads at the tower top are compared to the simulated values. It is shown how the present setup is capable of investigating more realistic conditions than those previously analysed in the literature.
The experimental setup is composed of a wind turbine scale model placed on top of a 6 degrees of freedom hexapod. The setup was tested in the Open Jet Facility (OJF) of the Delft University of Technology. The tunnel is a closed-loop open-jet test section facility with an octagonal nozzle with a size of 2.85 m × 2.85 m and a contraction ratio of 3:1 opening into a 13 m long, 8 m high open test section. The stream results are uniform with a turbulence intensity of 0.5 % up to 1 m from the nozzle exit, where the model is placed in the present tests, and lower than 2 % at 6 m from the nozzle. The tunnel is powered by a 500 kW fan, and the flow maximum velocity in the test section is 35 m s−1. The flow temperature is kept constant by a heat exchanger. A view of the setup in the wind tunnel test section is shown in Fig. 1.
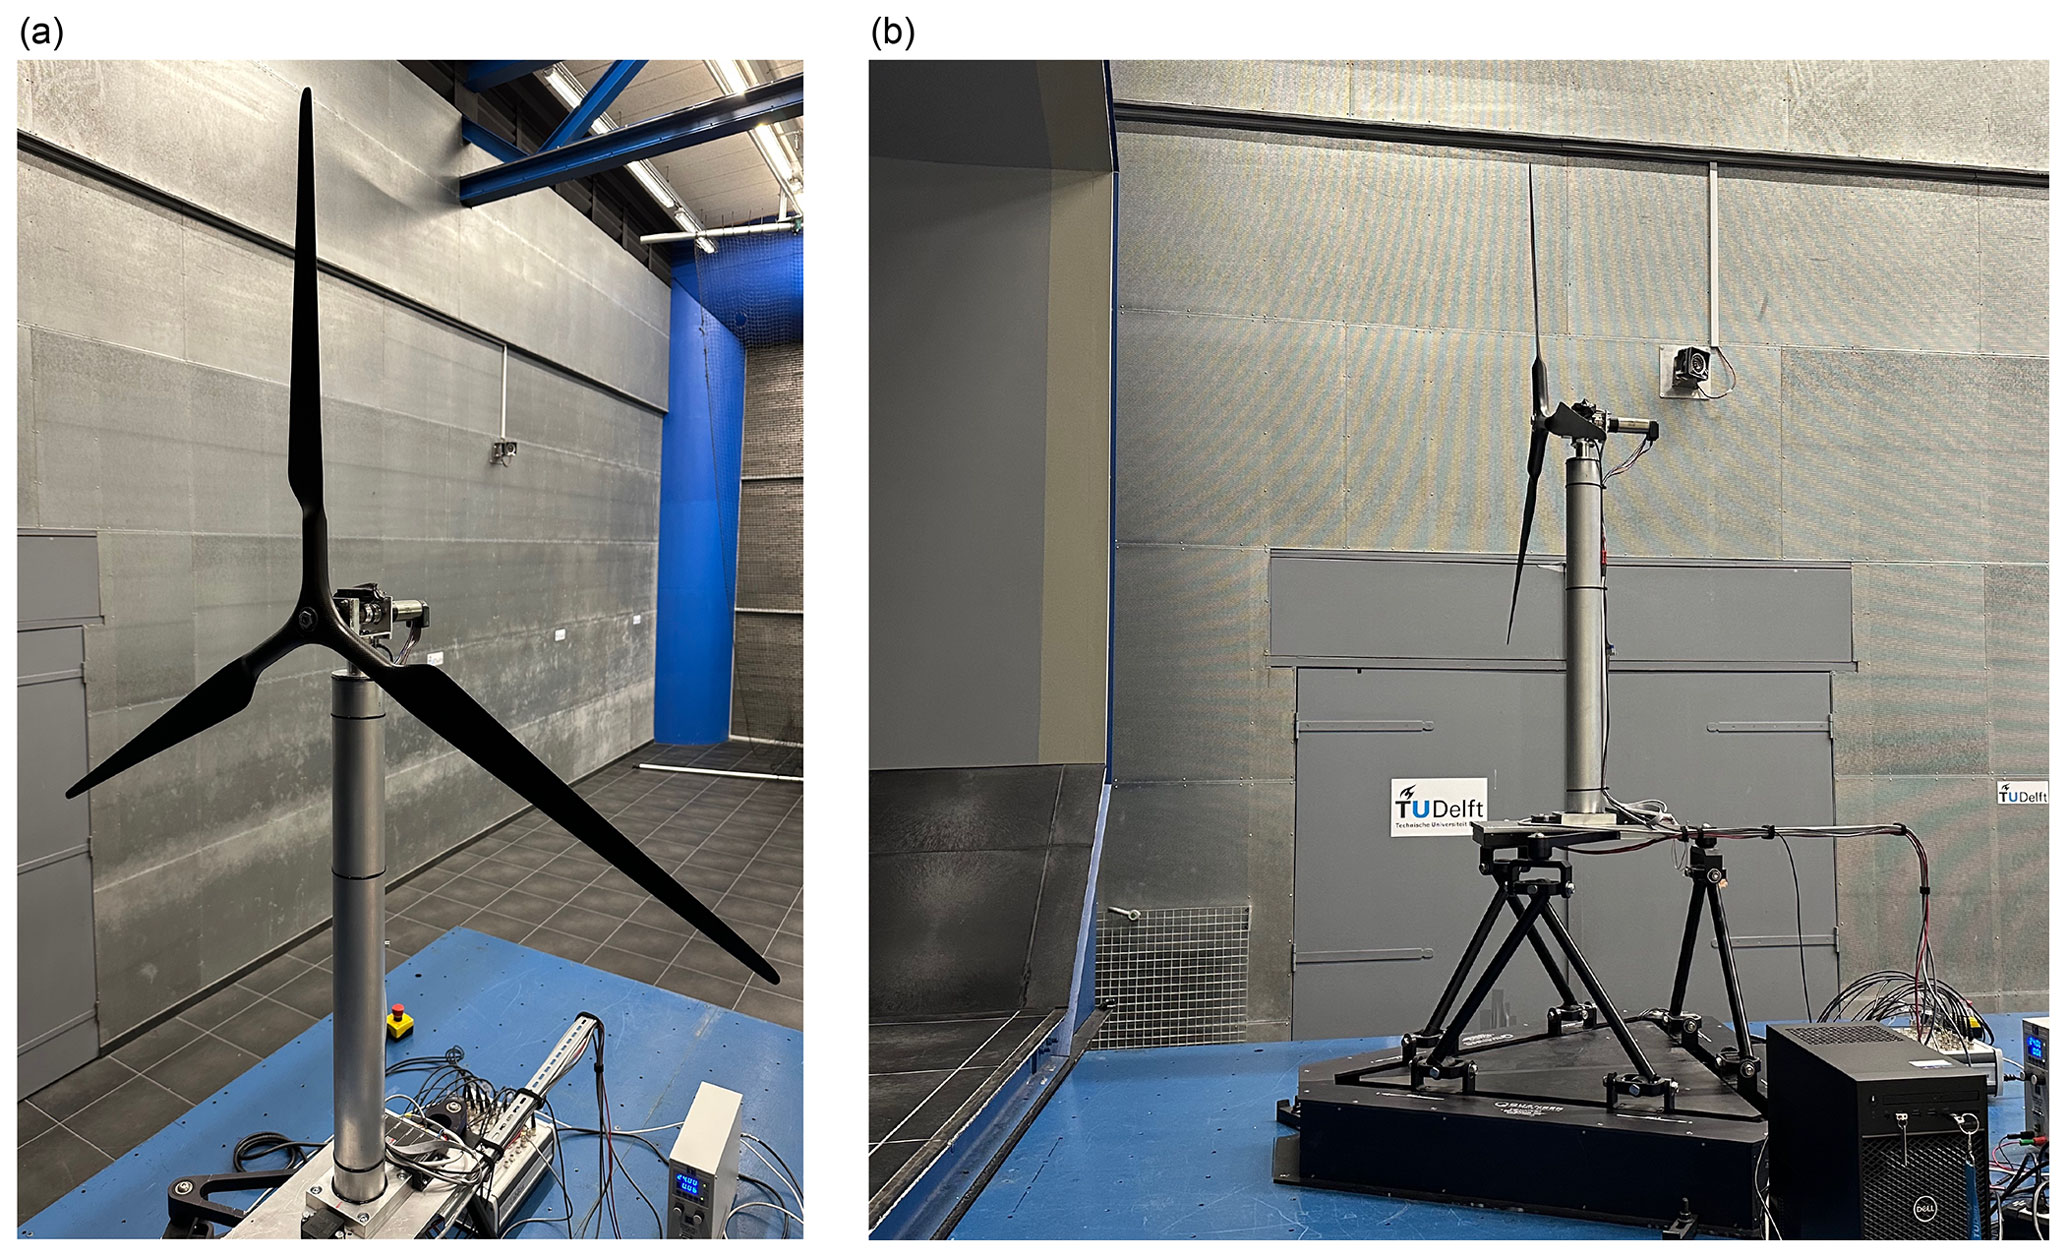
Figure 1View of the experimental setup in the wind tunnel test section: (a) close-up of the wind turbine model and (b) complete setup installed in the test section.
2.1 Wind turbine model
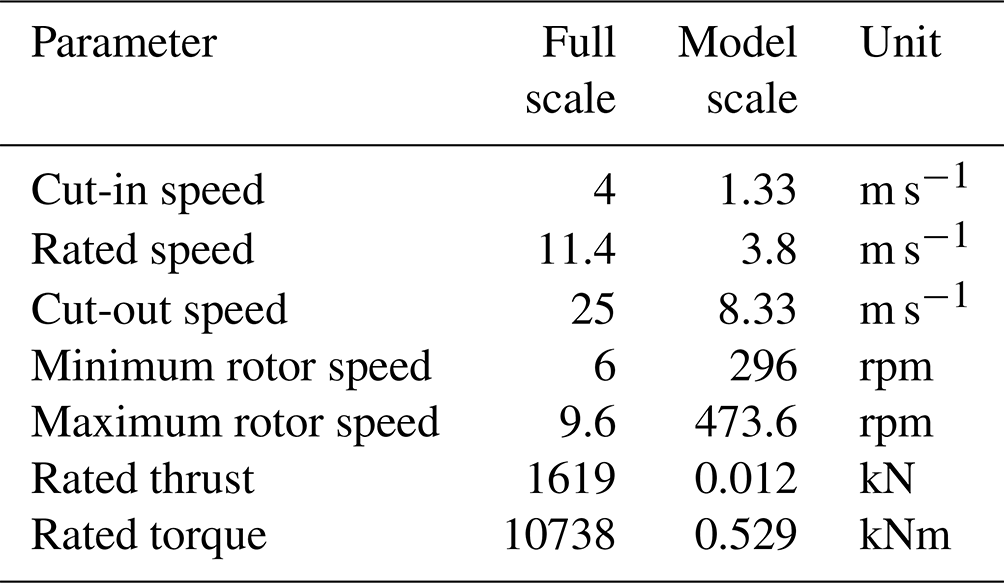
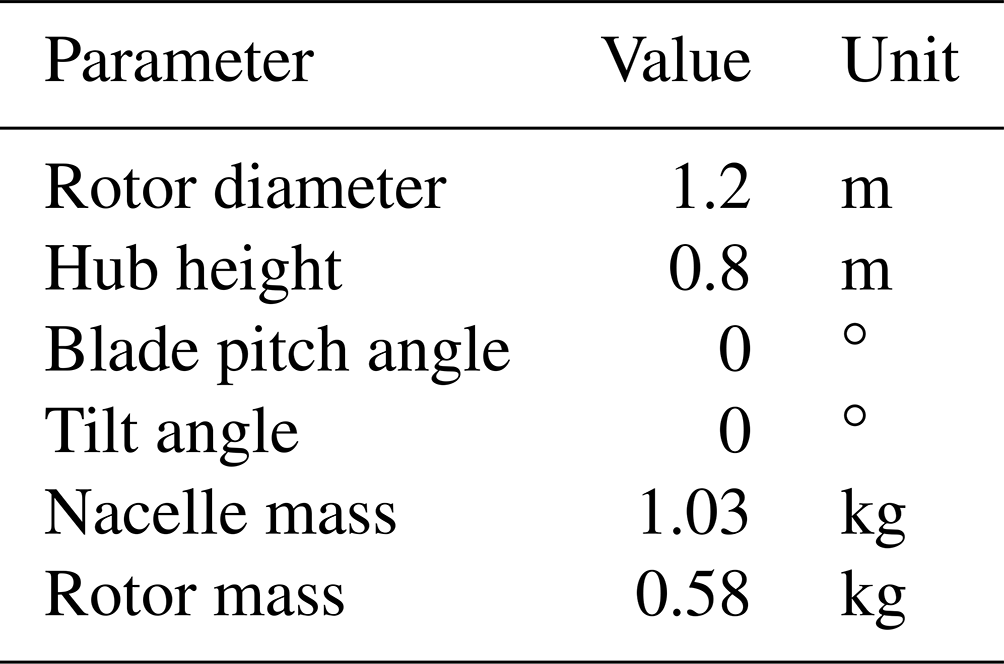
The wind turbine model utilized in this work is a 1:148 scale model of the DTU 10 MW reference wind turbine (RWT) (Bak et al., 2013). It is a three-bladed, fixed-pitch upwind rotor model designed to operate at a velocity scale of 3. The aerodynamic design was performed in Fontanella et al. (2023). The highlights relevant to the setup description and the analysis of the results are summarized here, and the main operating parameters and specifications are reported in Tables 1 and 2. The blades of the model are not geometrically scaled from the full-scale ones. Instead, to avoid low-Reynolds impaired aerodynamic performance, the rotor is scaled according to a performance scaling oriented at the correct reproduction of the thrust force. The primary objective of reproducing the thrust force is relevant since the model is specifically designed for floating-related testing, and the predominant role of thrust in floating offshore wind turbines, especially in the system dynamics and loads, is known (Bayati et al., 2016b). The same performance scaling methodology had been used before for different wind turbine models with different applications and scales (Muggiasca et al., 2021).
Table 1Comparison between full-scale and model-scale operation conditions.
A fixed-pitch wind turbine model can be considered beneficial for the scope of the present campaign, given that it excludes any uncertainty in the blade pitch angle. The latter can indeed cause the turbine to operate in a condition different than expected or to operate with different angles between the blades.
The SD7032 airfoil is selected for the design of the wind turbine scaled model. This is a low-thickness profile suitable for low-Reynolds application, such as the present one, and is therefore different from the profiles used at full scale. The static and dynamic polars of the SD7032 airfoil were experimentally characterized by others (LIFES50+, 2015). The present work only focuses on unsteady phenomena at rotor scale, rather than at airfoil scale.
The rotor is driven by a servomotor (model: Maxon EC-4pole 30 200 W) featuring a gearbox (model: Maxon GP 32 C 5.8:1) and is connected to the rotor shaft by means of an Oldham coupling. The servomotor is speed controlled by a servo drive (model: Maxon Escon ) and is also equipped with a braking resistor (model: Maxon DSR ) to dissipate the power generated.
The rotor-nacelle assembly is mounted on a cylindrical aluminium tower, which guarantees a high stiffness, important to limit the tower-top deflection and make the rotor follow the desired trajectory precisely. The first fore–aft mode is at around 12.5 Hz, more than twice the highest motion frequency tested and far from the rotor 1P and 3P frequencies. It is crucial that the tower modes are not excited by any system frequency to avoid large deflections and limit vibrations that could affect the tests.
2.2 Hexapod
The tower base of the scaled wind turbine model described in the previous section is mounted on a parallel kinematic robot capable of imposing motions in 6 degrees of freedom (translations: surge, sway and heave; rotations: roll, pitch and yaw). The motion system used here is the commercially available Quanser hexapod. The use of a commercial hexapod offers some advantages compared to handmade standalone systems. For example, it gives the possibility of easily recreating the setup in different experimental facilities. Additionally, the compactness, light weight and transportability of the hexapod allow for an easy and fast setup installation in the test facility. Tests were performed prior to the experimental campaign in order to assess the capabilities and limitations of the hexapod beyond the specifications and ensure the correct motion tracking in the campaign. The outcome is that the hexapod is capable of operating with the wind turbine at motion frequencies up to 5 Hz without amplitude tracking error. The maximum amplitudes are 75 mm for translations and 10∘ for rotation at low frequencies, which decrease to 10 mm and 1∘ at the maximum frequency, limited by the maximum velocity and acceleration on each DOF. This corresponds, considering as an example a surge sinusoidal motion case at rated wind, to testing at reduced frequency (fr) of 1.5 with reduced motion amplitude (Ar) of 0.01 and normalized velocity variation (ΔV*) of 0.125. These parameters are further defined in Appendix B. The hexapod motion is commanded by a host pc and consists of pre-calculated time histories for the various cases to be tested. The host pc serves as a data acquisition (DAQ) system for the hexapod motion parameters.
2.3 Measurements
The measurement system consists of several sensors. A six-component load cell (model: ATI Mini45 SI-290-10) is placed between the tower top and the nacelle and measures the rotor integral forces and torques. From the load cell measurement, the rotor thrust and torque are obtained. Two MEMS triaxial accelerometers (model: TE Connectivity 4030-002-120), placed at the tower base and nacelle locations, measure the translational accelerations. Velocities and position are derived from acceleration measurements, and they are used to enforce motion tracking and to evaluate amplification phenomena that may occur at the rotor location due to tower flexibility concerning the first fore–aft mode in motion cases involving high accelerations. For this scope, the accelerometers are of the low-frequency type. The wind turbine operating parameters are retrieved from the motor servo drive and include speed, measured by an encoder (model: Maxon HEDL 5540) embedded in the motor, and current, from which the torque can be calculated. All sensor signals are acquired with a sampling frequency of 1000 Hz by the DAQ system based on a real-time machine (model: dSPACE 1302), which also combines a human–machine interface (HMI) for signal visualization and to command the wind turbine operation. Feedback on the hexapod's actual motion is also acquired by the DAQ system for synchronization purposes. The uniform wind speed is measured by means of a pitot tube installed in the nozzle upstream of the contraction and retrieved from the tunnel control system. The speed at the testing location has been verified with a portable fan-type anemometer for the main conditions. A schematic representation of the setup is shown in Fig. 2.
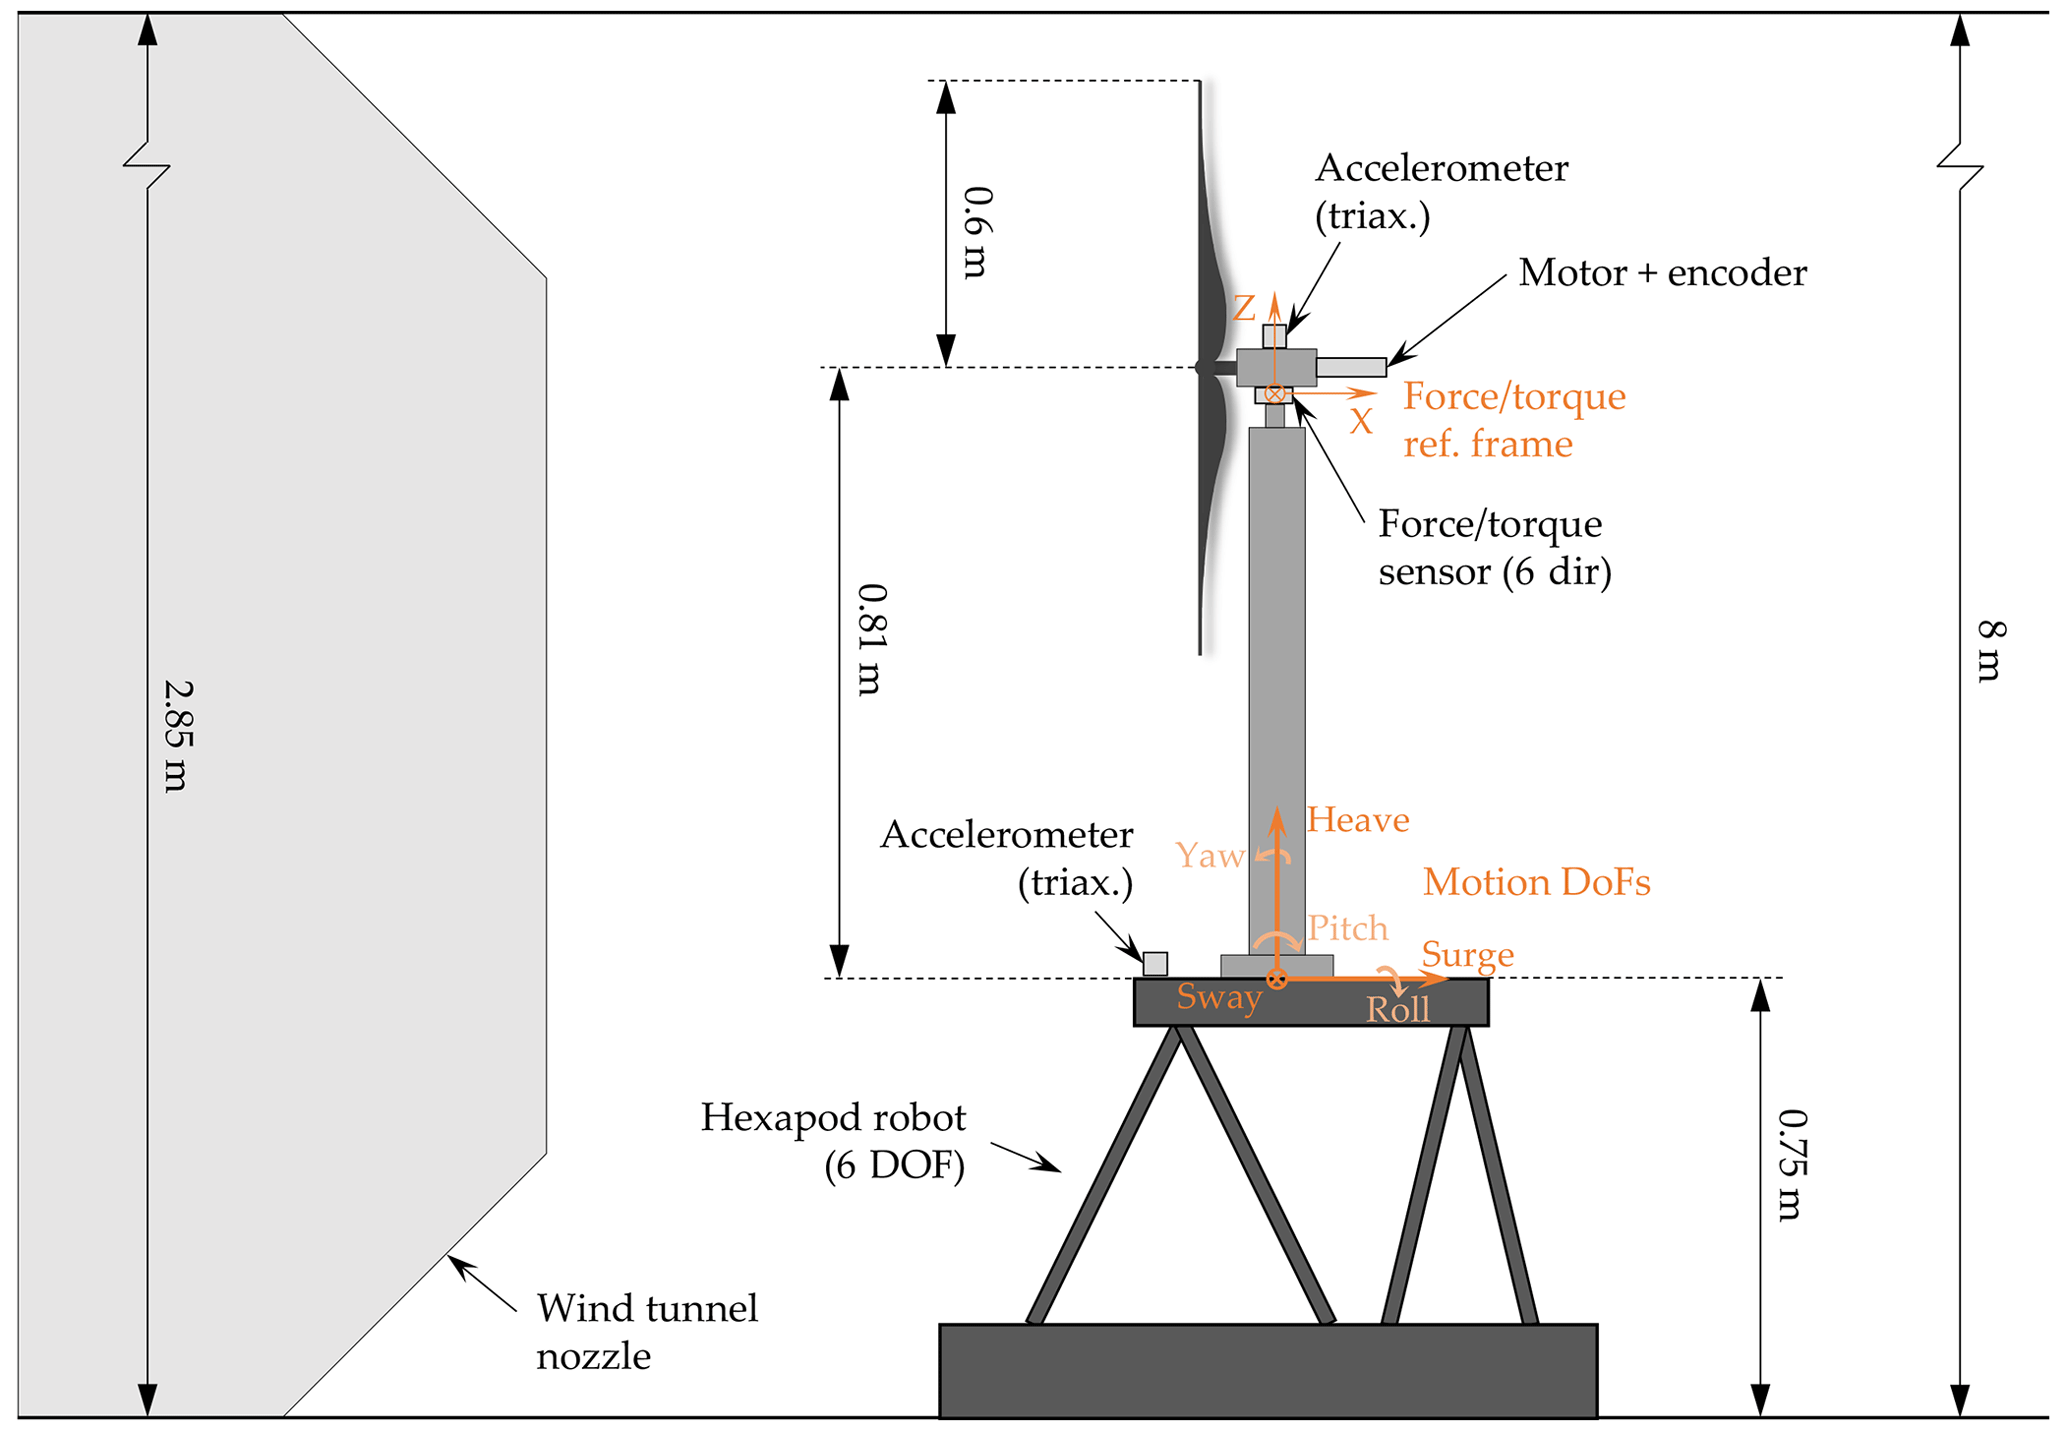
Figure 2Sketch of the experimental setup including motion and force measurement coordinate systems.
A series of experiments were performed on both a static and a moving turbine. The static tests aim at characterizing the aerodynamics of the scaled rotor and hence validating the numerical design of the model. These static tests include the reproduction of the full-scale operating points and the evaluation of the rotor performance in the whole wind speed and rotor speed operating range. In addition, tests aimed at evaluating the aerodynamic sensitivities of the rotor to wind speed and rotor speed variations were performed around the operating points considered for the moving cases.
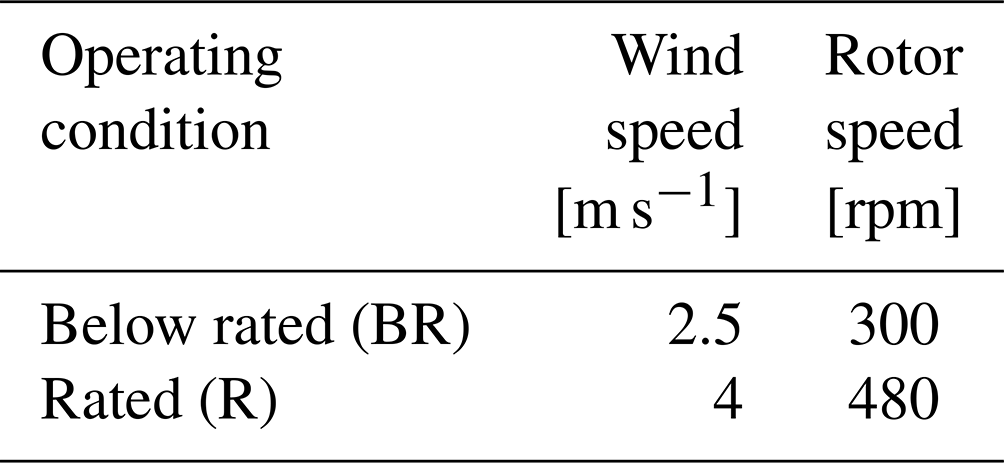
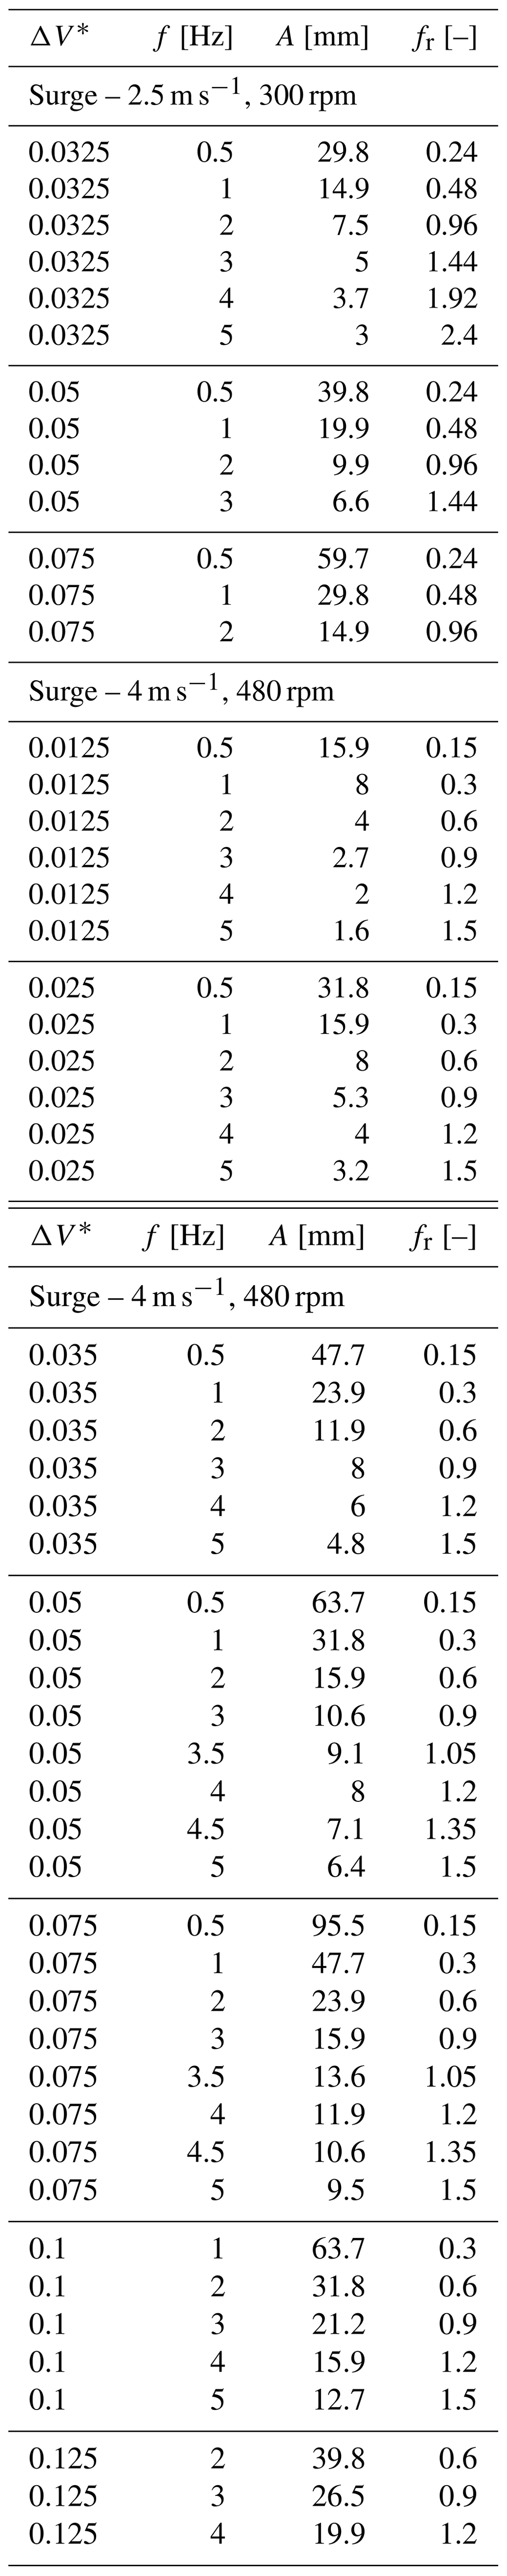
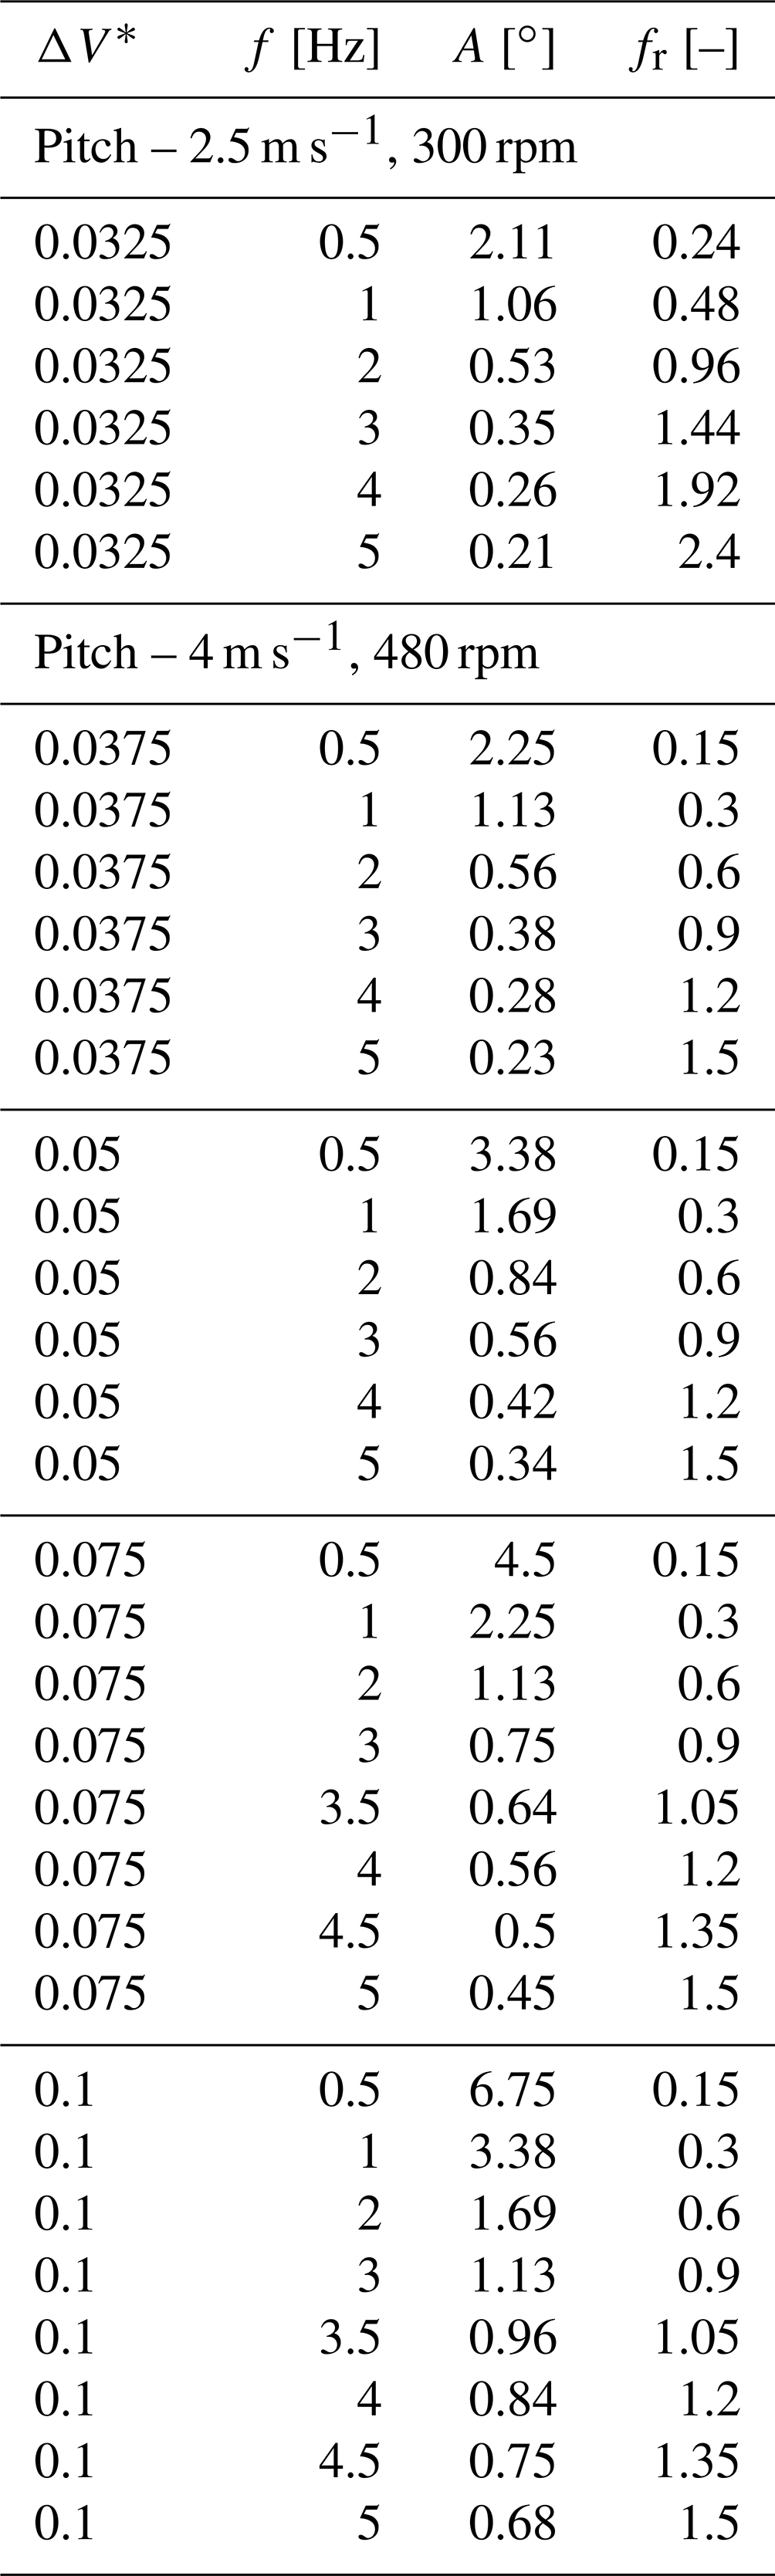
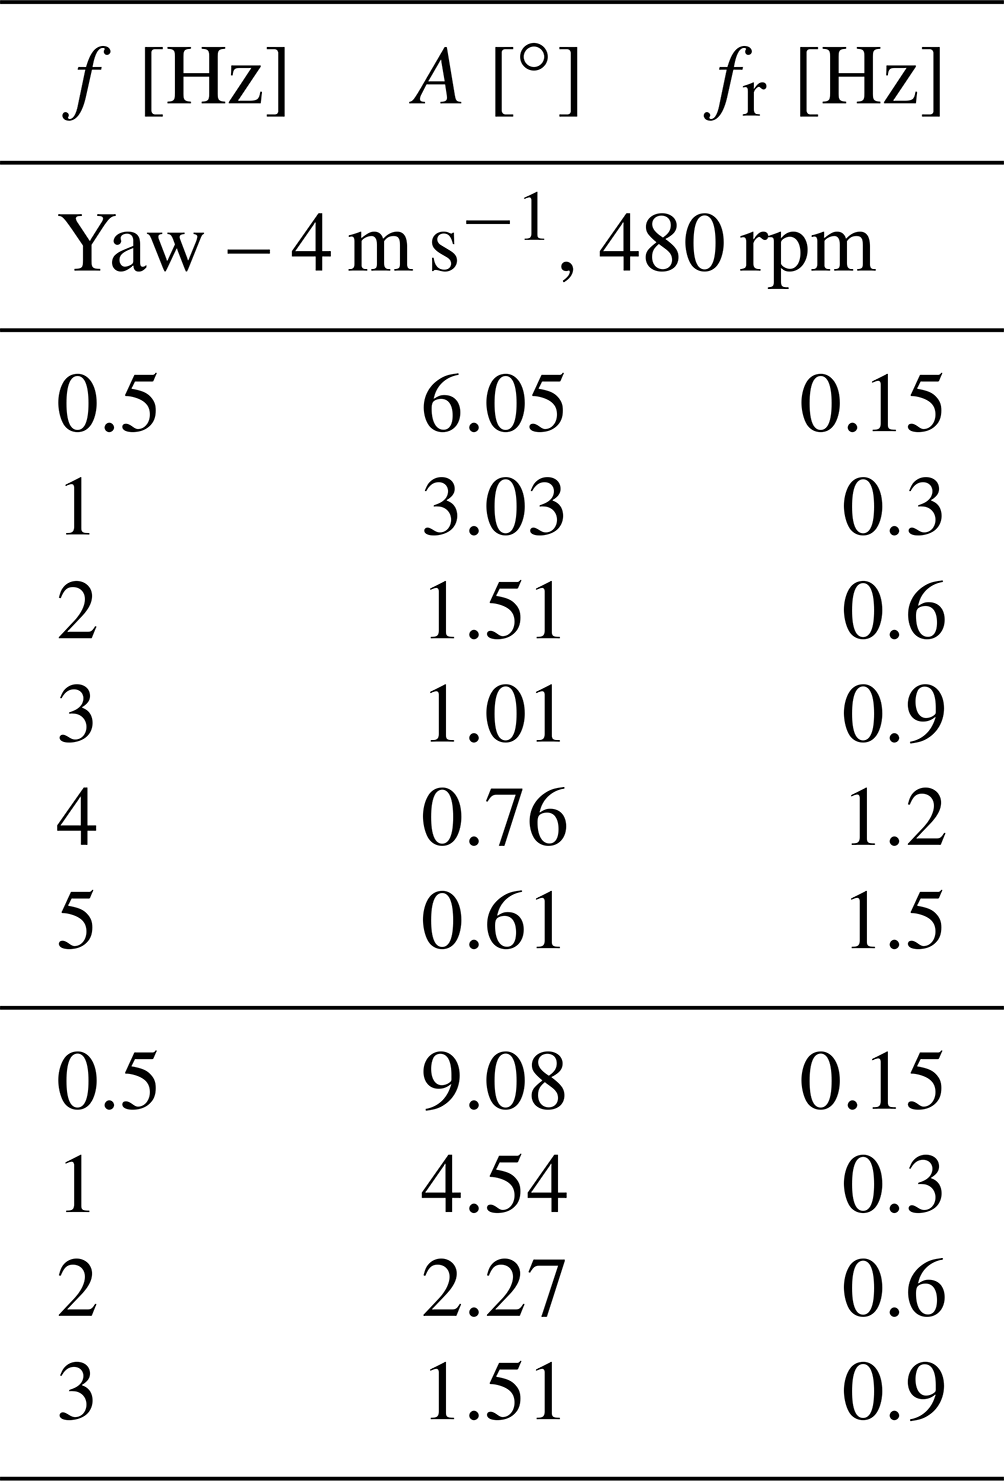
Regarding the motion tests, sinusoidal motions on a single DOF for surge, pitch and yaw were performed. The test matrix of surge and pitch motion cases consists of different sets of frequencies and motion velocities. The frequencies are in the 0.25–5 Hz range, with a thickening in the high frequencies, and the normalized motion velocities (ΔV*) are in the 0.0125–0.125 range. The motion velocity is identified as a key parameter since the thrust variation, excluding unsteadiness, is directly proportional to it. The motion amplitude is calculated from the velocity and frequency. A similar reasoning applies to the yaw motion case selection. The complete test matrices are displayed in Tables A1–A3. Two operating points of the wind turbine are considered for these tests, listed in Table 3, representing the rated condition (U=4 m s−1) and an additional condition in the below-rated region (U=2.5 m s−1). The duration of each test is different and is such that the tests include 50 full motion cycles. The main scope of the single DOF tests is to study unsteady aerodynamic effects that may arise at a high frequency and assess the validity of the quasi-static theory at a low frequency. The values of reduced amplitudes and frequencies for the surge motions considered in this work are shown graphically in Fig. 3 and are compared with the values considered in previous experimental studies as reported in Ferreira et al. (2022). As shown, an important contribution of this work lies in having tested higher motion frequencies than in other studies available in the literature.
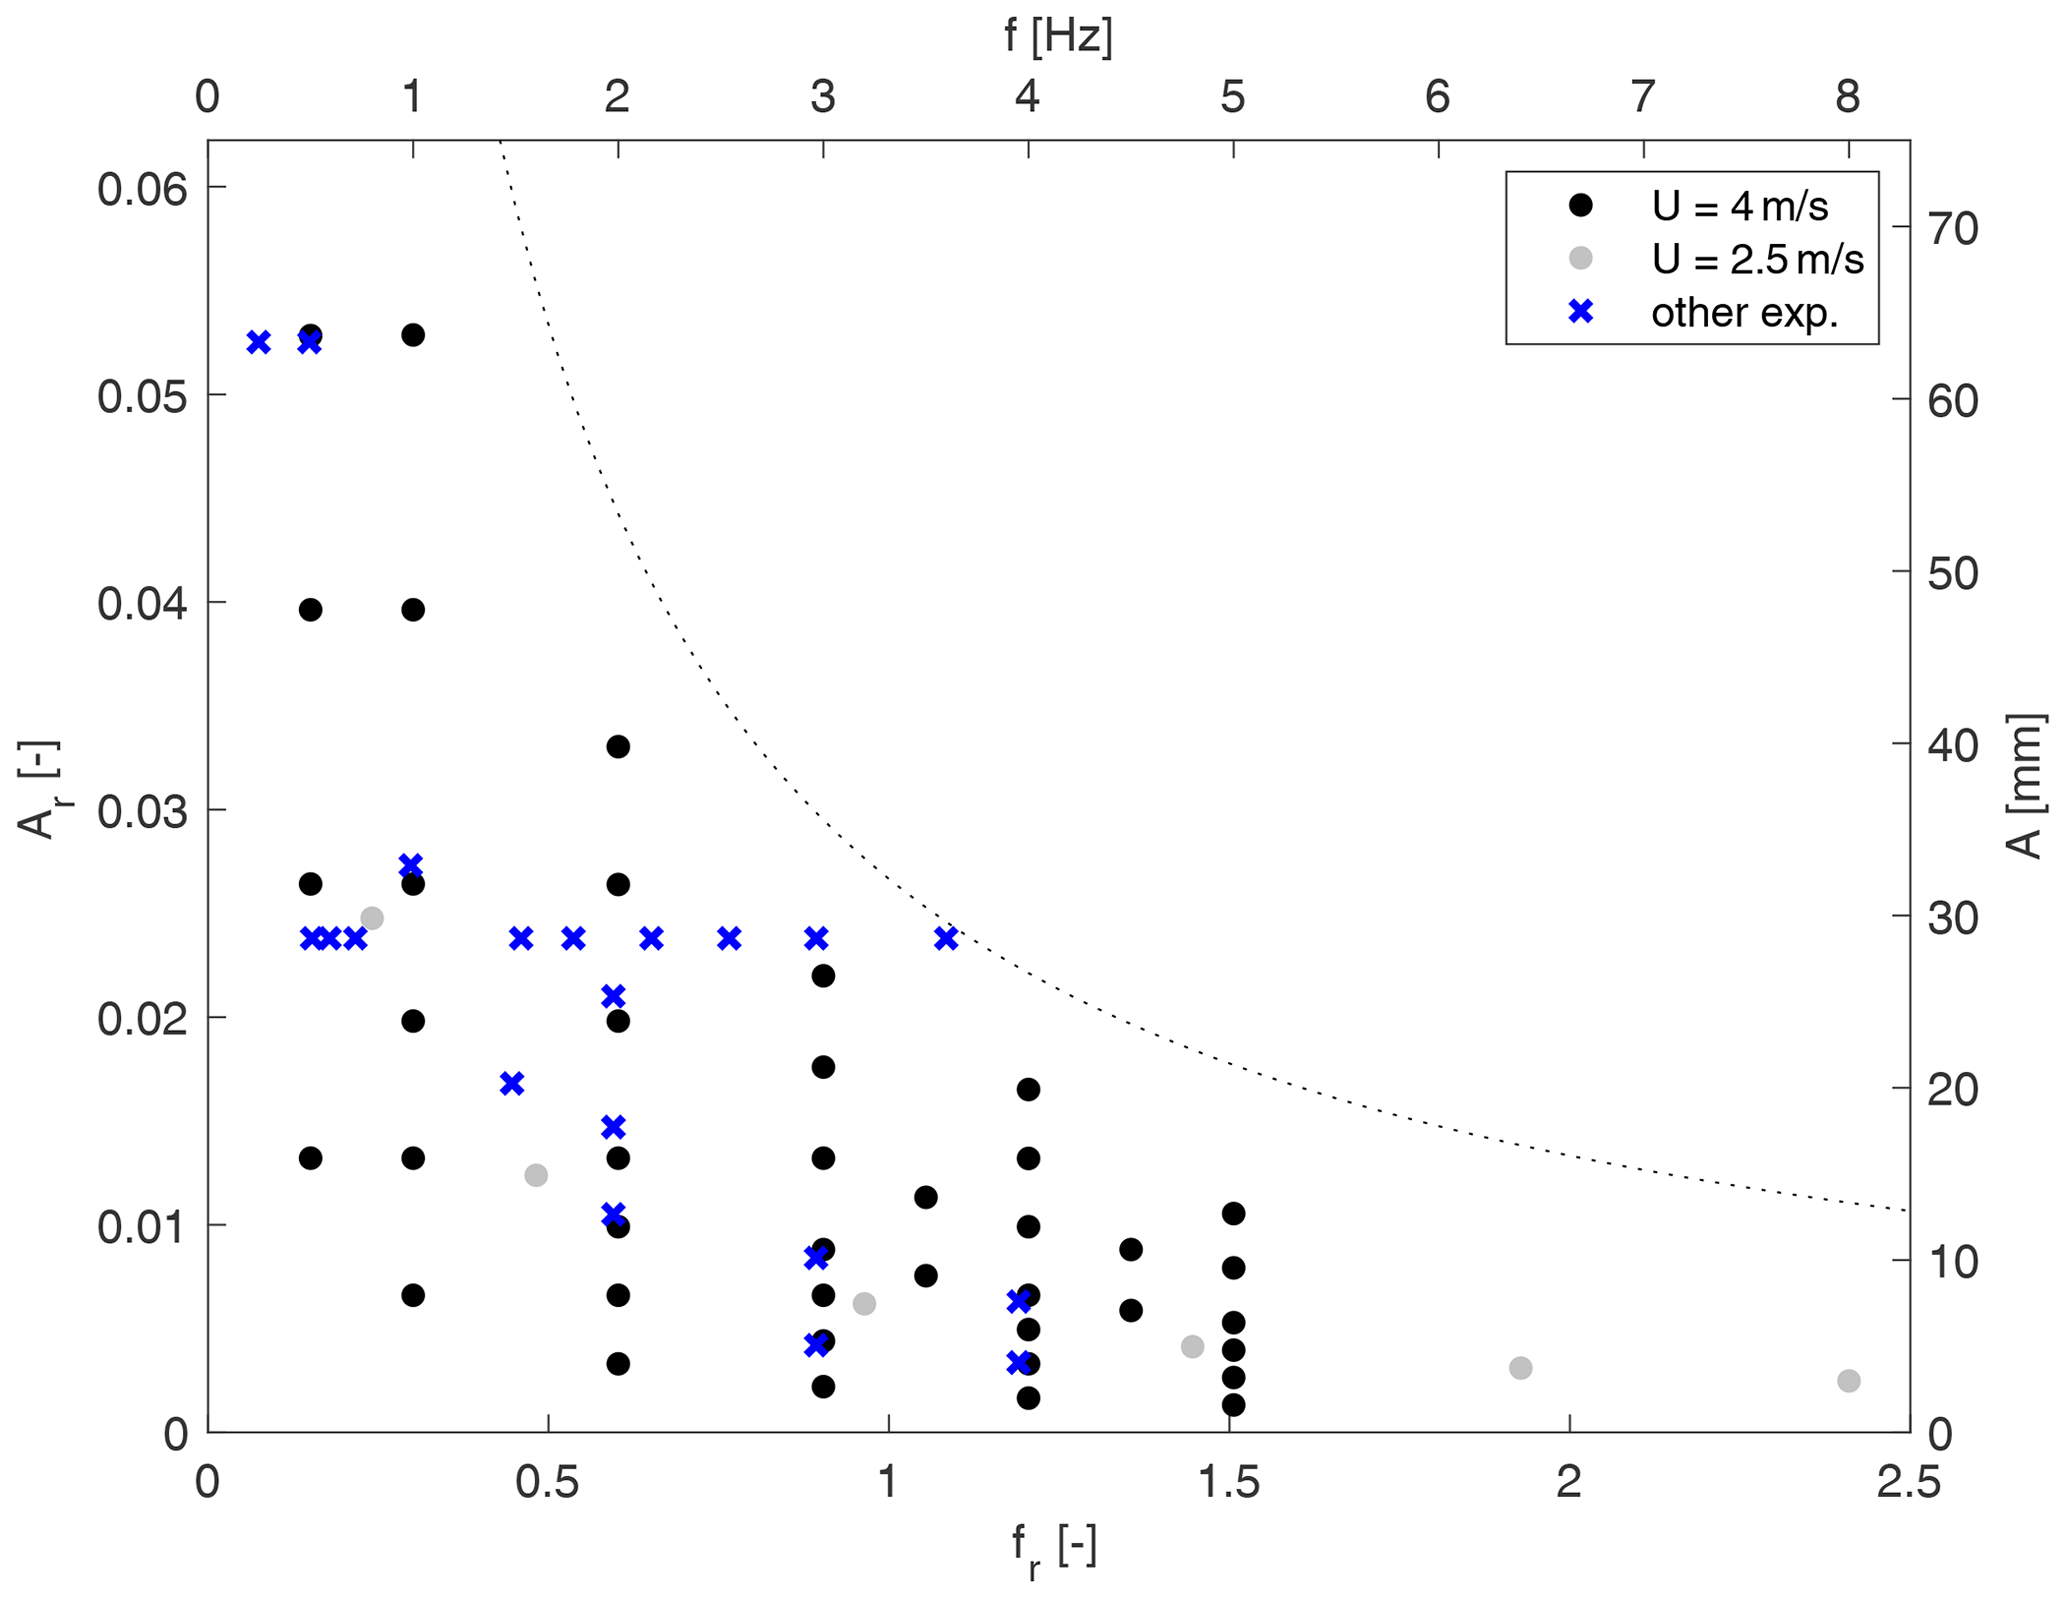
Figure 3Surge motion test matrix visualized according to nondimensional and key operational indicators and compared with previous experimental studies (blue crosses). The cases of the present study are split according to the wind speed in rated (U=4 m s−1, black dots) and below-rated (U=2.5 m s−1, grey dots) conditions. The dotted line represents the nominal limit of the hexapod. The dimensional parameters (top and left axes) apply only to the present study and rated wind condition.
Table 3Turbine operating parameters for prescribed motion cases.
Additionally, 6-DOF motion tests were performed to reproduce the realistic dynamics of a floating wind turbine under combined wind–wave loading. These are just mentioned as they are not pertinent to the findings of this study but are indeed relevant for assessing the capability of the setup and preparing for future studies.
For each test run, one or multiple offset tests with a duration of 10 s are run with the hexapod in the still homing position, with the rotor stopped and the wind tunnel off, to calibrate the load cell offset values that are subjected to drifts. Each motion test case is repeated in wind and no-wind conditions. The latter, in which only the motion is activated and both the rotor and the wind tunnel are turned off, is needed to extract the aerodynamic loads from the force measurements, purifying them of the inertial component. The procedure is explained in Sect. 4.2.
During all the tests with motions, the rotor speed is kept constant. It is important to ensure that the rotor speed variation is as little as possible in order to exclude any effect of it on rotor loads that could be summed to the effect caused by the motion. To ensure good rotor speed tracking, the speed gains in the main motor servo controller are set rather high. The excellent tracking is highlighted considering that the standard deviation in a reference motion case, e.g. a high-frequency surge motion, is around 3.5 rpm, while for comparison the standard deviation for a static test is around 3 rpm. A drawback is that this results in a highly varying motor current, and consequently also torque, found in the acquired signals. However, this does not affect the results since they focus on the motion-induced thrust force variation that is not affected by the torque variance but rather benefits from the very constant rotor speed. Torque is used in steady-state analysis, where only average values are considered, or similar.
4.1 Static tests
Prior to performing tests with the turbine under motion, a series of experiments were conducted in order to verify the aerodynamic performance of the scaled rotor. These experimental results were compared to both the reference downscaled values of the thrust and power of the DTU 10 MW wind turbine and the steady-state simulations with the wind turbine model polars utilizing FAST (Jonkman and Jonkman, 2016). Experiments were done twice to assess the repeatability of the measurements and were performed only in the region where the reference turbine, which has a variable-pitch control strategy, would be operating at a pitch angle of 0∘.
The power curve comparison is shown in Fig. 4. Both torque and thrust measurements are consistent, and only a small scattering is observed. The thrust presents a very good match with the FAST simulation results and overlaps the curve of the reference turbine. This is expected since the turbine was specifically designed to operate in that range. For low wind speeds, the experimental thrust measurements are more dispersed and slightly lower than the numerical simulations, which might be due to the wind tunnel's limitation in accurately reproducing flows at such a low wind speed. The torque measurements, both experimental and simulated, indicate lower values compared to the DTU 10 MW turbine. This difference can be attributed to the utilization of a low-Reynolds-number airfoil, the SD7032, which is less efficient than the airfoil used in the reference rotor.
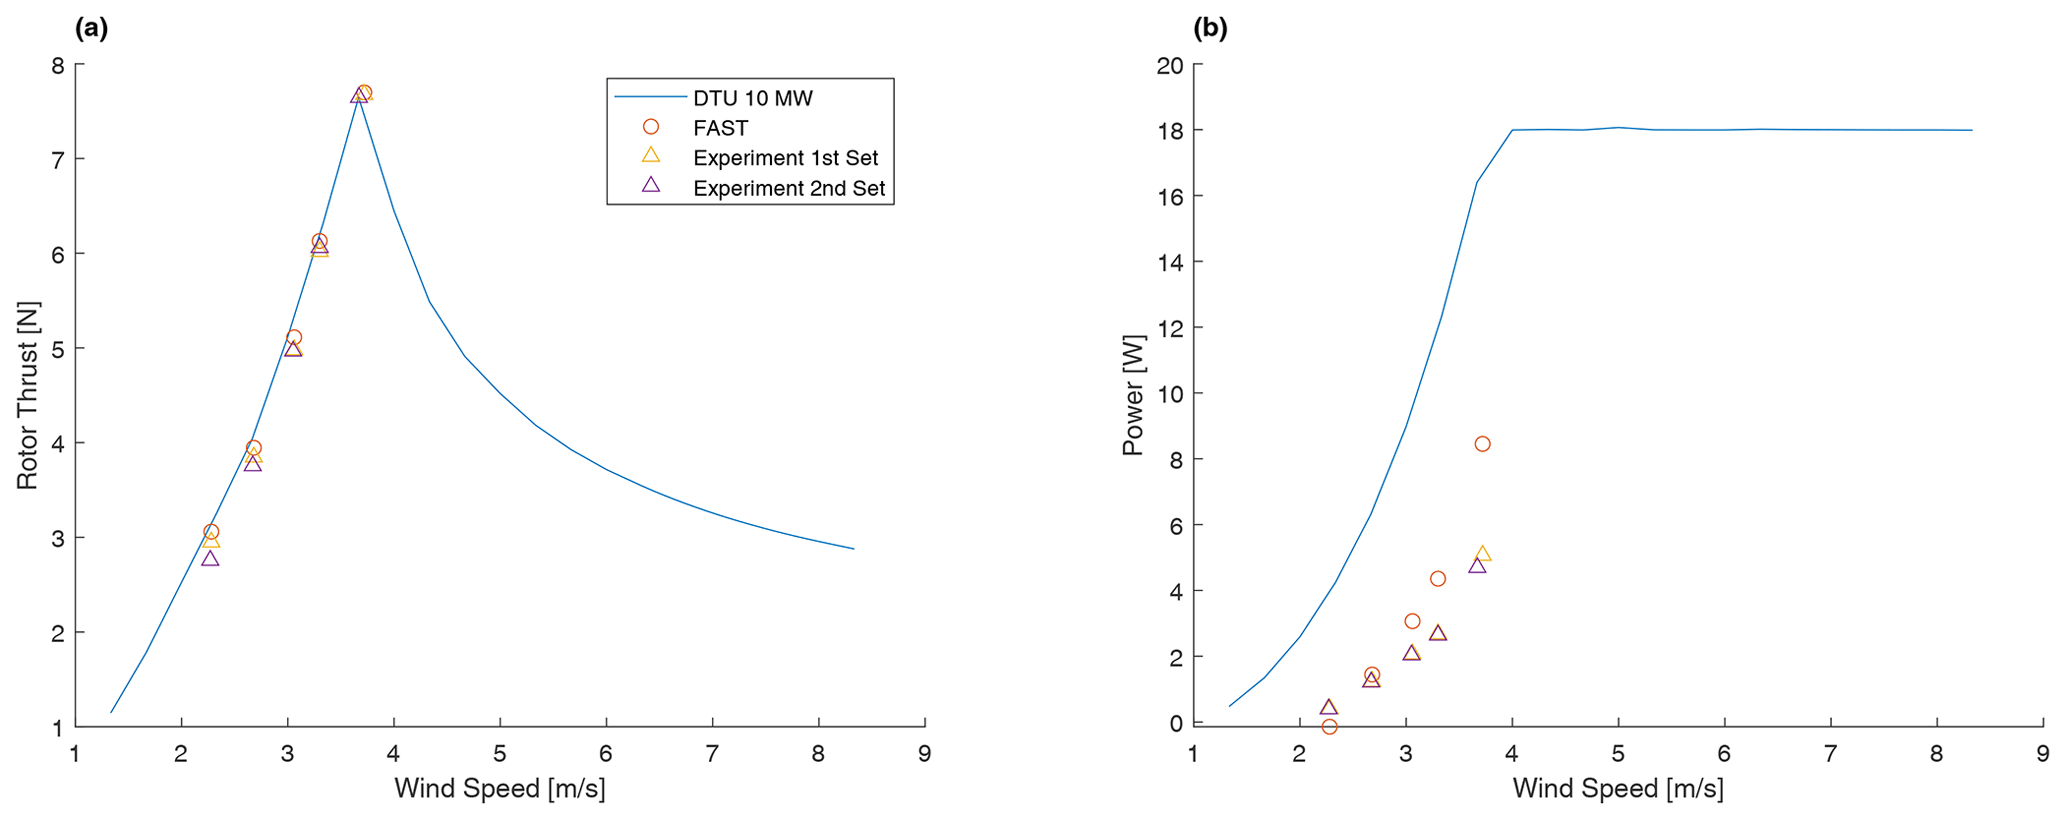
Figure 4Thrust (a) and power (b) comparison of the wind turbine model as a function of the wind velocity.
Various wind conditions and rotational speeds were also utilized to conduct tests on the turbine. The map in Fig. 5 displays the turbine's thrust coefficient, CT, and power coefficient, CP, across different operating conditions. Additionally, the main operational points considered in this paper are highlighted (red symbols).
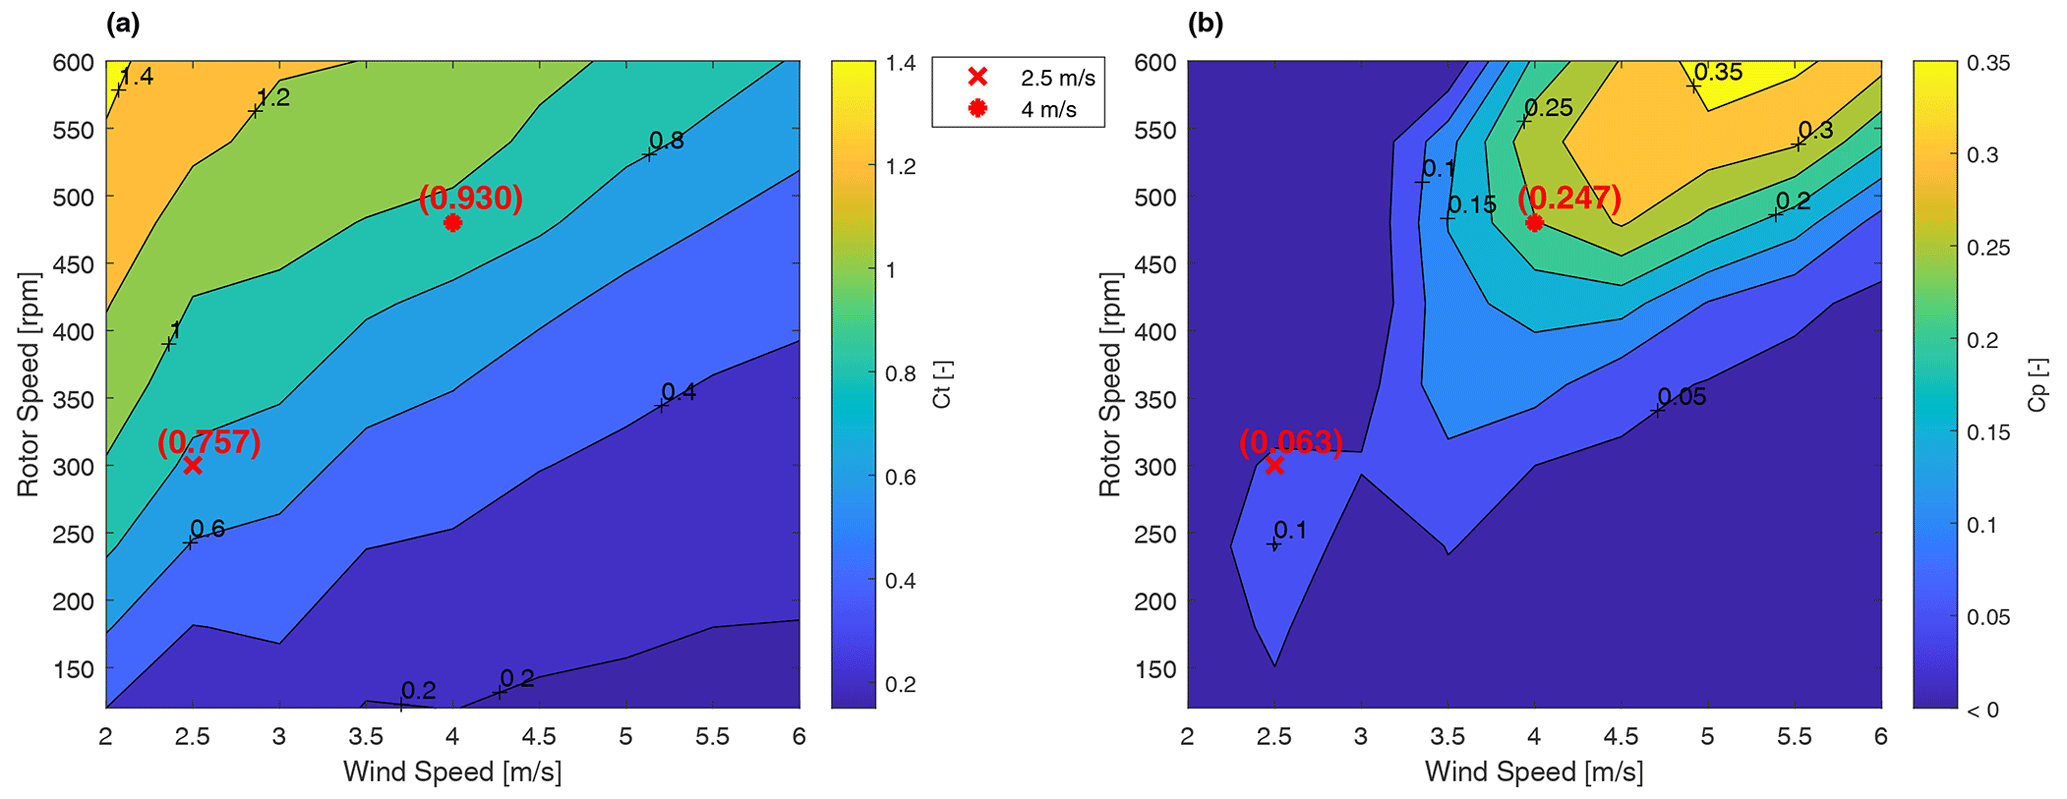
Figure 5Map of the thrust (CT, a) and power (CP, b) coefficients for the turbine at different operating points. Values utilized for the prescribed motion cases are highlighted by red symbols.
An uncertainty analysis of the steady-state thrust force at the two main operating points considered for the motion cases (R and BR) was performed. The standard deviation was calculated by making use of the average thrust evaluated over the stationary time windows present in each motion test data, resulting in an uncertainty of 9.8 % and 10.3 % for R and BR operating points.
4.2 Thrust variation
When the turbine is set under motion, the force measurement needs to be corrected to subtract the inertial and gravitational forces in order to isolate the aerodynamic contribution due to the dynamic motions. This is achieved by subtracting the forces measured during no-wind tests from the force measured during wind tests. This work applies this correction to both time and frequency domains, the former for visualization and the latter for quantitative analyses. To evaluate the thrust variation in frequency, the procedure involves cutting the signals to remove transients and analyse only the relevant motion parts, performing a fast Fourier transform (FFT) on the signals and obtaining complex numbers representing the force measurements for the wind and no-wind tests at the motion frequency. The difference between the complex numbers represents the thrust variation at the motion frequency. However, the phases of the complex numbers need to be corrected for synchronization purposes. This involves subtracting the phase of a corresponding reference signal from the wind- and no-wind-force complex numbers, identified in the tower base acceleration measure. The tower base acceleration signal is preferred over the motion feedback signal because it is less processed and thus less subject to inconstant delays. It is also preferred over the nacelle acceleration measure because the latter could be influenced by the aerodynamic loading, leading to a possible phase shift of the acceleration signal in wind tests only, hence harming the synchronization.
The method to calculate the thrust force variation can be summarized as
where |ΔT| is the thrust variation amplitude, ϕΔT is the thrust variation phase, and are the force variation amplitude and phase measured in the x direction (i.e. the direction of thrust) in the wind condition, and are the force variation amplitude and phase measured in the x direction in the no-wind condition, and are the phases of the acceleration measured in the same direction in wind and no-wind conditions, and is the frequency of motion.
For surge and pitch single-DOF motion cases, the experimental thrust variation is compared with a quasi-steady estimation based on quasi-steady theory. This theory, described in Appendix B, calculates the thrust fluctuations resulting from the variation in relative wind speed experienced by the rotor during motion. The comparison with experimental results helps determine the presence or absence of unsteady phenomena. The nominal quasi-static thrust variation is generally calculated from the motion amplitude, as in Eq. (B4), but the actual maximum motion velocity may differ. To address this, the velocity in the quasi-static estimation is evaluated from the spectral amplitude of the nacelle velocity, obtained by integrating the acceleration signal in the x direction at the motion frequency, as in
where is the time history of the measured acceleration at the nacelle location in the x direction, t0 is the initial instant and is the frequency of motion. Therefore, instead of considering a single value of quasi-steady thrust variation for each set of ΔV*, the value is evaluated individually for each test case to take into account the actual wind speed variation that the rotor faces. The estimated quasi-static thrust variation may deviate from the nominal value for two reasons: (i) the amplification effect due to the flexibility of the tower, which would cause the velocity at the hub to increase compared to the nominal value, and (ii) the inability of the hexapod to track the prescribed motion for particularly high-frequency cases, which would cause the velocity at the hub to decrease. The method adopted here allows us to fully take into account the aforementioned amplification effects. The latter could have induced increases in the measured thrust variations at high frequencies that would have been erroneously attributed to unsteady phenomena. In reality, however, it is noticed that the amplification contribution results in only a small part of the total thrust increase, as can be seen for example in Fig. 7. It can be inferred that the remaining part is due to the increase in frequency only and thus the rise in unsteady phenomena. In addition to the aforementioned post-processing, for estimating the nacelle velocity in pitch cases, the gravitational contribution in the measured acceleration has to be subtracted.
The aerodynamic wind-to-thrust sensitivity (KUT), used to calculate the quasi-steady thrust variation according to Eq. (B3), is evaluated by linear regression on the outputs of multiple steady-state numerical simulations performed in FAST for wind speeds around the operating points and is KUT=2.85 Ns m−1 for U=4 m s−1 and KUT=1.58 Ns m−1 for U=2.5 m s−1. Here, numerical values are preferred over values obtained by specifically performed static tests (results shown in Fig. 6) because of the uncertainty in the wind speed measurement for small velocity variations. The uncertainties in wind speed measurements do not affect the results as the wind speed variation during tests is determined by the motion system while the wind tunnel is set to a steady value. Uncertainties in wind speed measurements only impact static tests, also considering that the aerodynamic sensitivity remains approximately constant in the neighbourhood of the nominal wind speed that is greater than the uncertainty.
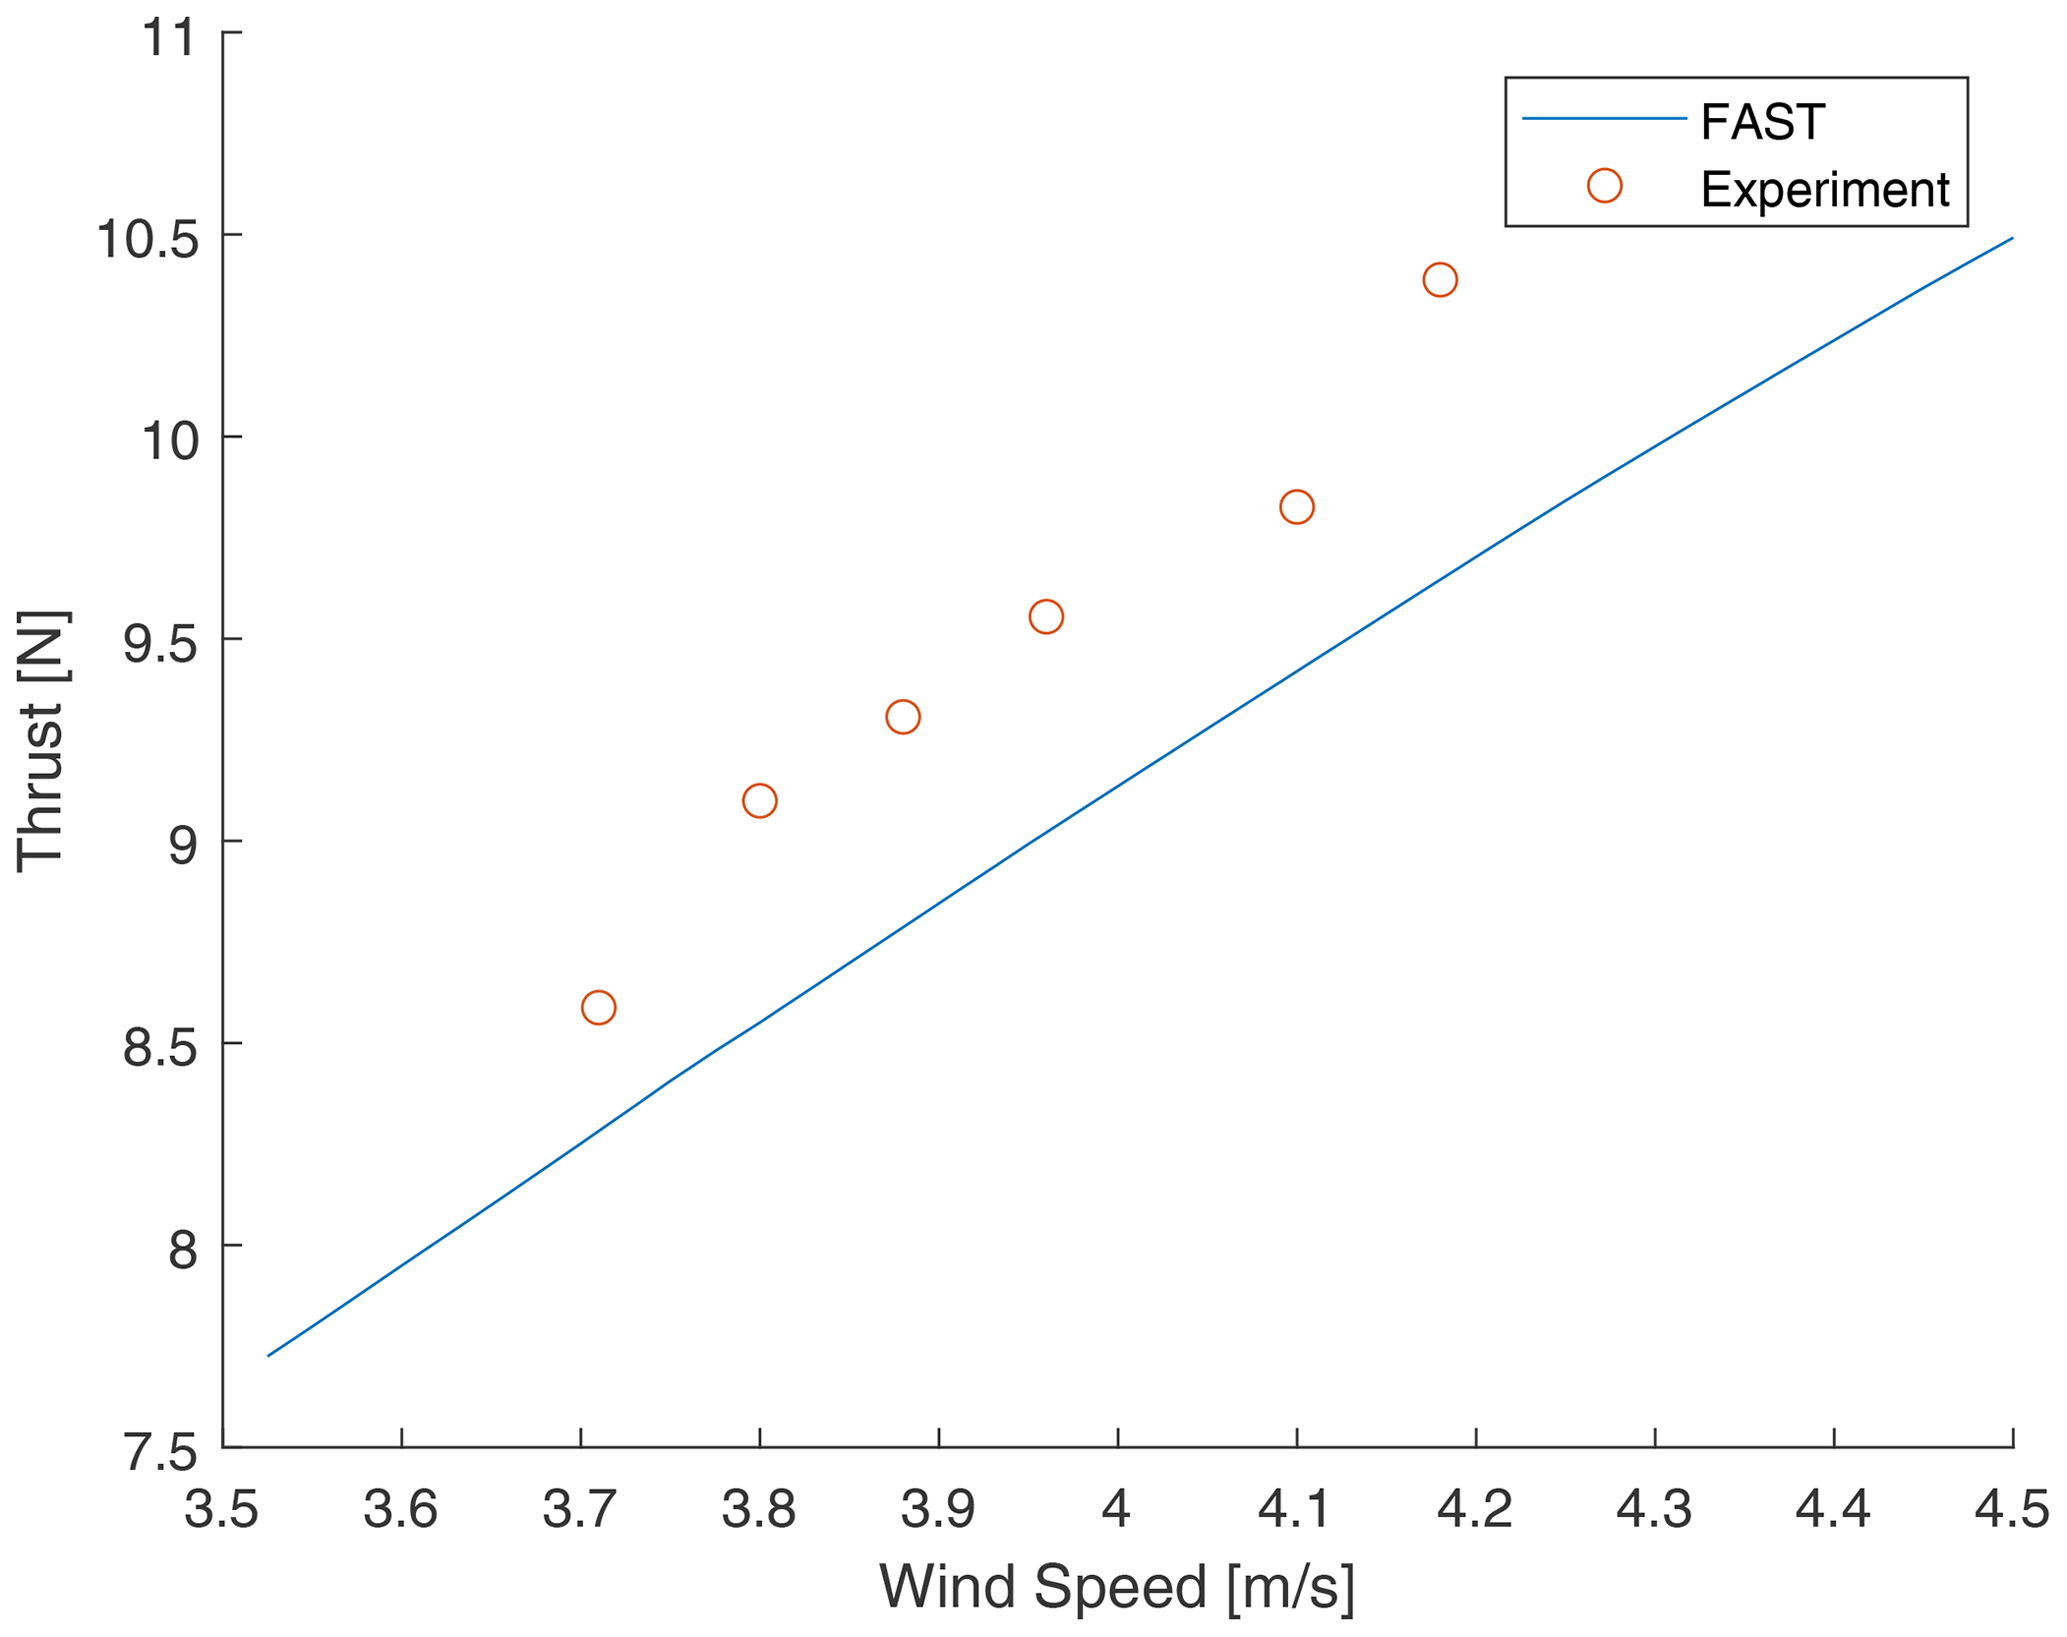
Figure 6Steady-state measurements of the thrust force as a function of the wind speed for a constant rotational speed of 480 rpm.
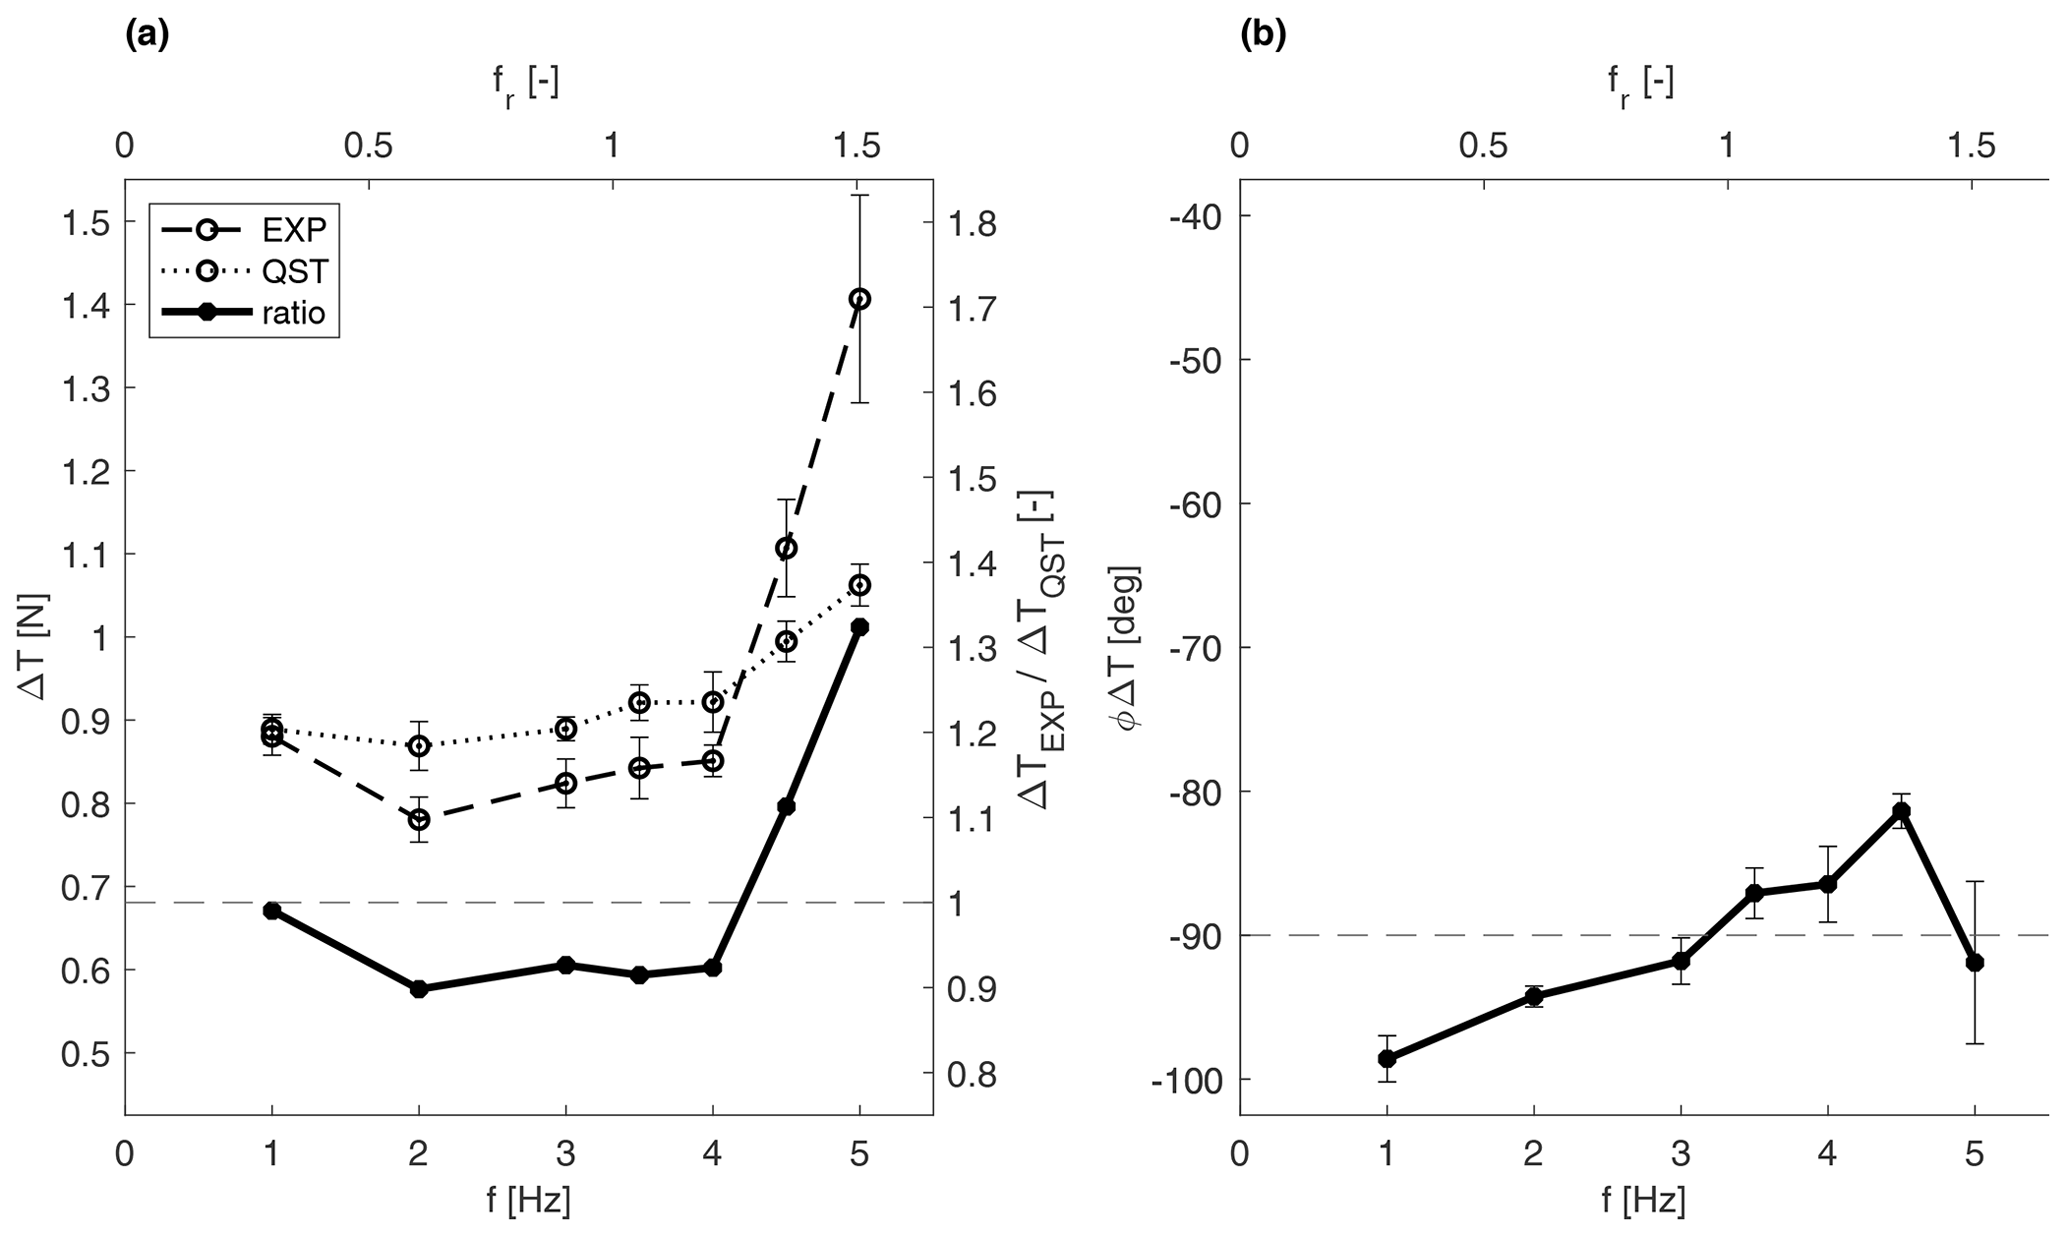
Figure 7Thrust variation as a function of the surge motion frequency for the rated wind speed of U=4 m s−1 and : (a) the experimental amplitude (dashed), quasi-static amplitude (dotted), ratio between the experimental and quasi-static (solid) amplitude, and (b) experimental phase (solid). The horizontal dashed line corresponds to the quasi-static values for both the ratio and the phase. The uncertainty is displayed in the form of error bars.
4.2.1 Surge motion
The thrust variation ΔT is evidently dependent on frequency. According to the results shown in Fig. 7, the experimental thrust variation amplitude is approximately constant and equal to the quasi-static thrust variation for low frequencies. By contrast, it increases significantly, up to an increment of about 50 %, for the highest frequencies tested. The threshold frequency above which the thrust variation amplitude starts deviating from the quasi-static estimation is identified to be around 4 Hz for rated wind cases (U=4 m s−1) and 3 Hz for below-rated wind cases (U=2.5 m s−1), both corresponding to a reduced frequency of around 1.2. To our knowledge, this is larger than the highest reduced frequency tested in the literature. For example, Mancini et al. (2020) considered reduced frequencies up to 1.2 and showed increasing scatter of the results at these high frequencies. The authors mentioned that this was likely due to the inception of unsteady effects. This is confirmed in this work for increasing values of fr. The thrust variation phase, shown in Fig. 7b, does not show a clear trend. This effect does not appear to be dependent on the motion velocity parameter, ΔV, as can be seen in Fig. 8. Some discrepancies that can be seen for the lowest values of ΔV are likely to be caused by the small forces to be measured in these cases that increase the uncertainty of the measure. The effect is equally noticeable independently of the wind speed, as Fig. 9 shows. However, similarly to the low ΔV point, for the below-rated wind speed, the forces to be measured are small. Moreover, the airfoil performance is affected by the low-Reynolds condition to a greater degree in this operating condition. The airfoil is reported to decrease its performance for Reynolds numbers lower than 60 000, and while in the rated operating point the Reynolds values experienced by the profiles are closer to that threshold with a maximum of around 50 000, and in below-rated conditions it drops to 30 000, possibly affecting the results.
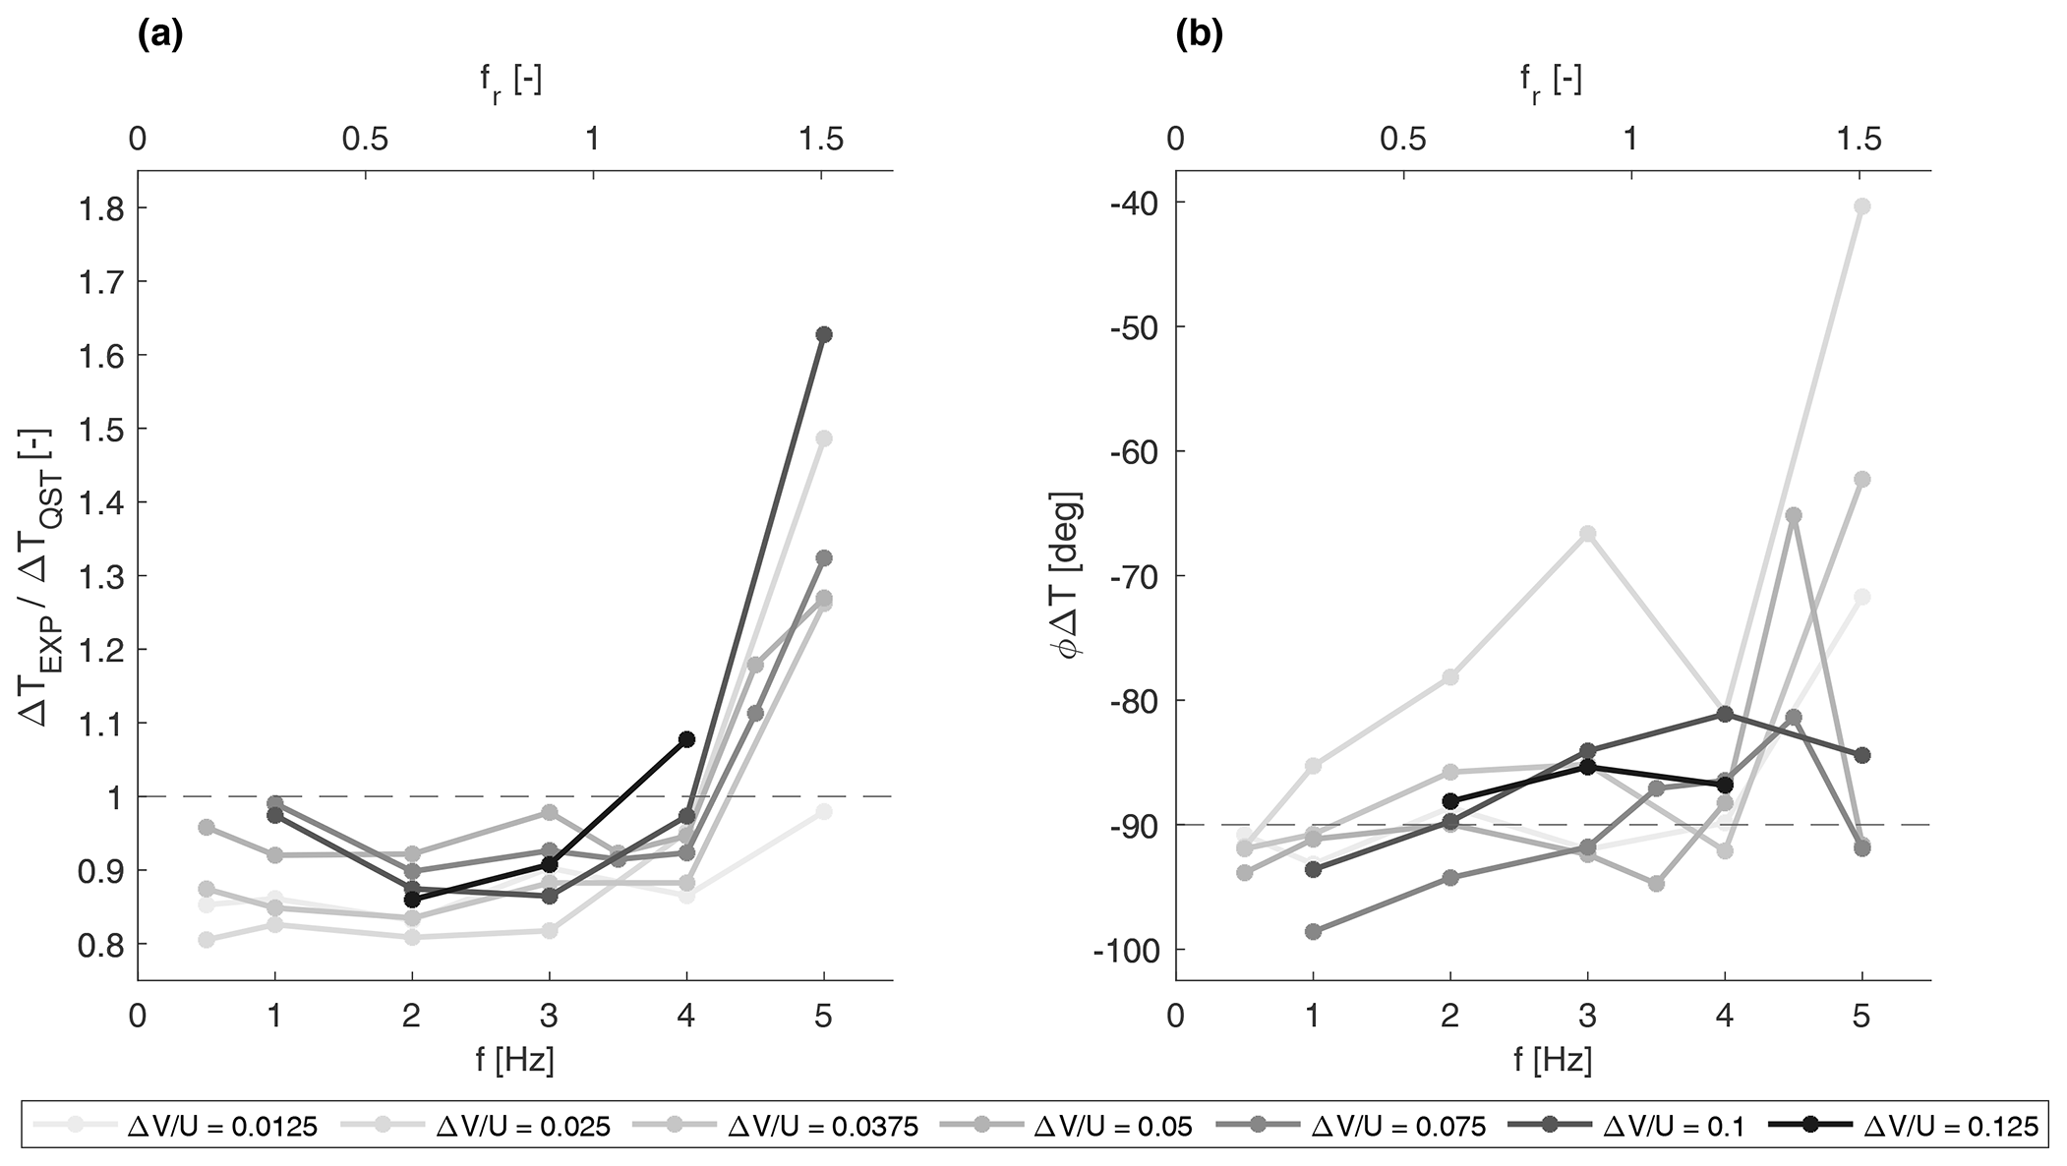
Figure 8Thrust variation as a function of the surge motion frequency for different ΔV* parameters at the rated wind speed of U=4 m s−1: (a) the ratio between the experimental and quasi-static amplitudes and (b) the experimental phase. The colour of the line represents different values of ΔV* (with increasing values from light grey to black), and the horizontal dashed line corresponds to the quasi-static values.
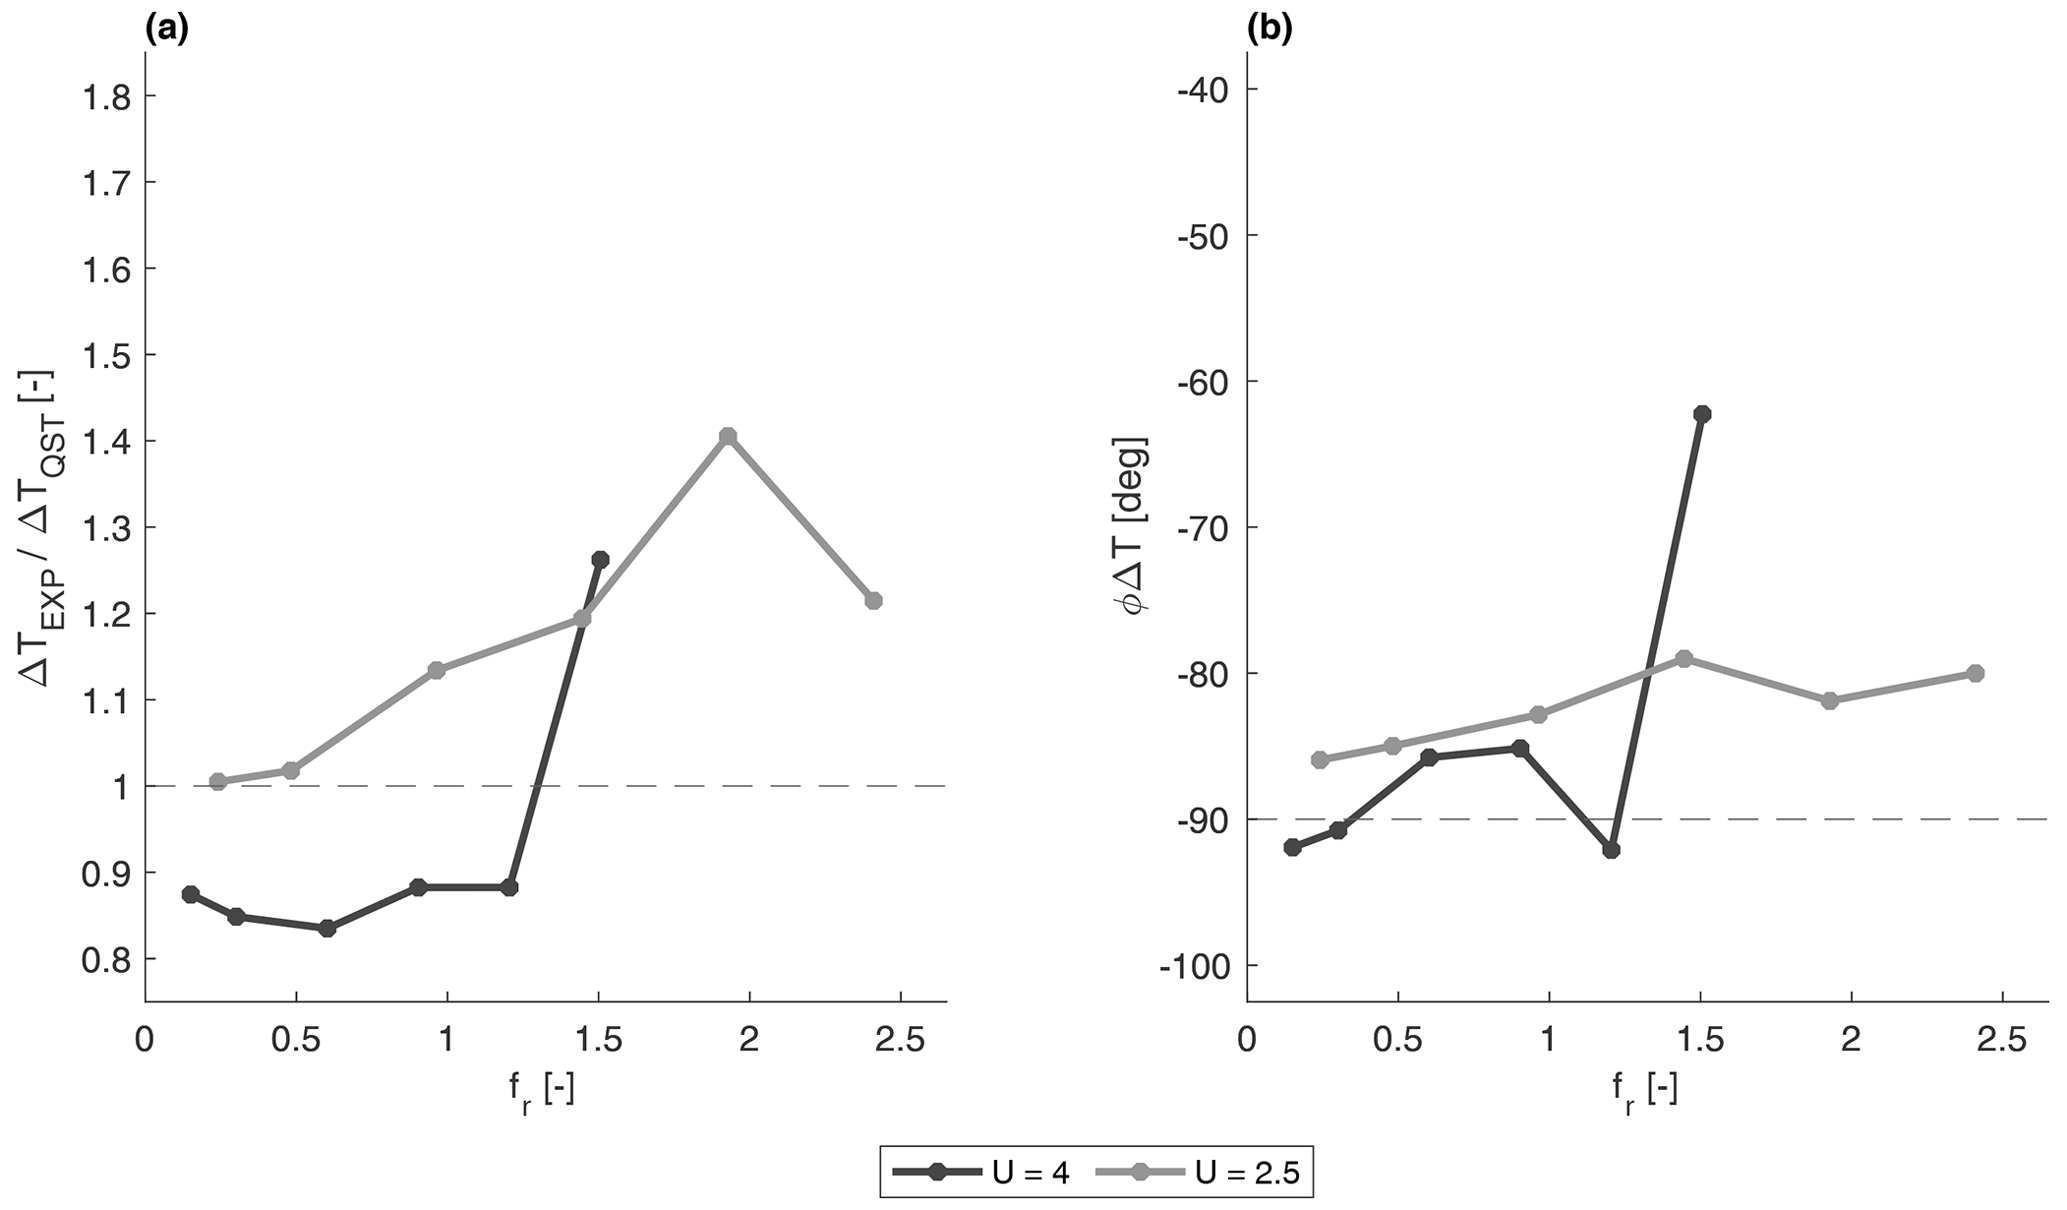
Figure 9Thrust variation as a function of the surge motion reduced frequency and wind speed, for : (a) the ratio between the experimental and quasi-static amplitudes and (b) the experimental phase. The colour of the line differentiates between a wind speed of U=4 n s−1 (black) and U=2.5 m s−1 (grey), and the horizontal dashed line corresponds to the quasi-static values.
Despite the fact that the focus of this analysis is on the rotor integral aerodynamics, we mention the unsteady regime that might occur at airfoil scale for completeness. It is estimated that for the highest motion frequency and rated wind case, around 45 % of the inboard portion of the blade would experience that regime.
A statistical analysis has been performed to estimate the uncertainty in the thrust variation results. The estimated uncertainty in Sect. 4.1 referred more to the reproduction of the operating point itself, as the dispersion was not caused by uncertainty in the thrust measure itself but rather by the variability in the operating condition. Thus, this dispersion value was not indicated as describing the uncertainty of the thrust variation. An example case was chosen, namely the surge motion case with U=4 m s−1 and , for which the results are shown in Fig. 7. The 40 utilizable motion cycles out of the 50 recorded per test, discarding the first 10 to avoid any transient effects, have been split into groups of 8 cycles, identified as a trade-off to have a greater number of groups and enough cycles per group to perform the frequency analysis proposed in Sect. 4.2. The uncertainty is estimated as the standard deviation of the thrust variation of each group and is evaluated for each motion frequency. The uncertainty is likewise estimated for the quasi-steady prediction as well, as this is based on measurements too. The resulting thrust variation uncertainty is in the range of 2.5 % to 8.8 % for increasing frequency, while the quasi-steady prediction is more constant and around 2.5 %.
The time history of two surge motion cases, a low-frequency case and a high-frequency one, can be visualized in Fig. 10 in a one-period window showing averaged records of motion and force measures over 30 motion cycles. The force in the x direction in the no-wind condition (dashed blue line) is always in phase with the motion. This is fully expected, as the force measured in this condition is only the inertial component, which has a 180∘ phase shift with respect to the acceleration. The force in the wind condition (solid blue line) results shifted in phase with respect to the motion, in addition to being greater in amplitude. This is because the inertial and aerodynamic contributions are summed here. While the first is in phase with the motion, the second is, ideally and disregarding unsteadiness, at −90∘, as it depends on velocity. The sum of the two effects, i.e. the actual measurement in wind cases, therefore results in a phase shift between 0 and −90∘. The force difference (red line), depicting only the aerodynamic contribution, is indeed at around −90∘ with respect to the motion, as foreseen. This applies to both tests shown. Quantitative results are obtained by frequency domain analysis, while this time domain analysis is useful for visualization.
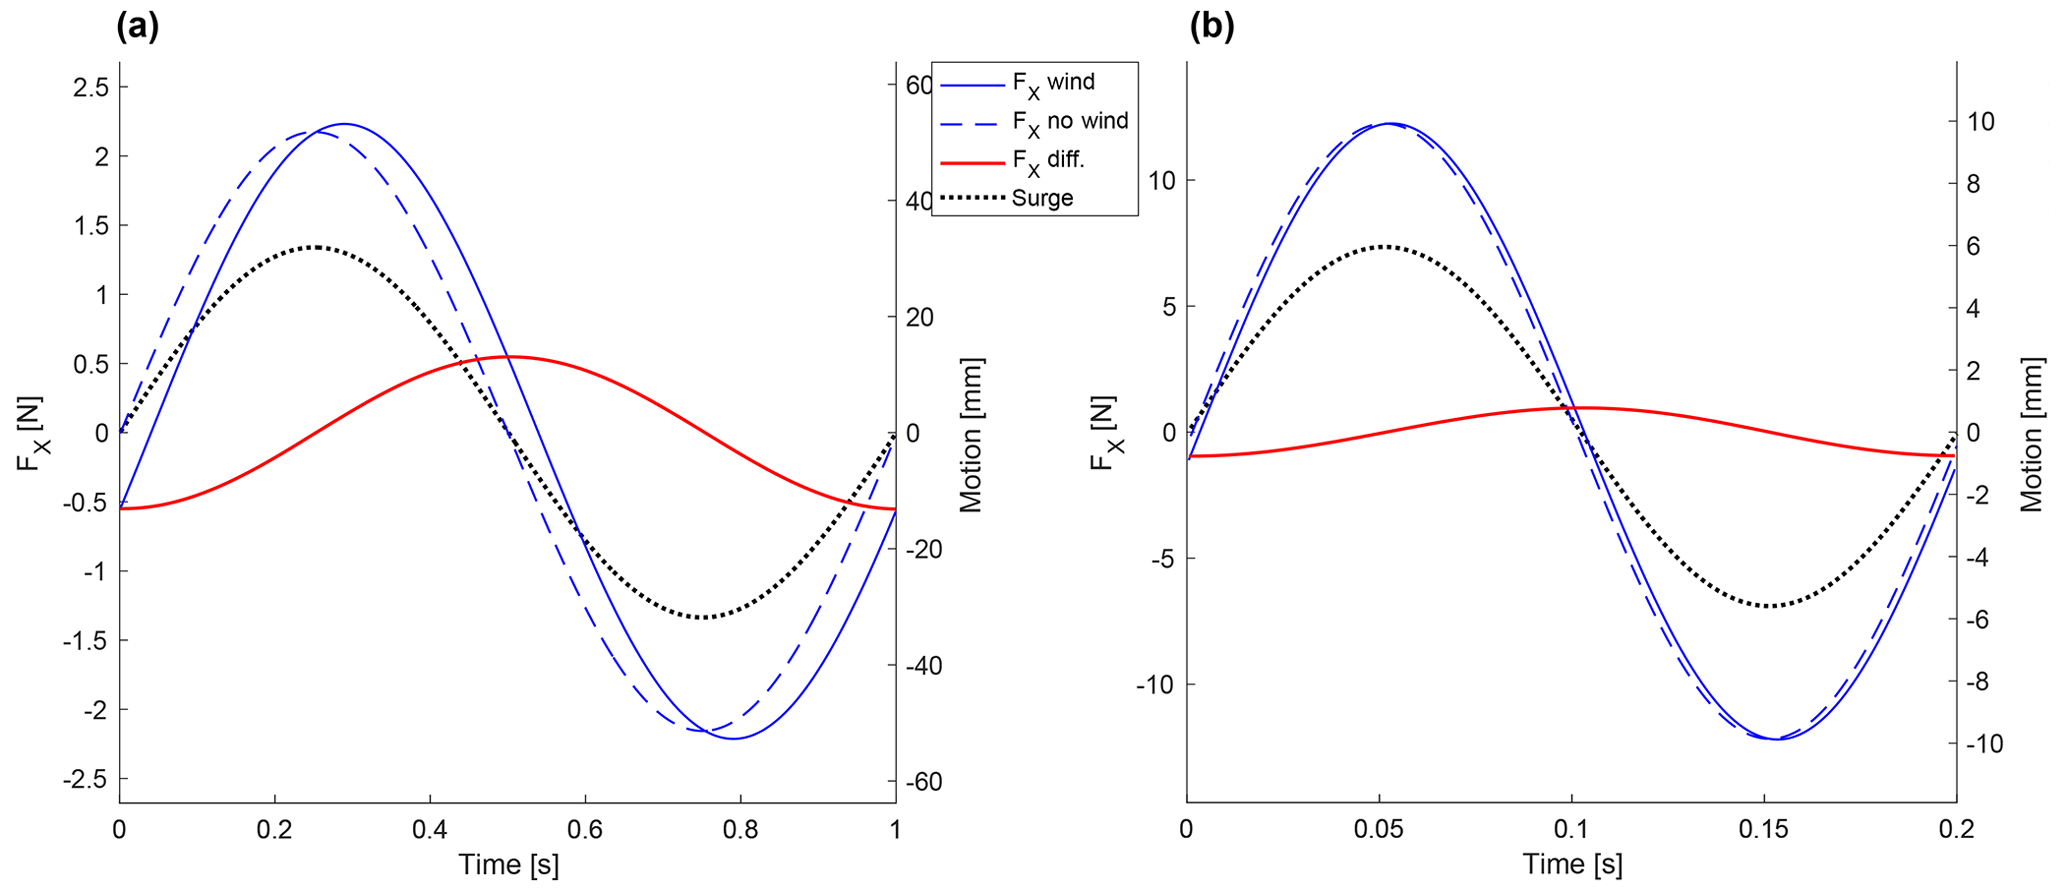
Figure 10A total of 30 cycles' averaged records of surge cases: (a) motion frequency of 1 Hz and (b) motion frequency of 5 Hz, parameter . The blue lines are the force measured in the x direction for the wind case (solid) and no-wind case (dashed); the red line is the difference between them, thus representing the aerodynamic contribution (i.e. the thrust force); and the dotted black line is the surge position. The records are low-pass filtered at 1.5 and 7.5 Hz, corresponding to 1.5 times the motion frequency.
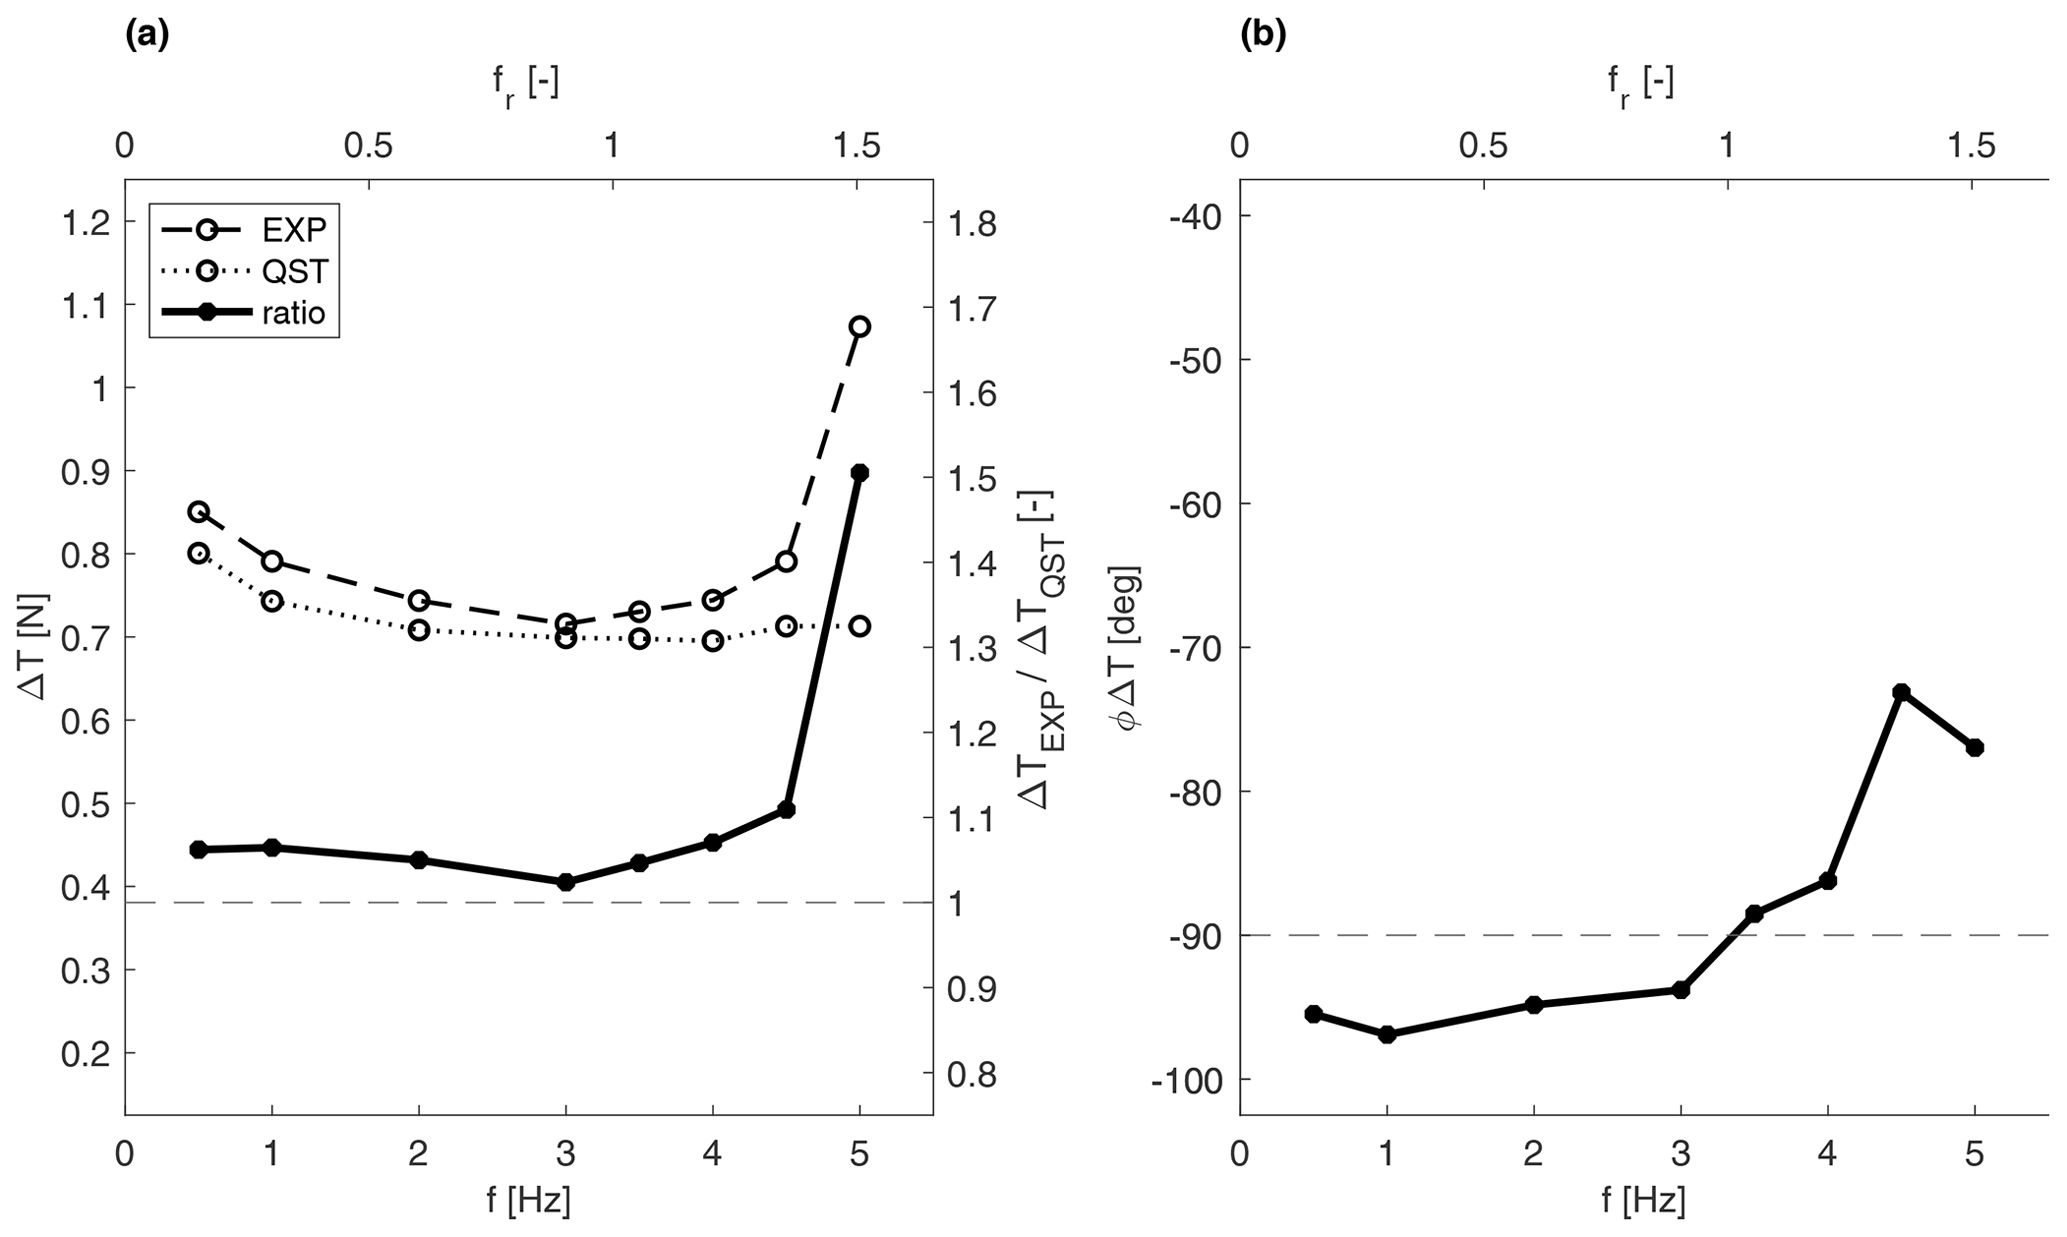
Figure 11Thrust variation as a function of the pitch motion frequency for the rated wind speed of U=4 m s−1 and : (a) the experimental amplitude (dashed), quasi-static amplitude (dotted), ratio between the experimental and quasi-static (solid) amplitudes, and (b) experimental phase (solid). The horizontal dashed line corresponds to the quasi-static values for both the amplitude ratio and the phase.
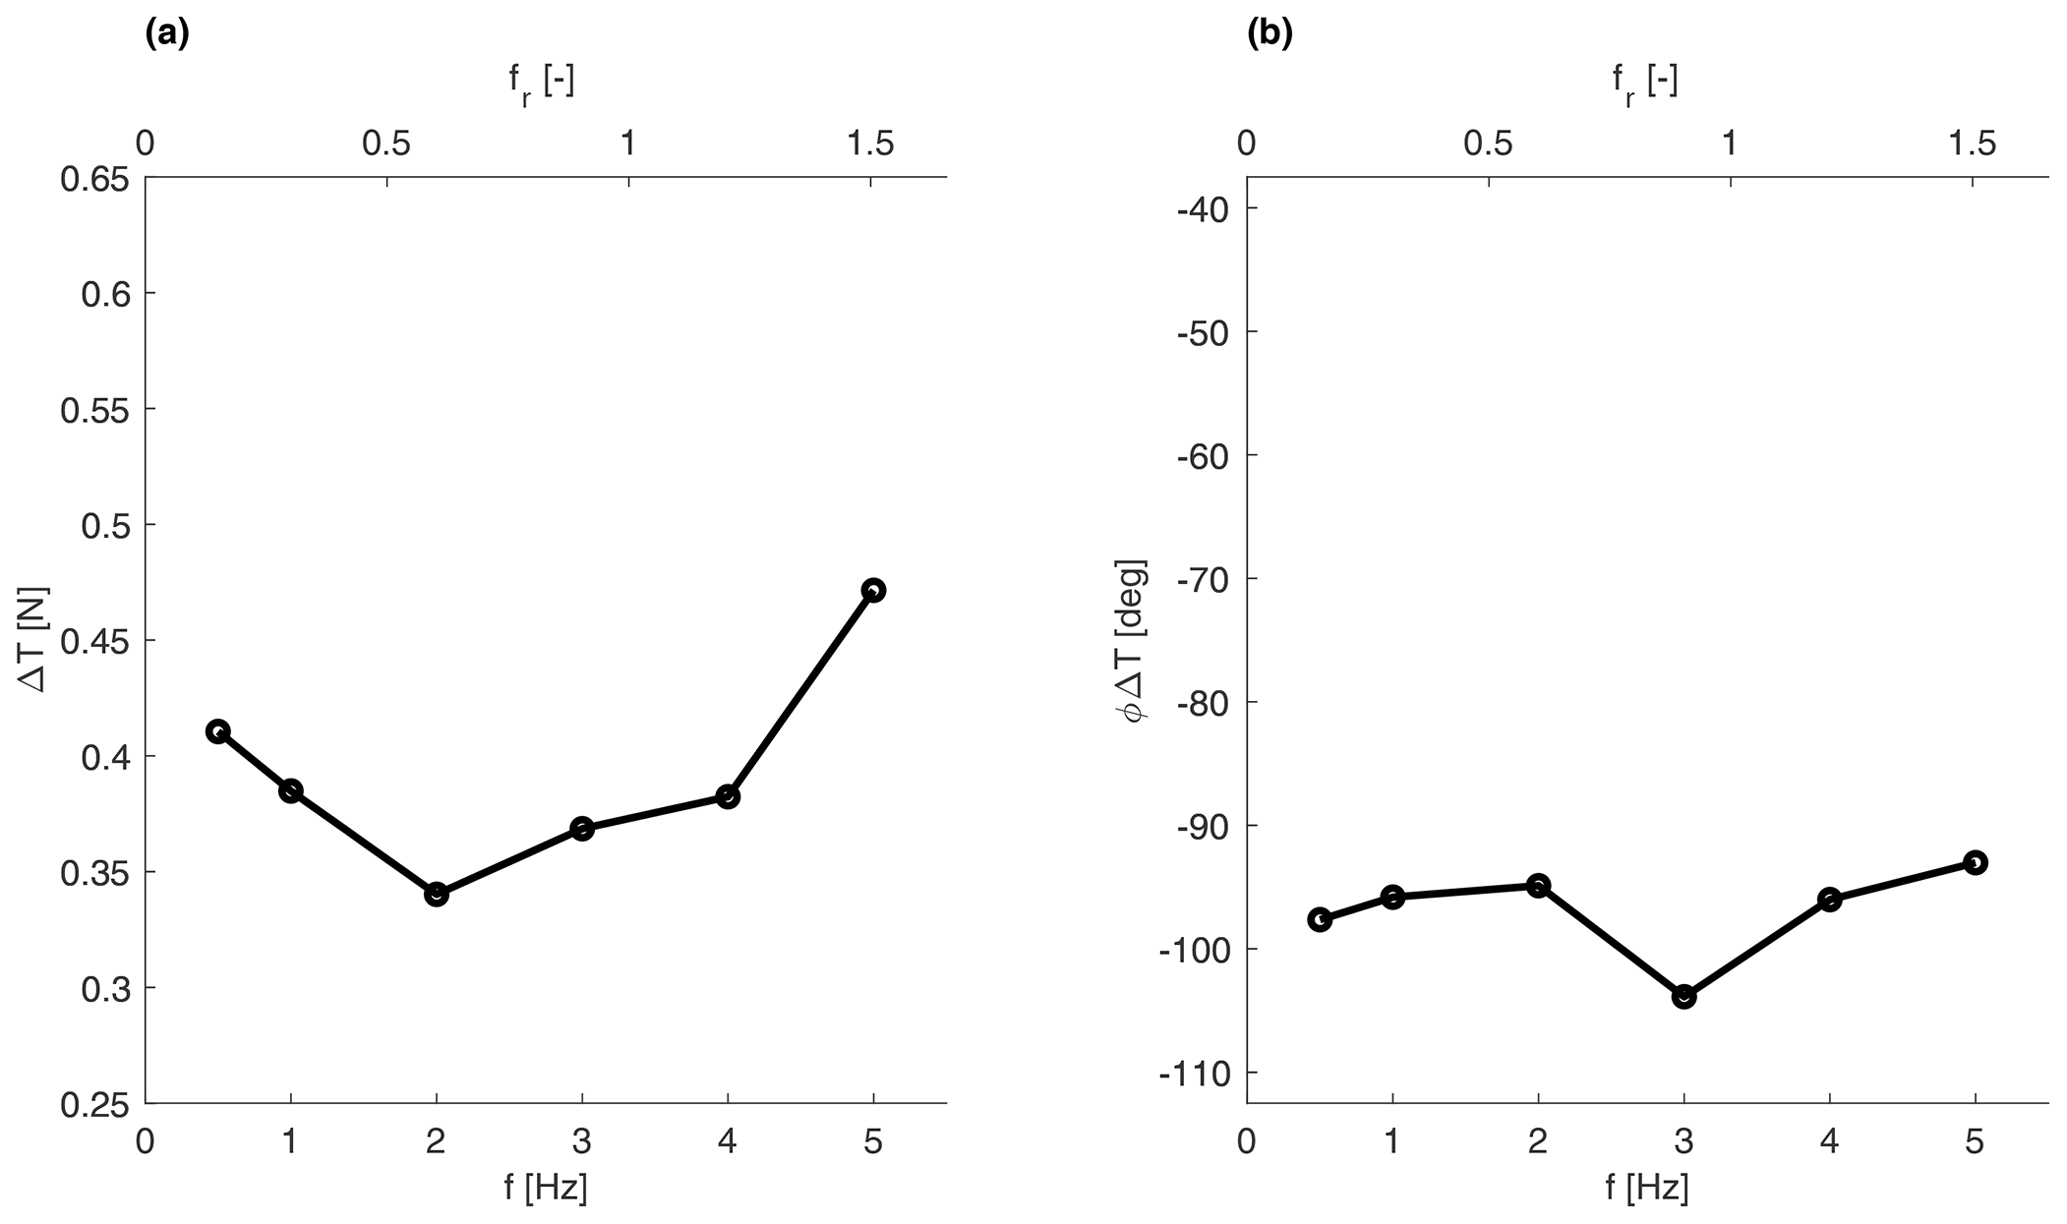
Figure 12Thrust variation as a function of the yaw motion frequency for the rated wind speed of U=4 m s−1 and the same value of motion velocity of 19∘ s−1: (a) experimental amplitude and (b) phase.
4.2.2 Pitch motion
The pitch motion tests reveal similar findings, as shown in Fig. 11 for an illustrative case corresponding to . As for the surge case, we observe that the thrust variation amplitude is essentially independent of the frequency of motion for frequencies up to 4 Hz. Below that value, the thrust variation replicates the quasi-steady value. By contrast, it shows a significant increase for higher frequencies, about the same magnitude as surge motion. Also, here the phase does not show a clear trend. The similarity between the surge and pitch results is due to the small rotation involved in the pitch cases, and this contributes to strengthening the repeatability of the present findings. Nevertheless, considering pitch cases in addition to surge motions is relevant as the pitch motion can affect the wake in a different way than the surge motion, e.g. wake meandering, and this may possibly have an effect on loads.
4.2.3 Yaw motion
Yawing cases are entirely different from the surging and pitching ones as the main drive is not the variation in hub relative velocity, which is null. The variation in thrust is here given by the dynamic misalignment between the rotor and the inflow. For these cases, due to their very nature, the results in terms of thrust variation are shown without quasi-static comparison. Results in Fig. 12 still exhibit a similar outcome to the cases with surge and pitch motions. However, the effect is less clear than in previous cases. Here the thrust variation amplitude first decreases in the frequency range of 0.5–2 Hz, then increases slightly for frequencies up to 4 Hz and then rises more steeply. The phase is fairly constant with frequency and lies between −105 and −95∘.
In this study, a new experimental setup is developed to analyse the aerodynamics of a scaled wind turbine under prescribed floating motions. The setup uses a scaled version of the DTU 10 MW reference wind turbine that has been extensively studied and is suitable for floating wind applications. Since wind turbine control is outside the scope of the present work, the scaled model used here has a fixed blade pitch, which simplifies the model and avoids any additional uncertainties in the experimental results. The motions are prescribed using a commercially available hexapod that can prescribe motions in 6 degrees of freedom. The present work distinguishes itself from other studies in the literature in multiple ways. Firstly, both single and realistic 6-DOF simulated motions are investigated here, whilst to our knowledge, only single and coupled 2 DOFs have been investigated in the literature so far. Secondly, the range of imposed motion amplitudes and frequencies surpasses what is currently available in the literature.
The results obtained from the single DOF motion experiments clearly indicate the presence of unsteady effects. It was observed that the variation in thrust force increases as the reduced frequencies exceed approximately 1.2. This signifies that the thrust force experiences greater fluctuations under higher reduced frequencies. However, when the reduced frequency falls below 1.2, the thrust variation remains constant, implying that the quasi-static theory can be applied in such cases. No discernible effect of wind speed and motion velocity on thrust amplification was evident from the experimental data. It was also assessed, in preparation for future studies, that the present experimental setup is capable of reproducing the full-scale behaviour of a floating wind turbine under more realistic met-ocean conditions.
These findings contribute to a deeper understanding of the aerodynamic behaviour of floating offshore wind turbines, and the observed unsteady effects underscore the importance of considering them in the design and analysis of floating wind turbines. By expanding the range of investigated parameters and pushing the boundaries of previous studies, this experimental campaign provides valuable insights into the loading on floating wind turbine rotors and can be used to further validate numerical models.
The observations outlined in this paper provide a compelling reason to pursue additional research into the impact of floater motions on wind turbine performance. To date, experiments have primarily concentrated on investigating 1 or 2 degrees of freedom. Nevertheless, operational floating offshore wind turbines experience combined motion across all 6 degrees of freedom. Hence, additional research in this field could focus on exploring the impact that the coupling of these degrees of freedom has on the aerodynamic response of the turbine.
The surge and pitch harmonic prescribed motion cases are compared to linear quasi-steady models. Usually, these low-fidelity numerical models are utilized for the design of turbine controllers and performing load analysis at an inexpensive computational cost; examples of applications can be seen in Fontanella et al. (2020), Lemmer (2018) and Pegalajar-Jurado et al. (2018). If quasi-steady aerodynamics are assumed, the thrust force can be expressed by
where ρ is the air density, Arotor is the area of the rotor and U is the wind speed. The thrust coefficient is a function of the blade pitch angle, β, and the tip-speed ratio, λ, which is also a function of the rotor speed ω and the wind speed. When applying a first-order Taylor linearization for a given operation point, the thrust force can be approximated to the following equation:
where T0, U0, β0 and ω0 represent the steady-state values at the specific operation point. KUT, KβT and KωT denote the partial derivatives of the thrust with respect to wind speed, the pitch angle and the rotor speed, respectively. For this test campaign, the rotor speed is set as constant and the turbine has a fixed collective pitch angle. Therefore, Eq. (B2) is reduced to
Considering that the maximum apparent wind speed at the rotor depends on the harmonic motion that is imposed, the amplitude of the velocity variation, ΔV, and the amplitude of the thrust variation, ΔT, can be defined as
where fmotion and Amotion denote the motion frequency and amplitude, respectively. The nondimensional quantities, reduced frequency (fr), reduced amplitude (Ar) and normalized velocity variation (ΔV*), are defined as
where D is the rotor diameter.
The dataset is accessible upon request to the authors.
FT, FN and AV imagined the scope of the work and designed the experimental campaign. FT and FN carried out the tests. FN performed the analyses of the static cases, and FT performed the analyses of the dynamic cases. FN performed the literature review. FT prepared the paper with contributions from the co-authors. AV was responsible for the supervision of the tests, the interpretation of the results and the manuscript revisions.
The contact author has declared that none of the authors has any competing interests.
Publisher's note: Copernicus Publications remains neutral with regard to jurisdictional claims made in the text, published maps, institutional affiliations, or any other geographical representation in this paper. While Copernicus Publications makes every effort to include appropriate place names, the final responsibility lies with the authors.
The project has received funding from the European Union's Horizon 2020 research and innovation programme under grant agreement no. 860737 (STEP4WIND project, step4wind.eu). This research is also partly funded by the Dutch National Research Council (NWO) Talent Programme under the Vidi scheme (project no. 19675).
This research has been supported by the Horizon 2020 (grant no. 860737) research and innovation programme and the Nederlandse Organisatie voor Wetenschappelijk Onderzoek (grant no. 19675).
This paper was edited by Sandrine Aubrun and reviewed by two anonymous referees.
Bak, C., Zahle, F., Bitsche, R., Kim, T., Yde, A., Henriksen, L. C., Nata-rajan, A., and Hansen, M. H.: Department of Wind Energy I – Report Description of the DTU 10 MW Reference Wind Turbine, https://backend.orbit.dtu.dk/ws/portalfiles/portal/55645274/The_DTU_10MW_Reference_Turbine_Christian_Bak.pdf (last access: 12 February 2024), 2013. a
Bayati, I., Belloli, M., Bernini, L., Fiore, E., Giberti, H., and Zasso, A.: On the functional design of the DTU 10 MW wind turbine scale model of LIFES 50+ project, J. Phys.: Conf. Ser., 753, 052018, https://doi.org/10.1088/1742-6596/753/5/052018, 2016a. a
Bayati, I., Belloli, M., Bernini, L., Mikkelsen, R., and Zasso, A.: On the aero-elastic design of the DTU 10 MW wind turbine blade for the LIFES50+ wind tunnel scale model, J. Phys.: Conf. Ser., 753, 022028, https://doi.org/10.1088/1742-6596/753/2/022028, 2016b. a, b, c
Bayati, I., Belloli, M., Bernini, L., and Zasso, A.: Wind tunnel validation of AeroDyn within LIFES50+ project: imposed Surge and Pitch tests, J. Phys.: Conf. Ser., 753, 092001, https://doi.org/10.1088/1742-6596/753/9/092001, 2016c. a
Bayati, I., Belloli, M., Bernini, L., Boldrin, D., Boorsma, K., Caboni, M., Cormier, M., Mikkelsen, R., Lutz, T., and Zasso, A.: UNAFLOW project: UNsteady Aerodynamics of FLOating Wind turbines, J. Phys.: Conf. Ser., 1037, 072037, https://doi.org/10.1088/1742-6596/1037/7/072037, 2018a. a
Bayati, I., Facchinetti, A., Fontanella, A., Giberti, H., and Belloli, M.: A wind tunnel/HIL setup for integrated tests of Floating Offshore Wind Turbines, J. Phys.: Conf. Ser., 1037, 052025, https://doi.org/10.1088/1742-6596/1037/5/052025, 2018b. a
Bergua, R., Robertson, A., Jonkman, J., Branlard, E., Fontanella, A., Belloli, M., Schito, P., Zasso, A., Persico, G., Sanvito, A., Amet, E., Brun, C., Campaña Alonso, G., Martín-San-Román, R., Cai, R., Cai, J., Qian, Q., Maoshi, W., Beardsell, A., Pirrung, G., Ramos-García, N., Shi, W., Fu, J., Corniglion, R., Lovera, A., Galván, J., Nygaard, T. A., dos Santos, C. R., Gilbert, P., Joulin, P.-A., Blondel, F., Frickel, E., Chen, P., Hu, Z., Boisard, R., Yilmazlar, K., Croce, A., Harnois, V., Zhang, L., Li, Y., Aristondo, A., Mendikoa Alonso, I., Mancini, S., Boorsma, K., Savenije, F., Marten, D., Soto-Valle, R., Schulz, C. W., Netzband, S., Bianchini, A., Papi, F., Cioni, S., Trubat, P., Alarcon, D., Molins, C., Cormier, M., Brüker, K., Lutz, T., Xiao, Q., Deng, Z., Haudin, F., and Goveas, A.: OC6 project Phase III: validation of the aerodynamic loading on a wind turbine rotor undergoing large motion caused by a floating support structure, Wind Energ. Sci., 8, 465–485, https://doi.org/10.5194/wes-8-465-2023, 2023. a, b
Bredmose, H., Lemmer, F., Borg, M., Pegalajar-Jurado, A., Mikkelsen, R., Larsen, T. S., Fjelstrup, T., Yu, W., Lomholt, A., Boehm, L., and Armendariz, J. A.: The Triple Spar campaign: Model tests of a 10 MW floating wind turbine with waves, wind and pitch control, Energ. Proced., 137, 58–76, https://doi.org/10.1016/j.egypro.2017.10.334, 2017. a
Ferreira, C., Yu, W., Sala, A., and Viré, A.: Dynamic inflow model for a floating horizontal axis wind turbine in surge motion, J. Phys.: Conf. Ser., 7, 469–485, https://doi.org/10.5194/wes-7-469-2022, 2022. a
Fontanella, A., Al, M., van der Hoek, D., Liu, Y., van Wingerden, J., and Belloli, M.: A control-oriented wave-excited linear model for offshore floating wind turbines, J. Phys.: Conf. Ser., 1618, 022038, https://doi.org/10.1088/1742-6596/1618/2/022038, 2020. a
Fontanella, A., Bayati, I., Mikkelsen, R., Belloli, M., and Zasso, A.: UNAFLOW: a holistic wind tunnel experiment about the aerodynamic response of floating wind turbines under imposed surge motion, Wind Energ. Sci., 6, 1169–1190, https://doi.org/10.5194/wes-6-1169-2021, 2021. a
Fontanella, A., Facchinetti, A., Di Carlo, S., and Belloli, M.: Wind tunnel investigation of the aerodynamic response of two 15 MW floating wind turbines, Wind Energ. Sci., 7, 1711–1729, https://doi.org/10.5194/wes-7-1711-2022, 2022. a
Fontanella, A., Da Pra, G., and Belloli, M.: Integrated Design and Experimental Validation of a Fixed-Pitch Rotor for Wind Tunnel Testing, Energies, 16, 2205, https://doi.org/10.3390/en16052205, 2023. a
Goupee, A. J., Koo, B., Lambrakos, K., and Kimball, R.: Model Tests for Three Floating Wind Turbine Concepts, All Days, in: Offshore Technology Conference, 30 April–3 May 2012, Houston, Texas, USA OTC-23470-MS, https://doi.org/10.4043/23470-MS, 2012. a
Goupee, A. J., Koo, B. J., Kimball, R. W., Lambrakos, K. F., and Dagher, H. J.: Experimental Comparison of Three Floating Wind Turbine Concepts, Jo. Offshore Mech. Arct. Eng., 136, 020906, https://doi.org/10.1115/1.4025804, 2014. a
Goupee, A. J., Kimball, R. W., and Dagher, H. J.: Experimental observations of active blade pitch and generator control influence on floating wind turbine response, Renew. Energy, 104, 9–19, https://doi.org/10.1016/j.renene.2016.11.062, 2017. a
Gueydon, S., Bayati, I., and de Ridder, E.: Discussion of solutions for basin model tests of FOWTs in combined waves and wind, Ocean Eng., 209, 107288, https://doi.org/10.1016/j.oceaneng.2020.107288, 2020. a
Jonkman, B. and Jonkman, J.: FAST v8.16.00a-bjj, https://www.nrel.gov/wind/nwtc/fastv8.html#:~:text=FAST v8.,transitioning from FAST to OpenFAST (last access: 12 February 2024), 2016. a
Kim, T., Madsen, F., Bredmose, H., and Pegalajar-Jurado, A.: Numerical analysis and comparison study of the 1:60 scaled DTU 10 MW TLP floating wind turbine, Renew. Energy, 202, 210–221, https://doi.org/10.1016/j.renene.2022.11.077, 2023. a
Lemmer, F.: Low-Order Modeling, Controller Design and Optimization of Floating Offshore Wind Turbines, PhD thesis, University of Stuttgart, Stuttgart, https://doi.org/10.18419/opus-10526, 2018. a
LIFES50+: http://lifes50plus.eu (last access: 12 February 2024), 2015. a, b
Mancini, S., Boorsma, K., Caboni, M., Cormier, M., Lutz, T., Schito, P., and Zasso, A.: Characterization of the unsteady aerodynamic response of a floating offshore wind turbine to surge motion, Wind Energ. Sci., 5, 1713–1730, https://doi.org/10.5194/wes-5-1713-2020, 2020. a, b
Meng, F., Lio, W. H., Pegalajar-Jurado, A., Pierella, F., Hofschulte, E. N., Santaya, A. G., and Bredmose, H.: Experimental study of floating wind turbine control on a TetraSub floater with tower velocity feedback gain, Renew. Energy, 205, 509–524, https://doi.org/10.1016/j.renene.2023.01.073, 2023. a
Muggiasca, S., Taruffi, F., Fontanella, A., Carlo, S. D., and Belloli, M.: Aerodynamic and structural strategies for the rotor design of a wind turbine scaled model, Energies, 14, 2119, https://doi.org/10.3390/en14082119, 2021. a
Pegalajar-Jurado, A., Borg, M., and Bredmose, H.: An efficient frequency-domain model for quick load analysis of floating offshore wind turbines, Wind Energ. Sci., 3, 693–712, https://doi.org/10.5194/wes-3-693-2018, 2018. a
Robertson, A. N., Jonkman, J. M., Goupee, A. J., Coulling, A. J., Prowell, I., Browning, J., Masciola, M. D., and Molta, P.: Summary of conclusions and recommendations drawn from the DeepCwind scaled floating offshore wind system test campaign, in: International Conference on Offshore Mechanics and Arctic Engineering, vol. 55423, 8–13 June 2013, American Society of Mechanical Engineers, V008T09A053, https://doi.org/10.1115/OMAE2013-10817, 2013. a
Schliffke, S., Aubrun, S., and Conan, B.: Wind Tunnel Study of a “Floating” Wind Turbine's Wake in an Atmospheric Boundary Layer with Imposed Characteristic Surge Motion, J. Phys.: Conf. Ser., 1618, 062015, https://doi.org/10.1088/1742-6596/1618/6/062015, 2020. a
van Kuik, G. A. M., Peinke, J., Nijssen, R., Lekou, D., Mann, J., Sørensen, J. N., Ferreira, C., van Wingerden, J. W., Schlipf, D., Gebraad, P., Polinder, H., Abrahamsen, A., van Bussel, G. J. W., Sørensen, J. D., Tavner, P., Bottasso, C. L., Muskulus, M., Matha, D., Lindeboom, H. J., Degraer, S., Kramer, O., Lehnhoff, S., Sonnenschein, M., Sørensen, P. E., Künneke, R. W., Morthorst, P. E., and Skytte, K.: Long-term research challenges in wind energy – a research agenda by the European Academy of Wind Energy, Wind Energ. Sci., 1, 1–39, https://doi.org/10.5194/wes-1-1-2016, 2016. a
- Abstract
- Introduction
- Experimental setup
- Test matrix
- Results
- Conclusions
- Appendix A: Single degree of freedom prescribed motion test matrix
- Appendix B: Quasi-steady theory
- Data availability
- Author contributions
- Competing interests
- Disclaimer
- Acknowledgements
- Financial support
- Review statement
- References