the Creative Commons Attribution 4.0 License.
the Creative Commons Attribution 4.0 License.
Characterization of dynamic stall of a wind turbine airfoil with a high Reynolds number
Hye Rim Kim
Jasson A. Printezis
Jan Dominik Ahrens
Joerg R. Seume
Lars Wein
This study shows an extensive analysis of dynamic stall on wind turbine airfoils, preparing for the development of a reduced-order model applicable to thick airfoils () in the future. Utilizing unsteady Reynolds-averaged Navier–Stokes (URANS) simulations of a pitching FFA-W3-211 airfoil with a Reynolds number of 15 × 106, our analysis identifies the distinct phases in the course of the evolution of dynamic stall. While the dynamic stall is conventionally categorized into the primary-instability transitioning to the vortex formation stage, we suggest two sub-categories for the first phase and an intermediate stage featuring a plateau in lift prior to entering the full stall region. This delays the inception of deep stall, approximately 3° for a simulation case. This is not predictable with existing dynamic-stall models, which are optimized for applications with a low Reynolds number. These features are attributed to the enhanced flow attachment near the leading edge, restricting the stall region downstream of the position of maximum thickness. The analysis of the frequency spectra of unsteady pressure confirms the distinct characteristics of the leading-edge vortex street and its interaction with large-scale mid-chord vortices in forming the dynamic-stall vortices (DSVs). Examination of the leading-edge suction parameter (LESP) proposed by Ramesh et al. (2014) for thin airfoils with low Reynolds numbers reveals that the LESP is a valid criterion in predicting the onset of the stall for thick airfoils with high Reynolds numbers. Based on the localized separation behavior during a dynamic-stall cycle, we suggest a mid-chord suction parameter (MCSP) and trailing-edge suction parameter (TESP) as supplementary criteria for the identification of each stage. The MCSP exhibits a breakdown in magnitude at the onset of the dynamic-stall formation stage and full stall, while the TESP supports indicating the emergence of a full stall by detecting the trailing-edge vortex.
- Article
(6327 KB) - Full-text XML
- BibTeX
- EndNote
The power generation of wind turbines (WTs) increases with the square of their rotor diameter, driving the trend towards larger WTs. The next generation of offshore megastructures will reach rated capacities of approx. 20 MW and diameters of 350 m. The elongated and flexible rotor blades of these megastructures are more prone to deformations, which along with wind speed fluctuations, turbulence, and altitude-dependent wind distribution, locally alter the blade's angle of attack (AoA). If the AoA exceeds the static-stall angle, it can trigger dynamic stall. Dynamic stall introduces transient loads that potentially excite blade vibrations, which contribute to mechanical fatigue and can lead to blade failure. It is, therefore, crucial to predict the onset of dynamic stall and account for the increased dynamic loads in the design of future WT blades. Dynamic stall has long been a subject of research in helicopter aerodynamics (Leishman, 2006; Corke and Thomas, 2015), and it has been investigated both experimentally (Merz et al., 2017; Schwermer et al., 2019) and numerically (Letzgus et al., 2019). Differences between dynamic stall for helicopter and WT blades are due to the larger diameters and chord lengths, resulting in higher Reynolds numbers (Re ≈ 15 M) and lower Mach numbers (Ma < 0.3). Additionally, WT airfoils have a higher thickness-to-chord ratio of > 0.21, and Bangga et al. (2017) have shown that the flow around WT blades can be assumed to be quasi-three-dimensional (Q3D) for regions outside of the inner 30 % of the span. Sharma and Visbal (2019) investigated the influence of airfoil thickness on dynamic stall and found that the influence of trailing-edge separation increases with thickness. They noted that for Q3D simulations, a span of 10 % of the chord is sufficient to study the onset of dynamic stall. The stall behavior of an airfoil gradually shifts from trailing-edge stall to leading-edge stall, and the stall angle and maximum lift increase for a growing value of Re > 2 × 10⁶ (Brunner et al., 2021). Kiefer et al. (2022) found that, for thick airfoils, the stall delay is characterized by a power law that is a function of the Reynolds number, kinematics of the pitching motion, and airfoil geometry parameters. Huang et al. (2020) identified the freestream's turbulence as a critical parameter that delays the onset of dynamic stall. The higher the freestream's turbulence, the later the dynamic-stall vortex (DSV) forms because the turbulence increases the transport of momentum in the wall-normal direction, thus stabilizing the boundary layer. The three stages of dynamic stall according to Mulleners et al. (2012) are the primary-instability stage, the vortex formation stage, and deep stall. When exceeding the static-stall angle αss, the boundary layer enters the primary-instability stage, which is characterized by the formation of small eddies on the suction side of the airfoil and an increase in lift above the maximum of the static curve. Further increasing the angle of attack above α∗ initiates the vortex formation stage. The unstable boundary layer rolls up, and the DSV is formed. This vortex subsequently detaches and the airfoil reaches deep stall at αds, which leads to a sudden drop in the lift. Decreasing the angle of attack prior to exceeding α∗ prevents the formation of a DSV and keeps the airfoil in the light-stall regime, which is associated with significantly lower dynamic blade loads and load oscillations (Mulleners et al., 2012; Deparday and Mulleners, 2019). The total stall delay is composed of the stall delay attributed to the primary-instability stage and the stall delay attributed to the vortex formation stage. The first is known to be a function of the airfoil geometry, whereas the later depends on the freestream conditions and kinematics of the airfoil (Mulleners et al., 2012; Kiefer et al., 2022).
The operating conditions of WTs are highly unsteady and vary over the span of the airfoils. Preventing the local angle of attack from exceeding the static-stall angle at every spanwise position and, thereby, avoiding dynamic stall are an impossible task with global pitch control. Changing the pitch angle locally would require expensive gear that measures the local angle of attack at multiple spanwise positions and is an approach to locally reduce that angle of attack. Gerontakos and Lee (2006) and Andersen et al. (2009) investigated trailing-edge flaps to suppress dynamic stall. However, installing such devices in a WT would drastically increase the cost and the maintenance intervals. A cost-effective way of mitigating the effects of dynamic stall is to develop airfoil geometries that are inherently less prone to dynamic stall. In order to design such airfoils, the angle where the DSV forms α∗ has to be predicted and maximized for new airfoil designs. This is possible because α∗ is a function of the airfoil geometry and flow conditions.
The most common engineering method for predicting dynamic stall with low computational effort is by integrating dynamic-stall models in blade element momentum (BEM) tools. Detailed presentations of the implementation of dynamic-stall models in the BEM theory are summarized in Branlard et al. (2022). The BEM theory combines the momentum and the blade element theory to ascertain the aerodynamic characteristics and loads of WT rotor blades. The momentum theory characterizes flow dynamics within a control volume, allowing for the calculation of thrust and torque. The blade element theory divides the blade into infinitesimal segments, enabling analysis of individual radial positions. By integrating these theories, BEM determines the forces and moments at different radial positions. Current dynamic-stall models in BEM theory require empirical results and rely on parameters that are derived from the static lift curve of already existing airfoils. The lift curves need to be obtained via simulations or experiments and are acquired for every combination of airfoil geometry and aerodynamic boundary condition investigated in the BEM simulation. Applying these empirical results to new airfoil geometries could lead to large uncertainties in the results (Tangler, 2002; Simms et al., 2001). To increase the accuracy of dynamic models, correction models have been developed over time. The most widely applied dynamic-stall model in the literature for wind turbines is the Beddoes–Leishman (BL) model (Leishman and Beddoes, 1989; Gupta and Leishman, 2006). The BL model consists of four modules that are used to calculate dynamic-stall effects, which are then linearly combined to obtain the resulting unsteady lift. The foundation of the BL model rests upon calculated static-polar information. The IAG model, a recently published dynamic-stall model, shows great improvement in the prediction accuracy compared to BL models (Bangga et al., 2020, 2023). It is proven to be applicable for thick airfoils for predicting characteristics of deep stall as well.
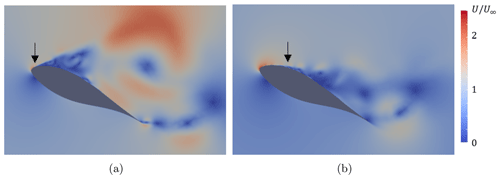
Figure 1Instantaneous contour of velocity during a pitching motion. (a) Re = 1.6 × 10⁶: typical leading-edge separation and large-scale dynamic-stall vortex formation. (b) Re = 16 × 106: small-scale vortices attached in the leading-edge region, delaying the onset of deep stall.
Another method for predicting dynamic stall is a non-empirical reduced-order model (ROM) for predicting the onset of the vortex formation stage. An example for such an approach for thin airfoils with a low Reynolds number is a discrete vortex method with a shedding criterion, which was established by Ramesh et al. (2014). They introduced the critical leading-edge suction parameter (LESPcrit) as a measure of the suction capacity at the leading edge, which is calculated by integrating the chordwise component of local force at the airfoil surface in the interval 0 < < 0.1. They found that for any thin airfoil and Reynolds number, there exists a critical LESPcrit. When exceeded, vortex shedding occurs at the leading edge, marked by a sudden breakdown of the suction of the airfoil and its lift. LESPcrit is a function of the airfoil geometry and Reynolds number, and using thin airfoil theory, we can analytically predict it with the first term of the Fourier series of the vortex sheet strength distribution along the camber line or by integrating unsteady pressure distribution around the airfoil (e.g., unsteady vortex lattice method, Konstadinopoulos et al., 1985). Using this relationship, Deparday and Mulleners (2019) predicted the onset of the vortex formation stage for thin airfoils based on LESPcrit and improved the method by introducing an effective angle of attack that depends on the instantaneous shear layer height at the suction side of the airfoil. Mulleners et al. (2012), Gupta and Ansell (2019), and Sharma and Visbal (2019) state that for thick airfoils the DSV does not form at the leading edge but at mid-chord. This was experimentally confirmed by Kiefer et al. (2022).
Based on these observations, the authors explore dynamic stall of a typical wind turbine airfoil, FFA-W3-211 at Re = 15 × 106. The vortex formation stages and deep stall are investigated, characterizing the local flow separations. Our hypothesis is that the critical mid-chord suction parameter (MCSP) and trailing-edge suction parameter (TESP) exist, which identify the different formation phases of the dynamic-stall vortices. The MCSP is a measure of the suction at mid-chord in the interval directly downstream of the maximum thickness at and the TESP of . LESPcrit, MCSPcrit, and TESPcrit are criteria that predict vortex shedding along the airfoil surface without relying on empirical static polars and coefficients as the BEM method. We test our hypothesis by conducting Reynolds-averaged Navier–Stokes (URANS) simulations of dynamic stall at Re = 15 × 106. This Reynolds number will be reached by future offshore WTs, and, to the best of our knowledge, dynamic stall has not been comprehensively investigated at such operating conditions.
2.1 Numerical setup
OpenFOAM v2012, an open-source computational fluid dynamics (CFD) software package, is used to conduct a three-dimensional time-resolved Reynolds-averaged Navier–Stokes (RANS) simulation for investigating dynamic stall for the FFA-W3-211 airfoil (Fig. 1). This airfoil has a commonly used geometry for WTs with a thickness-to-chord ratio of 0.21 at 0.3 c, and the coordinates of the geometry can be found in Björck (1990). The main purpose is to predict the flow separation on the suction side of the airfoil for both the static and the dynamic cases at Re = 15 × 106, which is representative of future offshore WTs.
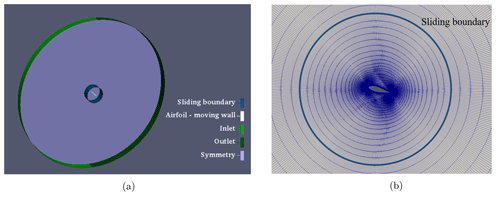
Figure 2Numerical-domain (a) boundary types and (b) mesh around the airfoil, with the blue line indicating the interface between pitching and stationary domains.
The computational domain and mesh are presented in Fig. 2. The Q3D domain consists of the stationary outer annulus with a diameter of 45 c and the pitching inner cylinder with a diameter of 5 c and chord length of c = 3.5 m. The two domains are coupled at each pitching motion using the cyclicAMI (arbitrary mesh interface) boundary condition in OpenFOAM. The span of the Q3D model is set to 2.5 c. Boundary layers at the blade surface are fully resolved; i.e., the non-dimensional grid spacing in the wall-normal direction y+ is smaller than 1. The cell account in the spanwise direction is 20, resulting in relatively high z+ values on the order of 103. This is a compromise between the computational cost and resolving three-dimensional vortices. The influence of cell numbers in the spanwise direction is shown in the following section. This results in a total number of cells of 0.7 × 10⁶ for the reference case. At the inlet, a uniform velocity of U∞ = 80 m s−1 and a zero gradient for the kinematic pressure are applied, while a zero gradient for the velocity and a uniform kinematic pressure of (incompressible flow) are applied at the outlet. The turbulent quantities are imposed at the inlet as fixed values, corresponding to the turbulence intensity of 0.01 %. This assumption is valid for the rotor cross-sections of large WTs in a laminar wind field at high altitude. The turbulent wind conditions should be applied for future studies as well. A periodic condition is used for all wall boundaries, except for the airfoil surface, where a zero-velocity condition is enforced.
The transient and incompressible pimpleFoam solver has been used for the unsteady RANS simulations. The two-equation shear stress transport (k−ω SST) model is applied as the turbulence model. It uses the PIMPLE (merged PISO–SIMPLE, pressure implicit split operator–semi-implicit method pressure-linked equations) algorithm for the pressure and velocity coupling (Issa, 1986). The correction of dominant fluxes in the impacted cells considers the impact of mesh movement. This correction involves substituting the velocity with a relative velocity in all convection terms. A comprehensive explanation of this process can be found in Jasak (2009). The transition model is not applied in this study since the flow is mostly turbulent (Fig. 1b). Kiefer et al. (2022) showed that for Re = 5 × 10⁶, the boundary layer is expected to transition to turbulence upstream of the separation point from conditions with a low Reynolds number and close to the leading edge of the airfoil. OpenFOAM uses the finite-volume method to discretize the differential RANS equation. The temporal discretization of implicit second-order and the spatial discretization of second-order Gauss linear schemes are employed with the exception of Laplacian schemes of Gauss linear limited corrected 0.5. This setup was successfully validated by Ahrens et al. (2022) for the prediction of dynamic stall of a thin blade at a low Reynolds number. Therefore, it cannot be guaranteed that the URANS setup and, in particular, the choice of the turbulence model are valid for this study. However, the error by the turbulence model will only influence the threshold values for the different stages of the dynamic stall but not the principle flow features observed. Depending on the calibration of the turbulence model, the turbulent boundary layer may be more or less stable (separation occurs at a higher or smaller angle of attack). Whether the URANS prediction is quantitatively accurate or not can only be validated by experiments or Reynolds stress-resolved large-eddy simulation. Neither are available, yet. The prediction of static stall will by validated by the widely used XFOIL method, and we assume that the unsteady model is then valid for the prediction of dynamic stall, too. The time step is adjusted during the unsteady simulation with the maximum Courant number (CFL number, Courant–Friedrichs–Lewy) of 10 along with the maximum time step of 5 × 10⁻⁴ s. Although the maximum CFL number is set to 10, a local CFL number is equal or less than 1, except at the leading-edge nose and tailing-edge where the mesh is excessively fine and velocity is high. This results in the time steps varying between 5 × 10⁻⁵ s at the stable region and 6 × 10⁻⁶ s at the stall region within a cycle.
To evaluate the static and dynamic performance of the airfoil, 200 numerical probes are located along the surface at the mid-span, with a denser distribution near the leading edge. The data are sampled at a frequency of 100 kHz for the spectral analysis; this is downsampled 100–1000 times for the quasi-steady-state analysis. The total simulation time corresponds to 5–15 cycles, with the first one or two being excluded to present the fully developed cycle behavior.
2.2 Non-dimensionalization
Comparability of the results presented in this paper is ensured by providing non-dimensional flow quantities. The non-dimensional quantities analyzed in this work are listed in the following paragraph. The Reynolds number of
is based on the chord length c, the freestream velocity U∞, and the kinematic viscosity ν. A local Reynolds number Rex takes the axial position x instead of the chord length c. The Strouhal number St is given to describe characteristic frequency of the vortex shedding f:
The kinematic frequency, in our case the pitching frequency fp, is non-dimensionalized as a reduced frequency k following the convention
The non-dimensional cell height at the wall of
is calculated with the cell height at the wall y, the wall shear stress τw, and the density ρ. x+ uses the streamwise cell size as input, and z+ uses the spanwise size. The lift coefficient is based on the lift force of the airfoil l:
The drag coefficient cd is the non-dimensionalized drag force d in the same manner.
2.3 Test cases
The URANS simulation is first conducted at a fixed AoA as listed in Tab. 1 to attain static polars. This is compared to XFOIL at 5° < AoA < 35°. XFOIL is a widely used tool for predicting the static performance of airfoils. According to Kang et al. (2018), XFOIL accurately predicts the pressure distribution of a thick profile at Re = 2.2 × 10⁶, including the transition point from laminar to turbulent flow. This is validated by comparing the result to a wind tunnel test. XFOIL cannot be used for the prediction of dynamic stall, which is why we focus on URANS in this work. The URANS model on the other hand was validated based on the widely used XFOIL simulations for the prediction of static stall. We then assume that URANS is valid for the prediction of dynamic stall, too. The dynamic-stall cases are simulated by pitching AoA α defined by
in Table 1. The dynamic conditions are chosen based on the static result to investigate light and deep stall. Although these conditions are extreme and apart from the realistic pitching operations, investigating this region is necessary to understand the characteristics of the dynamic stall and to validate or develop a comprehensive dynamic-stall model in the future. The pitching frequency is fp = 1 Hz, which corresponds to a reduced frequency of k=0.137. Simulations at Re = 1.6 × 10⁶ and 16 × 106 (e.g., Fig. 1) and k in a range of 0.029–0.137 have been conducted, too. For simplicity, the results of a few representative cases are shown in the paper. The influence of Re and k on dynamic-stall behavior is similar overall to the previous studies.
2.4 Blade element momentum code
The model chosen for this study is the four-state model of Hansen, Gaunaa, and Madsen (HGM model; Hansen et al., 2004), which is a variation of the BL model. The HGM model is analyzed in detail in Branlard et al. (2022). The airfoil under consideration and the boundary conditions are the same as the CFD setup. The time step of the calculation is Δt = 1 × 10⁻², which is considered adequate for convergence and stability, whereby its reduction has no effect on the results. URANS simulations in combination with XFOIL simulations were used to determine the static polars for 5° < α < 17°. The XFOIL polars were utilized for angles up to 10°, while the RANS polars were employed for angles ranging from 10° < α < 17°. The static-polar data underwent a three-dimensional correction based on the approach outlined by Du and Selig (1998). Extending the polar curve to cover a range of −180° < α < 180° allows for the determination of the unsteady parameters. The unsteady parameters which are used in the HGM model can be found in Damiani and Hayman (2019). Other parameters which are set in the HGM model are the empirical determined constants A1, A2, b1, b2, Tp, Tf, and Tv. This paper uses the values calculated by Leishman and Beddoes (1989): A1=0.3, A2=0.7, b1=0.14, b2=0.53, Tp=1.7, Tf=3, and Tv=6.
The preliminary studies are discussed in this section prior to the main analysis. The static polar is calculated by averaging the pressure after the convergence of the non-pitching simulations. The static case is utilized as the initial solution for the pitching cases. The dynamic cases have been simulated for 5–15 cycles; the data are then phased-averaged after the convergence. Since the time increment varies at each time step in unsteady setups, the data are resampled at a constant sampling frequency. Most of the contour figures are based on this phase-averaged data, e.g., the spatiotemporal and spatiospectral plots, except for a few instantaneous plots. Besides the phase-averaged performance, it is occasionally shown together with each cycle to represent the cycle-to-cycle variations. In this section, a maximum of 4 cycles are shown from each case for simplicity, even though the phase-average cycle is a result of averaging 5–15 cycles.
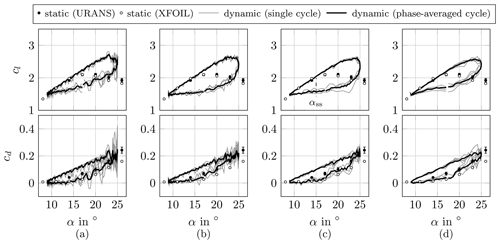
Figure 3The 17 ± 8° dynamic case for the mesh study of different cell counts spanning (a) 1 cell, (b) 10 cells, and (c) 20 cells (reference) for the airfoil aspect ratio of 2.5 and (d) 20 cells for the airfoil aspect ratio of 1.25. Error bar indicates 95 % confidence level.
The mesh study and time-step study have been conducted to find the adequate steps of spatial and temporal discretizations. Three cases of different cell counts of 1, 10, and 20 in the span of an aspect ratio (AR) of 2.5 are simulated with a pitching angle of 17 ± 8°. Another case is an AR of 1.25 with 20 cells in the spanwise direction. Figure 3 shows the dynamic-stall cycles from four mesh setups together with two static polars, one from time-averaged URANS of non-pitching setups of the reference mesh and the other from two-dimensional simulations in XFOIL. The error bar indicates the confidence level of 95 % of URANS simulations, which enlarges as the AoA increases. The calculations of cl and cd from XFOIL and URANS agree well up to an angle of attack of 17°, which is near the maximum cl. XFOIL predicts the transition position as at α = 20°, which supports the validity of the fully turbulent assumption in the URANS setup. The deviation between static URANS and XFOIL increases as the angle increases, which addresses the limitation of utilizing two-dimensional tools for large-WT applications. The influence of the mesh size on the prediction of stall cycles in cl and cd and the onset of static stall at αss = 15° is similar. Figure 3a predicts an earlier onset of deep stall at 23° when the other setups show light-stall behavior. The cycle-to-cycle variation is large in this case, which is not a physical phenomenon but rather numerical error. Figure 3d slightly under-predicts the variation in cl during dynamic stall (DS), especially the maximum lift and lift during a down-pitching, where DSVs are developed into large-scale three-dimensional vortices. The conventional choice of spanwise extension as similar to or smaller than a chord length might not be sufficient to resolve DS of large WTs. The AR of 2.5 with 20 cells is chosen for the studies in this paper; nevertheless, the influence of the domain should continue to be investigated in the future, focusing on the three-dimensional aspect of DSVs.
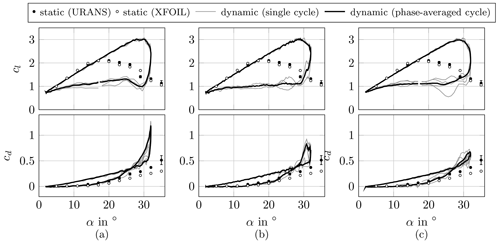
Figure 4The 17 ± 15° pitching case for the time-step study of the maximum CFL number of (a) 100, (b) 50, and (c) 10 (reference).
Figure 4 shows the dynamic-stall cycles from different maximum CFL number cases of 100, 50, and 10. The pitching angle is chosen to be 17 ± 15° to examine the influence of the time step during a deeper stall cycle compared to the mesh study. The cycle converges towards a maximum CFL of 10. This setup results in a CFL number for the majority of the cells under 1 at every time step. A maximum CFL number of 5 would require very high computational power. The prediction of αss = 15° and a maximum cl at 29–30° is similar for all different CFL numbers. However, the difference is distinct in cl and cd near the maximum angle of α = 30–32°, especially during down-pitching, which is relevant for estimating the LESP and later developing a reduced-order model. Therefore, the maximum CFL number of 10 is chosen for further simulations.
4.1 Sensitivity of dynamic stall towards pitching angle
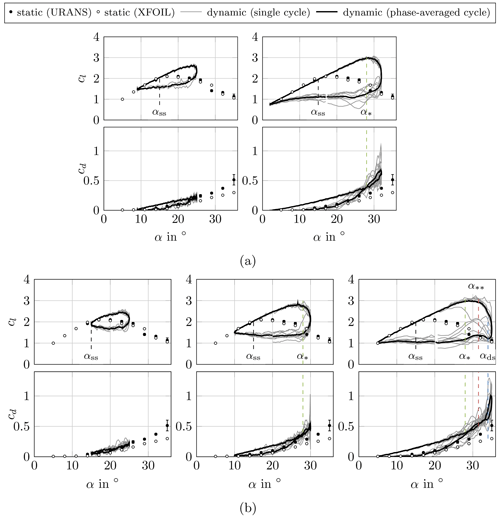
The dynamic-stall cycles in different mean and pitching angles are shown in Fig. 5. The onset angles of each dynamic-stall phase are defined as static stall αss, local stall α∗, full stall , and deep stall αds. The angles are introduced in this section based on the distinct characteristics of the flow separation and vortex structures on the airfoil suction side; the criteria for these will be introduced in the last section based on the suction parameters. A proper method, such as a proper orthogonal decomposition (POD), should be considered in the future to provide a measurable definition (Mulleners and Raffel, 2012).
The onset angle of the static stall is approximately at αss = 15°, which is defined as where the dynamic performance deviates from the static performance. This angle corresponds to a trailing-edge stall in the static case, the complete flow separation is found approximately at 35°. This type of partial stall is known for thick airfoils with a high Reynolds number (Braud et al., 2024). After exceeding αss = 15°, small fluctuations are observed in the dynamic signals of cl and cd as the flow becomes unsteady. The fluctuation and the cycle-to-cycle variation increase further and become distinctly more chaotic around a local stall at α∗ = 28°. This is also where the dynamic cd rapidly changes during down-pitching and the static lift abruptly decreases due to the flow separation without reattachment on the suction side. The difference in static polars between URANS and XFOIL is large at this angle. The pitching angle of 20 ± 15° shows a deep-stall cycle, while the others investigated in this paper are light stalls. This case experiences a sudden decrease in lift and increase in drag during dynamic stall at the full stall at = 31.5° and enters deep stall at αds = 34°. The static polar shows a second drop around αds = 34°, which indicates the complete stall in the leading-edge (LE) region. αss and α∗ can be set as critical angles for this airfoil. However, to generalize this observation for different airfoils during a design process and to find the correlation between the airfoil parameters and the critical angles, comprehensive understanding and analysis of the flow field is necessary.
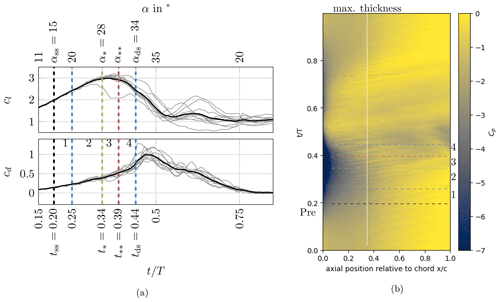
Figure 6Evolution of dynamic stall in different phases for 20 ± 15° with static stall at tss, localized stall at t∗, full stall at , and deep stall at tds: (a) phase-averaged (black) and individual (gray) lift and drag coefficients and (b) spatiotemporal plot of phase-averaged pressure coefficient cp on the suction side.
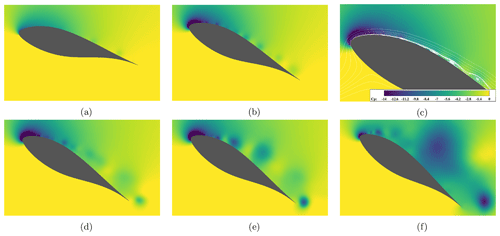
Figure 7Instantaneous pressure coefficient cp through during a dynamic stall: (a) initial instability (Stage 1) at (α=15.4°); (b, c) attached vortex street (Stage 2) at (α=26.4°); (d) lift peak, localized stall (Stage 3) at (α=30.3°); (e) full stall (Stage 4) at (α=32.1°); and (f) deep stall at (α=34.9°).
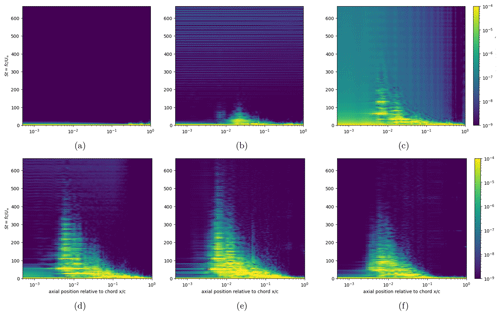
Figure 8Power spectral density of phase-averaged pressure coefficient cp on the suction side of the airfoil during dynamic stall, with the frequency non-dimensionalized as : (a) static stall at , (b) initial instability (Stage 1/Stage 2) at , (c) attached vortex street (Stage 2) at , (d) peak lift (Stage 3) at , (e) full stall (Stage 4) at , and (f) deep stall at .
4.2 Life cycle of dynamic stall
The life cycle of dynamic stall is conventionally categorized into the primary-instability stage and the vortex formation stage during an up-pitching motion. The primary-instability stage is where the flow becomes unstable, exceeding the static-stall limit (tss). The shear layer starts rolling up, forming localized vortices. During the vortex formation stage (t∗), the shear layer is rolled up together with the leading-edge separation vortex (LEV), forming a large DSV (Fig. 1a). DSVs are detached after entering this stage, leading the decrease in lift. Dynamic stall of a thick airfoil under a very high Reynolds number reveals that this classification is not completely applicable due to the distinct localized characteristics. Figure 6a shows the lift and drag coefficients, and Fig. 6b shows the pressure coefficient cp on the suction side of the airfoil with the individual stages marked, while Fig. 7 shows the pressure contours at the mid-span. The definition and description of each evolution phase are as follows:
-
Pre-stall. At a low angle of attack, small separations form near 0.3 c, where the maximum thickness of the airfoil is found. Those separations are convected downstream, while the leading-edge area is steady. Those are low-intensity and constant vortices, which are not influenced by the pitching angle in this region.
-
Initial instability, localized vortex formation (Stage 1). Exceeding the static stall at tss = 0.20, linear increase in the lift and drag is observed. Few localized small-scale vortices form independently in the LE region (0–0.3 c) and mid-chord (MC) to trailing-edge (TE) region (0.3–1 c). Those vortices are low intensity and quickly dissipate while being convected downstream. Their traces can be seen at the spatiotemporal plot in Fig. 6b at t = 0.20–0.25. The cycle-to-cycle variation is negligible at this initial-instability stage, implying a quasi-steady state.
-
Dynamic-stall vortex formation, attached vortex street (Stage 2). A further increase in the pitch angle results in gaining lift, although the increase is decelerated compared to the previous stage. The pressure contour shows that the LE is generating small-scale vortices (Fig. 7c). These high-intensity LEVs travel downstream, and they develop into DSVs as a result of interaction with the mid-chord vortices. It results in multiple vortices of large to small scales in various intensities, attached along the entire suction side of the airfoil. The cycle-to-cycle variation is increased compared to the earlier stage.
-
Lift plateau, localized stall (Stage 3). Although LE suction still increases and generates stronger vortices at the turbulent LE (0–0.3 c), the total lift does not increase in this stage since the stall is initiated in the rest of the region (0.3–1 c). This is apparent in Fig. 6b and Fig. 7d as detached and dissipating vortices at 0.3–1 c. The lift curve cl shows a plateau at time t∗ = 0.34 < t < = 0.39 as a result of the balance between ever increasing LE suction and decreasing suction in the rest of the region. For the cases of thin airfoils with low Reynolds numbers, the plateau in lift might be observed for a very short period time at the beginning of the vortex formation stage as a result of the balance between LEV and the trailing-edge separation vortex (TEV) (Deparday and Mulleners, 2019). However, the time span is relatively short for thin airfoils with a low Reynolds number because the primary DSV is formed at the LE and shortly after detached, when the attached small-scale vortices originated from the turbulent LE persist for an extended time for thick airfoils with a high Reynolds number. Therefore, it can be concluded that this extended intermediate stage is a consequence of the earlier transition at the LE and abrupt changes in blade thickness along the chamber line. This stage functions as a delay of deep stall and is beneficial for gaining further lift during a pitching motion.
-
Full stall (Stage 4). The LE region gradually stalls after reaching its maximum capacity at . In this stage, the suction side is fully stalled and the trailing-edge vortex starts appearing (Fig. 7e). This process results in a drastic decrease in lift cl and increase in drag cd.
-
Deep stall, shedding of dynamic-stall vortex. The airfoil is fully stalled, lift is decreased, and drag is increased continuously. The beginning of this stage at tds = 0.44 might involve a slight increase in lift due to the shedding of the large DSVs (Fig. 7f).
-
Post-stall. Leaving the stall by a down-pitching motion at t=0.5, the lift usually fluctuates and is returned to the pre-stall state, featuring LE reattachment. For the current study, this returning process is slightly delayed since the LEVs are still generated at t = 0.5–0.75, preventing a rapid decrease in lift. This is related to the characteristics of the delayed and stretched stall region during the up-pitching motion.
4.3 Vortex dynamics
Spectral analysis reveals the spatial and temporal evolution of vortices described earlier. Figure 8 shows frequency spectra of the pressure coefficient cp along the airfoil suction side at different time steps. The phase-averaged cp from adjusted time-step simulations is taken to eliminate numerical errors. The axial position is in log scale to highlight the LE region, where the dynamic unsteady flow separation is found. The origin and evolution of small- to large-scale DSVs are traced following the life cycle defined in the previous section. A few distinct peaks are observed during the dynamic stall, which correspond to the shedding of vortices.
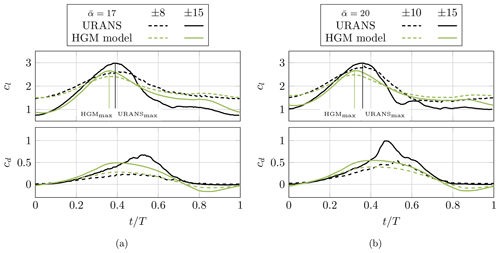
Figure 9Comparison of lift and drag coefficients between phase-averaged URANS and BEM simulations. Case ID (a) 2 and (b) 3, with a mark at maximum cl indicating under-estimation of dynamic stall from the HGM model.
As the angle of attack exceeds the static-stall limit (Fig. 8a), the increase in the unsteady pressure coefficient cp is detected at 0.3–1 c at very low frequency. This is the result of localized separations defined earlier. The pressure gradient along the airfoil surface at this stage is small so that the vortices are slowly convected downstream and dissipate. The LE region is still static at this stage (dark blue contour); the entire airfoil is in a quasi-steady state. As the cycle enters Stage 1 (Fig. 8b), LE separation at 0.025 c is initiated with discrete frequency content. The local Reynolds number of Rex = 3.8 × 10⁵ indicates that this is a turbulent separation. The previously separated region at 0.3–1 c becomes slightly more unsteady. The vortices originating from the LE and MC are independent, maintaining their own characteristics, indicating no large-scale DSVs are formed yet. Towards Stage 2 (Fig. 8c) and Stage 3 (Fig. 8d), the LE separation point is shifted further upstream at 0.006 c. The highest peak is observed at approximately St=25; this vortex is then convected downstream with a slightly decreasing frequency. This peak corresponds to the local Reynolds number of Rex = 9 × 10⁴ and Strouhal number of Stx=0.15, indicating the laminar separation bubble and its shedding. Laminar separation is more abrupt compared to the previous turbulent separation. The cascade form of the spectrum can be interpreted as the relative sizes of vortices from the LE to the TE; the high frequency near the LE means small-scale LEVs, and low frequency towards the TE means large-scale DSVs. This is also an indication of interaction between the convected LEVs and downstream vortices. DSVs are attached along the entire surface, achieving the maximum lift. At the full stall of the airfoil (Fig. 8e), the energy is less concentrated in specific frequencies and rather more broadband as a result of mixing and dissipation. The DSVs are enlarged and detached on the suction surface. Another noticeable region is the TE, where the flow becomes more unsteady due to the forming of a trailing-edge vortex. During the deep stall (Fig. 8f), the unsteady energy is mostly dissipated except in the LE region, where the vortices are still generated.
This analysis not only supports the characterization of the flow around the airfoil but also can be utilized to design a suppression method of the dynamic stall. The regions that are prone to flow separations can be either actively or passively controlled. Various methods (e.g., surface treatment, air injection, pulse generation) are conventionally applied near the LE to bypass the laminar separation (Visbal and Benton, 2018; De Tavernier et al., 2021). For large WTs, the mid-chord region could be additionally considered for the flow control to delay the localized flow separation. Considering divergent frequency spectra in different axial positions, the method has to be independently optimized along the airfoil chord.
Figure 9 compares the lift and drag coefficients between URANS and HGM simulations. The HGM result agrees with URANS at the initial vortex formation stage. However, the HGM model under-predicts the maximum loading by earlier development of dynamic stall. When URANS predicts a further increasing cl due to the delaying effect of dynamic stall at , the HGM model predicts the onset of dynamic stall. This is reasonable considering the model is optimized for thin airfoils with low Reynolds numbers. The distinct characteristic of a vortex street (Stage 2) and lift peak (Stage 3), the strong localization of flow separation and vortex detachment, is not considered in the current dynamic-stall model. These two phases should be considered in future reduced-order models. As a next step, the coefficients of the HGM model will be calibrated and IAG models will be tested.
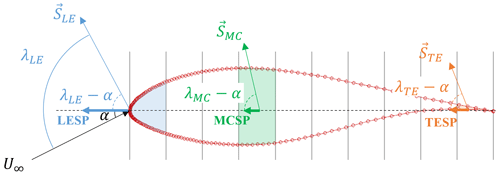
While the general feature of each stall phase during a dynamic-stall cycle is described earlier, the criteria determining the initialization of each phase is discussed in this section. This can be utilized to develop a reduced-order model in the future. Besides the commonly known leading-edge suction parameter (LESP), which is defined as the chordwise component of airfoil loading at the LE (0–0.1 c), the MCSP at 0.3–0.4 c and TESP at 0.9–1 c are newly introduced. Similarly to the LESP defined in Eq. (7), the MCSP and TESP can be calculated with the respective loading (SMC and STE) and the angles of those (λMC and λTE) as shown in Fig. 10. Conventionally, the LESP is sufficient to represent the onset characteristics of each stage of the dynamic stall for thin airfoils, where dynamic-stall separation occurs at the leading edge. Since some stages of dynamic stall of thick profiles are dominated by the separation close to mid-chord, using the LESP alone does not seem to be a straightforward way to identify all stages of dynamic stall. Due to the more detailed stages in this study, the MCSP and TESP might be the supporting parameters that fully describe the onset of individual stages.
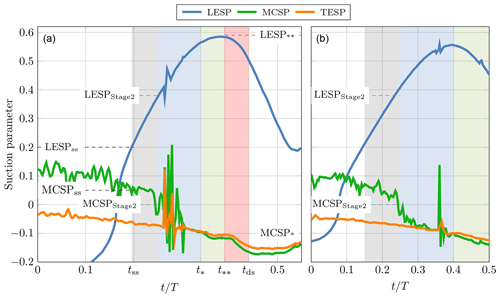
Figure 11Leading-edge suction parameter (LESP), mid-chord suction parameter (MCSP), and trailing-edge suction parameter (TESP) from the pitching case of (a) 20 ± 15° and (b) 20 ± 10°. The shaded regions refer to initial instability (gray), an attached DSV (blue), lift peak (green), and full stall (red).
Figure 11 shows the LESP, MCSP, and TESP for two variations in pitching angle, 20 ± 15° and 20 ± 10°. The magnitude of the MCSP and TESP are relatively low since most of the lift is grained near the LE, yet a distinct trend in the MCSP and TESP are observed. A critical LESP for the onset of static stall (LESPss) is valid as both of the cases have LESPss = 0.2. At the same time, MCSPss = 0.05 and TESPss = −0.06 support the indication of onset of static stall, although the sensitivity in these parameters is low. Entering Stage 2 at t=0.25, the MCSP abruptly decreases below zero (MCSPStage 2 = 0) due to the mid-chord region being locally separated. This is followed by high fluctuation in the suction parameter because of the traveling small vortices. LESPStage 2 = 0.38 as a criterion is valid as well, although the sensitivity is smaller compared to the MCSP. Remembering that Stage 3 (t∗) is characterized by slightly increasing leading-edge suction and complete stall in the rest of the area, the MCSP and TESP are better criteria than the LESP. The LESP either increases further (case of 20 ± 15°) or decreases (case of 20 ± 10°) depending on the angle setting. MCSP∗ = TESP∗ = −0.1 is found to be valid for both cases. Whether the cycle enters Stage 4 (full stall at ) can be determined by all three parameters. However, = 0.59 must be the determining parameter when and are the consequence of the full-stall driven by the stall in the leading edge. During the full stall, a sudden drop in the MCSP and TESP are observed, which indicates a large TEV.
Wind turbines operate in highly unsteady wind conditions, which makes avoiding dynamic stall entirely an impossible task. In order to design airfoils that are less prone to dynamic stall, especially deep stall, a reduced-order model that can predict the onset of the formation of the dynamic-stall vortex is required. The research presented here contributes to the development of such a reduced-order model for wind turbine airfoils with a high thickness-to-chord ratio and long chord length by analyzing the unsteady RANS simulations of a pitching FFA-W3-211 airfoil at the Reynolds number of 15 × 106.
The dynamic-stall cycle is categorized into four phases based on the unsteady vortex dynamics along the suction side of the airfoil. The initial-instability phase and attached vortex street phase fall into the conventional primary-instability stage. Before the occurrence of the deep stall, the peak lift phase, where the loss due to the localized stall is compensated by strengthened leading-edge vortices, is found. Individual stages are characterized in depth from a frequency analysis, where the size and growth of dynamic-stall vortices and the interaction between them are presented. The leading-edge suction parameter (LESP), introduced by Ramesh et al. (2014) for predicting the onset of the vortex formation stage on thin airfoils, was analyzed to test its feasibility for thick airfoils with high Reynolds numbers. It was found that the temporal evolution of the LESP indicates the inception of full stall. Since the flow at the leading edge remains mostly attached during the dynamic-stall cycle, the supplementary parameters which can represent the suction capability at different airfoil locations are needed. For airfoils as they occur on wind turbines, the dynamic-stall vortices form and separate initially at mid-chord, which illustrates that monitoring the LESP is not sufficient for predicting the onset of the initial vortex formation stage for the designer of WTs. Therefore, we introduced the mid-chord suction parameter (MCSP) at 0.3–0.4 c and the trailing-edge suction parameter (TESP) at 0.9–1 c, which are the same suction vector component as the LESP but on locations downstream of the leading edge. Since the MCSP is based on the pressure at the location of the initial vortex separation, it seems to be a robust supplement for the application to thick airfoils together with the LESP. Analogous to the LESP, the MCSP and TESP indicate the transition points of the dynamic-stall stages.
Future work should investigate the sensitivity of the airfoil camber distribution and the location of the maximum thickness to the stall delay attributed to the localized stall phases. Application of the transition model and different flow and kinematic boundary conditions should be tested for comprehensive characterization. Establishing correlations between LESPcrit, the temporal evolution of the MCSP and TESP, and these airfoil parameters would allow for the development of a reduced-order model that can predict dynamic stall in the design process of new airfoil geometries. Although dynamic-stall models using the URANS method have been validated numerous times in previous decades, the validation of the current model should be pursued in the future. Considering the URANS method models turbulence terms and transition characteristics and XFOIL models the viscous layer and transition point, the validity could be different for the large wind profiles with high Reynolds numbers. This has been difficult so far due to the lack of experimental data. However, recent studies promise dynamic-stall experiments of large-scale wind turbine profiles in the near future. Either utilizing those results or conducting high-fidelity simulations, e.g., detached-eddy simulation (DES) and large-eddy simulation (LES), should support the validity of the current study.
This work utilizes publicly accessible codes: OpenFOAM (https://www.openfoam.com/news/main-news/openfoam-v20-12, OpenCFD Ltd., 2020), OpenFAST (https://github.com/OpenFAST/openfast, NREL, 2025), and XFOIL (https://web.mit.edu/drela/Public/web/xfoil/, Drela, 2013).
The raw data can be shared upon request to the authors.
HRK conducted the URANS simulations, evaluated the results, and wrote the paper except for the parts regarding BEM. JAP conducted the BEM simulation and wrote the methodology and results regarding BEM. JDA wrote the majority of the Introduction. HRK, JAD, and JAP worked under the supervision JRS and LW, who reviewed the work.
The contact author has declared that none of the authors has any competing interests.
Publisher's note: Copernicus Publications remains neutral with regard to jurisdictional claims made in the text, published maps, institutional affiliations, or any other geographical representation in this paper. While Copernicus Publications makes every effort to include appropriate place names, the final responsibility lies with the authors.
The authors gratefully acknowledge the computing time granted by the Resource Allocation Board for the supercomputers Lise and Emmy at NHR@ZIB and NHR@Göttingen as part of the NHR (Nationales Hochleistungsrechnen) infrastructure. The calculations for this research were conducted with computing resources (project no. nii00172). The authors acknowledge the cluster system at Leibniz University Hannover for the high-performance computing (HPC) resources, which have contributed to the development of the research results presented here. The present work was carried out for subproject A02 within Collaborative Research Centre (CRC) 1463 Integrated Design and Operation Methodology for Offshore Megastructures, which is funded by the Deutsche Forschungsgemeinschaft (DFG, German Research Foundation). The authors thank the DFG for the support.
This research has been supported by the Deutsche Forschungsgemeinschaft (grant no. 434502799).
The publication of this article was funded by the open-access fund of Leibniz Universität Hannover.
This paper was edited by Emmanuel Branlard and reviewed by two anonymous referees.
Ahrens, J. D., Ziesse, M., Wein, L., and Seume, J. R.: A Novel And Costeffective Approach To Simulating Dynamic Stall On Rotating Wind Turbine Blades With A Changing Angle Of Attack, GPPS Chania, 2022. a
Andersen, P. B., Gaunaa, M., Bak, C., and Hansen, M. H.: A dynamic stall model for airfoils with deformable trailing edges, Wind Energy, 12, 734–751, 2009. a
Bangga, G., Weihing, P., Lutz, T., and Krämer, E.: Effect of computational grid on accurate prediction of a wind turbine rotor using delayed detached-eddy simulations, J. Mecha. Sci. Technol., 31, 2359–2364, 2017. a
Bangga, G., Lutz, T., and Arnold, M.: An improved second-order dynamic stall model for wind turbine airfoils, Wind Energ. Sci., 5, 1037–1058, https://doi.org/10.5194/wes-5-1037-2020, 2020. a
Bangga, G., Parkinson, S., and Collier, W.: Development and Validation of the IAG Dynamic Stall Model in State-Space Representation for Wind Turbine Airfoils, Energies, 16, 3994, https://doi.org/10.3390/en16103994, 2023. a
Björck, A.: Coordinates and Calculations for the FFA-W1-xxx,FFA-W2-xxx and FFA-W3-xxx Series of Airfoils for Horizontal Axis Wind Turbines, The Aeronautical Research Institute of Sweden, FFA TN 1990-15, Stockholm, 1990, https://books.google.de/books?id=alyC0AEACAAJ (last access: 7 January 2025), 1990. a
Branlard, E., Jonkman, B., Pirrung, G. R., Dixon, K., and Jonkman, J.: Dynamic inflow and unsteady aerodynamics models for modal and stability analyses in OpenFAST, J. Phys. Conf. Ser., 2265, 032044, https://doi.org/10.1088/1742-6596/2265/3/032044, 2022. a, b
Braud, C., Podvin, B., and Deparday, J.: Study of the wall pressure variations on the stall inception of a thick cambered profile at high Reynolds number, Physical Review Fluids, 9, 014605, https://doi.org/10.1103/physrevfluids.9.014605, 2024. a
Brunner, C. E., Kiefer, J., Hansen, M. O., and Hultmark, M.: Study of Reynolds number effects on the aerodynamics of a moderately thick airfoil using a high-pressure wind tunnel, Exp. Fluids, 62, 1–17, 2021. a
Corke, T. C. and Thomas, F. O.: Dynamic stall in pitching airfoils: aerodynamic damping and compressibility effects, Annu. Rev. Fluid Mech., 47, 479–505, 2015. a
Damiani, R. R. and Hayman, G.: The Unsteady Aerodynamics Module For FAST8, National Renewable Energy Laboratory, https://doi.org/10.2172/1576488, 2019. a
De Tavernier, D., Ferreira, C., Viré, A., LeBlanc, B., and Bernardy, S.: Controlling dynamic stall using vortex generators on a wind turbine airfoil, Renew. Energ., 172, 1194–1211, https://doi.org/10.1016/j.renene.2021.03.019, 2021. a
Deparday, J. and Mulleners, K.: Modeling the interplay between the shear layer and leading edge suction during dynamic stall, Phys. Fluids, 31, 107104, https://doi.org/10.1063/1.5121312, 2019. a, b, c
Drela, M.: Xfoil 6.99, XFOIL [code], https://web.mit.edu/drela/Public/web/xfoil/, last access: 23 December 2013.
Du, Z. and Selig, M.: A 3-D stall-delay model for horizontal axis wind turbine performance prediction, American Institute of Aeronautics and Astronautics, AIAA-98-0021, https://doi.org/10.2514/6.1998-21, 1998. a
Gerontakos, P. and Lee, T.: Dynamic stall flow control via a trailing-edge flap, AIAA J., 44, 469–480, 2006. a
Gupta, R. and Ansell, P. J.: Unsteady flow physics of airfoil dynamic stall, AIAA J., 57, 165–175, 2019. a
Gupta, S. and Leishman, J. G.: Dynamic stall modelling of the S809 aerofoil and comparison with experiments, Wind Energy, 9, 521–547, 2006. a
Hansen, M. H., Gaunaa, M., and Aagaard Madsen, H.: A Beddoes-Leishman type dynamic stall model in state-space and indicial formulations, Denmark. Forskningscenter Risoe. Risoe-R No. 1354(EN), 2004. a
Huang, X., Albers, M., Meysonnat, P., Meinke, M., and Schröder, W.: Analysis of the effect of freestream turbulence on dynamic stall of wind turbine blades, Int. J. Heat Fluid Fl., 85, 108668, https://doi.org/10.1016/j.ijheatfluidflow.2020.108668, 2020. a
Issa, R. I.: Solution of the implicitly discretised fluid flow equations by operator-splitting, J. Comput. Phys., 62, 40–65, 1986. a
Jasak, H.: Dynamic Mesh Handling in OpenFOAM, American Institute of Aeronautics and Astronautics, https://doi.org/10.2514/6.2009-341, 2009. a
Kang, S.-H., Ryu, K.-W., and Roh, S.-C.: Reynolds Number Extrapolation on High Thickness-Ratio Airfoil for Megawatt-Class Wind Turbine, Int. J. Aeronaut. Space, 19, 575–583, https://doi.org/10.1007/s42405-018-0074-7, 2018. a
Kiefer, J., Brunner, C. E., Hansen, M. O., and Hultmark, M.: Dynamic stall at high Reynolds numbers induced by ramp-type pitching motions, J. Fluid Mech., 938, https://doi.org/10.1017/jfm.2022.70, 2022. a, b, c, d
Konstadinopoulos, P., Thrasher, D., Mook, D., Nayfeh, A., and Watson, L.: A vortex-lattice method for general, unsteady aerodynamics, J. Aircraft, 22, 43–49, 1985. a
Leishman, G. J.: Principles of helicopter aerodynamics, Cambridge University Press, ISBN 9781107013353, 2006. a
Leishman, J. G. and Beddoes, T.: A Semi-Empirical model for dynamic stall, J. Am. Helicopter Soc., 34, 3–17, 1989. a, b
Letzgus, J., Gardner, A. D., Schwermer, T., Keßler, M., and Krämer, E.: Numerical investigations of dynamic stall on a rotor with cyclic pitch control, J. Am. Helicopter Soc. 64, 1–14, 2019. a
Merz, C. B., Wolf, C., Richter, K., Kaufmann, K., Mielke, A., and Raffel, M.: Spanwise differences in static and dynamic stall on a pitching rotor blade tip model, J. Am. Helicopter Soc. 62, 1–11, 2017. a
Mulleners, K. and Raffel, M.: The onset of dynamic stall revisited, Exp. Fluids, 52, 779–793, https://doi.org/10.1007/s00348-011-1118-y, 2012. a
Mulleners, K., Le Pape, A., Heine, B., and Raffel, M.: The dynamics of static stall, Proceedings of the 16th International Symposium on Applications of Laser Techniques to Fluid Mechanics, Lisbon, Portugal, 9–12 July 2012, https://elib.dlr.de/75965/ (last access: 7 January 2025), 2012. a, b, c, d
National Renewable Energy Laboratory (NREL): OpenFAST v8, GitHub [code], https://github.com/OpenFAST/openfast, last access: 7 January 2025.
OpenCFD Ltd.: OpenFOAM v2012, OpenFOAM [code], https://www.openfoam.com/news/main-news/openfoam-v20-12, last access: 23 December 2020.
Ramesh, K., Gopalarathnam, A., Granlund, K., Ol, M. V., and Edwards, J. R.: Discrete-vortex method with novel shedding criterion for unsteady aerofoil flows with intermittent leading-edge vortex shedding, J. Fluid Mech., 751, 500–538, 2014. a, b, c
Schwermer, T., Gardner, A. D., and Raffel, M.: A novel experiment to understand the dynamic stall phenomenon in rotor axial flight, J. Am. Helicopter Soc. 64, 1–11, 2019. a
Sharma, A. and Visbal, M.: Numerical investigation of the effect of airfoil thickness on onset of dynamic stall, J. Fluid Mech., 870, 870–900, 2019. a, b
Simms, D., Schreck, S., Hand, M., and Fingersh, L. J.: NREL unsteady aerodynamics experiment in the NASA-Ames wind tunnel: a comparison of predictions to measurements, Tech. rep., National Renewable Energy Lab. (NREL), Golden, CO, United States, 2001. a
Tangler, J. L.: The Nebulous Art of Using Wind-Turnnel Airfoil Data for Predicting Rotor Performance, Proceedings of the ASME 2002 Wind Energy Symposium, ASME 2002 Wind Energy Symposium, Reno, Nevada, USA, 14–17 January 2002, 190–196, ASME, https://doi.org/10.1115/WIND2002-40, 2002. a
Visbal, M. R. and Benton, S. I.: Exploration of high-frequency control of dynamic stall using large-eddy simulations, AIAA J., 56, https://doi.org/10.2514/1.J056720, 2018. a
- Abstract
- Introduction
- Methodology
- Mesh and time-step studies
- Features of dynamic stall
- Comparison between CFD simulation and the HGM model
- Predicting onset of dynamic stall
- Conclusions and outlook
- Code availability
- Data availability
- Author contributions
- Competing interests
- Disclaimer
- Acknowledgements
- Financial support
- Review statement
- References


