the Creative Commons Attribution 4.0 License.
the Creative Commons Attribution 4.0 License.
Characterization of vortex-shedding regimes and lock-in response of a wind turbine airfoil with two high-fidelity simulation approaches
Ricardo Fernandez-Aldama
George Papadakis
Oscar Lopez-Garcia
Sergio Avila-Sanchez
Vasilis A. Riziotis
Alvaro Cuerva-Tejero
Cristobal Gallego-Castillo
In this work, the vortex-induced vibration (VIV) phenomenon affecting a wind turbine airfoil section at 90° incidence is analysed with two numerical approaches, a two-dimensional (2D) setup of the airfoil, simulated using the unsteady Reynolds-averaged Navier–Stokes equations, and a three-dimensional (3D) setup with a span-to-chord aspect ratio of 1, employing the delayed detached-eddy simulation model. A constant inflow velocity is considered for a Reynolds number around 2×10⁶. The only structural degree of freedom is the airfoil chordwise displacement. As a reference, simulations of the static airfoil are also performed. By running the 3D static simulation for a sufficiently long time, the vortex shedding is found to have intermittent periods of different characteristics, including different Strouhal numbers. The VIV simulations are performed at different inflow velocities to cover the lock-in range, and a new robust metric is proposed to characterize this range. This robust characterization and the insight gained about the multiplicity of Strouhal numbers have allowed the present authors to make a fairer comparison between the 2D and 3D simulation results than in previous works. The outcome of this comparison is that, inside the lock-in range, the 2D and 3D approaches predict a very similar VIV development.
- Article
(11016 KB) - Full-text XML
- BibTeX
- EndNote
The vortex-induced vibration (VIV) phenomenon on wind turbine towers, nacelles and blades has been identified as one of the grand challenges for the wind turbine industry in the near future (Veers et al., 2023). VIV of parked or idling wind turbine blades may induce large edgewise vibrations and fatigue loading. The difficulties of facing this challenge include a lack of thorough understanding of the aeroelastic phenomena involved and a lack of appropriate mitigating solutions, simplified models for application at design and certification levels, simulation capabilities, and experimental data at both scaled and full-scale.
The VIV phenomenon of bluff bodies is well known and has been studied extensively both numerically and experimentally. VIV may be described as a resonance with nonlinear feedback phenomenon, where the structural motion affects the vortex shedding (de Langre, 2006). A critical aspect of this feedback is that it can result in a frequency lock-in if the unperturbed vortex-shedding frequency is close to the structural natural frequency (Griffin et al., 1973). VIV is typically characterized by the maximum amplitudes reached by the body, as well as by the lock-in range, i.e. the range of inflow velocities for which large vibrations build up, as a consequence of the synchronization between the vortex-shedding frequency and the structural natural frequency.
In engineering models of the VIV response of a bluff body, it is typical to employ as a parameter the non-dimensional vortex-shedding frequency or Strouhal number (Païdoussis et al., 2010), where is the vortex-shedding frequency observed for the static body, U∞ is the inflow velocity and Lref is a characteristic length of the body. The VIV response is dependent upon a very large parameter space related to both the inflow conditions and the structural system (Sarpkaya, 2004), including a fundamental dependency of the vortex-shedding topology on the Reynolds number regime (Schewe, 1983; Sumer and Fredsøe, 2006).
Recent computational advancements have favoured the use of high-fidelity computational fluid dynamics (CFD) models coupled with structural models to characterize the fluid–structure interaction (FSI) associated with VIV. The still large computational cost of this approach limits the extent to which realistic scenarios can be simulated (e.g. full wind turbine blades and towers immersed in the atmospheric boundary layer at high Reynolds numbers) and also limits the VIV characterization throughout the extensive parameter space.
A large part of the parameter space has been studied in the past, although the picture is far from complete. The flow features and VIV response interact in a complex manner, so it is not always easy to draw general conclusions from specific cases. A broad literature review is now given, showing some of the gaps that exist in the literature and highlighting some contributions which are relevant to the present analysis.
The most commonly analysed geometry in VIV studies is the circular cylinder. This geometry has been widely analysed experimentally from very early on. The first detailed account of the VIV response obtained experimentally is given by Feng (1968), who described the influence of the structural damping on several characteristics of the response such as the phase angle between force and motion, the position within the lock-in range of the maximum amplitude, or the spanwise correlation length. A systematic study of the effects of inflow turbulence intensity up to supercritical Reynolds numbers on the vortex-induced negative aerodynamic damping was first explored by Cheung and Melbourne (1983). The characterization of said aerodynamic damping remains a challenging task. Experimental campaigns are still being carried out to improve our understanding of this aerodynamic damping, such as those by Lupi et al. (2018, 2021), where experimental results are used to propose improved engineering models and methodologies for the prediction of VIV. In Jauvtis and Williamson (2003) and Cagney and Balabani (2014) it was found experimentally that constraining the structural motion of the cylinder to its transverse direction only, rather than allowing for transverse and in-line motion, has very little effect on the transverse VIV response and the wake topology. Full-scale studies of VIV of towers with circular sections are also common (Christensen and Askegaard, 1978; Galemann and Ruscheweyh, 1992), including recent efforts to characterize the vortex-shedding loads on wind turbine towers (Kurniawati et al., 2024). Computational simulations of cylinder VIV are also numerous, including recent contributions focused on the problem of wind turbine towers (Viré et al., 2020; Vlastos et al., 2024).
Another canonical case is that of prisms with square cross-sections, both with a face normal to the flow and rotated 45°. FSI simulations have shown that the diamond geometry is susceptible to VIV (Leontini and Thompson, 2013; Sourav et al., 2020) but always for relatively small Reynolds numbers. It was found by Leontini and Thompson (2013) that the VIV response is very sensitive to the sharpness of the corners pointing in the cross-flow direction. Additionally, experimental results showing the VIV response of square prisms with several different orientations can be found for example in Nemes et al. (2012) and Zhao et al. (2018), which were also limited to small Reynolds numbers.
An also extensively studied geometry is that of a flat plate at a 90° angle of attack. However, the authors have not found VIV analyses of the flat plate undergoing linear displacements. Numerical analyses of the vortex shedding behind a static flat plate provide valuable information about the flow topology in the wake. In this regard, in Najjar and Balachandar (1998) and Hemmati et al. (2016) different intermittent vortex-shedding regimes were identified. Experimental results of vortex-shedding characteristics behind a static flat plate can be found in the classical work by Fage and Johansen (1927), and a more recent review can be found in Teimourian et al. (2018).
Analyses of the VIV response of other geometries include the experimental study performed by Nakamura and Hirata (1991) for a prism of a rectangular cross-section, where the lower end of the lock-in region is said to be associated with low-speed galloping behaviour, where galloping refers to the canonical cross-flow aeroelastic instability (not related to vortex shedding), with low-speed galloping being a special case of galloping occurring at inflow wind speeds below the VIV critical velocity and potentially interacting with it. Lo et al. (2023) experimentally obtained the VIV response of a prism with a thin elliptical cross-shape, and signs of combined VIV and galloping were identified.
The airfoil geometry at a 90° angle of attack is not one of the shapes canonically studied in the VIV literature. One of the first VIV studies that focused on airfoils is that of Skrzypiński et al. (2014), where the VIV response of a wind turbine airfoil at an angle of attack of 90° and a high Reynolds number , obtained with FSI simulations, was analysed, coupling CFD simulations to structural motion simulations with 1 degree of freedom (1-DOF), considering chordwise displacements, and 3 degrees of freedom (3-DOF), considering chordwise and flatwise displacements and torsional rotation. The FSI simulations were performed with the unsteady Reynolds-averaged Navier–Stokes (URANS) turbulence-modelling approach on a two-dimensional (2D) airfoil model and with the delayed detached-eddy simulation (DDES) turbulence-modelling approach on a three-dimensional (3D) airfoil extruding one chord length. As a main conclusion, the authors found negative aerodynamic damping with both approaches at certain wind speed intervals, indicating the possible existence of lock-in behaviour in airfoils. For both cases, it was found that, when resonance occurred, the edgewise vibrations dominated over the flatwise and torsional vibrations. For the DDES case, the lock-in range obtained did not agree well with the Strouhal number obtained from a static simulation. Lian et al. (2023b) extended the 1-DOF URANS 2D airfoil FSI analysis of Skrzypiński et al. (2014) to study the effect of the structural damping value on the VIV response. More recently, the same authors continued this line of work by including results from a 3D detached-eddy simulation (DES) modellization of the moving airfoil with different damping values (Lian et al., 2023a). A limited number of experimental results of the VIV response of airfoils have also been performed, such as those by Benner et al. (2019) and Iyer (2023), but at Reynolds numbers much smaller than those typical of wind turbine airfoil flows.
The case of a full wind turbine blade FSI response has been simulated (Heinz et al., 2016; Horcas et al., 2022; Grinderslev et al., 2023), showing that the full blade is also susceptible to VIV, at least under constant inflow conditions. To the authors' knowledge, no numerical studies on the VIV response of wind turbine blades or airfoils have been made with a turbulent inflow velocity field. To the best of the authors' knowledge, no experimental results of full wind turbine blades undergoing VIV have been reported. Despite the extensive existing literature on VIV, characterizing the VIV response of a stopped wind turbine blade remains a challenging task. A large gap exists between the insight obtained from analyses of the airfoil VIV response and from simulations of the full wind turbine blade (Horcas et al., 2022).
The parameters affecting blade VIV include, among others, the Reynolds number, inflow turbulence characteristics, spatial heterogeneity (wind shear, blade twist, chord length, mass and stiffness distributions, flow relative inclination, etc.), cross-sectional shape (airfoil type, angle of attack, surface roughness, etc.), structural properties (natural frequencies, structural damping, etc.), and the presence of other concurrent forces or initial vibration conditions (due to the existence of multiple stable limit cycles). The effect of some of these parameters may be obtained from analyses of sectional models, whereas others will require analyses of the full blade. An additional layer of complexity is added when considering the interaction between more than one aeroelastic body, as would be the case of a wind turbine. The blade dynamics can interact with the tower dynamics, and the blades can interact with each other both structurally and aerodynamically. The multi-body problem has been studied extensively for multiple cylinders (Yu et al., 2024) and only recently for a whole wind turbine rotor (Pirrung et al., 2024) and for rotor–tower interactions (Ludlam et al., 2024). Thus, characterizing the effects on blade VIV of this large parameter space, whether to understand the phenomena or to define useful simplified models, will involve a combination of simulation approaches with different levels of fidelity.
It is crucial to have a good understanding of the capabilities and limitations of the different levels of simulation fidelity in characterizing VIV. To this end, the present work analyses the difference in vortex-shedding flow and VIV response of a wind turbine airfoil between a URANS 2D case and a DDES case for an extruded section of one spanwise chord length. The DDES 3D case is a higher-fidelity approach but much more computationally expensive. Such an analysis has been presented in the early work of Skrzypiński et al. (2014), but the short length of the time series they simulated meant that some of the vortex-shedding flow features were not observed, leading to a potentially inaccurate characterization of the Strouhal number for the 3D DDES case and possibly affecting the comparison of the VIV response between the two approaches. These potential shortcomings were replicated in the subsequent work by Lian et al. (2023a). The present work complements and extends those by Skrzypiński et al. (2014) and Lian et al. (2022, 2023a). In this work, the simulation of the static-airfoil vortex shedding for a longer time series and a more robust characterization of the VIV results have allowed for a novel comparison of the VIV response between 2D and 3D simulations. In Skrzypiński et al. (2014) and Lian et al. (2023a), the authors performed static 3D airfoil simulations with a length of 168 and about 260 non-dimensional time units, respectively. For the present work, 1200 non-dimensional time units are simulated for the static 3D case. This results in the detection of multiple intermittent flow regimes associated with different Strouhal number values, which was not possible with shorter simulation times. Furthermore, in Skrzypiński et al. (2014) the presented quantitative comparison between their 2D and 3D VIV simulations is based on the maximum amplitude reached by the airfoil after a non-dimensional time of 100 units, which is not nearly enough time for the maximum amplitude to be reached, thus making this comparison very sensitive to the initial transient of the simulation. Similarly, in Lian et al. (2022) the VIV amplitude results are shown after 100 non-dimensional time units, which again makes it difficult to perform any subsequent comparisons. In the present work, the VIV responses are compared using the initial amplitude growth rate, which is a robust metric of the VIV development even for relatively short time series (300 non-dimensional time units in this work). This enables reproducible comparisons by other authors and methods. These two extensions to the previous works result in the most objective comparison between 2D and 3D simulation results to date. A particular novelty is the level of agreement found between these two simulation approaches for the VIV response inside the lock-in range. Note that these difficulties in characterizing the VIV response arise because of the computational cost of performing CFD simulations of the flow at large Reynolds numbers, so other results cited in this work may not suffer from these shortcomings. The results and methodology presented here may serve as a guide for future comparisons and for simulations where the simulation time is considerably limited.
The present work is organized as follows. In Sect. 2, the simulation methodology is described; first, the CFD setup is given in Sect. 2.1, and then the structural system parameters and solver are described in Sect. 2.2. In Sect. 3, the simulation results are shown and discussed. This section is divided into five parts; the first part is Sect. 3.1, which gives a direct comparison of previously published results against a reproduction of said results employing the present solver and procedure, with the aim of verifying the proposed implementation. Section 3.2 presents a discussion on the computational cost of the simulations, as well as a mesh sensitivity analysis. In Sect. 3.3, the results from static-airfoil simulations are investigated. In the next part of the results section (Sect. 3.4), the free-to-move airfoil case is analysed. Lastly for the results, in Sect. 3.5, the findings from the static and free-to-move airfoil sections for the 3D case are investigated via flow field visualizations. Finally, the conclusions of the present work are reported in Sect. 4. Having a robust characterization of vortex shedding and VIV, through affordable CFD simulations, allows for the use of the results obtained in the development and calibration of engineering models, for example in the manners proposed by Kurushina et al. (2018) and Rigo et al. (2022). This is a crucial step if VIV is to be considered during the wind turbine design stages.
In this section, the computational setup of the airfoil FSI simulations performed is described. Each FSI simulation consists of two coupled parts, a CFD simulation part, described in Sect. 2.1, and a structural simulation part, described in Sect. 2.2.
Simulations of both a 2D airfoil and the same airfoil extruding one chord length in its spanwise direction (3D) are performed. This spanwise length is chosen as a compromise between the computational cost of the simulations, the lateral boundary condition effect and the spanwise discretization. Analyses of the effect of the spanwise length on the airfoil vortex shedding can be found in Skrzypiński et al. (2014) and Lian et al. (2023a), where in both of these works a one-chord spanwise length is deemed a good compromise and used for subsequent VIV analyses.
The airfoil chosen is the DU96-W-180, which has a relative thickness of 18 % and was designed for wind turbine applications at the Delft University of Technology (Timmer and van Rooij, 2001). The VIV response of this particular airfoil has been previously analysed by Skrzypiński et al. (2014), Hu et al. (2021) and Lian et al. (2022, 2023a, b, 2024). All the simulations are performed at an angle of attack of α=90°, with a constant velocity inflow and with a chord-based Reynolds number in the range .
The simulation solver employed is MaPFlow, developed at the Laboratory of Aerodynamics of the National Technical University of Athens (NTUA), which includes a finite-volume compressible CFD solver, offering URANS and DDES turbulence-modelling approaches (Papadakis, 2014; Diakakis, 2019). MaPFlow has been validated in code-to-code comparisons (Sørensen et al., 2016; Prospathopoulos et al., 2021), for the VIV problem of the circular cylinder (Papadakis et al., 2022) and for the vortex shedding behind the trailing edge of flatback airfoils (Papadakis et al., 2020; Papadakis and Manolesos, 2020; Manolesos and Papadakis, 2021). The solver used in the present work is accurate to the second order in space and time.
2.1 CFD setup
Two different turbulence-modelling approaches are employed in the CFD simulations, namely the unsteady Reynolds-averaged Navier–Stokes (URANS) equations with the k−ω shear stress transport (SST) two-equation turbulence model (Menter, 1994) for the 2D simulations and the delayed detached-eddy simulation (DDES) also with the k−ω SST model for the 3D simulations. The two different configurations are identified as “URANS-2D” and “DDES-3D”, respectively. The boundary layer is assumed to be fully turbulent in both configurations.
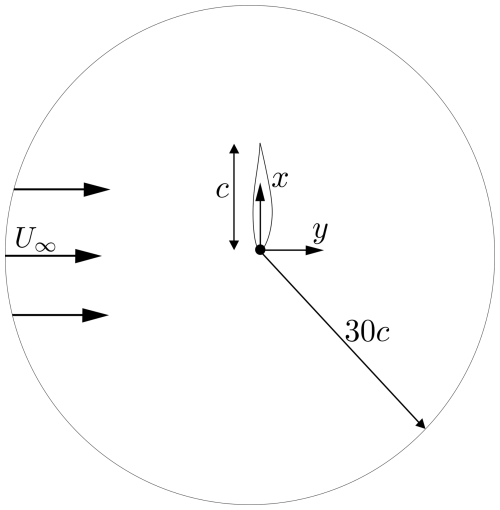
A sketch of the computational domain used in the URANS-2D simulations is shown in Fig. 1. This computational domain consists of a circular disc in the x–y plane, centred at the airfoil leading edge, with the x direction aligned with the airfoil chord line, pointing towards the trailing edge. The y axis is perpendicular to the chord, pointing downstream. The disc has a radius of 30c, where c is the airfoil chord length. In the case of the DDES-3D simulations, the computational domain is the same but extruded one chord in the spanwise direction, becoming a cylinder of height c in the z direction.
The edge of the disc in the 2D case and the lateral surface of the cylinder in the 3D case act both as mass flow inlet–outlet boundary conditions. The 30c disc radius ensures a blockage ratio under 2 %. The airfoil surface boundary condition is set to a no-slip wall. For the 3D case, a periodic boundary condition is set to the two end faces of the cylindrical domain.
The 30c domain radius is in line with the previous work by Skrzypiński et al. (2014), and it has been checked to ensure a blockage ratio under 2 %. In the present implementation, the solver employs the method of Riemann invariants at the far field so that the freestream conditions are more accurately prescribed.
For the 2D simulations, the domain is discretized using a structured O-type mesh. The number of grid points over the airfoil is 256, being more densely distributed around the leading and trailing edges. In the far field, i.e. at the disc edge, the 256 grid points are evenly distributed. In the radial direction, the mesh is discretized into 128 grid points, concentrating them close to the airfoil surface to obtain a first layer height which ensures a value of . The total number of cells in the mesh of the 2D simulations is thus 32 768. For the 3D simulations, the domain is also discretized using a structured O-type mesh, with the same number of mesh elements along the airfoil surface as in the 2D case, which is 256. In the radial direction, though, a finer discretization of 384 grid points is employed in the 3D case, which also ensures a first layer height of . In the spanwise direction, the mesh is extruded one chord length and is discretized into 128 equispaced grid points. The total number of elements in the mesh of the 3D simulations is thus about 12.6 million. The structured meshes files read by MaPFlow have been created with the publicly available code structAirfoilMesher (Diakakis, 2023). A close-up view of the meshes around the airfoil can be seen in Fig. 2, were panel (a) shows the 2D mesh and panel (b) shows some details of the 3D mesh, namely an oblique view of the mesh over the airfoil surface together with a slice perpendicular to the spanwise direction.
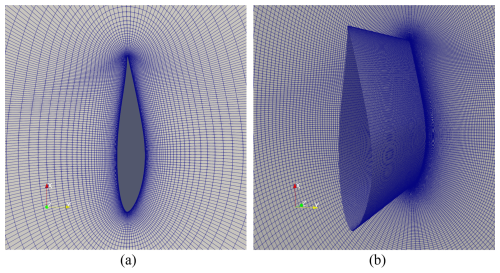
Figure 2Visualization of the CFD meshes employed. (a) Close-up view of the mesh around the airfoil used in the URANS-2D configuration. (b) Close-up view of the surface mesh and cross-sectional slice at one end of the mesh, around the airfoil used in the DDES-3D (aspect ratio of 1) configuration.
The mesh topology and discretization have been chosen to be similar to those from closely related publications (Skrzypiński et al., 2014; Lian et al., 2023a), for better comparability. Multiblock or unstructured meshes, where the wake can be more efficiently refined, may be preferable for vortex-shedding simulations. In the present work, the mesh is refined as much as possible at the near wake considering the computational cost of the simulations.
The non-dimensional time step of all CFD simulations is , which results in about 800 time steps for each vortex-shedding period. A maximum of 50 inner iterations per time step are employed in the URANS-2D case, and a maximum of 10 are employed in the DDES-3D case.
2.2 Structural dynamics system setup
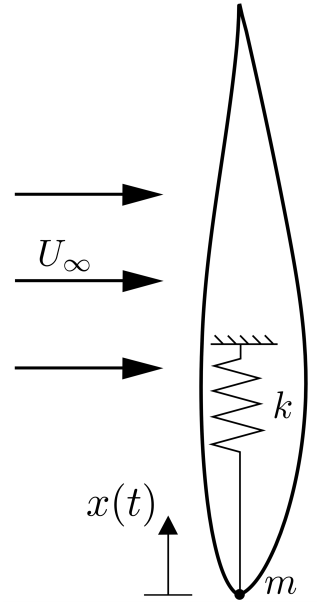
In the present FSI simulations, the airfoil is allowed to move freely (i.e. without an imposed motion) along its edgewise direction and without deformation. The CFD solver is tightly coupled to a 1-degree-of-freedom lumped-element dynamical system, without damping, of the form
where m is the mass per spanwise unit length of the airfoil; k is the stiffness constant per unit length; is the edgewise acceleration of the airfoil, with x as its displacement; t is time; and l is the lift force per unit length, computed as the edgewise projection of the integral of the pressure and viscous stress fields over the airfoil surface, as obtained from the CFD simulation. A schematic representation of this dynamical system is shown in Fig. 3.
In all simulations, the airfoil chord is set to c=1 m. The mass per unit length value is set to m=40 kg m−1, and the stiffness constant per unit length is defined as k=20 808 N m−2. Both the URANS-2D and DDES-3D dynamical models have a structural natural frequency of Hz and a mass ratio of , where ρ∞ is the fluid density at the inlet. These structural properties are in line with those used in previous works (Skrzypiński et al., 2014; Lian et al., 2022, 2023a, b), which have been defined to be representative of the dynamics of a realistic wind turbine blade. Note that the most relevant parameters for the VIV response are the mass ratio, which is similar to that of wind turbine blades (which the authors estimate to be in the range ), and the ratio between the structural natural frequency and the vortex-shedding frequency, which is studied parametrically in the present work.
The structural damping is also a relevant parameter in VIV but is set here to 0 to give conservative results if used to inform structural design engineering models. As stated in the Introduction (Sect. 1), in-line motion has little effect on the VIV response, allowing for the analysis of the present simplified one-dimensional structural model, especially given the relatively large aerodynamic damping expected in the flapwise direction. The present results of a 2D and a short-aspect-ratio 3D case can be used to inform 2D or lumped-element engineering models of the airfoil VIV response (e.g. using the procedure in Rigo et al., 2022), but additional 3D data would be needed to predict the response of a full wind turbine blade under realistic conditions, due to spanwise non-homogeneous structural, aerodynamic and inflow properties.
The dynamic equation is solved iteratively for each CFD solver time step using the Newmark-beta method (Newmark, 1959) with a convergence criterion for the residual acceleration between two iterations of . More details on the FSI coupling implementation in MaPFlow can be found in Papadakis et al. (2022). The motion calculated by the structural solver is passed to the CFD solver as a whole-grid-position update, so no mesh deformation algorithm is required.
A general overview of this section is now provided. First, the solver and procedure used here are evaluated by comparing with results from the literature (Sect. 3.1). Following this comparison, a new set of simulations is performed for a more comprehensive characterization of the vortex shedding and VIV response of the airfoil. Prior to analysing the new simulation results, a discussion on their computational cost is presented in Sect. 3.2, together with a mesh sensitivity analysis of the URANS-2D simulations. The simulations performed are grouped into static-airfoil simulations (Sect. 3.3), with which the vortex-shedding mechanisms are investigated, and free-to-move airfoil simulations (Sect. 3.4), where several simulations are needed to characterize its lock-in response. Section 3.5 presents an investigation connecting the findings from the 3D static case and the moving airfoil results, via flow field visualizations.
3.1 Comparison to previously published results
To verify the implementation of the FSI solver, previously published results by Skrzypiński et al. (2014) and Lian et al. (2022) are used for comparison. The focus is on 2D URANS VIV cases.
The parameter used for the analysis is the maximum displacement of the airfoil for each simulation (multiple simulations are performed to characterize the lock-in range). In Skrzypiński et al. (2014), these values are provided for 100 non-dimensional simulation time units () and are normalized with the maximum amplitude from all simulations such that , where is the non-dimensional natural oscillation period, which coincides with the widely used reduced velocity . The comparison of these published results against those obtained with the present implementation, for an identical setup, are shown in the left panel of Fig. 4. For the present results, the non-dimensional time used is 160 units rather than 100 to compensate for the slight differences in the VIV transient.
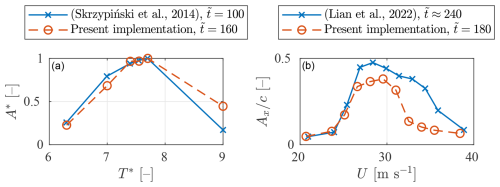
Figure 4Comparison of results from the literature replicated with the present implementation. (a) For the comparison with Skrzypiński et al. (2014), the maximum amplitudes are shown normalized with their highest value for each case, after the non-dimensional simulation times depicted, as a function of the reduced velocity. (b) In the Lian et al. (2022) case, the non-dimensional maximum amplitudes are shown as a function of the inflow wind speed.
In Lian et al. (2022), the amplitude is normalized with the chord, and the values reported correspond to approximately 240 non-dimensional time units. This time is found to be enough to reach a state where the amplitude is growing at a steady rate. However, the actual maximum VIV amplitude is far from being reached, so the comparison is still very sensitive to the transient behaviour. The right panel of Fig. 4 shows the comparison for this case, where the present results correspond to a non-dimensional time of 200 units. The comparison is fairly good in both cases shown in Fig. 4, despite the limitations mentioned above. It is worth noting that, as per the simulations performed in the present work, the true maximum amplitude is only reached after about 550 non-dimensional time units and has a value of about 1.5 chords (this is visible in Fig. 11).
There are some differences between the setups used in this comparison and the setup presented in Sect. 2. Namely, in Skrzypiński et al. (2014), to traverse the lock-in range, the value of the stiffness constant in the structural model is modified for each simulation. On the other hand, in Lian et al. (2022) and the present work, it is the inflow wind speed that changes. The only implication of this difference is that in Skrzypiński et al. (2014) all cases are run for the same Reynolds number (), whereas in the other two cases the Reynolds number is a function of the inflow wind speed. Additionally, in Lian et al. (2022) the non-dimensional time step for the VIV simulations is defined as , which goes from 0.06 to 0.11 for the simulated velocity range. In Skrzypiński et al. (2014) and the present work, the non-dimensional time step is for all simulations (as stated in Sect. 2.1). The present authors verified this time step through preliminary sensitivity analyses.
One of the motivations of the present work was to find more suitable metrics for the comparison between cases, e.g. different tools, different modelling choices, etc., in particular to enable reproducible results when the simulations are too short to characterize the converged (cyclostationary) behaviour. One such metric is presented in Sect. 3.4.2.
3.2 Computational cost and mesh sensitivity analysis
The URANS-2D simulations were carried out on the Magerit-3 supercomputer at CeSViMa (Universidad Politécnica de Madrid), and the DDES-3D simulations were carried out on the MareNostrum 4 supercomputer at the Barcelona Supercomputing Center. Details on the computational cost of the simulations presented hereafter are shown in Table 1. These data show the extent to which simulations with the URANS-2D approach take shorter to run and are much less resource-intensive than with the DDES-3D approach.
Table 1Details on the computational cost of the simulations performed. Nsteps refers to the number of time steps run, NCPUs is the number of CPUs used in parallel via the message-passing interface (MPI), Twall-clock is the wall-clock time for a single simulation and Nsims is the number of simulations of each type (i.e. the number of different inflow wind speeds).

Apart from the 2D mesh described in Sect. 2.1, two finer meshes have been tested to check the sensitivity of the URANS-2D results to the mesh resolution. A mesh called “medium” is created by doubling the resolution over the airfoil and in the radial direction, for a total of 4 times as many elements, i.e. about 1.3×10⁵ cells. The third mesh, called “fine”, is defined by making the mesh 3 times finer in both directions, for a total of about 3×10⁵ cells. The Courant number is preserved in all simulations by reducing the time step accordingly. The 2D mesh presented in Sect. 2.1 and used throughout the rest of the present work is named “coarse”.
The inflow velocity considered for the sensitivity analysis is such that the vortex-shedding frequency matches the structural frequency, so large vibrations are expected. The results obtained and compared are the maximum of the airfoil non-dimensional motion displacement , the standard deviation of the lift coefficient and the mean drag coefficient . These values are calculated using a time series length of 50 non-dimensional time units, starting after the wake development non-dimensional transient time has passed. These are canonical results of the VIV response (Tanida et al., 1973), although, as will be discussed later, these quantities do not always allow for a robust characterization of the VIV response, as they are very sensitive to the initial transient and the time interval used to compute them. An alternative metric will be proposed in Sect. 3.4.2. These canonical quantities of interest are employed for the present mesh sensitivity analysis nonetheless, for the sake of illustration and given that the similarity in the results allows for a sensible comparison.
The time series results with the three meshes are plotted in panel (a) of Fig. 5, and the percentage differences between the results obtained with the coarse and medium meshes with respect to the fine-mesh results are shown in panel (b) of the same figure. It can be observed that the results for the three meshes are quite similar for the three quantities analysed. The use of the coarse-mesh setup is considered a good compromise between accuracy and computational cost. A simulation with the medium-mesh setup takes about 8 times longer to run than with the coarse-mesh setup, and a simulation with the fine mesh takes about 18 times longer. Note that this type of sensitivity analysis for the DDES-3D case would be much more computationally expensive to run. The mesh chosen for the DDES-3D simulations is finer than the URANS-2D mesh, as explained in Sect. 2.1, and is in line with the mesh previously used by Skrzypiński et al. (2014).
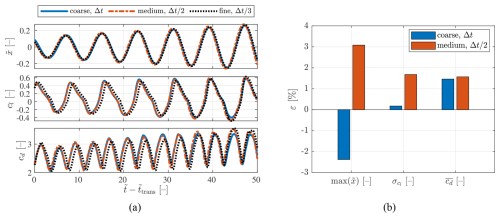
Figure 5(a) Time series segments of the airfoil non-dimensional displacement (top), lift coefficient (middle) and drag coefficient (bottom), for the three setups considered in the mesh sensitivity analysis. (b) Percentage difference in non-dimensional maximum displacement, standard deviation of the lift coefficient and mean drag coefficient, of the coarse and medium meshes with respect to the fine mesh. All cases correspond to URANS-2D simulations.
3.3 Static-airfoil case
The flow field around the airfoil in a static position is simulated to provide information about the vortex-shedding frequency. This configuration will be used as a reference for the analysis of the VIV response of the moving airfoil performed in the following sections. Two simulations are carried out at a Reynolds number , one for the URANS-2D model and one for the DDES-3D model.
3.3.1 Lift coefficient frequency content
The vortex-shedding frequency can be approximated by the frequency of the lift force fluctuation (Bishop and Hassan, 1964), typically obtained as the peak of its power spectral density (PSD) function.
In the present work, the lift coefficient fluctuation is obtained as , where , with cl(t) being the lift coefficient and being its mean value, and U∞ is the constant inflow velocity. The PSD of this zero-mean lift coefficient time series , where f is frequency, has been calculated using the Blackman–Tukey estimator, with a Hamming window, and with the maximum lag used for the autocovariance function estimation being equal to the time series length minus 1. The non-dimensional form of this PSD is analysed and shown in terms of the non-dimensional frequency . One-thousand frequency points between and are employed, after checking that almost all of the energy is contained within these frequencies from the PSD of the whole frequency range. The PSD estimation has been performed using the open-source toolbox mVARbox (Gallego-Castillo et al., 2024). The initial period of the time series associated with the transient wake development, spanning the non-dimensional time interval , is excluded from all statistical calculations, including the aforementioned PSD and mean lift coefficient. After excluding the transient period, the total simulation period for the URANS-2D case is 540 non-dimensional time units, and for the DDES case it is 1100.
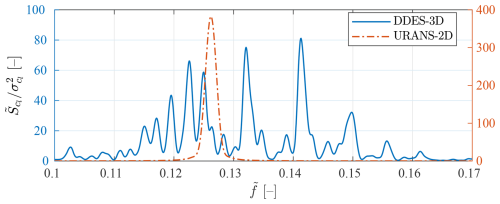
The PSD of the lift coefficient fluctuations for both modelling cases, normalized with the variance of the lift coefficient , are compared in Fig. 6. Two y axes are shown in the figure, with the left one corresponding to the DDES-3D case and the right one corresponding to the URANS-2D case, to accommodate for the different range of variation in the PSD values in both cases. For the URANS-2D case, almost all of the energy is concentrated around a single peak found at a non-dimensional frequency of about 0.126, whereas the DDES-3D PSD shows multiple peaks at clearly separated frequencies. The Strouhal number for the URANS-2D case is thus approximated as StU=0.126. On the other hand, for the DDES-3D case there is no clear dominant shedding frequency. The energy is spread out in multiple peaks in the range [0.11,0.16], so the authors consider it inappropriate to report a single Strouhal number value for this case. In Schewe (1983), it was found experimentally that for the case of a circular cylinder in the upper transition regime , no clear single vortex-shedding frequency could be identified in the lift coefficient fluctuation PSD. It was suggested that, in this regime, the flow experiences multiple unstable configurations, although no evidence could be given of a relationship between the PSD frequency peaks and the lift and drag coefficient behaviour. In Lehmkuhl et al. (2014), large-eddy simulations (LESs) of a static circular cylinder at different Reynolds numbers were performed, and they observed that for the case in the critical regime there were two different vortex-shedding frequencies in the PSD of the cross-stream velocity fluctuations. They noticed that one of the frequency peaks matched the frequency they obtained from a simulation in the subcritical regime and the other peak matched the frequency they obtained in the supercritical regime. This duplicity in the vortex-shedding frequency was attributed to a switching between two flow configurations, arising from the asymmetry in the flow characteristic of the critical regime. Recently, in Ellingsen et al. (2022) two different vortex-shedding frequencies were identified in the PSD of the lift coefficient of a circular cylinder, obtained from wind tunnel experiments. These two frequencies were observed in the whole range of Reynolds numbers studied, , which belong to the supercritical regime, and they were associated with two different spatial patterns of the cylinder surface pressure. It was not determined whether the two spatial patterns happened simultaneously or were intermittent. As far as the present authors are aware, the existence of multiple peaks of similar energy in the PSD of the lift coefficient, which leads to ambiguity in the Strouhal number definition, has not been reported before for the case of an airfoil.
3.3.2 DDES-3D flow regimes
To compare the time evolution of the aerodynamic forces acting on the airfoil predicted by the URANS-2D and the DDES-3D approaches, the time series of the lift and drag coefficients (cl and cd, respectively) for both models are shown together in Fig. 7. The results are shown for a non-dimensional time interval just to improve the visualization of the fluctuation patterns. It is noticeable that, for the URANS-2D case, the lift and drag time series are highly periodic. For the DDES-3D case, the time patterns of both coefficients are more irregular. Specifically, the lift coefficient predicted with the DDES-3D approach experiences amplitude changes, and the drag coefficient shows simultaneous changes in amplitude and mean value. These low-frequency modulations are seen to be of various degrees of intensity and of different duration along the whole time series .
In Lisoski (1993), experiments were performed for flat plates at 90°, with different aspect ratios, and Reynolds numbers between 3000 and 9000, and they reported lift and drag coefficient time patterns similar to those presented in Fig. 7 for the DDES-3D case. Direct numerical simulations (DNSs) were performed by Najjar and Balachandar (1998), for a flat plate at 90°, both in a 2D configuration and a 3D configuration with an aspect ratio AR=2π and for a Reynolds number Re=250 in both cases. The authors presented a drag coefficient time series for their 2D case, which is highly periodic, like the URANS-2D case shown in Fig. 7. Their 3D simulations of the flat plate show a drag and lift time series with irregularities, similar to the ones evidenced in the DDES-3D results presented here. This may imply, leaving out the large difference in Reynolds numbers, that the regular vortex shedding observed for the URANS-2D case is a consequence of the 2D nature of the simulation and not only of the modelling of turbulence. Preliminary results by the present authors showed that a URANS-3D case was not able to predict the irregular shedding behaviour observed in the DDES-3D case, so it is considered that both a 3D setup and large-eddy-resolving turbulence modelling are needed to predict the intermittent shedding presented here. Najjar and Balachandar (1998) also explored the mean drag force behaviour during the different low-frequency cycles and identified two main flow regimes, the high-drag (H) regime and the low-drag (L) regime. It was found that during the H regime the shed vortical structures are more coherent. More recently, an additional regime called M was proposed by Hemmati et al. (2016), occurring between regimes H and L.
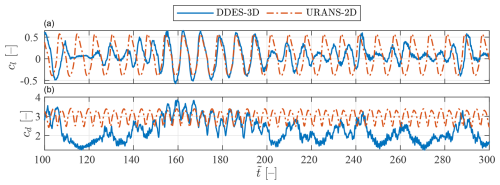
Figure 7Detail of the (a) lift coefficient and (b) drag coefficient as a function of non-dimensional time, for both the DDES-3D and the URANS-2D static simulations of the DU96-W-180 airfoil.
In Fig. 7 it can be seen that there are some time segments of varying duration where the behaviour of the aerodynamic coefficients predicted by the URANS-2D and the DDES-3D configurations are similar, in terms of not only amplitude and mean values but also frequency, e.g. during non-dimensional times 160 to 200 and in the vicinity of and . These time segments might correspond to the high-mean-drag-flow H regime. Najjar and Balachandar (1998) describe the H regime as one with coherent spanwise vortices, whereas in the L regime these vortices are broken apart. It seems reasonable then that the 2D simulation results are more similar to the 3D results during the high-drag regime, as 2D simulations may be considered spanwise uniform. A visual confirmation of this behaviour is given later on, in Sect. 3.5.
The existence of different flow regimes, as is observed in Fig. 7, each potentially having different characteristic vortex-shedding frequencies, constitutes one possible explanation for the multiple peaks observed in Fig. 6, for the lift coefficient PSD obtained from the DDES-3D simulation. To further explore the idea that the vortex-shedding frequency changes as time progresses, the time evolution of the frequency content of the lift coefficient is quantified, utilizing the continuous wavelet transform (CWT) of the lift coefficient fluctuation. The bump wavelet with 48 voices per octave in the range is employed. The use of CWT to inspect the time–frequency content of the aerodynamic forces in a VIV analysis has been previously implemented, for example by Zhao et al. (2022).
In Fig. 8, the CWT result is visualized using the scalogram representation (bottom panel), along with the whole lift coefficient time series (top panel). The scalogram shows the estimation of the instantaneous lift coefficient frequency content on the y axis, against the non-dimensional time on the x axis. Brightness is used to quantify the magnitude of the CWT normalized using the L1 or Manhattan norm, which serves as an indicator of the lift coefficient fluctuations amplitude content at each frequency (Lilly, 2017). A solid blue line is plotted on top of the scalogram, marking the time evolution of the most energetic instantaneous frequency. In this scalogram, it is seen that the vortex-shedding frequency varies notably as time progresses and that at any given time there is apparently just one dominant shedding frequency. It can be thus concluded that the PSD with multiple peaks observed in Fig. 6 is the result of individual vortex-shedding frequencies occurring at different time intervals. When comparing the scalogram with the lift coefficient time series, which share the x axis, it is observed that the low-amplitude oscillations of cl occur at a higher frequency than the high-amplitude ones. These variations may be attributed to the switching of flow regimes. Therefore, the H regime, characterized by a highly coherent shedding pattern and large amplitudes of the lift coefficient fluctuations, would present lower shedding frequencies than the other regimes. It is worth noting that the PSD previously shown in Fig. 6 has many distinct peaks, so it seems that there is not a one-to-one correspondence between vortex-shedding frequency and flow regime. This non-correspondence between frequency and regime is also observed in the scalogram, in the non-dimensional time interval , identified with the H regime from the cd time series not shown here, where the vortex-shedding frequency is seen to decrease continuously as time passes. The dashed line shown in the scalogram in Fig. 8 corresponds to the Strouhal number obtained with the URANS-2D results and is seen to match reasonably well with the vortex-shedding frequencies observed during the H regime for the DDES-3D configuration. This similarity is in accordance with the observation made above regarding Fig. 7 that the time series for both configurations matched well qualitatively in the H regime.
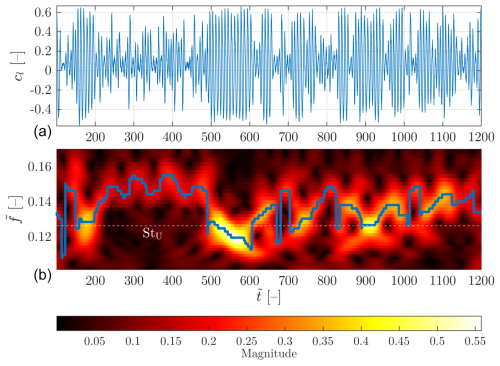
Figure 8(a) Lift coefficient time series and (b) non-dimensional scalogram of the lift coefficient for the DDES-3D static case. In the scalogram, the thick solid blue line (cyan) marks the frequency bin with the highest magnitude at each time bin and the dashed horizontal line (black) indicates the Strouhal number obtained from the URANS-2D static case.
The H regime may be triggered in the DDES-3D case as a consequence of increased coherence due to the spanwise boundary condition influence, given the short length of the 3D model (Wu and Sharma, 2020). Simulating models with higher aspect ratios would reduce the influence of the spanwise boundary condition, at the cost of increased computational resources for the same mesh density. Nonetheless, this intermittently increased spanwise correlation of the lift forces may occur anyway, either spontaneously or due to external conditions like airfoil motion or coherent turbulent structures. In the opinion of the authors of the present paper, more research on this topic is required to better understand this complex phenomenon.
3.3.3 Strouhal number analysis
To further assess the ambiguity in the Strouhal number definition for the DDES-3D configuration, a sensitivity analysis has been performed concerning the length of the time series used to calculate the PSD of the lift coefficient fluctuations . In Fig. 9, the non-dimensional frequency corresponding to the highest peak in the PSD of the lift coefficient fluctuations is plotted as a function of the non-dimensional duration of the time series used to compute this PSD . That is, as increases, a longer part of the time series is used, until for the last value the whole series is employed. It is observed that, while for the URANS-2D case the frequency quickly converges to its final value, for the DDES-3D case there are significant frequency jumps and no signs of convergence. The percentage difference in the PSD peak frequencies for the DDES-3D case observed in Fig. 6 as with respect to the converged URANS-2D frequency StU=0.126 is in the range [−3 %, 20 %]. Note that the Strouhal number value is typically employed in engineering models for the prediction of the vortex-induced forces and VIV response of a body, as mentioned in Sect. 1.
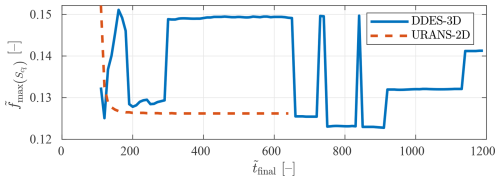
Figure 9Non-dimensional frequency of the highest peak in the PSD of the lift coefficient fluctuations, as a function of the total time used to calculate the PSD, for the DDES-3D and URANS-2D static configurations.
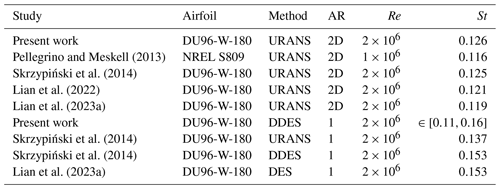
In Table 2, a list of Strouhal numbers reported in the literature for wind turbine airfoils at α=90° using different CFD modelling options is presented. The turbulence-modelling approach is specified under “Method”, and the aspect ratio is under “AR”. The St number obtained in the present work with the URANS-2D approach agrees reasonably well with those collected from the literature shown in Table 2. The range of Strouhal values obtained in the present work with the DDES-3D approach encompasses the previously reported Strouhal number values shown in Table 2, including those from URANS, DES and DDES simulations, both 2D and 3D. Both in Skrzypiński et al. (2014) and Lian et al. (2023a), it is mentioned that their lift coefficient PSDs, for the DES and DDES cases, show energy content at more than one frequency but that there is a single dominant peak, which they report as the Strouhal number. The total non-dimensional simulation time used to determine the Strouhal value in Skrzypiński et al. (2014) is 168 non-dimensional time units, and in Lian et al. (2023a) it is reported as “over 40 vortex shedding periods”, where 40 periods would correspond to a non-dimensional simulation time of approximately 260 units. Both of these time series might be too short to allow for the detection of the multiple shedding frequencies observed in the present work. In Fig. 9, a value of about , very close to the Strouhal number of 0.153 reported in Table 2 for the DDES and DES 3D cases, can be seen prominently in the DDES-3D results, especially in the non-dimensional time interval . This means that if the present simulation had been of a length within that range, the highest peak in the PSD would have been found at the non-dimensional frequency . Furthermore, it has been confirmed that this peak would have been clearly dominant if the simulation had been run with a non-dimensional final time in the interval . But, as has been shown throughout this section, such a frequency value would not have been representative of the vortex-shedding flow behaviour in the present DDES-3D case.
Pellegrino and Meskell (2013)Skrzypiński et al. (2014)Lian et al. (2022)Lian et al. (2023a)Skrzypiński et al. (2014)Skrzypiński et al. (2014)Lian et al. (2023a)Table 2List of Strouhal number values reported for wind turbine airfoils at using different CFD models. Note that “2D” in the aspect ratio column means that the simulation is two-dimensional. In the case of “Present work” with DDES, a range of Strouhal numbers is given instead of a single value.
To further characterize the DDES-3D case vortex-shedding process, the PSD of the lift coefficient fluctuations has been fitted to a Gaussian function. This fitting, shown in Fig. 10, reveals that the energy of the vortex-shedding loading can be approximated as a narrowband process with a central frequency around . In panel (a) of Fig. 10, the Gaussian fit does not seem very appropriate, but changing the y axis to a logarithmic scale, as shown in panel (b), reveals that there is an underlying distribution of the spectral content which is well represented by the Gaussian fit. The narrowband process can be identified even better in panel (c), where a wider range of frequencies is shown in log–log axes; the PSD is seen to grow above its background values for a limited range of frequencies, even if distinct peaks exist inside this range. According to the analysis carried out in this work, the central frequency of this narrowband process appears to be more significant than the frequency of the highest peak, as it defines the underlying vortex-shedding process and is more robust to changes in the simulation time. Note that the simulation should be long enough to ensure convergence of the Gaussian-fit central frequency.
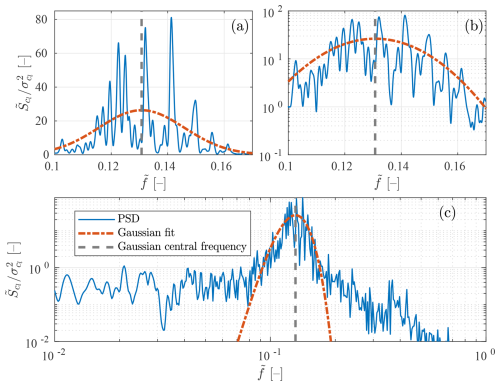
Figure 10Different representations of the normalized PSD of the lift coefficient fluctuations in the DDES-3D case, together with a Gaussian fit. (a) In linear axes, (b) in the logarithmic y axis and (c) in log–log axes and for a wider range of frequencies. The central frequency of the Gaussian fit is marked with a vertical line.
Approximating the vortex-shedding spectral content to a Gaussian has been done since early on by Vickery and Clark (1972) and is the basis of the spectral engineering models for the prediction of VIV (Vickery and Basu, 1983; Arunachalam and Lakshmanan, 2015). The Gaussian approximation was used to identify the Strouhal number from full-scale experimental data by Kurniawati et al. (2024). In all these cases, the Strouhal number is defined as the central frequency of the Gaussian fit.
Significant similarities and differences have been found between the static vortex shedding of the URANS-2D and DDES-3D cases, with the DDES-3D case exhibiting an intermittent behaviour which at times agrees remarkably well with the URANS-2D case. The spectral content of the DDES-3D lift coefficient is shown to be spread over a narrow range of frequencies, with distinct peaks within this range developing at different time intervals. These findings are used in the following sections to help interpret the VIV simulation results.
3.4 Free-to-move airfoil case
In this section, the fluid–structure interaction (FSI) response of the airfoil is simulated by coupling the CFD solver to the 1-degree-of-freedom elastic system solver, as described in Sect. 2, with the airfoil being free to move along its edgewise (chordwise) direction. Different simulations are performed, varying the inflow velocity in order to capture the airfoil response inside and outside the frequency lock-in range, as in Lian et al. (2022, 2023a, b). The URANS-2D FSI simulations are run at 15 different inflow velocities, for 1300 non-dimensional time units each, whereas the DDES-3D simulations, due to computational resources limitations, are run for 7 inflow velocities, for 300 non-dimensional time units each.
3.4.1 Non-dimensional frequency ratio definition
Typically, to present the results for the abovementioned different inflow velocities in a non-dimensional form, use is made of the ratio between the vortex-shedding frequency defined by the static-case Strouhal number and the structural natural frequency, i.e. , where , with the Strouhal number St being obtained from static simulations or experiments (Griffin et al., 1973; Lian et al., 2022). A ratio of 1 means that the vortex-shedding frequency, if the body were stationary, matches the structural natural frequency, corresponding to a classical-resonance situation. The vortex-shedding frequency obtained from a static case fSt is expected to approximate the actual vortex-shedding frequency of a free-to-move case when outside the lock-in range well. In the present work, for the URANS-2D case, the Strouhal number used to determine the frequency ratio StU=0.126 is obtained from the static CFD simulations, as reported in Sect. 3.3. For the DDES-3D case, it is argued in Sect. 3.3 that there is not a single Strouhal number for this configuration. Nonetheless, in the present work it is found that, by choosing a Strouhal number value of StD=0.132 for the DDES-3D case, the VIV response obtained with both approaches as a function of the frequency ratio is remarkably similar, as will be shown in the current section. This Strouhal number value of 0.132 matches one of the peaks obtained in the PSD shown in Fig. 6 and also coincides with the central frequency of the Gaussian fit shown in Fig. 10. It is also worth noting that this Strouhal number value is 13.7 % lower than the Strouhal value of 0.153 reported by the other authors shown in Table 2.
In what follows, different characteristics of the VIV response of the airfoil obtained with the URANS-2D and DDES-3D simulations will be compared, and the choice of this StD value will be discussed. The results will be presented in terms of the frequency ratio , where , referring to the URANS-2D and DDES-3D configurations, respectively, and is the vortex-shedding frequency calculated using the chosen Strouhal number value from the static simulations (StU=0.126 and StD=0.132).
3.4.2 Non-dimensional amplitude growth rate
One of the results that characterize the vortex-induced vibration response is the maximum amplitude of the airfoil displacement. In the present analysis, due to the large computational cost of the DDES-3D simulations, the simulated time was not long enough to get an accurate estimation of the airfoil displacement maximum amplitude. This computational time limitation is common to other studies. Some authors choose to show the maximum amplitude reached after a certain simulation time has passed and use this value for comparison between different cases (Skrzypiński et al., 2014; Lian et al., 2022). The present authors believe that this is not a good choice because the initial transients may be different for different simulations. It might also give an erroneous perception to the reader of the actual amplitude that would be reached if it is not very clearly stated that the simulations have not converged to a stationary amplitude value. As an alternative, in this work, it is proposed to employ the non-dimensional growth rate of the displacement amplitude as a characteristic of the VIV response. This metric can clearly indicate the VIV lock-in range by differentiating cases with almost no amplitude growth (out of lock-in) from cases with relatively large growth (lock-in). This metric is more consistent between different sets of simulations and does not require of long time series to be obtained.
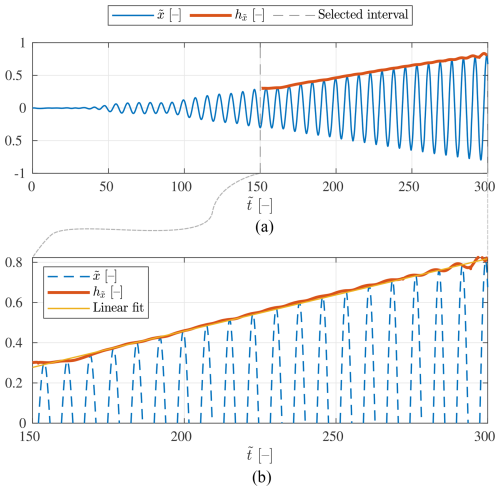
This non-dimensional growth rate of the displacement amplitude is defined as the slope of the straight line which fits a convenient time interval of the magnitude of the Hilbert transform of the non-dimensional displacement time series. Thus, to calculate the non-dimensional growth rate of the displacement amplitude, we first calculate the magnitude of the Hilbert transform of the time series of the non-dimensional displacement . The resulting time series is denoted . This time series can be employed as an approximation of the non-dimensional displacement envelope or amplitude (Zou et al., 2015). Then, a time interval of , corresponding to the initial displacement growth, is chosen. In the present work, the time interval has been selected after a visual inspection of the results. The same non-dimensional time interval has been chosen for all inflow velocities and both the URANS-2D and DDES-3D cases, namely . Finally, a straight line is fitted to this interval of the envelope, and the slope of the line is obtained. This slope, which is the approximation to the non-dimensional amplitude growth rate, is denoted .
The growth rate calculation process is illustrated in Fig. 11. Firstly, a time series of the non-dimensional displacement is shown in panel (a), together with the positive part of its Hilbert transform magnitude . Additionally, the selected time interval (, as mentioned before) is marked. Next, in panel (b) the same time series and envelope as those in panel (a) are shown cropped to the selected time interval, together with a straight line fitted to this portion of the envelope. The slope of this straight line is the non-dimensional amplitude growth rate , which is the metric proposed to determine the lock-in range and to compare the two modelling approaches studied. The same information as in Fig. 11, but for a DDES-3D case, is shown in Fig. 12. In this case, the time series is only 300 non-dimensional time units long, which can be seen to be enough to characterize the growth rate and thus the lock-in range, even if the maximum displacement amplitude has not been reached. The amplitude growth in all of the URANS-2D and DDES-3D simulations presented in the present work is approximated well by straight lines. VIV displacement responses with an initial growth rate which is largely nonlinear have been reported, e.g. in Derksen (2019) for a 2D cylinder with low mass ratio values.
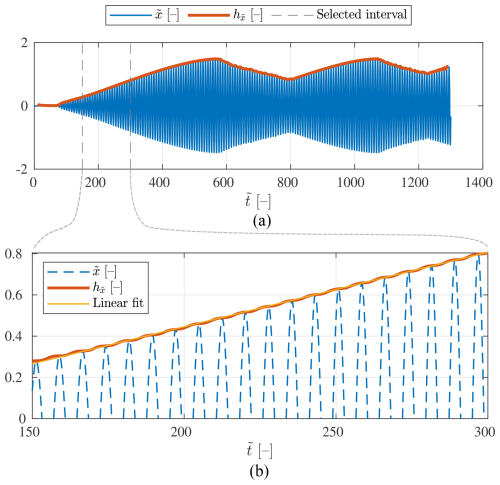
Figure 11Illustration of the amplitude growth rate calculation procedure. (a) Time series of the non-dimensional edgewise displacement along with, in a thicker line, the envelope of the time series calculated with the Hilbert transform . Additionally, the limits of the time interval selected for the linear fit to are marked with vertical dashed lines. (b) Time series of the non-dimensional edgewise displacement within the time interval selected for the linear fit, along with the estimated amplitude and the straight line fitted to in this portion of the envelope. The amplitude growth rate is defined here as the slope of the fitted line. All results are for a URANS-2D FSI simulation at .
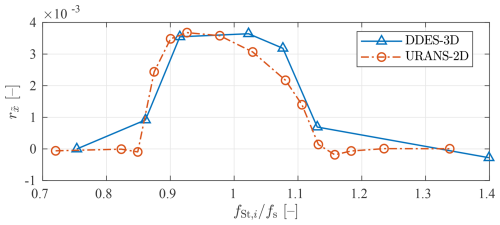
This procedure is followed for every simulation, i.e. for every frequency ratio , for both the URANS-2D and DDES-3D approaches. The resulting non-dimensional displacement amplitude growth rates are presented in Fig. 13. Both approaches predict growth rates close to 0 for small and large frequency ratios and a considerable increase in this parameter for frequency ratios around 1. This range of frequency ratios where the growth rate is appreciably higher than 0 is proposed as a measure of the lock-in range. Considering the results presented in Fig. 13, the lock-in range is established to be about , for both the URANS-2D and DDES-3D approaches. The results demonstrate that there is a very good agreement between the URANS-2D and DDES-3D predictions of the growth rate for all frequency ratios.
3.4.3 Aerodynamic coefficients
Some results that characterize the VIV response, other than the displacement behaviour, are the lift coefficient standard deviation and the mean drag coefficient . These two parameters are presented in Fig. 14, for both the URANS-2D and DDES-3D approaches, as a function of the frequency ratio. Note that due to the limited length of the time series obtained with the DDES-3D model, to make a fair comparison, the statistics for all simulations are calculated in all cases just for the non-dimensional time interval . The results from both models match to a high degree in the vicinity of the resonant frequency, i.e. inside the lock-in range, whereas large discrepancies appear for very small or very large frequency ratios. The higher lift coefficient standard deviation and mean drag coefficient values outside the lock-in range obtained with the URANS-2D approach may be attributed to the 2D character of these simulations, as is well known and documented (Mittal and Balachandar, 1995). The values predicted with the DDES-3D approach, outside the lock-in range, are about 42 % smaller than those predicted with the URANS-2D approach, whereas inside the lock-in range, this difference is reduced to about 8 %. Likewise, the values predicted with the DDES-3D approach, outside the lock-in range, are about 20 % smaller than those predicted with the URANS-2D approach, whereas inside the lock-in range, this difference is reduced to about 2 %.
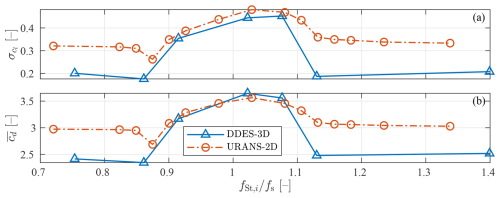
Figure 14(a) Lift coefficient standard deviation and (b) mean drag coefficient as a function of the ratio between the Strouhal-defined vortex-shedding frequency and the structural natural frequency, for the two modelling approaches. In both cases, the time series used to calculate these statistical parameters are limited to the non-dimensional time interval .
To further illustrate the similarities of the VIV airfoil response predicted by the URANS-2D and DDES-3D approaches inside the lock-in range, one example of the time series of the non-dimensional displacement and the aerodynamic coefficients cl and cd is shown in Fig. 15, cropped in time for better visualization. Note that the frequency ratio is not exactly the same for both models but similar enough to be comparable and well within the lock-in range. In this comparison, the x axis is the time t and not the non-dimensional time because inside the lock-in range the vortex-shedding frequency is locked in at the natural frequency of the structure fs, which is the same for both configurations. Therefore, the oscillation period is the same for both approaches and equal to , but the non-dimensional oscillation period is different for any given frequency ratio because the velocity at which this ratio is achieved depends on the Strouhal number chosen for each approach, which is different in the present work. In the comparison shown in Fig. 15, the time series predicted by both approaches happen to be in phase, but due to differences in the initial transients, this does not generally occur. Both the URANS-2D and DDES-3D approaches predict similar time series for , and . The similarity in the oscillation frequency was expected, as explained above. It was also expected from the results in Figs. 13 and 7 that the displacement growth rate, lift coefficient amplitude and mean drag coefficient would be similar. Additionally, it can be seen that the transitory behaviour of the lift and drag coefficients are also similar. In both approaches the lift coefficient amplitude is steadily growing with time, whereas the drag coefficient amplitude seems to be constant, while its mean value increases with time at a steady rate. The DDES-3D results show a slightly less periodic behaviour of both aerodynamic coefficients. The similarities of the aerodynamic coefficient time series inside the lock-in range are in contrast to the results previously shown in Fig. 7 for the static-airfoil case, where the differences were noticeably larger.
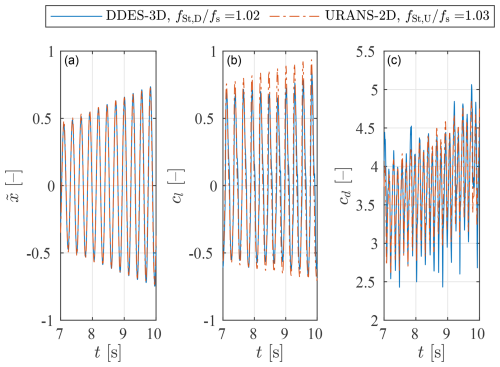
Figure 15Time series segment of the (a) airfoil non-dimensional displacement, (b) lift coefficient and (c) drag coefficient, for the two modelling approaches, at a similar ratio between the Strouhal-defined vortex-shedding frequency and the structural natural frequency inside the lock-in range.
To represent the relationship in time between the airfoil dynamics and the lift force, a phase plane is shown in Fig. 16, for both the DDES-3D and URANS-2D cases. The frequency ratios chosen (corresponding to the lock-in range) and the time series segment length shown ( s) are the same as those of Fig. 15. The left panel contains the phase plane of the non-dimensional displacement and the lift coefficient, where the time series are shown as lines evolving anticlockwise. Note that the lift force is defined as positive when pointing in the negative x direction. The right panel contains the phase plane of the lift coefficient and the non-dimensional airfoil velocity , where the time series are also shown as lines evolving anticlockwise. The aerodynamic power added from the flow to the airfoil motion can be defined as the product of the airfoil velocity times the aerodynamic force projected in the direction of motion (Skrzypiński et al., 2014). With the axis system used in the present work, energy is added to the airfoil when the lift coefficient has the opposite sign as the airfoil velocity. In the right panel of Fig. 16, the quadrants with the circled + sign correspond to time series segments where the fluid is adding energy to the airfoil motion and those with the circled − sign are time segments where the airfoil is losing energy. The shape of the phase plane can provide information about the phase difference between the two variables represented. In this case, the deviation from the purely elliptical shape means that the phase is changing within the duration of each oscillation period. This deviation is due to the not perfectly sinusoidal nature of the lift coefficient, which is often better modelled as a van der Pol type oscillator (Hartlen and Currie, 1970; Skop and Balasubramanian, 1997), resulting in the aforementioned time-dependent phase difference between lift and displacement or velocity. In both panels of Fig. 16, an excellent agreement is observed between the URANS-2D and DDES-3D cases at the magnitudes of the lift coefficient, non-dimensional displacement and non-dimensional velocity, as well as their relative phases.
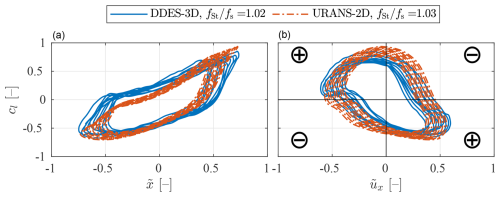
Figure 16Phase plane of (a) non-dimensional displacement and (b) non-dimensional velocity versus lift coefficient for simulation time between t=7 and t=10 s, for the two modelling approaches, at a similar ratio between the Strouhal-defined vortex-shedding frequency and the structural natural frequency inside the lock-in range. The quadrants with the + sign correspond to segments of the time series where the lift coefficient is adding energy to the motion, and the quadrants with the − sign correspond to those where energy is extracted from the motion.
3.5 Flow field analyses
As suggested in Sect. 3.3.2, it is expected that the amplitude of the loads over the airfoil is related to the coherence of the vortical structures. For instance, the vortex shedding predicted with the DDES-3D approach should be more coherent inside the lock-in range, when the airfoil vibrates with large amplitudes, than outside the lock-in range or for the static case (Lian et al., 2023a), at least during the initial build-up of vibration amplitude. This might explain why the 2D and 3D predictions of the airfoil displacement and aerodynamic coefficients match closely in the lock-in region.
To qualitatively observe the coherence in the shedding of vortices for the DDES-3D case, flow visualizations of three cases with different expected levels of coherence are shown in Fig. 17. The three cases shown correspond to DDES-3D simulations of, from top to bottom, the static simulation at time instant ; the static simulation at time instant ; and a free-to-move simulation, with , at time instant . In panel (a) of Fig. 17, snapshots of the pressure coefficient field cp are presented in a slice of the flow field at the midspan plane of the 3D airfoil. The pressure coefficient is defined as , where p is the pressure field and p∞ is the pressure at the inlet. In panel (b) of Fig. 17, snapshots of the Q-criterion isosurfaces, for a value of the non-dimensional second invariant of the velocity gradient tensor , superimposed to snapshots of the spanwise velocity field, also in the midspan slice, are shown. Time instant of the static simulation can be considered to belong to the L regime, due to the irregular lift coefficient behaviour and the high Strouhal number around this instant observed in Fig. 8. On the other hand, time instant is seen to belong to the H regime, where the lift coefficient exhibits high amplitude and regular oscillations, while the associated Strouhal number remains low. Lower coherence is expected in the L regime than in the H regime. The free-to-move simulation is well within the lock-in range, and the airfoil is undergoing large and growing vibrations at the selected time instant, so the coherence should be even higher.
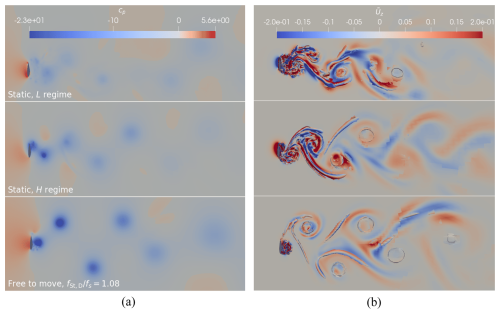
Figure 17(a) Instantaneous pressure coefficient field at a midspan slice and (b) instantaneous Q-criterion isosurfaces, for , coloured by the non-dimensional spanwise velocity field and superimposed to the instantaneous non-dimensional spanwise velocity field at a midspan slice. The colour range is limited to ±0.2 for improved visualization. For three different cases, the top shows a time instant in the L regime of the static simulation, the middle shows a time instant in the H regime of the static simulation and the bottom shows the free-to-move simulation with frequency ratio . All cases correspond to DDES-3D simulations at .
The presence of vortices can be recognized in the pressure field, as these vortices correspond to low-pressure areas. It is observed in panel (a) of Fig. 17 that the intensity of the shed vortices, as indicated by the values of the pressure coefficient, is lowest for the static L regime case and highest for the free-to-move case. It can also be observed that for the L regime case, one of the vortices shed from the trailing edge seems to be missing or has a very low intensity.
Regarding the Q-criterion isosurfaces in panel (b) of Fig. 17, it is noticeable that for the free-to-move case the vortical structures are more spatially coherent, and the least coherent structures correspond to the L regime case. In all three cases there are clear streamwise vortical structures (ribs), which induce spanwise velocities in the wake in the order of 10 % of the inflow velocity as shown by the non-dimensional spanwise velocity field presented.
The vortical structures of the static cases agree well qualitatively with the static case presented by Lian et al. (2023a), although in said work there is no distinction between the L and H regimes. The lock-in case also agrees well with that presented by Lian et al. (2023a) for a low-damping case well inside the lock-in range. The results presented in this section agree well with the interpretation previously given in Sect. 3.3.2, showing that the L regime is characterized by lower coherence of its vortical structures, as well as less intense and irregular vortex shedding, compared with the H regime. Moreover, it is shown that large and growing edgewise motions further increase this coherence and the vortex-shedding intensity.
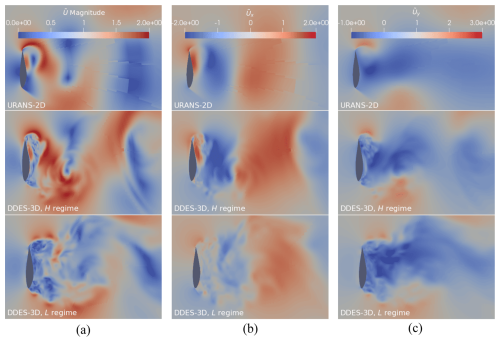
Figure 18(a) Instantaneous non-dimensional velocity magnitude , (b) instantaneous non-dimensional lateral velocity and (c) instantaneous non-dimensional longitudinal velocity . For three different cases, the top shows a time instant in the URANS-2D static simulation, the middle shows a time instant in the DDES-3D H regime of the static simulation and the bottom shows a time instant in the DDES-3D L regime of the static simulation. The DDES-3D results correspond to the midspan slice.
An additional comparison is made in Fig. 18 between near-wake non-dimensional velocity flow fields of the URANS-2D and DDES-3D static-airfoil simulations. Two sets of snapshots are shown for the DDES-3D case, corresponding to the same time instants as in Fig. 17, which are here associated with the L regime (bottom panels) and H regime (middle panels). As expected, the DDES-3D results show resolved vortical structures smaller than those of URANS-2D. But it is observed that the URANS-2D flow field is quite similar on average to the DDES-3D H regime for all three presented velocity components. On the other hand, in the DDES-3D L regime the flow field is notably different, having less clear large-scale structures. This is especially discernible in the velocity magnitude in panel (a) of Fig. 18. These results are in agreement with the time series presented in Fig. 8, where both lift and drag coefficients were seen to match closely between the two modelling options during the high-drag time intervals.
In this work, the vortex-induced vibration response of an airfoil designed for wind turbines is obtained using high-fidelity FSI simulations. Two configurations, with different levels of fidelity and computational cost, are simulated and compared, namely a 2D airfoil with the URANS turbulence-modelling approach (URANS-2D) and a 3D airfoil with an aspect ratio of 1 and the DDES turbulence-modelling approach (DDES-3D).
To characterize the Strouhal number of the flow, simulations of the static airfoil are performed, and it is shown that for the DDES-3D configuration only is there an intermittent switching of the flow regime, which produces a time-varying Strouhal number without a clear dominant value. The Strouhal numbers predicted with the DDES-3D approach are in the range [0.11, 0.16]. It is observed that long simulations are required to characterize the switching of flow regimes, and it is noted that short simulations may produce the misconception that there is a single dominant vortex-shedding frequency. Further exploration of the mechanism responsible for this intermittent switching of the flow regimes could be performed in the future, for example by means of multivariate–multidimensional empirical mode decomposition, as performed by de Souza et al. (2024) for airfoil dynamic stall conditions and for transitional Reynolds number conditions.
To compare the VIV simulation results between both approaches, the results are typically plotted in terms of the ratio between the Strouhal-defined frequency and the structural natural frequency, where the Strouhal number employed is observed from a static case. For the DDES-3D approach, as there is not a single Strouhal number in the static case, the Strouhal number is chosen such that the lock-in range compares well between the two approaches. This DDES-3D Strouhal number of 0.132 is seen to correspond to one of the dominant frequencies in the static case. This criterion to choose the Strouhal number is supported by the well-known fact that the coherence of the wake flow is increased as the body undergoes large and growing vibrations, thus implying that the simulated VIV response of the 3D airfoil under such conditions could be similar to that of the 2D simulations. The DDES-3D Strouhal number of 0.132 is 5 % higher than the URANS-2D Strouhal number of 0.126 obtained from the static simulation. It is also 14 % lower than the previously reported Strouhal number of 0.153 for similar setups of the 3D airfoil.
Comparing the VIV response between different approaches using the non-dimensional displacement growth rate is a robust metric and only requires short-time simulations. This metric is employed to define the extent of the lock-in range. A very good level of agreement is found between the two presented approaches for the growth rate and lock-in range. Furthermore, the lift coefficient standard deviation and the mean drag coefficient predicted during the VIV initial growth period are also found to be in good agreement between approaches but only inside the lock-in range. To the best of the authors' knowledge, this level of agreement between URANS-2D and DDES-3D predictions of the airfoil VIV response has not been reported before, either in terms of lock-in range extent, vibration growth rate or aerodynamic forces.
It is thus concluded that relatively cheap URANS-2D simulations may be as good for obtaining the VIV initial response of an airfoil as DDES-3D simulations of an airfoil with an aspect ratio of 1. Caution is advised regarding the influence of the lateral boundary conditions for such a short-span geometry as that of the DDES-3D setup, although preliminary simulations, not shown here, for the same airfoil with an aspect ratio of 21 have revealed equivalent results. Due to their computational cost, the computed DDES-3D time series have not been run for long enough for the maximum displacement amplitudes to be reached, and therefore it has not been established whether they would compare well to those from the URANS-2D approach.
Using the information from the VIV initial response obtained with relatively cheap URANS-2D simulations, even cheaper engineering models could be developed. URANS-2D simulations may allow for a correct VIV characterization under different conditions, such as different Reynolds numbers, mass ratios, structural damping values, airfoil shapes, angles of attack, initial displacement values, and concurrent forces or displacements. Nonetheless, higher-fidelity simulations may still be needed for the correct characterization of 3D phenomena, associated with the spanwise geometry, such as the full-blade mode shape, twist and chord taper, and associated with non-homogeneous inflow conditions, such as shear, atmospheric boundary layer turbulence or flow inclination.
Data will be made available upon reasonable request.
RFA: conceptualization, methodology, investigation, formal analysis, writing (original draft preparation). GP: methodology, software, writing (review and editing). OLG: supervision, conceptualization, writing (review and editing). SAS: supervision, software, writing (review and editing). VAR: conceptualization, resources, writing (review and editing). ACT: conceptualization, writing (review and editing). CGC: formal analysis, software, writing (review and editing).
The contact author has declared that none of the authors has any competing interests.
Publisher’s note: Copernicus Publications remains neutral with regard to jurisdictional claims made in the text, published maps, institutional affiliations, or any other geographical representation in this paper. While Copernicus Publications makes every effort to include appropriate place names, the final responsibility lies with the authors.
Project MEDEA (no. RTI2018-095592-B-I00) is funded by MICIU/AEI/10.13039/501100011033. The first author's grant (no. PRE2019-089821) is funded by MICIU/AEI/10.13039/501100011033 and the European Social Fund (ESF) Investing in Your Future programme. The authors thankfully acknowledge the computer resources at MareNostrum and the technical support provided by the Barcelona Supercomputing Center (BSC; RES-IM-2023-1-0020), used for the DDES-3D simulations. The authors gratefully acknowledge the Universidad Politécnica de Madrid (https://www.upm.es/, last access: 19 December 2024) for providing computing resources on the Magerit supercomputer, used for the URANS-2D simulations. We would like to express our gratitude to David H. Wood for his fruitful insights.
This research has been supported by the Ministerio de Ciencia, Innovación y Universidades (grant nos. RTI2018-095592-B-I00 and PRE2019-089821).
This paper was edited by Alessandro Bianchini and reviewed by three anonymous referees.
Arunachalam, S. and Lakshmanan, N.: Across-wind response of tall circular chimneys to vortex shedding, J. Wind Eng. Ind. Aerod., 145, 187–195, https://doi.org/10.1016/j.jweia.2015.06.005, 2015. a
Benner, B. M., Carlson, D. W., Seyed-Aghazadeh, B., and Modarres-Sadeghi, Y.: Vortex-Induced Vibration of symmetric airfoils used in Vertical-Axis Wind Turbines, J. Fluid. Struct., 91, 102577, https://doi.org/10.1016/j.jfluidstructs.2019.01.018, 2019. a
Bishop, R. E. D. and Hassan, A. Y.: The Lift and Drag Forces on a Circular Cylinder in a Flowing Fluid, P. R. Soc. Lond. A, 277, 32–50, http://www.jstor.org/stable/2414647 (last access: 19 December 2024), 1964. a
Cagney, N. and Balabani, S.: Streamwise vortex-induced vibrations of cylinders with one and two degrees of freedom, J. Fluid Mech., 758, 702–727, https://doi.org/10.1017/jfm.2014.521, 2014. a
Cheung, J. and Melbourne, W.: Aerodynamic damping of a circular cylinder in turbulent flow at high reynolds numbers, in: Eighth Australasian fluid mechanics conference, University of Newcastle, vol. 28, p. 13A, https://openlibrary.org/books/OL7866463M/Eighth_Australasian_Fluid_Mechanics_Conference (last access: 19 December 2024), ISBN 9780725904630, 1983. a
Christensen, O. and Askegaard, V.: Wind forces on and excitation of a 130-m concrete chimney, J. Wind Eng. Ind. Aerod., 3, 61–77, https://doi.org/10.1016/0167-6105(78)90028-4, 1978. a
de Langre, E.: Frequency lock-in is caused by coupled-mode flutter, J. Fluid. Struct., 22, 783–791, https://doi.org/10.1016/j.jfluidstructs.2006.04.008, 2006. a
Derksen, A.: Numerical simulation of a forced and freely-vibrating cylinder at supercritical Reynolds numbers, Master's thesis, TU Delft and Siemens, Delft, the Netherlands, http://resolver.tudelft.nl/uuid:4c92eee4-8378-4a40-9180-bcb72f751076 (last access: 19 December 2024), 2019. a
de Souza, L. F., Miotto, R. F., and Wolf, W. R.: Analysis of transient and intermittent flows using a multidimensional empirical mode decomposition, Theor. Comp. Fluid Dy., 38, 291–311, https://doi.org/10.1007/s00162-024-00689-y, 2024. a
Diakakis, K.: Computational analysis of transitional and massively separated flows with application to wind turbines, PhD thesis, National Technical University of Athens (NTUA), https://doi.org/10.13140/RG.2.2.14120.19206, 2019. a
Diakakis, K.: structAirfoilMesher, GitLab [code], https://gitlab.com/before_may/structAirfoilMesher (last access: 19 December 2024), 2023. a
Ellingsen, Ø. M., Amandolese, X., Flamand, O., and Hémon, P.: Twin Strouhal numbers in pressure loading of circular cylinder at high Reynolds numbers, J. Fluid. Struct., 115, 103782, https://doi.org/10.1016/j.jfluidstructs.2022.103782, 2022. a
Fage, A. and Johansen, F. C.: On the flow of air behind an inclined flat plate of infinite span, P. R. Soc. Lond. A, 116, 170–197, https://doi.org/10.1098/rspa.1927.0130, 1927. a
Feng, C.: The measurement of vortex induced effects in flow past stationary and oscillating circular and D-section cylinders, PhD thesis, University of British Columbia, https://doi.org/10.14288/1.0104049, 1968. a
Galemann, T. and Ruscheweyh, H.: Measurements of wind induced vibrations of a full-scale steel chimney, J. Wind Eng. Ind. Aerod., 41, 241–252, https://doi.org/10.1016/0167-6105(92)90416-8, 1992. a
Gallego-Castillo, C., Cuerva-Tejero, A., and Lopez-Garcia, O.: mVARbox v1.0.0, GitHub [code], https://github.com/arya-upm/mVARbox/ (last access: 19 December 2024), 2024. a
Griffin, O., Skop, R., and Koopmann, G.: The vortex-excited resonant vibrations of circular cylinders, J. Sound Vib., 31, 235–249, https://doi.org/10.1016/S0022-460X(73)80377-3, 1973. a, b
Grinderslev, C., Houtin-Mongrolle, F., Nørmark Sørensen, N., Raimund Pirrung, G., Jacobs, P., Ahmed, A., and Duboc, B.: Forced-motion simulations of vortex-induced vibrations of wind turbine blades – a study of sensitivities, Wind Energ. Sci., 8, 1625–1638, https://doi.org/10.5194/wes-8-1625-2023, 2023. a
Hartlen, R. T. and Currie, I. G.: Lift-Oscillator Model of Vortex-Induced Vibration, J. Eng. Mech., 96, 577–591, https://doi.org/10.1061/JMCEA3.0001276, 1970. a
Heinz, J. C., Sørensen, N. N., Zahle, F., and Skrzypiński, W.: Vortex-induced vibrations on a modern wind turbine blade, Wind Energy, 19, 2041–2051, https://doi.org/10.1002/we.1967, 2016. a
Hemmati, A., Wood, D. H., and Martinuzzi, R. J.: Characteristics of distinct flow regimes in the wake of an infinite span normal thin flat plate, Int. J. Heat Fluid Flow, 62, 423–436, https://doi.org/10.1016/j.ijheatfluidflow.2016.09.001, 2016. a, b
Horcas, S. G., Sørensen, N. N., Zahle, F., Pirrung, G. R., and Barlas, T.: Vibrations of wind turbine blades in standstill: Mapping the influence of the inflow angles, Phys. Fluids, 34, 054105, https://doi.org/10.1063/5.0088036, 2022. a, b
Hu, P., Sun, C., Zhu, X., and Du, Z.: Investigations on vortex-induced vibration of a wind turbine airfoil at a high angle of attack via modal analysis, J. Renew. Sustain. Ener., 13, 033306, https://doi.org/10.1063/5.0040509, 2021. a
Iyer, S.: Unsteady aerodynamics and vortex shedding of a wind turbine blade, Master's thesis, MS thesis, Technical University of Denmark and Delft University of Technology, http://resolver.tudelft.nl/uuid:105bcf3a-8c6d-4dfe-9165-5ba42d415788 (last access: 19 December 2024), 2023. a
Jauvtis, N. and Williamson, C. H. K.: Vortex-induced vibration of a cylinder with two degrees of freedom, J. Fluid. Struct., 17, 1035–1042, https://doi.org/10.1016/S0889-9746(03)00051-3, 2003. a
Kurniawati, I., Lupi, F., Seidel, M., Höffer, R., and Niemann, H.-J.: Insights into the Transcritical Reynolds Number Range Based on Field Measurements of a Wind Turbine Tower, in: Proceedings of the XVII Conference of the Italian Association for Wind Engineering, edited by: Schito, P. and Zasso, A., 52–63, Springer Nature Switzerland, Cham, ISBN 978-3-031-53059-3, https://doi.org/10.1007/978-3-031-53059-3_6, 2024. a, b
Kurushina, V., Pavlovskaia, E., Postnikov, A., and Wiercigroch, M.: Calibration and comparison of VIV wake oscillator models for low mass ratio structures, Int. J. Mech. Sci., 142-143, 547–560, https://doi.org/10.1016/j.ijmecsci.2018.04.027, 2018. a
Lehmkuhl, O., Rodríguez, I., Borrell, R., Chiva, J., and Oliva, A.: Unsteady forces on a circular cylinder at critical Reynolds numbers, Phys. Fluid., 26, 125110, https://doi.org/10.1063/1.4904415, 2014. a
Leontini, J. S. and Thompson, M. C.: Vortex-induced vibrations of a diamond cross-section: Sensitivity to corner sharpness, J. Fluid. Struct., 39, 371–390, https://doi.org/10.1016/j.jfluidstructs.2013.01.002, 2013. a, b
Lian, B., Zhu, X., and Du, Z.: Numerical study on vortex-induced vibration of wind turbine airfoil at high angle of attack via free vibration simulation, J. Renew. Sustain. Ener., 14, 033306, https://doi.org/10.1063/5.0086258, 2022. a, b, c, d, e, f, g, h, i, j, k, l, m
Lian, B., Tong, X., Zhu, X., Du, Z., Cui, Y., and Khoo, B. C.: Investigations on lock-in vortex-induced vibration of an airfoil at a high angle of attack based on detached eddy simulation, Phys. Fluid., 35, 094105, https://doi.org/10.1063/5.0166243, 2023a. a, b, c, d, e, f, g, h, i, j, k, l, m, n, o, p
Lian, B., Tong, X., Zhu, X., Du, Z., Cui, Y., and Khoo, B. C.: Investigations on the effects of structural damping on vortex-induced vibration response of an airfoil at a high angle of attack via the aero-damping map, Phys. Fluid., 35, 064107, https://doi.org/10.1063/5.0155120, 2023b. a, b, c, d
Lian, B., Zhu, X., and Du, Z.: Investigations on bifurcation behavior of wind turbine airfoil response at a high angle of attack, Eur. J. Mech. B-Fluid., 105, 206–218, https://doi.org/10.1016/j.euromechflu.2024.01.013, 2024. a
Lilly, J. M.: Element analysis: a wavelet-based method for analysing time-localized events in noisy time series, P. R. Soc. A, 473, 20160776, https://doi.org/10.1098/rspa.2016.0776, 2017. a
Lisoski, D. L. A.: Nominally two-dimensional flow about a normal flat plate, PhD thesis, California Institute of Technology, https://doi.org/10.7907/AZEG-2T16, 1993. a
Lo, J. C., Hourigan, K., Thompson, M. C., and Zhao, J.: The effect of structural damping on flow-induced vibration of a thin elliptical cylinder, J. Fluid Mech., 974, A5, https://doi.org/10.1017/jfm.2023.776, 2023. a
Ludlam, D. V., Jacobs, P., and Ahmed, A.: Impact of rotor blade aerodynamics on tower vortex induced vibration of modern wind turbines, J. Phys. Conf. Ser., 2767, 022058, https://doi.org/10.1088/1742-6596/2767/2/022058, 2024. a
Lupi, F., Niemann, H.-J., and Höffer, R.: Aerodynamic damping model in vortex-induced vibrations for wind engineering applications, J. Wind Eng. Ind. Aerod., 174, 281–295, 2018. a
Lupi, F., Höffer, R., and Niemann, H.-J.: Aerodynamic damping in vortex resonance from aeroelastic wind tunnel tests on a stack, J. Wind Eng. Ind. Aerod., 208, 104438, https://doi.org/10.1016/j.jweia.2020.104438, 2021. a
Manolesos, M. and Papadakis, G.: Investigation of the three-dimensional flow past a flatback wind turbine airfoil at high angles of attack, Phys. Fluid., 33, 085106, https://doi.org/10.1063/5.0055822, 2021. a
Menter, F. R.: Two-equation eddy-viscosity turbulence models for engineering applications, AIAA J., 32, 1598–1605, https://doi.org/10.2514/3.12149, 1994. a
Mittal, R. and Balachandar, S.: Effect of three-dimensionality on the lift and drag of nominally two-dimensional cylinders, Phys. Fluid., 7, 1841–1865, https://doi.org/10.1063/1.868500, 1995. a
Najjar, F. M. and Balachandar, S.: Low-frequency unsteadiness in the wake of a normal flat plate, J. Fluid Mech., 370, 101–147, https://doi.org/10.1017/S0022112098002110, 1998. a, b, c, d
Nakamura, Y. and Hirata, K.: Pressure fluctuations on oscillating rectangular cylinders with the long side normal to the flow, J. Fluid. Struct., 5, 165–183, https://doi.org/10.1016/0889-9746(91)90460-7, 1991. a
Nemes, A., Zhao, J., Lo Jacono, D., and Sheridan, J.: The interaction between flow-induced vibration mechanisms of a square cylinder with varying angles of attack, J. Fluid Mech., 710, 102–130, https://doi.org/10.1017/jfm.2012.353, 2012. a
Newmark, N. M.: A method of computation for structural dynamics, J. Eng. Mech., 85, 67–94, https://doi.org/10.1061/JMCEA3.0000098, 1959. a
Païdoussis, M. P., Price, S. J., and de Langre, E.: Fluid-Structure Interactions: Cross-Flow-Induced Instabilities, Cambridge University Press, https://doi.org/10.1017/CBO9780511760792, 2010. a
Papadakis, G.: Development of a hybrid compressible vortex particle method and application to external problems including helicopter flows, PhD thesis, National Technical University of Athens (NTUA), https://doi.org/10.13140/RG.2.2.26480.92168, 2014. a
Papadakis, G. and Manolesos, M.: The flow past a flatback airfoil with flow control devices: benchmarking numerical simulations against wind tunnel data, Wind Energ. Sci., 5, 911–927, https://doi.org/10.5194/wes-5-911-2020, 2020. a
Papadakis, G., Manolesos, M., Diakakis, K., and Riziotis, V. A.: DES vs RANS: The flatback airfoil case, J. Phys. Conf. Ser., 1618, 052062, https://doi.org/10.1088/1742-6596/1618/5/052062, 2020. a
Papadakis, G., Riziotis, V. A., and Voutsinas, S. G.: A hybrid Lagrangian–Eulerian flow solver applied to elastically mounted cylinders in tandem arrangement, J. Fluid. Struct., 113, 103686, https://doi.org/10.1016/j.jfluidstructs.2022.103686, 2022. a, b
Pellegrino, A. and Meskell, C.: Vortex shedding from a wind turbine blade section at high angles of attack, J. Wind Eng. Ind. Aerod., 121, 131–137, https://doi.org/10.1016/j.jweia.2013.08.002, 2013. a
Pirrung, G. R., Grinderslev, C., Sørensen, N. N., and Riva, R.: Vortex-induced vibrations of wind turbines: From single blade to full rotor simulations, Renew. Energ., 226, 120381, https://doi.org/10.1016/j.renene.2024.120381, 2024. a
Prospathopoulos, J. M., Riziotis, V. A., Schwarz, E., Barlas, T., Aparicio-Sanchez, M., Papadakis, G., Manolas, D., Pirrung, G., and Lutz, T.: Simulation of oscillating trailing edge flaps on wind turbine blades using ranging fidelity tools, Wind Energy, 24, 357–378, https://doi.org/10.1002/we.2578, 2021. a
Rigo, F., Andrianne, T., and Denoël, V.: Parameter identification of wake-oscillator from wind tunnel data, J. Fluid. Struct., 109, 103474, https://doi.org/10.1016/j.jfluidstructs.2021.103474, 2022. a, b
Sarpkaya, T.: A critical review of the intrinsic nature of vortex-induced vibrations, J. Fluid. Struct., 19, 389–447, https://doi.org/10.1016/j.jfluidstructs.2004.02.005, 2004. a
Schewe, G.: On the force fluctuations acting on a circular cylinder in crossflow from subcritical up to transcritical Reynolds numbers, J. Fluid Mech., 133, 265–285, https://doi.org/10.1017/S0022112083001913, 1983. a, b
Skop, R. and Balasubramanian, S.: A new twist on an old model for vortex-excited vibrations, J. Fluid. Struct., 11, 395–412, https://doi.org/10.1006/jfls.1997.0085, 1997. a
Skrzypiński, W., Gaunaa, M., Sørensen, N., Zahle, F., and Heinz, J.: Vortex-induced vibrations of a DU96-W-180 airfoil at 90° angle of attack, Wind Energy, 17, 1495–1514, https://doi.org/10.1002/we.1647, 2014. a, b, c, d, e, f, g, h, i, j, k, l, m, n, o, p, q, r, s, t, u, v, w, x, y
Sourav, K., Kumar, D., and Sen, S.: Undamped transverse-only VIV of a diamond cylinder at low Reynolds numbers, Ocean Eng., 197, 106867, https://doi.org/10.1016/j.oceaneng.2019.106867, 2020. a
Sumer, B. M. and Fredsøe, J.: Hydrodynamics Around Cylindrical Structures, WORLD SCIENTIFIC, revised edition, https://doi.org/10.1142/6248, 2006. a
Sørensen, N. N., Méndez, B., Muñoz, A., Sieros, G., Jost, E., Lutz, T., Papadakis, G., Voutsinas, S., Barakos, G., Colonia, S., Baldacchino, D., Baptista, C., and Ferreira, C.: CFD code comparison for 2D airfoil flows, J. Phys. Conf. Ser., 753, 082019, https://doi.org/10.1088/1742-6596/753/8/082019, 2016. a
Tanida, Y., Okajima, A., and Watanabe, Y.: Stability of a circular cylinder oscillating in uniform flow or in a wake, J. Fluid Mech., 61, 769–784, https://doi.org/10.1017/S0022112073000935, 1973. a
Teimourian, A., Yazdi, S. G., and Hacisevki, H.: Vortex shedding: a review on flat plate, Fluid Dyn., 53, 212–221, https://doi.org/10.1134/S0015462818020167, 2018. a
Timmer, W. and van Rooij, R. P. J. O. M.: Some aspects of high angle-of-attack flow on airfoils for wind turbine application, in: Proceedings of the European wind energy conference “wind energy for the new millennium”, held in Copenhagen, Denmark, 2–6 July 2001, edited by: Helm, P. and Zervos, A., WIP-renewable energies, 355–358, ISBN 88-900442-9-2, 2001. a
Veers, P., Bottasso, C. L., Manuel, L., Naughton, J., Pao, L., Paquette, J., Robertson, A., Robinson, M., Ananthan, S., Barlas, T., Bianchini, A., Bredmose, H., Horcas, S. G., Keller, J., Madsen, H. A., Manwell, J., Moriarty, P., Nolet, S., and Rinker, J.: Grand challenges in the design, manufacture, and operation of future wind turbine systems, Wind Energ. Sci., 8, 1071–1131, https://doi.org/10.5194/wes-8-1071-2023, 2023. a
Vickery, B. and Basu, R.: Across-wind vibrations of structures of circular cross-section. Part I. Development of a mathematical model for two-dimensional conditions, J. Wind Eng. Ind. Aerod., 12, 49–73, https://doi.org/10.1016/0167-6105(83)90080-6, 1983. a
Vickery, B. J. and Clark, A. W.: Lift or Across-Wind Response of Tapered Stacks, J. Struct. Div.-ASCE, 98, 1–20, https://doi.org/10.1061/JSDEAG.0003103, 1972. a
Viré, A., Derksen, A., Folkersma, M., and Sarwar, K.: Two-dimensional numerical simulations of vortex-induced vibrations for a cylinder in conditions representative of wind turbine towers, Wind Energ. Sci., 5, 793–806, https://doi.org/10.5194/wes-5-793-2020, 2020. a
Vlastos, D., Riziotis, V. A., Papadakis, G., Manolas, D. I., and Chaviaropoulos, P. K.: Numerical investigation of vortex induced vibrations on cylinders, J. Phys. Conf. Ser., 2767, 022034, https://doi.org/10.1088/1742-6596/2767/2/022034, 2024. a
Wu, X. and Sharma, A.: Artefacts of finite span in vortex-induced vibration simulations, Appl. Ocean Res., 101, 102265, https://doi.org/10.1016/j.apor.2020.102265, 2020. a
Yu, Z., Wang, E., Bao, Y., Xiao, Q., Li, X., Incecik, A., and Lin, B.: VIV of two rigidly coupled side-by-side cylinders at subcritical Re, Int. J. Mech. Sci., 267, 108961, https://doi.org/10.1016/j.ijmecsci.2024.108961, 2024. a
Zhao, J., Nemes, A., Lo Jacono, D., and Sheridan, J.: Branch/mode competition in the flow-induced vibration of a square cylinder, Philos. T. R. Soc. A, 376, 20170243, https://doi.org/10.1098/rsta.2017.0243, 2018. a
Zhao, J., Thompson, M. C., and Hourigan, K.: Decomposition of fluid forcing and phase synchronisation for in-line vortex-induced vibration of a circular cylinder, J. Fluid Mech., 941, R4, https://doi.org/10.1017/jfm.2022.359, 2022. a
Zou, F., Riziotis, V. A., Voutsinas, S. G., and Wang, J.: Analysis of vortex-induced and stall-induced vibrations at standstill conditions using a free wake aerodynamic code, Wind Energy, 18, 2145–2169, https://doi.org/10.1002/we.1811, 2015. a


